Embed Size (px)
Citation preview
NBER WORKING PAPER SERIES
HEALTH CARE SPENDING:HISTORICAL TRENDS AND NEW DIRECTIONS
Alice ChenDana Goldman
Working Paper 21501http://www.nber.org/papers/w21501
NATIONAL BUREAU OF ECONOMIC RESEARCH1050 Massachusetts Avenue
Cambridge, MA 02138August 2015
Research reported here was supported by the National Institute on Aging of the National Institutesof Health under award number P01AG033559. The content is solely the responsibility of the authorsand does not necessarily represent the official views of the National Institutes of Health or the NationalBureau of Economic Research.
At least one co-author has disclosed a financial relationship of potential relevance for this research.Further information is available online at http://www.nber.org/papers/w21501.ack
NBER working papers are circulated for discussion and comment purposes. They have not been peer-reviewed or been subject to the review by the NBER Board of Directors that accompanies officialNBER publications.
© 2015 by Alice Chen and Dana Goldman. All rights reserved. Short sections of text, not to exceedtwo paragraphs, may be quoted without explicit permission provided that full credit, including © notice,is given to the source.
Health Care Spending: Historical Trends and New DirectionsAlice Chen and Dana GoldmanNBER Working Paper No. 21501August 2015JEL No. I1,I11,I12,I13,I18
ABSTRACT
Over the last five decades, broad changes in the US health care system have dramatically influencedgrowth in health care expenditures. These structural changes have also influenced the trajectory ofthe health economics research. This paper reviews some of the seminal health economics papers (measuredby citations) and identifies the salient factors driving the growth of medical expenditures. We findthat the research identified – and was strongly influenced by – four eras of expenditure growth: (1)coverage expansion; (2) experimentation with financial incentives; (3) the managed care backlash;and (4) a golden era of declining expenditure growth. We conclude by discussing some themes fromthis research suggesting optimism that, going forward, we can curb excess expenditure growth aboveGDP growth without harming population health.
Alice ChenSchaeffer Center for Health Policy and EconomicsUniversity of Southern California635 Downey WayLos Angeles, CA [email protected]
Dana GoldmanSchaeffer Center for Health Policy and EconomicsUniversity of Southern California635 Downey WayLos Angeles, CA 90089-3333and [email protected]
1 IntroductionUnlike any other country in the world, the US spends almost 19% of its income on health care.1
Part of the reason, of course, is that we are one of the richest nations. However, even after adjustingfor GDP, the US remains a clear outlier. Figure 1 depicts the relationship between per capita healthspending and per capita GDP among 33 OECD countries.2 Excluding the US, the GDP to health-expenditure ratio is remarkably linear. Using the trend line for these other countries, one wouldexpect the US to spend 7.7% of its GDP on health care, 9.3 percentage points less than actualspending.3 This health-expenditure differential has almost always existed, and it has only grownlarger over time. Figure 2 shows that in 1960, the US spent 1.4 percentage points more of its GDPon health relative to seven other OECD countries. By 2010, this differential had nearly quintupledto 6.8 percentage points.
However, US health care expenditure growth over the last 50 years has not been steady. Anexamination of growth rates over this period, as shown in Figure 3, suggests growth can be dividedinto four major eras. The first period, from 1960 to 1981, saw rapid expenditure growth. Duringthis period of expansion, access to health insurance increased, cost sharing fell, and demand grew,as one would expect as prices fell. This effect was also spurred on by rapid but costly technologicalinnovation (e.g., Newhouse (1992). The second era, from 1981 to 1994, is one in which the healthexpenditure growth rate fell, rose, and fell again. The volatility of health expenditures in thisperiod can be attributed to policy experimentation in provider reimbursement and new benefitdesigns. Managed care plans skyrocketed in popularity, but by the mid- to late-1990s, interest inmanaged care fell almost as quickly as it rose. The backlash against managed care contributed tothe steady rise in expenditure growth from 1994 to 2002. In 2003, the expenditure growth ratechanged course yet again, and this time, its steady 10-year decline culminated in the lowest levelsof spending growth since 1960. During this “golden era” of declining expenditure growth, theCongressional Budget Office (CBO) has reduced– every year for the last six years in a row– itsestimate of how much the federal government will need to spend on Medicare ( Sanger-Katz &Quealy, 2014).
In this article, we review the dominant factors responsible for the observed changes in thehealth expenditure growth rate over time. These factors have heavily influenced the trajectory ofhealth economics research, and they inform the direction for not only future research, but alsofuture policy. For each factor, we discuss the literature’s most-cited works, listed in Tables 1 and2. Certain factors, such as benefit design, socioeconomic factors, and technology, have playeda continuous role in shaping health expenditures throughout the last five decades. We introducethose topics at length when discussing the first period and revisit them in subsequent periods. Weconclude by considering the innovations in health care structure and delivery that continue to shapethe US health care system.
1Official estimates of health spending in the US are provided by the Centers for Medicare and Medicaid Services’(CMS) National Health Expenditure Accounts. Over 80% of health care spending is attributed to health care servicesor goods. Services are provided by physicians, other medical professionals, dentists, home health care, nursing homes,and hospitals; and goods include prescription drugs, other non-durable medical products, and durable medical equip-ment. Also included are expenditures on public health activities, government administration, the net cost of healthinsurance, and investments related to health care research.
2Luxembourg is omitted from this list.3These figures are based on authors’ calculations using 2010 data from the World Bank’s World Development
Indicators.
2
2 Period 1: Coverage Expansion, 1960-1981From 1960 to 1981, the growth rate of health expenditures generally trended upwards. Duringthis period, health expenditures rose from less than $140 per capita in 1960 to over $1,000 percapita in 1980. While part of this growth can be attributed to an increase in personal wealth, GDPper capita merely quadrupled in size, whereas health expenditures per capita increased over sevenfold. In addition to an expanding economy, the presence of employer-sponsored health insurancerose, contributing to a higher uptake of insurance, improved access to care, and reduced patientcost-sharing. These changes enabled more people to afford the ground-breaking, yet expensive,medical innovations that were extending life-expectancy and creating a growing aging population.
2.1 The Spread of Health InsuranceDue to an increasing demand for health care, improvements in medical techniques and technology,and rising medical fees, the 1930s saw a surge of public interest in health insurance. Hospitals–which had traditionally limited themselves to providing care– responded by organizing methodsfor local associations to prepay for services rendered to the community. These prepaid plans–eventually combined under the auspices of the American Hospital Association and entitled theBlue Cross plans– proliferated across the country, enrolling approximately 20% of the populationby 1947 (Reed, 1947). Observing the success of the Blue Cross plans, commercial insurancecompanies quickly followed suit, and by the early 1950s, enrollment in commercial policies hadovertaken enrollment in Blue Cross plans (Thomasson, 2004). Throughout this period, employersplayed an important role in the provision of and demand for health insurance. With Truman erawage and price controls, employers had limited freedom to raise wages. As a result, they began tocompete for workers through increased fringe benefits.
Federal legislation enacted in the 1940s and 1950s helped spur the spread of employer-sponsoredhealth insurance. These rules culminated with the Internal Revenue Act of 1954, which demarcatedemployer contributions to employee health insurance plans as non-taxable income. Although thebill was controversial– with some lauding it as being “fortunate for the country” and others con-tending that it was drafted “to fund campaign pledges”– this piece of legislation cemented theprevalence of employer-sponsored health insurance in the US (Morris, 1954). To this day, the pref-erential tax treatment of health benefits is one of the largest tax expenditures in the US budget; in2013, the exclusion of income and payroll taxes from employer and employee contributions totalin excess of $250 billion in foregone tax revenue (Rae et al., 2014).
By 1960, 68% of the population carried health insurance. However, Congress and PresidentLyndon Johnson were concerned that low-income and elderly people had trouble obtaining af-fordable health insurance and paying for health care, so they created Medicaid and Medicare in1965. Medicaid, known then as Title XIX, provided federal matching funds for states to financethe health care of individuals who were at or close to the public assistance level. On the otherhand, Medicare provided virtually universal public health insurance to individuals aged 65 andolder. Medicare Part A provided coverage for up to 90 days of inpatient hospital expenses after aninitial deductible; with 25% co-insurance for days 61 to 90. Through Part B, individuals receivedsupplementary coverage of physician services, and they were responsible for a 20% coinsurance.Both programs were intended to integrate care into the mainstream, a goal that was ultimatelysuccessful for Medicare– in part due to its universality for the elderly– but not for Medicaid.
3
As take-up of both public and private insurance grew, economists began to recognize the po-tential to over-consume health care services, in a strict welfare sense that the costs of provid-ing additional services exceed patient’s willingness-to-pay if uninsured. In seminal papers, Pauly(1968) noted that insurance distorts the price paid by consumers, and Pauly (1974) demonstratedthat there will be over-insurance in the presence of imperfect information. Feldstein & Fried-man (1977) provided further insight by modeling demand for health insurance, with the importantfinding that the tax subsidy for health insurance enshrined in the Internal Revenue Act of 1954substantially increases health insurance demand. This research led to a crucial insight that wouldguide health economics to this day: insurance reduces the price to the consumer (cost-sharing),which can lead to increased utilization. When consumers with health insurance demand more carethan they would have at normal market prices, the value of their care is less than the market price(Holmstrom, 1979). The difference between the cost to produce care and the lowered value of careto insured consumers represents an inefficiency that generates welfare loss.
While this may seem tautological today, the notion that health care use responded to pricewas hardly well-established. This motivated one of the best experimental social science studiesever conducted: the RAND Health Insurance Experiment conducted from 1974 to 1982. Theexperiment sought to identify the effects of health insurance on utilization, costs, and overall health.The experiment, which randomly assigned families to either a prepaid group practice or one of 14fee-for-service insurance plans, demonstrated that families in the least generous plans spent atleast 30% less on medical care. This responsiveness to price was present in both the outpatientand inpatient care settings, yet – despite the big difference in utilization– there was little or nodifference in general health (Manning et al., 1988).
Decades of research has confirmed the findings of the RAND study. Most recently, a similarOregon Health Insurance Experiment examined the causal effect of cost-sharing on health utiliza-tion and health outcomes. Randomizing Medicaid coverage for a group of uninsured low-incomeindividuals, Finkelstein et al. (2012) estimate that having insurance coverage is associated with a30% increase in probability of having a hospital admission and a 35% increase in the probabilityof having an outpatient visit.
Beyond the RAND and Oregon experimental studies, some quasi-experimental studies andmany non-experimental studies provide similar evidence. For example, researchers have used theMassachusetts health reform for universal coverage and the age 65 Medicare cutoff as sources ofexogenous variation in insurance coverage (e.g., Card et al., 2008, Kolstad & Kowalski, 2012).After surveying 923 articles, Goldman et al. (2007) conclude that increased cost-sharing is associ-ated with lower rates of drug treatment, worse adherence among existing users, and more frequentdiscontinuation of therapy. It should be noted that much of the non-experimental work utilizesgeographic variation in cost-sharing, such as state-level changes in Medicaid (e.g., Reeder & Nel-son, 1985, Stuart & Zacker, 1999). Finkelstein (2007) uses geographic variation in private healthinsurance coverage prior to Medicare’s introduction. She finds that the overall spread of health in-surance between 1950 and 1990 may be able to explain about half of the increase in real per capitahealth spending over that time period. The bottom line from all this research is that we knowcoverage expansions– both in terms of new insurance and more generous insurance– can explainmuch of the growth of health care spending during this period. In 1960, out-of-pocket spendingconstituted 47% of total health expenditures, and only 67% of people had health insurance. By1981, out-of-pocket spending constituted less than 22% of total health expenditures, and over 85%of people had health insurance.
4
2.2 Technology and QualityHealth insurance was not the only factor changing over this period. On the supply-side, expensivenew technologies were also entering clinical practice. Between 1960 and 1980, important innova-tions included major pharmaceuticals–e.g, diuretics (1958), beta blockers (1962), and vaccinationsfor measles (1963), mumps (1967) and meningitis (1978). Biotechnology engineers also developedmammography imaging (1974), computerized tomography scans (1975), and ultrasounds (1978),and these were quickly adopted into routine patient care. Providers performed the first liver (1962),lung (1963), and heart (1967) transplants and experimented with techniques such as gene splicing(1973) and in-vitro fertilization (1978).
The development and diffusion of medical technology is a subject that is near and dear tohealth economics. Hall & Jones (2007) argue that this a consequence of income growth. Theyuse an expected lifetime utility framework to show that expensive medical technologies are valuedbecause of the rising value of life. In their model, a social planner chooses the consumptionand health spending for a representative individual so that the individual’s utility is maximizedsubject to resource and health production constraints. As future mortality declines, the value oflife increases and the marginal benefit of health spending increases, shifting total spending towardshealth.
Empirically, measuring the contribution of technology to health-expenditure growth has beendifficult as technological change and the demand for health insurance are highly interdependent(Weisbrod, 1991). When previously untreatable conditions become treatable, individuals becomemore susceptible to higher and more variable health care costs, enhancing the demand for insuranceand increasing utilization. Some researchers have attempted to disentangle the role of technologyfrom utilization. For example, Newhouse (1992) notes that from 1950 to 1990, hospital admissionrates and lengths of stay did not increase. However, the real cost of a day in the hospital quadrupled,suggesting that technology, as opposed to utilization, drove medical care costs.
More and better technology– and the attendant higher spending– may not be indicative ofimproved quality of life, increased longevity, or less time away from work (Fisher et al. 2003a,b).The value of technology depends on how it affects the medical system (Cutler & McClellan, 2001).Some technologies allow for the treatment of previously untreatable diseases. Because they expandthe treatment possibility frontier, those technologies are generally cost increasing, and their worthwill depend on how valuable they are to the marginal patient. Other technologies act as substitutesfor older therapies. Replacement therapies are not necessarily cost increasing, but their effective-ness may also vary. Cutler & McClellan (2001) analyze five conditions: heart attacks, low birthweight infants, depression, cataracts, and breast cancer. They find that in most cases, technologi-cal innovations in medicine led to net positive returns, but in the case of breast cancer, the slightincrease in outcomes is roughly counterbalanced by the substantial increase in costs. Others userandomized, placebo-controlled trials to identify the returns of technology. For example, Moseleyet al. (2002) demonstrate the ineffectiveness of arthroscopic surgeries for patients with osteoporo-sis, and Temel et al. (2010) shows that palliative care can lead to higher survival rates relative tochemotherapy for patients with terminal lung cancer.
These studies highlight the importance of assessing the appropriateness of medical-technologyuse. Although randomized clinical trials offer an gold-standard for identifying the effectivenessof medical technologies, they are often time-consuming, expensive, and particular to a narrowlydefined group of patients. Proposed by Brook et al. (1986), an alternative is to synthesize expert
5
opinions through surveying panelists and categorizing their ratings. Differences among panelistscan indicate evenly balanced benefits and risks of doing a procedure or disagreements over whatthe benefits and risks are. Regardless of the source of controversy, disagreements can account formuch of the observed differences in medical spending across the country. Phelps & Mooney (1993)find that disagreements among physicians and their patients account for more of the observedvariation in health spending than differences in socioeconomic factors. Baicker & Chandra (2004)conclude that states with higher Medicare spending have lower-quality of care, perhaps becausecostly, intensive care crowds out the use of more effective care, and Finkelstein et al., 2014 showthat supply-side differences may also account for up to 50% to 60% of the geographic variation inhealth care utilization.
2.3 Socioeconomic FactorsEven absent technological change, health expenditures will rise due to the changing demographicsin the US. Over the last five decades the average American has became richer, more educated, andolder. The effects of income are well-established: when income increases, the demand for bothhealth insurance and health care increase. Liu & Chollet (2006) review the literature, and theyconclude that the income elasticity of demand for health insurance is about 0.1. Although thiselasticity is small, changes in income have a larger effect on the type and generosity of health planchosen, as opposed to the intramarginal decision to purchase insurance (Ringel et al., 2002). Theestimates for the income elasticity of demand for health care range from 0.0 to 0.2, suggesting thathealth care is a normal good. Other studies that use time-series or aggregated state- or county-leveldata have produced higher estimates, ranging from 0.2 to 1.5. As Figure 1 suggests, income elas-ticities in other countries are higher, and cross-national studies have estimated income elasticitiesranging from 1.15 to 1.31 (e.g., Newhouse, 1977).
When relying on income elasticities to forecast changes in demand, it is worth noting that fewstudies observe exogenous changes in patient income. Because nearly all studies use observationaldata, these elasticities are measured as differences in demand attributable to differences, ratherthan changes, in income. Furthermore, the income elasticity may depend greatly on the serviceconsidered: certain services are necessities and will be fairly income-inelastic. Other services,such as cosmetic surgery, are discretionary and may be quite income-elastic.
The link between education and the demand for health services is more nuanced but perhapseven more important. As Grossman (2000) explains, the theoretical relationship between educationand health demand is unclear. Education makes a person more efficient in producing health, sothe quantity of health care required to achieve a given health stock is lowered. At the same time,education increases the demand for health, so the overall relationship between education and healthdepends on the increased productivity of inputs relative to the outward shift in demand for healthcare.
There is a well-established positive correlation between education and health, but identifyinga causal relationship– and understanding why it is exists– has proven more elusive. Cutler &Lleras-Muney (2008) review the literature. Relying on studies that use quasi-experimental varia-tion on schooling policies, they conclude that part of the correlation between education and healthis causal. Partial explanations for the relationship between education and health include the highereducated having higher income, greater access to health care, better labor market outcomes thatprovide health insurance and safer working environments, and a heightened sense of control and
6
self esteem through having a higher rank in society. More tenuous explanations include the highereducated placing higher valuations on future life years, being less risky, having access to morehealth-related information, having improved critical thinking skills, and having wider social net-works.
Coupled with medical innovations, higher income and more education lead to improvements inhealth that generate large increases in longevity. In 1960, average life expectancy at birth was 69.7years. By 1980, it was 73.7 years, and– by 2010– had reached 78.7 years.4 The cumulative gains inlife expectancy from 1970 and 2000 have added about $3.2 trillion per year to national wealth, andthe reduced age-specific mortality rates have mitigated expenditure growth prior to end-of-life care.However at the same time, a growing aging population has increased health expenditures. Cutleret al. (2006) show that the incremental costs per year of life gained has increased disproportionatelyfor those ages 65 and over, due in part to the increased utilization of Medicare-covered home healthcare and hospice services. Even though the reliance on non-hospital services has grown, the useof hospital services at the end-of-life has not slowed appreciably. Assuming constant spendingper age, Newhouse (1992) estimates that the changing population of those over 65 account forabout 15% of the increase in total spending in the late 1980s. Spillman & Lubitz (2000) furtherdemonstrate that both total expenditures from age 65 to death and spending in the last two years oflife increase with longevity.
3 Period 2: Policy Experimentation, 1981-1994By the 1980s, health expenditures were increasing at an all-time high of 16% a year. But in 1981,and again in 1984 and 1991, the growth rate of health expenditures fell significantly. Table 3 liststhe ten largest declines in annual health expenditure growth rate from 1960 to 2015. Significantly,five of the six largest declines in the health expenditure growth rate occurred during this period.We see health-expenditure growth falling, then rising, then falling again–a pattern that may beexplained by innovation in insurance contracts and financial incentives.
The initial decline in health expenditures from 1981 to 1983 remains relatively understudied.The recession which began in July 1981 and ended in November 1982 played a key role. Between1981 and 1983, the growth rate of personal health care expenditures, accounting for approximately85% of national health expenditures, fell by almost 6 percentage points. The decline affected allaspects of spending, including an 8.6 percentage point reduction in hospital expenditure growth,5.1 percentage point reduction in physician and clinical expenditure growth, and a 10 percentagepoint reduction in dental service expenditure growth. Such slowing of expenditures is consistentwith studies finding a pro-cyclical relationship between health and recessions (Charles & DeCicca2008, Dehejia & Lleras-Muney 2004, Ruhm 2000). Researchers have noted that people tend toengage in healthier behaviors during recessions, for example, by increasing exercise, reducingsmoking and drinking, and lowering the consumption of sugary drinks (Asgeirsdottir et al. (2014),Catalano et al. (2011), Ruhm & Black (2002)). Gibson et al. (1984) attribute any remaining growthin health expenditures to price inflation. Because health-related goods and services tend to belabor intensive, they conclude that price inflation is likely higher in health care than it is in other
4The data is from Table 22 of Health, US, 2011, CDC <http://www.cdc.gov/nchs/hus/contents2011.htm>. Ac-cessed August 1, 2015.
7
industries. However, other factors were at play as providers and payers experimented with othermodels.
3.1 Medicare Payment Reform3.1.1 The Prospective Payment System
Another precipitous decline occurred from 1984 to 1986, and it aligns closely with the October1983 implementation of Medicare’s prospective payment system (PPS). Under PPS, hospitals arereimbursed at a per-determined rate per inpatient admission, regardless of actual services admin-istered. Clinical information is used to classify each patient into a diagnosis-related group (DRG),and each DRG has a payment weight associated to it. The weights are based on the average re-sources needed to treat a Medicare patient with a specific diagnosis. In theory, PPS incentivizeshospitals to use resources efficiently, especially if a given provider tends to incur higher than av-erage costs. The extensive empirical literature supports this theory, and Coulam & Gaumer (1992)provides a comprehensive review.
Financially, the evidence points to reductions in total margins and a slower rate of increase ofhospital expenditures (Feder et al., 1987, Hadley et al., 1989). The reduced hospital expenditurescan be attributed to a slowdown in the increase in wages per hour, improved labor productivity, andmoderate, short-lived reductions in the length of stay (e.g., Cromwell & Pope, 1989, Long et al.,1987). PPS also shifted the setting in which care is administered. Physicians shifted a share oftheir surgical procedures from the inpatient setting to the outpatient setting, where payments weremade according to a fee-for-service (FFS) model (DesHarnais et al., 1988, Sloan et al., 1988).Hospitals also increased the proportion of patients they discharged to home health agencies (e.g.,Long et al., 1987). In theory, discharges to skilled nursing facilities should also have increased,but the empirical evidence is mixed. The conflicting findings are likely due to concurrent changesin coverage and payment policies for skilled nursing facilities during this period.
While PPS appears to have lowered costs, it can come at the expense of cost-shifting, cream-skimming behavior, or lower quality of care. Reimbursements are benchmarked to the cost oftreating the average patient, so in theory, PPS can encourage hospitals to avoid treating the sicker,costlier patients. It can also encourage hospitals to discharge patients as early as possible, regard-less of potential increases in health risk. However, there are no clear empirical documentationsof these adverse behaviors. Prices to third-party payers did not increase, suggesting that hospitalsdid not shift Medicare PPS shortfalls to private payers (Hadley & Zuckerman, 1990, Zuckerman& Holahan, 1988). Mortality statistics and remission rates did not change substantially, and trans-fers, which allows for the “dumping” of sicker patients to other hospitals, also did not change (e.g.,Kahn et al., 1990, Sloan et al., 1988).
There is stronger evidence that PPS encouraged upcoding or DRG creep, which refers to themanipulation of diagnostic coding to maximize reimbursements. Identifying DRG creep is diffi-cult because some changes in case mix are related to true changes in the resources needed carefor sicker patients (e.g., Ginsburg & Carter, 1986). Each year, the Center for Medicare and Medi-caid Services (CMS), formerly known as the Health Care Financing Administration (HCFA), usesdata on the average hospital costs to recalibrate weights for DRGs. Therefore, an increase inDRG weights can be indicative of either upcoding or simply the need to perform more complex,technologically intensive procedures that cannot be conducted outside of a hospital. Two studies
8
overcome these empirical challenges. Carter et al. (1990) exploit data from a private firm that inde-pendently recoded DRGs for a random sample of hospital charts. They find that between 1986 and1987, about two-thirds of the change in DRG payments reflect actual changes in the complexity ofcases, while the rest can be attributed to changes in coding practice. Dafny (2005) utilizes an ex-ogenous increase shock to certain DRG codes to identify the tendency to upcode. In 1987, HCFAeliminated several DRG codes and recalibrated the DRG weights. The recalibration created dif-ferential price changes among highly substitutable pairs of DRG codes. Dafny finds that hospitalsrespond primarily by upcoding patients to diagnosis codes with the largest price increases.
Despite the wealth of studies looking at PPS, several empirical constraints limit our under-standing of the potential effectiveness of PPS as a cost-containment strategy. First, the nationaladoption of PPS lends itself to a pre- and post-PPS study, but such an approach cannot disentanglethe impact of PPS from temporal confounding factors (Giacalone, 2001, Lohr, 1990). For exam-ple, the increasing adoption of technology favored use of outpatient care. The rise of managed-careprograms contributed to cost-reductions, and the liberalization of home health agencies from re-strictive Medicare rules increased the appeal of home health care. The 1986 amendments to theConditions of Participation, which laid forth new quality assurance standards for hospitals, alsolikely dampened potential quality-reductions from to PPS. Second, many studies focus on only thefirst three to four years following PPS implementation, so behavioral changes are limited to short-run observations. Third, it is widely conceded that in the first year of PPS, the “overpayment”created margins that were aberrant, making the short study windows even more limiting. Never-theless, policymakers consider PPS to be a successful method of containing costs, and the systemwas later implemented for Medicaid and Medicare reimbursements in skilled nursing facilities in1997 and home health agencies and Federally Qualified Health Centers in 2000.
3.1.2 The 1985 and 1987 Legislative Changes
From 1986 to 1988, the health expenditure growth rate once again began to climb. The literatureexamining this brief rise remains scant. However, it is likely not coincidental that the three healthservice groups with the largest expenditure growth rates in this period– Medicare services, homehealth services, and other professional services– are those that were most highly targeted by majorfederal policy changes.5 In 1985, the Reagan administration passed the Consolidated OmnibusReconciliation Act of 1985, and in 1987, they passed the Omnibus Budget Reconciliation Act of1987.
Both reforms mandated increases in the Medicare payment rate for inpatient hospital services.The 1985 act increased inpatient payments by 1%, and the 1987 act increased inpatient paymentsby 3% for rural hospitals, 1.5% for hospitals located in large urban areas, and 1% for all otherhospitals. The 1987 act also increased the medical economic index for physician services by 3.6%for primary care services and 1% for all other services. These payment increases likely incentivizedproviders to perform more services.
Both mandates also targeted home health care and other professional services. For example,Medicare home health agencies became required to provide services through licensed health care
5The annual growth rate of Medicare expenditures went from 7% in 1986 to 13.7% in 1989. For home healthservices, the annual growth rate of expenditures went from 13% in 1986 to 26.5% in 1988. For other professionalservices, the annual growth rate of expenditures went from 14% in 1986 to 21% in 1988. These figures are calculatedusing data from the National Health Expenditures Account.
9
professionals and were subject to unannounced quality check-ups. Medicare also became requiredto financially cover outpatient occupational therapy services, services provided by optometrists,and services furnished by select clinical social workers. These increases in benefit coverage likelyincentivized a higher utilization of services. Although increases in the home health and profes-sional service expenditures were large, these services account for only 1.1 to 1.6% of nationalhealth expenditures. Changes in hospital and physician payments likely constitute a much largerexplanation for the increasing health expenditure growth rate during the late 1980s.
While certain Medicare payments increased, others were reduced. These include paymentreductions for indirect medical education costs, reductions in the prevailing charges for 12 com-monly performed procedures, and freezes on the fee schedules for clinical diagnostic laboratorytesting.6 The 1987 act also reduced payments for durable medical equipment, prosthetics, and or-thotics to the lower of the actual charge for the equipment or the fee schedule amount establishedby the carrier. This payment change for durable medical equipment foreshadows the 2013 move-ment towards competitive bidding; under the competitive bidding program, suppliers submit bidsto provide equipment and supplies at lower prices than what Medicare currently pays.
3.1.3 The 1989, 1990, and 1993 Legislative Changes
Following its brief increase, the health expenditure growth rate began to decline once again in the1990s. While most of the decline can be attributed to the rise of managed care (discussed in Section3.2), the repeated reductions in Medicare payments also played a role. The 1990s were marked byMedicare payment reductions with the explicit goal of reducing the deficit. The Omnibus BudgetReconciliation Acts of 1989, 1990, and 1993 resulted in annual reductions in Medicare paymentsfrom 1991 through 1997. Together with the implementation of PPS, these reforms were estimatedto have reduced Medicare payments by $160 billion. The reductions in hospital payments fromMedicare, known as Medicare “bite,” had differential impacts during the late 1980s and early1990s. Cutler (1998) notes that in the 1980s when PPS was first introduced, Medicare paymentswere offset by increased prices to private insurers. However, when managed care networks grew,it became more difficult to shift costs from the public sector to private payers, so hospitals wereforced to reduce costs by downsizing.7
3.2 Managed CareOne of the most important policy experiments involved managed care. Managed care plans, aterm broadly used to describe health insurance contracts aimed at reducing costs while improv-ing quality of care, began to gain in popularity in the 1980s. These plans included models suchas health maintenance organizations (HMOs), preferred provider organizations (PPOs), point ofservice plans, and exclusive provider organizations. They are differentiated by the amount of out-of-network coverage offered and whether gatekeepers are used to access specialized care. While
6The 12 commonly performed procedures include bronchoscopy, carpel tunnel repair, cataract surgery, coronaryartery bypass surgery, diagnostic and/or therapeutic dilation and curettage, knee arthroscopy, knee arthroplasty, pace-maker implantation surgery, total hip replacement, suprapubic prostatectomy, transurethral resection of the prostate,and upper gastrointestinal endoscopy.
7Medicare bite did not affect the acquisition of new technologies and services provided disproportionately to thepoor.
10
managed care plans date back to 1849, only 5% of Americans were enrolled in a managed careplan in 1980. By 1995, this number had grown to 73% (Cutler & Sheiner, 1998).
In the earlier years, managed care penetration grew slowly because providers and states dis-approved of limiting provider networks. Over half of states banned consumer-controlled medicalplans, and 17 states required free choice of physician (Gruber et al., 1988). However, after theintroduction of Medicare and Medicaid in 1965, federal and state governments gained a vestedinterest in curbing the rising cost of health care. In 1973, the federal government passed the HealthMaintenance Organization Act which encouraged the growth of managed care plans by provid-ing start-up funds to HMOs. Then between 1981 and 1984, several states passed regulations thatrelaxed their pre-existing constraints against selective contracts between insurers and providers.These policy changes resulted in a rapid escalation of HMO plans (Gabel et al., 1986).
Although the rise in managed care participation began almost exclusively within the privatesector, by the late 1980s, it had extended to the public sectors. Medicaid managed care grewafter states began contracting with Medicaid managed-care plans, and Medicare managed careexpanded through a series of Medicare demonstrations. After verifying the feasibility of capitationpayments, Medicare formally established a risk-contracting program for HMOs in 1985. MedicarePPO demonstrations followed suit in the early 1990s (Langwell & Gordon, 1990).
Like PPS, the effects of managed care on utilization, cost savings, and health quality havebeen studied extensively. Glied (2000) provides a comprehensive review of the literature, and shenotes that estimation is complicated by a few empirical difficulties. First, managed care plansvary in their complexity, and data on factors such as cost-sharing arrangements or the stringencyof the utilization review procedures is often not released. Second, there is often selection biasbecause the individuals who decide to enroll in a managed care plan can be very different in termsof underlying health and health utilization preferences relative to those who choose FFS plans.Results of selection studies suggest that managed care plans enjoy a 20 to 30% prior utilizationadvantage by attracting younger families and fewer people who are chronically ill (Berki et al.,1977). Nevertheless, the RAND insurance experiment finds no statistically significant differencesbetween the prior expenditures of those assigned into an HMO and those who voluntarily chosethe plan (Manning et al., 1984).
Chernew et al. (1998), Miller & Luft (1994), and Miller & Luft (1997) offer detailed reviewsof studies that examine the effect of managed care enrollment on utilization. Because of selectionbias, they focus on publications that make an attempt to account for differences between managedcare and non-managed care enrollees. There is large variation in results, likely stemming from alimited ability to control for selection, imperfect information on plan characteristics, heterogeneityacross managed care plans, and non-uniform measures of utilization. Nevertheless, on average,studies conclude that total charges tend to be about 10 to 15% lower in HMO plans. It is less clearwhether PPOs generate the same type of expenditure reductions (Smith, 1997), and it does notappear that Medicaid managed care plans lower Medicaid spending (Duggan & Hayford, 2013).
While the aforementioned studies identify modest cost savings from managed care plans, it isnot equivalent to showing that managed care plans reduce total health care costs. If cost savings areoccurring due to the selection of healthier patients or the selective entry of managed care plans intomarkets that are on average lower cost, then total health costs may actually increase with highermanaged care penetration. An extensive review of the studies can be found in Glied (2000) andBaker (2003). Earlier studies, which did not account for potential selection bias, generally find noeffect between managed care penetration and total costs. On the other hand, more recent studies,
11
which try to limit health plan level selection, find a negative relationship between managed carepenetration and the total cost growth rate (e.g., Baker, 1997, Cutler & Sheiner, 1998, Robinson,1996).
Others have noted that administrative costs of managed care are particularly high, and the costof administering utilization controls are higher in the private sector relative to Medicare (Philipsonet al., 2010). The lower administrative costs among Medicare are often interpreted as part of thevalue generated by centralized insurance. To break even with Medicare FFS plans, Brown et al.(1993) estimates that private managed care plans must decrease expenditures by at least 15% tosimply cover administrative costs for marketing, negotiation of provider contracts, and regulatoryand compliance management.
There are several channels through which managed care plans can affect health expenditures.Several studies provide evidence that physicians adopt practice styles that apply differently acrosstheir insured patients (Baker & McClellan, 2001, Glied & Zivin, 2002). Because financial riskhas been transferred to providers, they have a greater incentive to reduce the cost of care. Utiliza-tion controls, such as having a primary care gatekeeper and pre-authorization requirements, alsoreduce unnecessary services and improve coordination of care (e.g., Hurley et al., 1991). Miller& Luft (1994) review the literature and conclude that managed care patients have shorter lengthsof stay, fewer inpatient admissions, fewer use of expensive procedures and tests, higher outpatientutilization, and higher use of preventative services.
Other studies focus on the ability of managed care plans to negotiate lower provider prices inthe private health insurance market (Cutler et al., 2000). Inefficient providers can be excluded fromthe network, and patients can be steered to providers who agree to accept discounted payments(Bindman et al., 1998, Mays et al., 2003). The 1990s reduction in Medicare hospital paymentsfurther encouraged contracting between insurers and low-cost hospitals.
A final channel through which managed care can reduce costs is by slowing the diffusion oftechnology. Cutler & Sheiner (1998) consider several technologies, including advanced cardiacprocedures, radiation therapy, diagnostic radiology, and transplant services. They find preliminaryevidence that increased HMO enrollment is associated with less-rapid diffusion of new technolo-gies, and this effect increases over time. Baker (2001), Baker & Wheeler (1998) and Baker &Phibbs (2001) provide a more detailed study on the impact of HMOs on MRI diffusion and use.They find that high managed care markets have significantly slower diffusion rates of MRIs intohospitals and lower rates of MRI procedure use. Despite the slowdown in technology adoption,quality of care or health outcomes do not appear to be compromised under managed care plans(Ware et al., 1987).
3.3 Other Factors: Inefficiency and Physician-Induced DemandDespite cost containment introduced through the PPS and managed care system, the increasingfragmentation and complexity of payment structures during this time period led to increased ad-ministration costs and reduced efficiency. Comparing administrative costs between the US andCanada from 1983 to 1987, Woolhandler & Himmelstein (1991) show that administrative costs– asa percent of total hospital spending, total costs, or gross income– increased significantly in the USbut declined in Canada. These costs can be traced to higher insurance overhead among both privateand public insurers, higher hospital and nursing home administration costs, and greater physicianoverhead and billing expenses. To this day, administrative costs remain one area in which the US
12
spends a disproportionately large share of its per capita health expenditures. In 2010, the US spentnearly $900 per person per year on administrative costs, whereas Canada spent $416 per personper year and Japan spent $120 per person per year.8
In addition to increasing administrative inefficiency, a substantial amount of literature has fo-cused on the idea of physicians encouraging their patients to demand services with minimal ben-efit (e.g., Evans, 1974, Fuchs, 1978). Known as physician-induced demand, this behavior canoccur because patients are not fully informed and physicians act as an agent on behalf of the pa-tient. Researchers have postulated two main theories to explain physician-induced demand (Ellis& McGuire, 1993, McGuire & Pauly, 1991). First, physicians might be motivated to maintaina certain level of income, so if their income falls below their target, they will alter their recom-mendations to produce additional income. Second, as Arrow (1963) first noted, there may beprofessional uncertainty regarding the effectiveness and success of various treatment options. Thisuncertainty can create what appears to be physician-induced demand. McGuire (2000) reviews theliterature, and concludes that there is a large volume of empirical research that supports the ideaof physician-induced demand. However, the literature has not been highly discriminatory betweenthe target income hypothesis and theories with fixed patient preferences. Some of the more com-pelling evidence for physician-induced demand comes from studying births. For example, Gruber& Owings (1996) show that obstetricians replace drops in their income due to lower fertility ratesby increasing the number of cesarean sections performed.
4 Period 3: The Managed Care Backlash, 1994-2002Transitions into managed care plans were not without controversy. Despite the early enthusiasmfor managed care, health care markets underwent an abrupt transition from support for HMOsto retrenchment and disillusionment in the late 1990s. This backlash stemmed from negative con-sumer sentiments, economic prosperity, legislative responses to consumers, and changes in hospitalmarket power. As health plans lost traction in their efforts to contain costs, premiums increased,returning to the levels of a decade ago. Benefits packages were trimmed, and cost-sharing, partic-ularly for pharmaceuticals, reached new highs.
4.1 The Response to Managed CareRobinson (2001) documents several key developments which led to backlash against managed care.Negative perceptions of managed care began to develop, and these perceptions were influenced bymajor media attention and several major lawsuits (Blendon et al., 1998). One of the most prominentcourt cases occurred when a California jury awarded $89.3 million to the family of a woman whoseHealth Net HMO refused to pay for a costly, experimental procedure to treat the breast cancer thatultimately killed her. Another important verdict handed down a $120 million fine on Aetna USHealthcare for having review processes that delayed a cancer patient’s high-dose chemotherapytreatment and bone marrow transplantation.
Public opinion polls showed that consumers, despite having a high personal satisfaction withmanaged care, held broad negative views of managed care based on anecdotal stories of patients
8These figures are based on the authors’ calculations from the OECD Health Data 2012.
13
being denied treatment (Brodie et al., 1998, Lesser & Ginsburg, 2000). Consumers lamented thelower quality of care, poorer access to providers, and administrative hassles that restricted use ofcare, and internet technology enhanced the ability of consumers to search for and switch amongplans (Strunk et al., 2001). With the internet, consumers could easily check eligibility, benefits,and coinsurance limits, and they could read up on others’ evaluations of quality.
Employers responded to growing consumer discontent by favoring loosely managed PPOs andopen-access HMOs over stricter closed-network plans (Heffler et al., 2001). With the boomingmid-1990 to early-2000 economy, employers faced pressure to attract and retain employees, sothey catered to their employees’ health-insurance preferences. They even absorbed much of theincrease in premiums during this period on behalf of their employees. Draper et al. (2002) notethat employers saw their premiums increase by 11% between 2000 and 2001, the highest rate ofincrease since 1993.
Policymakers responded by adopting regulatory limits on the use of some managed care tools.Between 1999 and 2002, several pieces of managed care consumer legislation passed through theSenate and House, including two Bipartisan Patient Protection Acts (Hearne & Chaikind (2002)).States themselves enacted dozens of measures, including laws that prohibited primary care gate-keepers, restricted utilization review, and mandated benefits (Cooper III & Green, 1991). The “anywilling provider” laws also ensured that providers had equal access to beneficiaries of managedcare plans. Together, these laws made it more difficult for managed care plans to limit coverage orto unreasonably restrict the use of out-of-network providers.
Not all legislation worked against managed care organizations. For example, the BalancedBudget Act of 1997 authorized the HCFA to create Medicare managed care contracts with coordi-nated plans, such as HMOs and PPOs. At the time, these new health plan contracts were part ofthe Medicare+Choice program, which, under the Medicare Prescription Drug, Improvement, andModernization Act of 2003, became known as the Medicare Advantage program. The BalancedBudget Act of 1997 also gave states the authority to mandate enrollment in Medicaid managedcare plans without obtaining a federal waiver.
However, these policies were not successful at maintaining enrollment into managed care plans.Gold (2001) notes that the Balanced Budget Act of 1997 occurred during a time when Congressconcurrently reduced FFS Medicare prices, translating to lower premiums for Medicare+Choiceplans. Furthermore, adequate provider networks became more difficult to form, and the HCFAexperienced a complete reorganization of their central office, leading to a diminished ability to ap-prove insurer participation plans. These conditions resulted in plans withdrawing from the Medi-care+Choice market or offering less generous benefit designs. Similarly, Medicaid managed careplans became unattractive when Medicaid lowered capitation rates, failed to lessen the burden ofproviding particularly expensive services, and mandated enrollment (Long & Yemane, 2005).
Hospitals responded by using their growing market power to negotiate a return to traditionalcompetitive strategies. Throughout the 1990s, the hospital industry was becoming more consoli-dated through mergers and acquisitions. In 1997, the number of mergers and acquisitions peakedat 310 but fell to 132 in 2000 (Cuellar & Gertler, 2003). With increased bargaining power, hospi-tals were able to move toward less restrictive care-management, higher payment rates, and bettercontract terms. Unlike prior disputes with insurers, the disputes in the early 2000s were notablebecause provider organizations were willing to walk away from health plan networks, and thesedisputes involved the largest, most prominent providers in the community (Lesser et al., 2003).
While hospital prices did rise, utilization rates, measured by quantity of services per capita,
14
was the largest contributor to the acceleration of hospital spending. Coupled with an increasinglytight labor market, this increase in demand for services led to widely reported shortages of nurses,pharmacology technicians, and imaging and laboratory technicians (Levit et al., 2003). By 2001,the wages for private hospital workers were increasing by 6% a year.
Finally, insurers responded to provider, consumer, and governmental pressures by offeringfewer managed care plans, outrunning costs by raising premiums, and increasing cost-sharing(Robinson, 2001). This response corresponds to the observation that between 1994 to 2001, thegrowth rate of private expenditures and out-of-pocket costs both increased by 5 percentage points.
4.2 Other Factors: Medicaid Expansions, Medicare Legislation, and Pre-scription Drugs
Other factors contributed to the rise in health expenditures during this period: extended Medicaideligibility, higher Medicare payouts, and a growth in prescription drug spending. Between 1994and 1996, Medicaid coverage declined due to strong economic growth and the disentanglement be-tween Medicaid eligibility and eligibility for Temporary Assistance for Needy Families. Howeverin 1997, Medicaid coverage expanded significantly with the State Children’s Health InsuranceProgram (SCHIP). Established through the Balanced Budget Act of 1997, SCHIP allocated $40billion over 10 years to aid states in expanding their Medicaid programs to low-income children.By 1999, SCHIP enrollment had already reached 1.8 million, and this figure continued to rise to3.9 million in 2003. The increased enrollment into SCHIP led to not only an increase in state andfederal health expenditures, but also a rise in utilization rates among the newly insured.
Medicare payment policies also contributed to the expenditure growth. Although the BalancedBudget Act of 1997 made several large financial cuts with the hopes of reducing spending, theClinton administration, amidst growing political pressure, passed the Medicare, Medicaid, andSCHIP Balanced Budget Refinement Act of 1999. This 1999 act restored $27 billion to variousproviders, with the biggest winners being Medicare managed care organizations. It also canceledthe proposed across-the-board reductions to the outpatient PPS and protected providers against anylosses incurred during the first three years of outpatient-PPS implementation.
Finally, towards the end of the 1990s, spending on prescription drugs began to grow. Insurersincreasingly adopted three-tier pharmacy benefits that required consumers to pay higher co-paysfor preferred and brand-name drugs (Mays et al., 2003). Patients also began using drug therapiesfor longer periods of time. Drug companies invested in more more direct-to-consumer advertising,and they received extended patent lives. Whereas the effective patent life averaged 8.1 years be-tween 1980 and 1984, the “base” patent life in the late 1990s had been increased to 9.5 years, withpossible extensions of up to 15.4 years (Heffler et al., 2001). However, these patterns eventuallyshifted.
5 Period 4: The Golden Era, 2002-2015
In 2002, the growth rate of health expenditures fell again, but unlike the fits and starts from thepolicy era, this slowdown has been sustained and continuous. From 2009 to 2013, the annual healthexpenditure growth rate has not exceeded 4%, a phenomenon not experienced since the 1960s. We
15
know surprisingly little about the root causes. Many have focused on identifying whether thisslowdown in health spending is a result of (1) broader economic factors, (2) structural changes inthe health care system, or (3) both. If broader economic factors are driving the observed slowdown,one can expect that the growth rate of health expenditures to rise in the future. However if structuralchanges are more responsible, then one can expect a continuation of historically low growth rates.
5.1 The Role of the Economy
One obvious culprit is the great recession, and several studies have considered the role ofeconomic downturns in explaining the slowdown in growth. The results point to an economiccontribution, but there is no consensus on the magnitude. Levitt et al. (2013) use a time seriesanalysis to identify macroeconomic variables that are highly predictive of the growth in healthspending in any given year. By focusing on inflation and growth in real GDP, they conclude thatmacroeconomic effects account for 77% of the recent decline in health spending growth. Instead ofassuming a constant relationship between GDP and spending across all years, Dranove et al. (2014)exploits variation in the regional severity of the economic slowdown to similarly conclude that therecession explains approximately 70% of the slowdown from 2007 to 2011. Others have attributeda much smaller role to the recession. Cutler & Sahni (2013) form projections for expected healthspending based on economic models, and they conclude that the recession accounted for 37% of theoverall slowdown in expenditures from 2003 to 2012. Levine & Buntin (2013) find no evidencethat unemployment, loss income, or declines in the values of beneficiaries’ assets affects use ofservices among Medicare beneficiaries.
Of these studies, few focus on identifying the mechanisms by which recessions affect healthspending. Demand is likely a factor. Recessions can lower consumer income, reduce the availabil-ity of employer-sponsored insurance through job loss, or cause employers to reduce health benefitson existing plans. All of these channels will reduce utilization of health services. Ryu et al. (2013)use data on the health spending behavior of beneficiaries at large firms to parse apart these ef-fects. They show that the effects of the recession extend beyond job loss, and the reductions inhealth spending occurred primarily because of rising out of pocket costs. An alternative effect ofthe recession is to shift private coverage towards public coverage. Holahan & McMorrow (2013),Truffer et al. (2010) and Sisko et al. (2009) note that between 2007 and 2012, both Medicaid en-rollment and spending increased. However, the growth in Medicaid spending per enrollee has beenwell below the growth rate in the medical care consumer price index, suggesting that Medicaidhas been able to keep cost increases below that of other sectors in the health system (Young et al.,2014).
However, the recession does not tell the whole story. Figure 3 shows that the slowdown inexpenditures clearly extends beyond the recession periods. The slowdown began as we exitedthe 2001 recession, and it has continued through 2013. While the decrease in health expendituregrowth appears particularly pronounced during the Great Recession from 2007 to 2009, otherfactors must be responsible for at least the pre-recession decline.5.2 Demand-Side Structural ChangesSome have pointed to permanent changes in benefit design, beyond the effects of the recession, toexplain why the slowdown is permanent (e,g., Cutler & Sahni, 2013). Although the growth rateof beneficiary out-of-pocket costs remained constant between 2002-2006 and 2007-2011, Baicker
16
& Goldman (2011) note that the level of real per capita out-of-pocket spending has been increas-ing. The prevalence of managed care plans has also increased. By 2010, only 1% of employer-sponsored plans were FFS plans. Health economists since Arrow have worked on optimal in-surance design, and the increase in patient cost-sharing can be seen as a move to more efficientdesigns. However, few plans implement cost-sharing that discriminate between the use of high-versus low-value care. Through various insurance structures, patients can be incentivized to uti-lize care more efficiently. One such structure is value-based insurance design (VBID) plans whichalign patients’ out-of-pocket costs with the value of the health services they receive. For exam-ple, statin co-payments may be lowered for patients with coronary artery disease but not for thosereceiving treatment for primary prevention. While the literature suggests that modest benefits arerealized through VBID, it is unclear whether these programs are cost-saving. Lee et al. (2013) re-view thirteen studies and conclude that VBID designs improve adherence and lower out-of-pocketspending for drugs. They do not find any significant changes in overall medical spending. How-ever, Goldman et al. (2007) and Mahoney (2008), two studies not reviewed by Lee et al. (2013),find decreases in total health costs. In addition to inconclusive evidence on health costs, little workhas been done to estimate the administrative costs of implementing VBID programs. EstablishingVBID programs can require considerable effort because the value of a given service changes acrosssubgroups of patients. VBID programs have contributed to the slowdown in health spending onlyto the extent that they help reduce total expenditures.
Consumer directed health plans (CDHPs), introduced in the mid 2000s, may also have con-tributed to the slowdown in health expenditures. These plans combine high deductible coveragewith tax-exempt savings accounts, which are used to pay for routine health care expense. The goalof these savings accounts was to encourage consumers to be more cost-conscious users of healthcare. CDHPs started to rise in popularity when regulation passed by the Internal Revenue Servicebetween 2001 and 2002 aided in the establishment of health retirement accounts. Health retirementaccounts are a type of CDHP where an employer adds funds for an employee’s health expenses.Unused funds revert to the employer if the employee leaves the company. An alternative plan thatallowed for greater consumer involvement– health savings accounts– was established in the 2003Medicare Modernization Act. In a health savings account, both the employer and employee cancontribute to the account, but the funds are portable with the employee.
There is robust empirical evidence that CDHPs effectively incentivize patients to change theirhealth care use and reduce costs in the first year after introduction (e.g., Buntin et al., 2011, LoSasso et al., 2010). Researchers have also established longer term impacts of an approximately15% reduction in total spending within the first three years of CDHP enrollment (Haviland et al.,2015). Wilensky (2006) suggests that in addition to lower costs, hospitals might be pressured toincrease price transparency and establish greater uniformity in pricing. Nevertheless, reductionsin use may not lead to better health outcomes. Several studies have found that higher drug costsharing can reduce the use of essential chronic-illness medications. For example, Gaynor et al.(2006) find that consumers substitute prescription drug use with outpatient care, and 35% of sav-ings achieved by reductions in drug spending are offset by consequent increases in other medicalspending. Goldman et al. (2007) find that increased cost sharing is associated with lower rates ofdrug treatment, worse adherence, and more frequent discontinuation of therapy.
Finally, the 2006 passage of Medicare Part D, the Medicare prescription drug plan, certainlyincreased demand for pharmaceuticals, but there is also evidence it may have reduced total spend-ing. Part D spending depends on several factors, including the number of Part D enrollees, their
17
health status, and their drug use. It also depends on each plan’s ability to manage use and negotiatediscounts. Actual Part D spending has been lower than anticipated because enrollment has beenlower than projected. Furthermore, Part D plan sponsors have been able to negotiate on average15% savings relative to retail prices, and the majority of beneficiary spending on brand-name drugshas occurred within preferred tiers of Part D plans (CBO, 2014). Shang & Goldman (2010) fur-ther show that a $1 increase in prescription drug spending is associated with a $2.06 reduction inMedicare spending because prescription drugs and medical services covered by Medicare Parts Aand B are substitutes.
5.3 Supply-Side Structural ChangesOthers attribute the slowdown to changes in the organization and delivery care, with the rise ofAccountable Care Organizations (ACOs) being perhaps the most popular. First coined in around2006, ACOs are groups of doctors, hospitals, and other providers who come together to voluntarilycoordinate care. The popularity of ACOs has grown over time with an estimated 14% of theUS population now being served by an ACO (Gold, 2014). The research on these organizationsremains limited, but initial work suggests that some ACOs share in savings of up to $300 millionwhile other ACOs have insignificant impacts on spending relative to their benchmarks (McClellanet al., 2015). Regardless of the potential cost-containment benefits, ACOs grew in popularity grewmainly after the Patient Protection and Affordable Care Act (ACA), and they cannot explain theearlier slowdown in health expenditures observed from 2000 to 2006.
Another supply-side change is a growing emphasis on preventive care. Thorpe (2005) notesthat changes in clinical thresholds for treatment have resulted in earlier interventions. For exam-ple, the thresholds for hypertension have been steadily lowered from 160/95 mmHG in 1980 to140/90 mmHg. The lowered threshold expands the number of Americans targeted for primary pre-vention.9 Similar changes have occurred with lipid controls for cholesterol and glucose levels fordiabetes. Although several components of the ACA emphasize the importance of preventive care,the evidence on the cost-saving potential of preventive care remains mixed. Cohen et al. (2008)review 599 studies in the literature. They conclude that focusing on certain preventable causes ofdeath, such as poor diet, physical inactivity, and smoking, can generate cost savings, but not allpreventive measures represent cost-effective care.
Other studies have focused on the decline of health care prices over time. While isolating theprice component of changes in health expenditures may be difficult, White & Ginsburg (2012)note that the trend toward tighter Medicare payment policies began in the middle of the 2000s.The Deficit Reduction Act of 2005 reduced payment rates for imaging, home health services, anddurable medical equipment while the Medicare Improvements for Patients and Providers Act of2008 made substantial cuts to Medicare Advantage plans. More generally, Medicare paymentshave risen below the relevant index of inflation each year (Martin et al., 2014). Since privatepayments tend to follow changes in Medicare fees, it is possible that tighter Medicare paymentpolicies created spillover effects in private payments as well (Clemens & Gottlieb, 2013).
Finally, some researchers cite the slowdown in technology and pharmaceutical development asa potential explanation for the slowing spending growth. Cutler & Sahni (2013) note that spendingon prescription drugs has fallen from a 10.1% annual growth rate between 1993 to 2003 to a 2.3%
9The first number represents the systolic blood pressure; the second represents the diastolic blood pressure.
18
annual growth rate between 2003 and 2012. They attribute this decline to the the number of drugscoming off patent and fewer introductions of new blockbusters. Furthermore, drugs that accountedfor roughly 17% of prescription drug spending in 2013 are coming off patent in the next five years.Similar patterns have been observed for the use of expensive imaging technology. While the useof advanced imaging use previously grew at an annual rate of 6% or more, the use of imagingdecelerated around 2005 (Lee & Levy, 2012).
5.4 Demographic ShiftsAlthough economic and structural factors may have lowered costs, many demographic factors–including a growing aging population and the rising prevalence of chronic diseases, notably obe-sity, across all age cohorts– have contributed to increasing health expenditures. Relative to thoseages 35 to 44, the average per capita health spending for Americans in 1999 ages 75 and olderwas five times as high. Many have concluded that the increasing fraction of elderly in the overallpopulation will contribute to increasing health expenditures (Schneider & Guralnik, 1990). Never-theless, Reinhardt (2003) notes that the annual growth in spending has affected per capita spendingfor all age groups, and the aging population is too gradual a process to rank as a major cost drivein health care.
Another key demographic factor is that the US population has become less healthy over time.Beginning in the 1980s, the obesity rate shot up, increasing from 15% of the adult population to35% of the population by the mid-2000s. Thorpe et al. (2004) find that obesity is responsible for25% of the rise in health spending from 1987 to 2001, and Finkelstein et al. (2009) conclude thatthe annual medical burden of obesity has increased to almost 10% of all medical spending between1998 and 2006. While the prevalence of obesity has remained fairly stable from 2003 through2010, more recent CDC data suggests that there have been statistically significant decreases inobesity prevalence among children ages 2 to 5 and women 60 and older (Ogden et al., 2014).
More generally, the number and proportion of Americans living with chronic diseases, includ-ing heart disease, asthma, cancer, and diabetes, have been increasing over time (Hoffman et al.,1996). Lakdawalla et al. (2004) further highlight that disability rates among people under age50 have been increasing, in part because general health among the young has been deteriorating.Treatment for people with chronic diseases and conditions account for most of health care costs.According to the Centers for Disease Control and Prevention, the treatment of those with chronicdiseases and conditions accounts for 86% of all health care spending in 2010. They also estimatedthat heart disease and strokes together cost at least $315 billion, cancer care cost $157 billion, dia-betes cost $245 billion, arthritis and related conditions cost $128 billion, and medical costs linkedto obesity cost $147 billion.
6 Conclusion
Since the 1950s, life expectancy in the US has risen at a steady pace, driven mostly by reducedmortality at older ages. The social benefits of these improvements are tremendous– on the orderof 50% of US gross domestic product– although these gains are not widely recognized (Murphy& Topel, 2016). These improvements have also come at substantial cost, with the US devoting an
19
increasing share of its income to health care. Health economists have demonstrated that health careis a normal good, so it is not surprising that the US is not unique. Figure 4 shows the excess healthspending growth between the US and other OECD countries over time. Following Squires (2014),we define excess health spending growth as the percent change in annual health expenditures thatexceeds the percent change in the annual GDP, and we compare the US to a population-weightedaverage of 12 OECD countries. As Figure 4 demonstrates, changes in the excess health-spendinggrowth rate have been quite similar between the US and other countries.
Clearly there are universal factors at play, and health economists have also demonstratedthat technology plays a crucial role. However, it is also the case that technology is treated asa âAIJresidualâAI for the unexplained portion of spending growth. Chandra & Skinner (2012)categorize technological progress in health care based on its impact on cost and health: (1) high-efficiency, low-cost innovations; (2) costly innovations with high efficiency for particular sub-groups; and (3) costly innovations with uncertain efficiency. The first two lead to large improve-ments in life expectancy, but they are not to be blamed for the rise in health spending relative toother nations. It is the third category that has been uniquely abundant in the US.
The field of health economics has been most successful in identifying payment system reformsand demand-side controls that can slow the diffusion of these innovations, without an immediatehit to population health, at least in the short-run. Longer term, there is question of whether effortsto control technology will induce a harmful reduction in innovation, with personalized medicine–currently showing great promise but also great expense– being a notable example. We clearly needa better understanding of what precisely constitutes innovation, how it diffuses, and whether it canbe harnessed to slow spending growth in a way that is socially desirable. Given the successes ofthe past half century, this seems well within the realm of possibility.
20

ReferencesArrow K. 1963. Uncertainty and the welfare economics of medical care. The American Economic
Review 53:941–973
Asgeirsdottir TL, Corman H, Noonan K, Olafsdottir P, Reichman NE. 2014. Was the economiccrisis of 2008 good for icelanders? impact on health behaviors. Economics and Human Biology13:1–19
Baicker K, Chandra A. 2004. Medicare spending, the physician workforce, and beneficiaries’ qual-ity of care. Health Affairs w4:184–197
Baicker K, Goldman D. 2011. Patient cost-sharing and health spending growth. Journal of Eco-nomic Perspectives 25:47–68
Baker L. 1997. The effect of hmos on fee-for-service health care expenditures: Evidence frommedicare. Journal of Health Economics 16:453–481
Baker L. 2001. Managed care and technology adoption in health care: Evidence from magneticresonance imaging. Journal of Health Economics 20:395–421
Baker L. 2003. Managed care spillover effects. Annual Review of Public Health 24:435–456
Baker L, McClellan M. 2001. Managed care, health care quality, and regulation. The Journal ofLegal Studies 30:715–741
Baker L, Phibbs C. 2001. Managed care and technology adoption in health care: Evidence frommagnetic resonance imaging. Journal of Health Economics 20:395–421
Baker L, Wheeler S. 1998. Managed care and technology diffusion: The case of mri. Health Affairs17:195–207
Berki S, Ashcraft M, Penchansky R, Fortus R. 1977. Enrollment choice in a multi-hmo setting:The roles of health risk, financial vulnerability, and access to care. Medical Care 15:95–114
Bindman A, Grumbach K, Vranizan K, Jaffe D, Osmond D. 1998. Selection and exclusion ofprimary care physician by managed care organizations. The Journal of American Medical Asso-ciation 279:675–679
Blendon R, Brodie M, Benson J, Altman D, Levitt L, et al. 1998. Understanding the managed carebacklash. Health Affairs 17:80–94
Brodie M, Brady LA, Altman D. 1998. Media coverage of managed care: Is there a negative bias?Health Affairs 34:9–25
Brook R, Chassin M, Fink A, Solomon D, Kosecoff J, Park R. 1986. A method for the detailedassessment of the appropriateness of medical technologies. International Journal of TechnologyAssessment in Health Care 4:53–63
21
Brown R, Bergeron J, Clement DG, Hill J, Retchin S. 1993. Does managed care work for medi-care? an evaluation of the medicare risk program for hmos. Princeton, NJ: Mathematica PolicyResearch, Inc
Buntin M, Haviland A, McDevitt R, Sood N. 2011. Health care spending and preventive carein high-deductible and consumer-directed health plans. American Journal of Managed Care17:222–230
Card D, Dobkin C, Maestas N. 2008. The impact of nearly universal insurance coverage on healthcare utilization: Evidence from medicare. American Economic Review 98:2242–2258
Carter G, Newhouse J, Rellas D. 1990. How much change in the case mix index is drg creep?RAND Publication Series
Catalano R, Goldman-Mellor S, Saxton K, Margerison-Zilko C, Subbaraman M, et al. 2011. Thehealth effects of economic decline. Annual Review of Public Health 32:1–25
Catlin A, Cowan C, Hartman M, Heffler S, the National Health Expenditure Accounts Team. 2008.National health spending in 2006: A year of change for prescription drugs. Health Affairs 27:1–16
Chandra A, Skinner J. 2012. Technology growth and expenditure growth in health care. Journal ofEconomic Literature 50:645–680
Charles KK, DeCicca P. 2008. Local labor market fluctuations and health: Is there a connectionand for whom? Journal of Health Economics 27:1532–1550
Chernew M, Hirth R, Cutler D. 2009. Increased spending on health care: Long-term implicationsfor the nation. Health Affairs 28:1253–1255
Chernew M, Hirth R, Sonnad S, Ermann R, Fendrick AM. 1998. Managed care, medical technol-ogy, and health care cost growth: A review of the evidence. Medical Care Research and Review55:259–288
Clemens J, Gottlieb J. 2013. In the shadow of a giant: Medicare’s influence on private physicianpayments. NBER Working Paper
Cohen J, Neumann P, Weinstein M. 2008. Does preventive care save money? health economicsand the presidential candidates. The New England Journal of Medicine 358:661–663
Congressional Budget Office. 2014. An update to the budget and economic outlook: 2014-2024
Cooper III P, Green K. 1991. The impact of state laws on managed care. Health Affaris 10:161–169
Coulam RF, Gaumer GL. 1992. Medicare’s prospective payment system: A critical appraisal.Health Care Financing Review 1991:45–77
Cromwell J, Mitchell J. 1986. Physician-induced demand for surgery. Journal of Health Economics5:293–313
22

Cromwell J, Pope GC. 1989. Trends in hospital labor and total factor productivity, 1981-86. HealthCare Financing Review 10:39–50
Cuellar AE, Gertler P. 2003. Trends in hospital consolidation: The formation of local systems.Health Affairs 22:77–87
Cutler D. 1998. Cost shifting or cost cutting? the incidence of reductions in medicare payments.In Tax Policy and the Economy, ed. J Poterba, vol. 12. MIT Press, 1–28
Cutler D, Lleras-Muney A. 2008. Making americans healthier, chap. Education and Health: Eval-uating Theories and Evidence. Russell Sage Foundation, 29–60
Cutler D, McClellan M. 2001. Is technological change in medicine worth it? Health Affairs 20:11–29
Cutler D, McClellan M, Newhouse J. 2000. How does managed care do it? RAND Journal ofEconomics 31:526–548
Cutler D, Rosen AB, Vijan S. 2006. The value of medical spending in the united states, 1960-2000.The New England Journal of Medicine 355:920–927
Cutler D, Sahni N. 2013. If slow rate of health care spending growth persists, projections may beoff by $770 billion. Health Affairs 32:841–850
Cutler D, Sheiner L. 1998. Managed care and the growth of medical expenditures. In Frontiers inHealth Policy Research, ed. A Garber. MIT, 77–116
Dafny LS. 2005. How do hospitals respond to price changes? The American Economic Review95:1525–1547
Dehejia R, Lleras-Muney A. 2004. Booms, busts, and babies’ health. Quarterly Journal of Eco-nomics 119:1091–1130
DesHarnais S, Chesney J, Fleming S. 1988. Trends and regional variations in hospital utilizationand quality during the first two years of the prospective payment system. Inquiry 25:374–382
Dranove D, Garthwaite C, Ody C. 2014. Health spending slowdown is mostly due to economicfactors, not structural change in the health care sector. Health Affairs 33:1399–1406
Draper D, Hurley R, Lesser C, Strunk B. 2002. The changing face of managed care. Health Affaris21:11–23
Duggan M, Hayford T. 2013. Has the shift to managed care reduced medicaid expenditures? evi-dence from state and local-level mandates. Journal of Policy Analysis and Management 32:505–535
Ellis R, McGuire T. 1993. Supply-side and demand-side cost sharing in health care. Journal ofEconomic Perspectives 7:135–151
23
Evans R. 1974. Supplier-induced demand: Some empirical evidence and implications. Macmillan,162–173
Feder J, Hadley J, Zuckerman S. 1987. How did medicare’s prospective payment system affecthospitals? New England Journal of Medicine 317:867–873
Feldstein M, Friedman B. 1977. Tax subsidies, the rational demand for insurance, and the healthcare crisis. Journal of Public Economics 72:155–178
Finkelstein A. 2007. The aggregate effects of health insurance: Evidence from the introduction ofmedicare. The Quarterly Journal of Economics 122:1–37
Finkelstein A, Gentzkow M, Williams H. 2014. Sources of geographic variation in health care:Evidence from patient migration. NBER Working Paper 20789
Finkelstein A, Taubman S, Wright B, Bernstein M, Gruber J, et al. 2012. The oregon health insur-ance experiment: Evidence from the first year. Quarterly Journal of Economics 127:1057–1106
Finkelstein E, Trogdon J, Cohen J, Dietz W. 2009. Annual medical spending attributable to obesity:Payer-and service-specific estimates. Health Affairs 28:w822–w831
Fisher ES, Wennberg DE, Stukel TA, Gottlieb DJ, Lucas F, Pinder EL. 2003a. The implications ofregional variations in medicare spending. part 1: The content, quality, and accessibility of care.Annals of Internal Medicine 138:273–287
Fisher ES, Wennberg DE, Stukel TA, Gottlieb DJ, Lucas F, Pinder EL. 2003b. The implicationsof regional variations in medicare spending. part 2: Health outcomes and satisfaction with care.Annals of Internal Medicine 138:288–298
Fuchs VR. 1978. The supply of surgeons and the demand for operations. The Journal of HumanResources 13:35–56
Gabel J, Ermann D, Rice T, de Lissovoy G. 1986. The emergence and future of ppos. Journal ofHealth Politics, Policy and Law 11:305–322
Gaynor M, Li J, Vogt W. 2006. Is drug coverage a free lunch? cross-price elasticities and the designof prescription drug benefits. NBER Working Paper
Giacalone JA. 2001. The us nursing home industry. M. E. Sharpe, Inc
Gibson RM, Levit KR, Laznby H, Waldo DR. 1984. National health expenditures, 1983. HealthCare Financing Review 6:1–29
Ginsburg P, Carter G. 1986. Medicare case-mix index increase. Health Care Financing Review7:51–65
Glied S. 2000. Handbook of health economics, chap. 13: Managed Care. Elsevier, 707–753
Glied S, Zivin JG. 2002. How do doctors behave when some (but not all) of their patients are inmanaged care? Journal of Health Economics 21:337–353
24
Gold J. 2014. Faq on acos: Accountable care organizations, explained. Kaiser Health News
Gold M. 2001. Medicare + choice: An interim report card. Health Affairs 20:120–138
Goldman D, Joyce G, Zheng Y. 2007. Prescription drug cost sharing associations with medicationand medical utilization and spending and health. The Journal of the American Medical Associa-tion 298:61–69
Grossman M. 2000. Handbook of health economics, vol. 1, chap. The Human Capital Model.Elsevier, 347–408
Gruber J, Owings M. 1996. Physician financial incentives and cesarean section delivery. The RANDJournal of Economics 27:99–123
Gruber L, SHadle M, Polich C. 1988. From movement to industry: The growth of hmos. HealthAffairs 7:197–208
Hadley J, Zuckerman S. 1990. Changes in hospitals’ charges to privately insured patients duringpps. Project Report 3429-07. Washington, D.C.: The Urban Institute
Hadley J, Zuckerman S, Feder J. 1989. Profits and fiscal pressure in the prospective paymentsystem: Their impacts on hospitals. Inquiry 26:354–365
Hall R, Jones C. 2007. The value of life and the rise in health spending. Quarterly Journal ofEconomics 122:39–72
Haviland A, Eisenberg M, Mehrotra A, Huckfeldt P, Sood N. 2015. Do "consumer-directed" healthplans bend the cost curve over time? NBER Working Paper
Hearne J, Chaikind HR. 2002. Patient protection and managed care: Legislation in the 107thcongress. Congressional Research Service Issue Brief for Congress IB98017:1–15
Heffler S, Levit K, Smith S, Smith C, Cowan C, et al. 2001. Health spending growth up in 1999;faster growth expected in the future. Health Affairs 20:193–203
Hoffman C, Rice D, Sung HY. 1996. Persons with chronic conditions: Their prevalence and costs.The Journal of the American Medical Association 276:1473–1479
Holahan J, McMorrow S. 2013. What drove the recent slowdown in health spending growth andcan it continue? The Urban Institute Research Report :1–10
Holmstrom B. 1979. Moral hazard and observability. The Bell Journal of Economics 10:74–91
Hurley R, Freund D, Gage B. 1991. Gatekeeper effects on patterns of physician use. Journal ofFamily Practice 32:167–174
Kahn KL, Keeler EB, Sherwood MJ, Rogers WH, Draper D, et al. 1990. Comparing outcomes ofcare before and after implementation of the drg-based prospective payment system. The Journalof American Medical Association 264:1984–1988
25
Kolstad J, Kowalski A. 2012. The impact of health care reform on hospital and preventative care:Evidence from massachusetts. Journal of Public Economics 96:909–929
Lakdawalla D, Bhattacharya J, Goldman D. 2004. Are the young becoming more disabled? HealthAffairs 23:168–176
Langwell K, Gordon N. 1990. Managed care and the medicare program: Background and evidence.Washington, D.C.: Congressional Budget Office
Lee D, Levy F. 2012. The sharp slowdown in growth of medical imaging: An early analysis sug-gests combination of policies was the cause. Health Affaris 31:w1–w9
Lee J, Maciejewski M, Raju S, Shrank W, Choudhry N. 2013. Value-based insurance design: Qual-ity improvement but no cost savings. Health Affairs 32:1251–1257
Lesser C, Ginsburg P. 2000. Update on the nation’s health care system: 1997-1999. Health Affairs19:206–216
Lesser C, Ginsburg P, Devers K. 2003. The end of an era: What became of the "manged carerevolution" in 2001? Health Services Research 38:337–355
Levine M, Buntin M. 2013. Why has growth in spending for fee-for-service medicare slowed?Congressional Budget Office Working Paper Series
Levit K, Smith C, Cowan C, Lazenby H, Sensenig A, Catlin A. 2003. Trends in u.s. health carespending, 2001. Health Affairs 22:154–164
Levitt L, Claxton G, Roehrig C, Getzen T. 2013. Assessing the effects of the economy on the recentslowdown in health spending. The Kaiser Family Foundation Report
Liu S, Chollet D. 2006. Price and income elasticity of the demand for health insurance and healthcare services. Mathematica Policy Research Reports
Lo Sasso A, Helmchen L, Kaestner R. 2010. The effects of consumer-directed health plans onhealth care spending. The Journal of Risk and Insurance 77:85–103
Lohr KN. 1990. Medicare: A strategy for quality assurance, volume ii: Sources and methods.National Academy of Science
Long MJ, Chesney JD, Ament RP, DesHarnais SI, Fleming ST, et al. 1987. The effect of pps onhospital product and productivity. Medical Care 25:528–538
Long S, Yemane A. 2005. Commercial plans in medicaid managed care: Understanding who staysand who leaves. Health Affairs 24:1084–1094
Mahoney J. 2008. Value-based benefit design: Using a predictive modeling approach to improvecompliance. Journal of Managed Care Pharmacy 14:3–8
Manning W, Leibowitz A, Goldberg G, Rogers W, Newhouse J. 1984. A controlled trial of the ef-fect of a prepaid group practice on use of services. New England Journal of Medicine 310:1505–1510
26
Manning W, Newhouse J, Duan N, Keeler E, Benjamin B, et al. 1988. Health insurance and thedemand for medical care: Evidence from a randomized experiment. The RAND Corporation
Manning W, Newhouse JP, Duan N, Keeler EB, Leibowitz A. 1987. Health insurance and thedemand for medical care: Evidence from a randomized experiment. American Economic Review77:251–277
Martin A, Hartman M, Whittle L, Catlin A, the National Health Expenditure Accounts Team. 2014.National health spending in 2012: Rate of health spending growth remained low for the fourthconsecutive year. Health Affairs 33:66–77
Mays G, Hurley R, Grossman J. 2003. An empty toolbox? changes in health plans’ approaches formanaging costs and care. Health Services Research 38:375–393
McClellan M, Kocot SL, White R. 2015. Early evidence on medicare acos and next steps for themedicare aco program (updated). Health Affairs Blog
McGuire T. 2000. Physician agency. Handbook of Health Economics 1:461–536
McGuire TG, Pauly MV. 1991. Physician response to fee changes with multiple payers. Journal ofHealth Economics 10:385–410
Miller R, Luft H. 1994. Managed care plan performance since 1980. The Journal of AmericanMedical Association 271:1512–1519
Miller R, Luft H. 1997. Does managed care lead to better or worse quality of care? Health Affairs16:7–25
Morris JD. 1954. Eisenhower wins income tax fight in house, 210 to 204: Aid on dividends butrise in exemptions fails as the omnibus reform bill passes. The New York Times
Moseley JB, O’Malley K, Petersen N, Menke T, Brody B, et al. 2002. A controlled trial of arthro-scopic surgery for osteoarthritis of the knee. The New England Journal of Medicine 347:81–88
Murphy K, Topel R. 2016. The value of health and longevity. Journal of Political Economy114:871–904
Newhouse J. 1977. Medical-care expenditure: A cross-national survey. The Journal of HumanResources 12:115–125
Newhouse J. 1992. Medical care costs: How much welfare loss? Journal of Economic Perspectives6:3–21
Ogden C, Carroll M, Kit B, Flegal K. 2014. Prevalence of childhoood and adult obesity in theunited states, 2011-2012. The Journal of the American Medical Association 311:806–814
Pauly M. 1968. The economics of moral hazard: Comment. The American Economic Review58:531–537
27
Pauly M. 1974. Overinsurance and public provision of insurance: The roles of moral hazard andadverse selection. Quarterly Journal of Economics 88:44–62
Phelps CE, Mooney C. 1993. Competitive approaches to health care reform, chap. Variations inMedical Practice Use: Causes and Consequences. Urban Institute, 140–78
Philipson T, Seabury S, Lockwood L, Goldman D, Lakdawalla D. 2010. Geographic variation inheatlh care: The role of private markets. Brookings Papers on Economic Activity :325–361
Rae M, Claxton G, Panchal N, Levitt L. 2014. Tax subsidies for private health insurance. KaiserFamily Foundation Issue Brief :1–20
Reed LS. 1947. Blue cross and medical service plans. Washington: Federal Security Agency, U.S.Public Health Service
Reeder CE, Nelson AA. 1985. The differential impact of copayment on drug use in a medicaidpopulation. Inquiry 22:396–403
Reinhardt U. 2003. Does the aging of the population really drive the demand for health care?Health Affairs 22:27–39
Rice TH. 1983. The impact of changing medicare reimbursement rates on physician-induced de-mand. Medical Care 21:803–815
Ringel J, Hosek S, Vollaard B, Mahnovski S. 2002. The elasticity of demand for health care: Areview of the literature and its application to the military health system. RAND Health
Robinson J. 2001. The end of managed care. The Journal of the American Medical Association285:2622–2628
Robinson JC. 1996. Decline in hospital utilization and cost inflation under managed care in cali-fornia. The Journal of American Medical Association 276:1060–1064
Ruhm C. 2000. Are recessions good for your health? Quarterly Journal of Economics 115:617–650
Ruhm C, Black W. 2002. Does drinking really decrease in bad times? Journal of Health Economics21:659–678
Ryu A, Gibson T, McKellar R, Chernew M. 2013. The slowdown in health care spending in 2009–11 reflected factors other than the weak economy and thus may persist. Health Affairs 32:835–840
Sanger-Katz M, Quealy K. 2014. Medicare: Not such a budget-buster anymore. New York TimesAug 27
Schneider E, Guralnik J. 1990. The aging of america: Impact on health care costs. The Journal ofthe American Medical Association 263:2335–2340
28
Shang B, Goldman D. 2010. Prescription drug coverage and medicare spending among us elderly.The Geneva Papers on Risk and Insurance: Issues and Practice
Sisko A, Truffe C, Smith S, Keehan S, Cylus J, et al. 2009. Health spending projections through2018: Recession effects add uncertainty to the outlook. Health Affairs 28:w346–57
Sloan F, Morrisey M, Joseph V. 1988. Medicare prospective payment and the use of medical tech-nologies in hospitals. Medical Care 26:837–853
Smith D. 1997. The effects of preferred provider organizations on health care use and costs. Inquiry34:278–287
Spillman B, Lubitz J. 2000. The effect of longevity on spending for acute and long-term care. TheNew England Journal of Medicine 342:1409–1415
Squires D. 2014. The global slowdown in health care spending growth. The Journal of the Ameri-can Medical Association 312:485–486
Strunk B, Devers K, Hurley R. 2001. Health plan-provider showdowns on the rise. CommunityTracking Study Issue Brief No. 40
Stuart B, Zacker C. 1999. Who bears the burden of medicaid drug copayment policies? HealthAffairs 18:201–212
Temel J, Greer J, Muzikansky A, Gallgher E, Admane S, et al. 2010. Early palliative care forpatients with metastatic non-small-cell lung cancer. The New England Journal of Medicine363:733–742
Thomasson M. 2004. Early evidence of an adverse selection death spiral? the case of blue crossand blue shield. Exploration in Economic History 41:313–328
Thorpe K. 2005. The rise in health care spending and what to do about it? Health Affairs 24:1436–1445
Thorpe K, Florence C, Howard D, Joski P. 2004. Trends: The impact of obesity on rising medicalspending. Health Affairs w4:480–486
Truffer C, Keehan S, Smith S, Cylus J, Sisko A, et al. 2010. Health spending projections through2019: The recession’s impact continues. Health Affairs 29:522–529
Ware J, Brook R, Keeler WRE, Davies AR, Sherbounre C, et al. 1987. Health outcomes for adultsin prepaid and fee-for-service systems of care: Results from the health insurance experiment.Tech. Rep. R-3459-HHS, RAND
Weisbrod B. 1991. The health care quadrilemma: An essay on technological change, insurance,quality of care, and cost containment. Journal of Economic Literature 29:523–552
White C, Ginsburg P. 2012. Slower growth in medicare spending– is this the new normal? TheNew England Journal of Medicine 366:1073–1075
29
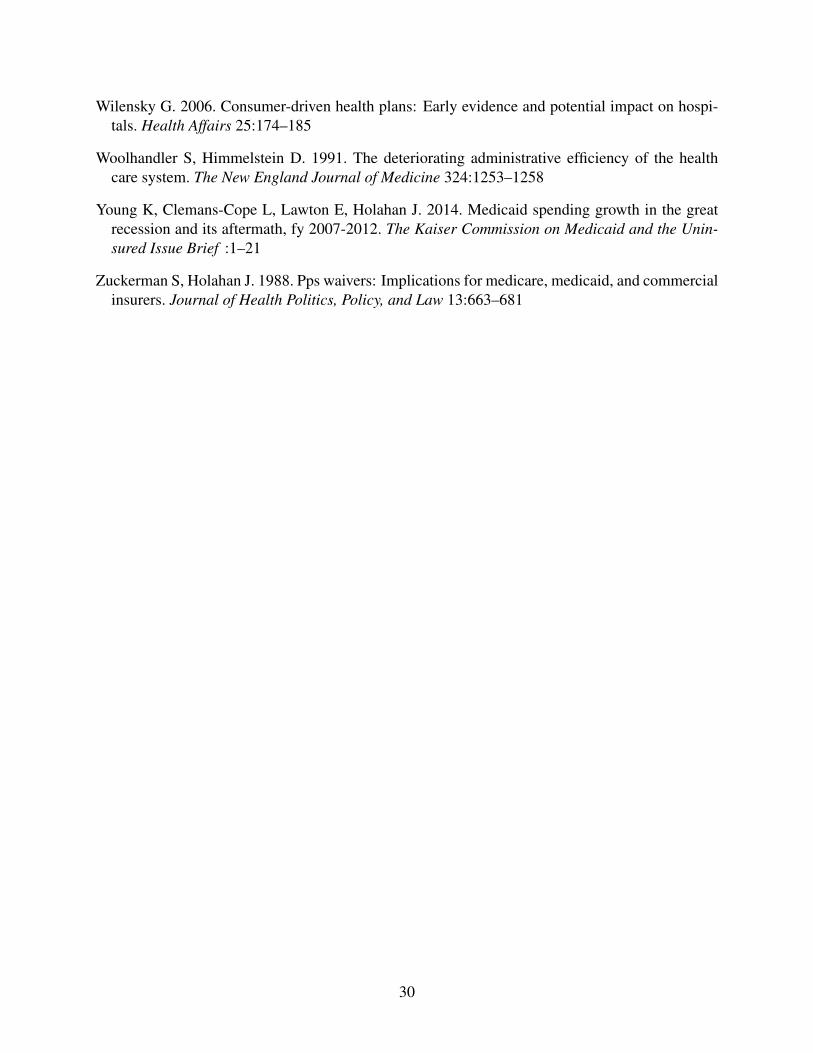
Wilensky G. 2006. Consumer-driven health plans: Early evidence and potential impact on hospi-tals. Health Affairs 25:174–185
Woolhandler S, Himmelstein D. 1991. The deteriorating administrative efficiency of the healthcare system. The New England Journal of Medicine 324:1253–1258
Young K, Clemans-Cope L, Lawton E, Holahan J. 2014. Medicaid spending growth in the greatrecession and its aftermath, fy 2007-2012. The Kaiser Commission on Medicaid and the Unin-sured Issue Brief :1–21
Zuckerman S, Holahan J. 1988. Pps waivers: Implications for medicare, medicaid, and commercialinsurers. Journal of Health Politics, Policy, and Law 13:663–681
30
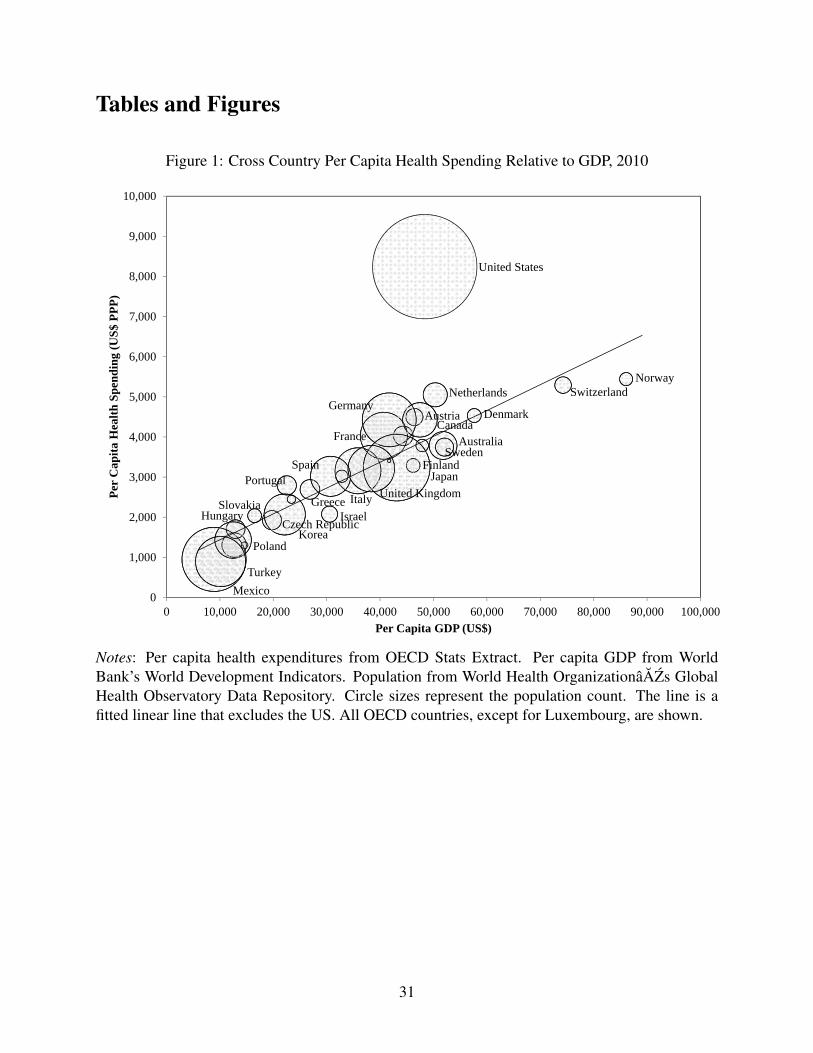
Tables and Figures
Figure 1: Cross Country Per Capita Health Spending Relative to GDP, 2010
Australia
AustriaCanada
Czech Republic
Denmark
Finland
France
Germany
GreeceHungary Israel
Italy
Japan
Korea
Mexico
NetherlandsNorway
Poland
Portugal
Slovakia
SpainSweden
Switzerland
Turkey
United Kingdom
United States
0
1,000
2,000
3,000
4,000
5,000
6,000
7,000
8,000
9,000
10,000
0 10,000 20,000 30,000 40,000 50,000 60,000 70,000 80,000 90,000 100,000
Per
Cap
ita H
ealth
Spe
ndin
g (U
S$ P
PP)
Per Capita GDP (US$)
Notes: Per capita health expenditures from OECD Stats Extract. Per capita GDP from WorldBank’s World Development Indicators. Population from World Health OrganizationâAZs GlobalHealth Observatory Data Repository. Circle sizes represent the population count. The line is afitted linear line that excludes the US. All OECD countries, except for Luxembourg, are shown.
31
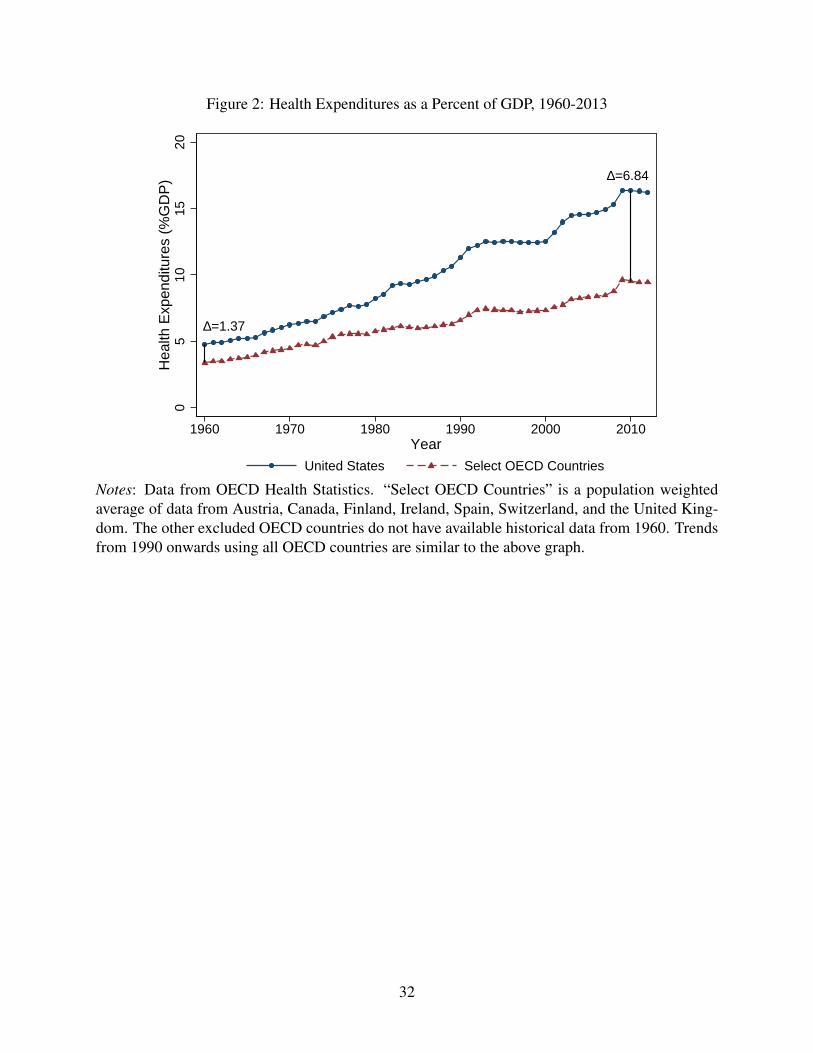
Figure 2: Health Expenditures as a Percent of GDP, 1960-2013
D=1.37
D=6.840
510
1520
Hea
lth E
xpen
ditu
res
(%G
DP
)
1960 1970 1980 1990 2000 2010Year
United States Select OECD Countries
Notes: Data from OECD Health Statistics. “Select OECD Countries” is a population weightedaverage of data from Austria, Canada, Finland, Ireland, Spain, Switzerland, and the United King-dom. The other excluded OECD countries do not have available historical data from 1960. Trendsfrom 1990 onwards using all OECD countries are similar to the above graph.
32
Figure 3: Percent Change in Health Expenditures, 1960-2013
0
2
4
6
8
10
12
14
16
18
1960 1965 1970 1975 1980 1985 1990 1995 2000 2005 2010
Perc
ent C
hang
e (%
)
Year
Period 1: Exploration
Period 2: Policy
Experimentation
Period 3:Backlash
Period 4: Golden Era
Changes in (1) benefit design, (2) soceioeconomic factors, and (3) technology
Notes: Data on total annual health spending from the National Health Expenditure Accounts. Greybars represent macroeconomic recessions as identified by the National Bureau of Economic Re-search. Changes in benefit design, socioeconomic factors, and technology play a key role through-out this time period. In period 1, the general increase in health expenditure growth can be attributedto increased insurance access, higher income, an aging population, and technological improve-ments. In period 2, changes in health expenditures are driven by the introduction of Medicare’sprospective payment system (PPS), the establishment of diagnosis-related groups (DRG), Medi-care’s fee increases, and the rise of managed care (MC). In period 3, there was backlash againstthe managed care system and several studies began to investigate the idea of physician induceddemand. In period 4, various factors discussed in Section 5 have contributed to the slowing ofhealth expenditure growth.
33
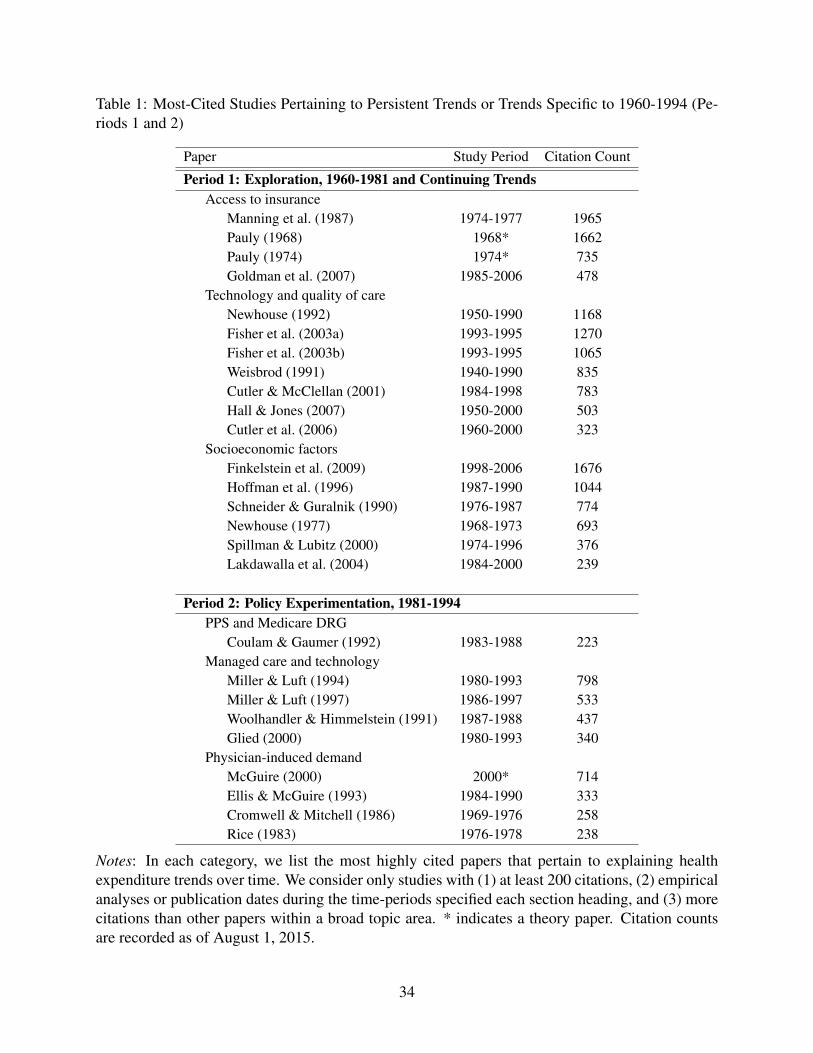
Table 1: Most-Cited Studies Pertaining to Persistent Trends or Trends Specific to 1960-1994 (Pe-riods 1 and 2)
Paper Study Period Citation Count
Period 1: Exploration, 1960-1981 and Continuing TrendsAccess to insurance
Manning et al. (1987) 1974-1977 1965Pauly (1968) 1968* 1662Pauly (1974) 1974* 735Goldman et al. (2007) 1985-2006 478
Technology and quality of careNewhouse (1992) 1950-1990 1168Fisher et al. (2003a) 1993-1995 1270Fisher et al. (2003b) 1993-1995 1065Weisbrod (1991) 1940-1990 835Cutler & McClellan (2001) 1984-1998 783Hall & Jones (2007) 1950-2000 503Cutler et al. (2006) 1960-2000 323
Socioeconomic factorsFinkelstein et al. (2009) 1998-2006 1676Hoffman et al. (1996) 1987-1990 1044Schneider & Guralnik (1990) 1976-1987 774Newhouse (1977) 1968-1973 693Spillman & Lubitz (2000) 1974-1996 376Lakdawalla et al. (2004) 1984-2000 239
Period 2: Policy Experimentation, 1981-1994PPS and Medicare DRG
Coulam & Gaumer (1992) 1983-1988 223Managed care and technology
Miller & Luft (1994) 1980-1993 798Miller & Luft (1997) 1986-1997 533Woolhandler & Himmelstein (1991) 1987-1988 437Glied (2000) 1980-1993 340
Physician-induced demandMcGuire (2000) 2000* 714Ellis & McGuire (1993) 1984-1990 333Cromwell & Mitchell (1986) 1969-1976 258Rice (1983) 1976-1978 238
Notes: In each category, we list the most highly cited papers that pertain to explaining healthexpenditure trends over time. We consider only studies with (1) at least 200 citations, (2) empiricalanalyses or publication dates during the time-periods specified each section heading, and (3) morecitations than other papers within a broad topic area. * indicates a theory paper. Citation countsare recorded as of August 1, 2015.
34
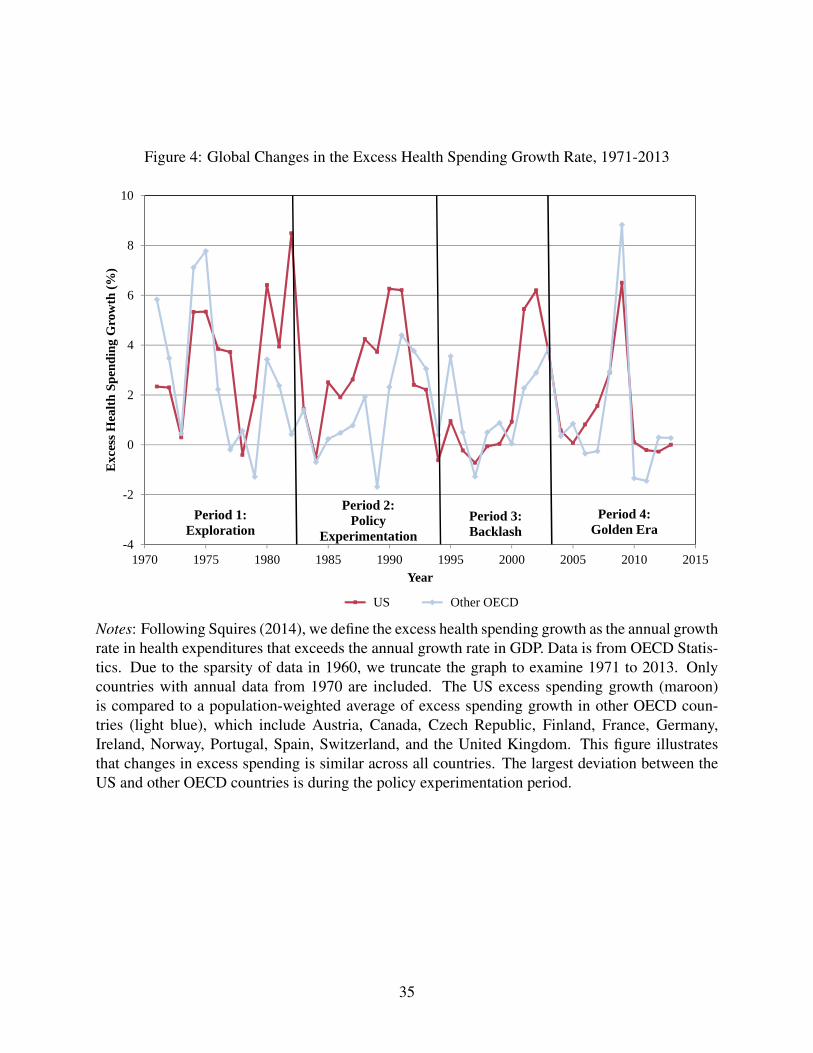
Figure 4: Global Changes in the Excess Health Spending Growth Rate, 1971-2013
-4
-2
0
2
4
6
8
10
1970 1975 1980 1985 1990 1995 2000 2005 2010 2015
Exc
ess H
ealth
Spe
ndin
g G
row
th (%
)
Year
US Other OECD
Period 1: Exploration
Period 2: Policy
ExperimentationPeriod 3:Backlash
Period 4: Golden Era
Notes: Following Squires (2014), we define the excess health spending growth as the annual growthrate in health expenditures that exceeds the annual growth rate in GDP. Data is from OECD Statis-tics. Due to the sparsity of data in 1960, we truncate the graph to examine 1971 to 2013. Onlycountries with annual data from 1970 are included. The US excess spending growth (maroon)is compared to a population-weighted average of excess spending growth in other OECD coun-tries (light blue), which include Austria, Canada, Czech Republic, Finland, France, Germany,Ireland, Norway, Portugal, Spain, Switzerland, and the United Kingdom. This figure illustratesthat changes in excess spending is similar across all countries. The largest deviation between theUS and other OECD countries is during the policy experimentation period.
35
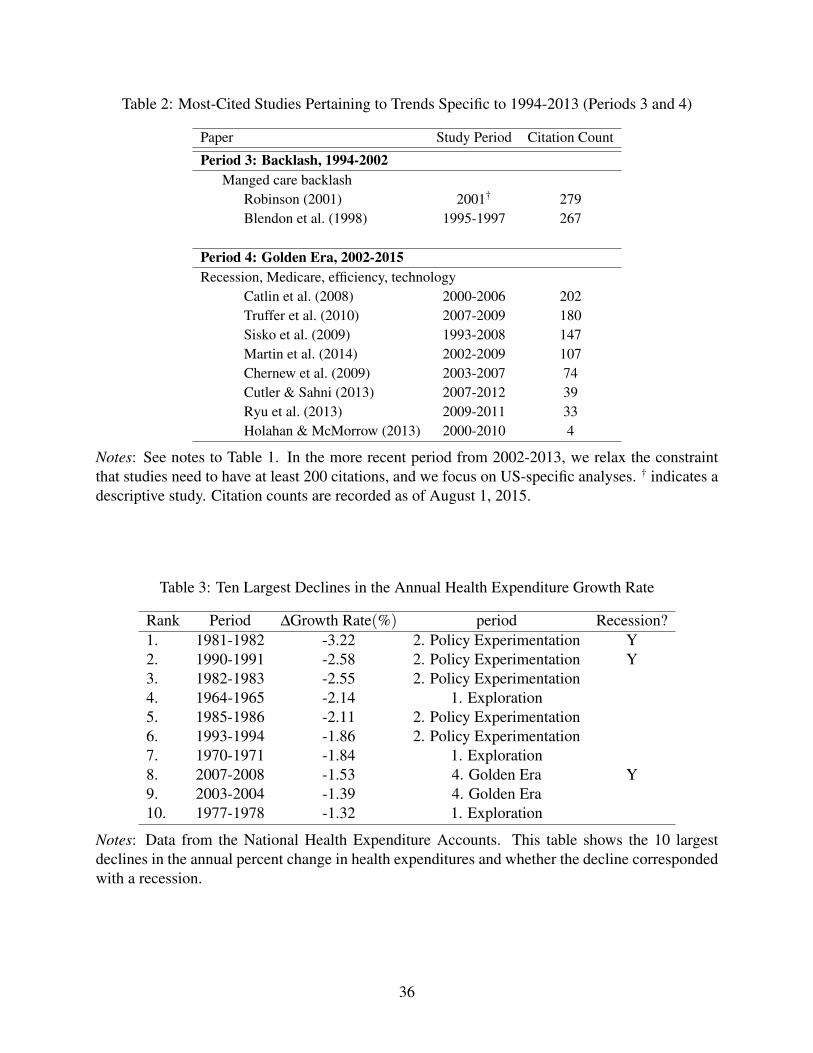
Table 2: Most-Cited Studies Pertaining to Trends Specific to 1994-2013 (Periods 3 and 4)
Paper Study Period Citation Count
Period 3: Backlash, 1994-2002Manged care backlash
Robinson (2001) 2001† 279Blendon et al. (1998) 1995-1997 267
Period 4: Golden Era, 2002-2015Recession, Medicare, efficiency, technology
Catlin et al. (2008) 2000-2006 202Truffer et al. (2010) 2007-2009 180Sisko et al. (2009) 1993-2008 147Martin et al. (2014) 2002-2009 107Chernew et al. (2009) 2003-2007 74Cutler & Sahni (2013) 2007-2012 39Ryu et al. (2013) 2009-2011 33Holahan & McMorrow (2013) 2000-2010 4
Notes: See notes to Table 1. In the more recent period from 2002-2013, we relax the constraintthat studies need to have at least 200 citations, and we focus on US-specific analyses. † indicates adescriptive study. Citation counts are recorded as of August 1, 2015.
Table 3: Ten Largest Declines in the Annual Health Expenditure Growth Rate
Rank Period ∆Growth Rate(%) period Recession?1. 1981-1982 -3.22 2. Policy Experimentation Y2. 1990-1991 -2.58 2. Policy Experimentation Y3. 1982-1983 -2.55 2. Policy Experimentation4. 1964-1965 -2.14 1. Exploration5. 1985-1986 -2.11 2. Policy Experimentation6. 1993-1994 -1.86 2. Policy Experimentation7. 1970-1971 -1.84 1. Exploration8. 2007-2008 -1.53 4. Golden Era Y9. 2003-2004 -1.39 4. Golden Era10. 1977-1978 -1.32 1. Exploration
Notes: Data from the National Health Expenditure Accounts. This table shows the 10 largestdeclines in the annual percent change in health expenditures and whether the decline correspondedwith a recession.
36
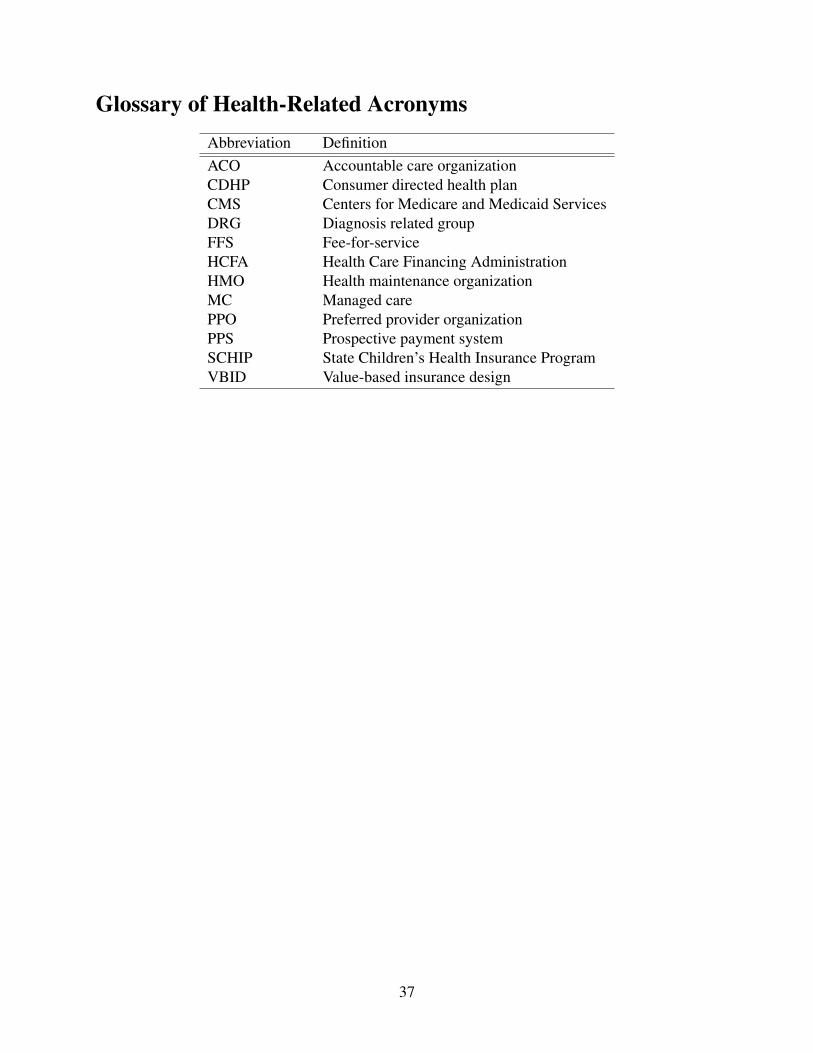
Glossary of Health-Related AcronymsAbbreviation DefinitionACO Accountable care organizationCDHP Consumer directed health planCMS Centers for Medicare and Medicaid ServicesDRG Diagnosis related groupFFS Fee-for-serviceHCFA Health Care Financing AdministrationHMO Health maintenance organizationMC Managed carePPO Preferred provider organizationPPS Prospective payment systemSCHIP State Children’s Health Insurance ProgramVBID Value-based insurance design
37


![THE GROWTH IN SPECIALTY DRUG SPENDING FROM 2013 TO 2014 · 2020-03-03 · The rowth in Specialty Drug Spending from 2013 to 2014 [May 2016] 3 CMS, National Health Expenditures, Historical](https://img.pdfslide.us/doc/110x75/5f40753d66e06d0e1e418660/the-growth-in-specialty-drug-spending-from-2013-to-2014-2020-03-03-the-rowth-in.jpg)