Embed Size (px)
Citation preview

February 2018
Health Care Innovation Awards (HCIA) Meta-Analysis and Evaluators
Collaborative
Annual Report Year 3
Prepared for
Timothy Day Centers for Medicare & Medicaid Services
Center for Medicare & Medicaid Innovation 7500 Security Boulevard
Baltimore, MD 21244-1850
Prepared by
Anupa Bir, ScD MPH Kevin Smith, MA
Leila Kahwati, MD MPH Jim Derzon, PhD
Nikki Freeman, MA Kyle Emery, MA
Holly Stockdale, MPH Julia Cohen, MA
Benjamin Koethe, MS Heather Kane, PhD
Elliott Liebling, MPH RTI International
3040 E. Cornwallis Road Research Triangle Park, NC 27709
RTI Project Number 0212790.009.005

HEALTH CARE INNOVATION AWARDS (HCIA) META-ANALYSIS AND EVALUATORS COLLABORATIVE
THIRD ANNUAL REPORT
Federal Project Officer: Timothy Day
RTI International
CMS Contract No. HHSM500201000021i
February 2018
This project was funded by the Centers for Medicare & Medicaid Services under contract no. 500-00-1234. The statements contained in this report are solely those of the authors and do not necessarily reflect the views or policies of the Centers for Medicare & Medicaid Services. RTI assumes responsibility for the accuracy and completeness of the information contained in this report.

iii
CONTENTS
Executive Summary .........................................................................................................................1
Section 1 Background and Methods ................................................................................................5 1.1 Data Sources ..................................................................................................................6
1.1.1 Primary Data ......................................................................................................6
1.1.2 Secondary Data ..................................................................................................7 1.2 Analytic Methods ...........................................................................................................8
1.2.1 Data Coding and Transformation.......................................................................8
1.2.2 Qualitative Comparative Analysis .....................................................................8
1.2.3 Quantitative Impact Analysis .............................................................................8
Section 2 Implementation Evaluation Findings .............................................................................11 2.1 Implementation Findings Summary .............................................................................11
2.1.1 Common Implementation Challenges..............................................................11
2.1.2 Key External Factor Affecting Implementation ..............................................11
2.1.3 Workforce Development ..................................................................................11
2.1.4 Scalability and Sustainability ...........................................................................12
2.1.5 Implementation Effectiveness ..........................................................................12 2.2 Innovation Characteristics ...........................................................................................12 2.3 Implementation Experience .........................................................................................14
2.3.1 Participant Enrollment and Engagement .........................................................14
2.3.2 Adaptation ........................................................................................................15
2.3.3 Partners ............................................................................................................17
2.3.4 Health Information Technology .......................................................................18
2.3.5 Context .............................................................................................................20
2.3.6 Workforce Development ..................................................................................27 2.4 Scalability and Sustainability .......................................................................................35 2.5 Implementation Effectiveness ......................................................................................38
2.5.1 Fidelity, Reach, and Dose ................................................................................38
2.5.2 Predicting Implementation Effectiveness with a Path Model ..........................40
2.5.3 Qualitative Comparative Analysis (QCA) .......................................................40
Section 3 Impact Evaluation Findings ...........................................................................................43 3.1 Impact Evaluation Summary........................................................................................43
3.1.1 Data Availability ..............................................................................................43
3.1.2 Forest Plots.......................................................................................................43
3.1.3 Heterogeneity Analysis ....................................................................................43
3.1.4 Meta-regression Results: Reasons for Variation..............................................44

iv
3.1.5 Path Model .......................................................................................................44
3.1.6 Qualitative Comparative Analysis ...................................................................44
3.1.7 Comparison Group Methodology ....................................................................45
3.1.8 Comparative Interrupted Time Series Results .................................................45
3.1.9 Bayesian Results ..............................................................................................45 3.2 Classification of HCIA Interventions ..........................................................................46
3.2.1 Intervention Settings ........................................................................................46
3.2.2 Types of Estimates Received ...........................................................................47
3.2.3 Quality of Estimates for Meta-analysis............................................................49 3.3 HCIA Innovation Impacts on the Four Core Outcomes ..............................................50
3.3.1 Total Cost of Care ............................................................................................50
3.3.2 Emergency Department Visits .........................................................................57
3.3.3 Hospital Admissions ........................................................................................63
3.3.4 Hospital Readmissions .....................................................................................68
3.3.5 Impact of Selected Innovation or Awardee Characteristics on Costs of Care ..................................................................................................................75
3.3.6 Sample Size and HCIA Effects ........................................................................76 3.4 Impact Effect Heterogeneity ........................................................................................78 3.5 Meta-Regression Analyses...........................................................................................81
3.5.1 Key Innovation Features ..................................................................................81
3.5.2 Meta-Regression Methods ...............................................................................83
3.5.3 Meta-Regression Results .................................................................................84
3.5.4 Meta-Regression Path Model ...........................................................................88 3.6 Qualitative Comparative Analyses Findings ...............................................................91
3.6.1 Transitional Care Coordination Interventions .................................................92
3.6.2 Outpatient Care Coordination, Care Management, or Patient Navigation Interventions ..................................................................................93
3.6.3 Patient-Centered Medical Home (PCMH) Interventions .................................96
3.6.4 Discussion ........................................................................................................97 3.7 Supplementary Methodological Analyses ...................................................................98
Section 4 Summary ......................................................................................................................100 4.1 Standardized information is needed to conduct informative meta-analyses. .............100 4.2 Most innovations were perceived by FLEs to have been implemented
effectively, but adaptation was often instrumental in achieving implementation effectiveness.....................................................................................100
4.3 Few direct drivers of effective implementation were identified, and implementation effectiveness did not predict differences in total cost of care. .........101
4.4 Scaling and sustainability became an increased focus as innovations matured. ........101 4.5 Additional work is needed to expand the pool of innovation features. .....................102

v
4.6 HCIA effects on TCOC do not appear to have been distorted by selection bias or comparison groups methods. .................................................................................103
4.7 The HCIA sample is adequate for conducting meta-regression with adequate precision. ....................................................................................................................103
4.8 The weighting methods used by FLEs have implications for summary results. .......103 4.9 Final reports should document all changes in methodology ......................................104
References ....................................................................................................................................105
Appendixes A Impact of Comparison Group Construction Methodology ................................................ 107 B Meta-Regression and Path Analysis Methods ................................................................... 117 C Copy of AASF Instruments 1 and 2 ................................................................................... 121 D Evaluation of the Comparative Interrupted Time Series (CITS) Method.......................... 153 E Bayesian Random Effects Meta-Analysis ......................................................................... 161 F Qualitative Comparative Analyses: Detailed Methods and Results .................................. 173 G Main Intervention Categorization and Distribution of Intervention Components ............. 217
List of Figures 2-1 Main innovation components, Health Care Innovation Awards Round One (N = 129
Unique Interventions) .......................................................................................................... 13 2-2 Percentage of awardees using different models of staff deployment .................................. 28 3-1 Total cost of care: Ambulatory care setting innovations reporting savings......................... 52 3-2 Total cost of care: Ambulatory care setting innovations reporting dissavings .................... 53 3-3 Total cost of care: Post-acute care setting innovations ........................................................ 54 3-4 Total cost of care: Hospital setting innovations (60-day lookback) .................................... 55 3-5 Total cost of care: Innovations with unique populations ..................................................... 56 3-6 Emergency department visits: Ambulatory care setting innovations reporting lower
rates of ED use ..................................................................................................................... 58 3-7 Emergency department visits: Ambulatory care setting innovations reporting higher
rates of ED use ..................................................................................................................... 59 3-8 Emergency department visits: Post-acute care setting innovations ..................................... 60 3-9 Emergency department visits: Hospital setting innovations ................................................ 61 3-10 Emergency department visits: Innovations with unique populations .................................. 62 3-11 Hospital admissions: Ambulatory care innovations with lower admission rates ................ 64 3-12 Hospital admissions: Ambulatory care innovations with higher admission rates ............... 65 3-13 Hospital admissions: Post-acute care innovations ............................................................... 66 3-14 Hospital Admissions: Innovations with unique populations ............................................... 67 3-15 Hospital readmissions: Ambulatory care setting innovations per 1,000 admissions
with decreased readmissions ................................................................................................ 69 3-16 Hospital readmissions: Ambulatory care setting innovations measured per 1,000
admissions with increased readmissions .............................................................................. 70 3-17 Hospital readmissions: Ambulatory care setting innovations measured per 1,000
beneficiaries ......................................................................................................................... 71 3-18 Hospital readmissions: Post-acute care innovations ............................................................ 72 3-19 Hospital readmissions: Hospital setting innovations ........................................................... 73 3-20 Hospital readmissions: Innovations with unique populations ............................................. 74
vi
3-21 Impact of selected characteristics on costs of care .............................................................. 75 3-22 Sample size by total cost of care effects: Ambulatory care setting innovations .................. 77 3-23 Sample size by emergency department visit effects: Ambulatory care innovations ........... 78 3-24 Path model of implementation features, utilization, and TCOC effects (N = 65
ambulatory care setting innovations) ................................................................................... 90
List of Tables 2-1 Selected characteristics of Health Care Innovation Awardee Interventions (N = 129
Unique Interventions) .......................................................................................................... 14 3-1 Types of Estimates Received ............................................................................................... 48 3-2 Types of quarterly means data received............................................................................... 49 3-3 Availability of Estimates for Meta-Analysis ....................................................................... 50 3-4 Awardees with results for TCOC significantly different from zero at p <0.1 ..................... 51 3-5 Awardees with results for ED visits significantly different from zero at p <0.1 ................. 57 3-6 Awardees with results for hospital admissions significantly different from zero at p
<0.1 ...................................................................................................................................... 63 3-7 Awardees with results for hospital readmissions significantly different from zero at
p <0.1 ................................................................................................................................... 68 3-8 Heterogeneity statistics ........................................................................................................ 79 3-9 Key innovation features by cluster ...................................................................................... 82 3-10 Meta-regression results for structural features of interventions in ambulatory care
settings (N = 72) 85 ................................................................................................................... 3-11 Meta-regression results for innovation features (N = 72) .................................................... 86 3-12 Meta-regression results for implementation features (N = 72) ............................................ 88 3-13 Sufficient combinations of features found among transitional care coordination
interventions that demonstrated a favorable effect, findings from a qualitative comparative analysis of the Health Care Innovation Awardees Round One ....................... 93
3-14 Sufficient combinations of features found among outpatient care coordination, care management, or patient navigation interventions that demonstrated a favorable effect, findings from a qualitative comparative analysis of the Health Care Innovation Awardees Round One ........................................................................................ 94
3-15 Sufficient combinations of features found among patient-centered medical home interventions that demonstrated a favorable effect, findings from a qualitative comparative analysis of the Health Care Innovation Awardees Round One ....................... 97

vii
Abbreviations AASF Annual Awardee Summary Form ACA Affordable Care Act ACO Accountable Care Organization AHRQ Agency for Healthcare Research and Quality APM Alternative Payment Models BH Behavioral Health CEO Chief Executive Officer CFI Comparative Fit Index CG Comparison Group CHIP Children’s Health Insurance Plan CHW Community Health Worker CI Confidence Interval CITS Comparative Interrupted Time Series CMMI Center for Medicare and Medicaid Innovation CMS Centers for Medicare and Medicaid Services DID Difference in Difference DSRIP Delivery System Reform Incentive Payment ED Emergency Department EHR Electronic Health Record FLE Frontline Evaluator HCC Hierarchical Condition Category HCIA Health Care Innovation Awards HIE Health Information Exchange HIT Health Information Technology IMPEFF Implementation Effectiveness IPD Individual Patient Data IT Information Technology LTPAC Long Term Post Acute Care MCO Managed Care Organization MH Medical Home MMSDM Medication Management and Shared Decision Making MOA Memorandum of Agreement MTM Medication Therapy Management OLS Ordinary Least Squares PBPQ Per Beneficiary Per Quarter PCMH Patient Centered Medical Home PCP Primary Care Provider PDSA Plan-Do-Study-Act PFB Probable Favorable Bias PS Propensity Score PSM Propensity Score Matching QCA Qualitative Comparative Analysis RCT Randomized Controlled Trial RE Random Effects

viii
ROBINS-I Risk of Bias In Non-randomized Studies – of Interventions SD Standard Deviation SE Standard Error SMHS Southeast Mental Health Services SQC Structured Qualitative Coding TCOC Total Cost of Care TEL Telemedicine WF Workflow

1
EXECUTIVE SUMMARY
Section 1115A of the Social Security Act (added by Section 3021 of the Affordable Care Act [ACA]) authorized the Center for Medicare and Medicaid Innovation (CMMI) to test innovative health care payment and service delivery models that had the potential to lower Medicare, Medicaid, and Children’s Health Insurance Program (CHIP) expenditures while maintaining or improving the quality of beneficiaries’ care (42 U.S.C. 1315a). Under the law, preference was given to models that improved coordination, efficiency, and quality. In response, CMMI launched a number of tests of innovative models, including the CMMI-funded Health Care Innovation Awards (HCIA) supporting grassroots innovation to address locally perceived needs.
The first round of 108 awards was made in July 2012 for a 3-year period of performance. A second round of 39 awards was made in September 2014, but is not the topic of this report. These HCIA awardees proposed compelling new service delivery innovations that held promise to drive system transformation and deliver better outcomes for Medicare, Medicaid, and CHIP beneficiaries. The initiative was not prescriptive, but rather open-ended, with specific, shared goals of improving outcomes and reducing costs.
The Centers for Medicare & Medicaid Services (CMS) grouped the first round of awardees by similarity of objective into 10 groups that fall into 3 broad categories of intervention focus and awarded evaluation contracts to 7 frontline evaluators (FLEs). After an open competition, in 2013 CMS awarded RTI a meta-analysis contract to further analyze FLE data from a cross-cutting perspective. The purpose of this effort was not merely to look for an overall initiative impact, but to learn from all HCIA awardees which approaches are most promising, for which populations, and under what conditions. To address these questions required comparisons between groups and within and between specific subpopulations of interest. Given the heterogeneity of the awardees, innovations, and populations, there were opportunities as well as limitations to the impact analyses. The implementation analysis identified barriers and facilitators across various types of innovations, and what awardee or innovation characteristics related to successful implementation. In addition to understanding the common drivers of success across innovations, this work included analyses aimed at specific cross-cutting service delivery issues like developing strategies for pediatric populations and rural populations. This third annual report presents our final findings for the first round HCIA innovations. Two previous annual reports are available through CMS’s website.1
1 Year 1 Annual Report is available at https://innovation.cms.gov/Files/reports/hcia-metaanalysis-evalcollab.pdf; the
Year 2 Annual Report is available at https://downloads.cms.gov/files/cmmi/hcia-metaanalysissecondannualrpt.pdf
Impact Findings. The impact of HCIA innovations on the four core outcomes were estimated by the project’s FLEs. We present forest plots for estimated impacts on costs and utilization for each intervention. These show a mixture of positive (dissavings, the innovation was less successful than their comparator in reducing costs or utilization), negative (savings, the innovation was more successful than their comparator in reducing costs or utilization),
2
and near zero effects (the innovation neither reduced or increased costs or utilization relative to comparators), similar to what has been observed in previous reports. Although a few awardees produced significant cost savings (and a few had significant dissavings), the mean effect of the HCIA award on total cost of care ranged from -$19 per beneficiary per quarter (ambulatory care) to -$160 (in only eight hospital settings), but none of the estimates were significantly different from zero. We observed similar results for three groups of special interest—innovations with a rural health focus, those addressing pediatric populations, and awardees who were granted no-cost extensions. Awardees’ combined effects in these groups had results showing no savings or dissavings as a result of their innovation.
We tested the influence of study design factors by cataloging the methods FLEs used to create comparison groups and by reviewing intervention group recruitment protocols for risk of selection bias. We identified 35% of the evaluations as being at risk for selection bias. However, we found that the potential sources of bias—weighting vs. matching methods, patient recruitment problems, and covariate imbalance (discrepancies between beneficiaries and comparison group members)—had negligible impacts on the HCIA effects reported by FLEs. These results suggest that the difference-in-difference (DID) effects reported by FLEs are unlikely to have been systematically biased, either favorably or unfavorably, by the way comparison groups were constructed or by the way intervention groups were selected.
We expanded our investigation of structural, innovation, and implementation features that affected TCOC effects sizes in the ambulatory care innovations. A set of meta-regression analyses found several features (e.g., awardee was a for-profit organization) associated with either cost savings or dissavings (e.g., innovations with a rural focus or for Medicare beneficiaries). Of six types of innovation components that we evaluated (i.e., used health IT, used community health workers, medical home intervention, focus on behavioral health, used telemedicine, workflow/process redesign intervention), only innovations using community health workers (CHWs) were found to lower total costs (by $138 per beneficiary per quarter).
To obtain a more comprehensive understanding of the relationships between features of innovation implementation and outcomes, we created and estimated a path model that took selected features from the three meta-regression analyses and linked them to the two utilization measures and TCOC. Although several features were related to patient recruitment problems and turnover challenges, neither of these had a significant impact on the core outcomes. As in our last report, we found that hospital admissions had a much greater impact on TCOC effect sizes than did emergency department (ED) visits. This suggest that features affecting hospital admission rates are likely to have the greatest implications for expenditures, but there were no features directly related to hospitalization in the path model. We observed a strong, direct, and unfavorable impact on TCOC for awardees that were implementing new innovations compared with awardees whose were expanding the reach or scope of an existing program or initiative. Innovations providing services directly to beneficiaries were also associated with overall savings, but this effect was transmitted indirectly through ED use and other variables.
Implementation Findings. Implementation experience and effectiveness at the awardee level were assessed with an FLE survey (Annual Awardee Summary Form) administered at the end of the first and second years, and through thematic analysis of FLE quarterly and annual reports. By the end of the second year, over 80% of innovations were considered implemented to

3
a great or moderate extent by FLEs. Although most implementation themes identified in the first and second year were not mentioned in third year annual reports, common themes arose in the third year surrounding sustainability. The primary challenge for many awardees was securing reimbursement for non-traditional staff and services once CMS funding ends. Awardees whose innovations were integrated into the clinical workflow and who were part of large provider institutions were often able to secure internal funding to sustain all or part of their innovation, while other awardees sought external funding sources. Despite these sustainability challenges, the value of these innovations has been recognized by awardees and their organizations, and the vast majority of awardees reported that their innovations will continue, either in whole or in part, after CMS funding expired. To promote replicability and continuing fidelity, many awardees in the third year revised their training to make it less resource intensive to replicate.
Over the course of this meta-evaluation, many themes affecting implementation were identified and addressed by awardees. Some key challenges included cultural barriers (e.g., language barriers, lack of trust) for innovations delivering care or placing self-monitoring technologies in patients’ homes. Vulnerable patients’ needs for additional support affected recruitment and treatment maintenance. Several awardees needed additional staff to support innovation implementation, and faced challenges in recruiting those staff. For many awardees with new partners, the time necessary to build trust and to forge strong relationships was unanticipated.
Awardees adapted their innovations in response to these and other challenges, with several benefits emerging as innovations matured. In particular, implementing effective and workflow-friendly health information technologies (health IT) was a common challenge in early FLE reports. However, by the end of the second year of implementation, this challenge receded and the benefits of robust, well-integrated health IT infrastructures became apparent during the third year. Awardee cross-training; physical colocation of staff; and improved recruitment, hiring, and training practices improved staff satisfaction, retention, empowerment, and staff relations by the third year of the award.
Staff appreciation of CHWs was apparent in the third year as staff recognized their role in improving workflow, connecting with patients, and enhancing implementation. However, lack of reimbursement for CHWs, care coordinators, and new staff types was identified as a significant barrier to sustainability, and many awardees adopting these innovations have secured only temporary funding to retain these staff. Several awardees sought to join payment reform pilots or model tests—mainly accountable care organization (ACO) pilots—for sustainability.
Perhaps most importantly, clinical staff satisfaction with and support for the innovations increased markedly in the second and third years as the value of innovations in improving workflow and patient care became increasingly apparent. Independent of success on the four core outcomes, several innovations will likely be sustained in whole or in part on the basis of staff support and satisfaction.
Nonetheless, several challenges, often beyond awardee control, continue to affect the maintenance and sustainability of innovations. Few awardees used formal improvement or change management processes (such as LEAN, PDSA cycles) to monitor innovation implementation and such processes were adopted to a great extent by only 12 awardees (14.6%).

4
Awardees also reported existing organizational capacity interacted with their resilience to external challenges. For example, awardees with limited capacity in states that did not expand Medicaid programs were challenged by the needs of uninsured patients with health-related social needs, while awardees in states that expanded Medicaid struggled to meet the demand for services that access to insurance created. Local policies likewise occasionally supported innovations by reducing barriers to access or undermined innovations by failing to provide adequate housing standards to support patient health.
With innovations successfully implemented, many organizational leaders implemented plans to sustain all or part of their innovations once CMS support ends. Some awardees turned to state and federal funding streams for ongoing support while others secured financing from commercial health plans. For some awardees, sustaining their innovation was conditional on a demonstrated return on investment or documented improvements in patient health outcomes. However, for many, the improvements in staff satisfaction, workflow, and organizational stature was sufficient to continue the innovation. Most awardees in large provider institutions who had integrated their innovations into the workflow planned to sustain their innovation after the HCIA funding ended. For many awardees, their partners played an active and strategic role in sustainability by agreeing to adopt and integrate key innovation components into their existing work.
We had limited success identifying awardee or innovation features associated with successful implementation. Using qualitative comparative analysis (QCA; an approach based on set theory) and path modeling (a form of correlational analysis), we attempted to isolate innovation features associated with implementation success. QCA did not identify any necessary or sufficient features or combinations of features: all tested features were present in both effectively and ineffectively implemented interventions. The path model identified three key features independently associated with greater implementation success: awardees were more successful in implementing their innovations when innovations were implemented at a single-site, engaged in more staff training, and engaged in more robust implementation planning. For innovations implementing health IT, filling frontline staff roles and recruiting and retaining staff were significant challenges. Awardees implementing new innovations were somewhat less effective implementing their innovations compared to awardees building on or expanding prior innovations. Awardees implementing new innovations faced greater challenges in implementing health IT, and were somewhat more likely to hire technical, research, or administrative staff to support their innovation although these features did not significantly impact implementation effectiveness.

5
SECTION 1 BACKGROUND AND METHODS
Section 1115A of the Social Security Act (added by Section 3021 of the Affordable Care Act [ACA]) authorizes the Center for Medicare and Medicaid Innovation (CMMI) to test innovative health care payment and service delivery models that have the potential to lower Medicare, Medicaid, and Children’s Health Insurance Program (CHIP) expenditures while maintaining or improving the quality of beneficiaries’ care (42 U.S.C. 1315a). Under the law, preference is to be given to models that improve coordination, efficiency, and quality. CMMI has launched a number of models to test innovative models that aim to improve care. Beyond the models that are currently being tested, CMMI funded Health Care Innovation Awards (HCIA) to encourage additional grassroots innovation that addresses locally perceived needs.
The first round of awards was made in July 2012 for a 3-year period of performance. These HCIA awardees have proposed compelling new service delivery and payment models that will drive system transformation and deliver better outcomes for Medicare, Medicaid, and CHIP beneficiaries. The initiative was not prescriptive, but rather open-ended, with specific, shared goals of improving outcomes and reducing costs.
The Centers for Medicare & Medicaid Services (CMS) seeks to learn from the efforts of the diverse group of awardees. For evaluation purposes, CMS categorized awardees into 3 broad groups based on their principal focus and into 10 groups for their similarity of objective. These 10 groups were then assigned to 7 frontline evaluators (FLEs) who conducted process and impact evaluations. In addition, in 2013 CMS awarded RTI a meta-evaluation contract to synthesize results from FLE reports and observations to obtain an overarching perspective on what could be learned from the experience of all HCIA awardees. This allowed for general conclusions to be drawn across these interventions, for example about which approaches are most promising, for which populations, and in what conditions and settings they are most appropriately implemented. For this evaluation, we relied on analyses reported in the FLEs’ quarterly and annuals reports. The meta-evaluation did not collect data directly from awardees, except for a workforce development survey, which was reported in our first annual report.
In addition, the meta-evaluation addresses specific cross-cutting service delivery issues across awardees in developing strategies for specific populations including pediatric populations, rural populations, and populations with behavioral health needs. Moreover, the meta-evaluation examines how interventions can be scaled up to wider practical use and how they can best be subjected to broad-based testing and ongoing quality improvement. In addressing these questions, we used the entire awardee portfolio, allowing comparisons between groups and within and between specific subpopulations of interest.
To maximize efficiency, the scientific value, and the utility of findings for CMS, we coordinated with the FLEs, evaluating the different awardee groups in aggregate. We worked with the FLEs to ensure that (1) the full set of available outcomes and data was understood and carefully managed, (2) we thoroughly understood the interventions and study designs across the projects, (3) we had the opportunity to suggest and influence changes or additions to data collection through CMS representatives for the frontline evaluation, and (4) we collected the analytical outputs from the FLEs that inform the overarching evaluation. For outcomes based on

6
claims data, we focused on developing and collecting standardized measures. From awardee measurement and monitoring plans, we assessed the extent to which awardees across groups were using the same measures. For additional outcomes, particularly qualitative ones, we also engaged in upfront coordination with FLEs to maximize the set of available and relevant measures for characterizing the key overarching features of interventions, settings, and contexts.
This report is presented in three major sections. The first covers the background of the initiative, our role in its evaluation, and the data and methods we used to assess awardees’ implementation experience and the impact of awards on the four core outcomes: total cost of care, hospital admissions, emergency department use, and hospital readmissions. The second major section presents our findings on how award implementation was experienced by awardees. The third major section presents findings related to awardee effectiveness in improving the four core outcomes. For these analyses, we grouped the HCIA interventions into three broad classes: ambulatory care, post-acute care, and hospital-setting as each represents distinct intervention approaches for different populations with different health care needs.
1.1 Data Sources
This section describes the data sources and analytic techniques used in this annual report to examine the implementation and effectiveness of HCIA awardees in improving health care delivery and their impact on health care costs and utilization.
Primary data acquired for analyses in this report include data elements from the first and second annual awardee summary forms, the no-cost extension statuses from CMMI, and the means and standard deviations for cost and utilization provided quarterly by the FLEs. As meta-evaluator for the HCIA model, however, most of our data is secondary data—data originally collected from the HCIA awardees by the FLEs and CMS’s implementation contractor. Section 1.1.1 outlines our primary data sources, the data elements derived from them, and their uses in this report; Section 1.1.2 does the same for each of our secondary data sources.
1.1.1 Primary Data
Impact Measure Data. From the beginning of our meta-evaluation, we have been collecting data from the FLEs for each of their awardees using a quarterly data template. These data include the means and standard deviations for baseline and intervention quarters for each of the four core measures of analysis: total cost of care (TCOC), all cause hospital admissions, all cause hospital readmissions, and emergency department (ED) utilization. FLEs were asked to implement some standard definitions, to enhance comparability across groups. For example, for calculating Medicare total costs, FLEs used only Medicare Parts A and B. All cause hospital admissions were defined as the number of patients admitted to the medical-surgical units and excludes patients kept overnight in observation beds. Patients with multiple admissions in a quarter were counted each time they were admitted. All cause readmissions were defined as an unplanned follow-up admission to any short-term acute general or long-term care hospital within 30 days of a discharge from another hospital of the same type. Finally, all cause ED utilization includes any overnight ED visits without a hospital admission including overnight ED observation visits without a hospital admission.

7
In this report, we use data collected via the template to estimate HCIA innovation effects using Comparative Times Series Analysis (we conducted additional impact analyses using secondary data).
Annual Awardee Summary Forms. To obtain detailed, standardized data that were not presented in annual reports, we collected data from FLEs in 2014 through a structured assessment form, or the Annual Awardee Summary Form (AASF). This form asked FLEs to provide information about key awardee characteristics, staff deployment models, program design, and project history. For the analyses in this report, we supplemented the primary data collection conducted in 2014 (AASF1) by fielding a revised version of the form in 2015. The Second Annual Awardee Summary Form (AASF2) asked FLEs more targeted questions about awardees’ implementation process and solicited a more uniform assessment of both implementation and intervention effectiveness. Using Likert scales, the tool asked FLEs to assess 4 to 12 different measures in each of 7 domains: innovation complexity, implementation planning, implementation process, staff training, organizational leadership, implementation effectiveness, implementation findings, and intervention impact. (Copies of the AASF1 and AASF2 surveys are in Appendix C.)
No-Cost Extension Status Data. We also collected data from CMMI on their decisions for each awardee regarding a no-cost extension of the awardee’s intervention period. These data were used in meta-regression and path model analyses.
1.1.2 Secondary Data
FLE Reports. We used qualitative data gathered from our thematic analysis of FLE annual and quarterly reports to CMS. In addition, we developed a structured and systematic coding scheme to standardize data extraction about innovation components and characteristics; these data elements comprise our structured qualitative coding (SQC) data, which are used extensively in our implementation and intervention effectiveness analyses.
The FLE reports also provided the quantitative data used in our intervention effectiveness analyses: FLEs were asked to provide summative intervention effect size estimates using difference-in-difference (DID) regression modeling for their awardees for each of four core measures. These estimates were used for our forest plots, meta-regression, and path model analyses (Section 3.4).
Lewin Group (Implementation Contractor) Data. Analyses in this report also use several variables collected in awardees’ quarterly report to CMS, collected by the Implementation Contractor, the Lewin Group: awardee tax status (for-profit or not-for-profit), organization type (academic institution or not), direct participant enrollment, awardee geography (urban, suburban, or rural), CMMI award spending, and barriers to enrollment. These variables were used in meta-regression and path model analyses.

8
1.2 Analytic Methods
1.2.1 Data Coding and Transformation
We conducted a thematic analysis of the seven FLEs’ annual reports and quarterly reports, and associated appendices using NVivo to code text associated with innovation implementation. Three pilot coding passes were undertaken to calibrate the qualitative coding, which led to minor adjustments to the coding scheme. We achieved inter-coder reliability kappas2 of 0.7 or greater for most codes. The various content and format differences across the FLE reports and appendices generated the major challenge in text coding and synthesis. Some of these differences were unavoidable because of the variation in types of awardees and nature of the different awardee innovations. Differences were managed through adjudication and a final inventory of themes reified. Nonetheless, themes emerged from this process and are presented in Section 2 of this report. In addition to thematic analysis, we also updated a structured and systematic coding scheme for innovation components and characteristics originally developed for the earlier reports.
1.2.2 Qualitative Comparative Analysis
We used qualitative comparative analysis (QCA) to examine combinations of innovation features, including characteristics of the target population, components and characteristics of the innovation, and contextual features related to innovation effectiveness (Appendix F). Drawing from mathematical set theory, QCA examines which features—individually or in combination—are necessary or sufficient for producing an outcome (Ragin, 2000; Schneider & Wagemann, 2012). This report uses QCA to identify the necessary and sufficient features (if any) associated with successful versus unsuccessful innovation impact on the core four outcomes. In QCA, a feature (or combination of features) is considered “necessary” if it is a consistent feature among awardees with effective innovations. A feature (or combination of features) is considered “sufficient” if an effective innovation is a consistent outcome among awardees with the feature. Relationships of necessity and sufficiency are a type of complex relationship that traditional qualitative and quantitative methods are not able to identify.
1.2.3 Quantitative Impact Analysis
In this report, we use a repertoire of quantitative methods to evaluate the impact of the HCIA innovations. Section 3 contains results from four distinct methods:
• Forest Plots. The standard approach to meta-analysis is to compute a mean intervention effect and standard error for each awardee and then display results for all awardees in the form of a forest plot.
• Heterogeneity Analyses. We computed two formal statistical tests to determine (1) whether all innovations share a common effect size for a particular core measure, and (2) the proportion of the total variation in innovation results which exceeds that
2 Kappa is a statistical measure of interrater agreement that ranges from 0 to 1, with 1 indicting perfect agreement.

9
expected from sampling error and that can be attributed to between-innovation differences.
• Meta-Regression. We used meta-regression in this report for innovations implemented within ambulatory settings. Meta-regression is similar to ordinary least squares (OLS) regression, except that the dependent variable is the summary effect estimate. Meta-regression methods are in Appendix B.1. It is used to explore what features drive different awardee effect estimates. In these models, HCIA total cost of care effects are regressed on three types of innovation features (structural characteristics, innovation components, and implementation features).
• Path Analysis. Finally, we used path analysis, a form of structural equation modeling, to conduct two multivariable analyses. Path analysis methods are in Appendix B.2. The first path model examines the influence of innovation characteristics, challenges, and performance on FLE ratings of implementation effectiveness. The second path model links structural and implementation features of the innovations to recruitment, turnover, and to the HCIA effects for three core impact outcomes.
Two additional methodological analyses used for these evaluations are presented in the report appendices:
• Comparative Interrupted Time Series Analysis (CITS). Using the quarterly template data collected from the FLEs, HCIA impacts were estimated by CITS and compared to the DID estimates reported by the FLEs for the same awardees. CITS methods are in Appendix D.
• Bayesian Analysis. The Bayesian approach uses observed data to revise probability distributions. Bayesian analysis methods are in Appendix E. In this report, we use Bayesian techniques to illustrate how meta-analytic findings can be expressed in terms of the probability that an innovation will achieve savings in total cost of care.

10
[This page intentionally left blank.]
11
SECTION 2 IMPLEMENTATION EVALUATION FINDINGS
2.1 Implementation Findings Summary
In this section, we summarize key findings of the implementation evaluation of innovations across the HCIA Round One portfolio of awardees. This includes 108 awardees who implemented 126 distinct interventions. Most interventions involved new or enhanced direct services to patients, while some were broader organization-level interventions. Major findings include:
• Adaptation of the originally proposed intervention was common and served to tailor the intervention to staff workflow and feedback, or address unmet patient needs.
• Leadership styles that encouraged staff and partner feedback and stakeholder participation in decision making improved services and created a growing, learning, and vibrant organizational culture around the intervention.
• Alignment of interventions to existing organizational programs and initiatives facilitated implementation.
2.1.1 Common Implementation Challenges
• In terms of shared challenges in implementing innovative interventions, enrollment, health IT, establishing partnerships, and role definition for team-based care rose to the top of the list of challenges.
• Identifying and enrolling participants to receive or participate in the interventions
• Implementing health information technology (health IT) components of interventions
• Establishing relationships and formal arrangements with supporting external partners, particularly when no prior relationship existed
• Avoiding role ambiguity and defining clear responsibilities for new or existing staff for awardees focused on team-based care.
2.1.2 Key External Factor Affecting Implementation
• State Medicaid expansion decisions affected some awardees and created capacity challenges, especially for awardees focusing on Medicaid-eligible target populations.
2.1.3 Workforce Development
• Community health workers were involved in 35% of interventions. These paid and unpaid staff increased patient and community connectedness with the health care system and often reduced professional staff burden, but for some awardees their use caused confusion among staff and patients.

12
2.1.4 Scalability and Sustainability
• Awardees had different experiences around sustaining and scaling their innovations. Innovations that were less resource intensive and more easily replicated, and those embedded into the clinical workflow of larger institutions were more often sustained.
• Awardees whose innovations were integrated into the clinical workflow and who were part of large provider institutions were often able to secure internal funding to sustain all or part of their innovation.
• Scalability and sustainability were enhanced by making training more replicable and less resource intensive.
• Some awardees fully or partially sustained their innovation through other funding mechanisms.
2.1.5 Implementation Effectiveness
• Understanding how effectively awardees implemented their interventions was a challenge because of the diverse set of innovations. Fidelity, reach, and dose are central constructs to assessing implementation effectiveness, but are elusive concepts for most HCIA interventions, which were “flexible by design,” and with few exceptions did not implement specific evidence-based interventions or models of care.
• Few awardees or frontline providers can accurately assess reach, the proportion of the eligible population to whom the innovation was delivered.
• Single-site implementation, robust staff training, and robust implementation planning were factors that predicted effective implementation in a path model.
• No single factor or combination of factors was identified as necessary or sufficient for effective implementation in qualitative comparative analyses.
The rest of this section describes detailed findings from the implementation evaluation.
2.2 Innovation Characteristics
From the 108 awardees, we identified 129 distinctly identifiable interventions that reflected a main intervention component of awardee’s overall innovation. Some interventions involved a distinct intervention delivered to specific individuals enrolled based on patient criteria, some were broad organization-level interventions but with direct impact on the delivery of patient care to all patients within a targeted setting, and a few were indirect interventions focused exclusively on workforce training, infrastructure enhancement, or other interventions without a direct impact or change to patient care. For our final analyses, we classified all interventions into 11 categories (Figure 2-1) to facilitate qualitative and quantitative analysis. Appendix G provides definitions for the intervention categories.
Most awardees implemented a multi-component intervention. From innovation descriptions, we identified main and secondary components. We classified 52 (40%) of the main innovation

13
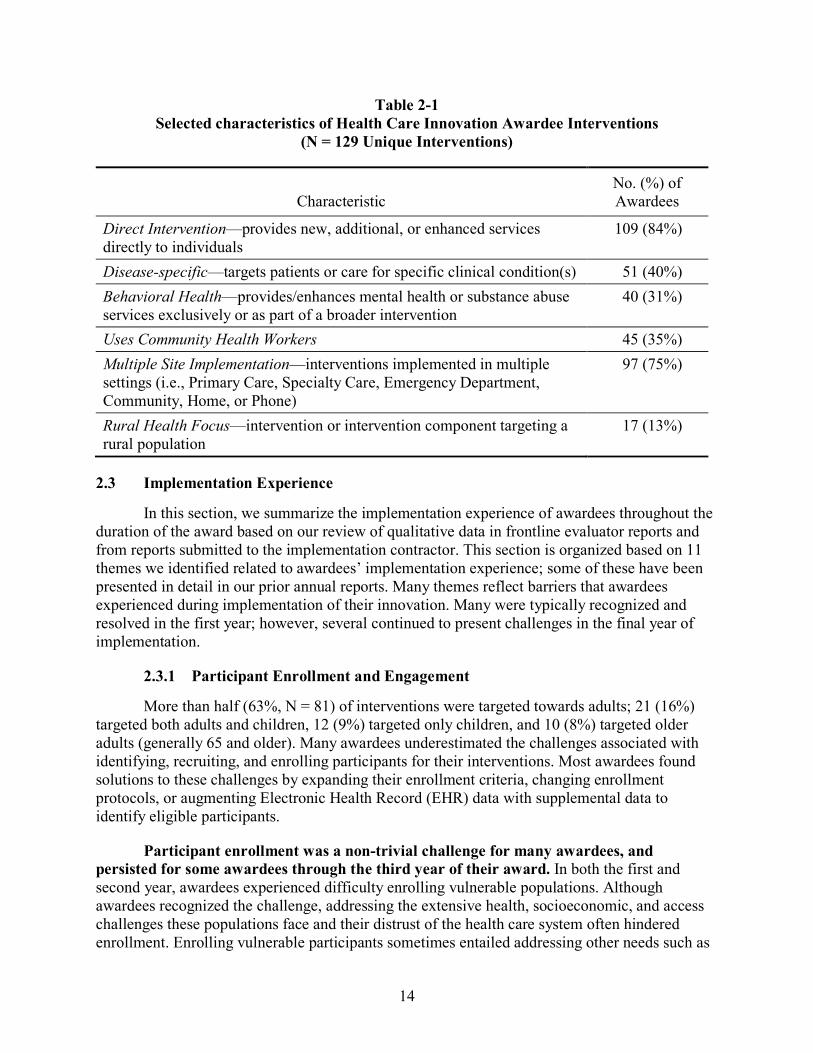
components as either a care coordination or care management intervention. Care coordination is the deliberate organization of patient care activities between two or more participants in the patient’s care to facilitate the appropriate delivery of health care services to a patient. Care management typically refers to a constellation of activities focused on managing care for patients with specific diseases or chronic conditions. In our classification scheme, these interventions were provided by nurses, social workers, or other health care professionals. The remaining interventions included interventions focused on redesigning workflow or processes, patient engagement and support interventions (including shared decision-making interventions), patient navigation provided by non-health care professionals, medication therapy management, interventions to implement patient-centered medical homes or to integrate behavioral health with primary care, or isolated workforce training (no direct patient care component). Several interventions were classified as “other” and consisted of unique interventions that did not fit into any of the other categories. Table 2-1 summarizes other key innovation characteristics.
Figure 2-1 Main innovation components, Health Care Innovation Awards Round One
(N = 129 Unique Interventions)
14
Table 2-1 Selected characteristics of Health Care Innovation Awardee Interventions
(N = 129 Unique Interventions)
Characteristic No. (%) of Awardees
Direct Intervention—provides new, additional, or enhanced services directly to individuals
109 (84%)
Disease-specific—targets patients or care for specific clinical condition(s) 51 (40%) Behavioral Health—provides/enhances mental health or substance abuse services exclusively or as part of a broader intervention
40 (31%)
Uses Community Health Workers 45 (35%) Multiple Site Implementation—interventions implemented in multiple settings (i.e., Primary Care, Specialty Care, Emergency Department, Community, Home, or Phone)
97 (75%)
Rural Health Focus—intervention or intervention component targeting a rural population
17 (13%)
2.3 Implementation Experience
In this section, we summarize the implementation experience of awardees throughout the duration of the award based on our review of qualitative data in frontline evaluator reports and from reports submitted to the implementation contractor. This section is organized based on 11 themes we identified related to awardees’ implementation experience; some of these have been presented in detail in our prior annual reports. Many themes reflect barriers that awardees experienced during implementation of their innovation. Many were typically recognized and resolved in the first year; however, several continued to present challenges in the final year of implementation.
2.3.1 Participant Enrollment and Engagement
More than half (63%, N = 81) of interventions were targeted towards adults; 21 (16%) targeted both adults and children, 12 (9%) targeted only children, and 10 (8%) targeted older adults (generally 65 and older). Many awardees underestimated the challenges associated with identifying, recruiting, and enrolling participants for their interventions. Most awardees found solutions to these challenges by expanding their enrollment criteria, changing enrollment protocols, or augmenting Electronic Health Record (EHR) data with supplemental data to identify eligible participants.
Participant enrollment was a non-trivial challenge for many awardees, and persisted for some awardees through the third year of their award. In both the first and second year, awardees experienced difficulty enrolling vulnerable populations. Although awardees recognized the challenge, addressing the extensive health, socioeconomic, and access challenges these populations face and their distrust of the health care system often hindered enrollment. Enrolling vulnerable participants sometimes entailed addressing other needs such as

15
lack of transportation and homelessness before working with them on health needs. As observed in the first annual report, meeting those needs required unanticipated time and resources, delayed the provision of health care, and contributed to staff frustration.
Meeting participant enrollment goals in the first year was also hindered by a lack of alignment between the innovation design and the size of the target population or the time or setting in which enrollment was expected to occur. For example, patients could not make HCIA intervention enrollment decisions while also dealing with health care crises and decisions in the ED setting. Also in the first year, several awardees who relied on data for enrollment discovered that EHRs, provider files, or state databases lacked complete or correct contact information for potential participants.
An emerging theme in the second year was the difficulty some awardees encountered managing cultural barriers in serving racial or ethnic minorities. A few of the awardees working with minority populations encountered language barriers, lack of trust in service providers or medical equipment technologies, or were uncomfortable allowing medical monitoring equipment or strangers into their home. Cultural mistrust of health care institutions likewise impeded enrollment, particularly for awardees serving Native American populations.
Awardees expanded innovation enrollment criteria or changed enrollment protocols to manage the challenge of lower-than-expected enrollment. Awardees expanded the criteria for intervention participation by broadening the age range of eligible participants, extending the geographic area of recruitment, increasing the enrollment time window, specifying additional eligible health conditions, and inviting patients covered by payers other than CMS to participate. Awardees also identified additional participants by improving marketing and outreach, increasing the number of partners, collaborating more closely with primary care providers (PCP), and employing community health workers (CHWs) to build community-based relationships. By the third year, several awardees modified their approach to identifying patients by incorporating clinical data (in addition to utilization data) to help identify high risk patients.
Innovations employed diverse strategies to enhance patient engagement throughout the innovation. FLE third annual reports reflected on successful strategies to keep participants engaged. Strategies included keeping in regular contact with participants, implementing a participant communication protocol, encouraging providers to champion the innovation to patients, and financial incentives. One awardee adopted a “high touch” approach to engage patients and discovered that regular telephone calls with participants were more effective than sending letters, e-mails, or text messages. Other awardees established communication protocols for staff when engaging participants. These protocols included being respectful of a patient’s condition, describing the intervention’s value, customizing talking points to fit a participant’s needs and circumstances, and stressing the intervention’s goal of improving care. One awardee implemented motivational interview training for staff to improve communication between staff and participants. Lastly, several awardees used financial incentives to increase the frequency of participant office visits and adherence to the innovation.
2.3.2 Adaptation
Most awardees found they needed to adapt their innovation to meet patient needs and local conditions. Identifying which components are essential and immutable, and which can be

16
modified without adversely impacting intervention fidelity and effectiveness, may increase the generalizability of interventions and improve their adoption. In addition, implementation often exposed unmet patient needs, which required intervention adaptation, additional resources, or both. Unmet needs and the additional resources necessary to meet those needs interacted with innovation capacity, necessitating adaptation. When patient needs exceed innovation capacity, triage and prioritization of health care services became necessary.
Among awardees, adapting innovations was a common consequence of implementation. For many awardees, the need for adaptation became apparent as they became aware of the unmet needs of socially vulnerable populations. For many awardees, this meant adapting their innovations to assist patients in accessing key services and resources in addition to delivering the intended health services. For other awardees, where demand exceeded resources, adaptation meant segmenting patient populations in terms of risk, first identifying patients in greatest need of care, and then focusing caregiving efforts towards patients with the most urgent problems.
Ongoing monitoring of implementation enabled awardees to make changes to their implementation plan. Awardees modified innovations to overcome challenges, enhance efficiency, or improve the fidelity of innovation delivery. Many awardees modified implementation plans to increase the flexibility with which they delivered key components. For example, flexible care coordination protocols enabled providers, care coordinators and peer navigators to adapt their service delivery to participant needs, cultures, and communication preferences. This flexibility allowed awardees to develop programs that were responsive to the needs and preferences of providers, organizations, and patients.
The unique staffing, patient, and physical resources available at different organizations encouraged some awardees to adapt their innovation plans. By taking advantage of existing personnel or services, awardees often discovered that they could better execute their innovation components. For example, one awardee improved work flow by integrating lay patient navigators into established nurse navigator programs. Leveraging existing care teams resulted in more efficient and effective care. Another awardee found that colocating their workforce improved communication and facilitated coordination.
Awardees standardized interventions roles, workflow, and care to improve the consistency of service delivery. Although many awardees found that flexibility was necessary to meet the diverse needs of providers, organizations, and participants, others found that interventions required standardization to ensure the delivery of core resources and services and to clarify staff roles and responsibilities. Awardees requiring standardization commonly needed to manage early uncertainty because of innovation newness or inconsistent leadership. Standardization reduced both uncertainty and staff frustration. Standardization was reinforced in the second year with expanded use of self-monitoring and increased use of data to monitor implementation and impact, although few awardees used formal improvement or change management processes.
Apparent in the second year was the need for additional staff to support many of the innovations, and for some, partners also provided support. For many awardees, the amount of work required to implement the intervention and meet CMS requirements exceeded the

17
awardees’ initial expectations. Most frequently mentioned was the high demand for behavioral health and social services, high telephone call volume for transitional care coordination, and high administrative burden. For example, in one award, the anticipated patient load was doubled when children referred to the innovation had a sibling with a behavioral health condition; in another instance, patient interest in the intervention exceeded implementation staff expectations. For several awardees, the additional administrative burden of meeting CMS reporting requirements was challenging. To support the innovation, most interventions hired additional technical, research, or administrative staff who were new to the organization. A few employed IT solutions such as automating referrals or redirecting phone calls to specific staff. Several added or turned to partner organizations to support their innovation. In general, ‘partners’ were any organization external to the organization receiving the HCIA award that were involved in the planning, implementation, or operation of the innovation. These partners provided training essential to intervention delivery, served as sites for participant recruitment, offered tools and technical expertise supporting the use of health IT, or enabled the provision of more comprehensive care or services to patients.
2.3.3 Partners
As mentioned above, partnerships between organizations and providers reinforced and supported many HCIA innovations. In addition to sharing patients, knowledge, skills, and resources, partnerships provided opportunities to extend intervention reach and, in some cases, improved the intervention. However, entering partnerships with external organizations was not a step that awardees took lightly. Building trust among partners and gaining support for intervention often required time and approval from several individuals and units within health care entities. It is a process that needs to begin early and be reinforced through interaction. Many awardees that worked with partners obtained memoranda of agreement (MOA), or other formal agreements that defined partner roles and responsibilities prior to receiving grant funding, which may have delayed getting started but also served to streamline implementation and reduce the potential for setbacks once implementation began.
Partners provided tools, training, and technical expertise essential to innovation delivery. Many innovations required the development of new or existing health IT, and partners frequently provided relevant technology or offered technical support. In some cases, partners were technology companies uninvolved in patient care, while in others, partners simply had more resources or experience with health IT than awardees.
Partners’ training curricula included skills and knowledge extending beyond traditional medical education. Partners helped prepare staff to assume new roles developed for the interventions—like “better health improvement specialists,” patient navigators, and peer mentors—and provided technical training on intervention tools and technology.
Partnerships enabled awardees to offer more comprehensive, specialized, or extended care than would otherwise be possible and connected the awardee to the community to ensure services provided by awardees were responsive to community needs. Partnerships allowed many awardees to expand their services by connecting awardees with local communities. This helped ensure that innovations reached intended populations and addressed

18
relevant patient needs. For several awardees, partners provided specialty or advanced care beyond what was available from awardees.
It takes time to build strong relationships between awardees and partners, especially for new partnerships. Many awardees had worked with partners prior to receiving their award, and this allowed them to execute innovations more efficiently, as a lack of history with partner organizations could impede successful implementation. Formal organizational processes (administrative, bureaucratic, and contractual) interfered with the establishment or successful operation of many innovations partnerships especially when one or more partnering organizations lacked the knowledge, experience, or resources to efficiently establish required contracts or MOAs. In other instances, implementation was delayed or prevented during the partners’ ethical research review.
For organizations without prior experience with their partner, by the second year it became clear that building the relationship took both time and frequent interaction. Awardees used collaborative practice agreements, developed joint objectives, and attended face-to-face meetings to support engagement. To maintain these relationships, awardees and partners held standing meetings, participated in joint-training, attended collaborative care conferences, and spoke at partner staff meetings, during networking calls, and participated in inter-organizational work groups. These collaborative activities fostered continued partner buy-in and engagement so that by Year 3 partnerships issues were no longer a concern.
2.3.4 Health Information Technology
Health Information Technology (health IT) offers great promise for the delivery of patient-centered and patient-customized health care delivery. It may also provide an unprecedented opportunity for health services researchers for building the evidence base necessary for evidence-based research. However, adopting new health IT systems and adapting current ones to meet multiple purposes was often challenging, although the rewards stemming from these systems started to become apparent in Year 2. Significant leadership and resources in terms of dollars, time, and expertise are necessary for successful implementation of innovations utilizing health IT—especially when interventions require partnering with independent organizations and health IT interoperability challenges are present.
Implementing health IT is a resource consuming, comprehensive process, requiring input, coordination, and cooperation among staff and institutions, and alignment with workflow. Implementing most types of health IT required a significant investment of time and resources and depended on a comprehensive process involving planning, assessment, rollout, ongoing monitoring, and adaptation. When followed, this process resulted in health IT aligned with the implementing organization’s culture and staff workflow, few or no operational disruptions, and implementation success. For many awardees, this comprehensive process required an extended timeline, and health IT challenges were prominent in Year 1. By Year 2, many of these issues were resolved, and awardees were focused on refining the use of health IT within their interventions.
Although less extensive health IT implementations, such as introducing new functionality in an extant EHR system, may seem easy to accomplish, the implementation process requires more than mere programming. Establishing stakeholder buy-in, ensuring alignment with

19
workflow (described below), and staff training must occur as part of the implementation process. “Glitches” or “bugs” may also arise in apparently simple programming. For several awardees that included a health IT component in their intervention, the innovation timeline did not fit with the time demands of implementing health IT.
Health IT that does not map well to workflow delays implementation and generates staff resistance; health IT that maps well to workflows supports communication and adds value. Aligning health IT with the clinical workflow is critical for health IT implementation success. Failure to align health IT created additional work for and burden for busy providers; for some awardees, in the first year, such burdens generated dissatisfaction with and abandonment or limited use of the health IT component. For example, in the first year, clinical staff at one awardee abandoned the health IT innovation preferring to continue using handwritten forms to record patient information. The health system policy of another awardee prevented providers from linking innovation mobile devices to the EHR which increased staff workload by requiring providers to enter information twice. Clinical staff at a third awardee realized that the telemedicine component of their innovation did not allow them to provide urgent care for patients, and changed the use of the telemedicine component to support follow-up care only. By the end of the second year, however, health IT was better integrated into workflows for most awardees and most providers felt that health IT components reduced burden, enhanced patient care, and staff communication.
The financial costs associated with implementing health IT proved difficult to overcome for some awardees and especially unfunded partners. Health IT implementation involves significant investment of resources, including the costs of hardware, software, IT programming and support, staff time and training, and ongoing maintenance. Researchers have identified cost as a key barrier to EHR adoption (DesRoches et al., 2008; Gans et al., 2005; Lorenzi et al., 2009; Yoon-Flannery et al., 2008). Similar costs and activities arise when integrating other forms of health IT (e.g., new patient assessment tools, clinical triggers and decision support tools, telemedicine) into patient care. Several awardees did not anticipate the costs of health IT implementation and some unfunded partners were forced to withdraw their participation because of the resources required to implement or maintain a health IT intervention.
Lack of interoperability and standardization of data elements delays implementation, hinders information sharing and communication, and leads to workarounds. Many awardees brought together multiple clinical partners, such as individual practices, health care systems, and pharmacies, to coordinate patient care through data exchange. However, because clinical partners often had different EHRs, implementing health IT and sharing information proved more difficult than expected because of poor interoperability, a challenge that persisted through the third year for some awardees. For example, lack of interoperability required clinical staff for one awardee to manually assemble patient information from across 14 partners and their systems to make it usable for the intervention. In another instance, one awardee’s intervention software could not identify key clinical data in their partners’ varied EHRs and could not consistently perform risk assessment algorithms with all the relevant clinical information.
Many awardees and their partners lacked sufficient capacity (staff, electronic infrastructure) to implement the health IT component of their innovation. Health IT

20
implementation, as mentioned above, requires extensive resources including expertise, staff time, and electronic infrastructure. Many awardees and their partners did not have all these resources in place at the outset of the award, which limited implementation. In particular, awardees working with rural practices or hospitals or in poor urban settings encountered difficulties with Internet access and connectivity. Adequate staff with IT expertise also proved challenging for some awardees. Regardless of overall IT capacity, even into the second year, awardees were describing how health IT modifications required “getting in the health IT development queue” (meaning IT requests would be addressed in the order received by the IT department), a wait that could extend for months. In the third year, strain on health IT capacity was exacerbated by challenges creating patient reports with EHRs and implementing new EHR processes as required with patient-centered medical home transformation interventions.
Awardees relied on third parties to develop, implement, and support health IT-related systems. Because health IT development and implementation are complex and requires specific expertise, many awardees without the necessary expertise partnered with vendors, consultants, and health IT-focused businesses. These partners provided a range of support, including designing software, EHR modules (e.g., decision support tools), databases, and patient portals; integrating disparate platforms; supporting connection to health information exchanges; and providing technical support.
2.3.5 Context
In this section, we describe findings related to the context surrounding the implementation of the HCIA innovations. This includes concepts related to endogenous context, such as organizational and implementation leadership, organizational characteristics and culture and implementation climate, and team characteristics. It also includes concepts related to exogenous context, such as external policies, regulations, or market characteristics that impacted the intervention design or its implementation.
Leadership Successful implementation requires leadership at several levels. Organizational leaders
provide resources and organizational support, technical staff provide leadership for providing intervention services, while champions (at several levels and fulfilling several roles) provide the needed impetus for staff and patient engagement. Leadership styles that encouraged staff and partner feedback and stakeholder participation in decision making improved services and created a growing, learning, and vibrant organizational culture around the innovation, and is a valued leadership style when implementing and establishing interventions.
Organizational leaders supported the innovation by allocating resources, generating staff commitment to the intervention, and engaging high-level stakeholders. Many organizational leaders played indirect roles in implementation by fostering an environment amendable to implementation. Some organizational leaders provided matching funds or in-kind support (e.g., funding staff positions with non-HCIA funding), others identified the intervention as an organizational priority and generated staff support for it. Some CEOs engaged in outreach, encouraging representatives from other state health care associations to attend meetings and asked for their support and collaboration. Another met with CEOs at each implementation site to emphasize the importance of the intervention. However, for awardees without high-level support

21
at the outset of the award, leaders strove to build that support. For example, one principal investigator reduced skepticism among hospital leaders and board members by describing how the new intervention staff would enhance workflow and improve patient satisfaction.
Leadership for most awardees had the technical expertise and change management experience to implement the interventions effectively. Effective implementation requires clinical/technical expertise, administrative expertise (e.g., grants and contract management), and implementation/change management experience, which most leaders possessed. Most leaders were well-known and trusted because of their years of working with their colleagues and partners. This experience gave them knowledge, respect, and legitimacy. However, not all leaders had all the requisite knowledge and skills. For example, leaders for a few awardees lacked familiarity with government contracting and reporting. These experience gaps led to early reporting shortcomings and difficulty meeting the administrative responsibilities of the award. Once these gaps were recognized, awardees hired individuals with content or administrative knowledge necessary to support the implementation.
Site-level champions obtained buy-in from other stakeholders. Many awardees noted the importance of having champions at the site level. Although overall intervention leaders served as champions for most of the awardees, frontline staff and community members also filled that role in some awardees. For example, frontline staff for one awardee mentored colleagues and helped them develop processes for patient follow-up. The founder of one awardees’ partner organization identified community leaders and encouraged them to participate in the intervention by educating the public on the safe use, storage, and disposal of medication. For another awardee, a community member who learned about the intervention at an outreach event became actively involved in efforts to enhance patient enrollment.
Leadership’s openness to input from staff and partners on intervention design and implementation improved program quality, staff engagement, and team relations. Several awardees had committee structures that enabled staff and partners to provide feedback that informed decision making, and others had less formal mechanisms for receiving input, such as an open-door policy. Leaders’ openness to feedback not only improved implementation, but also supported buy-in from staff. Leaders for several awardees empowered frontline staff to adapt their approaches to best suit the needs of individual patients or the processes of different implementation sites; leaders’ flexibility and willingness to allow for trial and error facilitated learning, increased staff engagement, and was consistent with the “flexible by design” nature of many of the HCIA innovations.
Organizational Characteristics Not surprisingly, organizations experienced with the adoption of innovative practices or
that possessed the organizational structure and capacity to support change found it easier to adopt and implement HCIA innovations. The alignment of interventions to existing organizational programs and initiatives facilitated implementation. Less obvious was the apparent lack of foresight in anticipating space needs and staff requirements; however, this may be attributable to the unmet patient needs these innovations occasionally exposed (discussed in Section 2.3.2: Adaptation). Finally, health care settings are often dynamic, with multiple ongoing and concurrent quality improvement initiatives competing for staff time and attention. In such settings, thoughtful leadership in assisting staff to prioritize resources may be necessary for

22
maintaining staff engagement and staff morale for the duration of the active implementation period.
Having a strong culture of innovation made staff more willing to take risks and try new approaches. Several awardees identified their openness to innovation as a driving force behind their work; in awardees with a culture of quality improvement, staff expect and are accustomed to implementing new efforts. For example, an awardee with implementation sites in teaching and community hospitals commented that staff in teaching hospitals (with a history of implementing improvement initiatives) were open to change, whereas staff in community hospitals (with fewer resources to engage in and support many improvement efforts) required evidence that the intervention added value before participating.
Integrated organizational structures and streamlined administrative processes at the site level facilitated implementation. Sites that were part of an integrated network had some advantages over independent sites, such as greater ease in recruiting and tracking patients, engaging providers, overcoming unforeseen challenges, and scaling up innovations. For many awardees, an established organization infrastructure facilitated implementation, particularly when the innovation was valued by the organization. Such organizations could supply the necessary support to engender buy-in and overcome unforeseen implementation challenges. Administrative processes also affected implementation. For example, one awardee commented that getting permission to make changes required less time and effort at teaching hospitals than community hospitals involved in their innovation, because the teaching hospitals they work with have more streamlined processes and structures.
Awardees that had piloted the innovation or implemented similar programs encountered fewer challenges and delays. Most of the awardees had experience implementing their initiatives, or components of them, prior to receiving HCIA funding. In many cases, the HCIA funding enabled the awardees to expand an existing initiative or accelerate the pace of its implementation. Other awardees had previously implemented components of their interventions, and used their award to add new elements or adapt existing components. Piloting the interventions provided awardees an opportunity to identify and resolve obstacles. Having implemented similar work also meant that awardees often had experienced staff with the requisite expertise and often had existing relationships with relevant partner organizations. Nonetheless, aspects of the intervention new to awardees often posed challenges. For example, one awardee had experience with diabetes prevention programs, but had not worked with the elderly. Working with a new target population required developing new partnerships to recruit participants and learning about different Medicare plans.
Alignment of the intervention with awardees’ broader strategies created synergies and contributed to organizational support for the program. Some of the innovations closely aligned with broader programs or initiatives that awardees were also implementing. In these cases, the complementary initiatives laid the groundwork for or enhanced the implementation of the interventions. In particular, for many awardees, the increased emphasis and attention towards becoming patient-centered medical homes fostered not only an organizational culture receptive to change, but also provided staff resources (e.g., care coordinators), support for team-based care, and the adoption and use of health IT that many awardees specified as part of their HCIA interventions.

23
On the other hand, competing initiatives or processes within the awardee organizations or the sites adversely affected implementation of a few innovations. In a few awardees, sites were implementing other initiatives in addition to the HCIA-designated interventions, which limited the time and energy that staff could devote to the HCIA-intervention. Some awardees were in sites implementing other quality initiatives, one was transitioning from a paper-based records system to an EHR, another site was implementing a new EHR and undergoing accreditation, while yet another awardee underwent a health system merger. However, as discussed above, competing initiatives often facilitated implementation of HCIA interventions, and in some cases gave access to a larger clinical team and additional clinical resources.
Lacking adequate physical space hindered implementation. Several awardees that added new staff encountered difficulties because they did not take into account having space for those staff. Some awardees did not have private spaces for staff to make phone calls or conduct health coaching; consequently, they reduced the size of their teams because of lack of space. For interventions that intended to provide team-based care, the spatial configuration of clinics sometimes proved to be a barrier to effective collaboration. For example, one awardee found that having innovation staff separated left staff unaware of aspects of the innovation that could support their work. For several innovations, coordination and communication improved when staff were relocated to a common workplace.
Team Characteristics Providing clearly defined roles and expectations during start-up for both new and current
staff improved implementation and facilitated team building. It is important, however, that all staff have the requisite expertise or clinical skills necessary to function in their assigned roles. That these roles and responsibilities may mature over time is to be expected and for several awardees, cross-training in the second year minimized fragmentation of care or delays in services. Enhanced coordination within teams improves patient care while educating staff and partners about the intervention and improves teamwork across units and organizations, especially if staff are in a common setting. Although not all interventions reduce staff workload, demonstrating or describing the value of the intervention increased acceptance among teams expected to provide the intervention. Anticipating staff concerns and proactively mitigating those concerns through appropriate guidance, training, and education ameliorated stress and confusion when implementing interventions.
The development of care teams and addition of new positions required shifting roles for many existing staff. Several awardees described revising the roles played by various existing staff. In some instances, this redefinition of roles ensured that staff worked at the top of their certification by shifting tasks from more to less specialized personnel. In the second year, many awardees experimenting with unlicensed staff found those staff lacked the expertise or clinical skills necessary to meet complex patient needs. The experience of new staff and the use of staff in new roles needs to be monitored to ensure the suitability the staff and their training for fulfilling their new roles.
Lack of clarity regarding the roles of new staff often generated competition between existing and new staff, inappropriate use of new staff, and discomfort among new staff with the ambiguity of their roles. Many awardees created new staff positions for their interventions.

24
Clearly defining the roles of new staff and communicating those roles to existing staff supported the successful integration of the new staff, but defining those roles was challenging for many awardees. In the absence of clear guidance about the roles and responsibilities of new staff, the new staff of some awardees were misused, and the existing staff of some awardees felt threatened because of perceived overlap in roles. It should not be assumed that current staff will understand, from just a title, the purpose of new staff or how they fit with and enhance current staff capacity.
In some instances, awardees had difficulty in determining the role of the new staff because the role had changed over the course of implementation. Several awardees noted that staff roles evolved over time, as they learned more about what was needed and how new staff fit in to the existing staff structure. Some awardees adjusted roles to avoid duplication of efforts. Awardees also adjusted team structures to address problems with overlapping roles, although by the second year, awardees were learning the value of cross-training staff to minimize health service fragmentation or service delays. In particular, several awardees found cross-training an effective response to tight budgets.
New staff encountered barriers to integration into the care teams. For some innovations, team structure hampered integration of new staff. For example, for one awardee, health navigators were relatively separate from other program staff in the same location (e.g., they did not attend trainings or meetings with them) and were not fully integrated in care delivery, which limited their ability to meet patient needs. A strong theme in the second year was the value of physically colocating staff to foster strong working relationships and improve care coordination. Regular face-to-face contact among team members also improved efficiency by minimizing the time clinicians spent reviewing and interpreting electronic and written communications.
Educating clinicians about the innovation and demonstrating results generated clinician buy-in. Awardees depended on buy-in from staff within the implementing sites (e.g., clinicians such as pharmacists who are expected to use a new tool or participate in new processes for providing care) and in the community (e.g., physicians who were being asked to refer their patients to the program) to enroll patients and ensure their ongoing participation. However, many physicians initially doubted that the changes introduced by the innovation added value, perceived that the changes would be burdensome, and expressed concerns about the 1) new staff capabilities, 2) possible reductions in fee-for-service visits, and 3) changes to long-established workflows. To alleviate these concerns, physician champions educated internal staff and external providers about the interventions and their potential value. Awardee willingness to adapt the interventions to the needs of clinicians and patients also facilitated uptake. In some cases, demonstrating how the innovation improved processes (e.g., showing navigators helping with patient communication) or outcomes (e.g., using data to demonstrate improved patient outcomes) likewise fostered buy-in.
Effective communication and coordination within and across teams enhanced implementation. Many interventions developed interdisciplinary teams that included both medical (e.g., physicians, nurses, pharmacists) and nonmedical (e.g., healthy family coordinators, social workers, case managers) staff. These teams addressed a broad range of patients’ needs and enabled staff to work at the top of their degree or certification. In the first

25
year, awardees found using daily interdisciplinary rounds or team huddles facilitated communication among team members. Both provided an opportunity for the teams to discuss patient needs. In the second year, several awardees acknowledged the role played by EHRs and other technological tools in improving communication among team members and enhancing patient care. Technology also supported physician access to information about patient status and treatment. However, concerns were raised that important information could be missed or ignored when relying solely on technology. Several awardees indicated that having regular in-person team meetings or daily huddles in concert with using technology to communicate about patient care ensured high quality care.
External Context Health care organizations exist within an ever-changing and dynamic environment which
often impacted the planned implementation of innovations. Occasionally these changes to the environment in which organizations operated facilitated adoption of the innovation. More often, however, these changes add to the stress of implementation and create challenges for innovators seeking to test and affirm their models.
Changes to policies impacted implementation of the innovations by influencing the eligible patient population and altering the public supports available to vulnerable populations. These changes adversely affected over one-third of awardees. Changes in the health care market (e.g., mergers, emergence of accountable care organizations [ACOs]) also impacted the innovations, often by diverting attention from the innovations while staff worked through organizational changes and new partnering agreements. Awardees also struggled to provide value-based care with fee-for-service (FFS) payment models, and some failed to obtain reimbursement for all services.
States’ decisions around Medicaid expansion affected the patient population and created capacity challenges. Although the impact of the ACA on patient populations was mentioned in the FLEs’ first annual reports, it featured prominently in the FLEs’ second annual reports. By the third year of the awards, the impact of states’ decisions around Medicaid expansion were discussed primarily in the context of sustainability.
Awardees across four evaluator portfolios—behavioral health, complex care, community, and hospital—faced challenges with adapting to patients’ needs as a result of states’ decisions on Medicaid expansion. HCIA awardees in states that did not expand Medicaid or that cut back their Medicaid programs experienced large and unanticipated numbers of uninsured patients, many with health-related social needs that exceeded awardee capacity. Staff warned that because patients’ health-related social needs exceeded the services HCIA-funded physicians could provide, their innovations might not demonstrate improved health outcomes. A more balanced patient population, they felt, would have allowed them to demonstrate greater program effectiveness.
Conversely, awardees in states that expanded Medicaid struggled to meet the demand for services that access to insurance created. In the absence of a concomitant increase in the supply of providers, awardees struggled to build capacity to accommodate increased demand for mental health services, patients with health-related social needs, and the complex health needs of newly

26
insured patients with pre-existing conditions that may have worsened or gone undiagnosed while they were uninsured.
State-level policies not associated with the ACA also influenced implementation. Although awardees with sites in multiple states needed to negotiate varying state regulations around provider scope of practice and reporting requirements, state policies could support enrollment or implementation. For example, in the third year of the award, state legislation in Arkansas requiring home caregiver training and certification facilitated enrollment for one awardee. A few awardees benefited from state legislatures provided funding for earlier versions or components of the innovation. For example, in a state supporting integrating care management in practices before the HCIA award, the awardee could use care managers funded through the state initiative and rely on primary care practices’ experience with care management in implementing the HCIA innovation. Changes to regulations defining providers’ scope of practice allowed a small number of awardees to reach more vulnerable populations (e.g., allowing unsupervised dental hygienists to perform cleanings enabled one awardee to serve rural patients with limited access to dentists).
State support (or lack thereof) for alternative payment models (APMs) can facilitate (or hinder) implementation. The coordinated, comprehensive care approaches tested under HCIA generally did not align well with the current reimbursement practices and a FFS payment model. Per evaluators, reimbursement for services was a challenge for nearly half of awardees; and a major challenge for nearly a quarter of them. Fee-for-service payment models did not adequately reimburse for certain services or staff types and limited the chances for innovation sustainability. Although some awardees could absorb the unreimbursed costs by providing in-kind staffing and by contributing resources other than staffing, for many the lack of or insufficient reimbursement for some services (especially care coordination, care management, comprehensive care, and telehealth) and some types of providers (e.g., community and lay health workers, pharmacists) was a barrier to engaging practices to participate and a threat to the sustainability of the innovation. State support for alternative payment models (such as shared savings, bundled payments, pay for performance, and other value-based strategies) could facilitate implementation and encourage sustainability.
State Medicaid and relationships with managed care organizations (MCOs) evolved over the course of implementation. In a few states, capitation levels decreased and the impact on many awardees is, yet, uncertain. For example, when, in the first year, a major insurer dropped patients after the state’s capitation rates decreased, one awardee that included a payer organization experienced an increase in enrollment due to a larger eligible patient population. Changes to MCOs in states created challenges for awardees partnered with MCOs. A few awardees lost MCO partners when the state changed MCOs or needed to develop new administrative processes with an MCO partner when the state revised administrative requirements. Such changes delayed implementation as these awardees needed to establish partnerships and referral agreements with the new MCOs or to create new administrative processes and data sharing agreements to align with regulations.
Local-level policies played a role in implementation in some awardees. A small number of localities offered housing subsidies and transportation waivers; innovation staff could link patients to those services to help patients manage some of their barriers to care and more

27
easily participate in the innovation. However, the inverse also occurred, when, for example, local housing regulations did not provide adequate standards to support asthma management. Despite the innovation, without fundamental changes in housing, participants remained in allergenic environments. Initiatives by local insurers supported implementation; for one awardee, the local Blue Cross Blue Shield had an ongoing patient-centered medical home (PCMH) initiative, which aligned with the awardee’s efforts and enhanced provider support for the innovation.
Changes or saturation in the local health care market translated into more challenging implementation environments. Consolidation of provider organizations, mergers of MCOs, and the emergence of ACOs altered the local landscape for some awardees and negatively affected their implementation plans. For example, two hospitals that partnered with an awardee were consolidated, implementing the organizational changes from the consolidation took precedence over implementing the innovation. For another awardee, the consolidation of MCOs partnering with the awardee meant renegotiating the original partnering agreements.
For a small number of awardees, some market conditions made the HCIA innovation difficult to differentiate from other services or to recruit partners. In one awardee using lay health workers to link patients to social services, the lay health workers were thought to be social services representatives rather than part of a care team or part of the HCIA intervention. Similarly, in a market where many service providers offered care management and care transition services, the awardee’s intervention was difficult to distinguish from other providers’ efforts. For another awardee, having a highly competitive health care market made MCOs reluctant to enter high risk contracts.
2.3.6 Workforce Development
The identification of new models of workforce development and deployment, as well as training and education to support these new models, was a primary objective of the Health Care Innovation Awards Round One. In 2011, CMMI attributed the limited diffusion of delivery system innovations in part to a dearth of adequately trained health sector employees and suggested that the health care workforce of the future must be trained in “prevention, care coordination, care process reengineering, dissemination of best practices, team-based care, continuous quality improvement, and the use of data to support a transformed system” (CMMI, 2011).
This section summarizes findings from the workforce development domain of the organizing framework. It also includes a summary of findings from a workforce survey conducted by RTI across all awardees, findings from the Annual Awardee Summary Form related to workforce development, and findings from structured and deductive coding of FLE reports concerning type of staff used, employee recruitment, training, deployment, retention, turnover, and satisfaction. We also include a separate section specifically related to the use of community health workers as part of innovation design and delivery.
Based on information in FLE reports, we used a structured coding process to characterize the type of workforce awardees used to provide the care or services that comprise the innovation components. This information may not match the staffing data that awardees reported to CMS on a quarterly basis that reported new hires or staff salaries being paid directly with HCIA funding.

28
For many awardees, innovation components involving direct patient care or services were not provided by HCIA-funded staff, but by existing staff within the organization or staff from partner organizations who took on new roles or had duties reorganized to provide care or services associated with the innovation. For assessing scalability, it is important to understand all staffing involved in providing the full innovation program, regardless of the source of salaries.
Fifty-one percent (N = 66) of innovations used licensed independent clinical providers (e.g., physician, dentist, nurse practitioner, physician assistant), 85% (N = 110) used licensed clinical staff (e.g., registered nurse, pharmacist, social worker, dental hygienist), and 69% (N = 89) used nonlicensed clinical support staff (e.g., CHWs, health coaches, benefits counselor, patient navigator) in their innovation workforce. The roles and issues surrounding CHWs and non-licensed staff are discussed in greater detail below.
In addition to categorizing the types of staff used to implement innovations, we asked evaluators to assess how new and existing staff were deployed. After an initial review of FLE documents, we created three archetypes for staff deployment models: 1) used existing staff, 2) integrated new staff/roles with existing staff/roles, and 3) used new staff/roles, semi-independent of existing staff/roles. Many innovations contained multiple components, and the same staff deployment model was not necessarily used for all components. A majority of awardees using a single model for staff deployment, also integrated new staff and roles with existing staff and roles, and only a few relied solely on existing staff, or used new staff in new roles that functioned somewhat independent of existing teams and staff. Of those awardees using more than one model for staff deployment, only some used all three models, while most used existing staff and new staff/existing staff models (see Figure 2-2).
Figure 2-2 Percentage of awardees using different models of staff deployment
Workforce Training Innovations often require the adoption of new skills and technologies for implementation.
Training, both formal and informal, provides staff the knowledge necessary to implement those skills and technologies and the understanding necessary to utilize those capacities. When

29
innovations include unfamiliar tools or techniques, initial and ongoing training increases staff confidence, staff capability, and improves fidelity of implementation.
Awardees used a range of modalities to deliver staff training in support of the innovation implementation. Widespread variation existed across awardees in types of training used but generally included a combination of formal and informal approaches. Formal training included lectures and in-person classroom training, on-line training workshops, continuing education, and university certifications. Informal training included job shadowing and mentoring of experienced staff, identifying “super-users” to work with individuals one-on-one, and train the trainer models (where staff train other staff to providing ongoing instruction to staff). For several innovations, staff considered informal modalities to be more effective than formal didactic training as many clinicians work shifts or rotate between hospital units. These temporary and transient staff may not be able to attend formal trainings and may thus have limited understanding of the innovation, their role in the innovation, or appreciation of other staffs’ roles in delivering the innovation. Awardee appreciation of the need for continued training grew with experience, and most adapted their approaches to training accordingly.
Training staff with varied backgrounds together helped foster a shared understanding of innovation activities and team responsibilities and helped break down divisions across different staff types (e.g., physicians, nurses, social workers). By including staff with different licensure and backgrounds in trainings, staff could better anticipate each other’s needs and cross-disciplinary training work increased respect for each member’s role in delivering the innovation. Additionally, cross-disciplinary training allowed team members to fill in for other staff as needed and overall improved respect for team members as a whole.
Many awardees focused training content on the skills needed to optimize patient interactions. Social workers helped staff interact with patients by showing team members how to communicate and manage patients with social and behavioral health needs. Several awardees highlighted the impact of motivational interviewing training on a range of staff, including pharmacists, nurses, and other support staff. Motivational interviewing promoted closer relationships with patients and improved staff confidence in engaging patients. One awardee attributed low attrition in the innovation to improved engagement through motivational interviewing.
Training not only transferred knowledge and developed skills, but established a level of comfort among staff tasked with implementing the innovation. Training on medical topics and skills allowed staff to expand their roles, but a supportive environment empowered staff to apply these lessons, particularly when interacting with a new, complex patient population, such as the critically ill or mentally ill. Many awardees provided additional, often informal, training to address staff uneasiness around unfamiliar clinical situations, giving those staff the confidence necessary to apply their newly acquired knowledge and skills.
Staff Recruitment, Retention, and Deployment Innovations faced early challenges identifying and recruiting staff with the requisite skills
and then retaining them in what are often high-stress and multifunction roles. By definition, innovations often require staff to take on new roles and responsibilities or require staff to have diverse skills for which they may not be prepared. Implementing health IT innovations, which

30
may require both technical and clinical skills, presented a particular challenge, as did innovations requiring a mix of technical and interpersonal skills. Recruiting additional staff, both paid and volunteer, may reduce burden, but uncertainty regarding sustainability was a likely impediment to hiring and retaining staff in the competitive health care marketplace. As innovations matured, and their recruitment and training activities improved, recruitment, retention, and turnover challenges were mitigated, particularly in the second year. Several awardees, including those with nursing homes and in rural areas, continued to face labor market constraints that affected recruitment and retention into the third year.
Labor market constraints hindered awardees’ ability to recruit and, in some cases, retain staff. Many awardees reported difficulties recruiting both clinical and nonclinical staff to implement their innovation. Several awardees found it difficult to recruit nurses with clinical experience and the interpersonal and emotional skills necessary to work with vulnerable populations (i.e., those with complicated medical problems, behavioral health conditions, and/or social needs). Others noted the shortage of or demand for mental health providers, nurses, critical care staff, and information technology specialists in their geographic region and their inability to compete with the salaries and potentially lower workloads offered by the larger providers. Offering additional education could improve recruitment and retention, but in some cases newly trained staff left for more lucrative employment or higher levels of medical training. In the second year, one awardee took steps to limit the loss of new staff by requiring them to pay back the cost of training if they did not stay for at least 6 months. However, awardees planning to use lower-level staff found these staff did not meet the positions’ expectations. Instead, awardees filled these positions with higher-level staff.
For some awardees, the uncertainty of sustainability was a barrier to recruitment. Some awardees expressed concern about retaining new hires and staff providing care coordination and care management services typically not reimbursable by payers. This complicated recruitment for some innovations as candidates were reluctant to accept an award-funded position they viewed as risky and unstable. Another awardee expressed concern that turnover could increase as employees begin to search for other positions in anticipation of the award ending.
Hiring the right staff enhanced retention and staff satisfaction. By the second year, to avoid excessive turnover, several awardees—particularly those serving patients with mental health conditions or chronically ill children—came to appreciate the need to recruit staff with the requisite experience, motivation, compassion, and commitment to work with these challenging populations. Furthermore, over the course of the funding period, awardees learned to look for strong communication skills and became more discerning during the hiring process. Several awardees reported that taking the necessary time and effort to recruit the “right” staff improved job satisfaction and limited staff turnover.
Staff burnout due to heavy caseloads and the stress of managing complex patient populations was an ongoing challenge. Care management, particularly with high-risk patients, often involves long hours, high caseloads, and managing relationships with patients experiencing significant health and social challenges. To reduce the stress and the demands placed on clinical staff, and to avoid staff burnout and turnover, several awardees deployed administrative assistants or care coordinator assistants to help with such tasks as patient outreach, recruitment,

31
and enrollment; updating patient care plans; scheduling office visits; monitoring patient’s adherence to medication; data collection and management duties; and chart reviews. Support staff also helped address patients’ psychosocial needs and nonmedical barriers to care such as financial concerns, transportation issues, and referrals to behavioral health resources. This allowed clinical staff to focus on providing clinical care and reduced their workload.
Other awardees organized trainings, retreats, and support groups to help employees cope with burnout. Examples of training included strategies for addressing trauma and compassion fatigue, self-care and stress reduction techniques, and maintaining a work/life balance. One awardee even reported recruiting volunteers from a local medical school to help ease the burden on clinical staff.
Many awardees staffed their innovations by redefining or expanding the roles of extant staff. Some awardees provided examples of training clinical and nonclinical staff to conduct new responsibilities and functions outside of their traditional roles. For some awardees, it was a matter of necessity. For example, staff for awardees in remote locations often filled multiple roles in the innovation due to limited local talent and insufficient patient volumes to support a full complement of staff for team-based care. Other awardees adjusted staff roles throughout implementation to help maximize efficiency and ensure that each employee’s unique skills were appropriately applied. Examples include training licensed practical nurses to conduct patient outreach and education, teaching pharmacy technicians to perform select disease management activities (including the delivery of medication management services in both in- and outpatient settings), helping clinical staff develop information technology skills, and teaching research assistants and junior staff to perform minor clinical tasks such as conducting chart reviews for patients.
Some awardees used volunteers to perform various functions. A few awardees describe using volunteers to assist with implementation. Two awardees reported using volunteer nurses and medical students to assist innovation staff with various care coordination activities. Another awardee reported using AmeriCorps volunteers as health coaches, which help provide education and guidance to enrollees on their medical condition. According to one awardee, using volunteers relieved staff of certain responsibilities, which helped reduce burnout and stress among employees.
Staff Satisfaction and Innovation Acceptability In the earlier stages of award implementation, some clinicians resisted innovations,
expressing concerns about lost revenue, suspicion around innovations replacing the traditional model of health care delivery, and frustration around integration of new processes, particularly information technology. Early efforts to secure buy in and engagement from clinicians, including activities to raise awareness about the innovation and clarify goals and address concerns helped mitigate resistance and improve intervention acceptability. By the second year, FLEs reported clinician buy-in and engagement was a major challenge for only 10 interventions (13.8%) and a modest challenge for an additional 17 (22.8%). As staff observed the positive impact of the innovation on patients, workflow, and their professional development, their acceptance of and satisfaction with innovations improved.

32
Some innovations generated initial clinician resistance and dissatisfaction. Resistance from some clinicians stemmed from concerns that innovations set outside of traditional health care settings that would “take away” their patients, reduce provider compensation, or cause role conflict with existing staff. Resistance from others arose from beliefs that clinicians and health care settings are the appropriate source for health care information, are better equipped to make care decisions, and better able to provide services to patients. Some clinicians reported being too busy to learn new IT systems or processes that interfered with their usual practice or workflows. Clinician confidence in some innovations was undermined by issues with data accuracy for attribution, clinical decision making, and monitoring reports. Lastly, some providers were reluctant to implement innovations and workflow redesigns that would help only a small subset of patients.
Some innovations did not experience active clinician resistance, but did require active and ongoing efforts to engage and promote the innovation among clinicians. For example, one awardee reported having to devise new ways of marketing a health IT tool to physicians who were overwhelmed by other tools and transformation initiatives. Similarly, another awardee expanded its use of a dashboard created to support the innovation to nurses, after recognizing that physicians are less focused on population management relative to nurse care managers. One awardee found low rates of prescriber acceptance of pharmacist recommendations mainly due to lack of prescriber awareness of the innovation, failure to identify their patients as participants in a medication management innovation, and large volumes of information received by fax, resulting in recommendations just getting “lost.”
Awardees used a variety of strategies to gain clinician buy-in and promote the innovation among clinicians before and during innovation implementation. For example, some awardees “marketed” the innovation by providing clinician education and training to clarify innovation goals, innovation staff roles, and address clinician concerns. Other awardees leveraged existing regional partnerships to build awareness about the program among providers. One awardee modified its service approach to respond to provider concerns about a competitive primary care market. Lastly, one awardee changed its approach to provider recruitment to work with those most engaged as opposed to those with the highest cost/patient use as had been originally intended.
Staff satisfaction often hinged on how the innovation impacted workload and improved patient care. Evaluators considered workflow redesign to be a major or moderate challenge for nearly 40% of interventions. As discussed in “Recruiting, Retention, and Deployment,” the workload for some awardee innovations exceeded expectations, and engendered burnout, with many more patient interactions or additional clinical tasks than expected. However, most innovations moved to reduce this burden by integrating new staff or processes into the workflow. Regardless of its impact on workflow, staff increasingly accepted their roles within innovations and reported increased job satisfaction when innovations improved patient care. For example, physicians may have been dubious about adding a care coordinator or social worker, but their attitude changed when they saw consistent patient follow-up, improved asthma control, or more effective patient education.
Clinical staff reported feeling empowered in their roles as a result of the innovation. Nurses appreciated additional training in clinical topics, increased critical thinking, and new

33
caregiving responsibilities, such as recognizing sepsis. Practicing at the top of their license also empowered nurses in their interactions with physicians. Similarly, home health aides and pharmacy technicians reported satisfaction with fully using their skill set, compared to traditional roles of pill dispensing, as well as gaining additional skills in patient counseling. Although physicians initially expressed some reluctance to providing unfamiliar services such as chronic pain management, stroke care, or behavioral health care, physicians ultimately reported more confidence after receiving training and gaining experience. The opportunity to develop impactful relationships with patients also improved satisfaction particularly among non-licensed staff who had little patient contact prior to the innovation. Nurses and care managers reported higher levels of satisfaction delivering patient-centered care and establishing deeper relationships with patients, especially in settings outside of the traditional clinical setting.
Use of Community and Nonlicensed Health Workers Community health workers are traditionally defined as individuals with personal or
community experience with the target population or conditions targeted, or respected and active members of their community, and typically come from a nonclinical background. Some awardees used traditionally defined CHWs, but many used nonlicensed staff to provide direct services to patients as part of one or more components within an innovation. The titles used to describe these roles include community health worker, patient navigator, health navigator, care coordinator, information specialist, peer support specialist, peer educator, family resource specialist, promotora, outreach specialist, and lay health worker. The titles reflect, in part, the diversity of functions performed and suggest specific background experience or requirements to function in these roles. In this section of the report, we describe this emerging component of the workforce, which includes but is not limited to traditionally defined community health workers.
Approximately 35% of innovations used CHWs and nonlicensed staff in many capacities, which caused confusion among staff and patients when the nonlicensed staff’s role within the innovation was not well communicated. This challenge was particularly evident among awardees without experience working with CHWs, who failed to provide sufficient training to both the care team and CHWs, or who provided insufficient role and responsibility guidance to the care team and CHWs. Patients especially may require guidance on the role nonlicensed staff will have in their health care and reassurance that these nonlicensed staff are trusted members of the patient’s health care team. Several awardees commented that in retrospect, earlier engagement of practices and providers in the design and planning phases, and more joint education, preparation, and mentoring related to integrating CHWs into clinical teams may have offset some of the challenges experienced.
Successful CHW integration improved clinical workflow and enhanced implementation. Several innovations depended primarily on CHWs to coordinate additional patient services, facilitate the flow of patients through various health care settings, and support self-management activities. Several awardees reported quantifiable impacts on workflow, with clinicians spending between 30% and 50% less time arranging and coordinating social services and referrals than before the innovation. Additionally, awardees reported improved reach, “better” services, and improved standardization of coordination services as a result of CHW integration.
CHWs and non-licensed staff are diverse in job roles and backgrounds. For many HCIA awardees, developing new workforce models required creating unique roles tailored to the

34
innovation design and needs. These roles required individuals from all walks of life and multiple educational backgrounds, and awardees used non-traditional means, such as relying on community partners, to recruit these individuals. In turn, these staff had a wide range of experiences and backgrounds to assist them in their roles. Awardees defined non-licensed roles on the basis of the needs of the innovation, and non-licensed staff (paid or volunteer) contributed to all levels of the innovations, from planning and designing to being extensions of their clinical staff across community and care settings. Training varied across innovations and allowed non-licensed staff to support numerous management and coordination activities. Some awardees faced challenges using CHWs in clinical settings. For example, one awardee initially used CHWs within an ED setting, and found that CHWs were not emotionally or professionally prepared for the active trauma experienced in an ED. CHWs and non-licensed staff can fill a range of roles within an innovation, but adequate training and realistic expectations about what CHWs and lay staff can accomplish is necessary.
Successful use of CHWs and non-licensed, lay staff requires thoughtful and clear delineation of roles and functions. With the influx of new positions, non-licensed, lay staff often performed functions that overlapped with existing health care team roles. Without clear guidance about the roles and responsibilities of these and other new staff, the new staff of some awardees were not well used, and the existing staff of some awardees felt threatened because of perceived overlap in roles. It should not be assumed that current staff will understand, from just a title, the purpose of new staff or how they fit with and enhance current staff capacity. For example, in one innovation, intensive case management was supported by nurses and community health workers. Both work directly with medical providers, but nurses’ work with the more complex and elderly patients while CHWs work with younger patients with chronic disease requiring follow up and focus on coordinating preventive services like immunizations. In contrast, another awardee embedded CHWs into a subset of awardee practices that serve high-needs patients to help connect patients to external resources, but several of these practices were unclear on how the CHWs should function and did not give CHWs assignments or work. Detailed roles and functions for CHW staff not only help avoid role conflict and confusion but also maximize the ability of CHWs and non-licensed, lay staff to reduce the patient burden on professional staff. Lastly, it should be noted that staff roles evolved over time as awardees recognized changing needs and how new staff and CHWs could enhance the existing staff structure.
The role and purpose of CHWs and other non-licensed staff need to be communicated effectively to patients. Introducing new individuals to care teams was often a delicate balancing act for many of the target populations. To facilitate this process, awardees communicated to patients the role of CHWs and other licensed staff, and actively supported the inclusion of CHWs and other non-licensed, lay staff in interactions between patients and the professional care team. For example, one awardee introduced patients to CHWs and posted CHW pictures in the clinic to affirm the role of the CHW as a clinical resource. Another awardee’s staff meet regularly to discuss handoff strategies that prevent patients from falling out of care.
Working alongside CHWs created a change in mindset and a cultural shift among health care providers whom began to value the role and duties of CHWs in connecting with patients. Several awardees reported that a cultural shift among health care organizations and

35
providers occurred over time in attitudes towards and respect for the CHW role. For many clinical staff, the effectiveness of CHWs in identifying and responding to previously unrecognized patient needs and their ability to build patient trust were among the key benefits of CHWs. Within some awardee organizations, physicians and other clinicians who may have been initially indifferent or even skeptical became champions for the CHW role.
Careful recruitment and tailored training of CHWs contributed to successful CHW retention. Awardees that reported having high CHW retention attributed this success to a “rigorous approach to vetting and training” and recruitment of the “right” kind of individuals. One awardee described successful CHWs as “self-starters” and “gregarious.” Another awardee attributed retention success to a partnership that allowed clinical program leaders significant input into the training. Other awardees reporting training of CHWs to be a critical aspect of the innovation, and essential for effectiveness and retention.
Many CHWs work under the oversight of clinicians, though some may be administratively managed by nonclinical or external entities. Different models of management and supervision were used across awardees, and sometimes within even the same awardee when multiple implementation sites were present. CHWs at some awardees faced role conflict when hired and administratively supervised by an external partners or agencies, yet functioned day-to-day among a clinical team. The most common types of clinical supervisors included licensed social workers and registered nurses.
2.4 Scalability and Sustainability
Year 1 reports generally did not focus on scalability or sustainability issues, although many awardees recognized, even in that first year, that sustaining the innovation beyond the award period would be challenging. Nonetheless, awardees reported multiple positive spillover effects and awardees were generally successful scaling-up their multisite innovations. In Year 2, awardee attention turned increasingly to sustainability. In the second year, most awardees sought to sustain their innovations by securing external funds from a variety of state, federal, or commercial sources. Other awardees planned to join future payment reform pilots or model tests; some sought grants from private foundations, public agencies, and universities; and one awardee considered selling its training model to other organizations and universities.
By the third year it was clear that obtaining funding to sustain CHWs and other unreimbursed patient-support services was the greatest challenge. Although some awardees did secure external funding to sustain their innovations, many large organization awardees will rely on temporary or permanent internal funding to sustain their innovation. Organizations were willing to sustain innovations that were incorporated into the workflow or perceived to add value to the organization. Some awardees received direct funding from donations, grants or a combination of both, others will charge fees, while still others joined—or plan to join—ACOs to sustain their innovations.
As a result of these and other activities to secure funding, evaluators reported that 40% of innovations would be fully sustained, 42% would be partially sustained, and 8% would not be sustained once HCIA funding ended. FLE reports for the remaining 10% of awardees did not

36
clearly indicate which innovation components would be sustained, or if the innovation would continue.
Awardees with multisite experience prior to and during the HCIA funding period tested and refined methods of scaling their innovation. HCIA awards allowed some awardees to test features of innovations prior to widespread scaling. For example, one awardee found a distributive model of care management to be more scalable than an intensivist model across its practice sites. Similarly, another awardee refined opt-in processes and procedures to determine the best approaches so the program could be replicated. When clinical staff not involved in the HCIA innovation adopted the supporting health IT infrastructure developed for one awardee’s HCIA innovation, the awardee realized the innovation was easy to adopt and use without extensive training, was perceived as valuable by clinicians, and could be used in other clinical settings.
Awardees whose innovations were integrated into the clinical workflow and who were part of large provider institutions were often able to secure internal funding to sustain all or part of their innovation. Large organization awardees and awardees who are part of a large organization, including hospital systems, local health departments, universities, and clinics, often secured internal funding to continue all or part of their innovation. For example, innovation staff positions, originally funded by the grant, were included in next year’s budget. These staff may be hired as permanent full-time employees of the awardee organization or funded temporarily while external funding is secured. Some awardee organizations agreed to temporarily sustain all or part of the innovation while the awardee secured other funding through, for example, payer reimbursement for CHW services, contracts with payers, or other grants. Institutions were most likely to provide funding to sustain all or parts of the innovation when the innovation was fully embedded in the culture and workflow of the institution. Organizational leaders were also likely to provide support for the innovation when the innovation provided value to the organization through improved care delivery, improved morale or workflow, increased organizational stature, improved patient outcomes, or reduced costs.
Scalability and sustainability were enhanced by making training more replicable and less resource intensive. Beginning in the second year, many awardees adapted training by transitioning from in person, face-to-face training to video-recorded instruction or Web-based formats. Some awardees implemented these prerecorded formats during the funding period; others planned to use those training methods in the future. A few awardees mentioned additional solutions, such as narrowing the scope of training activities, centralizing training to one organization, and employing a train-the-trainer approach to expand the base of trainers beyond licensed providers.
As innovations matured, innovation and organizational leaders sought external funding to sustain all or part of their innovations. In the second and third years of their awards, leaders increasingly sought external funding or reimbursement to sustain their innovation’s services after HCIA funding concluded. Some awardees secured financing from Medicaid and commercial health plans to sustain the innovation, but payers wanted to see a return on investment or improvements in health outcomes before entering contractual agreements. A few awardees noted they would sustain their innovations through 1115 Medicaid waiver programs such as the Healthcare Transformation waiver and the Delivery System Reform

37
Incentive Payment (DSRIP) program. Several awardees sought to participate in future payment reform models tested in their state, such as ACOs (mentioned most frequently by awardees), bundled payment pilot programs, total cost of care models, and others. Awardees reported that joining an ACO would allow them to pay for the salaries and benefits of care managers, finance a telehealth care management system, facilitate securing future grant funding, and enable them to scale their innovation to other counties or regions. Finally, several awardees applied for grants from private foundations, public agencies, and universities to maintain their HCIA innovations. Others considered charging dues or fees from partner sites, instituting small charges for beneficiaries, or selling its training model to preserve the innovation.
Some awardees were successful in fully or partially sustaining their innovation through other funding mechanisms. Some awardees received direct funding from donations, grants, or a combination of both. In the third year, one awardee secured funding from at least five sources including multiple trusts and foundations as well as a nonprofit Medical School Quality Network. Another awardee who implemented a Health Information Exchange (HIE) innovation sustained their HIE by charging membership dues. Lastly, an awardee sustained their PCMH innovation by joining an ACO, allowing the awardee to maintain funding for PCMH components through ACO payments. Although most awardees initially planned to sustain innovation components through other funding mechanisms, only a few successfully did so.
Partners, many of whom were implementing the innovation, also played an active and strategic role in sustainability by agreeing to adopt and integrate key innovation components into their existing work. They also secured additional funding or policy changes to continue activities beyond the HCIA award period. For example, one awardee and its partners agreed to continue providing the services and are collaborating to seek out public and private funders to support their ongoing efforts. Another awardee and its partners are in discussions with Medicaid managed care organizations about plans for reimbursement of the community health worker component of its innovation.
Lack of reimbursement for care coordination services and new staff types is a key challenge to sustainability. Non-clinical staff, such as health coaches, patient navigators, and community health workers, were integral to many HCIA innovations, but are unable to bill for the many care coordination services they provide. Lack of reimbursement for care coordination services or the inability of certain health care professionals to bill for health care services related to chronic disease or care management is the principal impediment to the sustainability of many innovations. Many awardees, dependent on obtaining these reimbursements, lobbied their state governments for legislation or for an amendment from state government that would allow reimbursement for community health worker services, peer navigator, paramedicine, and even tele-psychiatry services. On a positive note, a few awardees did note that evolving Medicaid redesign and payment reform undertaken in their state could present a viable funding source for these types of staff and services in future years.
To sustain their innovations, awardees both reduced and increased the scope of their innovations to ensure financial stability. Many awardees are sustaining their innovations by dropping components, reducing the number of innovation settings, changing some services’ mode of delivery, or some combination of the above. For example, one awardee reduced the number of original innovation sites and replaced the follow-up home visit portion of the

38
innovation with a follow-up telephone call. If the patient needs additional support, they are referred to local community resources. Another awardee sustained the innovation at six of seven original sites, some of which cut extended hours.
Other awardees expanded the target population’s age, geographical area, other commercial payers, or expanded recruitment to include other sites. Some awardees found that by increasing patients served, reimbursements would also increase in states that expanded Medicaid. One awardee expanded the innovation to four additional sites and began serving patients covered by commercial plans, which doubled the patient population served. Lastly, one awardee expanded the role of non-licensed clinical staff to include billable activities that were not part of the original innovation. This allowed the awardee to sustain these staff positions. By expanding the scope or scaling the innovation, awardees can increase financial stability following the end of the grant-funded period.
2.5 Implementation Effectiveness
In this section, we summarize findings related to the assessment of implementation effectiveness, including emergent themes identified through traditional qualitative analysis, findings from a path model constructed to predict implementation effectiveness, and findings from a qualitative comparative analysis to identify features or combinations of features that led to implementation effectiveness. These findings were presented in detail in the second annual report, but we briefly summarize key findings in this section of this final report.
2.5.1 Fidelity, Reach, and Dose
Implementation fidelity, reach, and effective dose are all central constructs to assessing implementation effectiveness. As metrics, they provide innovators with valuable data on the integrity of an intervention, and the measured impact it may be expected to have on the diseases and conditions innovations are designed to ameliorate. Nonetheless, such metrics require sufficient background knowledge about the extent of the need, the resources necessary to meet that need, and a routinized model of implementation—conditions that were not met by many of the innovations tested using HCIA funding and providing such metrics proved elusive among awardees. Even into the third year, awardees continued to stress the value of implementation flexibility to meet partners’ organizational structures, clinic-specific workflows and cultures, and patient needs and preferences.
Many innovations were “flexible by design,” and not implementing specific evidence-based models; for these innovations, fidelity is an elusive concept. Most innovations were not based on rigid, protocol-driven processes or procedures and allowed staff or implementing sites flexibility in meeting patients’ needs or adapting services to fit with local culture or available resources. When specific protocols or processes are vague, broadly defined, or iterative by nature, there can only be fidelity to the process, not the content of an innovation.
• Fidelity is described through data that addresses the question “were the intended activities implemented?”
• Reach is described as “to what proportion of the eligible population was the innovation delivered?”
• Dose is described as “to what extent did those participating in the innovation receive the prescribed frequency, intensity, or amount of the innovation?”

39
Thus, many awardees and evaluators conflated measures of fidelity with measures of attaining milestones. Most flexible by design innovations remained flexible through the third year of the model and for these awardees assessing fidelity remained a challenge and, in many cases, inappropriate. Conversely, when innovations were modeled on a clearly identifiable evidenced-based practice, we found examples of robust fidelity measurement.
Few awardees or frontline providers can accurately assess reach. An important determinant of impact at a population level is reach, or the extent to which an innovation reaches the eligible population for which it was designed. To determine reach, one needs to measure of how many people have been “touched” by an innovation and the number of people in the eligible population. Evaluators and awardees had difficulty in determining absolute numbers of patients eligible for an innovation and numbers reached by an innovation because 1) some innovations are not directly touching patients, 2) some innovations have multiple components that touch different groups of patients, 3) many awardees have multiple sites of implementation, 4) some innovations target a larger population than whom the FLE is including in the evaluation, and 5) awardees report the number of direct and indirect participants to CMS based on how HCIA funds are used to support the implementation and this number may differ from both the numbers of those touched directly and the evaluable population. Changing eligibility criteria also complicated measures of reach.
Many awardees supplied targets for patient enrollment as part of their HCIA application, and they often based these targets on staffing and feasibility considerations. However, these targets may not actually reflect the underlying size of the eligible population. For example, one awardee implementing a specialized ED unit for elderly patients has a capacity of 14 beds and achieved its enrollment target, but the actual reach of the innovation is likely low with respect to the potentially eligible population. In addition, many awardees do not know the size of the potentially eligible population. Reasons include the lack of coordinated community and provider data systems to determine population size by different characteristics, the transient nature of the patient population being served, and innovations designed to transform entire care processes for all patients, as opposed to those designed to be targeted to a specific population.
Evaluators and awardees often use counts of contacts with patients to assess dose. However, what was counted varied greatly among awardees and provided limited insight into establishing standards for meaningful dose. What was counted as being contacted by an innovation varied widely among awardees, including any communication or interaction with an individual whether in person (e.g., home visit, clinic visit, hospital interaction, classroom instruction), by phone, or virtually through asynchronous information provision. Some awardees defined dose as a one-time touch. Other awardees prescribe a dose based on patient disease states, and an appropriate dose may span 6 to 9 months, with the number of contacts flexible based on staff assessment or patient needs. Still other awardees defined dose as the number of touches in their innovation, for example, tracking the proportion of patients that complete each step in its innovation. With the exception of innovations modeled after existing evidence-based programs, few innovations have established minimally effective doses. In fact, nearly half of evaluators were unable to estimate the extent individuals reached by an innovation received a “minimally effective innovation dose” as defined by the awardee-specific definition of dose (if any).

40
2.5.2 Predicting Implementation Effectiveness with a Path Model
In the second year, we constructed a path model to predict implementation effectiveness. A path model estimates the magnitude and significance of hypothesized causal connections between a set of variables. The path model constructed to predict implementation effectiveness used data collected from FLEs, including data abstracted from annual and quarterly reports. The model also included results from the AASF. For the AASF results to be included in the model, the FLE had to provide responses to half or more of the AASF questions and variation in respondent ratings was also considered. Lastly, we considered the measure’s theoretical contribution to predicting implementation effectiveness in this application. Eleven factors or variables were included in the path model. The items used to construct these factors can be seen in Appendix C.
The path model identified single-site implementation, training, and implementation planning as factors impacting implementation effectiveness. By the end of the second year, multisite awardees reported lower levels of implementation effectiveness relative to other awardees implementing at single sites. These results were likely due to additional time allowing awardees to achieve or not achieve implementation effectiveness. Also, the path model showed awardees providing staff with more formal and extensive training and who engaged in greater implementation planning were strongly and positively associated with implementation effectiveness. We also considered clinician buy-in, health IT, and recruitment as potential factors impacting implementation effectiveness of multisite awardees. However, results presented in the second annual report show multisite awardees had no more difficulty achieving buy in from clinicians than others. Also, clinician buy in was not associated with implementation effectiveness. Although, awardees often faced challenges with health IT and recruitment, neither are associated with implementation effectiveness. We were unable to identify the challenges causing multisite awardees to struggle with achieving implementation effectiveness.
2.5.3 Qualitative Comparative Analysis (QCA)
In year two we reported QCA results assessing factors leading to implementation effectiveness. To select features for the QCA and to determine awardee implementation effectiveness we used the second AASF and data abstracted from FLE reports. Using our knowledge of the awardees and implementation science principles we selected 22 features that may influence awardee implementation effectiveness. We specified 120 QCA models and conducted analyses with all awardees with an implementation effectiveness score as well as subsets of these awardees classified based on AASF results.
No single feature was either necessary or sufficient among awardees who achieved implementation effectiveness. Our results also showed no combination of factors were sufficient for an awardee to achieve implementation effectiveness. Instead, features and combinations of features were present in both awardees who achieved and did not achieve implementation effectiveness, ultimately leading to “null” set-theoretic findings. These findings may be explained because of the wide-ranging elements assessed in the second AASF which made classifying awardees into smaller sets not feasible. To find features or combinations of features that lead to implementation effectiveness we may need to examine more specific measures to identify common elements of success. Also, implementation effectiveness ratings were skewed. FLEs tended to give their awardee a high implementation effectiveness rating,

41
resulting in little variation in implementation effectiveness among awardees. Lastly, it may be that our null findings are correct and no relationship exists between innovation features and implementation effectiveness, but this is unlikely.

42
[This page intentionally left blank.]

43
SECTION 3 IMPACT EVALUATION FINDINGS
3.1 Impact Evaluation Summary
3.1.1 Data Availability
Gathering standardized data across a number of awardees and FLEs to assess impacts is always a challenge. Of the 108 awardees, 36 (33.3%) implemented and tested multiple interventions as part of their overall innovation. This increased the number of possible interventions tested from the 108 original awardees to 157 interventions for which evaluation estimates were potentially available. FLEs created comparison groups for 134 interventions (85%), and produced difference-in-difference estimates of HCIA effects for at least one of the core outcomes for 128 of the 157 interventions implemented (82%).
For substantive and methodological reasons, awardees were sorted into three groups: ambulatory, post-acute, and hospital-based interventions. Of the 157 interventions 93 of 112 ambulatory setting interventions (83%) provided a summative difference-in-difference estimate, 27 of 36 post-acute setting interventions (75%) provided a summative difference-in-difference estimate, and 8 of the 9 hospital-based innovations (88.9%) provided a summative difference-in-difference estimate for at least one of the four core outcomes.
3.1.2 Forest Plots
Forest plots of difference-in-difference effects continue to show a wide range of favorable, unfavorable, and mostly null effects, with mean aggregate impacts for all four core outcomes near zero. Despite increased sample sizes and additional follow-up quarters, wide confidence intervals point to considerable persisting imprecision in the results for many small innovations. We showed once again that the highest and lowest effect sizes emanate from innovations with small sample sizes. Funnel plots confirm there is no systematic bias in effect size magnitude associated with sample size.
3.1.3 Heterogeneity Analysis
Two standard meta-analytic measures (Q and I2) were used to assess whether the variability in intervention results was within that expected from sampling error (i.e., the expected variation of results based on samples). These analyses start with the assumption that all awardees should return a similar result. Since results are based on samples, a certain amount of variation is expected due to sampling error. If the variation in results exceeds that expected from sampling error (the Q-test), the I2 test estimates the proportion of the total variation that exceeds that expected from sampling error and is attributable to substantive differences in performance. Out of 12 statistical tests (four outcomes for the ambulatory, post-acute care, hospital-setting groups), we found evidence of moderate or high heterogeneity for all but two outcomes, which were both for the hospital-setting group. The presence of significant heterogeneity indicates that observed variation in innovation effect sizes exceeds that expected from statistical noise and is attributable to between intervention differences.

44
3.1.4 Meta-regression Results: Reasons for Variation
The results of the heterogeneity analysis imply that much of the variation among effects sizes may be attributable to features of the innovations themselves. We used meta-regression analysis to examine the impact of selected features on total cost of care effects for 72 ambulatory care innovations. The results from three meta-regressions showed:
• Structural characteristics. Savings effects were found for for-profit organizations (-$168 per beneficiary per quarter [PBPQ]), while there were dissavings for innovations delivered to Medicare patients (+$157 PBPQ).
• Implementation features. Of seven features related to innovation implementation, only rural location had a noteworthy impact. Expenditure effects were higher by $160 PBPQ in innovations that had rural sites.
• Innovation components. Of six types of system delivery components, community health workers was the only type to be associated with substantial savings (-$138 PBPQ). Most awardees combined multiple types of components in their innovations.
3.1.5 Path Model
To obtain a more comprehensive understanding of the relationships in the HCIA data, we estimated a path model (a structural equation model for observed variables). The path model combined features from the three meta-regressions and linked them to the two utilization measures and TCOC.
Although several features were related to patient recruitment problems and turnover challenges, neither of these intermediate variables had a significant impact on the core outcomes. As in our last report, we found that hospital admission effects had a much greater impact on TCOC effect sizes (beta = 0.68) than did ED effects (beta = 0.10). This suggests that features that affect hospital admission rates are likely to have the greatest implications for expenditures, but there were no features directly related to hospitalization in the model. We observed a strong, direct, and unfavorable impact on TCOC (beta = 0.40) for awardees implementing new innovations with their HCIA award (relative to awardees simply expanding the reach or scope of an existing program or initiative). Innovations providing services directly to beneficiaries were also associated with overall savings, but this was an effect that was transmitted indirectly through ED use and other variables.
3.1.6 Qualitative Comparative Analysis
Qualitative comparative analysis (QCA) was used in three subgroups of awardees: awardees implementing transitional care coordination innovations; awardees implementing outpatient care coordination, care management, or patient navigation innovations; and awardees implementing patient-centered medical home innovations. No single feature or combination of features was identified as necessary for having favorable effects across the core four outcomes. Although some combinations of features were found to be sufficient for a favorable impact for some outcomes, these combinations were present in only a small proportion of awardees.

45
3.1.7 Comparison Group Methodology
We conducted an extensive analysis of the methodology that FLEs used to construct comparison groups, including the methods used to define the groups, the structure of propensity score models, covariate balance, and the potential risk of bias in estimating HCIA effects. The FLEs overwhelmingly relied on propensity score matching to select comparison beneficiaries. Another common methodology, inverse propensity score weighting, was used in only one evaluation.
Most evaluations achieved high levels of covariate balance when they compared covariate means for the intervention and comparison groups after propensity score adjustment. On average, only 9% of the covariate means differed significantly by group.
We identified a potential risk of bias in a favorable direction (making interventions appear to be more effective than they really were) in nearly one-third of the evaluations. This risk was largely attributable to the way in which beneficiaries were selected for intervention groups in contrast to the comparison group identification.
In a multivariate analysis of TCOC, none of the characteristics we examined—type of comparison group, risk of bias, or degree of covariate imbalance—had a major impact on the magnitude of innovation effects. This reassuring result suggests that the DID effects reported by FLEs are unlikely to be systematically biased because of the way that intervention and comparison groups were constructed.
3.1.8 Comparative Interrupted Time Series Results
Using different analytic approaches to test whether results are robust is a good idea for challenging analyses, especially if a simpler approach yields similar results. To assess if a simpler approach would show similar results to those obtained from the DID analysis, we compared CITS results with DID results. These analyses showed that CITS estimates for TCOC effects were strongly correlated with FLEs’ DID estimates (r = 0.64), but that only 72% of the CITS values were within $374 of the DID estimate, and 67% were within the 90% confidence interval for the corresponding DID estimate. The simpler, quarterly data-based CITS model may not produce sufficiently close estimates to DID estimates in as many of one-third of all evaluations like those evaluated in HCIA. Although some discrepancies were due to innovations with unusual results, CITS may not reproduce estimates accurately when there are spikes or non-linear trends in the quarterly data.
3.1.9 Bayesian Results
As a complement to our frequentist meta-analysis findings, we also conducted a Bayesian random-effects meta-analysis for total cost of care, hospitalizations, 30-day readmissions, and ED utilization for the ambulatory, post-acute, and hospital settings. The Bayesian grand mean posterior distributions were concordant with our frequentist findings. Using the Bayesian posterior samples, we computed the probability of cost savings/reductions in utilization for the three settings. On average evaluations in the three settings had more than a 50% probability of cost savings; strong evidence for reductions in average 30-day readmissions (80% probability) was found for hospital setting interventions and strong evidence for decreases in mean ED
46
utilization was found for the ambulatory (81%) and hospital setting (94%) interventions. Our Bayesian model also produced synthesized, or shrinkage, estimates for each intervention-level estimate. Whereas FLE-reported DID estimates only use intervention specific information, through Bayesian modeling we improved the precision of extreme, imprecise estimates by updating them with estimates from HCIA interventions that took place in the same setting.
3.2 Classification of HCIA Interventions
In this section, we detail how we classified HCIA interventions for meta-analysis, the types of estimates we received from the FLEs, and how we determined which estimates were appropriate for meta-analysis. In some cases, the same awardee implemented different interventions as part of their overall innovation. In others, FLEs evaluated the same intervention in different populations, for example separate evaluations of an innovation in the Medicare and Medicaid populations. We consider these to be independent analyses because they serve different samples. Of the 108 awardees, 36 (33.3%) implemented and tested multiple interventions as part of their overall innovation. Of these awardees, 30 tested two interventions, 2 tested three interventions, 2 tested four interventions, 1 tested five interventions, and 1 tested six interventions. This increased the number of possible interventions tested from the 108 original awardees to 157 interventions for which evaluation estimates were available. We conducted our analyses at the intervention level because this is the level at which FLEs report difference-in-difference regression estimates.
Compared to the second annual report, 23 new evaluations were added and one was removed. This resulted in an increase in the number of evaluations from 135 in the second annual report to 157 in this final report. Of the new evaluations, the majority (16 of the 23 interventions) were in the ambulatory setting; the remaining 7 were classified as post-acute care-setting interventions. Eleven of the new interventions were assessed by the Community FLE, eight by the Complex FLE, two by the Behavioral FLE, and one each by the Disease and Medication Management/Shared Decision Making FLEs. Additionally, the majority (15 of the 23 evaluations new to this report) were estimates for Medicaid beneficiaries. The remaining 8 were evaluations for interventions not reported in previous FLE reports. Of the 23 evaluations new to this report, 19 (82.6%) had a DID estimate for at least one core measure.
Of the 157 evaluations, 134 (85.4%) had a comparison group. This is an increase from our last report in which 99 of the 135 evaluations (73.3%) had comparison groups. Of the 134 evaluations with a comparison group, 128 had a DID estimate for at least one core outcome. This is an increase from 86 evaluations in our last report.
3.2.1 Intervention Settings
For substantive and methodological reasons, the awardees were sorted into three groups for analysis: ambulatory, post-acute, and hospital-based interventions. Substantively, these are different settings which is likely a marker for the implementation of distinct intervention approaches for different populations with different health care needs. Methodologically, these substantive differences produce highly disparate results on the four core outcome measures. For example, the potential per capita scale of cost savings from hospital-based innovations is much greater (given the higher cost of care) than those obtainable from ambulatory care innovations. Further, within these broad settings, the actual interventions and

47
populations are still quite diverse. In Section 3.5, we use meta-regression to examine how intervention and population diversity impacts estimates of effectiveness for the innovations implemented within ambulatory care, which is the only setting that has a sufficient sample size to conduct a meta-regression. Our classifications are based on classifications reported by FLEs. When these classifications were not provided, we based the assignment on FLEs’ descriptions of the innovation components and on our structured qualitative coding of innovation components and characteristics.
Innovations implemented within an ambulatory care setting generally identified and enrolled eligible patients on a rolling basis and then followed them for the remainder of the innovation period. They provided ongoing preventive, primary care, and specialist services in health care facilities, associated community-based settings, or in the patient’s home.
Innovations implemented within post-acute care settings were typically transitional care programs that targeted patients recently released from hospitals or skilled nursing facilities. Notably, post-acute care data are generally episode-based with follow-up periods ranging from 30 to 120 days. Because of the episode-based nature of these interventions, we also included in the post-acute group the small number of episode-based interventions that took place in the ED setting or long-term care setting.
Innovations implemented with hospital settings involved a set of interventions implemented within hospitals and long-term care facilities. With few exceptions, most were evaluated using episode-based entry. For substantive reasons, three hospital setting awardees were reassigned to other analysis groups: UChicago was analyzed with the ambulatory setting interventions and Mt. Sinai and Christus LTPAC were included with the post-acute care settings interventions.
3.2.2 Types of Estimates Received
We used summative DID estimates of the core measures for meta-analysis. DID models estimate the average difference in performance between intervention and comparison groups over time, accounting for trends in the pre-intervention period. Consequently, the availability of summative DID estimates is essential for accurately capturing changes in performance, and we monitored their availability from the FLEs carefully. Table 3-1 summarizes the estimates that were available for this report across the ambulatory, post-acute, and hospital settings.
At least one DID estimate was available for 93 of 112 (83.0%) ambulatory care setting interventions. This is an increase from our last report in which DID estimates were available for 39 of 97 (40.2%) ambulatory care setting interventions. Most report all core four measures. Six other ambulatory care-setting intervention reported either pre/post estimates or unadjusted quarterly means and standard deviations for the intervention and comparison groups.
Most (27 of 36, 75.0%) of the post-acute interventions had at least one DID estimate and the majority of those reported at least three of the four core measures. This is an increase from our last report in which DID estimates were available for 18 of 29 (62.1%) post-acute care setting interventions. Six other interventions reported either pre/post estimates or quarterly means for at least one core measure.

48
Table 3-1 Types of Estimates Received
Estimate type Ambulatory
care Post-acute
care Hospital All
interventions
Total 112 36 9 157 DID estimates for core measures 93 (83.0%) 27 (75.0%) 8 (88.9%) 128 (81.5%) 4 core measures 62 (55.4%) 16 (44.4%) * 78 (49.7%) 3 core measures 25 (22.3%) 9 (25.0%) 8 (88.9%) 42 (26.8%) 2 core measures 3 (2.7%) 2 (5.6%) 0 5 (3.2%) 1 core measure 3 (2.7%) 0 0 3 (1.9%) Pre/post or other estimates for some or all core measures
6 (5.4%) 6 (16.7%) 1 (11.1%) 13 (8.3%)
No core estimates reported 13 (11.6%) 3 (8.3%) 0 16 (10.2%)
* Most hospital-setting interventions provided their intervention in the hospital; the FLE did not report hospital admissions.
The hospital setting interventions were implemented in the hospital or among populations recently discharged. Consequently, the hospital admission outcome was not appropriate for this group and was not reported by the FLE. All but one intervention (88.9%) in the hospital setting had DID estimates for all the other core measures. This intervention instead provided quarterly means for the intervention and comparison groups. There is no change from our last report in this setting.
No estimates—DID or otherwise—were available for 16 of 157 (10.2%) interventions. This is a decrease from our previous report in which 29 of 135 (21.5%) interventions did not have available estimates. The most frequently cited reasons for a lack of estimates were data availability and problems constructing an appropriately matched comparison group.
All FLEs were asked to provide quarterly means data templates covering the baseline and post-intervention periods. The templates requested the outcome mean, standard deviation, and sample size by quarter for the intervention and comparison groups. Table 3-2 summarizes the quarterly means data that were available for this report across the ambulatory care, post-acute care, and hospital settings.
The majority of evaluations in the ambulatory care and post-acute care settings reported quarterly means for all four core measures. All hospital setting evaluations provided quarterly means for at least two of the four core measures.

49
Table 3-2 Types of quarterly means data received
Estimate type Ambulatory
care Post-acute
care Hospital All
interventions
Total 112 36 9 157 Quarterly means data for core measures
93 (83.0%) 29 (80.6%) 9 (100.0%)
131 (83.4%)
4 core measures 71 (63.4%) 19 (52.8%) * 90 (57.3%) 3 core measures 15 (13.4%) 6 (16.7%) 3 (33.3%) 24 (15.3%) 2 core measures 5 (4.5%) 4 (11.1%) 6 (66.7%) 15 (9.6%) 1 core measure 2 (1.8%) 0 0 2 (1.3%) No quarterly means data for core measures
19 (17.0%) 7 (19.4%) 0 26 (16.6%)
* Most hospital-setting interventions provided their intervention in the hospital; the FLE did not report hospital admissions.
3.2.3 Quality of Estimates for Meta-analysis
In addition to monitoring the availability and type of estimates being reported by the FLEs, we monitored the quality of the estimates being reported and the appropriateness of estimates for inclusion in the meta-analysis. We assessed the quality of DID estimates and standard errors in two ways. First, we compared all estimates from FLEs’ third annual reports and third annual report addendums to the values we had recorded in our last report. Second, we performed comparative interrupted time series analysis (see Appendix D) using the quarterly unadjusted means supplied by the FLEs to produce an alternative estimate of the DID effect. Any unexplained discrepancies detected by either of these checks were referred to CMMI staff and FLEs for clarification or correction.
We further examined the 128 evaluations with a HCIA effect estimate for at least one of the four core outcome measures to determine their suitability for meta-analysis. Table 3-3 summarizes the availability of these estimates.
The availability of methodologically consistent estimates is a key strength of our meta-evaluation and a major reason why we specified that FLEs report summative DID estimates. For this report, one FLE did not report summative DID effect sizes for any of their interventions. In this case, however, the FLE reported quarterly DID effect sizes. We used the quarterly DIDs to calculate summative estimates usable for meta-evaluation;3 the calculation was applied to nine ambulatory care and three post-acute care interventions, increasing the number of evaluations
3 Our post-hoc calculation of summative DIDs from quarterly DID estimates is not ideal because we cannot
accurately model the correlation between quarterly DID estimates, resulting in standard errors that are likely smaller, but possibly larger, than would be obtained from a summative DID. If the calculated standard error is smaller, these calculated estimates may appear to have more precision than is warranted.

50
included in our analyses by twelve. Twenty-nine interventions failed to provide a TCOC estimate of any kind.
Table 3-3 Availability of Estimates for Meta-analysis
Estimate type Ambulatory
care Post-acute
care Hospital All
interventions
Total DID estimates 93 27 8 128 Unique populations 8 (8.6%) 0 0 8 (6.3%) No TCOC effect size 2 (2.2%) 2 (7.4%) 0 4 (3.1%) TCOC outlier 11 (11.8%) 10 (37.0%) 1 (12.5%) 22 (17.2%) Meta-regression sample 72 15 7 94
Nine awardees serve populations that are unlike those in the other interventions. These “unique” interventions serve palliative care patients (PCCSB and UVA), hospice patients who are mostly in their last 30-days of life (Sutter-AIM), patients with advanced cancer (UAB End of Life), premature infants in intensive care (WIHRI), chronically ill children (Houston), children covered by Medicaid (NCH and Cleveland), or American Indian children receiving dental services (Delta Dental). These populations have expenditures and utilization unlike those we observed in most of the HCIA interventions. We refer to these interventions as serving “unique populations,” and although we report their estimates in Section 3.3, we do not use them when calculating summary effect estimates in meta-analyses or in meta-regressions.
We also noted extreme TCOC estimates, defining outliers as absolute values exceeding $1,000 per beneficiary per quarter. After exclusions, 72 of the original 93 (77.4%) ambulatory care setting evaluations remained available for meta-regression analyses.
3.3 HCIA Innovation Impacts on the Four Core Outcomes
In this section, we present the impacts of HCIA interventions on the four core outcomes. As previously described, impact effects are from DID regression analyses reported by the FLEs. The results are summarized in the form of forest plots. There are separate sections for each outcome, with the results broken out separately by each category of setting: ambulatory care, post-acute care (including post-acute, ED, and long-term care settings), and hospital-setting. Awardees are identified by their abbreviated names. If an awardee implemented multiple interventions, the same awardee name will be associated with an abbreviated intervention name.
3.3.1 Total Cost of Care
While most interventions showed no significant impact on total cost of care, 18 ambulatory care setting interventions reported significant savings while 11 reported significant dissavings.
The first of the core outcomes is Total Cost of Care. These are the costs associated with Medicare Parts A and B, Medicaid, and in a few cases, Medicare Advantage. TCOC effects are regression-adjusted DID estimates contrasting the intervention and its comparison group,

51
controlling for differences at baseline. All effects were converted into average differences per beneficiary per quarter (PBPQ). Negative effects represent cost savings, while positive effects are dissavings.
The TCOC forest plot for the largest group of awardee innovations, ambulatory care settings, is shown in Figures 3-1 and 3-2. Because of the large number of evaluations in this category (93), the results have been split into two figures with the first showing awardee interventions with negative estimates (savings) and the second containing awardee interventions with positive estimates (dissavings). The confidence intervals for most of the intervention effect estimates in both graphs straddle zero (i.e., demonstrate a null effect). The effects range from $1,643 PBPQ in savings (Courage (Medicaid) to $2,969 PBPQ in dissavings (DDHS Medicaid), and were fairly evenly distributed around the vertical line denoting an effect of $0. Eighteen of the evaluations had savings that were statistically significantly greater than zero based on the 90% confidence interval, while 11 innovations had dissavings significantly different from zero (see Table 3-4). The weighted summary effect was $-19.30 (90% CI = $-54 – $15).
Table 3-4 Awardees with results for TCOC significantly different from zero at p <0.1
Awardees with Significant Savings Awardees with Significant Dissavings
1 J-CHIP (Medicaid, Community Program) Dartmouth (DHMC Site) 2 Courage (Medicaid) Dartmouth (VMMC Site) 3 UNM WIPH (PCMH) 4 Texas (BSLTOC AL/MC Intervention) Curators 5 Maimonides(Medicaid) Carilion 6 FPHNY PBGH 7 ValueOptions Intermountain (SSM Intervention) 8 IOBS MPHI 9 Intermountain (Medicaid, IndiGO and
SSM Interventions) CLTCEC
10 Le BonHeur HRA 11 UEMS URI 12 NEU-CHA (Medicaid, CHA Site) 13 Bronx 14 Kitsap 15 Y-USA 16 TransforMED 17 Welvie (Medicare FFS, Ohio Site) 18 Welvie (Medicare Advantage, Ohio Site)

52
Figure 3-1 Total cost of care: Ambulatory care setting innovations reporting savings
Key: Error bar shows 90% confidence intervals

53
Figure 3-2 Total cost of care: Ambulatory care setting innovations reporting dissavings
Key: Error bar shows 90% confidence intervals

54
Figure 3-3 shows the results for the 18 post-acute setting interventions, 5 ED setting interventions, and 2 long-term care setting interventions. These innovations also exhibited a broad range of TCOC effects, and eight reported statistically significant effects using the 90% confidence interval. Four showed statistically significant savings—UIHC, AGH, J-CHIP (Medicaid, PAC Program), and Imaging Advantage (Medicaid)—and three interventions reported statistically significant dissavings—PPMC (Standard Transitions Program), Imaging Advantage, and Christus (LTPAC Program). The weighted summary effect was $-56 PBPQ (90% CI = $-273 – $161).
Figure 3-3 Total cost of care: Post-acute care setting innovations
Key: Error bar shows 90% confidence intervals

55
The forest plot for the hospital setting group is shown in Figure 3-4. These effects are expressed in terms of 60-day spending per episode. The weighted summary effect on TCOC was -$161 per episode (90% CI = $-483 – $161). With 90% confidence only one of the awardee interventions shows dissavings significantly different from zero (Methodist-DP, and one intervention showed significant savings (Emory).
Figure 3-4 Total cost of care: Hospital setting innovations (60-day lookback)
Key: Error bar shows 90% confidence intervals

56
Finally, we present in Figure 3-5 the TCOC effects for five interventions that we have identified as serving unique populations and for whom we had TCOC effect sizes. Because these populations are not comparable to the other settings, or to one another, no weighted summary mean was calculated. Two of these five interventions had a statistically significant effect. UAB (End of Life Program) shows significant savings and Sutter-AIM shows significant dissavings. Houston (Phase 2) was excluded from the forest plot because it was an outlier that distorted the graph (Effect Size=$18,046 PBPQ; 90% CI=-$973 to $37,065).
Figure 3-5 Total cost of care: Innovations with unique populations
Key: Error bar shows 90% confidence intervals

57
3.3.2 Emergency Department Visits
Although most interventions did not significantly impact emergency department visits, slightly more ambulatory care setting interventions significantly reduced ED use and somewhat more post-acute care setting interventions significantly increased ED use relative to comparators. The second core outcome was visits to emergency departments per 1,000 beneficiaries per quarter. Figures 3-6 and 3-7 summarizes the average quarterly effects for the ambulatory care setting interventions. Twenty interventions had statistically significant decreases in ED visits ranging from 1.4 to 140 visits per 1,000 beneficiaries per quarter, while 17 interventions showed significant increases in ED visits (see Table 3-5). The remaining awardees reported no significant increases or decreases than their comparators. The weighted summary effect was significant at 90% confidence with -3 visits per 1,000 beneficiaries (90% CI = -5.5 – - 0.5 visits).
Table 3-5 Awardees with results for ED visits significantly different from zero at p <0.1
Awardees with significant reductions in ED visits
Awardees with significant increases in ED visits
1 ValueOptions Altarum 2 UEMS VUMC (OCC Nurses Program) 3 NEU-CHA (Medicaid, CHA Site) PBGH 4 Eau Claire (Medicaid) Mineral 5 DDHS (Medicaid) Intermountain (SSM Intervention) 6 Le BonHeur Denver 7 Chicago (Medicaid) Northland 8 J-CHIP (Medicaid, Community Program) Carilion 9 Nemours Curators (Medicaid) 10 Kitsap Kitsap (Medicaid) 11 BAHC Duke 12 NEU-CHA (Medicare FFS, CHA Site) Intermountain (Medicaid, IndiGO and SSM
Intervention) 13 Curators UChicago 14 CLTCEC SMHS 15 IOBS Prosser 16 Y-USA Altarum (Medicaid) 17 TransforMED Courage (Medicaid) 18 Sanford 19 Dartmouth (DHMC Site) 20 Welvie (Medicare FFS, Ohio Site)

58
Figure 3-6 Emergency department visits: Ambulatory care setting innovations reporting lower rates
of ED use
Key: Error bar shows 90% confidence intervals

59
Figure 3-7 Emergency department visits: Ambulatory care setting innovations reporting higher rates
of ED use
Key: Error bar shows 90% confidence intervals

60
The results for the interventions implemented in post-acute care settings are in Figure 3-8. The total of 25 effects come from 18 post-acute setting interventions, 5 ED setting interventions, and 2 long-term care setting interventions. With 90% confidence, two interventions showed significant decreases in ED visits—J-CHIP (Medicaid, PAC Program) and Imaging Advantage. Six interventions demonstrated significant increases in ED visits, most of which were PPMC interventions—PPMC (Intensive Transition Teams), Imaging Advantage (Medicaid), Christus (LTPAC Program), PPMC (Standard Transitions Program), PPMC (ED Guides), and PPMC (C-TRAIN Program). The weighted summary effect was significant at 90% confidence with an additional 26 visits per 1,000 beneficiaries per quarter (90% CI = 2.8 – 49.2 visits).
Figure 3-8 Emergency department visits: Post-acute care setting innovations
Key: Error bar shows 90% confidence intervals

61
The effects estimates for the interventions implemented in hospital settings are shown in Figure 3-9. One intervention had significantly lower ED visit rates (Methodist-DP) than its comparison. The weighted summary effect was -7 visits per 1,000 beneficiaries per quarter (2.6 visits), as 6 of the 8 evaluations had lower ED visit rates.
Figure 3-9 Emergency department visits: Hospital setting innovations
Key: Error bar shows 90% confidence intervals

62
In Figure 3-10, we present the effects on ED use for the eight unique population interventions that provided an ED use effect size. Because these interventions were not implemented in populations that are comparable to the other settings, or to one another, no weighted summary effect was calculated. Four of these eight interventions had a significant effect size. UAB (End of Life Program) and PCCSB show significant decreases in ED use and Sutter-AIM and Delta Dental show significant increases in ED use.
Figure 3-10 Emergency department visits: Innovations with unique populations
Key: Error bar shows 90% confidence intervals
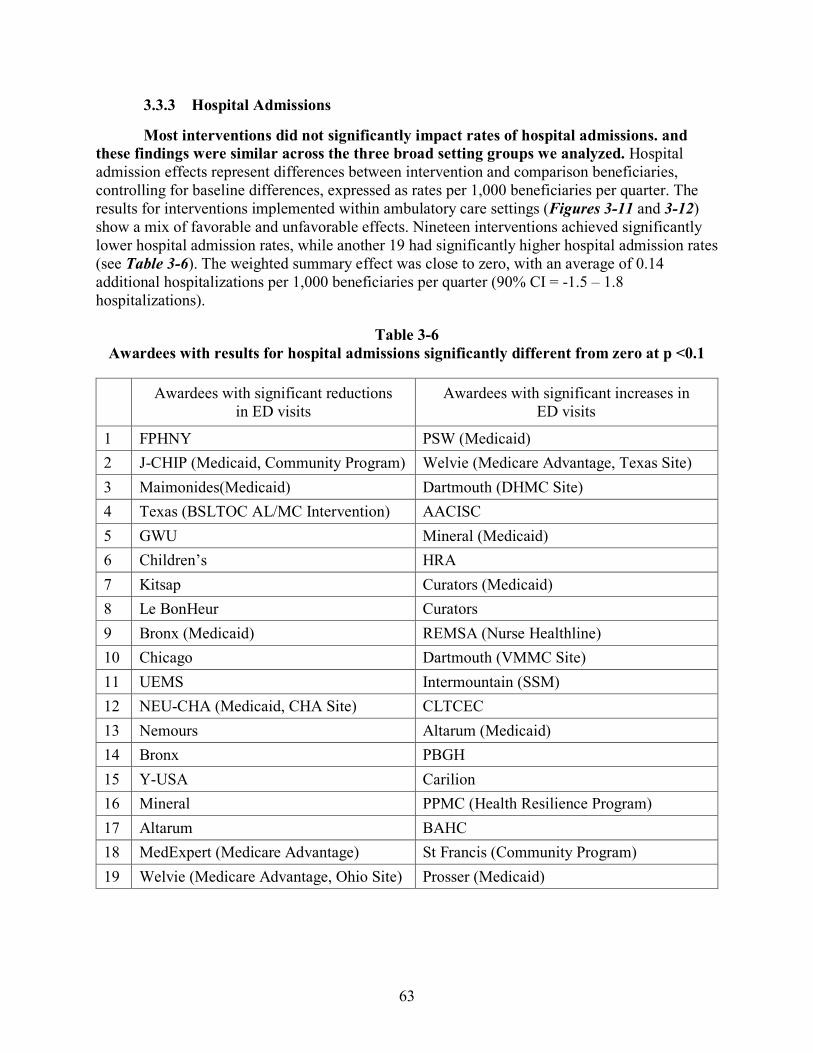
63
3.3.3 Hospital Admissions
Most interventions did not significantly impact rates of hospital admissions. and these findings were similar across the three broad setting groups we analyzed. Hospital admission effects represent differences between intervention and comparison beneficiaries, controlling for baseline differences, expressed as rates per 1,000 beneficiaries per quarter. The results for interventions implemented within ambulatory care settings (Figures 3-11 and 3-12) show a mix of favorable and unfavorable effects. Nineteen interventions achieved significantly lower hospital admission rates, while another 19 had significantly higher hospital admission rates (see Table 3-6). The weighted summary effect was close to zero, with an average of 0.14 additional hospitalizations per 1,000 beneficiaries per quarter (90% CI = -1.5 – 1.8 hospitalizations).
Table 3-6 Awardees with results for hospital admissions significantly different from zero at p <0.1
Awardees with significant reductions in ED visits
Awardees with significant increases in ED visits
1 FPHNY PSW (Medicaid) 2 J-CHIP (Medicaid, Community Program) Welvie (Medicare Advantage, Texas Site) 3 Maimonides(Medicaid) Dartmouth (DHMC Site) 4 Texas (BSLTOC AL/MC Intervention) AACISC 5 GWU Mineral (Medicaid) 6 Children’s HRA 7 Kitsap Curators (Medicaid) 8 Le BonHeur Curators 9 Bronx (Medicaid) REMSA (Nurse Healthline) 10 Chicago Dartmouth (VMMC Site) 11 UEMS Intermountain (SSM) 12 NEU-CHA (Medicaid, CHA Site) CLTCEC 13 Nemours Altarum (Medicaid) 14 Bronx PBGH 15 Y-USA Carilion 16 Mineral PPMC (Health Resilience Program) 17 Altarum BAHC 18 MedExpert (Medicare Advantage) St Francis (Community Program) 19 Welvie (Medicare Advantage, Ohio Site) Prosser (Medicaid)
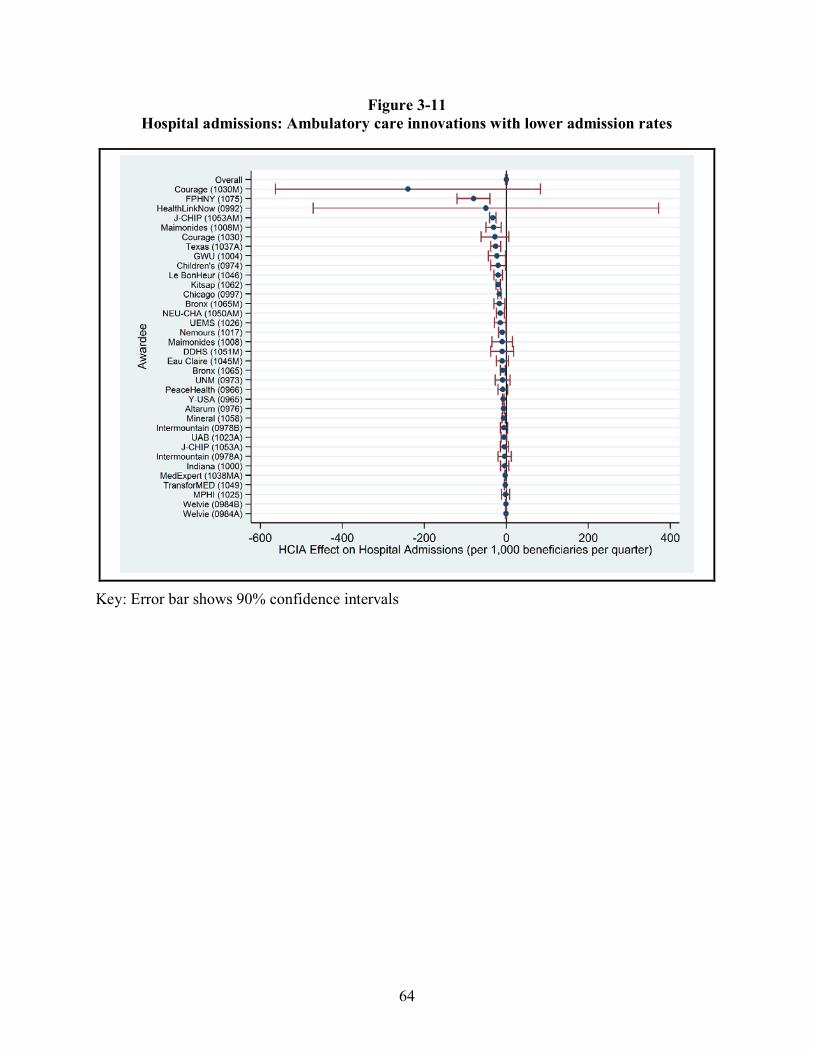
64
Figure 3-11 Hospital admissions: Ambulatory care innovations with lower admission rates
Key: Error bar shows 90% confidence intervals
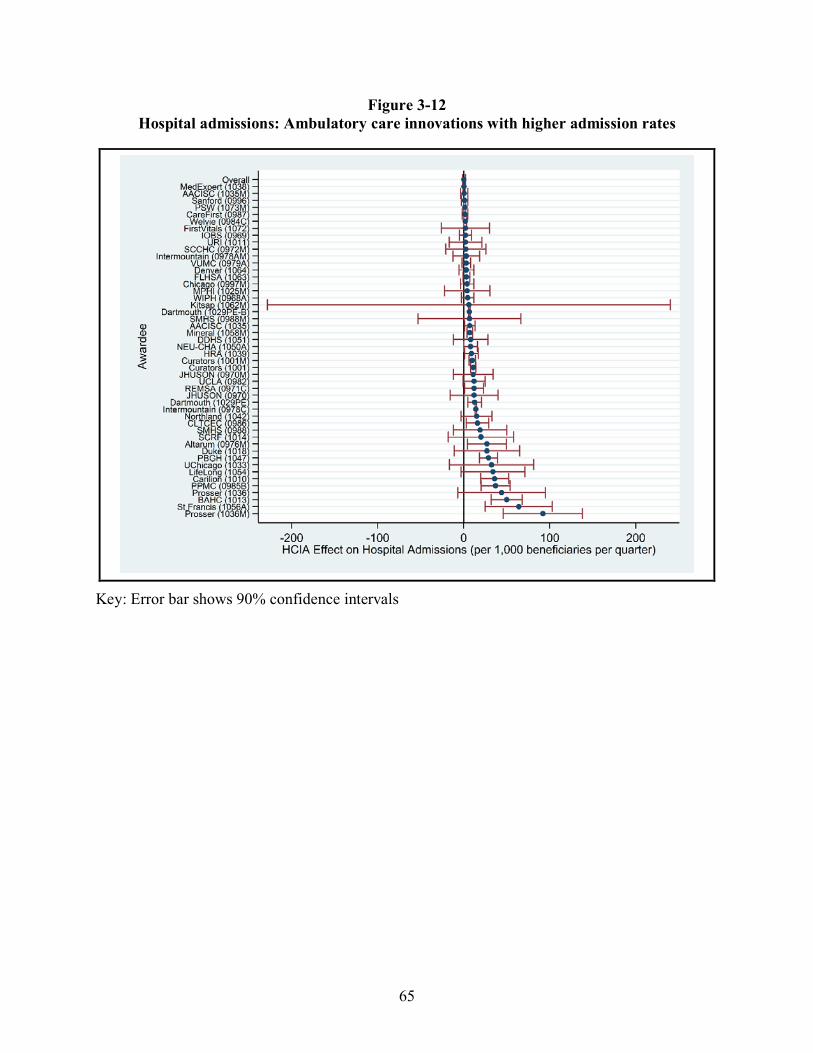
65
Figure 3-12 Hospital admissions: Ambulatory care innovations with higher admission rates
Key: Error bar shows 90% confidence intervals
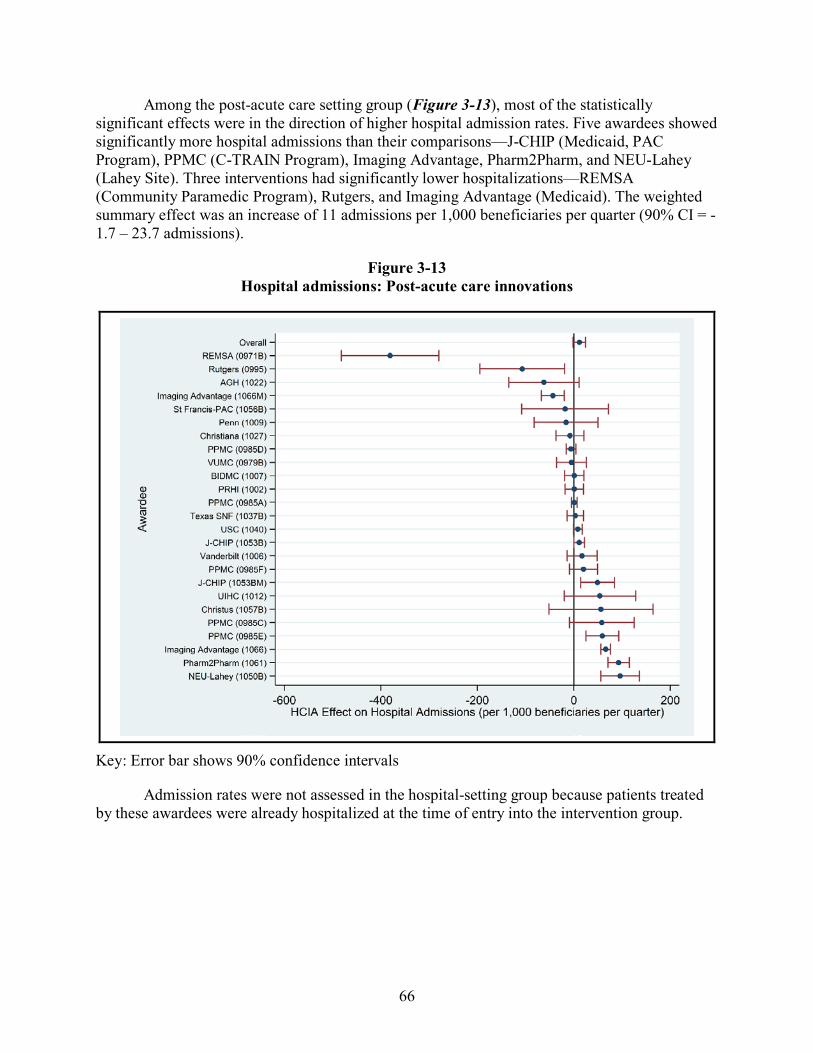
66
Among the post-acute care setting group (Figure 3-13), most of the statistically significant effects were in the direction of higher hospital admission rates. Five awardees showed significantly more hospital admissions than their comparisons—J-CHIP (Medicaid, PAC Program), PPMC (C-TRAIN Program), Imaging Advantage, Pharm2Pharm, and NEU-Lahey (Lahey Site). Three interventions had significantly lower hospitalizations—REMSA (Community Paramedic Program), Rutgers, and Imaging Advantage (Medicaid). The weighted summary effect was an increase of 11 admissions per 1,000 beneficiaries per quarter (90% CI = -1.7 – 23.7 admissions).
Figure 3-13 Hospital admissions: Post-acute care innovations
Key: Error bar shows 90% confidence intervals
Admission rates were not assessed in the hospital-setting group because patients treated by these awardees were already hospitalized at the time of entry into the intervention group.

67
In Figure 3-14, we present the hospitalization effects for six interventions that reported hospital admissions of the nine that we identified as serving unique populations. Because these interventions were implemented among populations that are not comparable to the other settings, or to one another, no weighted summary effect was calculated. Two of these six interventions had a significant effect size. UAB (End of Life Program) shows significant decreases in hospital admissions, and Sutter-AIM shows significant increases in hospital admissions.
Figure 3-14 Hospital Admissions: Innovations with unique populations
Key: Error bar shows 90% confidence intervals

68
3.3.4 Hospital Readmissions
Hospital readmission rates were generally not impacted by these interventions. The final core outcome is readmissions within 30 days of an index hospitalization. These rates are relatively imprecise because of small sample sizes because only beneficiaries recently hospitalized are eligible to contribute to the effect estimate. In general, anywhere from 5% to 30% of awardees’ target populations are hospitalized each year. The impact on hospital readmissions are displayed in Figures 3-15 and 3-16 for interventions implemented in ambulatory care settings. Five had significant decreases in readmissions, while 11 had significant increases in readmissions (see Table 3-7). The weighted summary effect was an increase of 1.9 readmissions per 1,000 admissions and did not differ significantly from zero (90% CI = -1.6 – 5.5). Texas (BSLTOC AL/MC Intervention) (effect size = -336 readmissions per 1,000 admissions; 90% CI = -629 – -43) and SMHS (effect size = -273 readmissions per 1,000 admissions; 90% CI = -489 – -57) were excluded from Figure 3-15 because they were outliers that distorted the graph.
Table 3-7 Awardees with results for hospital readmissions significantly different from zero at p <0.1
Awardees with significant reductions in hospital readmissions
Awardees with significant increases in hospital readmissions
1 Texas (BSLTOC AL/MC Intervention) CareFirst 2 SMHS PBGH 3 Children’s Mineral 4 J-CHIP (Medicaid, Community Program) PSW (Medicaid) 5 MedExpert (Medicare Advantage) Dartmouth (DHMC Site) 6 Bronx 7 MPHI 8 Prosser 9 GWU 10 SCRF 11 Altarum (Medicaid)

69
Figure 3-15 Hospital readmissions: Ambulatory care setting innovations per 1,000 admissions with
decreased readmissions
Key: Error bar shows 90% confidence intervals

70
Figure 3-16 Hospital readmissions: Ambulatory care setting innovations measured per 1,000
admissions with increased readmissions
Key: Error bar shows 90% confidence intervals

71
Figures 3-17 displays the readmissions effect sizes for awardees in the ambulatory setting for which the final core outcome of readmissions within 30 days of an index hospitalization were measured per 1,000 beneficiaries instead of per 1,000 hospital admissions. The weighted summary effect was an increase of 0.4 readmissions per 1,000 beneficiaries and did not differ significantly from zero (90% CI = -0.4 – 1.4).
Figure 3-17 Hospital readmissions: Ambulatory care setting innovations
measured per 1,000 beneficiaries
Key: Error bar shows 90% confidence intervals

72
Figure 3-18 displays the readmissions effect sizes for the post-acute care setting group. One intervention had a significant decrease in readmissions (Imaging Advantage) and two interventions had significant increases in admissions (J-CHIP (Medicare FFS, PAC Program), REMSA (Community Paramedic Program)). The weighted summary effect was 1.5 readmissions per 1,000 admissions and did not differ significantly from zero (90% CI = -3.9 – 7.0). The readmissions effect sizes for two awardees in the post-acute setting were measured as readmissions within 30 days of an index hospitalization per 1,000 beneficiaries instead of per 1,000 hospital admissions. One of these interventions had a significant decrease in readmissions (Rutgers) and one did not differ significantly from zero (AGH). Both interventions were excluded from Figure 3-18.
Figure 3-18 Hospital readmissions: Post-acute care innovations
Key: Error bar shows 90% confidence intervals
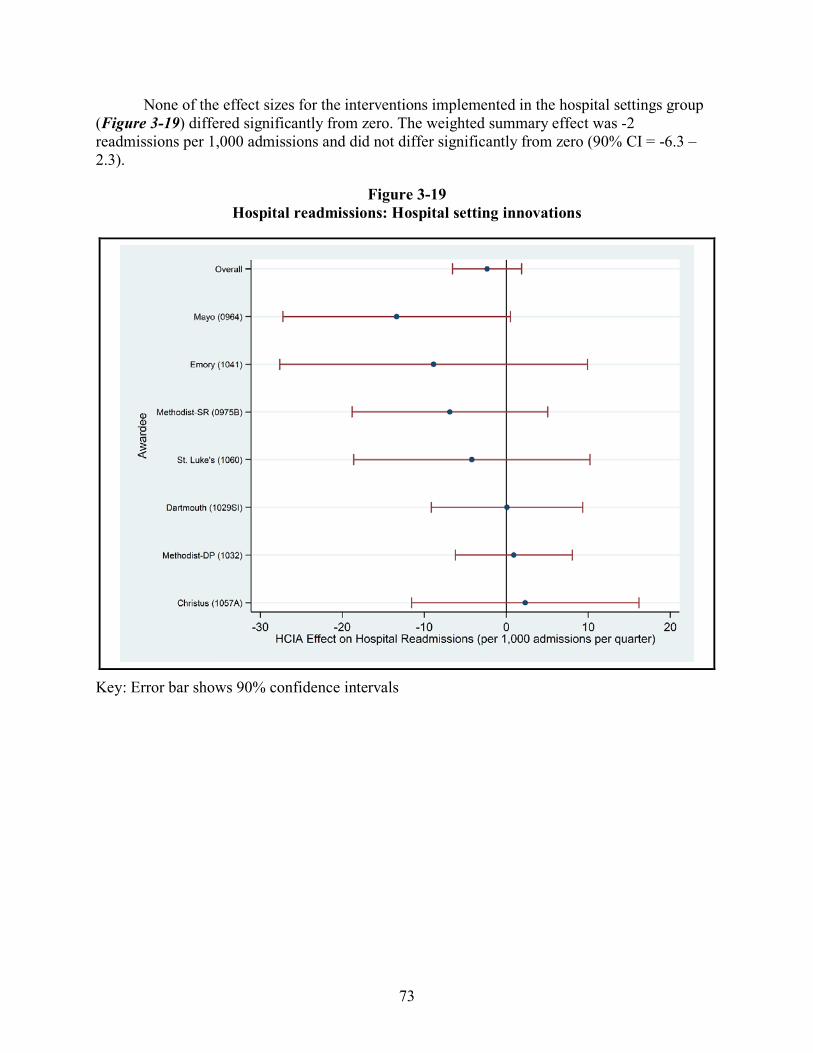
73
None of the effect sizes for the interventions implemented in the hospital settings group (Figure 3-19) differed significantly from zero. The weighted summary effect was -2 readmissions per 1,000 admissions and did not differ significantly from zero (90% CI = -6.3 – 2.3).
Figure 3-19 Hospital readmissions: Hospital setting innovations
Key: Error bar shows 90% confidence intervals

74
In Figure 3-20, we present the hospital readmissions effects for the three interventions reporting this outcome of the nine interventions that serve unique populations. Because the interventions implemented in these populations are not comparable to the other settings, or to one another, no weighted summary effect was calculated. One of these three interventions had a significant effect size: Sutter-AIM shows significant increases in hospital readmissions.
Figure 3-20 Hospital readmissions: Innovations with unique populations
Key: Error bar shows 90% confidence intervals

75
3.3.5 Impact of Selected Innovation or Awardee Characteristics on Costs of Care
Of the three special populations (awardees receiving no-cost extensions, awardees serving rural populations, and awardees serving pediatric populations), only awardees serving pediatric populations returned a significant result relative to comparators: a significant increase in TCOC of $53 PBPQ. The performance of three subgroups was of special interest to CMMI. We looked at the weighted summary effects for these three groups of awardees. Figure 3-21 displays the results of this analysis.
We excluded the nine interventions that served unique populations from our synthesis and meta-regression analyses. Section 3.2.3 provides more information about the awardees with unique populations. Because the interventions in the hospital setting group had effect sizes based on a 60-day lookback for total cost of care, a different scale from the other interventions, we also excluded them from this analysis.
Figure 3-21 Impact of selected characteristics on costs of care
Key: Error bar shows 90% confidence intervals
76
The weighted summary effect for the 47 interventions that received no cost extensions was -$47 (90% CI = -111.5 – 17.5). The weighted summary effect for 53 interventions that reported serving rural areas was -$53 (90% CI = -92.3 – -13.7, p <0.01). We identified 10 interventions as exclusively serving a pediatric population (age < 18 years). Of those, eight had total cost of care effect size data, but five served unique populations. The weighted summary effect estimate for the three interventions not serving unique populations was $254 (90% CI = -380.0 – 888.0).
3.3.6 Sample Size and HCIA Effects
Among interventions implemented in ambulatory care settings, larger effect sizes came from the evaluations with the smallest sample sizes. In theory, there should be no relationship between sample size and effect size. In practice, however, an association is not uncommon. Some form of reporting bias could be present in HCIA because effects are obtained only for those awardees with comparison groups and sufficient follow-up. In this section, we inspect plots of sample size by effect size for symmetry using all available data. Sample sizes were based on the average number of quarterly beneficiaries used in DID analyses during all reported intervention quarters. We computed these quarterly means separately for the intervention and comparison groups, and combined them to derive a total sample size. We then plotted the relationship between the square root of an intervention’s sample size and its effect size.
The plot of TCOC outcome versus sample size among the interventions implemented in ambulatory care settings is shown in Figure 3-22. The relationship resembles an inverted funnel. The near equal distribution of estimates around zero indicates that sample size and effect size are not correlated (r = -0.043, N = 83). Interventions with the largest sample sizes all have effects close to zero dollars and smaller samples show larger effects on both savings and dissavings. Most of the variation in TCOC effects comes from interventions with total samples of less than 5,000 beneficiaries. If sample size and effect size interacted, we would observe a funnel with unequal sides. This pattern also helps to explain why the weighted summary effects are so small in most of the forest plots. Interventions with larger samples tend to have the most weight in determining the summary effect size, that these estimates are near zero draws the summary effect toward zero.
The same funnel pattern is also evident among the smaller number of interventions implemented within ambulatory care settings that reported effects on ED visits (Figure 3-23). Once again, the interventions with the largest sample sizes had almost no impact on visit rates per 1,000 beneficiaries, and most of the effect variation occurred among the interventions with the smallest sample sizes. For completeness, the plot includes extreme effect size values. The effect-sample size correlation in this scatterplot was r = 0.01 (N = 84), again demonstrating no systematic relationship between the effect size obtained and the sample size of the awardee. If sample size correlated with effect size the funnel plot would show a warped distribution (i.e., depending on sample size effect sizes would be systematically favor either the intervention or comparison group; here neither group is favored).

77
Figure 3-22 Sample size by total cost of care effects: Ambulatory care setting innovations

78
Figure 3-23 Sample size by emergency department visit effects: Ambulatory care innovations
3.4 Impact Effect Heterogeneity
With few exceptions, we observed a large degree of variation in core outcome effect estimates across the portfolio of HCIA awardees. This finding is not surprising because of the clinical heterogeneity of intervention types, populations involved, and implementation settings for HCIA interventions. This variation can be seen in the forest plots presented in Section 3.3, and can be quantified using statistical tests. In this section, we present formal statistical tests of heterogeneity.
We use two measures, Q (Hedges & Olkin, 1985) and I2 (Higgins & Thompson, 2002) to assess heterogeneity. These are the generally accepted standards for estimating heterogeneity in fixed-effects models and are conventionally used for random-effects models, the type of model used to calculate the weighted summary effects in Section 3.3.1. The Q-test for homogeneity tests the hypothesis that all studies share a common effect size, that is, the variation observed between effect sizes is attributable to sampling error and not to actual differences in intervention effectiveness. A significant p-value is evidence for heterogeneity. The related measure, I2, estimates the proportion of the total variance (within-intervention variability plus between-intervention variability) that is attributable to between-intervention differences. Following

79
convention, I2 is expressed as a percentage. A rule of thumb for interpreting I2 is as follows: 25% indicates low heterogeneity, 50% indicates moderate heterogeneity, and 75% indicates high heterogeneity (Higgins, Thompson, Deeks, & Altman, 2003). Using Q and I2, we examined the heterogeneity across interventions for all four core measures for ambulatory care, post-acute care, and hospital setting interventions. Included in this analysis are interventions for which we had a DID effect size. Not all interventions provided estimates for all four core measures, thus the number of interventions across the four measures may differ. We present our findings in Table 3-8.
Table 3-8 Heterogeneity statistics
Type of intervention (N) Q-test statistic
(p-value) I2
(90% CI) Interpretation
Total Cost of Care Ambulatory (90) 614.79
(p < .001) 85.52%
(83.24%, 87.50%) Evidence of high heterogeneity
Hospital (8) 17.01 (p = 0.0173)
58.85% (23.50%, 77.86%)
Evidence of moderate heterogeneity
Post-Acute (28) 76.47 (p < .001)
64.69% (50.69%, 74.72%)
Evidence of moderate heterogeneity
Inpatient Admissions Ambulatory (90) 1312.4
(p < .001) 93.22%
(92.38%, 93.97%) Evidence of high heterogeneity
Post-Acute (28) 242.49 (p < .001)
88.87% (85.77%, 91.29%)
Evidence of high heterogeneity
Hospital Readmissions Ambulatory (64) 169.2
(p < 0.001) 62.77%
(53.37%, 70.27%) Evidence of moderate heterogeneity
Hospital (7) 3.53 (p = 0.74)
0% (0%, 40.71%)
Homogeneity
Post-Acute (24) 45.83 (p = 0.0031)
49.81% (26.04%, 65.95%)
Evidence of moderate heterogeneity
ED Use Ambulatory (91) 754.99
(p < .001) 88.08%
(86.32%, 89.61%) Evidence of high heterogeneity
Hospital (8) 4.59 (p = 0.7099)
0% (0%, 41.57%)
Homogeneity
Post-Acute (28) 1043.94 (p < .001)
97.41% (96.97%, 97.79%)
Evidence of high heterogeneity

80
With respect to total cost of care, the Q-test yields strong evidence that effect sizes vary significantly between interventions (p < 0.001) for ambulatory and post-acute interventions. There is also evidence that the effect sizes for hospital setting interventions also vary significantly between interventions (p < 0.05). The corresponding I2 values range from moderate to large (between 58% and 86%, with the 90% confidence intervals not crossing 0), indicating that much of the variation is attributable to between-intervention differences. This indicates that it is unlikely that these interventions share the common effect size given by the grand mean.
For inpatient admissions, the Q-test provides evidence of high heterogeneity among both ambulatory and post-acute settings (p < 0.001). In each case, the I2 value also indicates that more than 88% of the observed variation is likely due to between-intervention differences. It is unlikely that the grand mean is a good indicator of the expected effectiveness of these interventions.
For hospital readmissions, the Q-test provides sufficient evidence to reject homogeneity for the ambulatory and post-acute interventions (p < 0.01 in each case), but does not provide sufficient evidence to reject homogeneity among the interventions in the hospital setting (p > 0.1). Similarly, the I2 indicates that the vast majority of the heterogeneity between effects observed in the hospital setting is not attributable to between intervention heterogeneity. However, it is important to note that the Q-test (and the I2 estimate) are sensitive to the number of interventions included in its calculation and it is possible that this or a high degree of within-intervention variance is masking heterogeneity. Even so, the lack of evidence for heterogeneity supports the validity of the grand mean effect and confidence intervals as descriptors of the overall impact of the included interventions on hospital readmissions.
For ED use, the Q-test provides evidence of high heterogeneity among ambulatory care and post-acute setting interventions (p < 0.001) where 88% and 97% of the variation observed, respectively, is attributable to between-intervention differences. However, there is not strong evidence to reject homogeneity among hospital setting interventions (p = 0.71). As before, it is important to remember that Q-test (and the I2 estimation) are sensitive to the number of interventions included in its calculation. Despite this possibility, at this time the lack of evidence for heterogeneity supports the validity of the grand mean effect and confidence intervals as descriptors of the overall impact of the included interventions on ED usage.
The evidence for heterogeneity within each outcome and setting found in this report is generally consistent with the results in our second annual report. There is, however, one exception. Whereas the Q-test for interventions in the post-acute care setting with respect to hospital readmissions in the second annual report did not provide sufficient evidence to reject homogeneity, we now find evidence of moderate heterogeneity. The continued presence of heterogeneity among the interventions in the ambulatory care setting for total cost of care provides strong evidence that the differences observed are attributable to differences between the interventions and not statistical noise. Because of this, we expand our analysis beyond the quantification of heterogeneity that we have done in this section to meta-regression in Section 3.5.3, which uses key intervention features to explain differences in TCOC for interventions in the ambulatory care setting.

81
3.5 Meta-Regression Analyses
3.5.1 Key Innovation Features
Three meta-regressions were run to test whether innovation structural features, implementation features, or intervention components systematically affected TCOC estimates among interventions implemented in ambulatory care settings. Once intervention effects were determined for a critical mass of interventions and we established that they did not share a common effect size through statistical tests of heterogeneity, our next objectives was to examine how the magnitude of these effects might be affected by specific features of an innovation—for example, whether cost savings were consistently greater or less in interventions providing direct services to patients versus indirect or if utilization rates were lower or higher for interventions affiliated with academic versus non-academic medical centers. The appropriateness of conducting meta-regression at this stage is supported by the results in the previous section, which suggest that there is substantial unexplained heterogeneity among innovations that might be attributable to such features.
A major limiting factor in meta-regression is that having a small number of interventions makes it difficult to obtain reliable estimates for more than a few features at a time. Adding more features generally reduces the precision of estimates of the variables already in the meta-regression model. To address this limitation, we took our list of key intervention features, divided it into three clusters, and conducted separate analyses for each cluster of features. This permitted us to limit the number of features in any given analysis to no more than eight features. The models are run sequentially (i.e., structural then innovation components, then implementation features), with features showing significant relationships with TCOC in the earlier models carried forward in subsequent models. This isolates the additional variation explained by features included in later models.
Drawn from a variety of sources, the three clusters we selected are summarized below and explained in Table 3-9.
• Structural features: Pre-existing characteristics of the organization implementing the intervention, including payer type, academic affiliation, FLE-assessed resource adequacy, and two measures of previous experience implementing similar innovations or participation in other CMS demonstrations or initiatives.
• Intervention or population characteristics: Six characteristics that reflect the nature of the intervention, for example whether health IT was involved, or whether the intervention included a behavioral health focus, or whether the population targeted was primarily a Medicare fee for service (FFS) population.
• Implementation features: Six innovation components that were expected to influence the core outcomes, such as whether the innovation implemented health IT, telemedicine, used community health workers, or implemented a patient-centered medical home as part of the intervention

82
Table 3-9 Key innovation features by cluster
Feature Measurement Source*
Structural Features Medicare payer Yes/no; payer is Medicare FFS rather than
Medicaid or Medicare Advantage FLE reports
Resource adequacy Adequacy of site’s financial, training, and physical equipment resources as assessed by the FLE (Likert Scale: not all to more than adequate)
AASF1
Previous demonstration participation Yes/no; participating in a CMS APM program
AASF1
For-profit tax status Yes/no Lewin reports Academic affiliation Yes/no Lewin reports Was experienced in implementing similar intervention
Likert scale: not at all to a great extent AASF2 Item 10d
Intervention Features or Population Characteristics Feature Measurement Source Used
Implemented health information technology as part of the intervention
Yes, health IT was important or critical to intervention/no
SQC
Intervention had a behavioral health focus
Yes/no SQC
Implemented telemedicine as part of the intervention
Yes/no SQC
Intervention used community health workers
Yes/no SQC
Included workflow/process redesign as part of the intervention
Yes/no SQC
Intervention involved implementing a patient-centered medical home
Yes/no SQC
Targeted exclusively Medicare FFS beneficiaries
Yes/no SQC
Had for-profit tax status Yes/no Lewin reports Had a rural health focus Yes/no SQC Delivered to a clinically fragile population
Yes/no (populations that are clinically complex or at risk for disease progression)
SQC
Delivered to a socially fragile population
Yes/no (populations at risk due to social circumstances or barriers)
SQC
(continued)
83
Table 3-9 (continued) Key innovation features by cluster
Feature Measurement Source*
Intervention provided direct services to beneficiaries
Yes/no SQC
Was a new intervention to the awardee organization
Yes/no (did not exist or was not piloted pre-HCIA)
SQC
Intervention was implemented at multiple sites
Yes/no AASF2
Intervention had a rural health focus Yes/no SQC Awardee received no-cost extension Yes/no CMMI Awardee experienced barriers to patient recruitment
Yes/no Lewin reports
Awardee experienced staff turnover challenges
0 = not a challenge, 100 = major challenge
AASF2 item 16f
*FLE = Frontline Evaluator; AASF =Annual Awardee Summary Form; SQC = Structured Qualitative Coding
Another cluster we considered was one for Evaluation Design Features to characterize patient selection methods, measurement approaches, and statistical analyses. However, the CMMI awardee protocols imposed uniformity in the way that outcomes were measured, and all awardees used similar DID models to estimate innovation effects. The influence of methodological aspects of the construction of comparison groups is examined in Appendix A.
3.5.2 Meta-Regression Methods
The results of the testing in Section 3.3 indicate that effect sizes varied far more than expected due to sampling error, especially for TCOC and for ambulatory innovations. This variation may be generated in part by the kinds of awardee features listed in the table above. In the field of meta-analysis, the predominant method for analyzing heterogeneity is meta-regression. Meta-regression is similar to ordinary least squares (OLS) regression, the classical method for identifying systematic sources of variation, and regression coefficients are estimated and interpreted similarly. However, there are two important distinctions between the commonly used OLS regression and meta-regression which should be noted in the context of this report. First, the dependent variable in the meta-regression model is the DID intervention effect rather than the actual value of the outcome itself. With respect to TCOC, our outcome is the estimated intervention impact in terms of quarterly savings or dissavings rather than the level of expenditures that might be used in OLS regression. A second difference in meta-regression is that observations are weighted by the precision of estimated effects. We used inverse-variance weighting for our analyses. This means that large studies with small standard errors have greater influence on the regression results than smaller studies whose estimates are less precise.
We focus here on interventions in the ambulatory care setting for several reasons. First, there are substantial TCOC differences by setting. Mean TCOC during intervention follow-up

84
periods are dramatically lower for ambulatory interventions ($3,188 PBPQ) than for the interventions in post-acute care settings ($13,284 PBPQ). Second, the Cochrane Collaboration guideline is that at least 10 studies are needed to conduct meta-regression (Higgins & Green, 2011). After allowing for missing data, the ambulatory care settings group is the only group that exceeds this criterion. Third, the heterogeneity results in Section 3.3 indicate that this is the most likely group to have explainable variation in TCOC. We therefore use TCOC effects from interventions in the ambulatory care setting as the primary outcome. The utilization measures are associated with these costs, and we explore those relationships in the next section.
For the reasons above, the meta-regressions were limited to ambulatory innovations with comparison groups and regression-adjusted DID estimates for TCOC effects. We also eliminated outlier TCOC estimates because of the potential bias that can be introduced by only a few outliers in small sample regressions. Outliers were defined as absolute values of more than $1,000 per beneficiary per quarter for TCOC (N = 3), 100 per 1,000 for ED rates (N = 2), and 50 per 1,000 for hospital admissions (N = 1). These are equivalent to 15% and 18%, respectively, of national utilization patterns and 42% of quarterly Medicare FFS expenditures. These exclusions left 72 ambulatory evaluations with complete data for meta-regression (see Table 3-3).
Meta-analysts use random effects (RE) modeling when effect sizes are not assumed to be estimating a common effect and differences in observed estimates are not assumed to be due solely to statistical noise. RE meta-analysis attributes differences between intervention effect sizes to two components, statistical noise and underlying differences between the interventions. In the case of the HCIA awardees, we assume in these meta-regression analyses that the FLE-reported estimated effects are measuring many different underlying effects because of the wide variety of interventions being implemented by the awardees. The HCIA awardees also vary greatly in their size. RE meta-regression reweights the effect sizes so they are more equal in contribution, reducing the concern that effects from the larger interventions will overshadow the contribution of effects from smaller interventions in estimating relationships. Finally, unlike fixed-effect meta-analysis, the results from RE models are considered generalizable beyond that of the analyzed sample.
For each model, we show the unstandardized regression coefficient (i.e., the actual value of the difference in TCOC or utilization per beneficiary per quarter) and its standard error, the zero-order weighted Pearson correlation between the feature and the outcome, and the mean or percentage of innovations with the feature in the analysis group. This weighting can alter the prevalence of some features compared to the rates for the entire set of awardees. The standard errors are helpful for assessing how precisely we can determine the cost impact of any particular feature. After eliminating outliers TCOC effects ranged from -$1,000 to $1,000 per beneficiary per quarter with an average value near zero dollars.
3.5.3 Meta-Regression Results
Of the six structural features tested, only one—that the intervention was targeted towards Medicare FFS beneficiaries—was associated with significantly higher TCOC. The regression results for the six structural innovation features are shown in Table 3-10. Two of these features had sizable impacts on HCIA TCOC effect sizes. Adjusted for the other characteristics in the model, interventions which targeted Medicare FFS beneficiaries were

85
significantly less successful in reducing TCOC (by $157 PBPQ) than interventions which did not exclusively target Medicare FFS populations. Although not statistically significant due to the variability of estimates, interventions implemented by awardee organizations with for-profit status had savings relative to nonprofit and government-based awardee organizations (-$168 PBPQ). Having previous experience with implementing similar innovations or participation in other CMS demonstrations or initiatives were not significantly associated with reduced or increased TCOC relative to comparators.
Table 3-10 Meta-regression results for structural features of interventions in
ambulatory care settings (N = 72)
Feature
Costs per beneficiary per quarter
(standard error) Correlation with TCOC
Percent or mean
Targets Medicare FFS beneficiaries 157.1* (68.91)
0.25 59%
Resource adequacy 8.1 (17.36)
0.15 11.5
Previous demonstration participation 113.7 (67.58)
–0.05 67%
For-profit tax status –168.0 (107.28)
–0.13 44%
Academic affiliation 3.2 (87.49)
0.01 14%
Experience implementing similar interventions
1.3 (1.04)
0.22 76.1
* p < 0.05; Adj R2 = 0.141
The next regression focuses on the impact of specific intervention features or population characteristics (see Table 3-11). The results from last year’s model were published in the journal Health Affairs (Smith et al., 2017) and presented at two policy forums. In response to questions raised at the forums, we refined our selection and operationalization of features included in the model. Three changes were made. First, we previously used a broad definition of health IT that may have included some relatively inconsequential forms of health IT use. For this year’s model, the definition has been restricted only to cases in which health IT was judged to be important or critical to the intervention.
The use of community health workers and health IT were common intervention characteristics (see Appendix G). The prevalence of the most common intervention features among the 72 interventions we analyzed with meta-regression are community health workers (40%), use of health IT critical or important to the intervention (40%), and behavioral health

86
focus (29%). Few interventions used telemedicine (6%) or included a workflow redesign component (6%).
Of six intervention features or population characteristics, only use of CHWs had an appreciable impact on TCOC effects. To reduce variation in the TCOC outcome attributable to other sources, the model contains two measures of health severity (innovations targeting clinically or socially fragile patients) and three characteristics shown to be influential in other analyses in this section (for-profit status, rural locations, and Medicare payer). All the explanatory variables are binary.
Table 3-11 Meta-regression results for innovation features (N = 72)
Feature
Costs per beneficiary per quarter
(standard error) Correlation with TCOC Percent
Used health IT –30.2 (71.15)
–0.09 34%
Used community health workers –137.7 (89.26)
–0.36 9%
Medical home intervention –44.7 (104.52)
–0.04 8%
Focus on behavioral health 21.5 (90.44)
–0.09 7%
Used telemedicine 57.6 (198.90)
0.07 0.5%
Workflow/process redesign intervention –48.1 (143.39)
–0.16 2%
Targets clinically fragile population –38.5 (73.32)
0.01 33%
Targets socially fragile population 38.2 (101.30)
–0.20 4%
For Profit –156.7 (106.45)
–0.13 44%
Rural 97.2 (76.51)
0.21 78%
Medicare 137.0† (77.10)
0.25 59%
† p < 0.10; Adj R2 = 0.070

87
Although not significant at the 10% level, interventions which employed CHWs saved $138 PBPQ (p = 0.13) relative to interventions not employing CHWs. None of the other components had favorable (negative coefficient) effects exceeding $50 PBPQ. Compared with last year’s results, the increased sample size seems to have drawn most coefficient estimates closer to zero. The health IT effect is also much smaller than before, but that may also have to do with the more refined and specific definition of health IT that we used in this year’s analysis. When interpreting these coefficients, it is important to keep in mind that most components are not found in isolation and that impacts are larger when certain components (like health IT and medical homes) are combined in the same innovation.
One of the long-standing concerns with meta-regression in this project has been whether enough evaluations will be available to permit us to detect substantively important effects for system delivery components and other intervention features. For the 72 evaluations used here, the standard errors for most of the components are around $100 PBPQ or less, which means that our analysis is sufficiently powered to detect component effects of $200 PBPQ or more. Low prevalence components like telemedicine and workflow redesign will always have less precision. In general though, our analysis is capable of detecting noteworthy feature impacts when they exist, though some impactful features may go undetected.
Controlling for the six other implementation features in the model, interventions with a rural health focus were associated with significantly increased TCOC. Finally, Table 3-12 presents the model for features relevant to implementation. The first four features in this model are characteristics present at the start of the innovation. The next two features are potential problems during the early implementation period—patient recruitment problems (37% of the interventions reported barriers to recruitment) and staff-related turnover issues (mean rating of 23.4 on a 0 [not a challenge] to 100 [major challenge] scale). The model also considers the potential influence of receiving a no-cost extension (nearly half of the awardees received an extension).
Interventions that had a rural health focus had quarterly expenditures averaging $160 more than the level in comparison groups. None of the other effects was as large as $50 PBPQ. However, all four pre-innovation measures in the model had zero-order correlations with TCOC exceeding 0.20 and it appears that some of these features may be related to each other. We revisit this model in the next section, adding other features, and expanding it to encompass care utilization effect sizes.
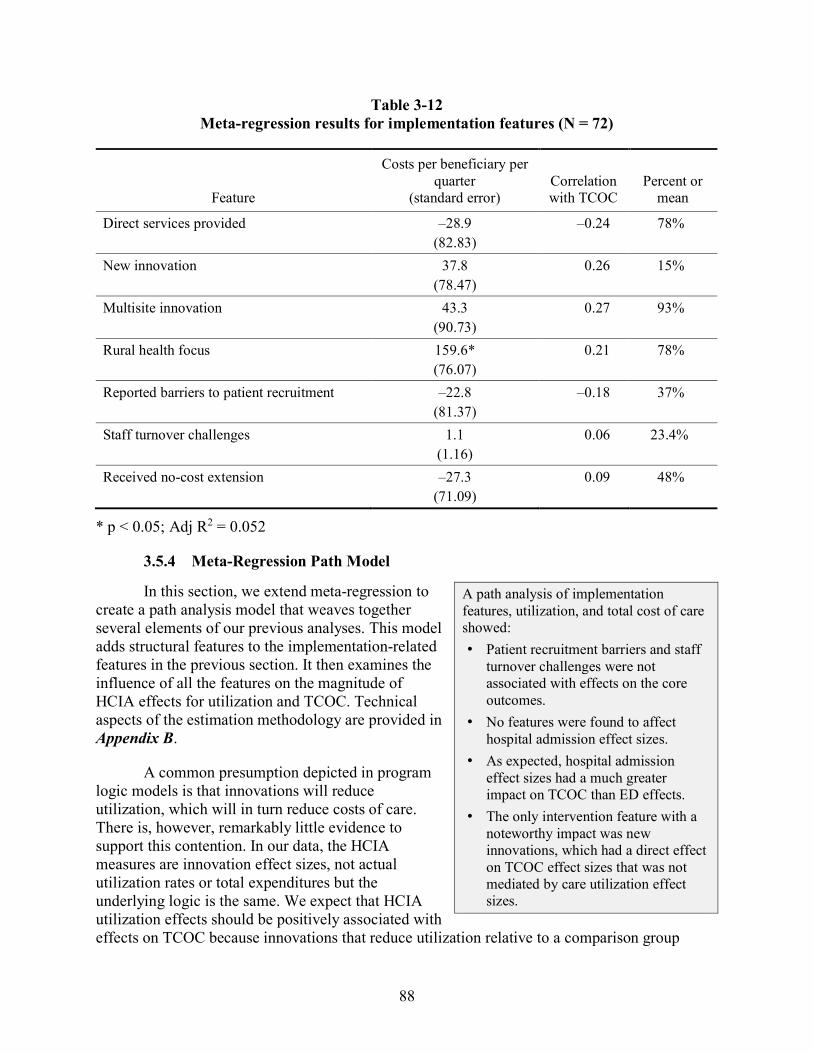
88
Table 3-12 Meta-regression results for implementation features (N = 72)
Feature
Costs per beneficiary per quarter
(standard error) Correlation with TCOC
Percent or mean
Direct services provided –28.9 (82.83)
–0.24 78%
New innovation 37.8 (78.47)
0.26 15%
Multisite innovation 43.3 (90.73)
0.27 93%
Rural health focus 159.6* (76.07)
0.21 78%
Reported barriers to patient recruitment –22.8 (81.37)
–0.18 37%
Staff turnover challenges 1.1 (1.16)
0.06 23.4%
Received no-cost extension –27.3 (71.09)
0.09 48%
* p < 0.05; Adj R2 = 0.052
3.5.4 Meta-Regression Path Model
In this section, we extend meta-regression to create a path analysis model that weaves together several elements of our previous analyses. This model adds structural features to the implementation-related features in the previous section. It then examines the influence of all the features on the magnitude of HCIA effects for utilization and TCOC. Technical aspects of the estimation methodology are provided in Appendix B.
A common presumption depicted in program logic models is that innovations will reduce utilization, which will in turn reduce costs of care. There is, however, remarkably little evidence to support this contention. In our data, the HCIA measures are innovation effect sizes, not actual utilization rates or total expenditures but the underlying logic is the same. We expect that HCIA utilization effects should be positively associated with effects on TCOC because innovations that reduce utilization relative to a comparison group
A path analysis of implementation features, utilization, and total cost of care showed: • Patient recruitment barriers and staff
turnover challenges were not associated with effects on the core outcomes.
• No features were found to affect hospital admission effect sizes.
• As expected, hospital admission effect sizes had a much greater impact on TCOC than ED effects.
• The only intervention feature with a noteworthy impact was new innovations, which had a direct effect on TCOC effect sizes that was not mediated by care utilization effect sizes.

89
should also experience a relative reduction in costs. The path analysis framework also enables us to simultaneously consider the impact of each type of utilization on cost effects.
The estimated path model with standardized coefficients is shown in Figure 3-24. Standardized coefficients may range from -1 to 1, with zero indicating no relationship and -1 and 1 indicating perfect negative and positive relationships, respectively. Effects in the model flow from the features at the far left, through the barrier, no-cost extension, and turnover measures to hospital and ED utilization, and ultimately to the TCOC effect size, which is a negative dollar value for innovations exhibiting estimated savings, and a positive value for dissavings. We do not include hospital readmission effects, because they are subsumed under all hospital admissions and are not evaluated by some awardees. Estimates are based on 65 ambulatory care setting interventions that had complete data; we dropped seven of the interventions used in the previous sections because they did not report utilization effects.
Two structural features with effects exceeding $150 PBPQ in the previous analysis (Table 3-10, Medicare payer and for-profit status) were added to the implementation features model (Table 3-12). A base model, which restricted the right half of the model to paths from recruitment barriers and turnover challenges to utilization and utilization to cost effects, did not fit the data well. In the absence of theoretical hypotheses, we examined modification indices to suggest features that might be influential for utilization effects. The final version of the model depicted in Figure 3-24 provided a better, but still marginal fit to the data (RMSEA = 0.127; 90% CI = 0.069–0.184; Comparative Fit Index = 0.930), although all features were allowed to influence the intermediate variables. For clarity, the left side of the model has been trimmed to display only paths with beta coefficients exceeding 0.20 in absolute value, nearly all of which were statistically different from zero at p < 0.05. In other words, although other paths are tested in the model, only the substantial and statistically significant relations are displayed.
The left side of the model contains relationships among the implementation feature-related measures. Most interventions delivered services directly to patients, and these were less likely to be new interventions to the awardee organization. Patient recruitment barriers were reported more often by awardee organizations with for-profit tax status and less often by innovations focused exclusively on Medicare FFS beneficiaries. Interventions experiencing patient recruitment problems were far more likely to receive a no-cost extension, while interventions providing direct patient services were less likely to receive one. Four features affected FLEs’ rating of staff turnover challenges. Frontline staff turnover or vacancies were less of a challenge for interventions with a rural health focus, that received no-cost extensions, and that had patient recruitment problems, and more of a challenge for awardee organizations with for-profit sites. Multisite status, a characteristic of 95% of all intervention, was not linked to any of the other features in the path model.

90
Figure 3-24 Path model of implementation features, utilization, and TCOC effects
(N = 65 ambulatory care setting innovations)
The hypothesis that patient recruitment and staff turnover would impact utilization was not supported by the path analysis. None of the features tested were found to be associated with hospitalization rates. ED utilization effects, on the other hand, showed greater reductions for interventions that provided direct services to patients but lower reductions for interventions that were new to the awardee organization or that had a rural health focus. The far-right side of the model summarizes the relationships among the effect sizes for the core measures. As previously identified, hospital admission effect sizes have a much bigger impact on TCOC effects (beta = 0.68) than ED utilization effect sizes (beta = 0.10). Using unstandardized coefficients, total costs were estimated to fall by $135 PBPQ for every decline of 10 beneficiaries per 1,000 in hospital admission rates (p < 0.000), but to decrease by only $12 PBPQ for a decline of 10 ED visits per 1,000 (p = 0.248). This is to be expected because hospitalization costs are typically much higher than ED costs in the Medicare population.
Most importantly, these results show that interventions that were new to awardee organizations directly affected TCOC effects (beta = 0.40) in a manner that was not mediated by utilization. This feature appears to be the only feature that plays a role in explaining the variability in core outcomes within the HCIA portfolio. Interventions providing direct services to
.75
Direct Services
Rural
For Profit
Medicare
Multisite
New Innovation
NCE
Recruitment Barriers
Hospital Effect
TCOC Effect
ED Effect
Turnover Challenges
-.48.21
-.25
.31
.40
.68
.10
-.21
.44
-.38
-.22-.39
.25-.57
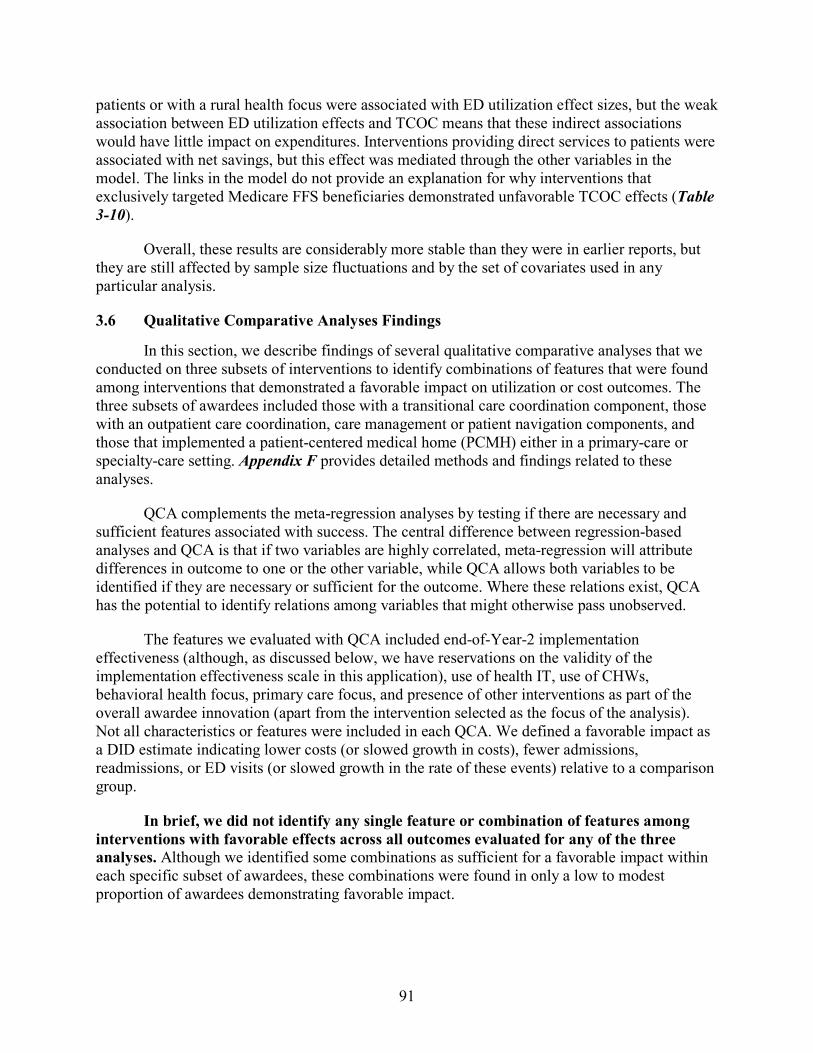
91
patients or with a rural health focus were associated with ED utilization effect sizes, but the weak association between ED utilization effects and TCOC means that these indirect associations would have little impact on expenditures. Interventions providing direct services to patients were associated with net savings, but this effect was mediated through the other variables in the model. The links in the model do not provide an explanation for why interventions that exclusively targeted Medicare FFS beneficiaries demonstrated unfavorable TCOC effects (Table 3-10).
Overall, these results are considerably more stable than they were in earlier reports, but they are still affected by sample size fluctuations and by the set of covariates used in any particular analysis.
3.6 Qualitative Comparative Analyses Findings In this section, we describe findings of several qualitative comparative analyses that we
conducted on three subsets of interventions to identify combinations of features that were found among interventions that demonstrated a favorable impact on utilization or cost outcomes. The three subsets of awardees included those with a transitional care coordination component, those with an outpatient care coordination, care management or patient navigation components, and those that implemented a patient-centered medical home (PCMH) either in a primary-care or specialty-care setting. Appendix F provides detailed methods and findings related to these analyses.
QCA complements the meta-regression analyses by testing if there are necessary and sufficient features associated with success. The central difference between regression-based analyses and QCA is that if two variables are highly correlated, meta-regression will attribute differences in outcome to one or the other variable, while QCA allows both variables to be identified if they are necessary or sufficient for the outcome. Where these relations exist, QCA has the potential to identify relations among variables that might otherwise pass unobserved.
The features we evaluated with QCA included end-of-Year-2 implementation effectiveness (although, as discussed below, we have reservations on the validity of the implementation effectiveness scale in this application), use of health IT, use of CHWs, behavioral health focus, primary care focus, and presence of other interventions as part of the overall awardee innovation (apart from the intervention selected as the focus of the analysis). Not all characteristics or features were included in each QCA. We defined a favorable impact as a DID estimate indicating lower costs (or slowed growth in costs), fewer admissions, readmissions, or ED visits (or slowed growth in the rate of these events) relative to a comparison group.
In brief, we did not identify any single feature or combination of features among interventions with favorable effects across all outcomes evaluated for any of the three analyses. Although we identified some combinations as sufficient for a favorable impact within each specific subset of awardees, these combinations were found in only a low to modest proportion of awardees demonstrating favorable impact.

92
3.6.1 Transitional Care Coordination Interventions
We included 32 interventions and evaluated the following features in this analysis:
• Implementation effectiveness (effective vs. ineffective)
• Health IT (use vs. no use)
• CHWs (use vs. no use)
• Other components (presence vs. absence of other interventions beyond the transitional care coordination intervention).
We identified no necessary conditions for a favorable impact on TCOC, readmissions, or ED use. We did not conduct analyses for the admissions outcome, as transitional care coordination interventions would not be expected to influence all-cause admissions independent of their effect on readmissions. We identified several combinations that were each sufficient for a favorable impact on TCOC, readmissions, and ED use (Table 3-13). Although the combinations we identified were perfectly consistent (i.e., all awardee interventions with these combinations demonstrated a favorable effect for the respective outcome), these combinations accounted for a small proportion of cases that demonstrated a favorable impact (i.e., poor coverage). Further, we identified unique combinations of features for each of the three outcomes, and the cases covered by these combinations were different across the outcomes.
The awardee cases covered by the identified combination demonstrating a favorable impact on TCOC were diverse and included the Women & Infants Hospital of Rhode Island, Courage Kenny Rehabilitation Institute, and Mount Sinai School of Medicine. The Women & Infants Hospital of Rhode Island targeted high risk neonates and was delivered by a team of staff, including nurse practitioners, social workers, and included a lay parent peer as the CHW, whereas the Courage Institute provided transitional care coordination intervention as one of several interventions provided as part of an overall PCMH intervention in a neuromuscular rehabilitation specialty setting for patients with neuromuscular disabilities and stroke. The Mount Sinai School of Medicine implemented structural enhancements and geriatric clinical protocols in the ED, include a transitional care team for geriatric patients in the ED.
Only one awardee case was covered by the combination demonstrating a favorable impact on readmissions: Atlantic General Hospital implemented an isolated transitional care coordination interventions in which patients received weekly phone calls for the first 30 days after discharge. Patients with additional needs were referred for home visits, and providers for patients at high risk for readmission were notified.

93
Table 3-13 Sufficient combinations of features found among transitional care coordination
interventions that demonstrated a favorable effect, findings from a qualitative comparative analysis of the Health Care Innovation Awardees Round One
Outcome (Number of
Cases) Sufficient Combination of Features Identified Parameters of Fita
Total cost of care (30)
1. Ineffective implementation AND use of health IT AND not using CHWs AND presence of other components
2. Effective implementation AND absence of health IT AND use of CHWs AND presence of other components
Consistency 1.00 Coverage 0.267
Readmissions (21)
Effective implementation AND absence of health IT Consistency 1.00 Coverage 0.167
Emergency department use (32)
1. Use of health IT AND use of CHWs 2. Effective implementation AND the use of health IT AND
presence of other components
Consistency 1.00 Coverage 0.250
a Parameters of fit refer to consistency and coverage values. Consistency refers to the proportion of cases with the combination of features listed that demonstrate a favorable impact. Each combination of features that comprises the overall solution has a consistency value, as does the overall solution. Consistency can range from 0 to 1.0 and values ≥ 0.8 are generally interpreted as strongly sufficient. Coverage refers to the proportion of cases that demonstrated a favorable impact that has the combination of features. This parameter is only interpreted for conditions with high consistency and can range from 0 to 1.0 with higher values suggesting more empirical relevance of the combination.
Two of the four awardee cases covered by the combinations demonstrating a favorable impact on ED use were focused on pediatric populations: duPont Hospital for Children provided transitional care coordination as part of a larger care management innovation focused on pediatric asthma, while Nationwide Children’s Hospital provided transitional care coordination services to two distinct pediatric populations (children with complex needs such as feeding tubes or with tracheostomies, and children admitted for behavioral health needs). The other two awardee cases focused on adult patients. Christiana Care Health Services provided a transitional care coordination intervention that included tiered services based on risk, while the Methodist Hospital provided transitional care coordination services as part of a broader care management innovation focused on care management and workflow/process redesign to improve care related to delirium.
3.6.2 Outpatient Care Coordination, Care Management, or Patient Navigation Interventions
We included 50 interventions and evaluated the following features in this analysis:
• Implementation effectiveness (effective vs. ineffective)
94
• Health IT (use vs. no use)
• CHWs (use vs. no use)
• Behavioral health focus (presence vs. absence)
• Other components (presence vs. absence of other interventions beyond the outpatient care coordination intervention)
We identified no necessary conditions for a favorable impact on TCOC, admissions, or ED use. We did not conduct analyses for the readmissions outcome, as outpatient care coordination interventions would not be expected to influence readmissions independent of their effect on admissions. We identified several combinations that were each sufficient for a favorable impact on outcomes (Table 3-14). Although the combinations we identified were highly consistent (i.e., most awardee interventions with these combinations demonstrated a favorable effect), these combinations collectively accounted for only a little over half of the interventions that demonstrated a favorable effect (i.e. modest coverage).
Table 3-14 Sufficient combinations of features found among outpatient care coordination, care
management, or patient navigation interventions that demonstrated a favorable effect, findings from a qualitative comparative analysis of the Health Care Innovation Awardees
Round One
Outcome (Number of cases) Sufficient combination of features identified Parameters of fita
Total cost of care (48)
1. Use of CHWs AND use of health IT AND presence of other components
2. Ineffective implementation AND use of health IT AND presence of other components AND no behavioral health focus
3. Ineffective implementation AND no use of health IT AND use of CHWs AND no other components AND no behavioral health focus
Consistency 0.875 Coverage 0.609
(continued)

95
Table 3-14 (continued) Sufficient combinations of features found among outpatient care coordination, care
management, or patient navigation interventions that demonstrated a favorable effect, findings from a qualitative comparative analysis of the Health Care Innovation Awardees
Round One
Outcome (Number of cases) Sufficient combination of features identified Parameters of fita Admissions (46)
1. Use of health IT AND use of CHWs AND absence of other components AND behavioral health focus
2. Ineffective implementation AND no use of health IT AND use of CHWs AND absence of other components AND no behavioral health focus
3. Ineffective implementation AND use of health IT AND no use of CHWs AND presence of other components AND no behavioral health focus
4. Effective implementation AND no use of health IT AND use of CHWs AND presence of other components AND behavioral health focus
5. Effective implementation AND use of health IT AND no use of CHWs AND presence of other components AND no behavioral health focus
Consistency 0.923 Coverage 0.632
Emergency department use (47)
1. No use of health IT AND use of CHWs AND absence of other components used AND no behavioral health focus
2. Ineffective implementation AND no use of health IT AND use of CHWs AND no behavioral health focus
3. Ineffective implementation AND no use of health IT AND no use of CHW AND presence of other components AND behavioral health focus
4. Ineffective implementation AND use of health IT AND use of CHW AND absence of other components AND behavioral health focus
5. Effective implementation AND use of health IT AND no use of CHWs AND absence of other components AND behavioral health focus
6. Effective implementation AND use of health IT AND no use of CHWs AND presence of other components AND no behavioral health focus
Consistency 0.929 Coverage 0.619
a Parameters of fit refer to consistency and coverage values. Consistency refers to the proportion of cases with the combination of features listed that demonstrate a favorable impact. Each combination of features that comprises the overall solution has a consistency value, as does the overall solution. Consistency can range from 0 to 1.0 and values ≥ 0.8 are generally interpreted as strongly sufficient. Coverage refers to the proportion of cases that demonstrated a favorable impact that have the combination of features. This parameter is only interpreted for conditions with high consistency and can range from 0 to 1.0 with higher values suggesting more empirical relevance of the combination.

96
In contrast to the transitional care coordination interventions, awardee cases covered by the combinations identified were not unique across the three outcomes. Four awardee cases were covered by one or more sufficient combinations that was identified for total cost of care, admissions, and ED use. These included two awardees that targeted pediatric populations (Children’s Hospital and Health System and LeBonheur Community Health) and two awardees that targeted adult patients (Michigan Public Health Institute [Medicaid Population] and University Emergency Medical Services). All four awardees used CHWs as part of their interventions and none of the interventions included a behavioral health focus, used any other components as part of the intervention, or used health IT as a significant part of the intervention. Frontline evaluators all reported ineffective implementation for these interventions (as of Year 3). Children’s Hospital implemented a patient navigation intervention focused on targeting high utilizers and getting them into routine care whereas LeBonheur implemented a care management intervention for children with asthma that included coordination with schools and home visits to mitigate environmental triggers. Both Michigan Public Health Institute and the University Emergency Medical Services implemented patient navigation interventions provided by CHWs; however, the models for deployment were quite different. In the former, CHWs were either embedded within the health care systems or were embedded within community agencies. In the latter, CHWs were deployed specifically within the ED setting to facilitate better access to primary care services by frequent ED utilizers.
3.6.3 Patient-Centered Medical Home (PCMH) Interventions
We included 16 interventions and evaluated the following features in this analysis:
• Behavioral health focus (presence vs. absence)
• Primary care focus (presence vs. specialty care focus)
• Other components (presence vs. absence of other interventions beyond the PCMH intervention)
We identified no necessary conditions for a favorable impact on TCOC, admissions, readmissions, or ED use. We identified several combinations that were each sufficient for a favorable impact on TCOC, readmissions, and ED use but we did not identify any combinations sufficient for a favorable impact on admissions (Table 3-15). Although the combinations we identified were perfectly consistent (i.e., all awardee interventions with the combinations identified demonstrated a favorable effect), these combinations accounted for only half to three-quarters of the interventions that demonstrated a favorable effect (i.e., modest coverage).
Two awardee cases were covered by one or more sufficient combinations that was identified for TCOC, readmissions, and ED use. Innovative Oncology Business Solutions supported the practice transformation of community oncology practices to PCMHs; specifically, this awardee implemented clinical decision support within EHRs for seven types of cancers, offered same-day scheduling and extended office hours, and added nurse triage capabilities. In contrast, Sanford Health focused on behavioral health and primary care integration, including team care and standardized care for chronic conditions. This awardee case also expanded EHR capabilities to support new workflows.

97
Table 3-15 Sufficient combinations of features found among patient-centered medical home
interventions that demonstrated a favorable effect, findings from a qualitative comparative analysis of the Health Care Innovation Awardees Round One
Outcome (Number of cases) Sufficient combination of features identified Parameters of fita
Total cost of care (14)
Presence of other components AND behavioral health focus AND no primary-care focus
Consistency 1.000 Coverage 0.500
Admissions (15)
None identified —
Readmissions (7)
1. No behavioral health focus AND no primary care focus 2. Presence of other components AND no behavioral health
focus 3. Absence of other components AND behavioral health
focus AND primary care focus
Consistency 1.000 Coverage 0.750
Emergency department use (15)
Absence of other components AND behavioral health focus Absence of other components AND no primary care focus
Consistency 1.000 Coverage 0.500
a Parameters of fit refer to consistency and coverage values. Consistency refers to the proportion of cases with the combination of features listed that demonstrate a favorable impact. Each combination of features that comprises the overall solution has a consistency value, as does the overall solution. Consistency can range from 0 to 1.0 and values ≥ 0.8 are generally interpreted as strongly sufficient. Coverage refers to the proportion of cases that demonstrated a favorable impact that have the combination of features. This parameter is only interpreted for conditions with high consistency and can range from 0 to 1.0 with higher values suggesting more empirical relevance of the combination.
3.6.4 Discussion
Although we were able to identify highly consistent sufficient combinations of features found among awardee interventions that exhibited a favorable impact, the data did not support the identification of a consistent combination of features across all outcomes evaluated in any of the three subsets of awardees. This suggests that features beyond what we evaluated with the QCA may be more important drivers for the outcomes evaluated, and that some interventions may have a larger impact on some outcomes relative to others.
In each of the three analyses we conducted, most combinations identified as sufficient covered only a few awardees, and overall solution coverage was poor to modest for all analyses. This suggests that the features we evaluated may be too coarse for representing important differences amongst interventions that would contribute to favorable impacts. This is a direct consequence of the heterogeneity of interventions evaluated, which required broad characterization of interventions to enable synthesis of findings across the portfolio. Further, highly consistent sufficient combinations coupled with poor to modest coverage within each of

98
the three analyses also suggests that intervention heterogeneity likely persists even when analyses are limited to subsets of awardees who are implementing “similar” interventions.
Implementation ineffectiveness was a feature found among several sufficient combinations of features in the first two of the three analyses, and may seem counterintuitive as typically interventions must be effectively implemented for a favorable effect to be observed. Several explanations for this phenomenon exist, and we advise against overinterpretation of this finding. Based on earlier analyses presented in our second annual report, we believe our measure of implementation effectiveness was not optimal as it was based on frontline evaluator self-report, was highly skewed, and required dichotomization to be used in this analysis. Further, measures of implementation effectiveness may need to be intervention specific, which was challenging in this project because of the heterogeneity of interventions evaluated. Thus, this measure may have been too crude to capture implementation effectiveness across the diverse kinds of interventions evaluated. Development of intervention-specific, psychometrically robust measures of implementation effectiveness will be needed for future analyses.
Limitations of these analyses include limited diversity (i.e., actual cases do not exhibit all the theoretically possible combinations of features) and model ambiguity for some outcomes in some analyses (see Appendix F for details). Lastly, we defined “favorable impact” solely based on the direction of the DID effect relative to a comparison group. We did not consider magnitude and did not require the DID estimate to be statistically significant, as few awardee interventions would have met this criterion; thus, the findings from these analyses may offer ideas for future intervention design but should be interpreted with caution.
3.7 Supplementary Methodological Analyses
In addition to the primary analyses reported above, we also conducted several supplementary analyses to determine the extent to which our results might be affected by applying different analysis methods. These analyses and findings are detailed in three appendices.
The supplementary analyses indicated that:
• The majority of evaluations used propensity score matching to create their comparison groups. We found that 33% of the nonrandomized innovations had a risk of biased effects due largely to the way they recruited their treatment groups and that 35% had some degree of covariate imbalance remaining after propensity score adjustments. However, in a multivariate analysis of TCOC effects, none of these characteristics—type of comparison group, bias risk, or degree of covariate imbalance—had a major impact on the magnitude of HCIA innovation effects. (Appendix A).
• Our analysis of comparative interrupted times series (CITS) showed that CITS estimates for TCOC effects were strongly correlated with FLE DID estimates (r = 0.64), but only 72% of the CITS values were within $374 of the DID estimate, and 67% were within the 90% confidence interval for the corresponding DID estimate (Appendix D). This suggests that CITS estimates may not be acceptable surrogates for DID analyses in as many as one third of the evaluations in an initiative like HCIA. These analyses suggest DID may be a more robust

99
metric for assessing relative change over time when strong dependencies over time are not anticipated.
• A Bayesian fixed-effects meta-analysis yielded nearly identical results with respect to estimated effects and confidence intervals as the more conventional frequentist analysis (Appendix E).
100
SECTION 4 SUMMARY
4.1 Standardized information is needed to conduct informative meta-analyses.
One lesson from this project is the importance of collecting information from FLEs and awardees in a standardized way. Although FLE reports were helpful in highlighting major implementation and process themes, they often did not provide awardee-specific information to fully characterize the intervention that was implemented or the full range of issues awardees faced and the extent to which they experienced them. Moreover, information was not presented in a uniform way by different FLEs. Our responses to these shortcomings were to 1) conduct structured coding of all FLE reports to apply standard criteria for determining intervention and implementation features, 2) develop annual surveys to gather detailed systematic information from FLEs about their perceptions of awardee performance and challenges, and 3) design a template for FLEs to report quarterly outcome data. Future evaluations may benefit from this kind of standardized data collection.
4.2 Most innovations were perceived by FLEs to have been implemented effectively, but adaptation was often instrumental in achieving implementation effectiveness.
For many awardees, enrolling patients, building partnerships and forging relations among staff, and implementing their innovations was a far greater challenge than was expected. However, awardees were largely able to meet these and other challenges and to effectively implement their innovations by adjusting their enrollment strategies; taking time to build trust, respect, and appreciation among partners and staff; and adapting their innovations.
For the 77 of 135 interventions that identified health IT as a challenge in implementing their intervention, by the end of the second year, the majority of those challenges were rated modest or small by FLEs. In the second year, health IT systems supporting interventions were refined to better reflect workflow needs and were increasingly integrated with existing health IT systems. With these adaptations, staff increasingly recognized and appreciated the added value of health IT.
Integrating community health workers and other non-licensed staff was a challenge that followed a similar trajectory as health IT. Early in their innovations, approximately half of innovations using CHWs were challenged by integrating non-licensed staff into their existing clinical teams and workflows. Role clarification and delineation of responsibilities helped existing staff accept non-traditional workers. Awardees using CHWs quickly learned the importance of hiring non-licensed staff with the right temperament and training to meet role demands. Combined, these adaptations increased staff appreciation of CHWs for their contributions in improving workflow and connecting with patients. For some awardees, a continuing challenge was obtaining reimbursement for services provided by these non-licensed health care workers.
Although intervention adaptation is a central component of learn-as-you-go innovations, it creates a challenge for evaluation and effective dissemination. If the intervention being tested is changing and adapting, specifying what intervention was actually tested may be difficult. If the adaptation is specific to local conditions, then results from the tested model may not be

101
comparable for evaluation purposes, and may not generalize to other settings. Clearly specifying the core components of the intervention in advance and limiting adaptations to only those that improve core component delivery may improve the generalizability of intervention results.
4.3 Few direct drivers of effective implementation were identified, and implementation effectiveness did not predict differences in total cost of care.
To examine the innovation features associated with effective implementation, we collected data using constructs identified in the literature as associated with implementation effectiveness. However, few of these features were found to be systematically associated with effective implementation in our analyses of HCIA interventions. This is likely because of the great variety of interventions tested, the diversity of settings in which they were implemented, and the disparate populations and conditions addressed by awardees. These features may intersect uniquely to create inconsistent implementation challenges and opportunities across awardees. Further, the diversity of interventions required the use of implementation effectiveness measures that could be applied across the portfolio resulting in measures with less specificity for any specific intervention. In addition, implementation effectiveness was measured from the perspective of the FLE, which may have been inconsistently applied across the FLE portfolios. Despite these limitations, our multivariate model indicated that implementing innovations in a single site was associated with greater implementation effectiveness, as was robust implementation planning (developing protocols, timelines, and, in particular, staffing plans), which are findings consistent with most theories about what drives effective implementation.
Awardees also identified existing organizational capacity as an important determinant of rapid and successful health care transformation. Across multiple measures of organizational capacity (e.g., resources; having experienced staff and established partnerships; having a robust health IT, administrative, and technical-support infrastructure), awardees with existing capacity achieved greater success in rapidly implementing their innovations, saw full adoption of the innovation by staff, and were able to deliver innovation components at the intended level of intensity and frequency and at the prescribed level of quality.
4.4 Scaling and sustainability became an increased focus as innovations matured.
Innovations being implemented in multiple sites were perhaps most attune to the need to test and refine innovation components for dissemination, but many awardees realized the need to streamline training, making it more replicable and less resource intensive, and to adjust the scope of their innovations to ensure sustainability. Innovations in large provider organizations that were successful in integrating their innovation into the workflow tended to be successful in securing at least temporary internal funding to sustain their innovations. Ultimately, however, most innovations will have to rely on external funding to sustain their efforts and have turned to grants, donations, and other payment reform initiatives to obtain the necessary funds. A few innovations have begun charging dues or fees from partner sites, or are selling their training model to support the innovation.
For many of the awardees, the lack of reimbursement for care coordination services and unlicensed staff roles is a key challenge to the sustainability of their innovation. Non-clinical staff, such as health coaches, patient navigators, and CHWs were integral to many HCIA innovations and are unable to bill for the many care coordination services they provide. The

102
inability of certain health care professionals to bill for health care services related to chronic disease or care management is the principal impediment to the sustainability of many HCIA innovations. However, a few awardees noted that evolving payment reform could present a viable funding source for these types of staff and services in the future.
A few awardees considered the needs of sustainability early in their innovations, but for many, the challenges of sustaining their innovations beyond CMS funding became apparent only in the final year of their award. Although most have at least temporary support to continue their innovations, it may be prudent to encourage future innovation awardees to actively seek sustaining support for their innovations earlier in their award periods. Subsequent HCIA awardees were encouraged to focus on payment model development as another possible route to sustainability.
4.5 Additional work is needed to expand the pool of innovation features.
One of the primary objectives of this project has been to identify innovation “features” that affect expenditures and utilization, especially those that might be subject to policy manipulation or that would help identify future applicants with the best chances for implementing successful interventions. Recognizing the shortcomings of annual reports, we designed and administered two surveys to FLEs to expand the pool of features we could investigate. We also developed and refined a structured coding scheme to systematically describe, using common labels and definitions, each awardee’s intervention components and features. Three different clusters of these features were used in our meta-regressions.
Our most comprehensive analysis is the path model that pulls features from several areas and links them to both utilization and TCOC effects. This model confirms the presumption that HCIA effects for hospital admissions have the greatest impact on TCOC effect sizes, and that the impact of ED utilization on TCOC is much smaller. Taken together, three variables directly related to TCOC (hospital utilization, ED utilization, and implementing an intervention that was new to the awardee organization) explained 70% of the variation in this outcome. However, we found no features that directly affected hospitalization effect sizes. Most features were correlated among one another, but neither patient recruitment problems nor staff turnover challenges influenced the core outcomes.
One reason for the lack of robust findings may be measurement error, which would lead to underestimates of feature effects. Measurement for some of the features we used were ratings made by FLEs completing our annual surveys. These are summary ratings made at the overall awardee level. We know that many FLEs were uncomfortable making these ratings because it required them to rate awardees based on the small number of sites they were familiar with through site visits. One option here would be to sample individual sites, have staff complete site-specific surveys, and then treat each implementation site separately in analysis.
Finally, we may be missing patient-level variables that affect outcomes. Our features are measures of innovation-level characteristics. However, there are likely specific patient characteristics such as gender or chronic disease status that produce heterogeneous treatment effects. Assessing the impact of patient characteristics would necessitate a shift to individual patient data (IPD) files that pool information from all the innovations.

103
4.6 HCIA effects on TCOC do not appear to have been distorted by selection bias or comparison groups methods.
All observational studies carry the potential for biased estimates of intervention effects. For this report, we conducted an extensive review of the methods FLEs used to create comparison groups for their analyses. We also reviewed the protocols used to recruit intervention group participants to assess the potential for biased intervention effect estimates.
FLEs overwhelmingly used propensity score matching to create comparison groups. Various forms of propensity score weighting were employed in only 11% of the evaluations. We identified a potential risk of bias, usually in a favorable direction, in 35% of the innovations. In a multivariate model of TCOC effects, we found that all suspected threats—risk of bias, weighting vs. matching, patient recruitment problems, and covariate imbalance—had negligible impacts on the HCIA effects reported by FLEs. Sixty-five percent of the evaluations achieved balance for all the covariates they used in their propensity models. These results indicate that the DID effects reported by FLEs are unlikely to be systematically biased by the way comparison groups were constructed or by the way intervention groups were selected.
4.7 The HCIA sample is adequate for conducting meta-regression with adequate precision.
Some researchers have expressed concerns with meta-regression because of small sample sizes and perceived limitations on the number of explanatory variable that can be employed. We believe the focus should be on the precision of coefficient estimates. Standard errors for most of the binary innovation features in our meta-regressions were below $100, indicating that our models were capable of detecting TCOC effects on the order of $175 PBPQ or more, or about 7% of the average quarterly costs of care for a Medicare beneficiary.
There was also considerable variation across awardees in the inverse variance weights used in meta-analysis. These weights are a function of sample size (i.e., the number of awardees included in the DID estimate). Meta-regression results tend to be very sensitive to these weights, which we capped to avoid giving undue influence to very large interventions. It is also apparent that coefficient precision is sensitive to the prevalence of a characteristic and to correlations among the explanatory variables. All of these factors need to be monitored when conducting meta-regression.
4.8 The weighting methods used by FLEs have implications for summary results.
Our forest plots and meta-regressions are based on the outcome effect sizes and standard errors reported by FLEs. Most FLEs relied on propensity score matching (PSM) to create comparison groups. In 87 evaluations using PSM, nearly half used 1-to-1 matching, and the other half did many-to-1 matching (choosing multiple comparison group members for each member of the intervention group). Some comparisons were also used for different intervention members. In all cases of many-to-1 matching, comparison beneficiaries were downweighted to make it appear that the comparison group was the same size as the intervention group. We see no statistical justification for downweighting because it is not a probability-based adjustment and does not take into consideration the closeness of the match. These comparison groups contained more information than their downweighted sample sizes would suggest. In addition, most evaluations

104
generated robust standard errors by adjusting for clustering effects. The rationale for the choice of a clustering variables was rarely revealed, but it was clear that this choice could have a dramatic impact on effect precision. In one evaluation, the estimated standard error for an outcome was several times higher when the clustering was done by provider rather than by patient.
Downweighting and clustering alter the standard errors of estimates. This affects not only the way awardees are depicted in forest plots, but also awardee weights and therefore the relative importance of individual interventions in meta-regression analyses. If there is a desire for future evaluations to contribute to cross-evaluation summaries, guidance on and requirements to use standard methods for PSM would create more comparable effect size and variance estimates.
4.9 Final reports should document all changes in methodology
There were substantial changes in evaluation methods during the final years for some innovations, including modifications in recruitment protocols, shifts in time periods, and altered comparison groups. We discovered many of these only when comparing reports and results from different years. These changes were rarely documented because most FLEs did not update their methodology sections, especially after a no-cost extension period. Our meta-analyses are based on the cumulative results at the end of 3 to 4 years of intervention, and the final reports should reflect the methods that were used to derive the final summary effects. The hallmark and distinguishing feature of scientific investigation is the specification of methods used to create findings. This allows other scientist to judge the quality of the work that was conducted and the veracity of the findings obtained. As noted, changing methods changed the impact estimates of a few awardees. Study methods have explained as much as 25% of the variation in results in other meta-analysis (Lipsey, 1997). A meta-evaluation can test for and estimate the impact of study methods on results, but only if the methods used to create the contributing results are consistently and accurately reported.

105
REFERENCES
Center for Medicare & Medicaid Innovation (CMMI). (2011). Health Care Innovation Challenge. Retrieved from http://innovation.cms.gov/Files/x/Health-Care-Innovation-Challenge-Funding-Opportunity-Announcement.pdf
DesRoches, C. M., Campbell, E. G., Rao, S. R., Donelan, K., Ferris, T. G., Jha, A., Kaushal, R., Levy, D. E., Rosenbaum, S., Shields, A. E., & Blumenthal, D. (2008). Electronic health records in ambulatory care—A national survey of physicians. New England Journal of Medicine, 359, 50–60.
Gans, D., Kralewski, J., Hammons, T., & Dowd, B. (2005). Medical groups’ adoption of electronic health records and information systems. Health Affairs, 24(5), 1323–1333.
Hedges, L. V., & Olkin, I. (1985). Statistical methods for meta-analysis. New York: Academic Press.
Higgins, J. P. T., & Green, S. (Eds.). (2011, March). Cochrane Handbook for Systematic Reviews of Interventions Version 5.1.0. The Cochrane Collaboration. Available from www.cochrane-handbook.org
Higgins, J. P. T., & Thompson, S. G. (2002). Quantifying heterogeneity in a meta-analysis. Statistics in Medicine, 21(11), 1539–1558. doi: 10.1002/sim.1186
Higgins, J. P. T., Thompson, S. G., Deeks, J. J., & Altman, D. G. (2003). Measuring inconsistency in meta-analyses. BMJ, 327(7414), 557–560. doi:10.1136/bmj.327.7414.557
Lipsey, M. W. (1997). What can you build with thousands of bricks? Musings on the cumulation of knowledge in program evaluation. New Directions for Evaluation, 76, 7-23. doi:10.1002/ev.1084
Lorenzi, N., Kouroubali, A., Detmer, D. & Bloomrosen, M. (2009). How to successfully select and implement electronic health records (EHR) in small ambulatory practice settings. BMC Medical Informatics and Decision Making, 9, 15.
Ragin, C. C. (2000). Fuzzy-set social science. Chicago: University of Chicago Press.
Schneider, C. Q, & Wagemann, C. (2012). Set-theoretic methods for the social sciences: A guide to qualitative comparative analysis. Cambridge, United Kingdom: Cambridge University Press.
Smith, K. W., Bir, A., Freeman, N. L. B., Koethe, B. C., Cohen, J. & Day, T. J. (2017). Impact of health care delivery system innovations on total cost of care. Health Affairs, 36(3), 509-515.
Yoon-Flannery, K., Zandieh, S. O., Kuperman, G. J., Langsam, D. J., & Kaushal, R. (2008). A qualitative analysis of an electronic health record (EHR) in an academic ambulatory setting. Informatics in Primary Care, 26, 277–284.

106
[This page intentionally left blank.]

107
APPENDIX A: IMPACT OF COMPARISON GROUP CONSTRUCTION METHODOLOGY

108
[This page intentionally left blank.]

109
With the exception of six randomized controlled trials (RCTs), Health Care Innovation Awards (HCIA) awardees implemented non-randomized innovations. To assess the effectiveness of these non-randomized innovations, frontline evaluators (FLEs) constructed comparison groups to serve as the counterfactual to those receiving the intervention. In our second annual report, we presented a summary of the different approaches FLEs used to construct their comparison groups for the HCIA innovations. In this section, we update and expand our summary of the FLE comparison group construction methods and the implications it has for evaluations of total cost of care (TCOC).
A.1 Comparison Group Methods
Most FLEs used propensity scores (PSs) to construct comparison groups for interventions without a randomized control group. A PS is the probability that an individual receives the intervention conditional on observable characteristics (Rosenbaum & Rubin, 1983). The PS summarizes the observable characteristics that might affect treatment status into a single probability (Rubin, 1997). For HCIA, most FLEs use PSs to match treatment beneficiaries to beneficiaries in a pool of potential comparison beneficiaries. Most matching was done based on finding comparison beneficiaries with a PS that fell within a specified range of each treatment beneficiary’s PS (sometimes called a caliper) or by finding comparison beneficiaries with the PS closest to the treatment beneficiary’s PS (often referred to as nearest neighbor matching).
One hundred thirty-four HCIA evaluations had a comparison group to assess the impact of HCIA interventions on at least one of the core four measures (TCOC, hospitalizations, 30-day hospital readmissions, and emergency department [ED] utilization). For each evaluation with a comparison group, we classified the comparison group construction method used by the FLEs into five broad categories:
1. Matching: Matching included interventions with a direct (or exactly) matched comparison group or a PS matched comparison group. Direct matching entails matching beneficiaries directly on characteristics without the use of the PS. Propensity score matching includes caliper matching and nearest neighbor matching.
2. Weighting: Weighting included interventions that used PSs to weight the comparison group in their analyses. Methods included inverse propensity of treatment weights, standardized mortality ratios, and relative weights.
3. RCT: A few HCIA interventions were RCTs with a control group. For these, the FLEs used the randomly selected control group as the counterfactual
4. Other: Some interventions were not RCTs and FLEs did not use matching or weighting to construct their comparison groups.
5. Not reported: In a few cases, FLEs constructed comparison groups and reported estimates for the effect of the HCIA intervention for the treatment group compared to the comparison group but did not include information on how they constructed those comparison groups.
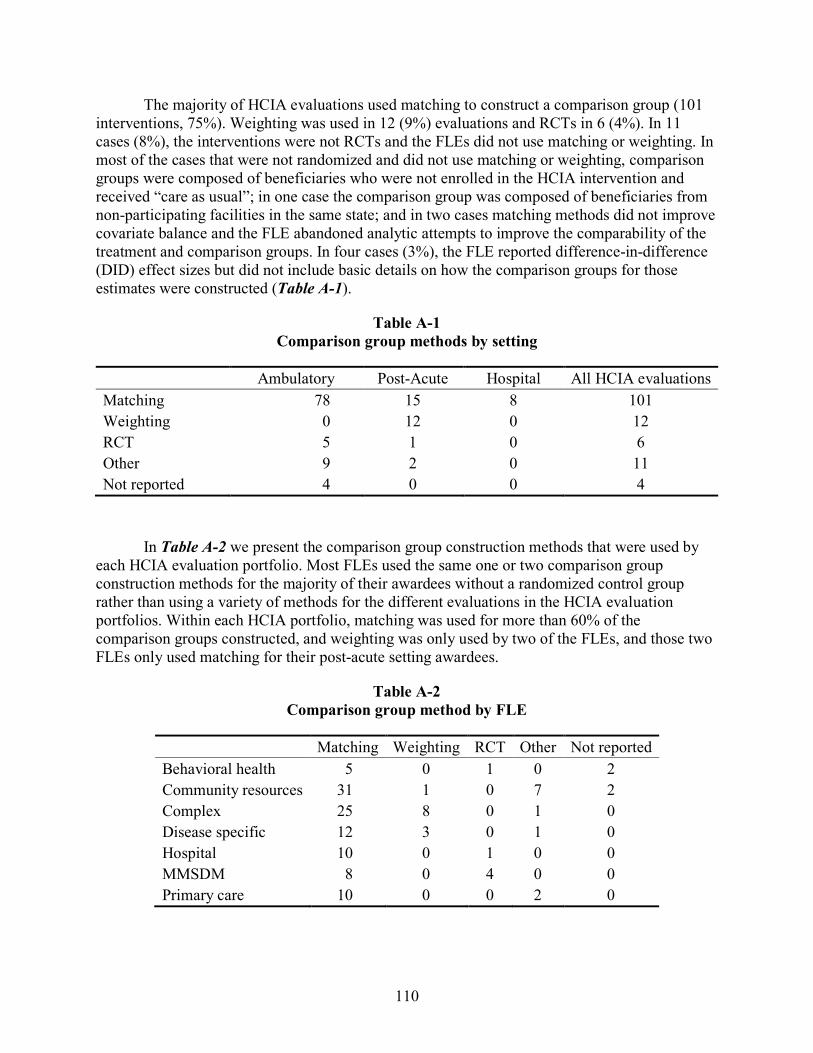
110
The majority of HCIA evaluations used matching to construct a comparison group (101 interventions, 75%). Weighting was used in 12 (9%) evaluations and RCTs in 6 (4%). In 11 cases (8%), the interventions were not RCTs and the FLEs did not use matching or weighting. In most of the cases that were not randomized and did not use matching or weighting, comparison groups were composed of beneficiaries who were not enrolled in the HCIA intervention and received “care as usual”; in one case the comparison group was composed of beneficiaries from non-participating facilities in the same state; and in two cases matching methods did not improve covariate balance and the FLE abandoned analytic attempts to improve the comparability of the treatment and comparison groups. In four cases (3%), the FLE reported difference-in-difference (DID) effect sizes but did not include basic details on how the comparison groups for those estimates were constructed (Table A-1).
Table A-1 Comparison group methods by setting
Ambulatory Post-Acute Hospital All HCIA evaluations Matching 78 15 8 101 Weighting 0 12 0 12 RCT 5 1 0 6 Other 9 2 0 11 Not reported 4 0 0 4
In Table A-2 we present the comparison group construction methods that were used by each HCIA evaluation portfolio. Most FLEs used the same one or two comparison group construction methods for the majority of their awardees without a randomized control group rather than using a variety of methods for the different evaluations in the HCIA evaluation portfolios. Within each HCIA portfolio, matching was used for more than 60% of the comparison groups constructed, and weighting was only used by two of the FLEs, and those two FLEs only used matching for their post-acute setting awardees.
Table A-2 Comparison group method by FLE
Matching Weighting RCT Other Not reported Behavioral health 5 0 1 0 2 Community resources 31 1 0 7 2 Complex 25 8 0 1 0 Disease specific 12 3 0 1 0 Hospital 10 0 1 0 0 MMSDM 8 0 4 0 0 Primary care 10 0 0 2 0
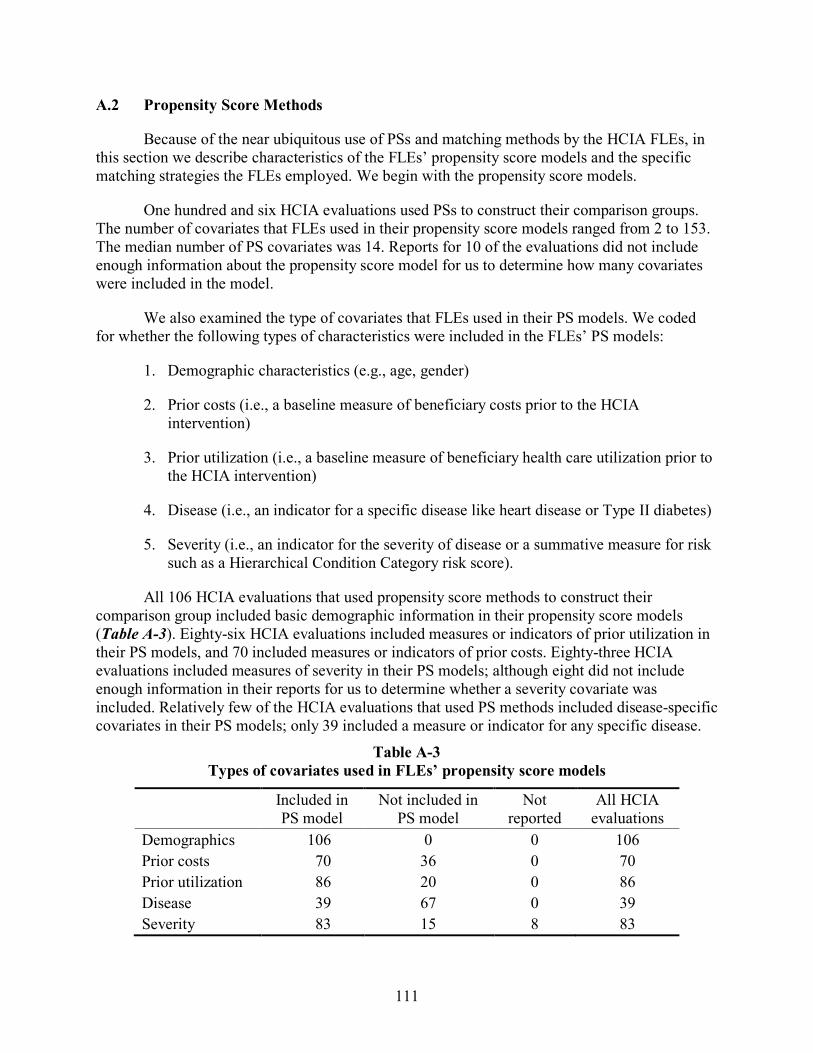
111
A.2 Propensity Score Methods
Because of the near ubiquitous use of PSs and matching methods by the HCIA FLEs, in this section we describe characteristics of the FLEs’ propensity score models and the specific matching strategies the FLEs employed. We begin with the propensity score models.
One hundred and six HCIA evaluations used PSs to construct their comparison groups. The number of covariates that FLEs used in their propensity score models ranged from 2 to 153. The median number of PS covariates was 14. Reports for 10 of the evaluations did not include enough information about the propensity score model for us to determine how many covariates were included in the model.
We also examined the type of covariates that FLEs used in their PS models. We coded for whether the following types of characteristics were included in the FLEs’ PS models:
1. Demographic characteristics (e.g., age, gender)
2. Prior costs (i.e., a baseline measure of beneficiary costs prior to the HCIA intervention)
3. Prior utilization (i.e., a baseline measure of beneficiary health care utilization prior to the HCIA intervention)
4. Disease (i.e., an indicator for a specific disease like heart disease or Type II diabetes)
5. Severity (i.e., an indicator for the severity of disease or a summative measure for risk such as a Hierarchical Condition Category risk score).
All 106 HCIA evaluations that used propensity score methods to construct their comparison group included basic demographic information in their propensity score models (Table A-3). Eighty-six HCIA evaluations included measures or indicators of prior utilization in their PS models, and 70 included measures or indicators of prior costs. Eighty-three HCIA evaluations included measures of severity in their PS models; although eight did not include enough information in their reports for us to determine whether a severity covariate was included. Relatively few of the HCIA evaluations that used PS methods included disease-specific covariates in their PS models; only 39 included a measure or indicator for any specific disease.
Table A-3 Types of covariates used in FLEs’ propensity score models
Included in PS model
Not included in PS model
Not reported
All HCIA evaluations
Demographics 106 0 0 106 Prior costs 70 36 0 70 Prior utilization 86 20 0 86 Disease 39 67 0 39 Severity 83 15 8 83

112
One of the most important reasons for using PSs is to improve covariate balance between the treatment group and the comparison group. Covariate balancing involves minimizing, on average, differences between the treatment and comparison groups on a set of observable covariates. For the HCIA evaluations, attempts at covariate balance were made by matching or weighting. For each evaluation using propensity scores, we recorded the number of covariates used in the FLE’s PS model and the number of covariates that remained unbalanced after matching or weighting and calculated the percentage of covariates that remained unbalanced at the 0.1 standardized differences threshold. Just over half of the HCIA evaluations (65 evaluations) using PS methods achieved balance at the 0.1 threshold on all the covariates the FLE included in their PS model. Strikingly, treatment and comparison groups for 4 evaluations remained unbalanced on more than half of the covariates that were included in the PS model after matching and 18 were unbalanced on more than 10% of the covariates in their propensity scores models. Although full covariate balance is desired, the FLEs in each of these instances concluded that matching was sufficient to justify the comparison. In addition, 77% of the evaluations presented overlay plots of the PS distributions for the intervention and comparison groups to illustrate the overlap (known as common support) between the groups.
A.3 Propensity Score Matching Methods
Overwhelmingly, matching was the most common method for comparison group construction among the HCIA FLEs. We identified 101 HCIA evaluations for which FLEs used matching to construct their comparison groups. While most interventions used PS matching, the Hospital-Setting FLE only used direct matching at the facility level for 10 of their interventions. In this section, we focus on the 91 HCIA evaluations that implemented PS matching.
PS matching was sometimes completed at multiple levels. For most of the evaluations, the most basic unit for matching was the beneficiary. However, the most basic unit of matching was the physician, facility, or hospital for 10 evaluations; in those cases, the FLEs used all eligible beneficiaries within the matched physician, facility, or hospital for their comparison groups. Seven comparison groups were formed through a combination of propensity score matching on physicians, facilities, or hospitals and propensity score matching on beneficiaries. The majority of the evaluations (74) only matched at the beneficiary level.
For our assessment of PS matching methods, we examined whether matching was done with replacement, the ratio of treatment beneficiaries to comparison beneficiaries used in the FLEs’ analyses, and whether the FLE weighted multiple comparison matches downward (downweighting) to make the effective sample size of the comparison group equal to that of the treatment group. Information about these variables was not consistently reported. Whether the comparison group was constructed using matching with replacement was reported for 51 interventions (20 matched without replacement and 31 matched with replacement); however, this information was not available for 40 of the evaluations. The matching ratio was commonly reported, and information was available for 86 of the 91 evaluations with PS matched comparison groups. Forty-four evaluations employed one-to-one matching, and 43 employed one-to-many matching. For the 43 evaluations using one-to-many matching, 39 downweighted the comparison group beneficiaries, one did not, and in three evaluations information about downweighting was not reported. The lack of consistently reported information made summarizing and analyzing these characteristics difficult.
113
A.4 Risk of Bias
Other than six RCTs, all of the HCIA evaluations employed nonrandomized comparisons groups created by the FLEs. Any nonrandomized comparison poses a risk of bias when estimating intervention effects. The bias may be favorable (making the intervention appear to be more effective than it really was) or unfavorable (yielding intervention effects that are too small). For this report, we conducted a comprehensive review of the potential for biased effect estimates among the HCIA interventions.
To assess risk of bias, we reviewed FLEs’ third annual reports and addendums following no-cost extension periods for descriptions of how treatment and comparison groups were formed. Most ambulatory care programs shared a similar approach to group design. Treatment groups were assembled by establishing basic eligibility criteria for the intervention and relying on providers, facilities, or third parties to identify and recruit suitable patients. In some cases, patients had to actively enroll or comply with a set of conditions to be considered a treatment group participant. A finder file of “enrollees” or “participants” was generated from facility records to be linked to claims. Comparison group beneficiaries, on the other hand, were Medicare or Medicaid beneficiaries with similar diagnoses and hospitalization patterns drawn from neighboring geographic areas. The size of potential comparison pools was frequently very large, and FLEs relied heavily on PS matching to identify a much smaller group of comparison beneficiaries. There was no contact between HCIA staff and comparison group members.
Our bias assessments were informed by the guidelines in the ROBINS-I tool for assessing risk of bias in non-randomized studies of interventions (Sterne et al., 2016), particularly those for pre-intervention confounding and participant selection. We noted the following potential bias threats: interventions in which the treatment group consisted of volunteers, patients were required to actively enroll in programs, group status was dependent on meeting participation or compliance criteria (such as attending a minimum number of sessions), or providers cherry-picked patients they felt were the most “suitable” for their intervention. We also noted all cases cited by FLEs as potential bias problems. If we felt that sufficient risk of cherry picking was present (as determined by two independent coders) and that the direction was most likely in a favorable direction (producing spuriously low rates of expenditure and health care utilization effects), we coded the intervention as Probable Favorable Bias (PFB). When the direction of the bias was unclear, we coded it simply as Risk of Bias. We assigned PFB status to 27% of the interventions with comparison groups. Another 6% were classified as Risk of Bias with indeterminate direction. Some evidence for the validity of the bias coding is provided by examining extreme estimates. Of 19 DID effects that were later determined to be TCOC outliers, 10 were labeled PFB.
The biggest challenge in making risk assessments was the lack of detail in the FLE reports about how enrollees and participants were defined for the treatment group finder files. The enrollment process was often a mystery. Rates of prescreening, refusal to participate, and opting-out were not described. The extent to which providers deliberately selected certain types of patients for their programs was rarely mentioned. As a result, it is likely that we have underreported the true risk rates because the incriminating information was not given in the annual reports that would have permitted us to make an accurate classification. Another complication is that some awardees changed their protocols over time. This seemed to be more
114
common among awardees that were having patient recruitment problems who began relaxing or eliminating enrollment criteria to increase the size of their treatment groups. The most egregious violation of intent-to-treat was a program that started as an RCT, and then allowed control group patients to shift into the treatment group.
There are at least two ways in which potential bias may have been mitigated. First, the ambulatory programs typically served a much broader clientele than just Medicare or Medicaid patients. For example, the Eau Claire Cooperative Health Centers identified 1,653 participants who had ever been “enrolled” in their intervention. Of these, only 316 (19%) were Medicaid beneficiaries who were used in the evaluation. Removing these participants likely reduced bias that may have emanated from different insurance payers. Second, nearly all the FLE evaluations used propensity scores to match or weight treatment and comparison beneficiaries. Most FLEs reported adequate balance between the two groups for the covariates used in the propensity models. However, these covariates consisted mostly of standard demographic and diagnostic data that were available from the Chronic Conditions Warehouse. While the PS approach undoubtedly helps to reduce bias, the question in all nonexperimental designs is whether the available covariates adequately adjust for unobserved factors like patient motivation or compliance that are also related to the core outcomes.
A.5 Impact of Evaluation Design on TCOC
To determine whether the characteristics of the comparison group construction had any systematic impacts on TCOC effects, we estimated a meta-regression model for evaluations that used propensity score matching or weighting, did not serve unique populations (unique populations are defined in Section 3.2.3), and had TCOC effect sizes less than or equal to $2,000 per beneficiary per quarter in absolute value. The analytic sample included 82 evaluations. The explanatory variables in the model consisted of several aspects of the comparison group design and other measures related to TCOC impacts:
• Potential Favorable Bias (PFB). As described above, PFB flagged evaluations in which we suspected that the recruitment process may have produced a favorable bias in the TCOC effects. The PFB effect was expected to be negative, indicating greater savings in expenditures. Thirty-one percent of the evaluations were assigned PFB status.
• Barriers to recruitment: Nineteen percent of the evaluations reported that they experienced problems recruiting patients for treatment. These evaluations were expected to be prone to bias because they frequently liberalized their recruitment protocols to draw more beneficiaries into their treatment group.
• Risk of bias: Four percent of the evaluations were coded as being at risk of bias in an indeterminate direction. These evaluations were most often flagged by FLEs.
• Weighting: Eleven percent of the evaluations used comparison groups that were constructed using propensity score weighting. TCOC effect sizes from these evaluations were compared to evaluations that used PS matching. and we hypothesized that no statistically significant difference would be observed between the two with respect to the TCOC effect sizes.

115
• Percent unbalanced covariates: We included the percentage of PS covariates that remained unbalanced after matching or weighting. We expected that this effect would be close to zero because imbalance could produce both positive and negative outcome effects.
• New innovation: Previous analyses have repeatedly shown that HCIA TCOC effects show more dissavings when awardees implement new, untried programs that they do not have previous experience with. This variable was included to remove some of the known variance in TCOC effects that was not related to the comparison group methodology. Twenty-six percent of the evaluations were new innovations.
The results from our meta-regression are shown in Table A-4. As hypothesized, PFB and barriers to enrollment were associated with TCOC savings (negative TCOC effect sizes) of $59 (SE = $63) and $79 (SE = $97) per beneficiary per quarter (PBPQ), respectively. The few evaluations that were classified as being at risk for bias were also associated with TCOC savings of $22 (SE = $91) PBPQ. None of these explanatory variables—PFB, barriers to enrollment, or risk of bias—were significantly associated with TCOC effect sizes.
Table A-4 Meta-regression results for the impact of comparison group method on TCOC effect size
Estimate (Std. Error)
p-value
Intercept 43.8(48.46) 0.37
Weighting -328.93(613.61) 0.59
Risk of bias -21.93(91.05) 0.81
PFB -59.3(63.4) 0.35
New program 156.83(70.13) 0.03
Barriers to enrollment -78.77(97.05) 0.42
Unbalanced covariates (%) -0.89(1.71) 0.61
Risk of bias, PFB, and recruitment barriers all had negative (savings) effects in the model, but these effects were small in value and insignificant. The impact of weighting versus matching seems large (-$329 PBPQ), but this is a very imprecise, inconclusive estimate due to the small number of evaluations using weighting. As expected, the impact of covariate imbalance

116
was close to zero. Like our previous meta-regressions, new innovations were significantly associated with dissavings ($157 [SE = $70] PBPQ).
The large weighting effect estimate could be because all the PS weighted comparison groups came from post-acute setting interventions. Post-acute setting interventions have more variable effect sizes because of the greater potential for savings or dissavings in the post-acute setting. Furthermore, the post-acute programs were smaller, on average, than the ambulatory care setting programs; this means that their coefficients were less precise and had smaller weights in the meta-regression.
The results from this meta-regression are reassuring because they indicate that bias-related variables had only negligible effects on TCOC. As a result, the DID effects we use as outcomes are unlikely to be contaminated by systematic biases associated with the way comparison groups were created, and we can be more confident that our meta-analytic results are not being dominated by a handful of potentially biased results.
References
Rosenbaum, P. R. & Rubin, D. B. (1983). The central role of the propensity score in observational studies for causal effects. Biometrika, 70(1), 41–55.
Rubin, D. B. (1997). Estimating causal effects from large data sets using propensity scores. Annals of Internal Medicine, 127, 757–763.
Sterne, J. A. C., Hernan, M. A., Reeves, B. C., Savovic, J., Berkman, N. D., Viswanathan, M., … & Higgins, J. P. T. (2016). ROBINS-I: a tool for assessing risk of bias in non-randomised studies of interventions. BMJ, 355, i4919.

117
APPENDIX B: META-REGRESSION AND PATH ANALYSIS METHODS

118
[This page intentionally left blank.]
119
B.1 Meta-Regression Methods
In meta-regression, awardee effect sizes become the dependent variables in the analysis.
The explanatory variables in this model are factors that are hypothesized to influence the magnitude of the awardee effects (Thompson & Higgins, 2002). In Health Care Innovation Awards (HCIA), the results for any particular awardee may be a function not only of the effectiveness of a particular treatment component, but also of beneficiary attributes, geographic influences, and other structural and implementation-related features of the innovation.
The meta-regression is based on the following general equation that explicitly accounts for heterogeneity across awardees:
Yi = α + ΣjβjXji + ΣkλkZki + μi + εi,
where
• Yi = the effect size for the i-th HCIA awardee, based on the most recent quarter of data • α = an intercept term • Xji = a set of j characteristics of the i-th awardee’s HCIA program • Zki = a set of k structural features of the i-th awardee’s innovation • μi = unexplained (unobserved) variation in the i-th program from “true” program effect • εi = residual sampling error in the i-th intervention.
The X and Y vectors consist of program-related, structural, and design-related characteristics that may have introduced the heterogeneity into the results and that may systematically elevate or reduce observed effect sizes. The impacts of these features are estimated by the associated βj and λk coefficients.
Because estimated outcome effects are considerably more precise for some innovations than for others, we performed weighted regressions with weights equal to the inverse of the total cost of care (TCOC) error variance. Large weights were capped at three times the mean value to prevent the biggest programs from having undue influence on the results. Random effects meta-regression models were estimated using the metareg command in Stata 14.0.
B.2 Path Analysis Methods
We used path analysis to analyze two models, one for the determinants of implementation effectiveness and a second for the relationships between implementation features and the core outcomes. An extension of regression methods, path analysis is a statistical technique for estimating linear associations among a set of variables arranged in a presumed, hierarchical causal sequence (Kline, 2011). The results of multiple regression equations are displayed in the form of a model that summarizes the key relationships (or paths) in the data. The magnitudes of individual effects are measured by standardized regression (beta) coefficients. These coefficients indicate how many standard deviations (SDs) an outcome would be expected to change in response to a one standard deviation increase in an explanatory variable. A beta value of 0.20, for example, indicates that the outcome is expected to increase 0.20 SDs per SD change in the

120
explanatory variable. With all variables in the path model standardized to their respective metrics, larger betas represent larger relative effects.
Standard output for path models includes modification indexes, which estimate the effect of inserting omitted paths back into the model. We reviewed these indexes for conceptually appropriate changes in model specification.
Several indices can be used to assess the fit of a path model. Fit refers to the degree to which the proposed model reproduces the observed correlations in the data. We made fit assessments based primarily on one absolute fit measure (the Root Mean Square Error of Approximation or RMSEA) and one incremental fit measure (the Comparative Fit Index or CFI). Criteria for good model fit are RMSEA values less than 0.08 and CFI values greater than 0.95 (Hooper, Coughlan, & Mullen, 2008). The model results were estimated from weighted covariance matrices using Stata 14.0.
References
Hooper, D., Coughlan, J., & Mullen, M. (2008). Structural equation modelling: Guidelines for determining model fit. Electronic Journal of Business Research Methods, 6, 53–60.
Kline, R. B. (2011). Principles and practice of structural equation modeling. Third edition. New York: Guilford Press.
Thompson, S. G. & Higgins, J. P. T. (2002). How should meta-regression analyses be undertaken and interpreted? Statistics in Medicine, 21, 1559–1573.

121
APPENDIX C: COPY OF AASF INSTRUMENTS 1 AND 2

122
[This page intentionally left blank.]

123
COPY OF AASF1 INSTRUMENT

124

125
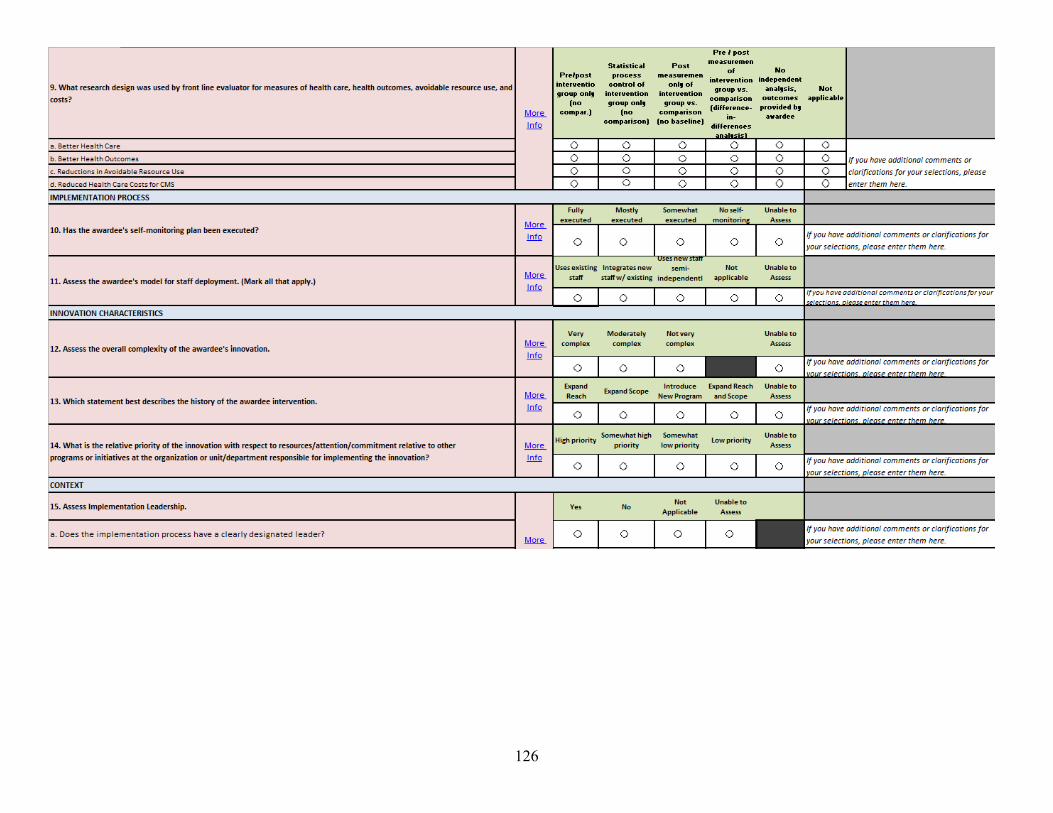
126

127

128
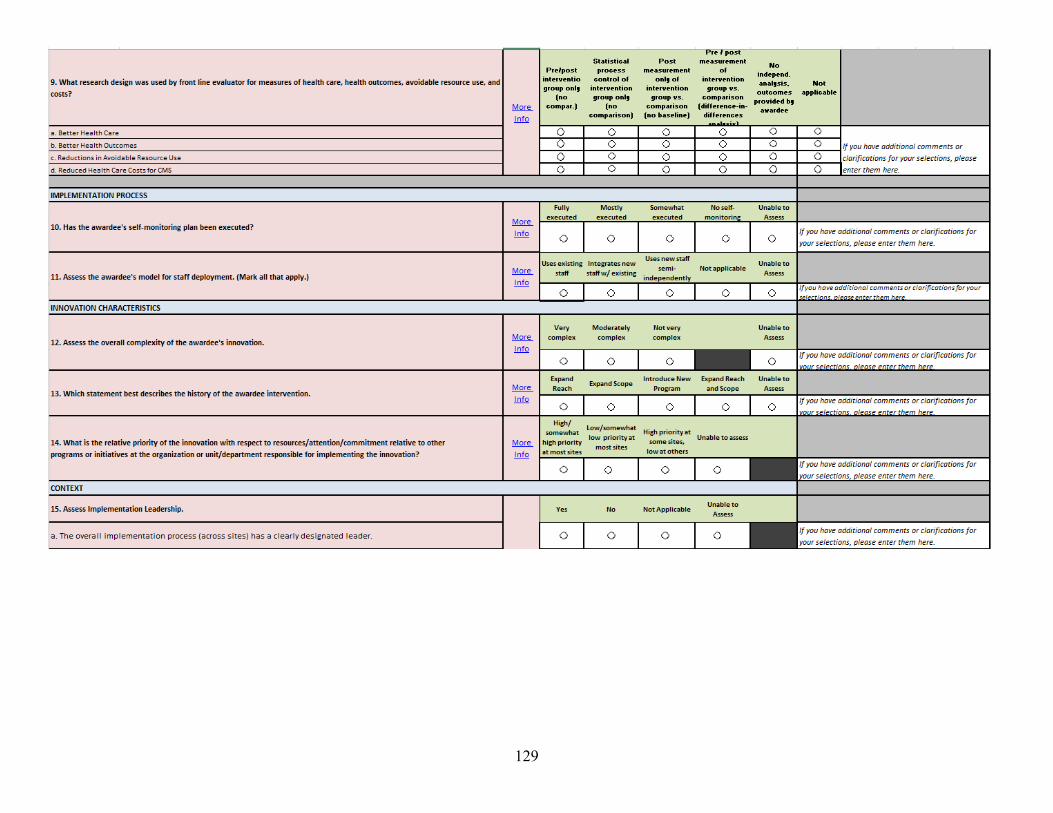
129

130

131

132

133

134

135

136
COPY OF AASF2 INSTRUMENT
2015 Annual Awardee Summary Form Instructions
The HCIA meta-evaluator will use Frontline Evaluator (FLE) responses on this form to synthesize findings across awardees. Read instructions carefully, consult the “Instructions for Annual Awardee Summary Form 2015” provided to all FLEs prior to completing this form. The awardee assessment provided on this form will not be shared with awardees. Items marked with an “*” are required.
Contact Asha Ayub ([email protected], (781) 434-1787)) for any questions.
1. Front Line Evaluator Name and HCIA Portfolio [prepopulated with FLE name]
2. Awardee Name [prepopulated with Awardee name]
Check this box to confirm this is the Awardee for whom you are reporting on.
If this is not the correct awardee, please check that you have selected the correct link and try again. If you are certain that you have selected the correct link, please contact Asha Ayub for further assistance.
Implementation Sites
The following items ask you to characterize the number of implementation sites used by the awardee.
An implementation site is defined as the organizational unit where innovation components, care, or services are being implemented and monitored by an awardee or an awardee’s partners. Sites serving as comparison or usual treatment comparison sites are not considered implementation sites.
A site may be at the level of a hospital unit, clinic or practice, hospital system, organization, geographic unit (e.g., county), or other unit defined by administrative/management boundaries. In other words, the implementation site is the organizational unit which tracks patients through their care experience. An awardee with multiple sites may coordinate data collection from independent sites; each site is responsible for implementing the innovation locally, delivering care or services, and providing data on that care experience. For example, one awardee disseminated a model for a specific care program to other hospitals. Each hospital is independently implementing the model. In this case, each hospital represents an implementation site.
A single implementation site may span multiple care settings. For example, a transitional care coordination program implemented by an awardee at one hospital, may involve services at hospital discharge, follow-up in an outpatient setting, and follow-up home visits.

137
3. Does the innovation involve more than one implementation site? (select one)
Yes No Unable to determine
[Yes skip to check box question on next page.]
Comments ________________________________________________________
4. How many implementation sites does this awardee have? (Enter a numeric value)
_______ Enter “0” if you are unable to determine the precise number of sites and use the comment box below to describe the range or approximate number, for example “less than 5”, “not more than 10”, etc.
Comment _________________________________________________________
5a. How many implementations sites did you collect implementation experience data from through in-person site visits, telephone interviews, or direct observation?
_______
5b. If you did not visit or collect implementation experience data from all sites within an awardee, how did you select which sites to visit or collect data from? For example, were sites selected based on geography, size, performance characteristics, representativeness, non- representativeness, etc.
_______
For the next items, management team refers to the Innovation Project Director or Principal Investigator and his or her team responsible for oversight of innovation implementation, which may or may not be the same as the patient care team responsible for providing direct care or services associated with the innovation.
6. What model of oversight of the implementation process best describes this awardee? (select one)
The management team at the awardee organization oversees implementation activities.
A management team at each participating site oversees implementation activities. Other (please describe)

138
7. Which best describes the management relationship between the awardee organization and implementing sites? (select one)
All or most participating sites are under the management of the awardee organization (e.g., different practices that are part of the same health care system).
All or most participating sites are external partners to the awardee organization. Other (please describe)
8. Please indicate the reporting unit for impact outcomes for this awardee (select all that apply)
Impact outcomes include the core four measures (hospital admission, readmissions, ED visits, total cost of care), along with any other awardee-specific outcomes defined for this awardee.
Outcomes are or will be reported at the Awardee level (i.e., data from multiple sites will be aggregated)
Outcomes are or will or can be reported at the site level. For this item, please do not consider whether sufficient power exists to estimate impact by site, just whether outcomes can be provided separately by site.
Other, please describe
On the following pages, please answer the items using information collected through document review, interviews or field observations, surveys, or other primary data collection that you conducted as part of your evaluation.
Read the “Instructions for Annual Awardee Summary Form 2015” for further description of the item questions, response options and for how to complete the item if your response varies by implementation site (i.e., your rating would be “to a great extent” at most sites, but “not at all” at a few sites).
Click here to continue to the next page

139
9. Innovation Complexity
The awardee’s innovation:
To a great
extent
To a moderate
extent
To a slight extent
Not at all
Not applicable
Unable to assess
Varied by site
Involved multiple interconnecting components
Spanned multiple care settings (e.g., hospital, outpatient, home)
Involved staff from various groups, departments, or organizational levels providing care or services
Required formal agreements among organizations
Required cooperation from distributed independent providers
Added or significantly changed steps in the service delivery workflow
Required new health information technology
Required hiring clinical staff new to the organization
Required hiring technical, research, or administrative staff new to the organization
Required changes to existing staffs’ roles and responsibilities
Required training staff for new or additional skills
Was explicitly developed and designed with intent for future dissemination to other sites
Comments for this awardee related to any items above _______________________________

140
10. Implementation Planning
The management team refers to the Innovation Project Director or Principal Investigator and his or her team responsible for oversight of innovation implementation, which may or may not be
the same as the patient care team responsible for providing direct care or services associated with the innovation.
To what extent did the management team have:
To a great
extent
To a moderate
extent
To a slight extent
Not at all
Not applicable
Unable to assess
Varied by site
Written and available protocols and procedures for innovation delivery
A detailed timeline with milestones
A comprehensive staffing plan Experience with implementing similar programs at a similar scale
Comments for this awardee related to any items above _______________________________

141
11. Implementation Process
The management team refers to the Innovation Project Director or Principal Investigator and his or her team responsible for oversight of innovation implementation, which may or may not be the same as the patient care team responsible for providing direct care or services associated with the innovation.
To what extent did the management team:
To a great
extent
To a moderate
extent
To a slight extent
Not at all
Not applicable
Unable to assess
Varied by site
Introduce innovation components in a planned and deliberate way
Work with all necessary entities within the awardee organization to implement the innovation
Work with all necessary entities across organizations to implement the innovation
Execute its self- monitoring plan Use a formal improvement framework or change management process (e.g., LEAN, PDSA cycles)
Comments for this awardee related to any items above _______________________________

142
12. Staff Training.
The following items ask about staff training in support of innovation delivery. The staff to consider for responding to this item are awardee or partner staff that had a role in providing or supporting the care or services required to implement and sustain the innovation.
To what extent did:
To a great
extent
To a moderate
extent
To a slight extent
Not at all
Not applicable
Unable to assess
Varied by site
Front-line staff participate in formal training to support innovation delivery
Front-line staff receive training through experiential learning (e.g., shadowing or mentoring)
Front-line staff receive ongoing training throughout the duration of the innovation award
New (and rotating) staff receive training to accommodate staff turn-over
Comments for this awardee related to any items above _______________________________

143
13. Organizational Leadership.
Leaders include the person(s) to whom the Innovation Project Director/Principal Investigator reports and are individuals with the power to make resource allocation decisions within the organization. This may include the organization CEO or other key senior leaders.
For these items, organization leaders are NOT the PD/PI of the HCIA award or innovation team staff, unless the PI/PD is, in fact, a senior leader in the organization and can make resource allocation decisions within the organization.
To what extent did organization leaders:
To a great
extent
To a moderate
extent
To a slight extent
Not at all
Not applicable
Unable to assess
Varied by site
Attend meetings related to innovation
Act as a liaison to external partners
Closely monitor implementation progress
Proactively resolve problems in response to feedback from staff
Provide in-kind staffing to support the innovation
Provide in-kind resources other than staffing to support the innovation
Comments for this awardee related to any items above _______________________________

144
14. Implementation Effectiveness.
The next items ask you to rate how successful the awardee has been in implementing the innovation, which is defined as the extent to which the planned innovation care or services were consistently delivered to the intended target population at the intended level of quality and intensity. Innovation effectiveness (e.g., impact outcomes) will be captured in a later section.
To what extent did implementation result in:
To a great
extent
To a moderate
extent
To a slight extent
Not at all
Not applicable
Unable to assess
Varied by site
Full adoption of innovation by front- line staff
Full adoption of innovation by external partners
Rapid adoption of the innovation Completion of all tasks needed for full innovation implementation
Comments for this awardee related to any items above _______________________________
To what extent are:
To a great
extent
To a moderate
extent
To a slight extent
Not at all
Not applicable
Unable to assess
Varied by site
Innovation components being delivered as intended and at the prescribed level of quality
Innovation components being delivered at the intended level of intensity and frequency
Comments for this awardee related to any items above _______________________________

145
15. Challenges
This item asks about challenges awardees may have faced in implementing or maintaining their innovations. This item asks about non-Health Information Technology (health IT) challenges and the awardee’s success in overcoming those challenges. Health IT challenges will be assessed in the next item.
Rate the extent of each of the challenges below:
Major
challenge Moderate challenge
Small challenge
Not a challenge
Not applicable
Unable to
assess Varied by site
Enrolling patient participants Implementing and/or executing agreements with partners
Clinician buy-in and engagement
Staff recruitment Management staff turnover or unfilled management roles
Frontline staff turnover or unfilled frontline staff roles
Integration of non- licensed staff (e.g., community health workers) into care team
Competing initiatives or programs
Level of reimbursement for services
Changes in federal or state policies, legislation, or regulation affecting implementation
Workflow redesign
Please comment further on the challenges and on the extent to which the awardee was able to overcome each of the challenges you have marked as major or moderate above. ____________________________________________________________________________

146
16. Health Information Technology (health IT) Challenges.
This item asks about health IT challenges awardees may have faced in implementing or maintaining their innovations and success in overcoming these challenges. If the awardee’s innovation does not involve any health IT components, select not applicable for each item.
Rate the extent of each of the health information technology (health IT) challenges below.
Major
challenge Moderate challenge
Small challenge
Not a challenge
Not applicable
Unable to
assess Varied by site
Selecting or designing health IT to support the innovation
Building out or installing health IT to support the innovation
Identifying, hiring, or obtaining vendor support for innovation health IT requirements
Data standardization across systems
Interoperability across organizations
Alignment of health IT with clinical workflow
Acceptability of the health IT by front line staff
Please comment further on the challenges and on the extent to which the awardee was able to overcome each of the challenges you have marked as major or moderate above. ____________________________________________________________________________

147
Implementation Evaluation-Other
17. By what approximate date was the innovation considered fully implemented?
• Quarter [Drop down]: Jan-Mar, Apr-Jun, Jul-Sep, Oct-Dec, UNABLE TO ASSESS
• Year: [Drop down]: 2012, 2013, 2014, 2015, UNABLE TO ASSESS
The next two items ask you to identify a few factors which you believe uniquely supported or hindered implementation. These can be the factor(s) that stand out in your mind as the most important for innovation implementation success or failure, or unexpected factors that influenced implementation.
18. Was there anything that uniquely supported implementation for this awardee?
Yes No If yes, please describe:
19. Was there anything that uniquely inhibited implementation for this awardee?
Yes No If yes, please describe:
20. Based on your knowledge of the processes, activities, and management supporting this innovation, do you believe the innovation could be successfully disseminated for wide- spread adoption and implementation?
Yes No If yes, please discuss why, if no, please discuss the limitations to dissemination and wide- spread adoption.

148
Impact Assessment
In this section we will ask for your evaluation of the innovation’s impact on the core four outcomes being measured as part of the HCIA evaluation (total cost of care, hospital admissions, 30 day hospital readmissions, and emergency department visits).
We will also ask you about impact on up to 3 additional measures that you are evaluating as part of your evaluation from the categories below. The measures you specify as additional outcomes should be measures that you think have the most direct relevance to the innovation.
Health Care Processes and Experience of Care: The impact of the intervention or services on clinical processes related to quality or safety, coordination of care, patient experience, timeliness, and efficiency. Health Outcomes: The impact of the intervention or services on health outcomes including mortality, morbidity, health-related quality of life, functional or symptom status, and health-care associated harms (e.g., health-care associated infections, iatrogenic injury or exposures). Resource Use: The impact of the intervention on health care use other than hospital admissions, readmissions and ED visits. For example, use of diagnostic laboratory or imaging tests, medication, outpatient primary care visits, outpatient specialty care visits, outpatient mental health visits, ancillary care, etc. Health Care Costs: The impact of the intervention or services on health care costs other than total cost of care.
Please specify up to 3 impact outcomes (other than the core four) that have the most direct relevance to the awardee’s innovation that you are estimating. For example, if you are measuring impact on diabetes control related to an innovation, you would likely specify a measure involving hemoglobin A1C (mean change, % at goal, etc.).
Specify Name of Additional Outcome 1
Specify Name of Additional Outcome 2
Specify Name of Additional Outcome 3
Comments for this awardee related to any items above

149
21. Based on the nature of the innovation and population targeted, please rate the extent to which the innovation is likely to impact each of the core four measures and the additional outcomes you have specified above. In other words, does the logic model or theory of change for the innovation suggest a direct impact on these measures and within what timeframe might that be expected?
Impact within 1
years
Impact within 3
years
Impact beyond 3
years
Unlikely to ever impact this measure
Unable to assess
Total costs of care Hospital admissions 30-day hospital readmissions Emergency department visits Additional Outcome 1 Additional Outcome 2 Additional Outcome 3
Comments for this awardee related to any items above _______________________________

150
The item below asks you to assess the 1) the magnitude and direction of each impact outcome and 2) the certainty of each impact outcome. You will make these assessments for each of the core four measures and also for the additional outcomes you have specified for this awardee.
Magnitude and direction of impact on each outcome:
Magnitude refers to the effect size of the innovation impact, including whether it is clinically meaningful or meaningful from a policy perspective.
Direction refers to whether the innovation improves the outcomes (i.e., favorable impact) or worsens outcomes (i.e., unfavorable impact).
Please select your rating below based on the awardee goals and context (e.g., a 2% improvement on a measure for one awardee may represent a meaningful magnitude, whereas a 2% improvement on a different measure in another awardee may be meaningless).
Certainty of impact for each outcome
The degree to which the impact outcome estimate is precise, whether it could be due to chance, and whether the evaluation was adequately powered to detect an effect.
A precise estimate is one with a narrow confidence interval that has no substantive difference in interpretation across the interval. An imprecise estimate is one with a wide confidence interval for which the lower bound may result in different actions taken as compared to the upper bound.
The degree to which the estimate could be due to chance is assessed through classical statistical significance testing. Estimates associated with a p< 0.05 are unlikely to be due to chance, those with p< 0.2 are probably not due to chance.
Favorable impact that is moderate to large and meaningful
Favorable impact that is small and may not be meaningful
Unfavorable impact that is small and may not be meaningful
Unfavorable impact that is moderate to large and meaningful
Very certain-estimate is very precise and unlikely to be due to chance (p< 0.05)
Certain-estimate is reasonably precise and probably not due to chance (p< 0.2)
Uncertain-estimate is imprecise, may be due to chance (p>0.2), or limited power to detect an effect
Very uncertain-estimate is very imprecise, probably due to chance (p>0.5), with very limited power to detect an effect

151
26. Provide your assessment of magnitude and direction and certainty using the drop down selections below. [Each drop down includes: 4, 3, 2, 1, UNABLE TO ASSESS]
Impact Magnitude and
Direction of Impact Certainty of
Total Cost of Care [drop down] [drop down] Hospital admissions [drop down] [drop down] 30 day hospital readmissions [drop down] [drop down] Emergency department visits Additional Outcome 1 [drop down] [drop down] Additional Outcome 2 [drop down] [drop down] Additional Outcome 3 [drop down] [drop down]

152
[This page intentionally left blank.]

153
APPENDIX D: EVALUATION OF THE COMPARATIVE INTERRUPTED TIME SERIES (CITS)
METHOD

154
[This page intentionally left blank.]

155
The primary measures of the effectiveness of Health Care Innovation Award (HCIA) innovations are the difference-in-difference (DID) regression estimates reported by frontline evaluators (FLEs). These estimates are based on monthly data for individual patients. Another method of estimating intervention effects is Comparative Interruptive Time Series (CITS) analysis. CITS can be performed with unadjusted quarterly data at the treatment and comparison group level. In this appendix, we compute CITS estimates for HCIA ambulatory care innovations and compare them to the DID estimates reported by the FLEs. Our objective is to determine how accurately the simpler CITS model can reproduce the DID estimates.
Recent research (Somers, Zhu, Jacob, & Bloom, 2013; St. Clair, Cook, & Hallberg, 2014) has found that the CITS approach can produce results similar to those obtained from randomized clinical trials. Those examples, however, were based on unique interventions with brief time series. Moreover, the units of observation in those studies were individual patients. Our CITS analyses, on the other hand, are based on group-level quarterly means and variances from templates completed by the FLEs. The comparison of the DID and CITS estimates presented in this appendix allows us to evaluate how much impact group-level data has on the precision of the estimates.
D.1 Methods
The model specification for each intervention for the CITS analysis was as follows:
𝑻𝑻𝑻𝑻𝑻𝑻𝑻𝑻𝑻𝑻 = 𝒂𝒂 + 𝒃𝒃𝟏𝟏𝑰𝑰 + 𝒃𝒃𝟐𝟐𝑫𝑫 + 𝒃𝒃𝟑𝟑𝑸𝑸 + 𝒃𝒃𝟒𝟒𝑰𝑰 ∗ 𝑫𝑫 + 𝒆𝒆
where • TCOCq = the mean total cost of care (TCOC) per beneficiary in quarter q • a = the intercept • I = a 0/1 indicator for the HCIA innovation group vs. the comparison group • D = a 0/1 indicator for a quarter occurring during the intervention period • Q = a count of the quarter number (ranging from 1, the earliest baseline period quarter, to the
total number of baseline and intervention period quarters) • b1–b4 = unstandardized regression coefficients • e = an error term.
Quarterly TCOC means, standard deviations, and sample sizes for each HCIA innovation were provided by FLEs. All available quarters were used in the analyses. In this model, the HCIA impact on TCOC is estimated by 𝑏𝑏4, the coefficient associated with the I*D interaction term. This coefficient estimates the mean effect per beneficiary per quarter (PBPQ) on TCOC attributable to the HCIA innovation during the intervention period. The model controls for a linear trend in costs throughout the entire observation period. Quarterly means were weighted using variance-weighted least squares, which gives greater weight to more precise estimates of the means.
The key differences between the two methods are that CITS is based on quarterly data, incorporates a term for linear trends, and does not contain patient-level covariates demographic characteristics, comorbidities, or prior utilization patterns that were available to the FLEs for the DID models.

156
D.2 Sample
We focused on interventions in the ambulatory care setting and on TCOC as the outcome measure. We began with the set of 72 ambulatory setting interventions included in the TCOC meta-regression analysis presented in Section 3.5 These interventions all reported a DID estimate, did not serve unique populations, and were not outliers in terms of the TCOC effect size (i.e., absolute value of less than $1,000 PBPQ). From this group, we excluded 15 interventions that had inadequate quarterly data or that were not matched to the same time period as the DID analyses. This left 57 interventions in the analysis.
At least four quarters of baseline and four quarters of intervention period data were available for all interventions. Eight or more quarters of baseline data were available for 42 interventions (74%), while 48 interventions (84%) included at least eight quarters of intervention period data. On average, 17 total quarters of data (baseline and intervention periods combined) were used in the analyses (range 10 to 22 quarters).
D.3 Results
We plotted the relationships between the CITS and DID estimates and computed several measures of their concordance. The mean effect size for TCOC was about -$60 per person per quarter for both DID and CITS, and the median values were also similar (-$3 for DID, $7 for CITS). The average standard error values for the DID and CITS estimates were also quite similar (mean close to $250, median approximately $200). The correlation coefficients for the estimates and the standard errors were r = 0.64 and r = 0.79, respectively (p < .0001 for both).
Figure D-1 plots the CITS effect estimates against the DID estimates and includes the “y = x” line as a reference and dotted lines representing the values one standard deviation (SD, $374) above and below the DID estimates. The CITS estimates for 41 of 57 (72%) interventions are within one standard deviation of the DID estimates. A somewhat smaller number of the CITS estimates, 38 (67%), fell within the corresponding DID estimates’ 90% confidence interval. The mean absolute prediction error was $273. Figure D-2 is a similar plot for the standard error (SE) estimates. This plot shows substantial concordance with only three points outside the standard deviation interval (±$262).

157
Figure D-1 CITS and DID Estimates for TCOC
Figure D-2 Standard Errors for the CITS and DID Estimates for TCOC

158
One question in the literature has to do with the minimum number of quarters (usually baseline quarters) that are needed for CITS to produce accurate estimates. The greater the number of quarters, the more precise CITS estimates should be. This relationship is displayed in Figure D-3. The flat slope in the plot indicates that there was no relationship between precision and the number of quarters of data used for analysis. Beneficiary sample size and many other factors influence the magnitude of standard errors, but it does not appear that increasing the number of quarters has an appreciable effect on the precision of CITS estimates in HCIA. Another way to examine this question would be contrast the results for shorter (say 4 quarters) versus longer (8 quarters) periods of follow-up data for the same awardees.
Figure D-3 CITS Standard Errors by Number of Quarters Used for Estimation

159
D.4 Summary
Our analysis showed that CITS estimates for TCOC effects were strongly correlated with FLEs’ DID estimates (r = 0.64), but only 72% of the CITS values were within $374 of the DID estimate, 67% were within the 90% confidence interval for the corresponding DID estimate, and the mean prediction error was $273. This suggests that CITS estimates may not be acceptable surrogates for DID estimates in as many as a third of the evaluations in an initiative like HCIA. The similarity in the mean estimates produced by each method indicates that CITS does not systematically over- or underestimate DID effects. CITS standard errors were remarkably similar to those from DID despite being based only on a small number of quarterly observations without any adjustments for covariates.
Factors unrelated to estimation method may have affected the CITS estimates. Several extreme DID estimates were suspected of being cases in which designs carried a risk of biased treatment effects. CITS models assume that trends are relatively stable throughout the baseline and intervention follow-up periods, and that intervention and comparison group trends parallel one another during the baseline period. Lack of parallelism, periodic quarterly spikes, or non-linear trends in the quarterly data may affect the CITS estimates.
Contrary to our expectation, the number of quarters used for analysis did not increase the precision of estimates. As a result, we were unable to contribute anything substantive to deliberations regarding the minimum number of quarters needed to conduct CITS analyses.
CITS is a simpler, less data-intensive alternative for estimating treatment effects, especially when data collection and analysis costs are high. As a form of secondary analysis, CITS methods may also help researchers circumvent constraints related to patient and data privacy. And, as we did in our evaluation, CITS is a relatively inexpensive method for quickly checking the accuracy of estimates produced by other statistical methods.
References
Somers, M. –A., Zhu, P., Jacob, R., & Bloom, H. (2013, September). The validity and precision of the comparative interrupted time series design and the difference-in-difference design in educational evaluation. MDRC Working Paper on Research Methodology. Retrieved from http://www.mdrc.org/publication/validity-and-precision-comparative-interrupted-time-series-design-and-difference
St. Clair, T., Cook, T. D., & Hallberg, K. (2014). Examining the internal validity and statistical precision of comparative interrupted time series design by comparison with a randomized experiment. American Journal of Evaluation, 35, 311–327.

160
[This page intentionally left blank.]

161
APPENDIX E: BAYESIAN RANDOM EFFECTS META-ANALYSIS

162
[This page intentionally left blank.]
163
As a complement to our frequentist meta-analytic findings in Section 3.3 we present Bayesian random-effects meta-analysis findings in this section. Bayesian estimation affords the opportunity to produce probabilities of specific outcomes (e.g. the probability of cost savings) and to synthesize information across the Heath Care Innovation Award (HCIA) evaluations.
For our analysis, we excluded evaluations for unique populations (unique populations are defined in Section 3.2.3) and those without difference-in-difference (DID) effect size estimates. We analyzed ambulatory setting, post-acute setting, and hospital setting evaluations separately and considered total cost of care, hospitalizations, 30-day readmissions, and emergency department (ED) utilization.
To synthesize estimates for each measure in the three settings, we used a Bayesian random-effects meta-analysis model. Each evaluation’s effect size entered the model through a normal likelihood function, and each evaluation’s effect size’s standard error was used to model uncertainty in the effect size estimate. Priors for the evaluation-level parameters summarized our beginning belief that each intervention had a 50/50 chance of total cost of care (TCOC) savings (or a reduction in utilization for the hospitalizations, 30-day readmissions, and ED utilization measures). Like a hierarchical, or multilevel, model the evaluation-level mean parameters were modeled to come from a common distribution centered at the grand mean. The prior for the grand mean assumed a 50/50 chance of savings or a reduction of utilization on average for the interventions in the analysis. The heterogeneity parameter, or between study variance, was tuned to shrink extreme estimates closer to the mean and improve their precision (shrinkage) while preserving non-extreme and precise frontline evaluator (FLE)-reported DID estimates.
Evaluation-level estimates and grand means were produced in the analysis. During estimation of the grand mean, the intervention-level parameters were updated and refined through the “borrowing of strength.” Borrowing of strength occurred because in the estimation process FLE-reported evaluation-level estimates informed the grand mean and the grand mean—and thus the other FLE-reported evaluation-level estimates in the analysis—informed the parameters for each evaluation. The Bayesian intervention-level estimates are different from the FLE-reported estimates because they draw from different information. FLE-reported estimates reflect data from the specific intervention being evaluated whereas the refined Bayesian estimates (also called synthesized or shrinkage estimates) uses FLE-reported estimates across interventions in the same setting.
In Subsection E.1, we present the plots of the posterior distributions for the grand mean Bayesian random effects (RE) parameter for each measure and setting. In subsection E.2, we present the refined evaluation-level effect size estimates in a series of plots that illustrate shrinkage.
E.1 Bayesian RE Grand Mean Posterior Distributions
In Figures E-1 through E-4., we present plots of the posterior distributions for the grand mean Bayesian RE parameter for each measure and setting.

164
Figure E-1 Grand mean posterior distribution for TCOC for the ambulatory, post-acute, and hospital
settings
All three settings (ambulatory, post-acute, and hospital) showed mean cost savings per beneficiary per quarter (Figure E-1). The largest mean savings was of $36 per beneficiary per quarter (PBPQ; posterior standard deviation = $87 PBPQ) was observed in the hospital setting. Interventions in the ambulatory-setting, on average, yielded savings of $22 PBPQ (posterior standard deviation = $39 PBPQ). For the post-acute setting, we found average cost savings of $21 PBPQ (posterior standard deviation = $90 PBPQ).
Figure E-2 Grand mean posterior distribution for hospitalizations for the ambulatory and post-acute
setting
On average, interventions in the ambulatory and post-acute settings showed increases in the mean number of hospitalizations per 1,000 beneficiaries per quarter. The post-acute setting had a mean increase of 11 hospitalizations per 1,000 beneficiaries per quarter (posterior standard deviation of 8 hospitalizations per 1,000 beneficiaries per quarter); the ambulatory setting

165
showed a mean increase of 1 hospitalization per 1,000 beneficiaries per quarter (posterior standard deviation = 2 hospitalizations per 1,000 beneficiaries per quarter).
Figure E-3 Grand mean posterior distribution for 30-day readmissions for the ambulatory, post-acute,
and hospital setting
Interventions in the ambulatory and post-acute settings showed increases in the mean number of readmissions. On average, readmissions in the ambulatory setting increased by 1 readmissions per 1,000 beneficiaries per quarter (posterior standard deviation = 1 readmission per beneficiary per quarter); readmissions in the post-acute setting increased by 1 readmission per 1,000 beneficiaries per quarter (posterior standard deviation = 4 readmissions per 1,000 beneficiaries per quarter). Interventions in the hospital setting had an average decrease in the number of readmissions with a reduction of 3 readmissions per 1,000 beneficiaries per quarter (posterior standard deviation = 4 readmissions per beneficiary per quarter).
Figure E-4 Grand mean posterior distribution for ED Utilization for the ambulatory, post-acute, and
hospital setting

166
For ED visits per 1,000 beneficiaries per quarter, interventions in the post-acute setting showed an increase of 25 ED visits per 1000 beneficiaries per quarter (posterior standard deviation = 8 ED visits per 1,000 beneficiaries per quarter). In contrast, interventions in the ambulatory and hospital settings showed modest decreases in the number of ED visits (reductions of 3 and 7 ED visits per 1,000 beneficiaries per quarter with posterior standard deviations = 4 and 4 ED visits per 1,000 beneficiaries per quarter, respectively).
In addition to reporting the posterior means and standard deviations from our Bayesian RE meta-analysis, in Figures E-5 through E-8 we report the probability of savings/costs (or reduced/increased utilization) for each outcome in each setting.
Figure E-5 Probability of TCOC of savings/dissavings
On average, in all three settings, HCIA interventions led to reduced costs per beneficiary per quarter. In the ambulatory setting the probability of savings was 0.72. In the post-acute and hospital-settings, the probability of savings was 0.59 and 0.66, respectively.
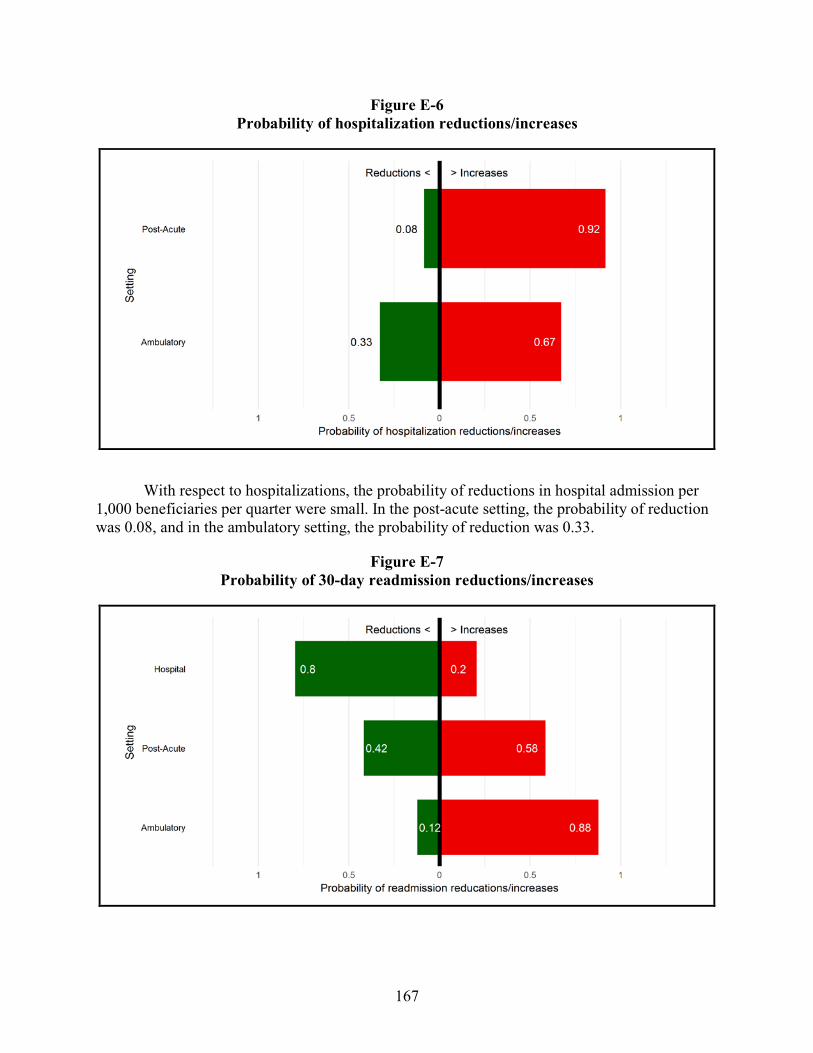
167
Figure E-6 Probability of hospitalization reductions/increases
With respect to hospitalizations, the probability of reductions in hospital admission per 1,000 beneficiaries per quarter were small. In the post-acute setting, the probability of reduction was 0.08, and in the ambulatory setting, the probability of reduction was 0.33.
Figure E-7 Probability of 30-day readmission reductions/increases

168
Across the three settings, the average effect of the HCIA interventions on 30-day readmissions per 1,000 beneficiaries was mixed. Among hospital setting interventions, the probability of readmission reduction was 0.80. However, in the post-acute setting, the probability of readmission reduction was just 0.42 and even lower in the ambulatory setting with a probability of 0.12.
Figure E-8 Probability of ED Utilization reductions/increases
With respect to ED utilization, interventions in both the ambulatory and hospital settings reduced ED utilization per 1,000 beneficiaries per quarter on average. For the ambulatory setting, the probability of ED utilization reduction was 0.81; for the hospital setting the probability of reduction was 0.94. On the other hand, for the post-acute setting, the probability of ED utilization reduction was less than 0.01.
We did not expect the findings from our Bayesian random-effects meta-analysis model to differ greatly from our findings from the frequentist random-effects model (Section 3.2), and while not identical, the meta-analytic results are consistent between the estimation methods. Bayesian estimation, however, enabled us to enrich our interpretation of our meta-analytic findings, shifting away from the language of statistical significance and towards probabilistic statements about savings and reductions in utilization across the HCIA portfolio.
E.2 Bayesian RE shrinkage estimates
In Section E.1., we presented the grand mean posterior distributions and waterfall plots for the Bayesian RE meta-analysis of the core four measures in the ambulatory, post-acute, and hospital settings. In this section, we compare the FLE-reported DID core four measure effect sizes and the synthesized, or shrinkage, estimates from our Bayesian analysis. As discussed
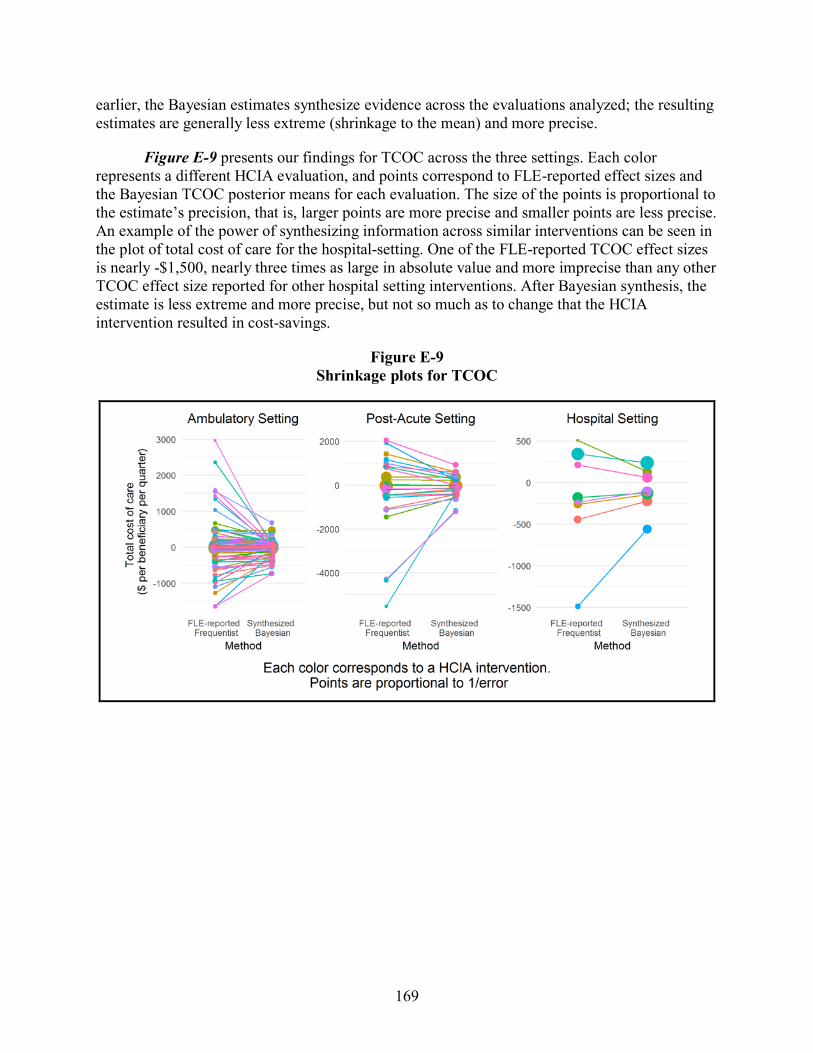
169
earlier, the Bayesian estimates synthesize evidence across the evaluations analyzed; the resulting estimates are generally less extreme (shrinkage to the mean) and more precise.
Figure E-9 presents our findings for TCOC across the three settings. Each color represents a different HCIA evaluation, and points correspond to FLE-reported effect sizes and the Bayesian TCOC posterior means for each evaluation. The size of the points is proportional to the estimate’s precision, that is, larger points are more precise and smaller points are less precise. An example of the power of synthesizing information across similar interventions can be seen in the plot of total cost of care for the hospital-setting. One of the FLE-reported TCOC effect sizes is nearly -$1,500, nearly three times as large in absolute value and more imprecise than any other TCOC effect size reported for other hospital setting interventions. After Bayesian synthesis, the estimate is less extreme and more precise, but not so much as to change that the HCIA intervention resulted in cost-savings.
Figure E-9 Shrinkage plots for TCOC
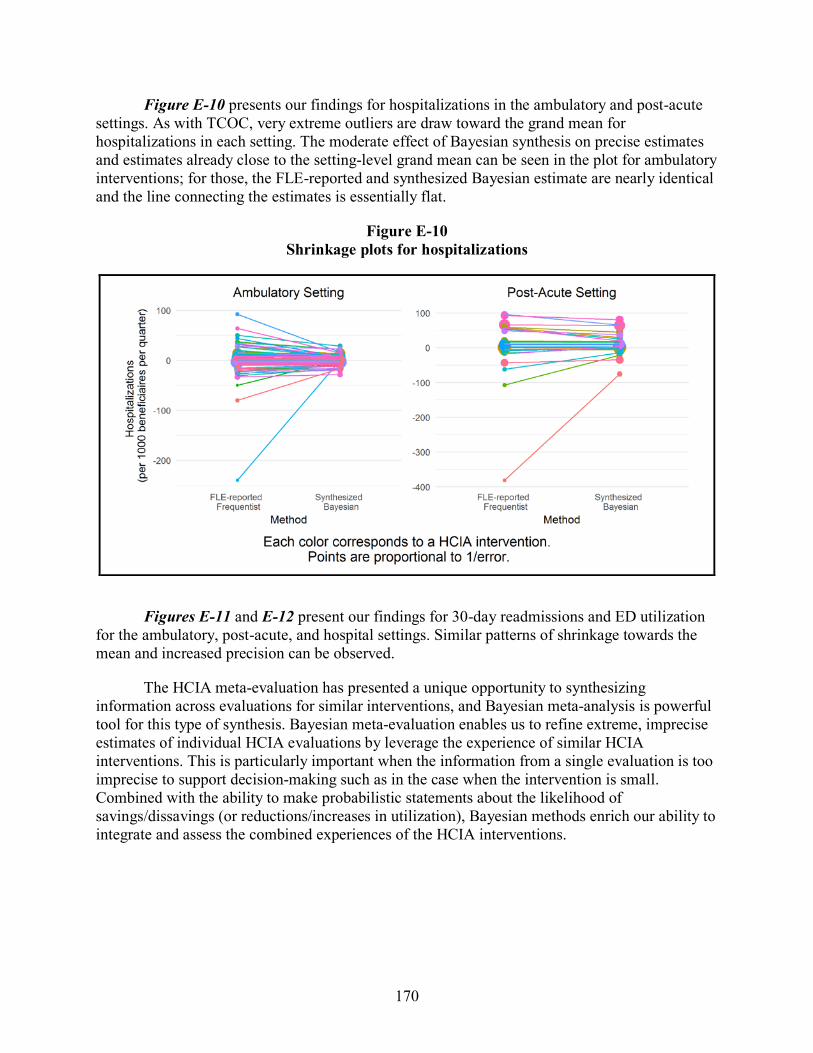
170
Figure E-10 presents our findings for hospitalizations in the ambulatory and post-acute settings. As with TCOC, very extreme outliers are draw toward the grand mean for hospitalizations in each setting. The moderate effect of Bayesian synthesis on precise estimates and estimates already close to the setting-level grand mean can be seen in the plot for ambulatory interventions; for those, the FLE-reported and synthesized Bayesian estimate are nearly identical and the line connecting the estimates is essentially flat.
Figure E-10 Shrinkage plots for hospitalizations
Figures E-11 and E-12 present our findings for 30-day readmissions and ED utilization for the ambulatory, post-acute, and hospital settings. Similar patterns of shrinkage towards the mean and increased precision can be observed.
The HCIA meta-evaluation has presented a unique opportunity to synthesizing information across evaluations for similar interventions, and Bayesian meta-analysis is powerful tool for this type of synthesis. Bayesian meta-evaluation enables us to refine extreme, imprecise estimates of individual HCIA evaluations by leverage the experience of similar HCIA interventions. This is particularly important when the information from a single evaluation is too imprecise to support decision-making such as in the case when the intervention is small. Combined with the ability to make probabilistic statements about the likelihood of savings/dissavings (or reductions/increases in utilization), Bayesian methods enrich our ability to integrate and assess the combined experiences of the HCIA interventions.

171
Figure E-11 Shrinkage plots for 30-day readmissions
Figure E-12 Shrinkage plots of ED utilization

172
[This page intentionally left blank.]

173
APPENDIX F: QUALITATIVE COMPARATIVE ANALYSES: DETAILED METHODS AND
RESULTS

174
[This page intentionally left blank.]

175
In this appendix, we provide detailed methods and results related to the qualitative comparative analyses (QCA) we conducted to examine combinations of Health Care Innovation Award (HCIA) intervention or implementation features found among interventions that demonstrated a favorable impact on utilization or costs. We conducted three separate analyses each focused on a subset of HCIA interventions:
1. Transitional care coordination interventions (N = 32)
2. Outpatient care coordination, care management, or patient navigation interventions (N = 50)
3. Patient-centered medical home interventions (PCMH) (N = 16).
Each analysis examined the utilization or cost outcomes most relevant to the nature of the intervention. For example, we examined total cost of care (TCOC), readmissions, and emergency department (ED) use outcomes for transitional care coordination interventions as these interventions would not be expected to have an impact on all-cause hospital admissions. For each analysis, we describe the criteria for HCIA awardee selection into the analysis, the HCIA awardees included in the analysis, innovation and implementation features evaluated, detailed results, and key analytic decisions and assumptions.
Innovation and implementation features. All features included in these analyses were calibrated as crisp sets (i.e., dichotomous coding) based on our structured coding of frontline evaluator (FLE) reports, implementation contractor reports, awardee-submitted progress reports, or the annual awardee summary form submitted by FLEs in 2015. These included implementation effectiveness, use of health information technology (health IT), use of community health workers (CHW), behavioral health focus, primary care focus, and presence of other interventions as part of the overall innovation approach. Not all features were included in each QCA. Table F-1 describes the features in detail, including which QCA they were used in.
We selected these features for use in the QCAs for several reasons. Some of these features have been proposed as enabling strategies that enhance the implementation and thus, ultimately the impact of the interventions (e.g., CHWs and health IT). Further, the use (or non-use) of health IT and CHWs were among the most reliably identifiable features in the secondary source materials we reviewed, relative to other possible population or intervention features that we coded. We included a feature to capture whether other intervention components were present because of the heterogeneity of innovations, and the possibility of synergy among multiple components could influence impact. For the second and third analysis, we also included a feature to discern whether the intervention included a behavioral health focus, as the populations, providers, and settings involved with providing or integrating behavioral health services add additional complexity to an already complex intervention. For the third analysis (PCMH interventions), we included a feature to discern whether the focus was within primary care settings, to discern primary care PCMH interventions from PCMH interventions occurring in specialty medical settings.
Impact Outcomes. We used the same impact outcomes for all three analyses; specifically, the difference-in-difference (DID) estimates that were provided in FLE reports for each awardee

176
intervention for TCOC, inpatient admissions, readmissions, and ED use for Medicare or Medicaid beneficiaries. When an awardee’s overall innovation included multiple interventions and separate impact estimates were reported for each intervention, we treated each intervention and estimate as a separate case. When FLEs reported separate impact estimates for Medicare and Medicaid beneficiaries for the same intervention, we also treated each estimate as a separate case. We used crisp sets to calibrate the impact outcomes using a liberal definition of “favorable effect.” If the DID estimate showed lower costs (or slowed growth in costs) or fewer admissions, readmissions, or ED visits (or slowed growth in the rate of these events) relative to the comparison group, we considered the awardee intervention as demonstrating a “favorable effect.” We could not conduct the QCA using a more stringent definition of “favorable effect” (i.e., requiring a statistically significant favorable effect) because few awardees met this criterion.
Analytic Methods. We used the “enhanced standard analysis” as described by Schneider and Wagemann to conduct all analyses. First, we conducted necessity analyses for all characteristics or features in relationship to the three outcomes we evaluated. Consistency refers to the proportion of cases with the outcome listed (either a favorable impact estimate or not favorable impact estimate) that also had the feature listed. Values can range from 0 to 1.0 and features with consistency values greater than or equal to 0.9 with a high value on the relevance of necessity measure are interpreted as relevant necessary conditions for the outcome listed. We then generated truth tables for each analysis and outcome and evaluated the consistency of sufficiency for each truth table row. Consistency of sufficiency refers to the proportion of cases with the combination of features listed that demonstrate a favorable impact. Consistency can range from 0 to 1.0 and values greater than or equal to 0.8 are generally interpreted as sufficient. If one or more truth table rows was above a consistency threshold of 0.8, we logically minimized the truth table to generate the conservative, most parsimonious, and intermediate solutions. For all intermediate solutions, our directional expectations assumed that the presence of the condition was associated with the outcome. We evaluated each solution for model ambiguity, and evaluated the plausibility and tenability of all simplifying assumptions used to generate the most parsimonious and intermediate solutions. We interpreted the intermediate solution for all analyses, except where model ambiguity was present, in which case we interpreted the conservative solution. We conducted robustness checks using a consistency threshold of 0.75 for truth table minimization where appropriate. We report coverage values for all solutions and their component terms. Coverage refers to the proportion of cases that demonstrated a favorable impact that have the combination of features identified in the solution. This parameter is only interpreted for conditions with high consistency and can range from 0 to 1.0 with higher values suggesting more empirical relevance of the combination. Solutions with low coverage (less than 0.5) suggest that the majority of cases with favorable impact estimates are note explained by the solution identified. We used R version 3.4.1 with the packages QCA (version 2.6) and SetMethods (version 2.1) to conduct all analyses (Dusa, 2017; Medzihorsky, J. et al., 2017).

177
Table F-1 Implementation and implementation features evaluated in the qualitative comparative analyses for the HCIA meta-analysis
Feature Description Calibration
Transitional CC Interventions
(N = 32)
Outpatient CC Interventions
(N = 50)
PCMH Interventions
(N = 16)
Implementation Effectiveness
Composite numeric measure based on FLE responses to multiple survey items designed to assess different aspects of implementation effectiveness (e.g., fidelity). Measure ranged from 0 (completely ineffective implementation) to 100 (completely effective implementation). Measured in 2015, which was Year 3 of innovation implementation.
Effective implementation: ≥ 90 on composite measure Not effective implementation: < 90 on composite measure
X X
Health Information Technology (health IT)
Health information technology includes electronic health record adoption or enhancement, health information exchange implementation or enhancement, telemedicine technology, or other types of technology, such as standalone decision support or population management tools.
Use of health IT: One or more health IT components played a critical or important role in the intervention No use of health IT: No health IT component, or health IT played a minor/supporting role not critical or important to the intervention delivery
X X
Community Health Workers (CHW)
Community health workers are lay people (i.e., not nurses, social workers, or staff with any clinical education or training) who are from and/or who know the community and population to whom they are providing services. Referred to using different terms by awardees: coach, advocate, community health advisor, health coordinator, navigator, liaison, peer or lay health educator, peer counselor, outreach worker.
Use of CHW: Intervention is provided in whole or in part using CHWs No use of CHW: Intervention does not use CHWs
X X
(continued)

178
Table F-1 (continued) Implementation and implementation features evaluated in the qualitative comparative analyses for the HCIA meta-analysis
Feature Description Calibration
Transitional CC Interventions
(N = 32)
Outpatient CC Interventions
(N = 50)
PCMH Interventions
(N = 16)
Behavioral Health Focus
An identifiable, behavioral health focus. Could include services related to mental health, substance abuse, or both. Evidence that this component is present includes the uses of specific behavioral health staff, coordination with behavioral health providers, or targeting of intervention to patients with behavioral health diagnoses.
Behavioral health focus present: Intervention is exclusively behavioral health or includes a component focused on behavioral health Behavioral health focus absent: Intervention does not include specific, discrete component related to behavioral health
X X
Primary Care Focus Primary care focus refers to general primary care settings in community or within integrated health systems; excludes specialty care settings or clinics designed to serve special populations based on diagnoses or complex health care needs.
Primary care focus present: Intervention implemented in general primary care practice setting Primary care focus absent: Intervention implemented in medical specialty care settings, or among patients with specific diagnoses.
X
Other Components Innovations may or may not include other interventions in addition to the main interventions under evaluation in the QCA (i.e., transitional care coordination, outpatient care coordination, or patient-centered medical home). The use of other components may enhance or detract from the main intervention, both in terms of implementation effectiveness and in terms of impact on cost or utilization outcomes. Examples of other components include interventions to increase patient engagement or support, workflow or process redesign, and direct care services.
Other components present: Innovation includes other interventions as part of the overall innovation in addition to the main intervention under evaluation in the analysis. Other components absent: The main intervention under analysis is the only intervention implemented as part of the overall innovation.
X X X
Abbreviations: CC = care coordination; CHW = community health worker; FLE = frontline evaluator report; health IT = health information technology; QCA = qualitative comparative analysis

179
F.1 Transitional Care Coordination Interventions
F.1.1 Transitional Care Coordination Awardees Included in Analysis
We included HCIA awardees in this analysis if the awardee implemented a transitional care coordination intervention and FLE-generated impact estimates used DID analyses with a comparison group. We defined transitional care coordination interventions as direct patient care delivery interventions designed to facilitate coordination of care during transitions between inpatient settings and other settings (e.g., outpatient, home, skilled nursing facilities). In many cases, these interventions began during an inpatient stay and were provided for 14 to 60 days after discharge from an acute inpatient stay. These interventions were characterized by similar intervention activities, which included transfer of relevant medical information across the continuum of care providers, scheduling and conducting routine follow up with patients during the immediate post-discharge period (by phone, through home visits, or during outpatient clinic appointments), and ensuring patients and their caregivers understood where to call or go with questions, concerns or issues that arose in the post-discharge period. A total of 43 HCIA awardees implemented innovations that included a transitional care coordination intervention, but DID impact estimates were not available for 11 awardees. Thus, 32 awardees were included in this analysis (listed in Table F-2); however, not all 32 awardees had DID estimates available for all utilization and cost outcomes evaluated in this analysis (i.e., total cost of care, readmissions, emergency department use). We did not conduct a QCA for the admissions outcome, as transitional care coordination interventions would not be expected to influence all-cause admissions independent of their effect on readmissions.

180
Table F-2 HCIA included in the qualitative comparative analysis of transitional care coordination
interventions (N = 32)
Portfolio Awardee
Community Regional Emergency Medical Services Authority Community Women & Infants Hospital of Rhode Island Community The Curators of the University of Missouri Community Michigan Public Health Institute (Medicare) Community Michigan Public Health Institute (Medicaid) Community Prosser Public Hospital District(Medicare) Community Prosser Public Hospital District (Medicaid) Complex Providence Portland Medical Center (Care Coordination) Complex Providence Portland Medical Center (Transitional Care Coordination C Train Model)
Complex Providence Portland Medical Center (Transitional Care Coordination Intensive Transition Teams Model)
Complex Pittsburgh Regional Health Initiative Complex Suttercare Corporation Complex Vanderbilt University Medical Center Complex Beth Israel Deaconess Medical Center Complex University of Iowa Health Care Complex Courage Center (Medicare) Complex Courage Center (Medicaid) Complex The University of Texas Health Science Center at Houston Complex The Johns Hopkins University-CHIP (Medicare) Complex The Johns Hopkins University-CHIP (Medicaid) Complex St. Francis Healthcare Foundation of Hawaii Disease Vanderbilt University Medical Center (My Health Team) Disease Alfred I. duPont Hospital for Child NCC-‐W of the Nemours Foundation Disease Christiana Care Health Services, Inc. Disease Ochsner Clinic Foundation - Stroke Mobile Hospital The Methodist Hospital Research Institute—Delirium Hospital The University of Chicago Hospital Mount Sinai School of Medicine MMSDM University of Hawaii: Pharm2Pharm Primary Care PeaceHealth Ketchikan Medical Center Primary Care Research Institute at Nationwide Children’s Hospital Primary Care Rutgers, The State University of New Jersey Primary Care Atlantic General Hospital

181
F.1.2 Transitional Care Coordination Results
Total Cost of Care
Of 30 cases with this outcome reported, 15 demonstrated a favorable impact on total cost of care and 15 did not demonstrate a favorable effect.
We identified no features that were necessary for a favorable impact estimate on total cost of care (Table F-3).
Table F-3 Necessity analyses for transitional care coordination interventions for the total cost of care
outcome
Characteristic or feature Total cost of care
outcomea Consistencyb Coveragec Relevance of
necessityd Effective implementation Favorable 0.333 0.385 0.680 Not effective implementation Favorable 0.667 0.588 0.650 Effective implementation Not favorable 0.533 0.615 0.773 Not effective implementation Not favorable 0.467 0.412 0.565 Any use of health IT Favorable 0.133 0.182 0.679 No use of health IT Favorable 0.867 0.684 0.647 Any use of health IT Not favorable 0.600 0.818 0.905 No use of health IT Not favorable 0.400 0.316 0.458 Use of CHW Favorable 0.267 0.667 0.923 No use of CHW Favorable 0.733 0.458 0.316 Use of CHW Not favorable 0.133 0.333 0.857 No use of CHW Not favorable 0.867 0.542 0.353 Presence of other components within innovation Favorable 0.333 0.625 0.880 Absence of other components within innovation Favorable 0.667 0.455 0.400 Presence of other components within innovation Not favorable 0.200 0.375 0.815 Absence of other components within innovation Not favorable 0.800 0.545 0.444
Abbreviations: CHW = community health worker; health IT= health information technology a A favorable impact was defined as a difference-in-difference estimate suggesting slowed growth in total cost of care expenditures (or cost savings) relative to a comparison group. Some favorable estimates may have been statistically significant (at α= 0.10), but statistical significance was not used to define favorable impact for these analyses as this approach would have limited the ability to use this analytic approach because most cases did not demonstrate a statistically significant favorable impact. b Consistency refers to the proportion of cases with the outcome listed (either a favorable impact estimate or not favorable impact estimate) that also had the feature listed. Values can range from 0 to 1.0 and features with consistency values ≥ 0.9 are interpreted as necessary conditions for the outcome listed. c This parameter is only interpreted for conditions with high consistency (≥ 0.9). It refers to the proportion of cases with the feature listed that also demonstrated the outcome listed (either a favorable impact estimate or not favorable impact estimate). Values can range from 0 to 1.0 and conditions with higher values are interpreted as more relevant. However, in some instances this parameter can produce artificially high values, thus relevance should also be assessed with the relevance of necessity parameter. d This parameter is only interpreted for conditions with high consistency (≥ 0.9). It reflects the degree to which a feature is a relevant (i.e., non-trivial) necessary condition. Values can range from 0 to 1.0 and higher values suggest more relevance.
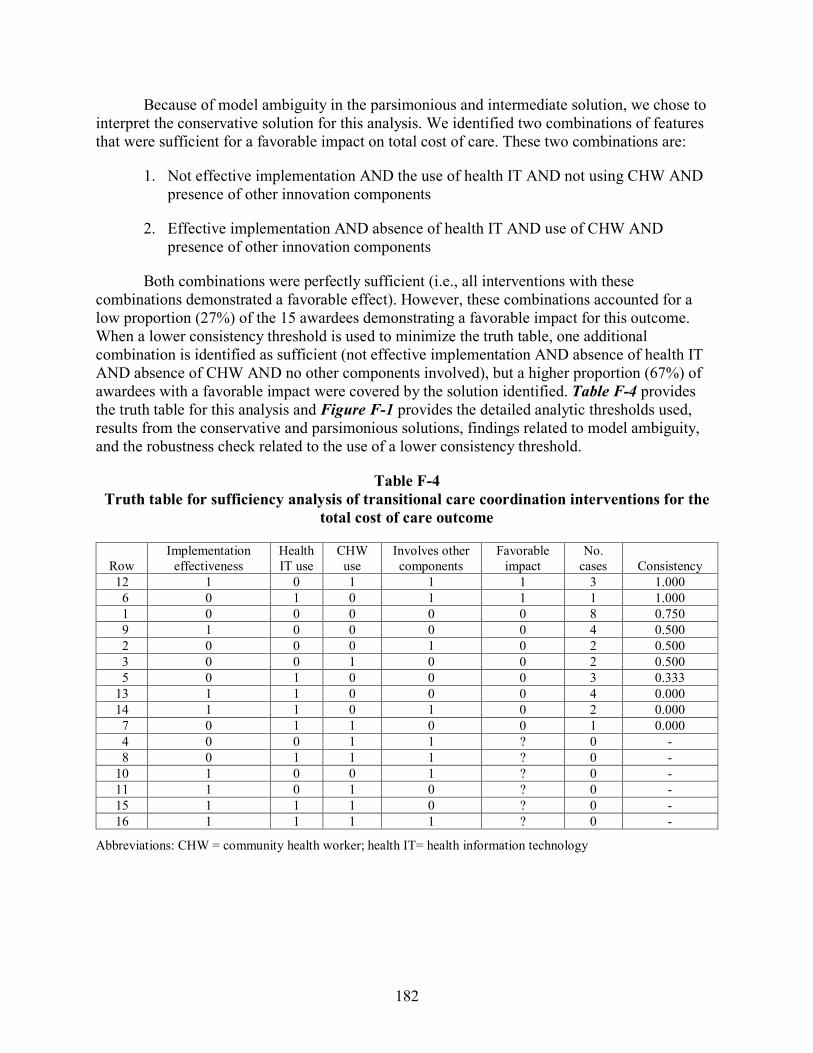
182
Because of model ambiguity in the parsimonious and intermediate solution, we chose to interpret the conservative solution for this analysis. We identified two combinations of features that were sufficient for a favorable impact on total cost of care. These two combinations are:
1. Not effective implementation AND the use of health IT AND not using CHW AND presence of other innovation components
2. Effective implementation AND absence of health IT AND use of CHW AND presence of other innovation components
Both combinations were perfectly sufficient (i.e., all interventions with these combinations demonstrated a favorable effect). However, these combinations accounted for a low proportion (27%) of the 15 awardees demonstrating a favorable impact for this outcome. When a lower consistency threshold is used to minimize the truth table, one additional combination is identified as sufficient (not effective implementation AND absence of health IT AND absence of CHW AND no other components involved), but a higher proportion (67%) of awardees with a favorable impact were covered by the solution identified. Table F-4 provides the truth table for this analysis and Figure F-1 provides the detailed analytic thresholds used, results from the conservative and parsimonious solutions, findings related to model ambiguity, and the robustness check related to the use of a lower consistency threshold.
Table F-4 Truth table for sufficiency analysis of transitional care coordination interventions for the
total cost of care outcome
Row Implementation
effectiveness Health IT use
CHW use
Involves other components
Favorable impact
No. cases Consistency
12 1 0 1 1 1 3 1.000 6 0 1 0 1 1 1 1.000 1 0 0 0 0 0 8 0.750 9 1 0 0 0 0 4 0.500 2 0 0 0 1 0 2 0.500 3 0 0 1 0 0 2 0.500 5 0 1 0 0 0 3 0.333
13 1 1 0 0 0 4 0.000 14 1 1 0 1 0 2 0.000 7 0 1 1 0 0 1 0.000 4 0 0 1 1 ? 0 - 8 0 1 1 1 ? 0 -
10 1 0 0 1 ? 0 - 11 1 0 1 0 ? 0 - 15 1 1 1 0 ? 0 - 16 1 1 1 1 ? 0 -
Abbreviations: CHW = community health worker; health IT= health information technology

183
Figure F-1 Solutions generated from sufficiency analyses for transitional care coordination
interventions for the Total Cost of Care outcome
Note: Upper case indicates presence of characteristic or features and lowercase indicates absence of characteristic or feature.
Abbreviations: CHW = community health worker; HIT = health information technology; impeff = implementation effectiveness a Consistency refers to the proportion of cases with the combination of features listed that demonstrate a favorable impact. Each combination of features that comprises the overall solution has a consistency value, as does the overall solution. Consistency can range from 0 to 1.0 and values ≥ 0.8 are generally interpreted as strongly sufficient. b Coverage refers to the proportion of cases that demonstrated a favorable impact that have the combination of features. This parameter is only interpreted for conditions with high consistency and can range from 0 to 1.0 with higher values suggesting more empirical relevance of the combination. Row coverage refers to the proportion of cases that demonstrate a favorable impact that are covered by the combination, unique coverage refers to the proportion of cases that demonstrate a favorable impact that are ONLY covered by the combination.

184
The awardee cases covered by the identified combination demonstrating a favorable impact on total costs of care were diverse and included the Women & Infants Hospital of Rhode Island, Courage Kenny Rehabilitation Institute, and Mount Sinai School of Medicine. The Women & Infants Hospital of Rhode Island targeted high risk neonates and was delivered by a team of staff, including nurse practitioners, social worker, and included a lay parent peer as the CHW, whereas the Courage Center provided transitional care coordination intervention as one of several interventions provided as part of an overall PCMH intervention in a neuromuscular rehabilitation specialty setting for patients with neuromuscular disabilities and stroke. The Mount Sinai School of Medicine implemented structural enhancements and geriatric clinical protocols in the emergency department, including a transitional care team for geriatric patients in the ED.
Readmissions
Of the 21 cases with this outcome reported, 6 demonstrated a favorable impact on readmissions and 15 did not demonstrate a favorable effect.
We identified no features that were necessary for a favorable impact on readmissions (Table F-5).

185
Table F-5 Necessity analyses for transitional care coordination interventions for the readmissions
outcome
Condition Readmissions
outcomea Consistencyb Coveragec Relevance of
necessityd Effective implementation Favorable 0.333 0.400 0.842 Not effective implementation Favorable 0.667 0.250 0.294 Effective implementation Not favorable 0.200 0.600 0.889 Not effective implementation Not favorable 0.800 0.750 0.556 Any use of health IT Favorable 0.333 0.222 0.632 No use of health IT Favorable 0.667 0.333 0.529 Any use of health IT Not favorable 0.467 0.778 0.857 No use of health IT Not favorable 0.533 0.667 0.692 Use of CHW Favorable 0.000 0.000 0.905 No use of CHW Favorable 1.000 0.316 0.133 Use of CHW Not favorable 0.133 1.000 1.000 No use of CHW Not favorable 0.867 0.684 0.250 Presence of other components within innovation
Favorable 0.333 0.333 0.789
Absence of other components within innovation
Favorable 0.667 0.267 0.353
Presence of other components within innovation
Not favorable 0.267 0.667 0.882
Absence of other components within innovation
Not favorable 0.733 0.733 0.600
Abbreviations: CHW = community health worker; health IT= health information technology a A favorable impact was defined as a difference-in-difference estimate suggesting slowed growth in total cost of care expenditures (or cost savings) relative to a comparison group. Some favorable estimates may have been statistically significant (at α= 0.10), but statistical significance was not used to define favorable impact for these analyses as this approach would have limited the ability to use this analytic approach because most cases did not demonstrate a statistically significant favorable impact. b Consistency refers to the proportion of cases with the outcome listed (either a favorable impact estimate or not favorable impact estimate) that also had the feature listed. Values can range from 0 to 1.0 and features with consistency values ≥ 0.9 are interpreted as necessary conditions for the outcome listed. c This parameter is only interpreted for conditions with high consistency (≥ 0.9). It refers to the proportion of cases with the feature listed that also demonstrated the outcome listed (either a favorable impact estimate or not favorable impact estimate). Values can range from 0 to 1.0 and conditions with higher values are interpreted as more relevant. However, in some instances this parameter can produce artificially high values, thus relevance should also be assessed with the relevance of necessity parameter. d This parameter is only interpreted for conditions with high consistency (≥ 0.9). It reflects the degree to which a feature is a relevant (i.e., non-trivial) necessary condition. Values can range from 0 to 1.0 and higher values suggest more relevance.
Using the intermediate solution, we identified one combination of features that was sufficient for a favorable impact on readmissions outcomes. This combination is effective implementation AND absence of health IT. This combination was perfectly sufficient (i.e., all interventions with these combinations demonstrated a favorable effect). However, this

186
combination accounted for a low proportion (17%) of the six awardees demonstrating a favorable impact for this outcome.
The truth table for this analysis is provided in Table F-6 and Figure F-2 provides the detailed analytic thresholds used and results from the conservative, parsimonious, and intermediate solutions; no robustness checks related to the use of a lower or higher consistency thresholds were required given no truth table row consistency values fell near the threshold we used.
Table F-6 Truth table for sufficiency analysis of transitional care coordination interventions for the
readmissions outcome
Row Implementation
effectiveness Health IT use
CHW use
Involves other components
Favorable impact No. cases Consistency
9 1 0 0 0 1 1 1.000 2 0 0 0 1 0 2 0.500 6 0 1 0 1 0 2 0.500 13 1 1 0 0 0 2 0.500 1 0 0 0 0 0 7 0.286 5 0 1 0 0 0 3 0.000 3 0 0 1 0 0 2 0.000 14 1 1 0 1 0 2 0.000 4 0 0 1 1 ? 0 - 7 0 1 1 0 ? 0 - 8 0 1 1 1 ? 0 - 10 1 0 0 1 ? 0 - 11 1 0 1 0 ? 0 - 12 1 0 1 1 ? 0 - 15 1 1 1 0 ? 0 - 16 1 1 1 1 ? 0 -
Abbreviations: CHW = community health worker; health IT= health information technology

187
Figure F-2 Solutions generated from sufficiency analyses for transitional care coordination
interventions for the readmissions outcome
Note: Upper case indicates presence of characteristic or features and lowercase indicates absence of characteristic or feature.
Abbreviations: CHW = community health worker; HIT = health information technology; impeff = implementation effectiveness a Consistency refers to the proportion of cases with the combination of features listed that demonstrate a favorable impact. Each combination of features that comprises the overall solution has a consistency value, as does the overall solution. Consistency can range from 0 to 1.0 and values ≥ 0.8 are generally interpreted as strongly sufficient. b Coverage refers to the proportion of cases that demonstrated a favorable impact that have the combination of features. This parameter is only interpreted for conditions with high consistency and can range from 0 to 1.0 with higher values suggesting more empirical relevance of the combination. Row coverage refers to the proportion of cases that demonstrate a favorable impact that are covered by the combination, unique coverage refers to the proportion of cases that demonstrate a favorable impact that are ONLY covered by the combination.
Emergency Department Use
Of the 32 cases with this outcome reported, 16 demonstrated a favorable impact on emergency department use, and 16 did not demonstrate a favorable effect.
We identified no features that were necessary for a favorable impact on emergency department use (Table F-7).

188
Table F-7 Necessity analyses for transitional care coordination interventions for the emergency
department use outcome
Condition
Emergency department
use outcomea Consistencyb Coveragec Relevance of
necessityd Effective implementation Favorable 0.438 0.500 0.720 Not effective implementation Favorable 0.562 0.500 0.609 Effective implementation Not favorable 0.438 0.500 0.720 Not effective implementation Not favorable 0.562 0.500 0.609 Any use of health IT Favorable 0.375 0.500 0.769 No use of health IT Favorable 0.625 0.500 0.545 Any use of health IT Not favorable 0.375 0.500 0.769 No use of health IT Not favorable 0.625 0.500 0.545 Use of CHW Favorable 0.250 0.571 0.893 No use of CHW Favorable 0.750 0.480 0.350 Use of CHW Not favorable 0.188 0.429 0.862 No use of CHW Not favorable 0.812 0.520 0.368 Presence of other components within innovation Favorable 0.312 0.556 0.852 Absence of other components within innovation Favorable 0.688 0.478 0.429 Presence of other components within innovation Not favorable 0.250 0.444 0.821 Absence of other components within innovation Not favorable 0.750 0.522 0.450
Abbreviations: CHW = Community Health Worker; health IT= health information technology; TCOC = Total Cost of Care a A favorable impact was defined as a difference-in-difference estimate suggesting slowed growth in total cost of care expenditures (or cost savings) relative to a comparison group. Some favorable estimates may have been statistically significant (at α= 0.10), but statistical significance was not used to define favorable impact for these analyses as this approach would have limited the ability to use this analytic approach because most cases did not demonstrate a statistically significant favorable impact. b Consistency refers to the proportion of cases with the outcome listed (either a favorable impact estimate or not favorable impact estimate) that also had the feature listed. Values can range from 0 to 1.0 and features with consistency values ≥ 0.9 are interpreted as necessary conditions for the outcome listed. c This parameter is only interpreted for conditions with high consistency (≥ 0.9). It refers to the proportion of cases with the feature listed that also demonstrated the outcome listed (either a favorable impact estimate or not favorable impact estimate). Values can range from 0 to 1.0 and conditions with higher values are interpreted as more relevant. However, in some instances this parameter can produce artificially high values, thus relevance should also be assessed with the relevance of necessity parameter. d This parameter is only interpreted for conditions with high consistency (≥ 0.9). It reflects the degree to which a feature is a relevant (i.e., non-trivial) necessary condition. Values can range from 0 to 1.0 and higher values suggest more relevance.
Using the intermediate solution, we identified two combinations of features that were sufficient for a favorable impact on emergency department use outcomes. These two combinations are:
1. Use of health IT AND use of CHWs
2. Effective implementation AND the use of health IT AND presence of other innovation components

189
Both combinations were perfectly sufficient (i.e., all interventions with these combinations demonstrated a favorable effect). However, these combinations accounted for a low proportion (31%) of the 16 awardees demonstrating a favorable impact for this outcome. Table F-8 provides the truth table for this analysis and Figure F-3 provides the detailed analytic thresholds used and results from the conservative and parsimonious solutions; no robustness checks related to the use of a lower or higher consistency thresholds were required given no truth table row consistency values fell near the threshold we used.
Table F-8 Truth table for sufficiency analysis of transitional care coordination interventions for the
emergency department use outcome
Row Implementation
effectiveness Health IT use
CHW use
Involves other components
Favorable impact No. cases Consistency
14 1 1 0 1 1 2 1.000 7 0 1 1 0 1 1 1.000
16 1 1 1 1 1 1 1.000 1 0 0 0 0 0 9 0.556 9 1 0 0 0 0 4 0.500 2 0 0 0 1 0 2 0.500 3 0 0 1 0 0 2 0.500 5 0 1 0 0 0 3 0.333
12 1 0 1 1 0 3 0.333 13 1 1 0 0 0 4 0.250 6 0 1 0 1 0 1 0.000 4 0 0 1 1 ? 0 - 8 0 1 1 1 ? 0 -
10 1 0 0 1 ? 0 - 11 1 0 1 0 ? 0 - 15 1 1 1 0 ? 0 -
Abbreviations: CHW = community health worker; health IT= health information technology
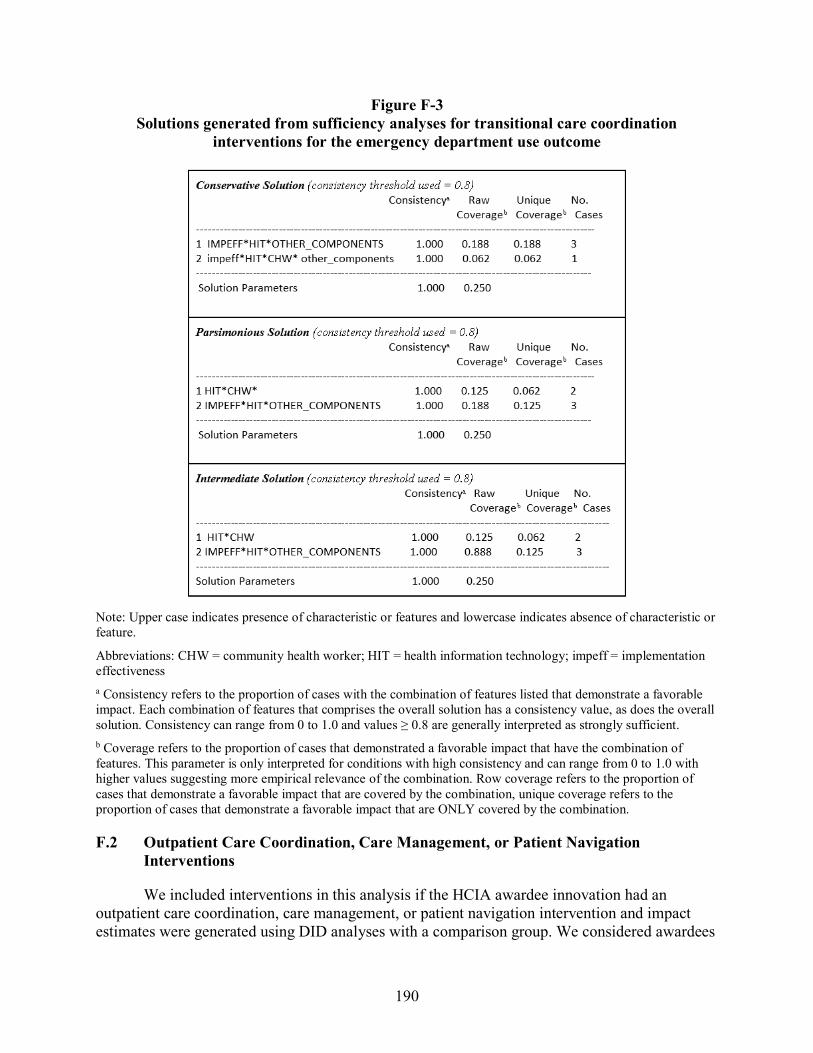
190
Figure F-3 Solutions generated from sufficiency analyses for transitional care coordination
interventions for the emergency department use outcome
Note: Upper case indicates presence of characteristic or features and lowercase indicates absence of characteristic or feature.
Abbreviations: CHW = community health worker; HIT = health information technology; impeff = implementation effectiveness a Consistency refers to the proportion of cases with the combination of features listed that demonstrate a favorable impact. Each combination of features that comprises the overall solution has a consistency value, as does the overall solution. Consistency can range from 0 to 1.0 and values ≥ 0.8 are generally interpreted as strongly sufficient. b Coverage refers to the proportion of cases that demonstrated a favorable impact that have the combination of features. This parameter is only interpreted for conditions with high consistency and can range from 0 to 1.0 with higher values suggesting more empirical relevance of the combination. Row coverage refers to the proportion of cases that demonstrate a favorable impact that are covered by the combination, unique coverage refers to the proportion of cases that demonstrate a favorable impact that are ONLY covered by the combination.
F.2 Outpatient Care Coordination, Care Management, or Patient Navigation Interventions
We included interventions in this analysis if the HCIA awardee innovation had an outpatient care coordination, care management, or patient navigation intervention and impact estimates were generated using DID analyses with a comparison group. We considered awardees

191
as having this type of intervention if a discrete intervention designed to facilitate the care coordination or care management primarily within or across outpatient care settings, including primary care, specialty care, behavioral health care, or community services. These interventions were quite heterogenous with respect to intensity, type of staff involved in providing, duration of services, criteria for patient enrollment in services, and type of services/care provided. Some focused exclusively on care management of a single diagnosis (e.g., diabetes) whereas others focused more broadly on coordination of care between or among multiple providers, agnostic to any specific diagnosis. A total of 62 awardees had innovations that included outpatient care coordination, management, or navigation interventions, but 12 did not have DID estimates. Thus, 50 awardees were included in this analysis (Table F-9); however, not all 50 awardees had DID estimates available for all utilization and cost outcomes evaluated (total cost of care, hospital admissions, hospital readmissions, emergency department use). We did not conduct analyses for the readmissions outcome, as outpatient care coordination interventions would not be expected to influence readmissions independent of their effect on admissions.
Table F-9 HCIA awardees included in the qualitative comparative analysis of outpatient care
coordination, care management, or patient navigation interventions (N = 50)
Portfolio Awardee Behavioral HealthLinkNow Inc. Behavioral Maimonides Medical Center (Medicare) Behavioral Maimonides Medical Center (Medicaid) Behavioral ValueOptions Inc. Behavioral Fund for Public Health in New York, Inc. Community South County Community Health Center, Inc. Community Children’s Hospital and Health System, Inc. Community Southeast Mental Health Services (Medicare) Community Southeast Mental Health Services (Medicaid) Community The Curators of the University of Missouri (Medicare) Community The Curators of the University of Missouri (Medicaid) Community Ben Archer Health Center (Medicare) Community Ben Archer Health Center (Medicaid) Community Michigan Public Health Institute (Medicare) Community Michigan Public Health Institute (Medicaid) Community The Asian Americans for Community Involvement of Santa Clara (Medicare) Community The Asian Americans for Community Involvement of Santa Clara (Medicaid) Complex Providence Portland Medical Center Complex Suttercare Corporation Complex South Carolina Research Foundation Complex University Emergency Medical Services, Inc. Complex Courage Center (Medicare) Complex Courage Center (Medicaid) Complex Northland Healthcare Alliance Complex The Johns Hopkins University-CHIP (Medicare) Complex The Johns Hopkins University-CHIP (Medicaid) Complex LifeLong Medical Care Complex St. Francis Healthcare Foundation of Hawaii
(continued)

192
Table F-9 (continued) HCIA awardees included in the qualitative comparative analysis of outpatient care
coordination, care management, or patient navigation interventions (N = 50)
Portfolio Awardee Disease Vanderbilt University Medical Center Disease Regents of the University of California, Los Angeles Disease Trustees of Indiana University Disease The George Washington University Disease Alfred I. duPont Hospital for Child NCC-‐W of the Nemours Foundation Disease Duke University Disease Mountain Area Health Education Center, Inc. Disease University of Alabama at Birmingham Disease University of Alabama at Birmingham (End of Life) Disease Christiana Care Health Services, Inc. Disease The Rector and Visitors of the University of Virginia Disease Health Resources in Action, Inc. Disease Le Bonheur Community Health and Well-Being Disease FirstVitals Health and Wellness Inc. Hospital The University of Chicago MMSDM Trustees of Dartmouth College—Patient Engagement Primary PeaceHealth Ketchikan Medical Center Primary CareFirst, Inc. Primary University Hospitals of Cleveland Primary Pacific Business Group on Health Primary Finger Lakes Health Systems Agency Primary Denver Health and Hospital Authority
Total Cost of Care Of the 48 cases with this outcome reported, 23 demonstrated a favorable impact on total
cost of care and 25 did not demonstrate a favorable effect.
We identified no features that were necessary for a favorable impact estimate on total cost of care (Table F-10).

193
Table F-10 Necessity analyses for outpatient care coordination, care management, or patient
navigation for the total cost of care outcome
Condition Total cost of
care outcomea Consistencyb Coveragec Relevance of
necessityd Effective implementation Favorable 0.130 0.300 0.844 Not effective implementation Favorable 0.870 0.526 0.357 Effective implementation Not favorable 0.280 0.700 0.927 Not effective implementation Not favorable 0.720 0.474 0.333 Any use of health IT Favorable 0.304 0.389 0.732 No use of health IT Favorable 0.696 0.533 0.562 Any use of health IT Not favorable 0.440 0.611 0.811 No use of health IT Not favorable 0.560 0.467 0.529 Use of CHW Favorable 0.783 0.621 0.633 No use of CHW Favorable 0.217 0.263 0.674 Use of CHW Not favorable 0.440 0.379 0.514 No use of CHW Not favorable 0.560 0.737 0.853 Presence of other components within innovation Favorable 0.565 0.619 0.771 Absence of other components within innovation Favorable 0.435 0.370 0.553 Presence of other components within innovation Not favorable 0.320 0.381 0.675 Absence of other components within innovation Not favorable 0.680 0.630 0.677 Presence of Behavioral Health Focus Favorable 0.478 0.550 0.757 Absence of Behavioral Health Focus Favorable 0.522 0.429 0.556 Presence of Behavioral Health Focus Not favorable 0.360 0.450 0.718 Absence of Behavioral Health Focus Not favorable 0.640 0.571 0.625
Abbreviations: CHW = Community Health Worker; health IT= health information technology a A favorable impact was defined as a difference-in-difference estimate suggesting slowed growth in total cost of care expenditures (or cost savings) relative to a comparison group. Some favorable estimates may have been statistically significant (at α= 0.10), but statistical significance was not used to define favorable impact for these analyses as this approach would have limited the ability to use this analytic approach because most cases did not demonstrate a statistically significant favorable impact. b Consistency refers to the proportion of cases with the outcome listed (either a favorable impact estimate or not favorable impact estimate) that also had the feature listed. Values can range from 0 to 1.0 and features with consistency values ≥ 0.9 are interpreted as necessary conditions for the outcome listed. c This parameter is only interpreted for conditions with high consistency (≥ 0.9). It refers to the proportion of cases with the feature listed that also demonstrated the outcome listed (either a favorable impact estimate or not favorable impact estimate). Values can range from 0 to 1.0 and conditions with higher values are interpreted as more relevant. However, in some instances this parameter can produce artificially high values, thus relevance should also be assessed with the relevance of necessity parameter. d This parameter is only interpreted for conditions with high consistency (≥ 0.9). It reflects the degree to which a feature is a relevant (i.e., non-trivial) necessary condition. Values can range from 0 to 1.0 and higher values suggest more relevance.

194
Based on the intermediate solution, we identified three combinations of features that were sufficient for a favorable impact on total cost of care. These three combinations are:
1. Use of CHWs AND presence of other innovation components AND behavioral health focus
2. Not effective implementation AND use of health IT AND presence of other innovation components AND no behavioral health focus
3. Not effective implementation AND no use of health IT AND use of CHW AND no other innovation components AND no behavioral health focus
One combination (Number 2 above) was perfectly sufficient (i.e., all interventions with these combinations demonstrated a favorable effect); the other two combinations were moderately consistent. These combinations accounted for just over half (61%) of the 23 awardees demonstrating a favorable impact for this outcome. Table F-11 provides the truth table for this analysis, and Figure F-4 provides the detailed analytic thresholds used, results of the conservative, intermediate, and parsimonious solutions, and findings related to robustness checks.

195
Table F-11 Truth table for sufficiency analysis of outpatient care coordination, care management, or
patient navigation interventions for the total cost of care outcome
Row Implementation
effectiveness Health IT use
CHW use
Involves other components
Behavioral health focus
Favorable impact No. cases Consistency
11 0 1 0 1 0 1 2 1.000 24 1 0 1 1 1 1 2 1.000 15 0 1 1 1 0 1 1 1.000 32 1 1 1 1 1 1 1 1.000 5 0 0 1 0 0 1 5 0.800 8 0 0 1 1 1 1 5 0.800 14 0 1 1 0 1 0 3 0.667 3 0 0 0 1 0 0 4 0.500 6 0 0 1 0 1 0 4 0.500 1 0 0 0 0 0 0 2 0.500 7 0 0 1 1 0 0 3 0.333 13 0 1 1 0 0 0 3 0.333 9 0 1 0 0 0 0 3 0.000 17 1 0 0 0 0 0 2 0.000 2 0 0 0 0 1 0 1 0.000 4 0 0 0 1 1 0 1 0.000 12 0 1 0 1 1 0 1 0.000 21 1 0 1 0 0 0 1 0.000 25 1 1 0 0 0 0 1 0.000 26 1 1 0 0 1 0 1 0.000 27 1 1 0 1 0 0 1 0.000 30 1 1 1 0 1 0 1 0.000 10 0 1 0 0 1 ? 0 - 16 0 1 1 1 1 ? 0 - 18 1 0 0 0 1 ? 0 - 19 1 0 0 1 0 ? 0 - 20 1 0 0 1 1 ? 0 - 22 1 0 1 0 1 ? 0 - 23 1 0 1 1 0 ? 0 - 28 1 1 0 1 1 ? 0 - 29 1 1 1 0 0 ? 0 - 31 1 1 1 1 0 ? 0 -
Abbreviations: CHW = Community Health Worker; health IT= health information technology

196
Figure F-4 Solutions generated from sufficiency analyses for outpatient care coordination, care management, or patient navigation interventions for the total cost of care outcome
Conservative Solution (consistency threshold used = 0.8) Consistency a Raw Unique No. Coverage b Coverage b Cases ——————————————————————————————————————————————————————— 1 hit*CHW*OTHER_COMPONENTS*BEHAV_HEALTH 0.857 0.261 0.174 7 2 IMPEFF*CHW* OTHER_COMPONENTS*BEHAV_HEALTH 1.000 0.130 0.043 3 3 impeff*HIT*OTHER_COMPONENTS*behav_health 1.000 0.130 0.130 3 4 impeff*hit*CHW*other_components*behav_health 0.800 0.174 0.174 5 ——————————————————————————————————————————————————————— Solution Parameters 0.875 0.609 Robustness Check: Use of 0.75 Consistency Threshold results in solution consistency 0.875 and coverage 0.609 with the same solution terms produced. Parsimonious Solution (consistency threshold used = 0.8) Consistency a Raw Unique No. Coverage b Coverage b Cases ——————————————————————————————————————————————————————— 1 CHW*OTHER_COMPONENTS*BEHAV_HEALTH 0.875 0.304 0.304 8 2 impeff*HIT*OTHER_COMPONENTS*behav_health 1.000 0.130 0.130 3 3 impeff*hit*CHW*other_components*behav_health 0.800 0.174 0.174 5 ——————————————————————————————————————————————————————— Solution Parameters 0.875 0.609 Robustness Check: Use of 0.75 Consistency Threshold results in solution consistency 0.875 and solution coverage 0.609 with the same solution terms produced. Intermediate Solution (consistency threshold used = 0.8) Consistency a Raw Unique No. Coverage b Coverage b Cases ——————————————————————————————————————————————————————— 1 CHW *OTHER_COMPONENTS*BEHAV_HEALTH 0.875 0.304 0.304 8 2 impeff*HIT*OTHER_COMPONENTS*behav_health 1.000 0.130 0.130 3 3 impeff*hit*CHW*other_components*behav_health 0.800 0.174 0.174 5 ——————————————————————————————————————————————————————— Solution Parameters 0.875 0.609 Robustness Check: Use of 0.75 Consistency Threshold results in solution consistency 0.875 and coverage 0.609 with the same solution terms produced.
Note: Upper case indicates presence of characteristic or features and lowercase indicates absence of characteristic or feature.
Abbreviations: CHW = community health worker; HIT = health information technology; impeff = implementation effectiveness a Consistency refers to the proportion of cases with the combination of features listed that demonstrate a favorable impact. Each combination of features that comprises the overall solution has a consistency value, as does the overall solution. Consistency can range from 0 to 1.0 and values ≥ 0.8 are generally interpreted as strongly sufficient. b Coverage refers to the proportion of cases that demonstrated a favorable impact that have the combination of features. This parameter is only interpreted for conditions with high consistency and can range from 0 to 1.0 with higher values suggesting more empirical relevance of the combination. Row coverage refers to the proportion of cases that demonstrate a favorable impact that are covered by the combination, unique coverage refers to the proportion of cases that demonstrate a favorable impact that are ONLY covered by the combination.
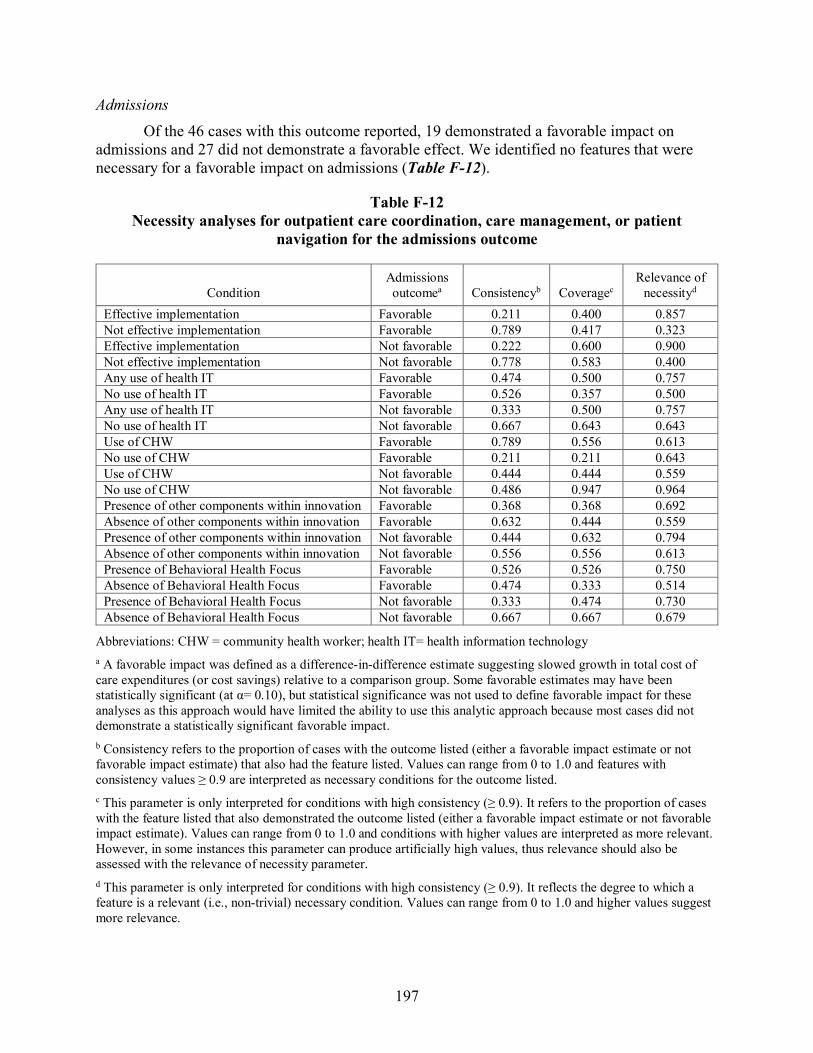
197
Admissions
Of the 46 cases with this outcome reported, 19 demonstrated a favorable impact on admissions and 27 did not demonstrate a favorable effect. We identified no features that were necessary for a favorable impact on admissions (Table F-12).
Table F-12 Necessity analyses for outpatient care coordination, care management, or patient
navigation for the admissions outcome
Condition Admissions outcomea Consistencyb Coveragec
Relevance of necessityd
Effective implementation Favorable 0.211 0.400 0.857 Not effective implementation Favorable 0.789 0.417 0.323 Effective implementation Not favorable 0.222 0.600 0.900 Not effective implementation Not favorable 0.778 0.583 0.400 Any use of health IT Favorable 0.474 0.500 0.757 No use of health IT Favorable 0.526 0.357 0.500 Any use of health IT Not favorable 0.333 0.500 0.757 No use of health IT Not favorable 0.667 0.643 0.643 Use of CHW Favorable 0.789 0.556 0.613 No use of CHW Favorable 0.211 0.211 0.643 Use of CHW Not favorable 0.444 0.444 0.559 No use of CHW Not favorable 0.486 0.947 0.964 Presence of other components within innovation Favorable 0.368 0.368 0.692 Absence of other components within innovation Favorable 0.632 0.444 0.559 Presence of other components within innovation Not favorable 0.444 0.632 0.794 Absence of other components within innovation Not favorable 0.556 0.556 0.613 Presence of Behavioral Health Focus Favorable 0.526 0.526 0.750 Absence of Behavioral Health Focus Favorable 0.474 0.333 0.514 Presence of Behavioral Health Focus Not favorable 0.333 0.474 0.730 Absence of Behavioral Health Focus Not favorable 0.667 0.667 0.679
Abbreviations: CHW = community health worker; health IT= health information technology a A favorable impact was defined as a difference-in-difference estimate suggesting slowed growth in total cost of care expenditures (or cost savings) relative to a comparison group. Some favorable estimates may have been statistically significant (at α= 0.10), but statistical significance was not used to define favorable impact for these analyses as this approach would have limited the ability to use this analytic approach because most cases did not demonstrate a statistically significant favorable impact. b Consistency refers to the proportion of cases with the outcome listed (either a favorable impact estimate or not favorable impact estimate) that also had the feature listed. Values can range from 0 to 1.0 and features with consistency values ≥ 0.9 are interpreted as necessary conditions for the outcome listed. c This parameter is only interpreted for conditions with high consistency (≥ 0.9). It refers to the proportion of cases with the feature listed that also demonstrated the outcome listed (either a favorable impact estimate or not favorable impact estimate). Values can range from 0 to 1.0 and conditions with higher values are interpreted as more relevant. However, in some instances this parameter can produce artificially high values, thus relevance should also be assessed with the relevance of necessity parameter. d This parameter is only interpreted for conditions with high consistency (≥ 0.9). It reflects the degree to which a feature is a relevant (i.e., non-trivial) necessary condition. Values can range from 0 to 1.0 and higher values suggest more relevance.

198
Because of extensive model ambiguity in the parsimonious and intermediate solutions, we interpreted the conservative solution. We identified five combinations of features that were sufficient for a favorable impact on admissions. These five combinations are:
1. Use of health IT AND use of CHWs AND the absence of other innovation components AND a behavioral health focus
2. Not effective implementation AND no use of health IT AND use of CHWs AND no other innovation components AND no behavioral health focus
3. Not effective implementation AND use of health IT AND no use of CHWs AND presence of other innovation components AND no behavioral health focus
4. Effective implementation AND no use of health IT AND use of CHWs AND presence of other innovation components AND behavioral health focus
5. Effective implementation AND use of health IT AND no use of CHWs AND presence of other components AND no behavioral health focus
All combinations, except number 2 above, were perfectly sufficient (i.e., all interventions with these combinations demonstrated a favorable effect); combination number 2 was moderately consistent. These combinations accounted for 63% of the 19 awardees demonstrating a favorable impact for this outcome. Table F-13 provides the truth table for this analysis and Figure F-5 provides the detailed analytic thresholds used, results of the conservative, intermediate, and parsimonious solutions. No robustness checks related to the use of a lower or higher consistency thresholds were required given no truth table row consistency values fell near the threshold we used.

199
Table F-13 Truth table for sufficiency analysis of outpatient care coordination, care management, or
patient navigation interventions for the Admissions outcome
Row Implementation
effectiveness Health IT
use CHW use
Involves other
components Behavioral
health Favorable
impact No. cases Consistency 14 0 1 1 0 1 1 3 1.000 24 1 0 1 1 1 1 2 1.000 12 0 1 0 1 1 1 1 1.000 27 1 1 0 1 0 1 1 1.000 30 1 1 1 0 1 1 1 1.000 5 0 0 1 0 0 1 5 0.800 13 0 1 1 0 0 0 3 0.667 6 0 0 1 0 1 0 4 0.500 11 0 1 0 1 0 0 2 0.500 3 0 0 0 1 0 0 4 0.250 8 0 0 1 1 1 0 4 0.250 9 0 1 0 0 0 0 3 0.000 1 0 0 0 0 0 0 2 0.000 7 0 0 1 1 0 0 2 0.000 17 1 0 0 0 0 0 2 0.000 2 0 0 0 0 1 0 1 0.000 4 0 0 0 1 1 0 1 0.000 15 0 1 1 1 0 0 1 0.000 21 1 0 1 0 0 0 1 0.000 25 1 1 0 0 0 0 1 0.000 26 1 1 0 0 1 0 1 0.000 32 1 1 1 1 1 0 1 0.000 10 0 1 0 0 1 ? 0 - 16 0 1 1 1 1 ? 0 - 18 1 0 0 0 1 ? 0 - 19 1 0 0 1 0 ? 0 - 20 1 0 0 1 1 ? 0 - 22 1 0 1 0 1 ? 0 - 23 1 0 1 1 0 ? 0 - 28 1 1 0 1 1 ? 0 - 29 1 1 1 0 0 ? 0 - 31 1 1 1 1 0 ? 0 -
Abbreviations: CHW = Community Health Worker; health IT= health information technology

200
Figure F-5 Solutions generated from sufficiency analyses for outpatient care coordination, care
management, or patient navigation interventions for the Admissions outcome
Conservative Solution (consistency threshold used = 0.8) Consistency a Raw Unique No. Coverage b Coverage b Cases ———————————————————————————————————————————————— 1 HIT*CHW*other_components*BEHAV_HEALTH 1.000 0.211 0.211 4 2 impeff*hit*CHW*other_components*behav_health 0.800 0.211 0.211 5 3 impeff* HIT *chw* OTHER_COMPONENTS*BEHAV_HEALTH 1.000 0.053 0.053 1 4 IMPEFF*hit *CHW* OTHER_COMPONENTS*BEHAV_HEALTH 1.000 0.105 0.105 2 5 IMPEFF* HIT *chw* OTHER_COMPONENTS*behav_health 1.000 0.053 0.053 1 ———————————————————————————————————————————————— Solution Parameters 0.923 0.632
Parsimonious Solution (consistency threshold used = 0.8) Extensive Model Ambiguity: 16 models produced Solution Parameters (all models) Consistency a 0.923 Coverage b 0.632
Intermediate Solution (consistency threshold used = 0.8) Extensive Model Ambiguity: 1-2 models produced for each of the 16 parsimonious models Solution Parameters (all models) Consistency a 0.923 Coverage b 0.632
Note: Upper case indicates presence of characteristic or features and lowercase indicates absence of characteristic or feature.
Abbreviations: CHW = community health worker; HIT = health information technology; impeff = implementation effectiveness a Consistency refers to the proportion of cases with the combination of features listed that demonstrate a favorable impact. Each combination of features that comprises the overall solution has a consistency value, as does the overall solution. Consistency can range from 0 to 1.0 and values ≥ 0.8 are generally interpreted as strongly sufficient. b Coverage refers to the proportion of cases that demonstrated a favorable impact that have the combination of features. This parameter is only interpreted for conditions with high consistency and can range from 0 to 1.0 with higher values suggesting more empirical relevance of the combination. Row coverage refers to the proportion of cases that demonstrate a favorable impact that are covered by the combination, unique coverage refers to the proportion of cases that demonstrate a favorable impact that are ONLY covered by the combination.
Emergency Department Use Of the 47 cases with this outcome reported, 21 demonstrated a favorable impact on
emergency department use and 26 did not demonstrate a favorable effect.
We identified no features that were necessary for a favorable impact on emergency department use (Table F-14).

201
Table F-14 Necessity analyses for outpatient care coordination, care management, or patient
navigation for the emergency department use outcome
Condition
Emergency department use
outcomea Consistencyb Coveragec Relevance of
necessityd
Effective implementation Favorable 0.143 0.300 0.841 Not effective implementation Favorable 0.857 0.486 0.354 Effective implementation Not favorable 0.269 0.700 0.925 Not effective implementation Not favorable 0.731 0.514 0.357 Any use of health IT Favorable 0.381 0.444 0.744 No use of health IT Favorable 0.619 0.448 0.529 Any use of health IT Not favorable 0.385 0.556 0.784 No use of health IT Not favorable 0.615 0.552 0.581 Use of CHW Favorable 0.810 0.607 0.633 No use of CHW Favorable 0.190 0.211 0.651 Use of CHW Not favorable 0.423 0.393 0.528 No use of CHW Not favorable 0.577 0.789 0.875 Presence of other components within innovation Favorable 0.333 0.350 0.675 Absence of other components within innovation Favorable 0.667 0.519 0.606 Presence of other components within innovation Not favorable 0.500 0.650 0.794 Absence of other components within innovation Not favorable 0.500 0.481 0.588 Presence of Behavioral Health Focus Favorable 0.476 0.500 0.730 Absence of Behavioral Health Focus Favorable 0.524 0.407 0.556 Presence of Behavioral Health Focus Not favorable 0.385 0.500 0.730 Absence of Behavioral Health Focus Not favorable 0.615 0.593 0.645
Abbreviations: CHW = Community Health Worker; health IT= health information technology a A favorable impact was defined as a difference-in-difference estimate suggesting slowed growth in total cost of care expenditures (or cost savings) relative to a comparison group. Some favorable estimates may have been statistically significant (at α= 0.10), but statistical significance was not used to define favorable impact for these analyses as this approach would have limited the ability to use this analytic approach because most cases did not demonstrate a statistically significant favorable impact. b Consistency refers to the proportion of cases with the outcome listed (either a favorable impact estimate or not favorable impact estimate) that also had the feature listed. Values can range from 0 to 1.0 and features with consistency values ≥ 0.9 are interpreted as necessary conditions for the outcome listed. c This parameter is only interpreted for conditions with high consistency (≥ 0.9). It refers to the proportion of cases with the feature listed that also demonstrated the outcome listed (either a favorable impact estimate or not favorable impact estimate). Values can range from 0 to 1.0 and conditions with higher values are interpreted as more relevant. However, in some instances this parameter can produce artificially high values, thus relevance should also be assessed with the relevance of necessity parameter. d This parameter is only interpreted for conditions with high consistency (≥ 0.9). It reflects the degree to which a feature is a relevant (i.e., non-trivial) necessary condition. Values can range from 0 to 1.0 and higher values suggest more relevance.

202
Because of extensive model ambiguity in the parsimonious and intermediate solutions, we interpreted the conservative solution. We identified six combinations of features that were sufficient for a favorable impact on emergency department use. These combinations are:
1. No use of health IT AND use of CHWs AND no other innovation components used AND no behavioral health focus
2. Not effective implementation AND no use of health IT AND use of CHWs AND no behavioral health focus
3. Not effective implementation AND no use of health IT AND no use of CHW AND presence of other innovation components AND behavioral health focus
4. Not effective implementation AND use of health IT AND use of CHW AND no use of other innovation components AND behavioral health focus
5. Effective implementation AND use of health IT AND no use of CHWs AND no use of other innovation components AND behavioral health focus
6. Effective implementation AND use of health IT AND no use of CHWs AND presence of other innovation components AND no behavioral health focus
All combinations, except numbers 1 and 2 above, were perfectly sufficient (i.e., all interventions with these combinations demonstrated a favorable effect); combination numbers 1 and 2 were moderately consistent. Together, all these combinations accounted for 62% of the 21 awardees demonstrating a favorable impact for this outcome. Table F-15 provides the truth table for this analysis, and Figure F-6 provides the detailed analytic thresholds used, results of the conservative, intermediate, and parsimonious solutions. No robustness checks related to the use of a lower or higher consistency thresholds were required given no truth table row consistency values fell near the threshold we used.

203
Table F-15 Truth table for sufficiency analysis of outpatient care coordination, care management, or
patient navigation interventions for the emergency department use outcome
Row Implementation
effectiveness Health IT
use CHW use
Involves other
components Behavioral
health Favorable
impact No. cases Consistency
14 0 1 1 0 1 1 3 1.000 7 0 0 1 1 0 1 2 1.000 4 0 0 0 1 1 1 1 1.000 21 1 0 1 0 0 1 1 1.000 26 1 1 0 0 1 1 1 1.000 27 1 1 0 1 0 1 1 1.000 5 0 0 1 0 0 1 5 0.800 13 0 1 1 0 0 0 3 0.667 8 0 0 1 1 1 0 5 0.600 6 0 0 1 0 1 0 4 0.500 9 0 1 0 0 0 0 3 0.333 3 0 0 0 1 0 0 4 0.000 1 0 0 0 0 0 0 2 0.000 11 0 1 0 1 0 0 2 0.000 17 1 0 0 0 0 0 2 0.000 24 1 0 1 1 1 0 2 0.000 2 0 0 0 0 1 0 1 0.000 12 0 1 0 1 1 0 1 0.000 15 0 1 1 1 0 0 1 0.000 25 1 1 0 0 0 0 1 0.000 30 1 1 1 0 1 0 1 0.000 32 1 1 1 1 1 0 1 0.000 10 0 1 0 0 1 ? 0 - 16 0 1 1 1 1 ? 0 - 18 1 0 0 0 1 ? 0 - 19 1 0 0 1 0 ? 0 - 20 1 0 0 1 1 ? 0 - 22 1 0 1 0 1 ? 0 - 23 1 0 1 1 0 ? 0 - 28 1 1 0 1 1 ? 0 - 29 1 1 1 0 0 ? 0 - 31 1 1 1 1 0 ? 0 -
Abbreviations: CHW = Community Health Worker; health IT= health information technology

204
Figure F-6 Solutions generated from sufficiency analyses for outpatient care coordination, care management, or patient navigation interventions for the emergency department use
outcome
Conservative Solution (consistency threshold used = 0.8) Consistency a Raw Unique No. Coverage b Coverage b Cases —————————————————————————————————————————————— 1 hit*CHW*other_components*behavioral 0.833 0.238 0.048 6 2 impeff*hit*CHW*behavioral 0.857 0.286 0.095 7 3 impeff*hit *chw* OTHER_COMPONENTS*BEHAVIORAL 1.000 0.048 0.048 1 4 impeff * HIT *CHW*other_components *BEHAVIORAL 1.000 0.143 0.143 3 5 IMPEFF* HIT *chw* other_components* BEHAVIORAL 1.000 0.048 0.048 1 6 IMPEFF* HIT *chw* OTHER_COMPONENTS*behavioral 1.000 0.048 0.048 1 —————————————————————————————————————————————— Solution Parameters 0.929 0.619
Parsimonious Solution (consistency threshold used = 0.8) Extensive Model Ambiguity: 8 models produced Solution Parameters (all models) Consistency a 0.929 Coverage b 0.619
Intermediate Solution (consistency threshold used = 0.8) Extensive Model Ambiguity: 1-2 models produced for each of the 8 parsimonious models Solution Parameters (all models) Consistency a 0.929 Coverage b 0.619
Note: Upper case indicates presence of characteristic or features and lowercase indicates absence of characteristic or feature.
Abbreviations: CHW = community health worker; HIT = health information technology; impeff = implementation effectiveness a Consistency refers to the proportion of cases with the combination of features listed that demonstrate a favorable impact. Each combination of features that comprises the overall solution has a consistency value, as does the overall solution. Consistency can range from 0 to 1.0 and values ≥ 0.8 are generally interpreted as strongly sufficient. b Coverage refers to the proportion of cases that demonstrated a favorable impact that have the combination of features. This parameter is only interpreted for conditions with high consistency and can range from 0 to 1.0 with higher values suggesting more empirical relevance of the combination. Row coverage refers to the proportion of cases that demonstrate a favorable impact that are covered by the combination, unique coverage refers to the proportion of cases that demonstrate a favorable impact that are ONLY covered by the combination.
F.3 Patient-centered Medical Home Interventions
We included interventions in this analysis if the HCIA awardee innovation implemented a PCMH model of care delivery and impact estimates were generated using DID analyses with a comparison group. These interventions are implemented at the practice-level and are not specifically targeted to individual patients. We considered awardees as having this type of intervention if the main innovation intervention was a practice transformation to patient-centered

205
medical home. These interventions were heterogenous with respect to scope; some were limited to single practice or clinic settings; others were designed to facilitate practice transformation across a group of affiliated or unaffiliated practices. Some were focused within primary-care practices whereas others were focused in establishing PCMH for patients within specialty settings or with complex conditions. A total of 19 cases had innovations that included PCMH interventions, but 3 did not have DID estimates. Thus, 16 cases were included in this analysis (Table F-16); however, not all 16 cases had DID estimates available for all utilization and cost outcomes evaluated (total cost of care, hospital admissions, hospital readmissions, emergency department use).
Table F-16 HCIA Awardees included in the qualitative comparative analysis of patient-centered
medical home interventions (N = 16)
Portfolio Awardee Behavioral Kitsap Mental Health Services (Medicare) Behavioral Kitsap Mental Health Services (Medicaid) Community South County Community Health Center, Inc. Complex University of Rhode Island Complex Courage Center (Medicare) Complex Courage Center (Medicaid) Complex The University of Texas Health Science Center at Houston Complex Developmental Disabilities Health Services PA (Medicare) Complex Developmental Disabilities Health Services PA (Medicaid) Disease Innovative Oncology Business Solutions, Inc. Primary Wyoming Institute of Public Health Primary Sanford Health Primary University Hospitals of Cleveland Primary TransforMED, LLC Primary Finger Lakes Health Systems Agency Primary Denver Health and Hospital Authority
Total Cost of Care Of the 14 cases with this outcome reported, 6 demonstrated a favorable impact on total
cost of care and 8 did not demonstrate a favorable effect.
We identified no features that were necessary for a favorable impact estimate on total cost of care (Table F-17).

206
Table F-17 Necessity analyses for patient-centered medical home interventions for the total cost of care
outcome
Condition Total cost of care
outcomea Consistencyb Coveragec Relevance of
necessityd Presence of other components within innovation Favorable 0.667 0.571 0.700 Absence of other components within innovation Favorable 0.333 0.286 0.583 Presence of other components within innovation Not favorable 0.375 0.429 0.636 Absence of other components within innovation Not favorable 0.625 0.714 0.778 Presence of Behavioral Health Focus Favorable 0.667 0.500 0.600 Absence of Behavioral Health Focus Favorable 0.333 0.333 0.667 Presence of Behavioral Health Focus Not favorable 0.500 0.500 0.600 Absence of Behavioral Health Focus Not favorable 0.500 0.667 0.800 Presence of Primary Care Focus Favorable 0.333 0.333 0.667 Absence of Primary Care Focus Favorable 0.667 0.500 0.600 Presence of Primary Care Focus Not favorable 0.500 0.667 0.800 Absence of Primary Care Focus Not favorable 0.500 0.500 0.600
a A favorable impact was defined as a difference-in-difference estimate suggesting slowed growth in total cost of care expenditures (or cost savings) relative to a comparison group. Some favorable estimates may have been statistically significant (at α= 0.10), but statistical significance was not used to define favorable impact for these analyses as this approach would have limited the ability to use this analytic approach because most cases did not demonstrate a statistically significant favorable impact. b Consistency refers to the proportion of cases with the outcome listed (either a favorable impact estimate or not favorable impact estimate) that also had the feature listed. Values can range from 0 to 1.0 and features with consistency values ≥ 0.9 are interpreted as necessary conditions for the outcome listed. c This parameter is only interpreted for conditions with high consistency (≥ 0.9). It refers to the proportion of cases with the feature listed that also demonstrated the outcome listed (either a favorable impact estimate or not favorable impact estimate). Values can range from 0 to 1.0 and conditions with higher values are interpreted as more relevant. However, in some instances this parameter can produce artificially high values, thus relevance should also be assessed with the relevance of necessity parameter. d This parameter is only interpreted for conditions with high consistency (≥ 0.9). It reflects the degree to which a feature is a relevant (i.e., non-trivial) necessary condition. Values can range from 0 to 1.0 and higher values suggest more relevance.
Based on the intermediate solution, we identified one combination of features that was sufficient for a favorable impact on total cost of care. This combination is presence of other innovation components AND behavioral health focus AND not a primary-care focus.
This combination was perfectly sufficient (i.e., all interventions with these combinations demonstrated a favorable effect) but only accounted for half of the six cases demonstrating a favorable impact for this outcome. Table F-18 provides the truth table for this analysis and Figure F-7 provides the detailed analytic thresholds used, results of the conservative, intermediate, and parsimonious solutions. No robustness checks related to the use of a lower or higher consistency thresholds were required given no truth table row consistency values fell near the threshold we used.

207
Table F-18 Truth table for sufficiency analysis of patient-centered medical home interventions for the
total cost of care outcome
Row Involves other
components Behavioral
health Primary care
focus Favorable
impact No. cases Consistency 7 1 1 0 1 3 1.000 1 0 0 0 0 2 0.500 2 0 0 1 0 2 0.500 8 1 1 1 0 2 0.500 3 0 1 0 0 2 0.000 4 0 1 1 0 1 0.000 5 1 0 0 0 1 0.000 6 1 0 1 0 1 0.000
Figure F-7 Solutions generated from sufficiency analyses for patient-centered medical home
interventions for the total cost of care outcome
Conservative, Intermediate, and Parsimonious Solution (consistency threshold used = 0.8) Consistency a Raw Unique No. Coverage b Coverage b Cases —————————————————————————————————————————————————— 1 OTHER_COMPONENTS*BEHAV_HEALTH*primary_care 1.000 0.500 - 3 —————————————————————————————————————————————————— Solution Parameters 1.000 0.500
Note: Upper case indicates presence of characteristic or features and lowercase indicates absence of characteristic or feature. a Consistency refers to the proportion of cases with the combination of features listed that demonstrate a favorable impact. Each combination of features that comprises the overall solution has a consistency value, as does the overall solution. Consistency can range from 0 to 1.0 and values ≥ 0.8 are generally interpreted as strongly sufficient. b Coverage refers to the proportion of cases that demonstrated a favorable impact that have the combination of features. This parameter is only interpreted for conditions with high consistency and can range from 0 to 1.0 with higher values suggesting more empirical relevance of the combination. Row coverage refers to the proportion of cases that demonstrate a favorable impact that are covered by the combination, unique coverage refers to the proportion of cases that demonstrate a favorable impact that are ONLY covered by the combination.
Admissions
Of the 15 cases with this outcome reported, 6 demonstrated a favorable impact on admissions and 9 did not demonstrate a favorable effect. We identified no features that were necessary for a favorable impact on admissions (Table F-19).

208
Table F-19 Necessity analyses for patient-centered medical home interventions for the admissions
outcome
Condition Admissions outcomea Consistencyb Coveragec
Relevance of necessityd
Awardee used additional components within innovation
Favorable 0.500 0.375 0.583
Awardee did not use additional components within innovation
Favorable 0.500 0.429 0.667
Awardee used additional components within innovation
Not favorable 0.556 0.625 0.700
Awardee did not use additional components within innovation
Not favorable 0.444 0.571 0.727
Presence of Behavioral Health Focus Favorable 0.667 0.444 0.545 Absence of Behavioral Health Focus Favorable 0.333 0.333 0.692 Presence of Behavioral Health Focus Not favorable 0.556 0.556 0.600 Absence of Behavioral Health Focus Not favorable 0.444 0.667 0.818 Presence of Primary Care Focus Favorable 0.167 0.167 0.643 Absence of Primary Care Focus Favorable 0.833 0.556 0.600 Presence of Primary Care Focus Not favorable 0.556 0.833 0.900 Absence of Primary Care Focus Not favorable 0.444 0.444 0.545
a A favorable impact was defined as a difference-in-difference estimate suggesting slowed growth in total cost of care expenditures (or cost savings) relative to a comparison group. Some favorable estimates may have been statistically significant (at α= 0.10), but statistical significance was not used to define favorable impact for these analyses as this approach would have limited the ability to use this analytic approach because most cases did not demonstrate a statistically significant favorable impact. b Consistency refers to the proportion of cases with the outcome listed (either a favorable impact estimate or not favorable impact estimate) that also had the feature listed. Values can range from 0 to 1.0 and features with consistency values ≥ 0.9 are interpreted as necessary conditions for the outcome listed. c This parameter is only interpreted for conditions with high consistency (≥ 0.9). It refers to the proportion of cases with the feature listed that also demonstrated the outcome listed (either a favorable impact estimate or not favorable impact estimate). Values can range from 0 to 1.0 and conditions with higher values are interpreted as more relevant. However, in some instances this parameter can produce artificially high values, thus relevance should also be assessed with the relevance of necessity parameter. d This parameter is only interpreted for conditions with high consistency (≥ 0.9). It reflects the degree to which a feature is a relevant (i.e., non-trivial) necessary condition. Values can range from 0 to 1.0 and higher values suggest more relevance.
We identified no combinations of features that were sufficient for a favorable impact on admissions at the default consistency threshold of 0.8. We conducted a robustness check at a consistency threshold of 0.75 and identified the same combination of features as for the total cost of care outcome, but with lower solution consistency (0.75). Table F-20 provides the truth table for this analysis.

209
Table F-20 Truth table for sufficiency analyses of patient-centered medical home interventions for the
admissions outcome
Row Involves other components
Behavioral health
Primary care focus
Favorable impact No. cases Consistency
7 1 1 0 0 4 0.750 1 0 0 0 0 2 0.500 2 0 0 1 0 2 0.500 3 0 1 0 0 2 0.500 8 1 1 1 0 2 0.000 4 0 1 1 0 1 0.000 5 1 0 0 0 1 0.000 6 1 0 1 0 1 0.000
Readmissions
Of the seven cases with this outcome reported, four demonstrated a favorable impact on readmissions and three did not demonstrate a favorable effect. We identified no features that were necessary for a favorable impact on readmissions (Table F-21).

210
Table F-21 Necessity analyses for patient-centered medical home interventions for the readmissions
outcome
Condition Readmissions
outcomea Consistencyb Coveragec Relevance of
necessityd Awardee used additional components within innovation
Favorable 0.250 0.500 0.833
Awardee did not use additional components within innovation
Favorable 0.750 0.600 0.500
Awardee used additional components within innovation
Not favorable 0.333 0.500 0.833
Awardee did not use additional components within innovation
Not favorable 0.677 0.400 0.400
Presence of Behavioral Health Focus Favorable 0.250 0.333 0.667 Absence of Behavioral Health Focus Favorable 0.750 0.750 0.750 Presence of Behavioral Health Focus Not favorable 0.667 0.667 0.800 Absence of Behavioral Health Focus Not favorable 0.333 0.250 0.500 Presence of Primary Care Focus Favorable 0.750 0.600 0.500 Absence of Primary Care Focus Favorable 0.250 0.500 0.833 Presence of Primary Care Focus Not favorable 0.667 0.400 0.400 Absence of Primary Care Focus Not favorable 0.333 0.500 0.833
a A favorable impact was defined as a difference-in-difference estimate suggesting slowed growth in total readmissions (or fewer readmissions) relative to a comparison group. Some favorable estimates may have been statistically significant (at α= 0.10), but statistical significance was not used to define favorable impact for these analyses as this approach would have limited the ability to use this analytic approach because most cases did not demonstrate a statistically significant favorable impact. b Consistency refers to the proportion of cases with a favorable impact estimate that also had the characteristic or feature listed. Features with consistency values ≥ 0.9 are interpreted as necessary conditions for a favorable impact. c Coverage refers to the proportion of cases with the characteristic or feature listed that also demonstrated a favorable impact estimate. This parameter is only interpreted for conditions with high consistency. d Relevance of necessity is only evaluated when consistency is high (≥ 0.9) and coverage is high (≥ 0.8); it reflects the degree to which a feature or characteristic is a relevant (vs. trivial) necessary condition. Higher values suggest more relevance.
Using the intermediate solution, we identified three combinations of features that were sufficient for a favorable impact on readmission outcomes. These three combinations are:
1. Not a behavioral health focus AND not a primary care focus
2. Presence of other innovation components AND not a behavioral health focus
3. Absence of other innovation components AND behavioral health focus AND primary care focus
All combinations were perfectly sufficient (i.e. all interventions with these combinations demonstrated a favorable effect). These combinations account for 75% of the four awardees demonstrating a favorable impact for this outcome. Table F-22 provides the truth table for this analysis and Figure F- 8 provides the detailed analytic thresholds used and results from the conservative, intermediate, and parsimonious solutions; no robustness checks related to the use

211
of a lower or higher consistency thresholds were required given no truth table row consistency values fell near the threshold we used.
Table F-22 Truth table for sufficiency analyses of patient-centered medical home interventions for the
readmissions outcome
Row Involves other components
Behavioral health
Primary care focus
Favorable impact No. cases Consistency
1 0 0 0 1 1 1.000 4 0 1 1 1 1 1.000 6 1 0 1 1 1 1.000 2 0 0 1 0 2 0.500 3 0 1 0 0 1 0.000 8 1 1 1 0 1 0.000 5 1 0 0 ? 0 7 1 1 0 ? 0
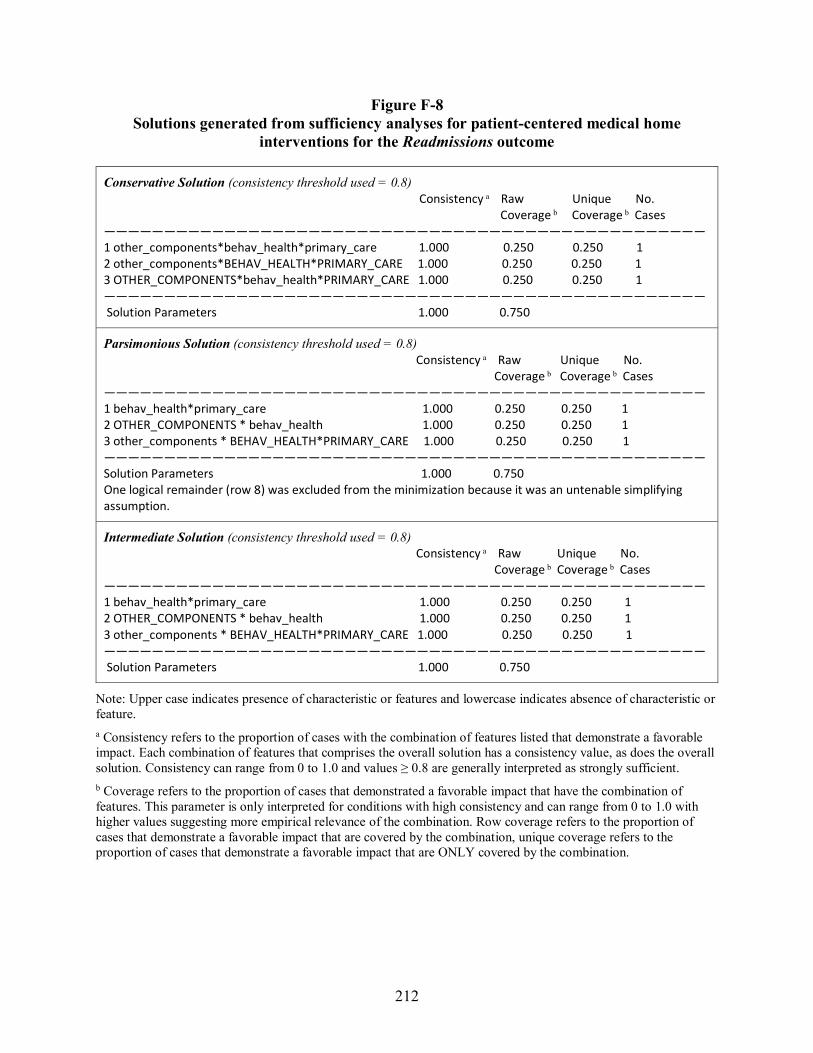
212
Figure F-8 Solutions generated from sufficiency analyses for patient-centered medical home
interventions for the Readmissions outcome
Conservative Solution (consistency threshold used = 0.8) Consistency a Raw Unique No. Coverage b Coverage b Cases —————————————————————————————————————————————————— 1 other_components*behav_health*primary_care 1.000 0.250 0.250 1 2 other_components*BEHAV_HEALTH*PRIMARY_CARE 1.000 0.250 0.250 1 3 OTHER_COMPONENTS*behav_health*PRIMARY_CARE 1.000 0.250 0.250 1 —————————————————————————————————————————————————— Solution Parameters 1.000 0.750
Parsimonious Solution (consistency threshold used = 0.8) Consistency a Raw Unique No. Coverage b Coverage b Cases —————————————————————————————————————————————————— 1 behav_health*primary_care 1.000 0.250 0.250 1 2 OTHER_COMPONENTS * behav_health 1.000 0.250 0.250 1 3 other_components * BEHAV_HEALTH*PRIMARY_CARE 1.000 0.250 0.250 1 —————————————————————————————————————————————————— Solution Parameters 1.000 0.750 One logical remainder (row 8) was excluded from the minimization because it was an untenable simplifying assumption.
Intermediate Solution (consistency threshold used = 0.8) Consistency a Raw Unique No. Coverage b Coverage b Cases —————————————————————————————————————————————————— 1 behav_health*primary_care 1.000 0.250 0.250 1 2 OTHER_COMPONENTS * behav_health 1.000 0.250 0.250 1 3 other_components * BEHAV_HEALTH*PRIMARY_CARE 1.000 0.250 0.250 1 —————————————————————————————————————————————————— Solution Parameters 1.000 0.750
Note: Upper case indicates presence of characteristic or features and lowercase indicates absence of characteristic or feature. a Consistency refers to the proportion of cases with the combination of features listed that demonstrate a favorable impact. Each combination of features that comprises the overall solution has a consistency value, as does the overall solution. Consistency can range from 0 to 1.0 and values ≥ 0.8 are generally interpreted as strongly sufficient. b Coverage refers to the proportion of cases that demonstrated a favorable impact that have the combination of features. This parameter is only interpreted for conditions with high consistency and can range from 0 to 1.0 with higher values suggesting more empirical relevance of the combination. Row coverage refers to the proportion of cases that demonstrate a favorable impact that are covered by the combination, unique coverage refers to the proportion of cases that demonstrate a favorable impact that are ONLY covered by the combination.

213
Emergency Department Use
Of the 15 cases with this outcome reported, 8 demonstrated a favorable impact on emergency department use and 7 did not demonstrate a favorable effect. We identified no features that were necessary for a favorable impact on emergency department use (Table F-23).
Table F-23 Necessity analyses for patient-centered medical home interventions for the emergency
department use outcome
Condition
Emergency department
use outcomea Consistencyb Coveragec Relevance of
necessityd Awardee used additional components within innovation
Favorable 0.375 0.333 0.500
Awardee did not use additional components within innovation
Favorable 0.625 0.833 0.900
Awardee used additional components within innovation
Not favorable 0.857 0.667 0.667
Awardee did not use additional components within innovation
Not favorable 0.143 0.167 0.643
Presence of behavioral health focus Favorable 0.625 0.556 0.600 Absence of behavioral health focus Favorable 0.375 0.500 0.750 Presence of behavioral health focus Not favorable 0.571 0.444 0.545 Absence of behavioral health focus Not favorable 0.429 0.500 0.750 Presence of primary care focus Favorable 0.500 0.571 0.727 Absence of primary care focus Favorable 0.500 0.500 0.636 Presence of primary care focus Not favorable 0.429 0.429 0.667 Absence of primary care focus Not favorable 0.571 0.500 0.636
a A favorable impact was defined as a difference-in-difference estimate suggesting slowed growth in total cost of care expenditures (or cost savings) relative to a comparison group. Some favorable estimates may have been statistically significant (at α= 0.10), but statistical significance was not used to define favorable impact for these analyses as this approach would have limited the ability to use this analytic approach because most cases did not demonstrate a statistically significant favorable impact. b Consistency refers to the proportion of cases with the outcome listed (either a favorable impact estimate or not favorable impact estimate) that also had the feature listed. Values can range from 0 to 1.0 and features with consistency values ≥ 0.9 are interpreted as necessary conditions for the outcome listed. c This parameter is only interpreted for conditions with high consistency (≥ 0.9). It refers to the proportion of cases with the feature listed that also demonstrated the outcome listed (either a favorable impact estimate or not favorable impact estimate). Values can range from 0 to 1.0 and conditions with higher values are interpreted as more relevant. However, in some instances this parameter can produce artificially high values, thus relevance should also be assessed with the relevance of necessity parameter. d This parameter is only interpreted for conditions with high consistency (≥ 0.9). It reflects the degree to which a feature is a relevant (i.e., non-trivial) necessary condition. Values can range from 0 to 1.0 and higher values suggest more relevance.

214
We identified two combinations of features that were sufficient for a favorable impact on emergency department use. These combinations were:
1. No other innovation components AND behavioral health focus
2. No other innovation components AND not a primary-care focus
Both combinations were perfectly sufficient (i.e., all interventions with these combinations demonstrated a favorable effect) but only accounted for 50% of the eight cases demonstrating a favorable impact for this outcome. Table F-24 provides the truth table for this analysis and Figure F-9 provides the detailed analytic thresholds used, results of the conservative, intermediate, and parsimonious solutions, which were identical for this analysis since no logical remainders were present. No robustness checks related to the use of a lower or higher consistency thresholds were required given no truth table row consistency values fell near the threshold we used.
Table F-24 Truth table for sufficiency analysis of patient-centered medical home interventions for the
emergency department use outcome
Row Involves other components
Behavioral health
Primary care focus
Favorable impact No. cases Consistency
1 0 0 0 1 2 1.000 3 0 1 0 1 1 1.000 4 0 1 1 1 1 1.000 8 1 1 1 0 3 0.667 2 0 0 1 0 2 0.500 7 1 1 0 0 4 0.250 5 1 0 0 0 1 0.000 6 1 0 1 0 1 0.000

215
Figure F-9 Solutions generated from sufficiency analyses for patient-centered medical home
interventions for the emergency department use outcome
Conservative, Parsimonious, and Intermediate Solution (consistency threshold used = 0.8) Consistency a Raw Unique No. Coverage b Coverage b Cases —————————————————————————————————————————————————— 1 other_components*BEHAV_HEALTH 1.000 0.250 0.125 2 2 other_components*primary_care 1.000 0.375 0.250 3 —————————————————————————————————————————————————— Solution Parameters 1.000 0.500
Note: Upper case indicates presence of characteristic or features and lowercase indicates absence of characteristic or feature. a Consistency refers to the proportion of cases with the combination of features listed that demonstrate a favorable impact. Each combination of features that comprises the overall solution has a consistency value, as does the overall solution. Consistency can range from 0 to 1.0 and values ≥ 0.8 are generally interpreted as strongly sufficient. b Coverage refers to the proportion of cases that demonstrated a favorable impact that have the combination of features. This parameter is only interpreted for conditions with high consistency and can range from 0 to 1.0 with higher values suggesting more empirical relevance of the combination. Row coverage refers to the proportion of cases that demonstrate a favorable impact that are covered by the combination, unique coverage refers to the proportion of cases that demonstrate a favorable impact that are ONLY covered by the combination.
References
Dusa, A. (2017). QCA: Qualitative Comparative Analysis (Version R Package Version 2.6). Retrieved from https://CRAN.R-project.org/package=QCA
Medzihorsky J., Oana. I.-E., Quaranta, M., Schneider, C. (2017). SetMethods: Functions for Set-Theoretic Multi-Method Research and Advanced QCA (Version R Package Version 2.1). Retrieved from https://CRAN.R-project.org/package=SetMethods
Schneider, C. Q, & Wagemann, C. (2012). Set-theoretic methods for the social sciences: A guide to qualitative comparative analysis. Cambridge, United Kingdom: Cambridge University Press.

216
[This page intentionally left blank.]

217
APPENDIX G: MAIN INTERVENTION CATEGORIZATION AND DISTRIBUTION OF
INTERVENTION COMPONENTS

218
[This page intentionally left blank.]

219
Table G-1 Main Intervention Categorizations
Intervention Component (Brief/Standard Terms) Definition
Integrated Care Models of providing care that attempt to combine traditionally separate providers and types of services, with the most common example being the integration of medical care and behavioral health services. “The care that results from a practice team of primary care and behavioral health clinicians, working together with patients and families, using a systematic and cost-effective approach to provide patient-centered care for a defined population. This care may address mental health and substance abuse conditions, health behaviors (including their contribution to chronic medical illnesses), life stressors and crises, stress-related physical symptoms, and ineffective patterns of health care utilization.”4 If innovation specifically mentions “medical home” then code with medical home and not this code. Is distinguished from care coordination by the deliberate and systematic organization of multiple kinds of care within one service model. Whereas care coordination coordinates the care among two or more service models.
Care Coordination/Case Management/Clinical Navigation
Care coordination is the deliberate organization of patient care activities between two or more participants (including the patient) involved in a patient’s care to facilitate the appropriate delivery of health care services. Organizing care involves the marshalling of personnel and other resources needed to carry out all required patient care activities, and is often managed by the exchange of information among participants responsible for different aspects of care.5,6 Includes case management as a kind of care coordination. Case management as defined by CMS for reimbursement as services that assist individuals eligible under the plan in gaining access to needed medical, social, educational, and other services.7 Is provided by clinical staff (usually nurses or social workers), and the staff providing these services may be called care coordinators, case managers, or nurse navigators. These staff may be internal or external to the organization providing care. Note: care coordination and case management related to cancer care typically uses the term “navigation”; this term is less commonly used for other diseases/conditions.
4 Peek CJ and the National Integration Academy Council. Lexicon for Behavioral Health and Primary Care Integration: Concepts and Definitions
Developed by Expert Consensus. AHRQ Publication No.13-IP001-EF. Rockville, MD: Agency for Healthcare Research and Quality. 2013. Available at: http://integrationacademy.ahrq.gov/sites/default/files/Lexicon.pdf .
5 McDonald KM, Schultz E, Albin L, Pineda N, Lonhart J, Sundaram V, Smith-Spangler C, Brustrom J, and Malcolm E. Care Coordination Atlas Version 3 (Prepared by Stanford University under subcontract to Battelle on Contract No. 290-04-0020). AHRQ Publication No.11-0023-EF. Rockville, MD: Agency for Healthcare Research and Quality. November 2010.
6 McDonald KM, Sundaram V, Bravata DM, et al. Care coordination. In: Shojania KG, McDonald KM, Wachter RM, and Owens DK, eds. Closing the quality gap: A critical analysis of quality improvement strategies. Technical Review 9 (Prepared by Stanford-UCSF Evidence-Based Practice Center under contract No. 290-02-0017). Vol. 7. Rockville, MD: Agency for Healthcare Research and Quality, June 2007. AHRQ Publication No. 04(07)-0051-7.
7 Centers for Medicare and Medicaid Services- Definition of Case Management Services, Optional State Plan Case Management (CMS 2237-F) § 440.169

220
Intervention Component (Brief/Standard Terms) Definition
Care Management Typically specific to a disease condition or constellation of related conditions, involves creating and executing care plans, involves clinical decision making and reassessment, and is typically provided by clinical staff. 8 May require care coordination in order to execute the care plan. May use patient navigation services to execute the care plan, particularly as related to troubleshooting barriers encountered by patient. Care management interventions for a specific disease are distinguished from Workflow/Process Redesign interventions by a focus on care planning/tailoring for individual patient across the continuum of care settings. Care management may include specific workflow process/redesign elements, but if the “innovation” crosses into other care settings, then it would be more appropriately classified as case management.
Medical Home A model or organization of primary care that delivers the core functions of primary health care and encompasses five functions and attributes: comprehensive care, patient-centered care, coordinated care, accessible services, quality and safety. 9 May include elements of care coordination or care management.
Workflow or process redesign
Workflow is defined as “a series of steps, frequently performed by different staff members and often dependent on related workflows, that accomplishes a particular task. Workflows represent how work actually gets done, not the protocols that have been established to do the work.”10 These innovations include revisions of process, procedure, process redesign, administrative workflow, or clinical workflow. These innovations are typically limited/restricted to workflow/process redesign for patients within a single setting and the innovation does not span care settings. General practice transformation to Medical Home should not be coded with this description. Workflow or process redesign will typically be a supporting component to an innovation, though in some cases it may be the main innovation.
Patient Engagement and Support-
Refers to patient outreach, engagement, self-management support, and education. Self-management support involves “the systematic provision of education and supportive interventions by health care staff to increase patients’ skills and confidence in managing their health problems, including regular assessment of progress and problems, goal setting, and problem-solving support.”11 These services can be provided by non-clinical or clinical staff. These services may be provided internal or external to a health care system.12 These services may be supported by health IT and virtual platforms of engagement. This category also covers things like use of patient incentives for achieving or attempting health behavior changes.
(continued)
8 Adapted from National Quality Forum. National Quality Forum-endorsed definition and framework for measuring care coordination.
Washington, DC: National Quality Forum; 2006. 9 Agency for Healthcare Research and Quality. Defining the PCMH. Patient-centered Medical Home Resource Center.
http://pcmh.ahrq.gov/page/defining-pcmh Accessed Aug 18, 2014. 10 Module 5. Mapping and Redesigning Workflow. May 2013. Agency for Healthcare Research and Quality, Rockville, MD.
http://www.ahrq.gov/professionals/prevention-chronic-care/improve/system/pfhandbook/mod5.html, Accessed Aug. 18, 2014 11 Adams K, Corrigan JM, editors. Institute of Medicine. Priority areas for national action: Transforming health care quality. Washington, DC:
National Academies Press; 2003. 12 Patient Self-Management Support Programs: An Evaluation: Final Contract Report. November 2007. Agency for Healthcare Research and
Quality, Rockville, MD. http://www.ahrq.gov/research/findings/final-reports/ptmgmt/index.html Accessed Aug 18, 2014

221
Intervention Component (Brief/Standard Terms) Definition
Patient Navigation Patient navigation definitions vary widely and have much overlap with care coordination, care management, and case management definitions in terms of navigator functions.13 14 15For this meta-evaluation, we will distinguish patient navigation as patient-centered assistance provided by non-licensed clinical support staff. Specific tasks performed by a navigator may overlap with activities performed by care coordinators, care managers, or treating health care team so this innovation refers to using non-licensed support staff or community health workers to assist patients with accessing and receiving diagnostic and/or treatment care. Typical services include troubleshooting individual barriers (e.g., translation services, transportation, scheduling appointments, paperwork barriers to getting into the systems, etc.). Navigation services may be longitudinal over the course of an “episode” (cancer dx and treatment), or they may be ad hoc, in response to patient request for assistance. Navigation services that are provided by clinical staff or involve clinical decisions, assessment, or monitoring are probably better described as care coordination/case management OR care management.
Medication Therapy Management
Refers to specific pharmaceutical care services (i.e., non-dispensing, clinical services), typically provided by pharmacists to patients in inpatient, outpatient, or community/retail pharmacy settings. 16 May have overlap with other innovation types, such as care coordination, care management, or medical home. Only use to describe a clear and distinct innovation component involving episodes of care that are documented and/or billed as visits/contacts for the provision of MTM services. Services such as medication reconciliation during transitions of care or as part of care management most likely do not rise the level of being considered MTM.
Isolated Workforce Training
Used to describe indirect innovations that are purely one-time or limited workforce training that have no direct participants, and have no other elements of system intervention (workflow, ongoing care processes or services).
Direct Care Provision Is the provision of direct medical, dental or mental health care that is primarily designed to increase access to these services in a population that previously did not have access. This component requires clear and distinct services that would be recognizable as medical (dental, mental health) care services billable by licensed professionals, and not simply outreach, care coordination, care management, or navigation services that are designed to wrap-around a patient’s existing medical care.
Other Coder needs to provide a brief description and rationale why it does not fit any of the other standard categories.
13 Parker VA, Clark JA, Leyson J, Calhoun E, Carroll JK, Freund KM, Battaglia TA. Patient navigation: development of a protocol for describing
what navigators do. Health Serv Res. 2010 Apr;45(2):514-31. doi: 10.1111/j.1475-6773.2009.01079.x.Epub 2010 Jan 27. 14 Health Resources and Services Administration. Community Health Worker National Workforce Study. 2007. Available at
http://bhpr.hrsa.gov/healthworkforce/reports/chwstudy2007.pdf Accessed August 18, 2014. 15 Freeman HP. The origin, evolution, and principles of patient navigation. Cancer Epidemiol Biomarkers Prev. 2012 Oct;21(10):1614-7. 16 Bluml BM. Definition of medication therapy management: development of profession wide consensus. J Am Pharm Assoc (2003). 2005 Sep-
Oct;45(5):566-72.

222
Table G-2 Distribution of six types of intervention components among HCIA ambulatory
care innovations
Number of interventions Health IT CHW MH BH TEL WF
19a No No No No No No 1 No No No No No Yes 1 No No No Yes No No 1 No No Yes No No No 1 No No Yes No Yes No 1 No No Yes Yes No No 9 No Yes No No No No 8 No Yes No Yes No No 1 No Yes Yes Yes No No 1 No Yes Yes Yes Yes No 9 Yes No No No No No 4 Yes No No No No Yes 1 Yes No No No Yes No 1 Yes No No Yes No No 1 Yes No No Yes Yes No 2 Yes No Yes No No No 1 Yes No Yes Yes No No 3 Yes Yes No No No No 1 Yes Yes No No Yes No 5 Yes Yes No Yes No No 1 Yes Yes Yes Yes No No
NOTES: The analysis includes 72 innovations. Intervention components: health IT = health information technology, CHW = community health workers, BH = behavioral health, MH = medical home, TEL = telemedicine, WF = workflow. a. Nineteen awardees did not have any of the components attributed to them. They were characterized as primarily care coordination or care management innovations.