Embed Size (px)
Citation preview
Health Care-Associated Infections: 2016 Oregon Annual Report
2017–2018
PUBLIC HEALTH DIVISION
2
Acknowledgments
This publication was prepared by the Oregon Health Authority Health Care-associated Infections (HAI) Program, including: Roza Tammer, MPH, CICLisa Takeuchi, MPHDiane Roy
Oversight provided by: Rebecca Pierce, PhD, MS, BSN, HAI program manager
Zintars Beldavs, MS, ACDP section manager
This report would not have been possible without the efforts of Oregon’s HAI prevention partners, including the Health Care-Associated Infections Advisory Committee and the health care facilities included in this report.
For more information contact: Roza Tammer, MPH, CIC [email protected]
Rebecca Pierce, PhD, MS, BSN [email protected]
October 2017
Please cite this publication as follows:
Oregon Public Health Division. Health care-associated infections: 2016 Oregon Annual Report. Oregon Health Authority. Portland, OR. 2017 October.
Acknowledgments | Health Care-Associated Infections 2016
3
Contents
» Executive summary 2016 ................................................................. 4
» Introduction ........................................................................................ 6
» Data ..................................................................................................10
» Central line-associated bloodstream infections: Adult and pediatric intensive care units and wards ......................... 13
» Central line-associated bloodstream infections: Neonatal intensive care units ...........................................................15
» Catheter-associated urinary tract infections: Adult and pediatric intensive care units and wards ......................... 17
» Clostridium difficile infections ...........................................................19
» Methicillin-resistant Staphylococcus aureus bloodstream infections ...................................................................21
» Surgical site infection (SSI) following select surgeries .................... 23
» Bloodstream infections in freestanding outpatient dialysis facilities ............................................................................... 27
» Acronym glossary ............................................................................ 28
» References ....................................................................................... 29
» Appendix I: Recommendations for patients and families to minimize health care-associated infections risk .......................... 30
Health Care-Associated Infections 2016 | Contents
4
Executive summary 2016 Health care-associated infections in Oregon hospitals
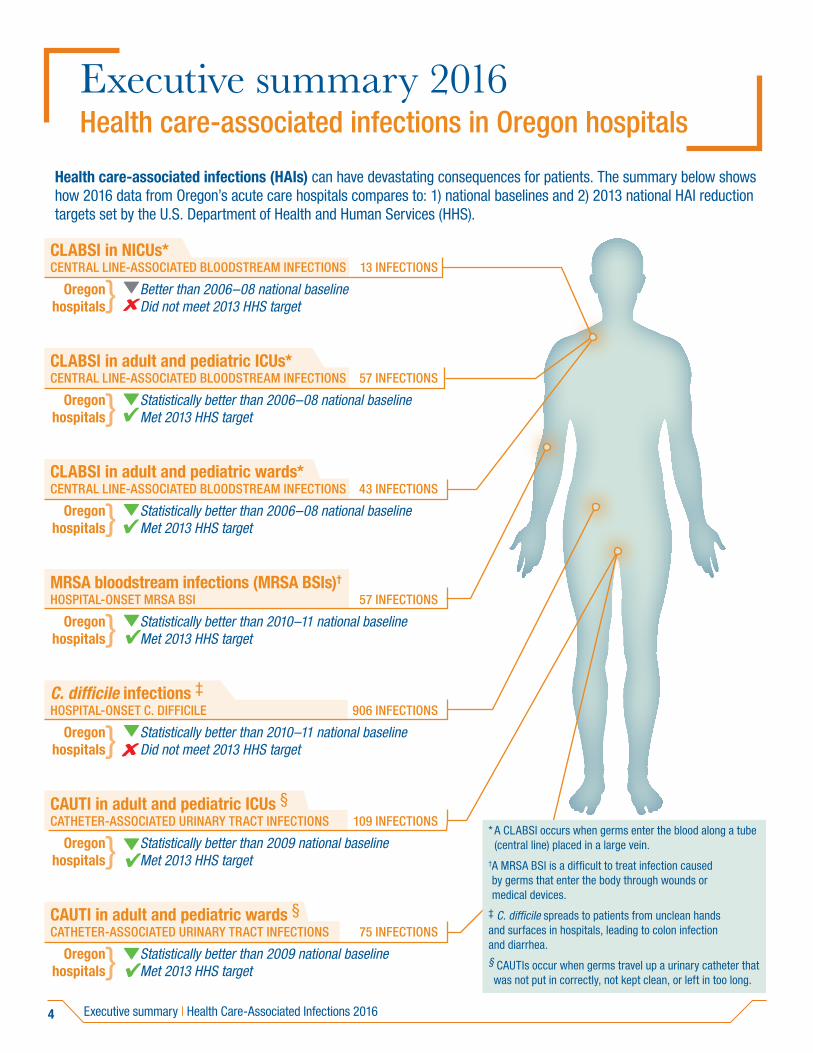
Health care-associated infections (HAIs) can have devastating consequences for patients. The summary below shows how 2016 data from Oregon’s acute care hospitals compares to: 1) national baselines and 2) 2013 national HAI reduction targets set by the U.S. Department of Health and Human Services (HHS).
CLABSI in NICUs* CENTRAL LINE-ASSOCIATED BLOODSTREAM INFECTIONS 13 INFECTIONS
Oregon Better than 2006–08 national baseline hospitals Did not meet 2013 HHS target
CLABSI in adult and pediatric ICUs* CENTRAL LINE-ASSOCIATED BLOODSTREAM INFECTIONS 57 INFECTIONS
Oregon Statistically better than 2006–08 national baseline hospitals Met 2013 HHS target
CLABSI in adult and pediatric wards* CENTRAL LINE-ASSOCIATED BLOODSTREAM INFECTIONS 43 INFECTIONS
Oregon Statistically better than 2006–08 national baseline hospitals Met 2013 HHS target
MRSA bloodstream infections (MRSA BSIs)†
HOSPITAL-ONSET MRSA BSI 57 INFECTIONS
Oregon Statistically better than 2010–11 national baseline hospitals Met 2013 HHS target
C. difficile infections ‡HOSPITAL-ONSET C. DIFFICILE 906 INFECTIONS
Oregon Statistically better than 2010–11 national baseline hospitals Did not meet 2013 HHS target
CAUTI in adult and pediatric ICUs §CATHETER-ASSOCIATED URINARY TRACT INFECTIONS 109 INFECTIONS
Oregon Statistically better than 2009 national baseline hospitals Met 2013 HHS target
CAUTI in adult and pediatric wards §CATHETER-ASSOCIATED URINARY TRACT INFECTIONS 75 INFECTIONS
Oregon Statistically better than 2009 national baseline hospitals Met 2013 HHS target
}
}
}
}
}
}
}
* A CLABSI occurs when germs enter the blood along a tube (central line) placed in a large vein.
† A MRSA BSI is a difficult to treat infection caused by germs that enter the body through wounds or medical devices.
‡ C. difficile spreads to patients from unclean hands and surfaces in hospitals, leading to colon infection and diarrhea.§ CAUTIs occur when germs travel up a urinary catheter that was not put in correctly, not kept clean, or left in too long.
Executive summary | Health Care-Associated Infections 2016
5
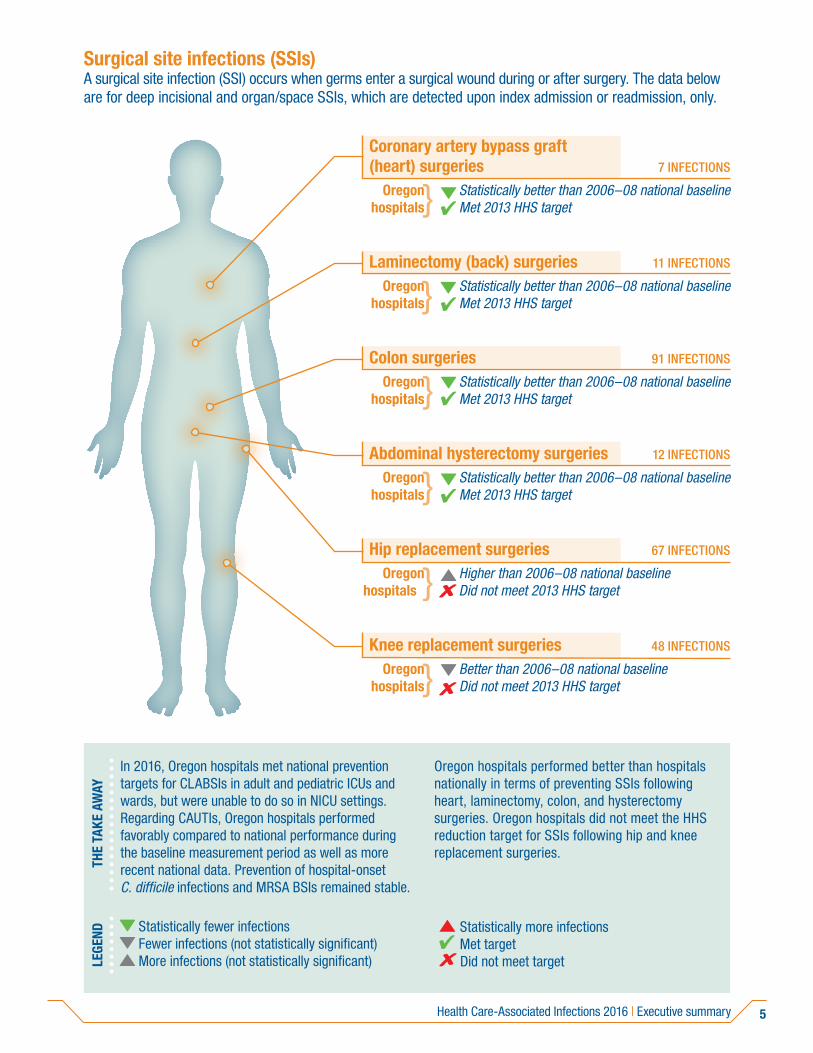
Surgical site infections (SSIs)A surgical site infection (SSI) occurs when germs enter a surgical wound during or after surgery. The data below are for deep incisional and organ/space SSIs, which are detected upon index admission or readmission, only.
Coronary artery bypass graft (heart) surgeries 7 INFECTIONS
Oregon Statistically better than 2006–08 national baseline hospitals Met 2013 HHS target
Laminectomy (back) surgeries 11 INFECTIONS
Oregon Statistically better than 2006–08 national baseline hospitals Met 2013 HHS target
Colon surgeries 91 INFECTIONS Oregon Statistically better than 2006–08 national baseline hospitals Met 2013 HHS target
Abdominal hysterectomy surgeries 12 INFECTIONS
Oregon Statistically better than 2006–08 national baseline hospitals Met 2013 HHS target
Hip replacement surgeries 67 INFECTIONS
Oregon Higher than 2006–08 national baseline hospitals Did not meet 2013 HHS target
Knee replacement surgeries 48 INFECTIONS
Oregon Better than 2006–08 national baseline hospitals Did not meet 2013 HHS target
}
}
}
}
}
}
THE
TAKE
AW
AY
In 2016, Oregon hospitals met national prevention targets for CLABSIs in adult and pediatric ICUs and wards, but were unable to do so in NICU settings. Regarding CAUTIs, Oregon hospitals performed favorably compared to national performance during the baseline measurement period as well as more recent national data. Prevention of hospital-onset C. difficile infections and MRSA BSIs remained stable.
Oregon hospitals performed better than hospitals nationally in terms of preventing SSIs following heart, laminectomy, colon, and hysterectomy surgeries. Oregon hospitals did not meet the HHS reduction target for SSIs following hip and knee replacement surgeries.
LEGE
ND Statistically fewer infections Fewer infections (not statistically significant) More infections (not statistically significant)
Statistically more infections Met target Did not meet target
Health Care-Associated Infections 2016 | Executive summary
6
Introduction
BackgroundOne in 25 hospitalized patients in the United States gets a health care-associated infection (HAI) while receiving medical treatment. An estimated 722,000 HAIs occur each year in acute care facilities.(1) Results of HAIs include medical complications, longer hospital stays, increased risk of death, and increased health care costs.(2)
In 2007, the Oregon Legislative Assembly passed House Bill 2524. This bill created Oregon’s HAI Program, with oversight provided by its HAI Advisory Committee (HAIAC) of stakeholders including providers, consumers, insurers and experts. The HAIAC advises the Oregon Health Authority (OHA) regarding which HAIs facilities should report to OHA under Oregon Administrative Rule (OAR) 333-018. Oregon’s hospitals began reporting selected HAIs to OHA in 2009. By 2015, 10 types of HAIs were reportable by hospitals. In addition, a requirement for dialysis facilities to report adverse events was established. (Table 1) This report contains HAI and dialysis event data. Health care worker influenza vaccination data are in a separate report.
Statewide infection preventionThe HAI Program supports various infection prevention efforts. In November of 2014, Oregon’s inter-facility transfer communication law took effect. This law requires health care facilities to notify receiving facilities of a patient colonized by or infected with a multidrug-resistant organism (MDRO), including MRSA and Clostridium difficile. Additional information about prevention activities is available on the HAI Program website.
Report audience This report is for health care providers, consumers, public health officials and policy makers. Combined data for calendar year 2016 are in this report. Facility-specific data and maps are accessible online at www.healthoregon.org/hai-reports.
Introduction | Health Care-Associated Infections 2016
7
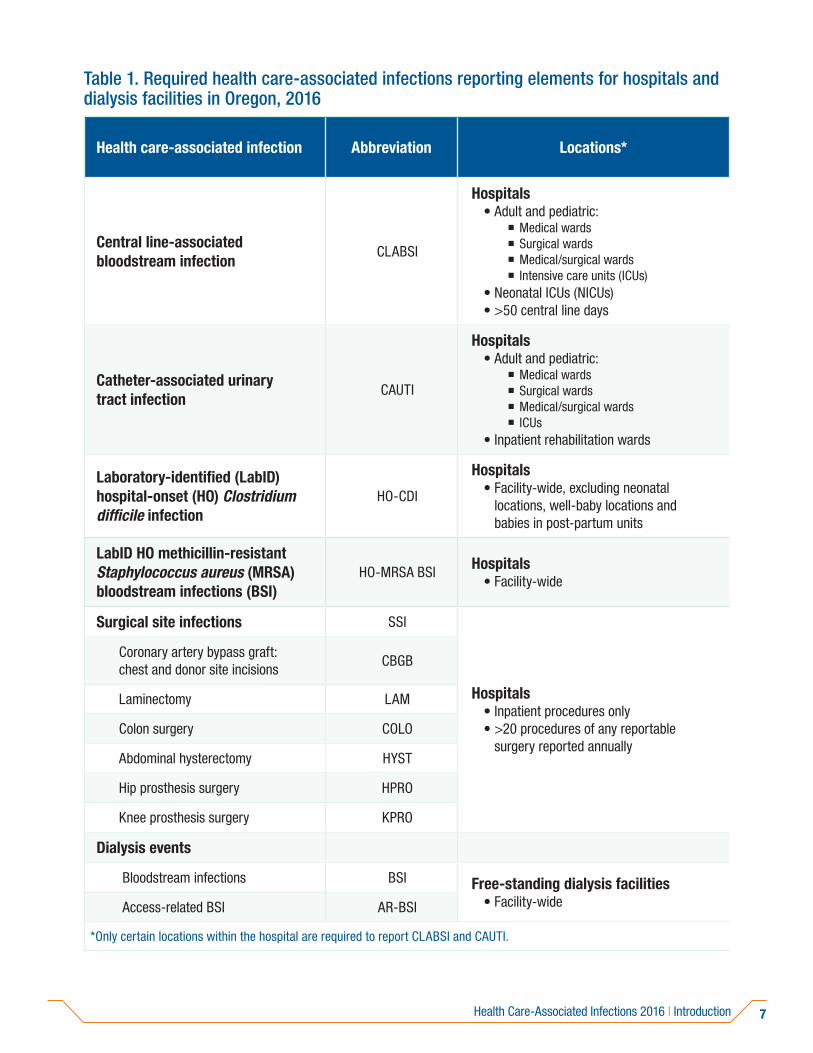
Table 1. Required health care-associated infections reporting elements for hospitals and dialysis facilities in Oregon, 2016
Health care-associated infection Abbreviation Locations*
Central line-associated bloodstream infection
CLABSI
Hospitals• Adult and pediatric:
� Medical wards � Surgical wards � Medical/surgical wards � Intensive care units (ICUs)
• Neonatal ICUs (NICUs)• >50 central line days
Catheter-associated urinary tract infection
CAUTI
Hospitals• Adult and pediatric:
� Medical wards � Surgical wards � Medical/surgical wards � ICUs
• Inpatient rehabilitation wards
Laboratory-identified (LabID) hospital-onset (HO) Clostridium difficile infection
HO-CDI
Hospitals• Facility-wide, excluding neonatal
locations, well-baby locations and babies in post-partum units
LabID HO methicillin-resistant Staphylococcus aureus (MRSA) bloodstream infections (BSI)
HO-MRSA BSI Hospitals• Facility-wide
Surgical site infections SSI
Hospitals• Inpatient procedures only• >20 procedures of any reportable
surgery reported annually
Coronary artery bypass graft: chest and donor site incisions
CBGB
Laminectomy LAM
Colon surgery COLO
Abdominal hysterectomy HYST
Hip prosthesis surgery HPRO
Knee prosthesis surgery KPRO
Dialysis events
Bloodstream infections BSI Free-standing dialysis facilities• Facility-wide Access-related BSI AR-BSI
*Only certain locations within the hospital are required to report CLABSI and CAUTI.
Health Care-Associated Infections 2016 | Introduction
8 Introduction | Health Care-Associated Infections 2016
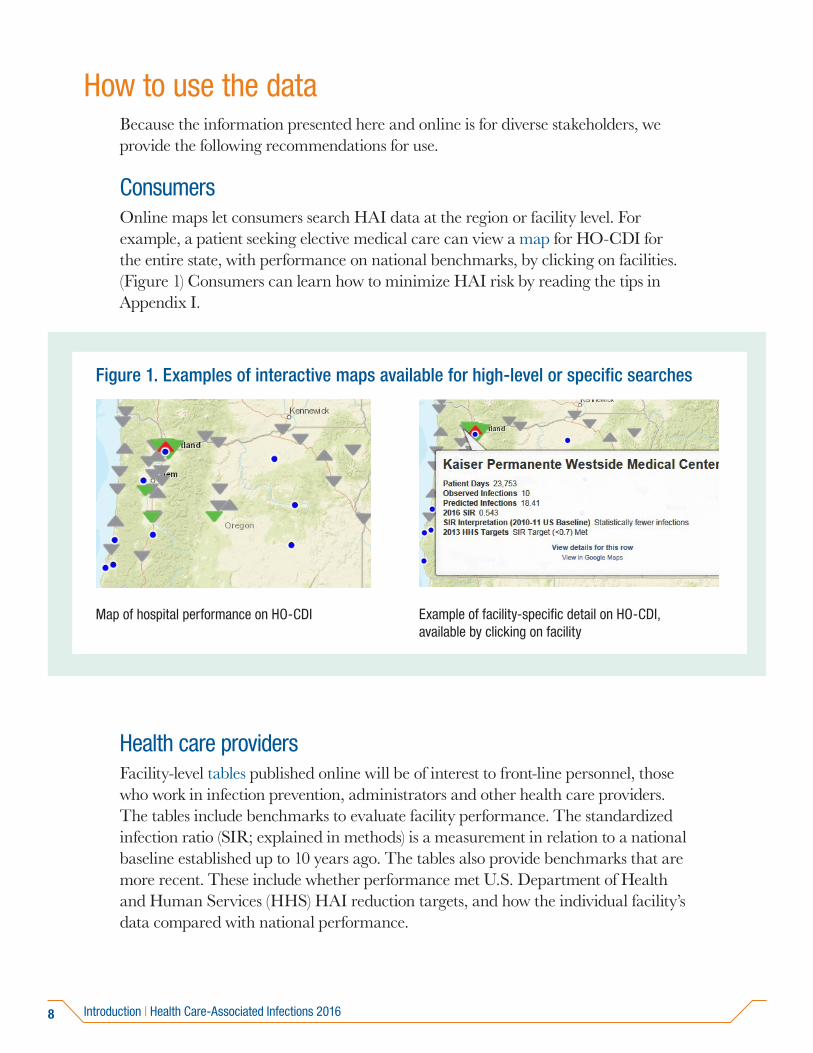
How to use the dataBecause the information presented here and online is for diverse stakeholders, we provide the following recommendations for use.
Consumers Online maps let consumers search HAI data at the region or facility level. For example, a patient seeking elective medical care can view a map for HO-CDI for the entire state, with performance on national benchmarks, by clicking on facilities. (Figure 1) Consumers can learn how to minimize HAI risk by reading the tips in Appendix I.
Health care providersFacility-level tables published online will be of interest to front-line personnel, those who work in infection prevention, administrators and other health care providers. The tables include benchmarks to evaluate facility performance. The standardized infection ratio (SIR; explained in methods) is a measurement in relation to a national baseline established up to 10 years ago. The tables also provide benchmarks that are more recent. These include whether performance met U.S. Department of Health and Human Services (HHS) HAI reduction targets, and how the individual facility’s data compared with national performance.
Map of hospital performance on HO-CDI Example of facility-specific detail on HO-CDI, available by clicking on facility
Figure 1. Examples of interactive maps available for high-level or specific searches
Map of hospital performance on HO-CDI Example of facility-specific detail on HO-CDI, available by clicking on facility
Figure 1. Examples of interactive maps available for high-level or specific searches
9
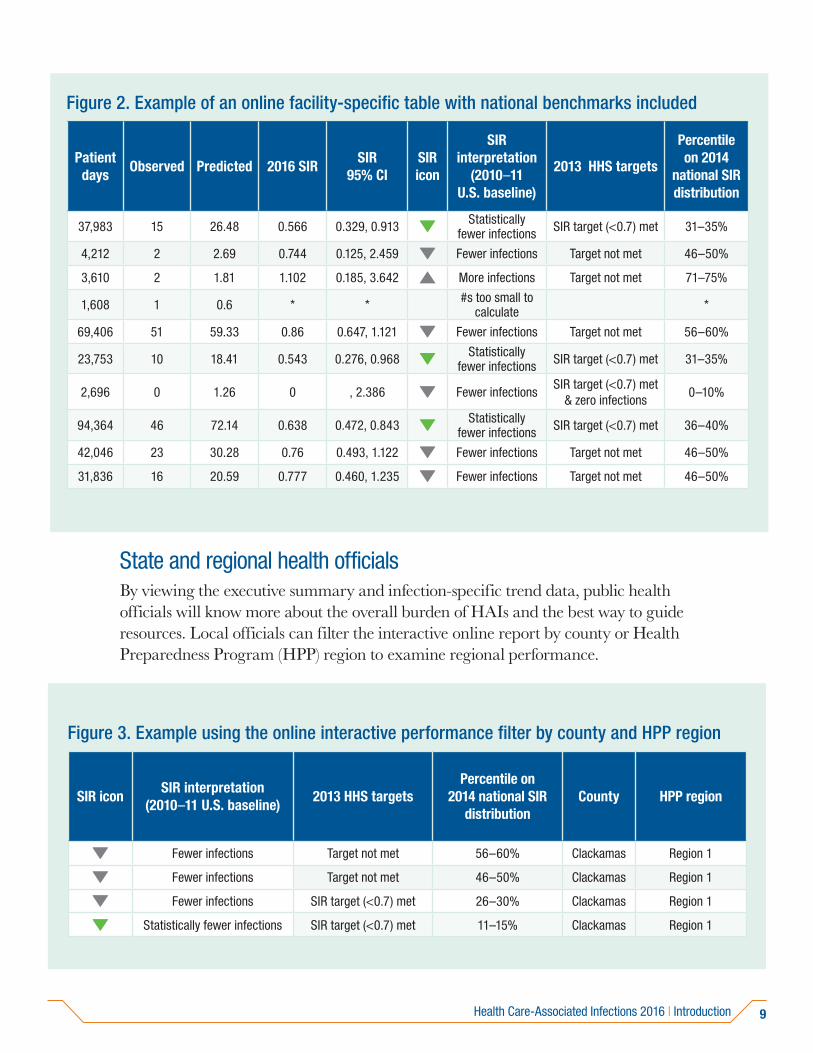
Figure 2. Example of an online facility-specific table with national benchmarks included
Patient days
Observed Predicted 2016 SIRSIR
95% CISIR icon
SIR interpretation
(2010–11 U.S. baseline)
2013 HHS targets
Percentile on 2014
national SIR distribution
37,983 15 26.48 0.566 0.329, 0.913 Statistically fewer infections SIR target (<0.7) met 31–35%
4,212 2 2.69 0.744 0.125, 2.459 Fewer infections Target not met 46–50%
3,610 2 1.81 1.102 0.185, 3.642 More infections Target not met 71–75%
1,608 1 0.6 * * #s too small to calculate *
69,406 51 59.33 0.86 0.647, 1.121 Fewer infections Target not met 56–60%
23,753 10 18.41 0.543 0.276, 0.968 Statistically fewer infections SIR target (<0.7) met 31–35%
2,696 0 1.26 0 , 2.386 Fewer infectionsSIR target (<0.7) met
& zero infections0–10%
94,364 46 72.14 0.638 0.472, 0.843 Statistically fewer infections SIR target (<0.7) met 36–40%
42,046 23 30.28 0.76 0.493, 1.122 Fewer infections Target not met 46–50%
31,836 16 20.59 0.777 0.460, 1.235 Fewer infections Target not met 46–50%
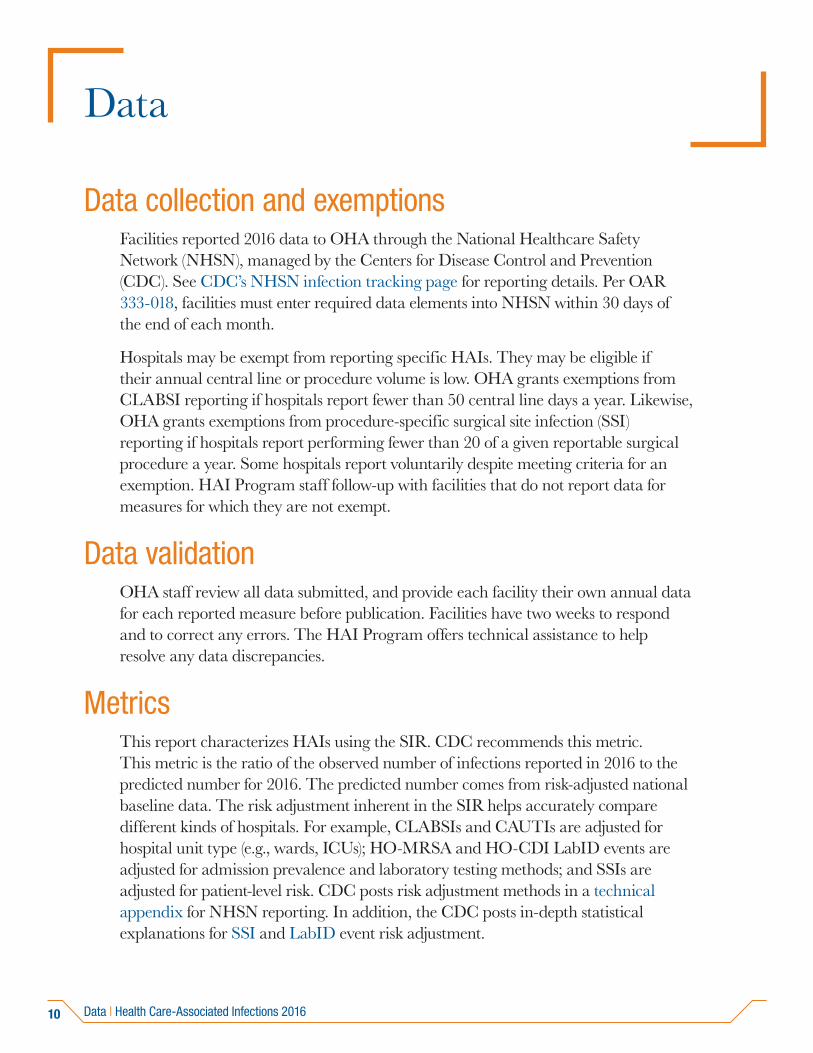
State and regional health officials By viewing the executive summary and infection-specific trend data, public health officials will know more about the overall burden of HAIs and the best way to guide resources. Local officials can filter the interactive online report by county or Health Preparedness Program (HPP) region to examine regional performance.
Figure 3. Example using the online interactive performance filter by county and HPP region
SIR iconSIR interpretation
(2010–11 U.S. baseline)2013 HHS targets
Percentile on 2014 national SIR
distributionCounty HPP region
Fewer infections Target not met 56–60% Clackamas Region 1
Fewer infections Target not met 46–50% Clackamas Region 1
Fewer infections SIR target (<0.7) met 26–30% Clackamas Region 1
Statistically fewer infections SIR target (<0.7) met 11–15% Clackamas Region 1
Health Care-Associated Infections 2016 | Introduction
10
Data
Data collection and exemptionsFacilities reported 2016 data to OHA through the National Healthcare Safety Network (NHSN), managed by the Centers for Disease Control and Prevention (CDC). See CDC’s NHSN infection tracking page for reporting details. Per OAR 333-018, facilities must enter required data elements into NHSN within 30 days of the end of each month.
Hospitals may be exempt from reporting specific HAIs. They may be eligible if their annual central line or procedure volume is low. OHA grants exemptions from CLABSI reporting if hospitals report fewer than 50 central line days a year. Likewise, OHA grants exemptions from procedure-specific surgical site infection (SSI) reporting if hospitals report performing fewer than 20 of a given reportable surgical procedure a year. Some hospitals report voluntarily despite meeting criteria for an exemption. HAI Program staff follow-up with facilities that do not report data for measures for which they are not exempt.
Data validationOHA staff review all data submitted, and provide each facility their own annual data for each reported measure before publication. Facilities have two weeks to respond and to correct any errors. The HAI Program offers technical assistance to help resolve any data discrepancies.
MetricsThis report characterizes HAIs using the SIR. CDC recommends this metric. This metric is the ratio of the observed number of infections reported in 2016 to the predicted number for 2016. The predicted number comes from risk-adjusted national baseline data. The risk adjustment inherent in the SIR helps accurately compare different kinds of hospitals. For example, CLABSIs and CAUTIs are adjusted for hospital unit type (e.g., wards, ICUs); HO-MRSA and HO-CDI LabID events are adjusted for admission prevalence and laboratory testing methods; and SSIs are adjusted for patient-level risk. CDC posts risk adjustment methods in a technical appendix for NHSN reporting. In addition, the CDC posts in-depth statistical explanations for SSI and LabID event risk adjustment.
Data | Health Care-Associated Infections 2016
11
Metrics for dialysis events in this report include the rate of BSIs and AR-BSIs per 100 patient-months. Facility rates are calculated by access type and are compared to national rates to benchmark facility performance.
BenchmarksOHA compares the collective, state-level data in this report against two national benchmarks:
• The 2013 U.S. HHS target SIRs for acute care hospital HAI prevention, as described in the National Action Plan to Prevent Health Care-Associated Infections: Road Map to Elimination.
• The 2014 national SIR established by NHSN, as described in the National and State Healthcare-Associated Infections Progress Report.
At the time of the writing of this report, CDC and HHS were updating targets for both of these benchmarks. More details on these updates are accessible online:
• CDC’s NHSN website: https://www.cdc.gov/nhsn/index.html.
• HHS’s Office of Disease Prevention and Health Promotion website: https://health.gov/hcq/prevent-hai-measures.asp.
Collective data for all Oregon facilitiesIn this report, we summarize performance for all metrics for 2016 that facilities must report to Oregon’s HAI Program. On April 24, 2017, OHA staff exported data from NHSN. Facility-specific tables and maps are online, alphabetized by facility name, with facility-specific data.
Facility-specific table elements• Facility name: Facilities listed are those that reported data to OHA. Facilities
missing from tables had an exemption from reporting.
• Location (where relevant): For device-associated infections (CLABSI and CAUTI), facilities must report from specific locations. (Table 1) This aligns with the Centers for Medicare & Medicaid Services (CMS) for the hospital inpatient quality reporting program (IQR). Each table presents both collective data and data by location.
• Observed infections: Total number of infections (or events) meeting the NHSN criteria for reporting.
• Predicted infections: Total number of infections (or events) predicted for 2016, based on risk-adjusted national baselines.
Health Care-Associated Infections 2016 | Data
12
• Standardized infection ratio (SIR): This measure divides the number of observed infections (or events) by the number of predicted infections (or events).
• SIR interpretation: An SIR value of one means the facility reported the same number of infections (or events) as predicted based on risk-adjusted national baselines. Values of less than one means the facility reports fewer infections than predicted based on the national baseline. Values of greater than one means the facility reports more infections than predicted based on the national baseline.
• 95% confidence interval (CI): There is a 95% chance the true SIR lies within this range of values. If this range includes the value of one, the number of infections or events reported was not significantly different from predicted. Confidence intervals (CI) will not be calculated when an SIR is not available.
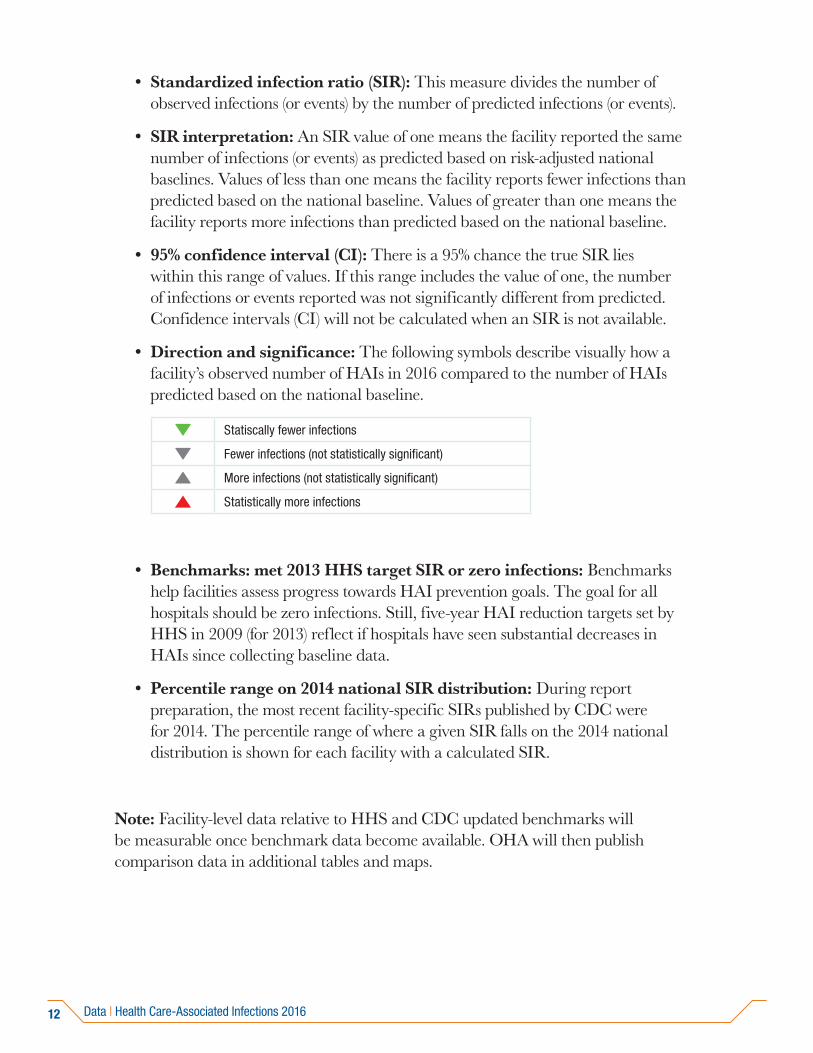
• Direction and significance: The following symbols describe visually how a facility’s observed number of HAIs in 2016 compared to the number of HAIs predicted based on the national baseline.
Statiscally fewer infections
Fewer infections (not statistically significant)
More infections (not statistically significant)
Statistically more infections
• Benchmarks: met 2013 HHS target SIR or zero infections: Benchmarks help facilities assess progress towards HAI prevention goals. The goal for all hospitals should be zero infections. Still, five-year HAI reduction targets set by HHS in 2009 (for 2013) reflect if hospitals have seen substantial decreases in HAIs since collecting baseline data.
• Percentile range on 2014 national SIR distribution: During report preparation, the most recent facility-specific SIRs published by CDC were for 2014. The percentile range of where a given SIR falls on the 2014 national distribution is shown for each facility with a calculated SIR.
Note: Facility-level data relative to HHS and CDC updated benchmarks will be measurable once benchmark data become available. OHA will then publish comparison data in additional tables and maps.
Data | Health Care-Associated Infections 2016
13
Central line-associated bloodstream infections: Adult and pediatric intensive care units and wards
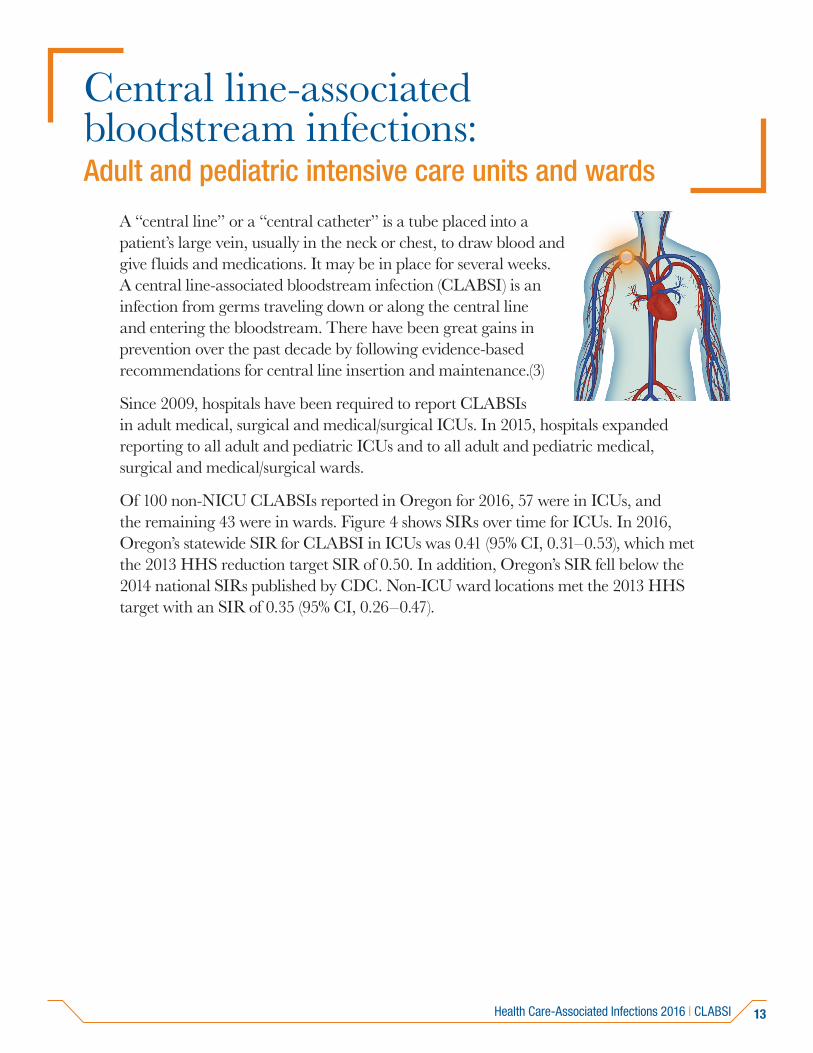
A “central line” or a “central catheter” is a tube placed into a patient’s large vein, usually in the neck or chest, to draw blood and give fluids and medications. It may be in place for several weeks. A central line-associated bloodstream infection (CLABSI) is an infection from germs traveling down or along the central line and entering the bloodstream. There have been great gains in prevention over the past decade by following evidence-based recommendations for central line insertion and maintenance.(3)
Since 2009, hospitals have been required to report CLABSIs in adult medical, surgical and medical/surgical ICUs. In 2015, hospitals expanded reporting to all adult and pediatric ICUs and to all adult and pediatric medical, surgical and medical/surgical wards.
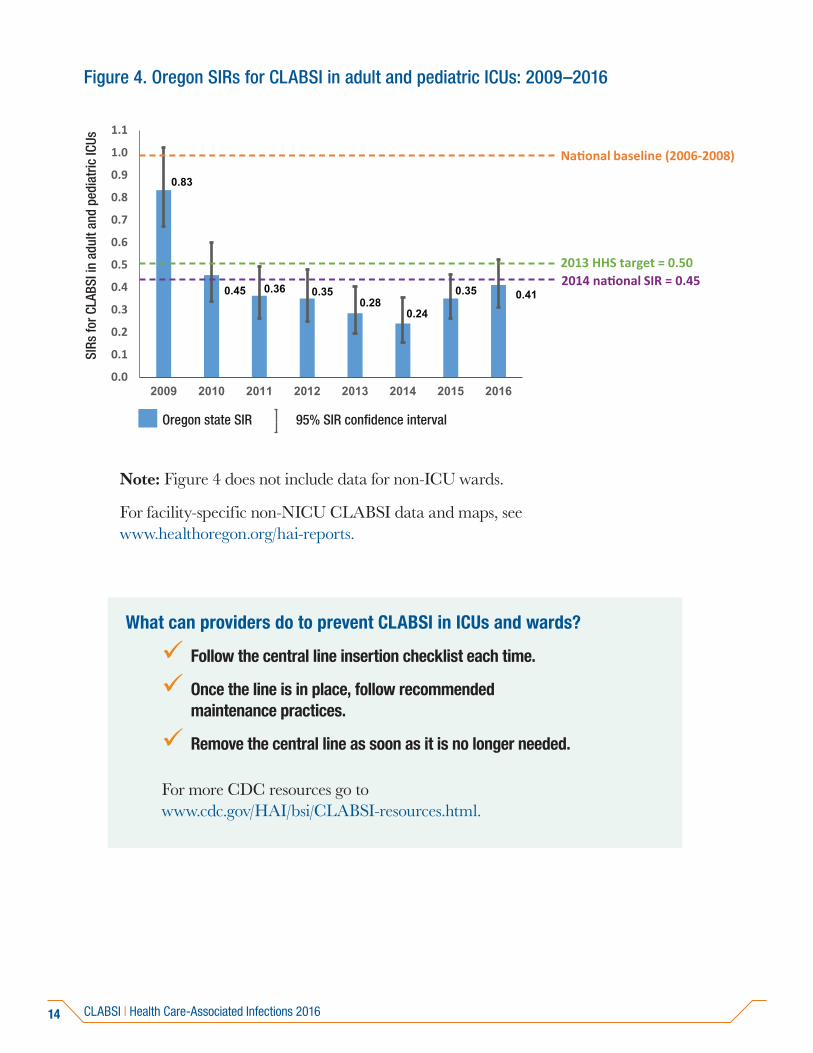
Of 100 non-NICU CLABSIs reported in Oregon for 2016, 57 were in ICUs, and the remaining 43 were in wards. Figure 4 shows SIRs over time for ICUs. In 2016, Oregon’s statewide SIR for CLABSI in ICUs was 0.41 (95% CI, 0.31–0.53), which met the 2013 HHS reduction target SIR of 0.50. In addition, Oregon’s SIR fell below the 2014 national SIRs published by CDC. Non-ICU ward locations met the 2013 HHS target with an SIR of 0.35 (95% CI, 0.26–0.47).
Health Care-Associated Infections 2016 | CLABSI
14
Figure 4. Oregon SIRs for CLABSI in adult and pediatric ICUs: 2009–2016
0.83
0.45 0.36 0.350.28
0.24
0.35 0.41
0.0
0.1
0.2
0.3
0.4
0.5
0.6
0.7
0.8
0.9
1.0
1.1
2009 2010 2011 2012 2013 2014 2015 2016
National baseline (2006-2008)
2013 HHS target = 0.502014 national SIR = 0.45
95% SIR confidence interval Oregon state SIR
SIRs
for C
LABS
I in
adul
t and
ped
iatr
ic IC
Us
Note: Figure 4 does not include data for non-ICU wards.
For facility-specific non-NICU CLABSI data and maps, see www.healthoregon.org/hai-reports.
What can providers do to prevent CLABSI in ICUs and wards?
Follow the central line insertion checklist each time.
Once the line is in place, follow recommended maintenance practices.
Remove the central line as soon as it is no longer needed.
For more CDC resources go to www.cdc.gov/HAI/bsi/CLABSI-resources.html.
CLABSI | Health Care-Associated Infections 2016
15
Central line-associated bloodstream infections: Neonatal intensive care units
CLABSIs are the result of germs entering the bloodstream through catheters inserted into large veins for medication delivery and monitoring. Immature immune systems and compromised skin make newborns, particularly preterm infants, vulnerable to infection. Proper line maintenance, removal of lines when they are no longer needed and good communication between medical providers and families can prevent CLABSIs in neonatal intensive care units (NICU).(4)
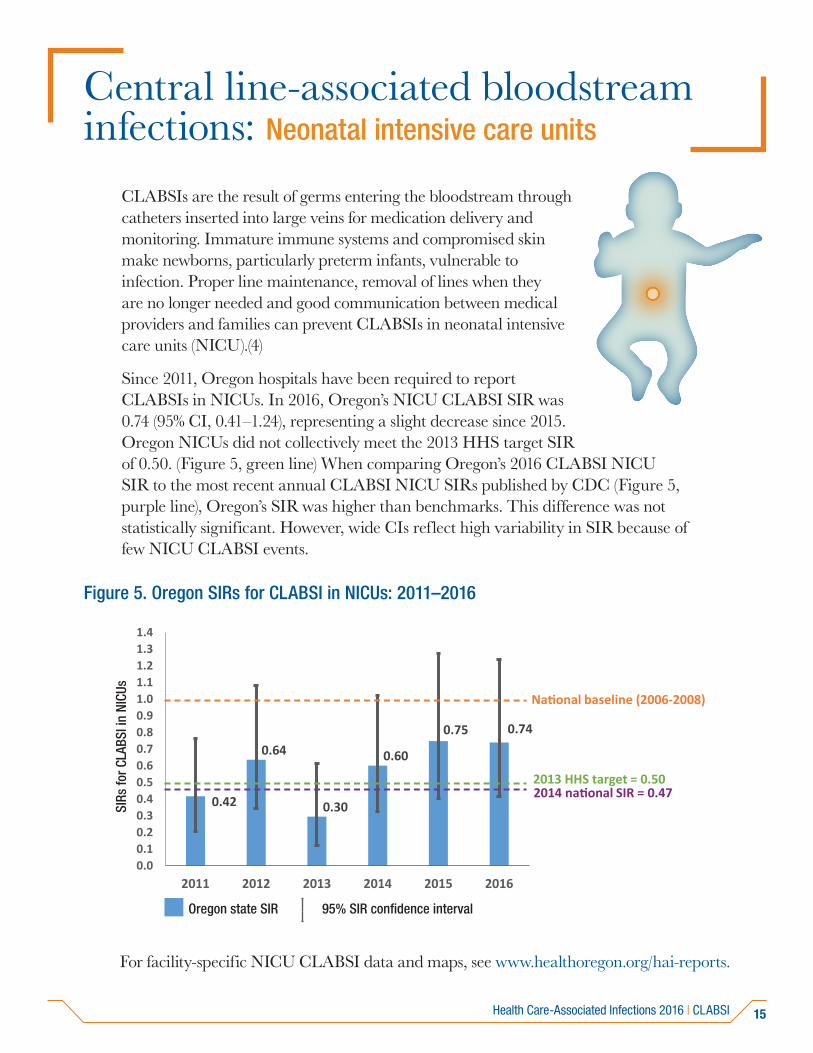
Since 2011, Oregon hospitals have been required to report CLABSIs in NICUs. In 2016, Oregon’s NICU CLABSI SIR was 0.74 (95% CI, 0.41–1.24), representing a slight decrease since 2015. Oregon NICUs did not collectively meet the 2013 HHS target SIR of 0.50. (Figure 5, green line) When comparing Oregon’s 2016 CLABSI NICU SIR to the most recent annual CLABSI NICU SIRs published by CDC (Figure 5, purple line), Oregon’s SIR was higher than benchmarks. This difference was not statistically significant. However, wide CIs reflect high variability in SIR because of few NICU CLABSI events.
Figure 5. Oregon SIRs for CLABSI in NICUs: 2011–2016
95% SIR confidence intervalOregon state SIR
SIRs
for C
LABS
I in
adul
t and
ped
iatr
ic IC
U
National baseline (2006-2008)
2013 HHS target = 0.502014 national SIR = 0.470.42
0.64
0.30
0.60
0.75 0.74
0.00.10.20.30.40.50.60.70.80.91.01.11.21.31.4
2011 2012 2013 2014 2015 2016
National baseline (2006-2008)
2013 HHS target = 0.502014 national SIR = 0.47
SIRs
for C
LABS
I in
NICU
s
For facility-specific NICU CLABSI data and maps, see www.healthoregon.org/hai-reports.
Health Care-Associated Infections 2016 | CLABSI
16
What can providers do to prevent CLABSI in NICUs?
Follow the central line insertion checklist.
Allow only trained professionals to insert lines.
Pay close attention to line maintenance:
» Follow evidence-based guidelines for maintenance;
» Emphasize hand hygiene; and
» Educate parents and visitors.
Remove the central line as soon as it is no longer needed.
Assess and address local challenges to recommend practices.
For more CDC resources go to www.cdc.gov/HAI/bsi/CLABSI-resources.html.
CLABSI | Health Care-Associated Infections 2016
17
Catheter-associated urinary tract infections: Adult and pediatric intensive care units and wards
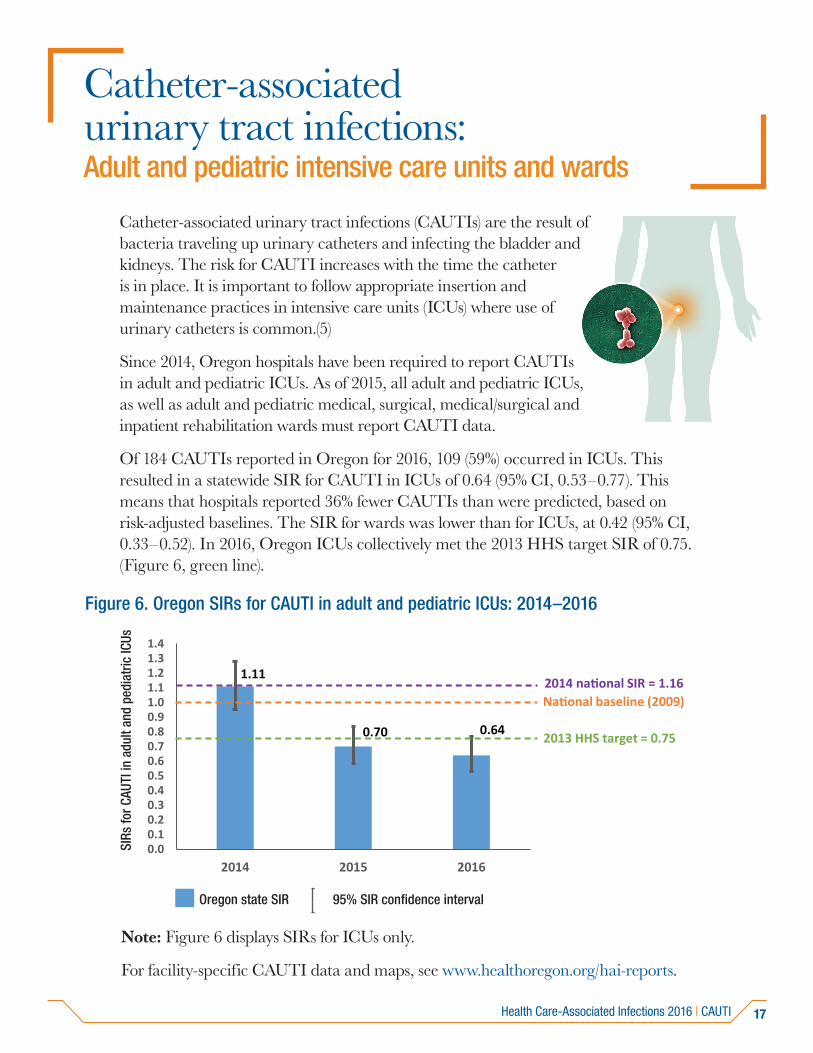
Catheter-associated urinary tract infections (CAUTIs) are the result of bacteria traveling up urinary catheters and infecting the bladder and kidneys. The risk for CAUTI increases with the time the catheter is in place. It is important to follow appropriate insertion and maintenance practices in intensive care units (ICUs) where use of urinary catheters is common.(5)
Since 2014, Oregon hospitals have been required to report CAUTIs in adult and pediatric ICUs. As of 2015, all adult and pediatric ICUs, as well as adult and pediatric medical, surgical, medical/surgical and inpatient rehabilitation wards must report CAUTI data.
Of 184 CAUTIs reported in Oregon for 2016, 109 (59%) occurred in ICUs. This resulted in a statewide SIR for CAUTI in ICUs of 0.64 (95% CI, 0.53–0.77). This means that hospitals reported 36% fewer CAUTIs than were predicted, based on risk-adjusted baselines. The SIR for wards was lower than for ICUs, at 0.42 (95% CI, 0.33–0.52). In 2016, Oregon ICUs collectively met the 2013 HHS target SIR of 0.75. (Figure 6, green line).
Figure 6. Oregon SIRs for CAUTI in adult and pediatric ICUs: 2014–2016
95% SIR confidence interval Oregon state SIR
)
2013
1.11
0.70 0.64
0.00.10.20.30.40.50.60.70.80.91.01.11.21.31.4
2014 2015 2016
National baseline (2009)
2013 HHS target = 0.75
2014 national SIR = 1.16
SIRs
for C
AUTI
in a
dult
and
pedi
atric
ICUs
Note: Figure 6 displays SIRs for ICUs only.
For facility-specific CAUTI data and maps, see www.healthoregon.org/hai-reports.
Health Care-Associated Infections 2016 | CAUTI
18
What can providers do to prevent CAUTI?
Insert urinary catheters only when necessary.
Remove as soon as possible.
Allow only trained professionals to insert catheters,using sterile techniques.
Pay close attention to catheter care:
» Clean hands before and after handling;
» Properly secure indwelling catheters after insertion; and
» Maintain free urine flow.
For more CDC resources go to www.cdc.gov/HAI/ca_uti/uti.html.
CAUTI | Health-Care Associated Infections 2016
19
Clostridium difficile infections
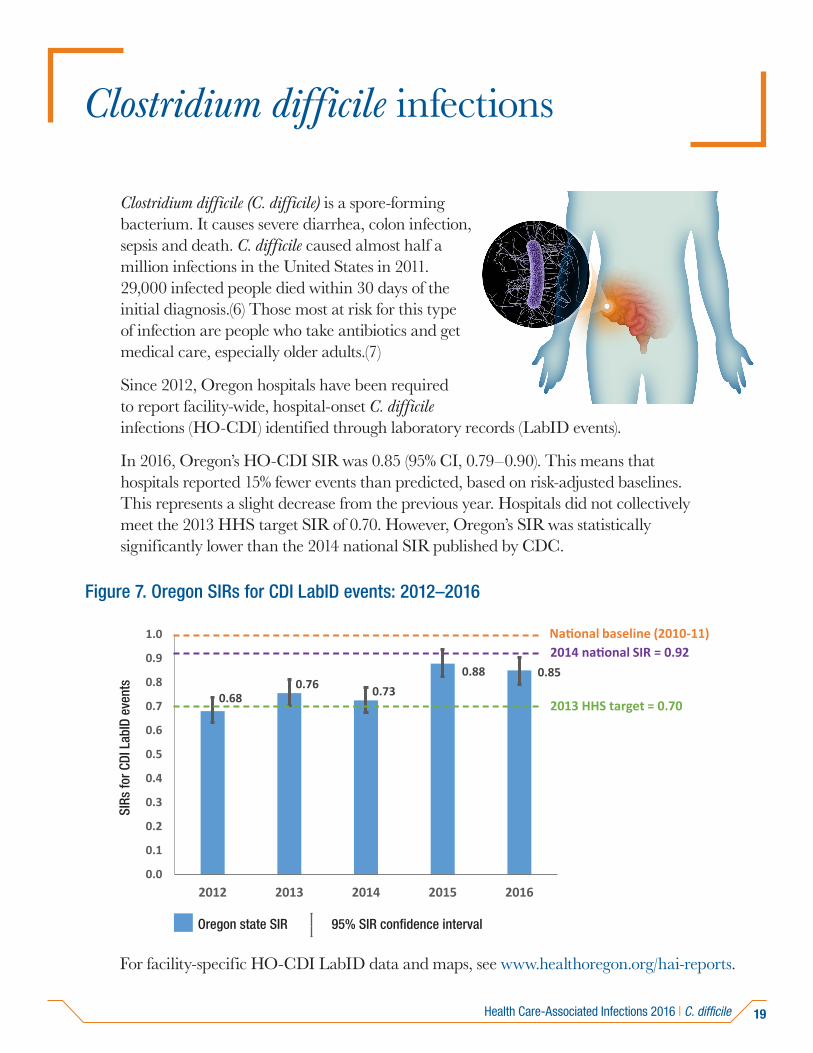
Clostridium difficile (C. difficile) is a spore-forming bacterium. It causes severe diarrhea, colon infection, sepsis and death. C. difficile caused almost half a million infections in the United States in 2011. 29,000 infected people died within 30 days of the initial diagnosis.(6) Those most at risk for this type of infection are people who take antibiotics and get medical care, especially older adults.(7)
Since 2012, Oregon hospitals have been required to report facility-wide, hospital-onset C. difficile infections (HO-CDI) identified through laboratory records (LabID events).
In 2016, Oregon’s HO-CDI SIR was 0.85 (95% CI, 0.79–0.90). This means that hospitals reported 15% fewer events than predicted, based on risk-adjusted baselines. This represents a slight decrease from the previous year. Hospitals did not collectively meet the 2013 HHS target SIR of 0.70. However, Oregon’s SIR was statistically significantly lower than the 2014 national SIR published by CDC.
Figure 7. Oregon SIRs for CDI LabID events: 2012–2016
95% SIR confidence intervalOregon state SIR
0.680.76 0.73
0.88 0.85
0.0
0.1
0.2
0.3
0.4
0.5
0.6
0.7
0.8
0.9
1.0
2012 2013 2014 2015 2016
National baseline (2010-11)
2013 HHS target = 0.70
2014 national SIR = 0.92
SIRs
for C
DI L
abID
eve
nts
For facility-specific HO-CDI LabID data and maps, see www.healthoregon.org/hai-reports.
Health Care-Associated Infections 2016 | C. difficile
20
What can providers do to prevent CDI?
Prescribe antibiotics with care.
Swiftly detect and isolate any patient with C. difficile.
Wear gowns and gloves when treating a patient with C. difficile.Alcohol-based hand rubs will not kill C. difficile. Hand washingwith soap and water is preferable.
In areas where patients with C. difficile have been treated, cleansurfaces with a U.S. Environmental Protection Agency-approved,spore-killing disinfectant.
When transferring a patient with C. difficile, let the receivingfacility know of the patient’s status.
For more CDC resources go to www.cdc.gov/hai/organisms/cdiff/Cdiff_clinicians.html.
C. difficile | Health Care-Associated Infections 2016
21
Methicillin-resistant Staphylococcus aureus bloodstream infections
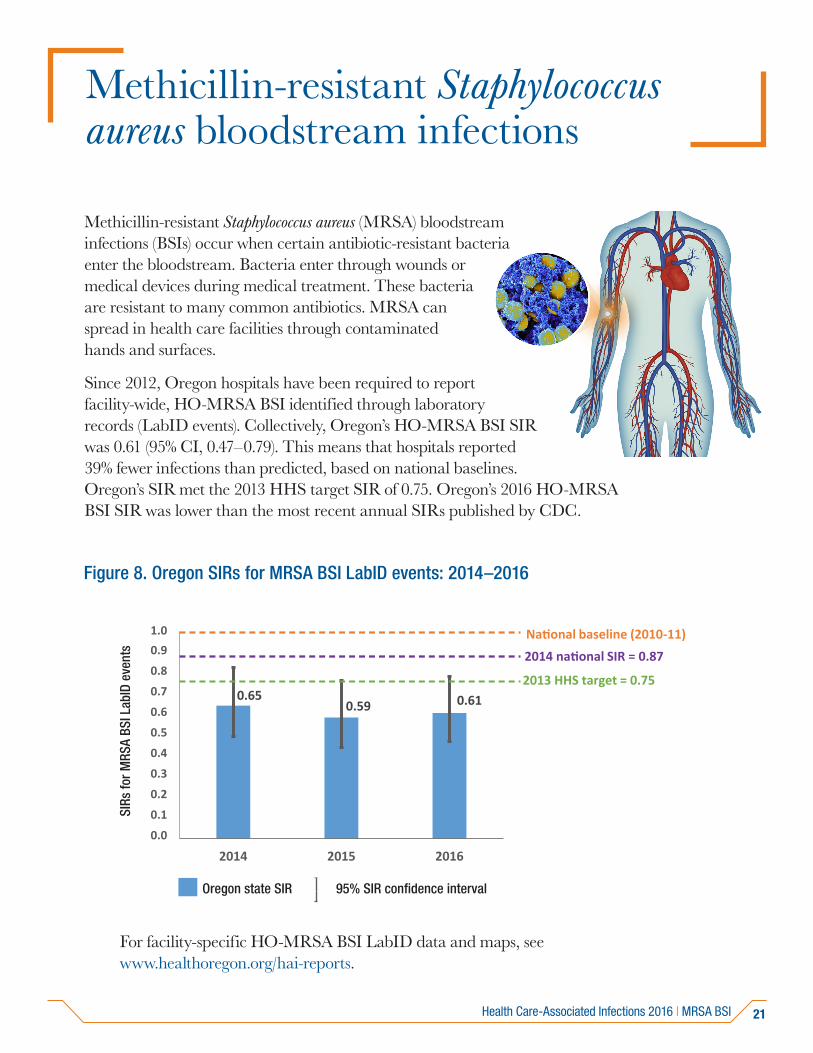
Methicillin-resistant Staphylococcus aureus (MRSA) bloodstream infections (BSIs) occur when certain antibiotic-resistant bacteria enter the bloodstream. Bacteria enter through wounds or medical devices during medical treatment. These bacteria are resistant to many common antibiotics. MRSA can spread in health care facilities through contaminated hands and surfaces.
Since 2012, Oregon hospitals have been required to report facility-wide, HO-MRSA BSI identified through laboratory records (LabID events). Collectively, Oregon’s HO-MRSA BSI SIR was 0.61 (95% CI, 0.47–0.79). This means that hospitals reported 39% fewer infections than predicted, based on national baselines. Oregon’s SIR met the 2013 HHS target SIR of 0.75. Oregon’s 2016 HO-MRSA BSI SIR was lower than the most recent annual SIRs published by CDC.
Figure 8. Oregon SIRs for MRSA BSI LabID events: 2014–2016
95% SIR confidence interval Oregon state SIR
0.650.59 0.61
0.0
0.1
0.2
0.3
0.4
0.5
0.6
0.7
0.8
0.91.0
2014 2015 2016
National baseline (2010-11)
2013 HHS target = 0.75
2014 national SIR = 0.87
SIRs
for M
RSA
BSI L
abID
eve
nts
For facility-specific HO-MRSA BSI LabID data and maps, see www.healthoregon.org/hai-reports.
Health Care-Associated Infections 2016 | MRSA BSI
22
What can providers do to prevent MRSA BSIs?
Perform hand hygiene before and after patient care or contactwith surfaces in patient care areas.
Carefully clean hospital rooms and medical equipment.
Use contact precautions (gown and gloves) when caring forpatients with MRSA.
When transferring a patient with MRSA, let the receiving facilityknow of the patient’s status.
When receiving a patient from another facility, confirm the statusof any infections with a MDRO.
For more CDC resources go to www.cdc.gov/HAI/organisms/mrsa-infection.html.
MRSA BSI | Health Care-Associated Infections 2016
23
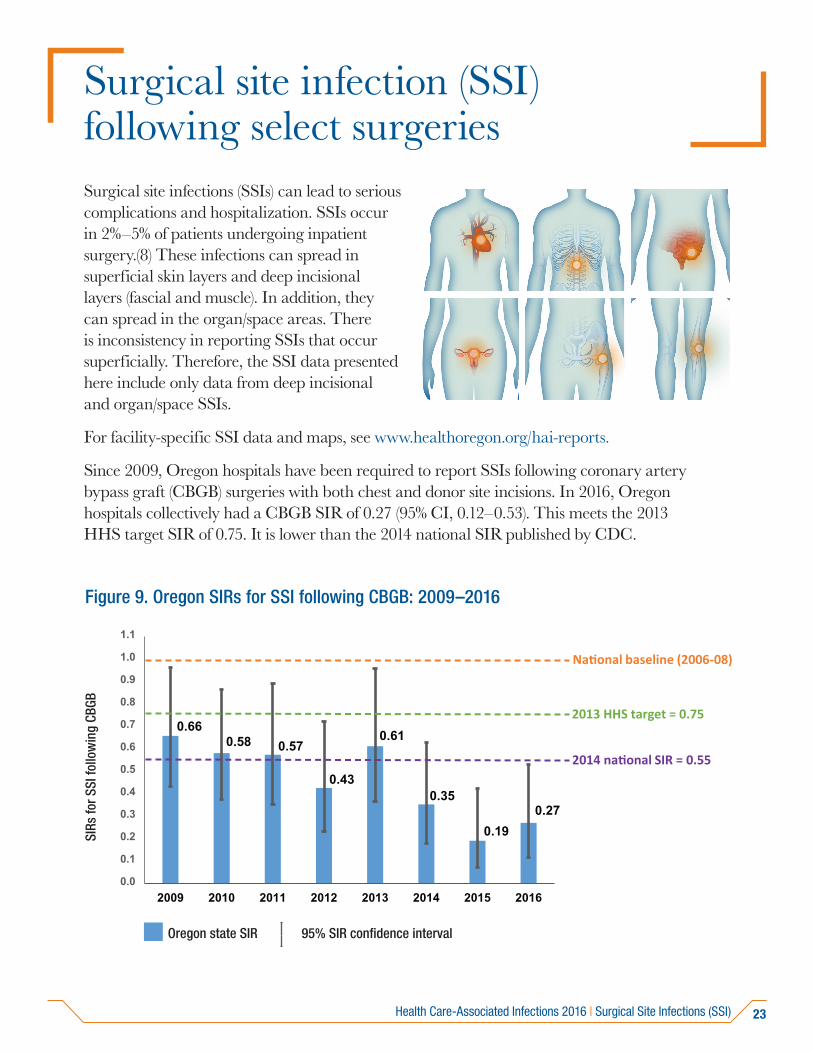
Surgical site infection (SSI) following select surgeriesSurgical site infections (SSIs) can lead to serious complications and hospitalization. SSIs occur in 2%–5% of patients undergoing inpatient surgery.(8) These infections can spread in superficial skin layers and deep incisional layers (fascial and muscle). In addition, they can spread in the organ/space areas. There is inconsistency in reporting SSIs that occur superficially. Therefore, the SSI data presented here include only data from deep incisional and organ/space SSIs.
For facility-specific SSI data and maps, see www.healthoregon.org/hai-reports.
Since 2009, Oregon hospitals have been required to report SSIs following coronary artery bypass graft (CBGB) surgeries with both chest and donor site incisions. In 2016, Oregon hospitals collectively had a CBGB SIR of 0.27 (95% CI, 0.12–0.53). This meets the 2013 HHS target SIR of 0.75. It is lower than the 2014 national SIR published by CDC.
Figure 9. Oregon SIRs for SSI following CBGB: 2009–2016
95% SIR confidence interval Oregon state SIR
0.660.58 0.57
0.43
0.61
0.35
0.190.27
0.0
0.1
0.2
0.3
0.4
0.5
0.6
0.7
0.8
0.9
1.0
1.1
2009 2010 2011 2012 2013 2014 2015 2016
National baseline (2006-08)
2013 HHS target = 0.75
2014 national SIR = 0.55
SIRs
for S
SI fo
llow
ing
CBGB
Health Care-Associated Infections 2016 | Surgical Site Infections (SSI)
24
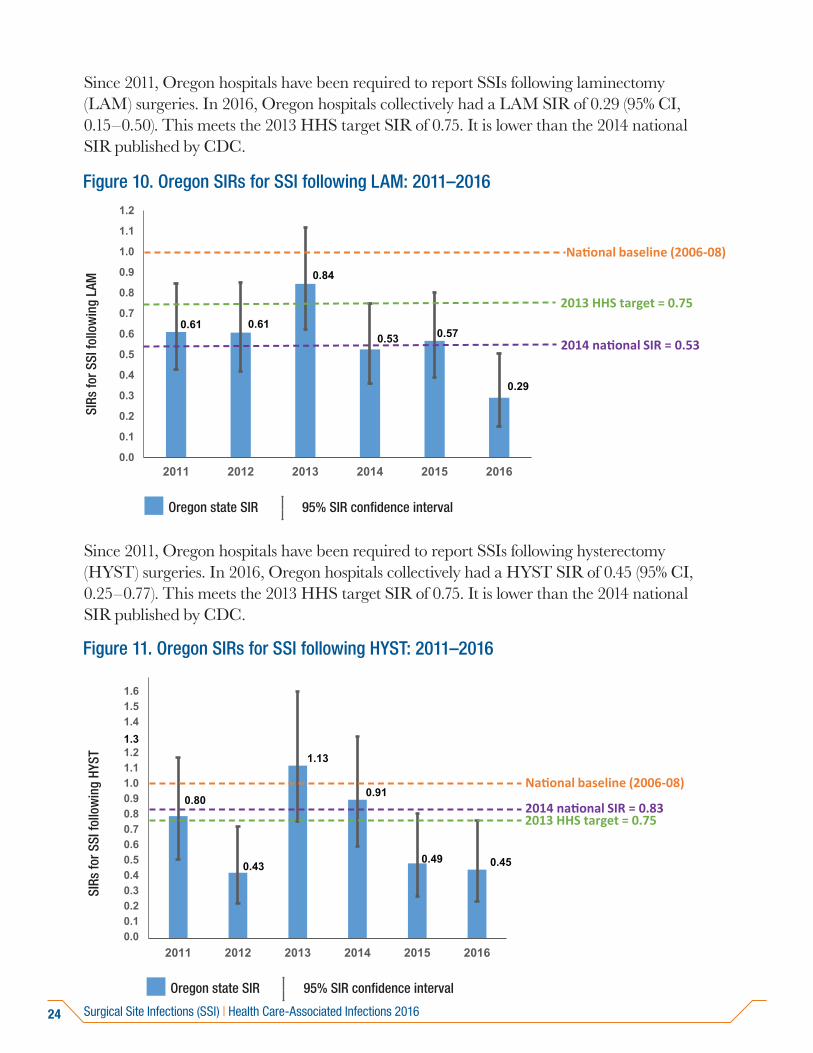
Since 2011, Oregon hospitals have been required to report SSIs following laminectomy (LAM) surgeries. In 2016, Oregon hospitals collectively had a LAM SIR of 0.29 (95% CI, 0.15–0.50). This meets the 2013 HHS target SIR of 0.75. It is lower than the 2014 national SIR published by CDC.
Figure 10. Oregon SIRs for SSI following LAM: 2011–2016
0.61 0.61
0.84
0.53 0.57
0.29
0.0
0.1
0.2
0.3
0.4
0.5
0.6
0.7
0.8
0.9
1.0
1.1
1.2
2011 2012 2013 2014 2015 2016
National baseline (2006-08)
2013 HHS target = 0.75
2014 national SIR = 0.53
95% SIR confidence interval Oregon state SIR
SIRs
for S
SI fo
llow
ing
LAM
Since 2011, Oregon hospitals have been required to report SSIs following hysterectomy (HYST) surgeries. In 2016, Oregon hospitals collectively had a HYST SIR of 0.45 (95% CI, 0.25–0.77). This meets the 2013 HHS target SIR of 0.75. It is lower than the 2014 national SIR published by CDC.
Figure 11. Oregon SIRs for SSI following HYST: 2011–2016
95% SIR confidence intervalOregon state SIR
0.80
0.43
1.13
0.91
0.49 0.45
0.00.10.20.30.40.50.60.70.80.91.01.11.21.31.41.51.6
2011 2012 2013 2014 2015 2016
National baseline (2006-08)
2013 HHS target = 0.752014 national SIR = 0.83
SIRs
for S
SI fo
llow
ing
HYST
Surgical Site Infections (SSI) | Health Care-Associated Infections 2016
25
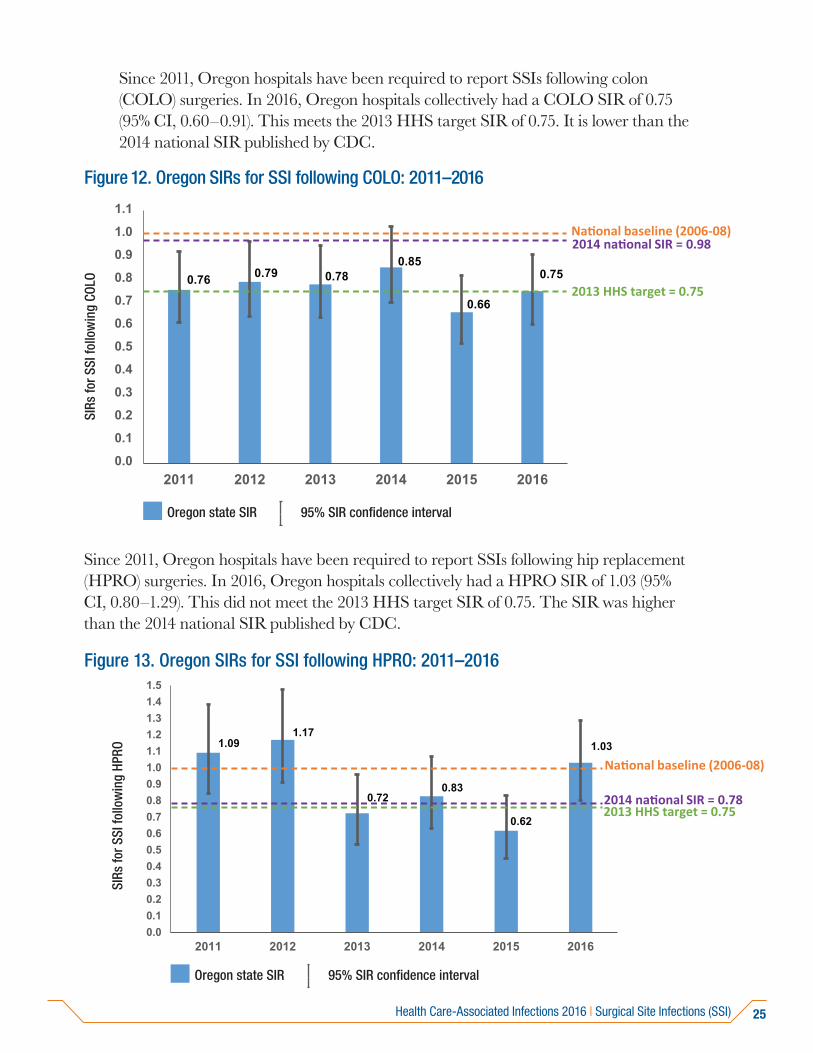
Since 2011, Oregon hospitals have been required to report SSIs following colon (COLO) surgeries. In 2016, Oregon hospitals collectively had a COLO SIR of 0.75 (95% CI, 0.60–0.91). This meets the 2013 HHS target SIR of 0.75. It is lower than the 2014 national SIR published by CDC.
Figure 12. Oregon SIRs for SSI following COLO: 2011–2016
95% SIR confidence interval Oregon state SIR
0.76 0.79 0.780.85
0.66
0.75
0.0
0.1
0.2
0.3
0.4
0.5
0.6
0.7
0.8
0.9
1.0
1.1
2011 2012 2013 2014 2015 2016
National baseline (2006-08)
2013 HHS target = 0.75
2014 national SIR = 0.98
SIRs
for S
SI fo
llow
ing
COLO
Since 2011, Oregon hospitals have been required to report SSIs following hip replacement (HPRO) surgeries. In 2016, Oregon hospitals collectively had a HPRO SIR of 1.03 (95% CI, 0.80–1.29). This did not meet the 2013 HHS target SIR of 0.75. The SIR was higher than the 2014 national SIR published by CDC.
Figure 13. Oregon SIRs for SSI following HPRO: 2011–2016
95% SIR confidence interval Oregon state SIR
1.091.17
0.720.83
0.62
1.03
0.00.10.20.30.40.50.60.70.80.91.01.11.21.31.41.5
2011 2012 2013 2014 2015 2016
National baseline (2006-08)
2013 HHS target = 0.752014 national SIR = 0.78
SIRs
for S
SI fo
llow
ing
HPRO
Health Care-Associated Infections 2016 | Surgical Site Infections (SSI)
26
95% SIR confidence interval Oregon state SIR
0.86
0.981.06 1.07
0.69 0.65
0.83 0.78
0.00.10.20.30.40.50.60.70.80.91.01.11.21.31.41.5
2009 2010 2011 2012 2013 2014 2015 2016
National baseline (2006-08)
2013 HHS target = 0.75
2014 national SIR = 0.59
SIRs
for S
SI fo
llow
ing
KPRO
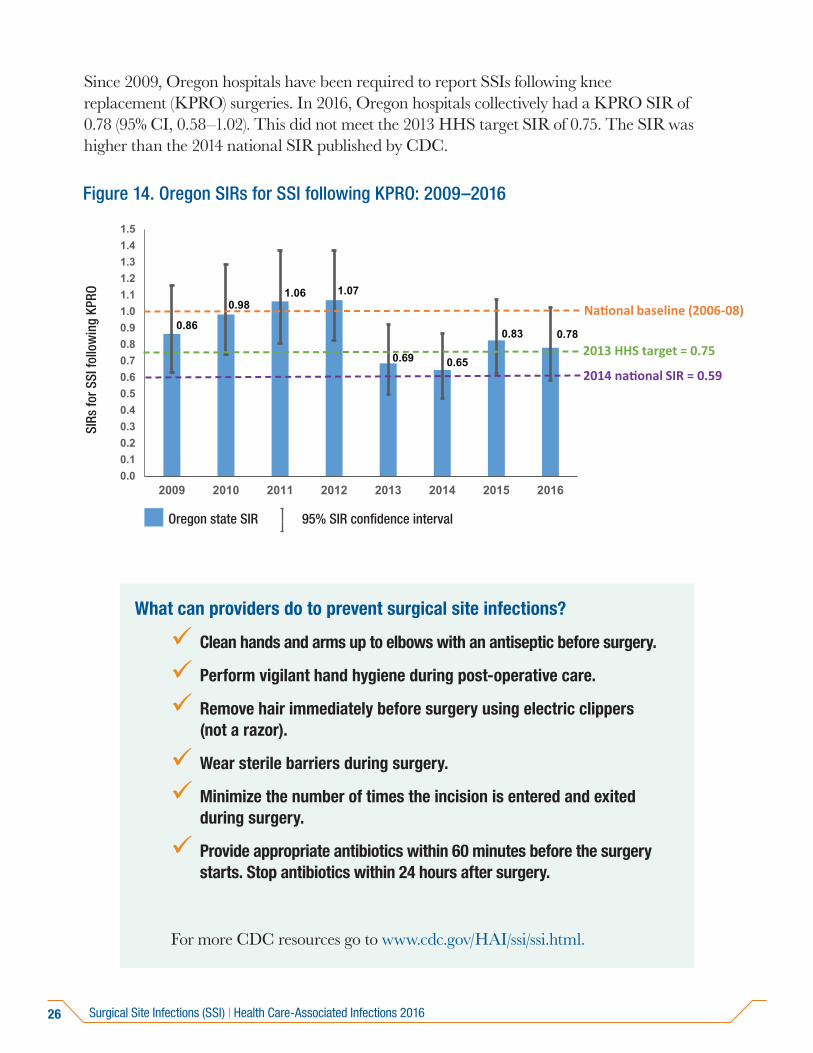
Figure 14. Oregon SIRs for SSI following KPRO: 2009–2016
What can providers do to prevent surgical site infections?
Clean hands and arms up to elbows with an antiseptic before surgery.
Perform vigilant hand hygiene during post-operative care.
Remove hair immediately before surgery using electric clippers(not a razor).
Wear sterile barriers during surgery.
Minimize the number of times the incision is entered and exitedduring surgery.
Provide appropriate antibiotics within 60 minutes before the surgerystarts. Stop antibiotics within 24 hours after surgery.
For more CDC resources go to www.cdc.gov/HAI/ssi/ssi.html.
Since 2009, Oregon hospitals have been required to report SSIs following knee replacement (KPRO) surgeries. In 2016, Oregon hospitals collectively had a KPRO SIR of 0.78 (95% CI, 0.58–1.02). This did not meet the 2013 HHS target SIR of 0.75. The SIR was higher than the 2014 national SIR published by CDC.
Surgical Site Infections (SSI) | Health Care-Associated Infections 2016
27
Bloodstream infections in freestanding outpatient dialysis facilities
95% SIR confidence interval Oregon state SIR
0.86
0.981.06 1.07
0.69 0.65
0.83 0.78
0.00.10.20.30.40.50.60.70.80.91.01.11.21.31.41.5
2009 2010 2011 2012 2013 2014 2015 2016
National baseline (2006-08)
2013 HHS target = 0.75
2014 national SIR = 0.59
SIRs
for S
SI fo
llow
ing
KPRO
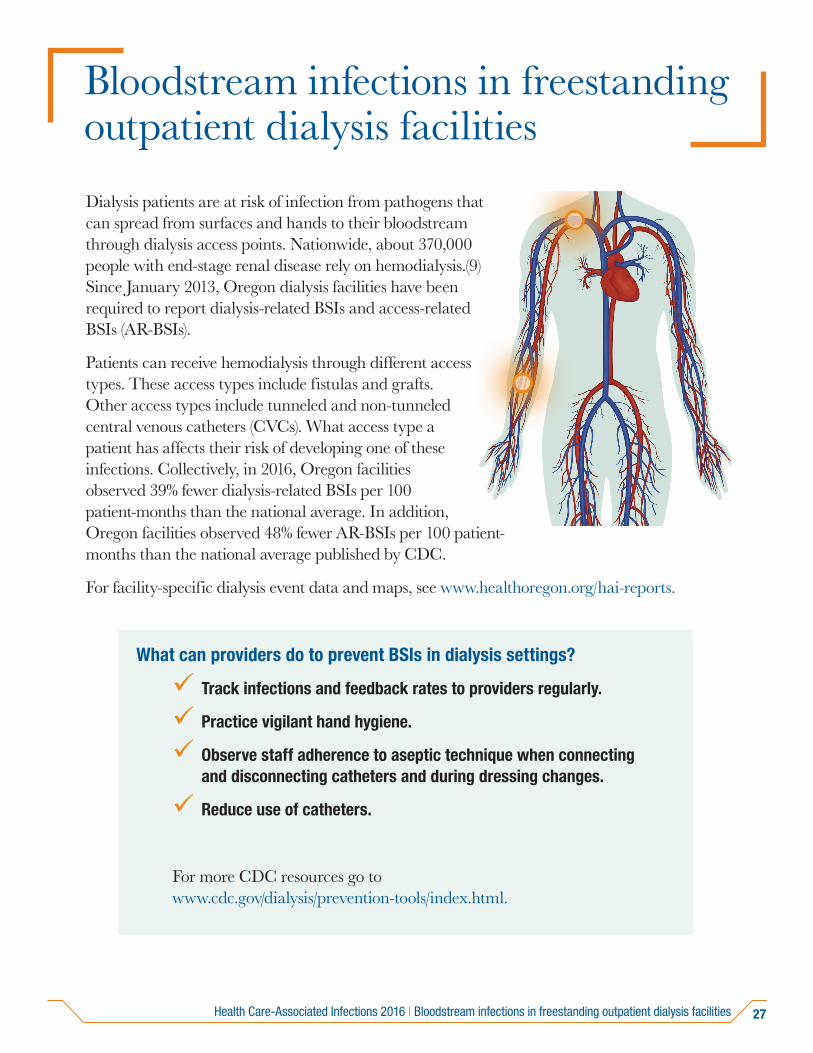
Dialysis patients are at risk of infection from pathogens that can spread from surfaces and hands to their bloodstream through dialysis access points. Nationwide, about 370,000 people with end-stage renal disease rely on hemodialysis.(9) Since January 2013, Oregon dialysis facilities have been required to report dialysis-related BSIs and access-related BSIs (AR-BSIs).
Patients can receive hemodialysis through different access types. These access types include fistulas and grafts. Other access types include tunneled and non-tunneled central venous catheters (CVCs). What access type a patient has affects their risk of developing one of these infections. Collectively, in 2016, Oregon facilities observed 39% fewer dialysis-related BSIs per 100 patient-months than the national average. In addition, Oregon facilities observed 48% fewer AR-BSIs per 100 patient-months than the national average published by CDC.
For facility-specific dialysis event data and maps, see www.healthoregon.org/hai-reports.
What can providers do to prevent BSIs in dialysis settings?
Track infections and feedback rates to providers regularly.
Practice vigilant hand hygiene.
Observe staff adherence to aseptic technique when connectingand disconnecting catheters and during dressing changes.
Reduce use of catheters.
For more CDC resources go to www.cdc.gov/dialysis/prevention-tools/index.html.
Health Care-Associated Infections 2016 | Bloodstream infections in freestanding outpatient dialysis facilities
28
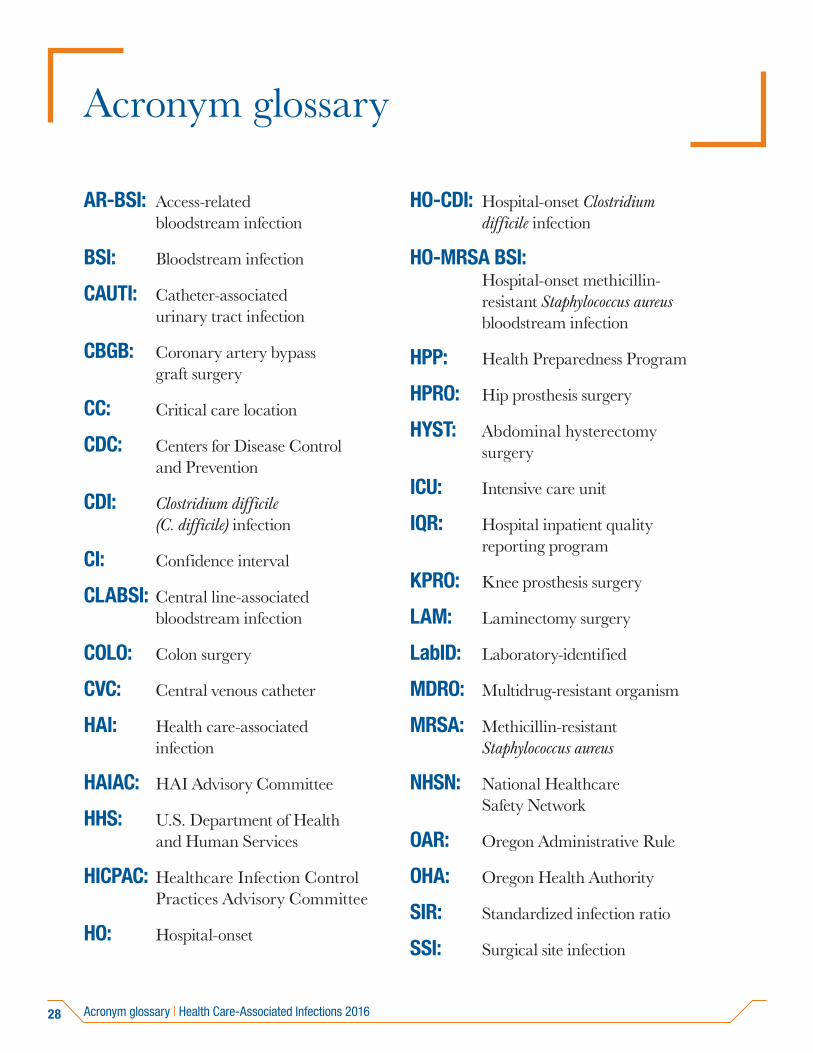
Acronym glossary
AR-BSI: Access-related bloodstream infection
BSI: Bloodstream infection
CAUTI: Catheter-associated urinary tract infection
CBGB: Coronary artery bypass graft surgery
CC: Critical care location
CDC: Centers for Disease Control and Prevention
CDI: Clostridium difficile (C. difficile) infection
CI: Confidence interval
CLABSI: Central line-associated bloodstream infection
COLO: Colon surgery
CVC: Central venous catheter
HAI: Health care-associated infection
HAIAC: HAI Advisory Committee
HHS: U.S. Department of Health and Human Services
HICPAC: Healthcare Infection Control Practices Advisory Committee
HO: Hospital-onset
HO-CDI: Hospital-onset Clostridiumdifficile infection
HO-MRSA BSI: Hospital-onset methicillin-
resistant Staphylococcus aureus bloodstream infection
HPP: Health Preparedness Program
HPRO: Hip prosthesis surgery
HYST: Abdominal hysterectomy surgery
ICU: Intensive care unit
IQR: Hospital inpatient quality reporting program
KPRO: Knee prosthesis surgery
LAM: Laminectomy surgery
LabID: Laboratory-identified
MDRO: Multidrug-resistant organism
MRSA: Methicillin-resistant Staphylococcus aureus
NHSN: National Healthcare Safety Network
OAR: Oregon Administrative Rule
OHA: Oregon Health Authority
SIR: Standardized infection ratio
SSI: Surgical site infection
Acronym glossary | Health Care-Associated Infections 2016
29
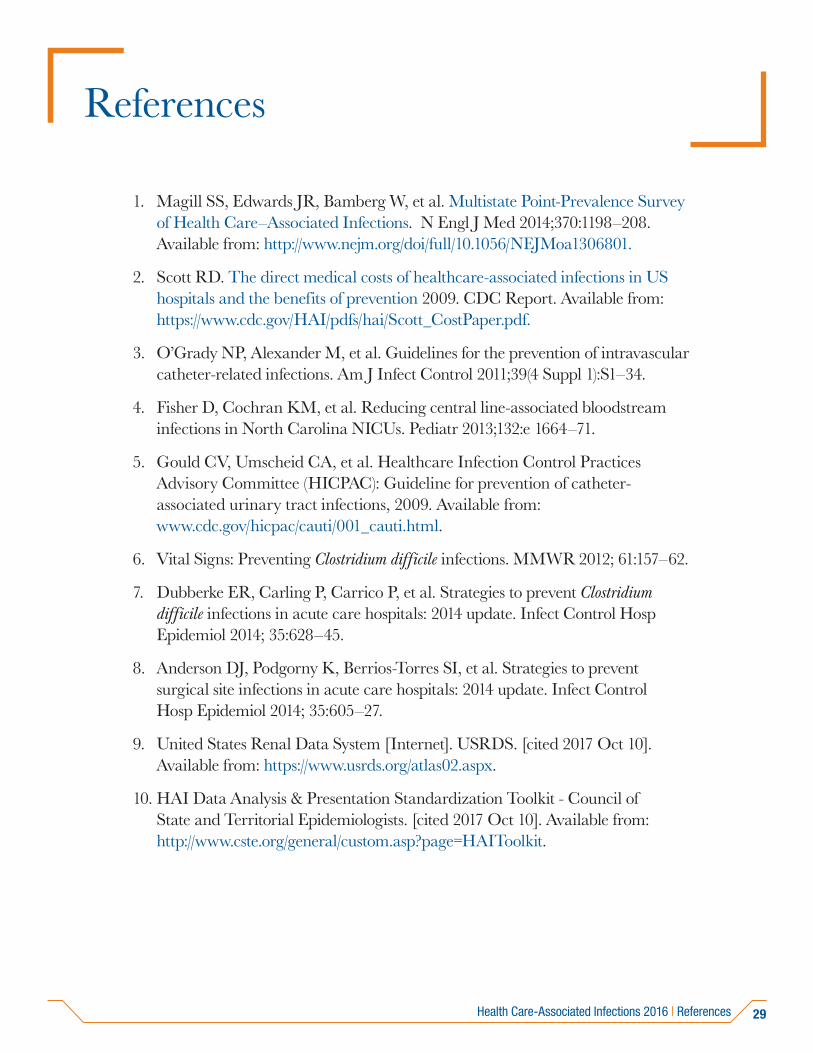
References
1. Magill SS, Edwards JR, Bamberg W, et al. Multistate Point-Prevalence Surveyof Health Care–Associated Infections. N Engl J Med 2014;370:1198–208.Available from: http://www.nejm.org/doi/full/10.1056/NEJMoa1306801.
2. Scott RD. The direct medical costs of healthcare-associated infections in UShospitals and the benefits of prevention 2009. CDC Report. Available from:https://www.cdc.gov/HAI/pdfs/hai/Scott_CostPaper.pdf.
3. O’Grady NP, Alexander M, et al. Guidelines for the prevention of intravascularcatheter-related infections. Am J Infect Control 2011;39(4 Suppl 1):S1–34.
4. Fisher D, Cochran KM, et al. Reducing central line-associated bloodstreaminfections in North Carolina NICUs. Pediatr 2013;132:e 1664–71.
5. Gould CV, Umscheid CA, et al. Healthcare Infection Control PracticesAdvisory Committee (HICPAC): Guideline for prevention of catheter-associated urinary tract infections, 2009. Available from:www.cdc.gov/hicpac/cauti/001_cauti.html.
6. Vital Signs: Preventing Clostridium difficile infections. MMWR 2012; 61:157–62.
7. Dubberke ER, Carling P, Carrico P, et al. Strategies to prevent Clostridiumdifficile infections in acute care hospitals: 2014 update. Infect Control HospEpidemiol 2014; 35:628–45.
8. Anderson DJ, Podgorny K, Berrios-Torres SI, et al. Strategies to preventsurgical site infections in acute care hospitals: 2014 update. Infect ControlHosp Epidemiol 2014; 35:605–27.
9. United States Renal Data System [Internet]. USRDS. [cited 2017 Oct 10].Available from: https://www.usrds.org/atlas02.aspx.
10. HAI Data Analysis & Presentation Standardization Toolkit - Council ofState and Territorial Epidemiologists. [cited 2017 Oct 10]. Available from:http://www.cste.org/general/custom.asp?page=HAIToolkit.
Health Care-Associated Infections 2016 | References
30
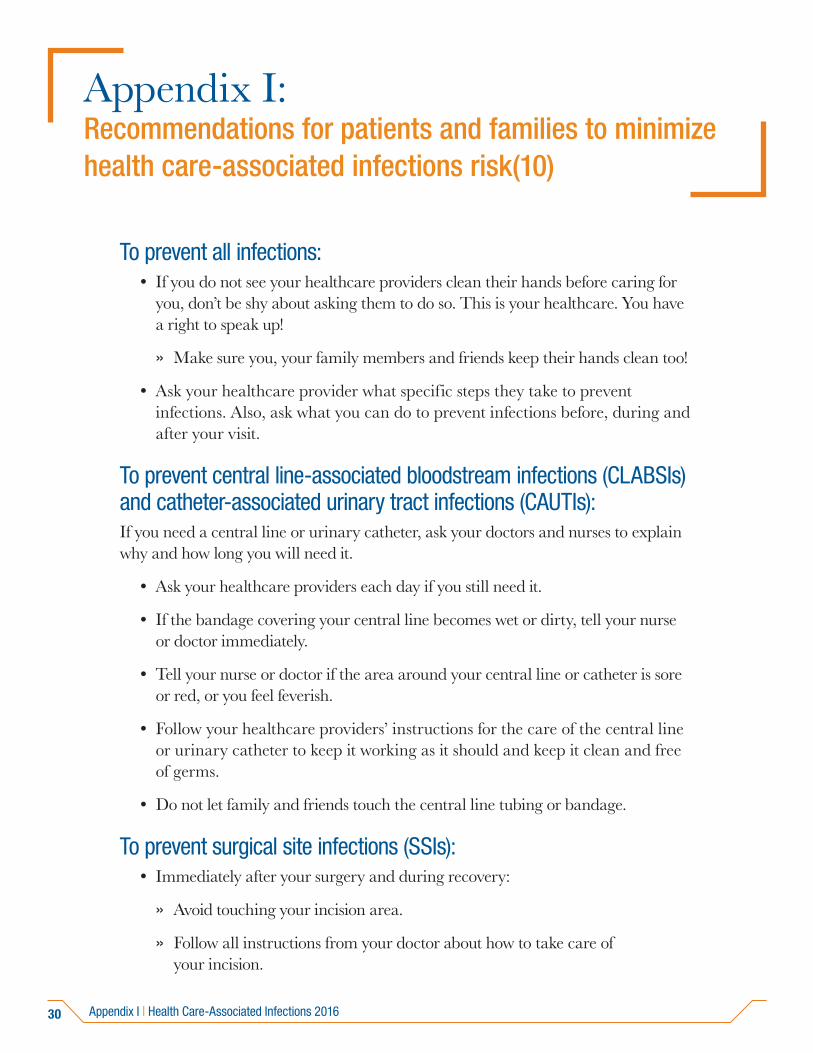
Appendix I: Recommendations for patients and families to minimize health care-associated infections risk(10)
To prevent all infections:• If you do not see your healthcare providers clean their hands before caring for
you, don’t be shy about asking them to do so. This is your healthcare. You havea right to speak up!
» Make sure you, your family members and friends keep their hands clean too!
• Ask your healthcare provider what specific steps they take to preventinfections. Also, ask what you can do to prevent infections before, during andafter your visit.
To prevent central line-associated bloodstream infections (CLABSIs) and catheter-associated urinary tract infections (CAUTIs):If you need a central line or urinary catheter, ask your doctors and nurses to explain why and how long you will need it.
• Ask your healthcare providers each day if you still need it.
• If the bandage covering your central line becomes wet or dirty, tell your nurseor doctor immediately.
• Tell your nurse or doctor if the area around your central line or catheter is soreor red, or you feel feverish.
• Follow your healthcare providers’ instructions for the care of the central lineor urinary catheter to keep it working as it should and keep it clean and freeof germs.
• Do not let family and friends touch the central line tubing or bandage.
To prevent surgical site infections (SSIs):• Immediately after your surgery and during recovery:
» Avoid touching your incision area.
» Follow all instructions from your doctor about how to take care ofyour incision.
Appendix I | Health Care-Associated Infections 2016
31
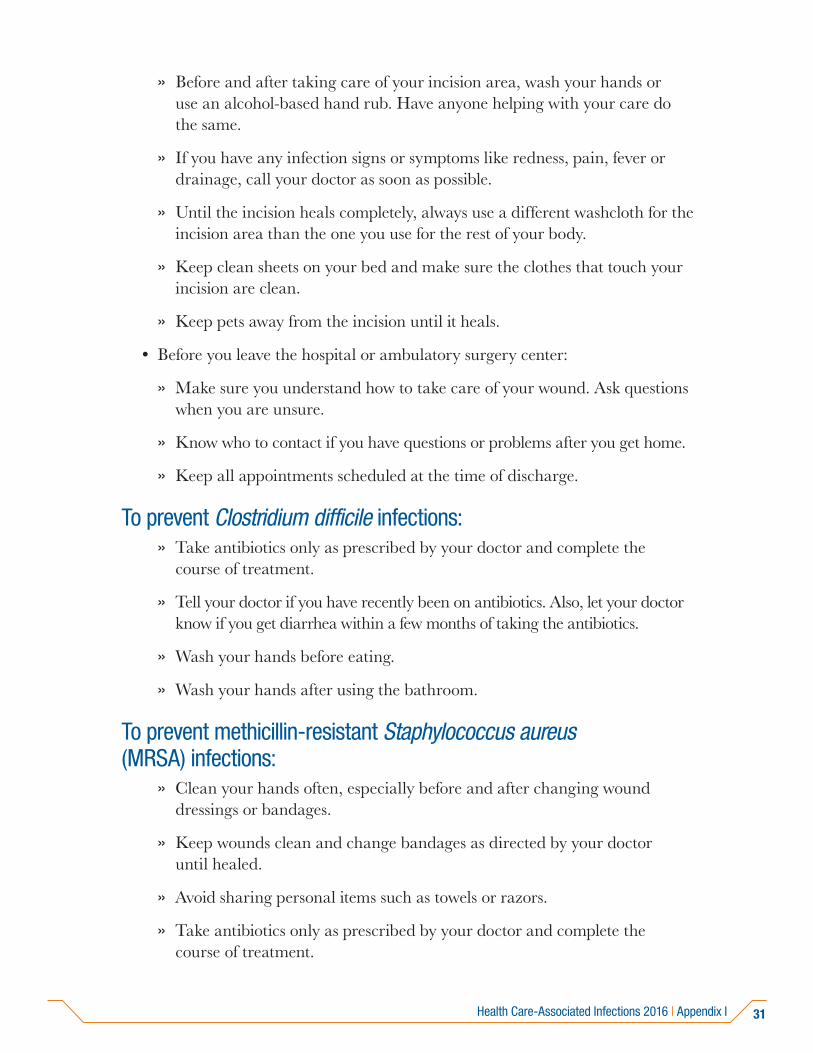
» Before and after taking care of your incision area, wash your hands oruse an alcohol-based hand rub. Have anyone helping with your care dothe same.
» If you have any infection signs or symptoms like redness, pain, fever ordrainage, call your doctor as soon as possible.
» Until the incision heals completely, always use a different washcloth for theincision area than the one you use for the rest of your body.
» Keep clean sheets on your bed and make sure the clothes that touch yourincision are clean.
» Keep pets away from the incision until it heals.
• Before you leave the hospital or ambulatory surgery center:
» Make sure you understand how to take care of your wound. Ask questionswhen you are unsure.
» Know who to contact if you have questions or problems after you get home.
» Keep all appointments scheduled at the time of discharge.
To prevent Clostridium difficile infections:» Take antibiotics only as prescribed by your doctor and complete the
course of treatment.
» Tell your doctor if you have recently been on antibiotics. Also, let your doctorknow if you get diarrhea within a few months of taking the antibiotics.
» Wash your hands before eating.
» Wash your hands after using the bathroom.
To prevent methicillin-resistant Staphylococcus aureus (MRSA) infections:
» Clean your hands often, especially before and after changing wounddressings or bandages.
» Keep wounds clean and change bandages as directed by your doctoruntil healed.
» Avoid sharing personal items such as towels or razors.
» Take antibiotics only as prescribed by your doctor and complete thecourse of treatment.
Health Care-Associated Infections 2016 | Appendix I
OHA 8581 (10/17)
PUBLIC HEALTH DIVISIONPhone: 971-673-1111Fax: 971-673-1100https://public.health.oregon.gov/DiseasesConditions/CommunicableDisease/HAI/Pages/index.aspx
This document can be provided upon request in an alternate format for individuals with disabilities or in a language other than English for people with limited English skills. To request this publication in another format or language, contact the Public Health Division at 503-673-1111 or 711 for TTY.