Embed Size (px)
Citation preview

NBER WORKING PAPER SERIES
HEALTH CARE ADHERENCE AND PERSONALIZED MEDICINE
Mark EganTomas J. Philipson
Working Paper 20330http://www.nber.org/papers/w20330
NATIONAL BUREAU OF ECONOMIC RESEARCH1050 Massachusetts Avenue
Cambridge, MA 02138July 2014
Previously circulated as "Non-Adherence In Health Care: A Positive and Normative Analysis." Weare thankful to seminar participants at Chicago, Indiana, NBER, and Northwestern as well as MichaelDickstein, Dana Goldman, Kris Hult, Alex MacKay, Casey Mulligan, and Derek Neal for discussionsand comments. Tomas Philipson is thankful for financial support from the George Stigler Center forStudy of the Economy and the State, The University of Chicago. The views expressed herein are thoseof the authors and do not necessarily reflect the views of the National Bureau of Economic Research.
NBER working papers are circulated for discussion and comment purposes. They have not been peer-reviewed or been subject to the review by the NBER Board of Directors that accompanies officialNBER publications.
© 2014 by Mark Egan and Tomas J. Philipson. All rights reserved. Short sections of text, not to exceedtwo paragraphs, may be quoted without explicit permission provided that full credit, including © notice,is given to the source.

Health Care Adherence and Personalized MedicineMark Egan and Tomas J. PhilipsonNBER Working Paper No. 20330July 2014,Revised September 2015JEL No. I1,I10,I18
ABSTRACT
Non-adherence in health care results when a patient does not initiate or continue care that a providerhas recommended. Previous research identifies non-adherence as a major source of waste in US healthcare, totaling approximately 2.3% of GDP, and have proposed a plethora of interventions to raise adherence.However, health economics provides little explicit analyses of the important dynamic demand behaviorthat drives non-adherence, and it is often casually attributed to uninformed patients. We argue thatwhereas providers may be more informed about the population-wide effects of treatments, patientsare more informed about the individual specific value of treatment. We interpret a patient’s decisionto adhere to a treatment regime as an optimal stopping problem in which patients learn the value ofa treatment through treatment experience. We derive strong positive and normative implications resultingfrom interpreting non-adherence as an optimal stopping problem. Our positive analysis derives an“adherence survival function,” depicting the share of patients still on treatment as a function of time,and predicts how various observable factors alter adherence. Our normative analysis derives the efficiencyeffects of non-adherence and the conditions under which adherence is too high or low. We considerthe efficiency implications of this analysis for common adherence interventions. We argue that personalizedmedicine is intimately linked to adherence issues. It replaces the learning through treatment experiencewith a diagnostic test, and thereby speeds up the leaning process and cuts over-adherence and raisesunderadherence. We assess the quantitative implications of our analysis by calibrating the degree ofover- and under-adherence for one of the largest US drug categories, cholesterol-reducing drugs. Contraryto frequent normative claims of under-adherence, our estimates suggest the efficiency loss from overadherenceis over 80% larger than from under-adherence, even though only 43% of patients fully adhere.
Mark EganUniversity of ChicagoDepartment of Economics1126 East 59th StreetChicago, IL [email protected]
Tomas J. PhilipsonIrving B. Harris Graduate Schoolof Public Policy StudiesUniversity of Chicago1155 E. 60th StreetChicago, IL 60637and [email protected]
1
Section 1: Introduction
Improving adherence to prescribed medical treatments remains a universally agreed-upon
and widespread challenge in health care. In the United States, estimates show that non-adherence
is wasteful;1 the New England Healthcare Institute (2009) estimates that the annual cost of non-
adherence in the United States is approximately $290 billion, equating to about 13% of total health
care spending, or 2.3% of GDP. Improving medical adherence through both private and public
interventions has been identified as a crucial step toward improving health outcomes and lowering
health care costs.2 Recent technological advancements have targeted medical adherence, for
example, electronic and educational messaging systems (Baum 2013, Comstock 2013, Vollmer et
al. 2011), as well as technology designed to help providers identify non-adherent patients
(Lesselroth et al. 2011). In the United States, The Patient-Centered Outcomes Research Institute
(PCORI), the Agency for Healthcare Research and Quality, and the National Institutes of Health,
among other government bodies, dedicate substantial funding to support research on raising
medication adherence (Pharmaceutical Research and Manufacturers of America 2013). An
enormous literature outside of economics on the prevalence of non-adherence and its consequences
has driven these efforts. Indeed, since 1996, an estimated more than 25,000 peer-reviewed medical
articles have been published on patient adherence or compliance (Chernew 2008). The overall
implicit concern of this vast literature is that adherence is too low and that private or public
interventions are needed to raise adherence. Although many analysts stress inadequate patient
adherence in both economic and medical circles, one should be cautious about bystanders’ claims
of under-consumption.
1 See Bosworth et al. (2011) for further discussion. 2 See Black et al. (1987), Feldman et al. (1998), Flack et al. (1996), Haynes et al. (1996), Hershey et al. (1980), Mallion et al. (1998), and Nelson et al. (1980).

2
Despite the great concerns regarding under-adherence, little explicit economic analysis
examines the dynamic demand behavior resulting in non-adherence that offers predictions about
the conditions under which it is more likely to occur than not. Without an empirical validation of
such a positive theory, making credible normative claims that adherence is too low is difficult.
To this end, this paper provides an explicit analysis of non-adherence and derives its positive and
normative implications.
We interpret non-adherence as an optimal stopping problem for a patient learning about
his individual value of a therapy. Although providers recommending treatments are likely more
informed about the population-wide effects of these treatments, patients experiencing a treatment
are more informed about its individual value to them. This individual value of treatment
incorporates how the patient trades off patient-specific treatment effectiveness, side effects, and
costs of care. In our analysis, a patient’s prior beliefs about a treatment coupled with the patient’s
experience with the treatment drive initiation and subsequent adherence. The patient behavior
mimics the common-sense approach of using a treatment, assessing its value, and discontinuing
if it is not valuable. Non-adherence is thus inherently a dynamic demand behavior that requires
an explanation of why people initiate but then discontinue therapy. Learning about treatment
value provides a natural explanation.
Our positive analysis of non-adherence as an optimal stopping problem offers many
testable implications. As patients learn about the treatment, they will become more informed
over time, implying that good patient–treatment matches last, but bad ones don’t. More
precisely, we derive an “adherence survival function” depicting the share of patients still on
treatment as a function of time, and show how various observable factors affects it. We predict
that non-adherence occurs early in the sense that adherence decisions stabilize with sufficient
3
learning about treatment value. We find that adherence as conventionally measured may
sometimes be insensitive to its price and even increase in price. We also predict that education
has non-trivial effects on adherence because it interacts with patient-level treatment effects; more
educated individuals adhere longer to individually valuable care, but shorter to non-valuable
care.3 Learning about treatment quality may occur in other ways than through experiencing it,
such as from communication with providers or through diagnostic tests in personalized medicine,
and we also analyze how these impact adherence behavior.
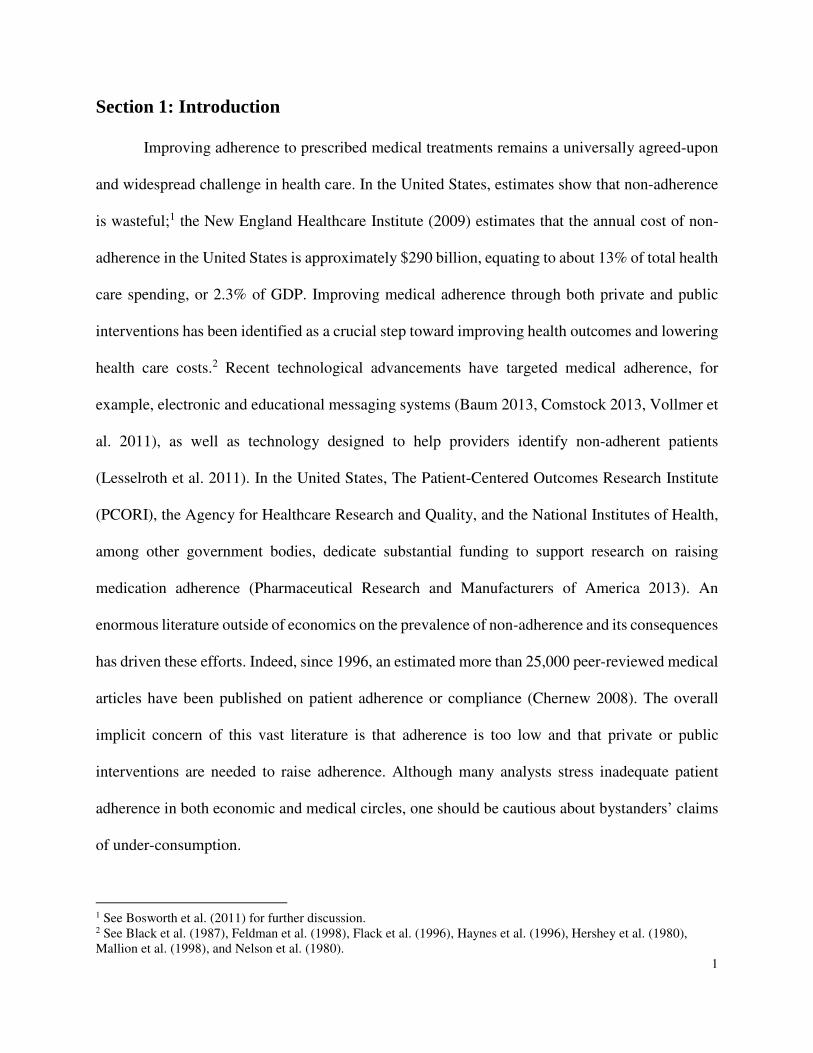
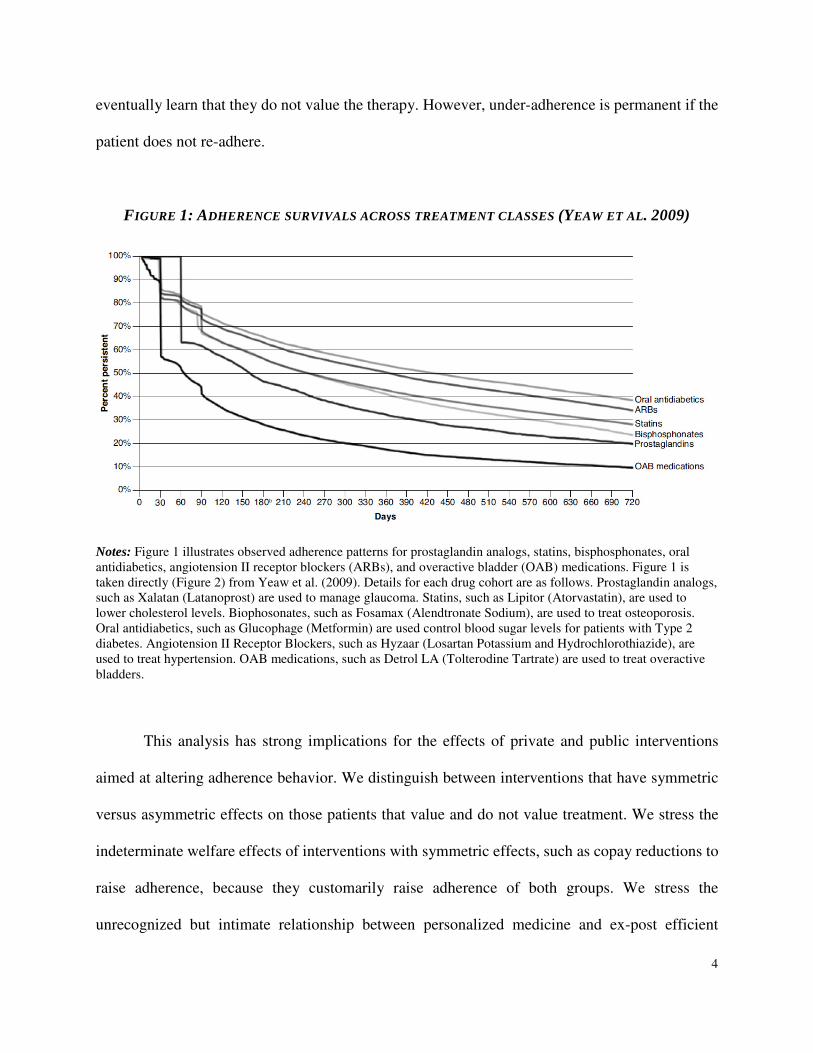
To illustrate, consider Figure 1 below which depicts adherence behavior that the medical
literature reports across several treatment classes. It displays the general pattern that non-
adherence occurs early but then stabilizes, which we interpret as patients learning about
treatment value over time. Lien et al. (2010) find clinical evidence supporting the view that
patient adherence decisions are rational and incorporate a patient’s anticipated benefits from
treatment. Lien et al find that patients whose condition improves under treatment are more likely
to adhere while patient’s whose condition deteriorates under treatment are less likely to adhere.
Non-adherence driven by patient learning produces many surprising normative
implications. In particular, we argue that separating ex-ante from ex-post efficient adherence is
important. When learning about personalized treatment value, patients act in an ex-ante optimal
fashion given their treatment beliefs. However, adherence may be ex-post inefficient in that some
patients adhere to what turns out to be non-valuable treatment for them, whereas others do not
adhere to what turns out to be valuable for them. Therefore, adhering patients who do not value
treatment display ex-post over-adherence, and non-adhering patients who value treatment display
ex-post under-adherence. We argue that such over-adherence vanishes over time as patients
3 For example, uneducated individuals adhered longer to smoking after it was discovered that cigarettes had the “side-effect” of inducing cancer.
4
eventually learn that they do not value the therapy. However, under-adherence is permanent if the
patient does not re-adhere.
FIGURE 1: ADHERENCE SURVIVALS ACROSS TREATMENT CLASSES (YEAW ET AL. 2009)
Notes: Figure 1 illustrates observed adherence patterns for prostaglandin analogs, statins, bisphosphonates, oral antidiabetics, angiotension II receptor blockers (ARBs), and overactive bladder (OAB) medications. Figure 1 is taken directly (Figure 2) from Yeaw et al. (2009). Details for each drug cohort are as follows. Prostaglandin analogs, such as Xalatan (Latanoprost) are used to manage glaucoma. Statins, such as Lipitor (Atorvastatin), are used to lower cholesterol levels. Biophosonates, such as Fosamax (Alendtronate Sodium), are used to treat osteoporosis. Oral antidiabetics, such as Glucophage (Metformin) are used control blood sugar levels for patients with Type 2 diabetes. Angiotension II Receptor Blockers, such as Hyzaar (Losartan Potassium and Hydrochlorothiazide), are used to treat hypertension. OAB medications, such as Detrol LA (Tolterodine Tartrate) are used to treat overactive bladders.
This analysis has strong implications for the effects of private and public interventions
aimed at altering adherence behavior. We distinguish between interventions that have symmetric
versus asymmetric effects on those patients that value and do not value treatment. We stress the
indeterminate welfare effects of interventions with symmetric effects, such as copay reductions to
raise adherence, because they customarily raise adherence of both groups. We stress the
unrecognized but intimate relationship between personalized medicine and ex-post efficient
5
adherence. Testing for treatment value before undertaking therapy involves changing the therapy
from an experience good, for which consumption experience is required to determine its quality,
to a search good, for which it is not. Personalized medicine essentially speeds up the learning
process and is an asymmetric intervention that eliminates inefficient adherence for both those that
value and do not value treatment. The emergence of personalized medicine is therefore explained
by learning being central to adherence. In particular, the value of personalized medicine is higher
when learning through experience is costly relative to learning through a diagnostic, which
explains its emergence in cancer care, where over-adherence may be fatal. The fact that much of
the rationale of personalized medicine seems to be to reduce harmful over-adherence is in direct
contrast to the common belief that adherence is too low.
To assess the quantitative importance of these implications, we calibrate the ex-post
efficiency effects in the case of the cholesterol-reducing drug simvastatin (Zocor). Interestingly,
our calibration results imply the vast majority of the efficiency loss comes from over-adherence,
as opposed to under-adherence, even though less than half of patients adhere. In particular, we find
that the ex-post efficiency loss from over-adherence is over 80% larger than that from under-
adherence. In this context, we stress that the common argument that patients under-adhere because
they do not understand the benefits of treatment seems unsatisfactory, because those perceived
benefits presumably made them start the therapy in the first place.
This paper relates to several strands of previous analysis. A large literature on health care
demand starts with Grossman (1972), but we are not aware of any explicit analysis of the
dynamic demand behavior that is inherent in non-adherence. Elsewhere (Seabury et al. 2014), we
have provided a partial review of the vast empirical health services research literature on the
extent of non-adherence. This paper relates most closely to Philipson and Hedges (1998) and
6
Philipson and Desimone (1997) who analyze attrition in clinical trials when patients learn about
treatments from their own experience in the same way investigators learn about population-wide
effects from aggregate data. Non-adherence driven by learning after the trial is thus analog to
attrition driven by learning in the trial. The paper also relates to later structural estimation papers
such as Crawford and Shum (2005), Chan and Hamilton (2006), Fernandez (2013) and Dickstein
(2014), but these papers are not concerned with the positive or normative analysis of adherence
behavior addressed here. Goldman et al. (2007) and Chernew et al. (2008) report estimates of
negative price elasticities for this type of health care demand. In the general economics literature,
this paper is most closely related in spirit and structure to the labor literature on job turnover
(Jovanovic 1979), where matching workers to jobs is the analog of matching patients to
treatments. Indeed, there appears to be many analogies between optimal matching issues in
economics and personalized medicine.
The paper is briefly outlined as follows. Section 2 sets up the model and derives the
implied adherence survival functions. Section 3 discusses the large set of positive implications
regarding the effects of observable factors on the adherence survival function. Section 4
discusses the normative implications and the role of personalized medicine as an asymmetric
adherence intervention. Section 5 calibrates the amount of over-and under adherence for the
cholesterol-reducing drug simvastatin. Lastly, Section 6 concludes with a discussion of a large
set of future research avenues that the explicit analysis of this type of demand behavior suggests.
Section 2: Non-Adherence as an Optimal Stopping Problem
In this section we derive the positive implications of interpreting non-adherence as an
optimal stopping problem when a patient learns about his own personal treatment value given
7
prior knowledge about population wide effects.4 Following Philipson and Desimone (1997), we
assume the patient decides whether to initiate the treatment regime with limited information
regarding the value of the treatment. By initiating treatment, the patient learns if she values the
treatment and then decides to continue to adhere or stop the treatment depending on whether the
current experience suggests it valuable or not. We are interested in the observable conditions
under which so called primary adherence occurs, the patient initiates the treatment, as well as
when secondary adherence occurs, the patient continues after initiation.
We assume that there is a continuum of patient types or true quality levels or treatment
effects denoted by � and distributed according to �(⋅). These treatment effects correspond to the
patient-specific “quality” of the product the treatment represents. This level of quality represents
all health related outcomes and throughout the paper is interpreted as a net benefit index of
inclusive of treatment effectiveness, side effects, and any other effects on a patient’s health. For
example, the quality may represent quality-adjusted-life-years (QALY) net of side effects.
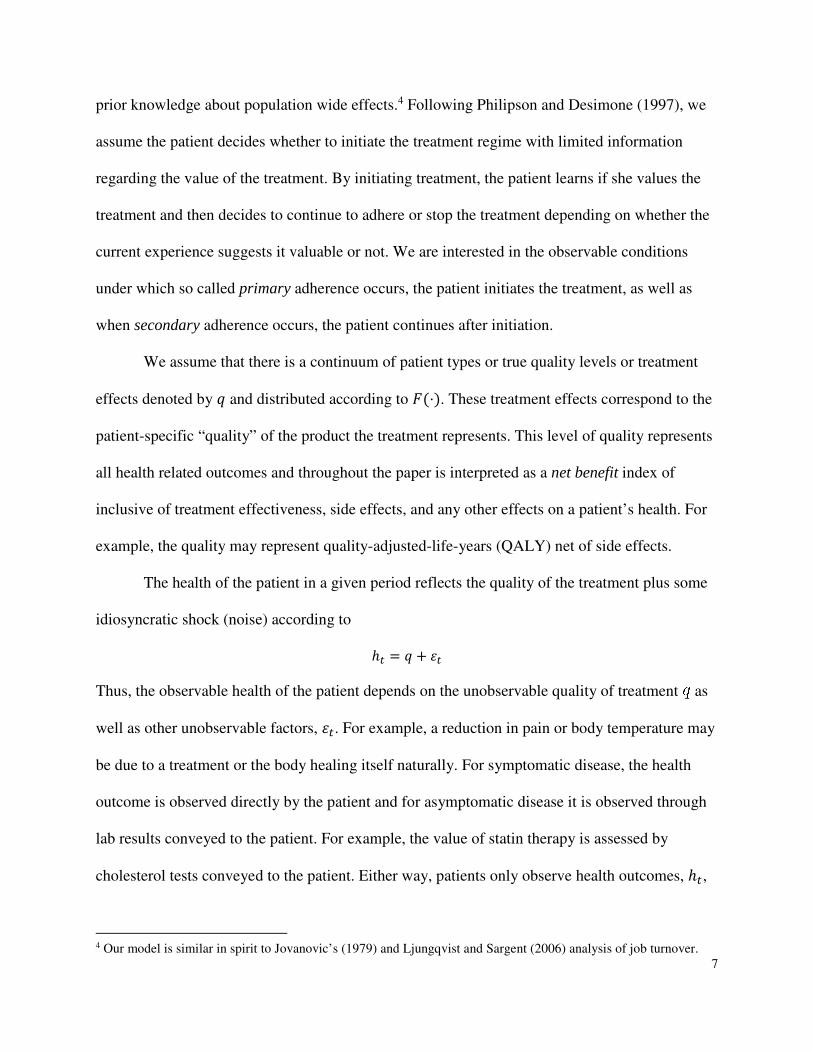
The health of the patient in a given period reflects the quality of the treatment plus some
idiosyncratic shock (noise) according to
ℎ� = � + ��
Thus, the observable health of the patient depends on the unobservable quality of treatment as
well as other unobservable factors, ��. For example, a reduction in pain or body temperature may
be due to a treatment or the body healing itself naturally. For symptomatic disease, the health
outcome is observed directly by the patient and for asymptomatic disease it is observed through
lab results conveyed to the patient. For example, the value of statin therapy is assessed by
cholesterol tests conveyed to the patient. Either way, patients only observe health outcomes, ℎ�, 4 Our model is similar in spirit to Jovanovic’s (1979) and Ljungqvist and Sargent (2006) analysis of job turnover.

8
and do not separately observe � and ��. Thus, the patient cannot infer treatment quality
immediately from their health outcomes but rather learn about the quality of treatment over time.
The period utility from the treatment is given by �(ℎ�, �) where
�(ℎ�, �) = ℎ� − ��
The parameter � represents patient’s health consumption trade-off. Utility is distinct from the
effectiveness or health; effective treatments may have little value and low adherence by a patient
not concerned with the condition being treated. If not on treatment, the patient has access to an
alternative treatment with per period utility (ℎ�, ��) where both ℎ� and �� are known with
certainty.5
Patients have a prior over the quality of the treatment, ��(⋅). We assume that each
patient’s initial prior beliefs reflect the true distribution of treatment heterogeneity such that
��(⋅) = �(⋅). This may be interpreted as patients agreeing with providers, perhaps through
provider communication, about the population wide effects of treatments before learning about
their individual value of care. For example, this prior may be the result of knowing summary
statistics of the distribution of treatment effects from the labeling of the product, obtained from
clinical trials in the approval process. We denote a patient’s prior at time � as ���⋅ �ℎ���� where ℎ��� is the history of personal health outcomes on the treatment. Under the maintained assumption
that treatment quality and noise/shocks are normally distributed, � ∼ �(�, ��) and �� ∼�(0, ���), standard normality results imply that a patient’s posterior distribution over their
treatment effect is given by
����, ℎ���� = � !�ℎ"� + (1 − !�)��, $ �%&' + (
%)'*+(, , !� = %)'-&'. /%)' (1)
5 In the Appendix, we derive the analog implications for the case of multiple treatments which we interpret to include partial adherence levels of a single treatment.

9
where the patient’s initial priors are ��(⋅) = �(��, ���). The patient optimally updates his beliefs about the quality of the treatment based on
weighting the average health outcomes, ℎ"�, and his initial prior. With each observation the
patient places more weight on his treatment experience and less on his prior. In addition, his
posterior variance decreases after each treatment experience over time. In other words, the longer
a patient has been in treatment, the more he learns about the quality of the treatment and the
more his belief is informed by his own experience rather than any beliefs prior to initiating the
treatment, such as the population-wide beliefs offered by the provider.
Given these beliefs about the personal treatment effect, the patient’s value function after
rounds of treatments is given by
1�ℎ�, ℎ���, ��� = �(ℎ�, �) + 3max 7891�ℎ�/(, ℎ���/(, ������:, �(ℎ�, ��)1 − 3 ; The patient elects to adhere to treatment if and only if the expected value of staying on the
treatment is larger than going on the alternative treatment from there on. The future is discounted
according the parameter 3 which may induce differential adherence across treatments with
differences in timing of benefits and costs. For example, a patient may adhere perfectly to a pain
medicine while adhering poorly to a cholesterol reducing drug given the immediate benefit of the
former and delayed benefit of the latter.
Once a patient elects to forgo treatment for the alternative treatment, he will find it
optimal to continue the standard care in all proceeding periods.6 Patients will never find it
6 Suppose patients potentially found it optimal to reenter treatment. Consider the patients decision to continue treatment after receiving rounds of treatment max<891�ℎ=/(, ℎ��=/(, �����=:, 1(ℎ�, ℎ��=, ��> If a patient opts for the alternative treatment he does not learn any additional information about the treatment regime. Thus if a patient opts for the alternative treatment he will do so in all proceeding periods. This was originally shown in Bradt, Johnson and Karlin (1956).

10
optimal to “re-adhere” to the treatment regime. 7 Because of the future option value of continuing
treatment, a patient may elect adhere to treatment even if the expected future period return is
lower than that of the alternative treatment.
It is well established that the optimal stopping behavior for this type of learning is
characterized by a treatment performance threshold (Gittins and Jones 1974, Gittins and Jones
1979).8 This implies that non-adherence occurs when the average experience on treatment ℎ"�is
below a certain threshold level, here denoted ?�. In other words, a patient remains in treatment as
long as their average treatment experience, ℎ"�, is greater than the threshold ?�. The optimal
stopping rule or threshold, ?�, is a function of the patient’s prior mean and variance, discount rate
3, as well as the distribution of the treatment/signal noise.
Adherence behavior conditional on patient type (�) is characterized by survival function
@(�|�) which reflects the proportion of type � individuals remaining in treatment at time �. @(�|�) = Pr(ℎ( > ?(, ℎ"� > ?�, … , ℎ"� > ?�|�)
The overall survival function of adherence thus results from aggregating over all types
@(�) = ∫ @(�|�)G�(�)
For such a survival function, the degree of primary non-adherence or non-initiation corresponds
to the magnitude 1 − @(1) while secondary non-adherence or discontinuation usually seems to
refer to adherence conditional on initiation or @(�)/@(1). For example the adherence behavior
depicted in Figure 1 in the Introduction concerns this type of secondary adherence.9
7In the case of multiple treatment options or the case when the value of the alternative treatment is not known with certainty, as discussed in the Appendix A1, the patient may find it optimal to re-adhere to the initial treatment regime. 8 See also Gittins et. al (2011) and Powell and Ryzhov (2012) for a general discussion of characterizing stopping problems. 9 Sometimes the quantity S(t)/S(1) is referred to as persistence in the empirical and medical adherence literature, referring to the fraction of patients that refill prescriptions, differentiating it from secondary adherence, referring to fraction of days during the treatment period the prescription was followed.
11
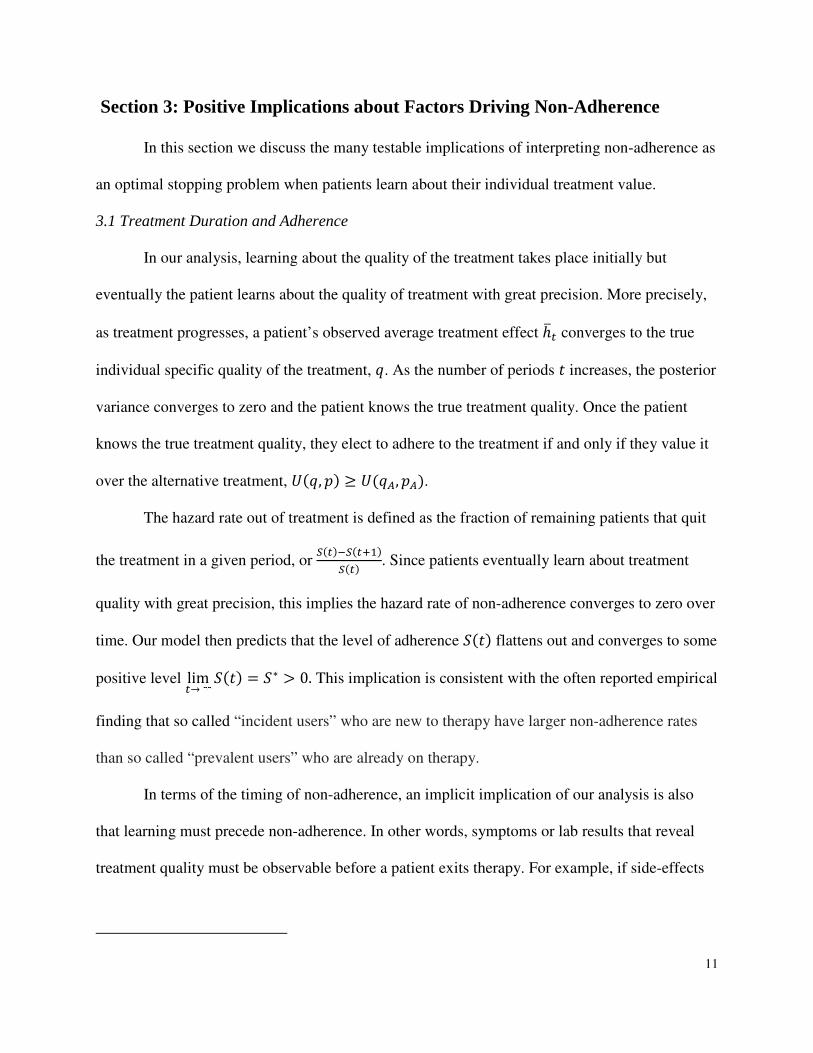
Section 3: Positive Implications about Factors Driving Non-Adherence
In this section we discuss the many testable implications of interpreting non-adherence as
an optimal stopping problem when patients learn about their individual treatment value.
3.1 Treatment Duration and Adherence
In our analysis, learning about the quality of the treatment takes place initially but
eventually the patient learns about the quality of treatment with great precision. More precisely,
as treatment progresses, a patient’s observed average treatment effect ℎ"� converges to the true
individual specific quality of the treatment, �. As the number of periods � increases, the posterior
variance converges to zero and the patient knows the true treatment quality. Once the patient
knows the true treatment quality, they elect to adhere to the treatment if and only if they value it
over the alternative treatment, �(�, �) ≥ �(��, ��). The hazard rate out of treatment is defined as the fraction of remaining patients that quit
the treatment in a given period, or J(�)+J(�/()
J(�) . Since patients eventually learn about treatment
quality with great precision, this implies the hazard rate of non-adherence converges to zero over
time. Our model then predicts that the level of adherence @(�) flattens out and converges to some
positive level lim�→∞ @(�) = @∗ > 0. This implication is consistent with the often reported empirical
finding that so called “incident users” who are new to therapy have larger non-adherence rates
than so called “prevalent users” who are already on therapy.
In terms of the timing of non-adherence, an implicit implication of our analysis is also
that learning must precede non-adherence. In other words, symptoms or lab results that reveal
treatment quality must be observable before a patient exits therapy. For example, if side-effects

12
take say three months to manifest themselves for a treatment treating an asymptomatic disease,
then a large amount of non-adherence in the first couple of months would invalidate our analysis.
The timing of non-adherence should match when patients learn about the quality of treatment.
3.2 The Effect of Prices and Income on Adherence
There are two primary costs of treatment: the monetary cost of treatment � and the
opportunity cost of treatment incurred by forgoing an alternative treatment. The cost of treatment
may rise either due to higher co-pays, premiums, the time-cost of adherence, or other forms of
time or monetary costs that contribute to the total cost of care. Such a price increase naturally
lowers the value of treatment and lowers the adherence survival function by raising the optimal
stopping threshold; OP.OQ > 0. For primary adherence, it’s governed by whether the value function
at initiation is larger than the permanent adoption of the alternative treatment: 1 >�(��, ��)/(1 − 3). Since the left-hand side falls in the price � and the right hand side does not,
primary adherence falls in price. This simply says that demand is downward sloping in its own
price. 10
However, secondary adherence may not be down-ward sloping in its own price. As
usually defined as the adherence conditional on initiation,@(�)/@(1), it may potentially rise as
opposed to fall with price dependent on whether the denominator falls more than the numerator.
This will depend on the type of patient heterogeneity present. For example, consider when
differential prior beliefs in the treatment value determine the level of primary adherence. An
increase in price lowers primary adherence but those still initiating believe more in the treatment
10 In the health policy literature, a common argument is since price (premium or copay) are a barrier to adherence, it should be cut when adherence is price-sensitive. However, we here note that this pricing policy is the exact opposite to optimal insurance design under moral hazard that implies larger copays for price-elastic demand. Standard arguments about moral hazard imply that there is excessive adherence without copays. In short, moral hazard implies there is over-adherence rather than under-adherence.

13
than those that initiated before the price increase. This would imply a potentially offsetting
positive selection effect on secondary adherence counteracting the direct negative price effect on
initiation11. For example, if the treatment lost patent expiration and went generic, the resulting
lower prices would imply larger primary adherence but potentially lower secondary adherence.
The other cost of treatment is the opportunity cost in terms of alternative care that
represents the outside option in our stopping problem. It is straightforward to show that the better
the outside options, the lower the adherence. This implies that the price of the alternative
treatment raises adherence while the quality of alternative treatment lowers adherence; RP.RQS <
0, RP.RUS > 0. Analog arguments imply that primary adherence falls in the value of alternative care,
whether through it having a higher quality or lower price, but that secondary adherence may rise
or fall with the value of alternative care.
To consider the effect of income on adherence in this setting, we assume that health is
normal good that is valued more highly by wealthier patients. In this case, a wealthier patient
may be represented as having a lower price in terms of the utility loss from foregone
consumption represented by a lower parameter value for �. It is straightforward to show that
adherence is decreasing in �, RP.RV > 0. 3.3 Treatment Quality and Adherence
A basic implication of our analysis is that better performance leads to higher adherence
both on the individual level as well as on an aggregate level relating to overall product quality.
11The selection generating these non-standard price-effects on secondary adherence are similar to the empirical findings of Cardon and Showalter (2015) who find that advertising lowers adherence.

14
On an individual level, our analysis implies that a patient’s treatment experience drives
adherence behavior. In our framework, if a patient experiences treatment outcomes ℎ�� that are
uniformly larger than another set of treatment outcomes ℎ��′, then he will adhere longer with the
first experience. In our particular learning environment based on normality assumptions, the first
set of experiences would imply a larger average health outcome throughout, which in turn would
imply a higher posterior mean, thus resulting in higher adherence.
On an aggregate level, differences across treatments in terms of their overall quality are
represented by differences in the mean quality of the treatment �.12 These population-wide
effects of treatments are often estimated in clinical trials conducted to gain approval for
marketing. At any given time, the performance threshold driving optimal stopping is decreasing
in the average quality of the treatment, RP.RX ≤ 0.13 In fact, an increase in the average quality of the
treatment raises adherence through two channels. It lowers the performance threshold as well as
increases the fraction of patients that perform above any given threshold
3.4 Treatment Heterogeneity and Noise
A patient’s health outcome in a given period is a function of treatment heterogeneity (� ∼�(�, ��)) and the ability to infer treatment quality from health or so called noise (�� ∼�(0, ���)). Treatment heterogeneity, captured by the true and prior variance ��, and the
treatment noise, captured by ���, impact learning and thus adherence. Both have offsetting effects
on overall adherence and thus their impact on adherence is indeterminate.
12 Aggregate effectiveness should be distinguished from so called “cost-effectiveness” of care which is more loosely related to larger adherence. Cost-effectiveness is not perfectly related to adherence because patients may trade off cost versus effectiveness differently than one to one, that is, the utility �(ℎ, �) may differ from a ratio. Other reasons include unmeasured quality dimensions that affect patient utility and adherence, or prices that do not correspond to the full cost of care faced by the patient. 13See section 6.4 in Gittins (1989) and Corollary 1 in Yao (2006) for further details.

15
3.4.1 Heterogeneity in Treatment Quality and the Option Value of Care
Heterogeneity in treatment value ( ), including effectiveness and side effects, has
opposing effects on adherence. On the one hand, the patient’s outside option to adopt the
alternative treatment allows patients to partake in the upside of treatment value without the
downside making the payoff of treatment resemble an equity call option. The option value of
treatment rises in heterogeneity because non-adherence limits the downside. Other things
constant, an increase in treatment heterogeneity lowers the patients stopping threshold, RP.R%'<0.14
On the other hand, treatment heterogeneity not only impacts the threshold but it also impacts
the distribution of treatment experiences observed by the patients. In particular treatment
heterogeneity raises the number of patients experiencing bad outcomes. 15 As a consequence,
heterogeneity has offsetting effects on adherence and produces an indeterminate effect on
adherence.
3.4.2 Noise in the Learning about Treatment Quality from Health
Treatment noise also has offsetting effects on adherence. On the one hand, a greater
variance of treatment noise makes it harder for patients to discern between the true treatment
effect and the treatment noise. In other words, treatment noise ultimately slows the learning
process of patients. Other things constant, an increase in the variance of the treatment noise
lowers the value of continuing treatment and increases the stopping threshold such that RP.R%&' >
0.16 On the other hand, treatment noise interacts with treatment quality in driving adherence. To
14 See Theorem 1 in Yao (2006) for details on the proof. 15 Consider the trivial example where treatment is known to be valuable for all individuals; �(�, �) > �(ℎ�, ��), �� = 0 and ��� > 0. If ��Z > 0, the ex-ante value of treatment rises but it would no longer be the case that all
individuals find it valuable to stay in treatment. There exists ℎ′ such that �(ℎZ, �) < �(ℎ�, ��) since ℎ ∼ ���, ��Z�. Heterogeneity raises the value of treatment but produces an ambiguous effect on adherence. 16See Lemma 1 in Yao (2006) for details on the proof.

16
illustrate, consider the extreme case without noise (���=0). In the setting without noise, the
fraction of those who benefit (�(�, �) > �(��, ��)) adhere while the rest leave. At the opposite
extreme, nothing is learned about treatment from adhering (��� is very large). In this case, if the
average value is positive then everyone adheres, otherwise no-one adheres. These extreme cases
illustrate how the impact of treatment noise on adherence interacts with the true value of the
treatment. The end result is that, the effect of noise on adherence is indeterminate.
3.5: Education and Adherence
Learning about treatment quality may occur in other ways than through experiencing it,
such as from education or communication with providers. In particular, we examine how
education affects a patient’s ability to assess treatment quality in the particular Bayesian learning
framework assumed here.
We discuss the implications of education where education results in patients holding
more accurate beliefs about the effectiveness of treatment. First, traditional education, as
measured a years of regular schooling, may enable more accurate beliefs. Second, even an
uneducated individual may have accurate beliefs due to “health-literacy” in his condition. Third,
provider education or communication may raise the accuracy of patient beliefs.17 However, a
provider may educate his knowledge in the population-wide effects of the treatment, here �(⋅), but the patient has the ultimate expertise in the individual value of the treatment after
experiencing it, here �. In particular, providers do not have expertise in how the patient trades off
17 There are of course other factors that may drive provider effects on adherence. One is through reimbursements incentives, e.g. fee-for-service medicine may discourage adherence when it means less future care. Another way is that high quality providers may have a direct effect on adherence without communication. If a doctor from a well-known medical institution prescribes a treatment, the patient may believe in the treatment more than if a resident or nurse from a community hospital prescribed it.

17
side-effects, efficacy, or the full time costs of compliance.18 It is perhaps not surprising that
providers often claim there is under-adherence since they do not face the cost of adherence.
Consider when education results in patients having beliefs closer to the true distribution
of treatment effects. In particular, consider when the true mean is �, educated individuals hold
prior mean �[\and uneducated individuals hold prior �]\ such that �]\ > �[\ = �. This says
that uneducated individuals are overly optimistic about the treatment. From our previous
discussion of the impact of priors on adherence, it follows that adherence falls with education in
this case. However, if uneducated patients are overly pessimistic about treatment ( �]\ < �[\ =�), education raises adherence. In other words, if education corresponds to having beliefs closer
to the truth, education may either be positively or negatively related to adherence.
In addition, regardless of why patients may have more accurate prior beliefs about a
treatment, various forms of education will not have a marginal effect on adherence in the long
run. This is because ultimately the patient will learn whether the treatment works for him or not
which will drive adherence. A patient’s posterior beliefs are determined more and more by
treatment performance over time (the weight ^ goes to unity) regardless of the patient’s prior
beliefs.
3.6 Provider Communication and Adherence
Providers, such as nurses and doctors, play a critical role not only in the diagnosis and
prescription process but also in the patient’s adherence decision. The model is easily extended to
incorporate the role of providers by considering how providers impact a patient’s prior beliefs
about treatment as well as how patients update those beliefs based on treatment experience.
18 In particular, doctors may incorrectly argue that patients under-adhere because doctors are often only focused on health outcomes as opposed to the patients that must weigh all aspects of care and pay the price.

18
A patient’s prior beliefs may be partially or totally determined by his medical provider. In
the context of the model, providers may provide patients with a noisy signal about the personal
effectiveness of treatment _, _ ∼ �(�, �`). The patient then incorporates this information into his
beliefs such that his beliefs prior to treatment are now
��(�; _) = �(��̀, ��̀ ) = � b!_ + (1 − !)��, c 1��̀ + 1���d
+(e ,! = �����̀ + ���
The patient then updates his beliefs based on treatment experience given his new prior beliefs
(��̀, ��̀ ). Better providers may be characterized by providing less noisy signals about the
effectiveness of treatment (i.e. smaller �`) such that patients of better doctors have more precise
beliefs about the effects of the treatment. However, as discussed, more precise priors may
increase or decrease adherence. Thus more knowledgeable providers do not necessarily lead to
improved adherence. If there are agency issues, providers may provide biased information to
steer patients towards more highly reimbursed treatments. Consider when the provider provides
more positive information about a more highly reimbursed treatment. Hence, rather than
providing a signal _ ∼ �(�, �`), doctors may provide patients with a biased signal _f ∼ �(� +g, �`), g > 0. If patients are aware of the bias, then this will not impact their adherence decision.
If patients are unaware of the bias then the bias results in overly optimistic patients and an
increase in short-run adherence. However, in the long run the effect of the doctor’s bias on
patient beliefs disappears. As illustrated by eq. (1), the patient’s treatment experience dominates
the patient’s biased prior beliefs. In other words, our model suggests that the agency problem
between patients and doctors is muted in the long run when patients can learn treatment quality
over time.

19
3.7: Comorbidities and Adherence
A patient undergoing a given treatment may be undertaking other treatments due to
multiple diagnoses or comorbidities. There are three ways in which comorbidities may affect
adherence in our analysis. First, the effectiveness of a treatment may depend critically on the
patient’s comorbidities and the associated treatments. For example, the effectiveness of one drug
may be partially subdued or enhanced when taken in conjunction with another drug.
Secondly, comorbidities may make it harder for patients to infer treatment value from
health outcomes. This is because when the patient is on several treatments due to comorbidities,
the patient does not know whether it is the treatment itself, the comorbidities, or the treatment for
comorbidities that may be causing a given health outcome. In other words, comorbidities raise
the variance of the treatment noise ���. As discussed, a rise in the variance of the treatment noise
produces an indeterminate effect on adherence.
Lastly, comorbidities may affect adherence by making it marginally more taxing on a
patient, both financially and mentally, to undertake multiple treatments for multiple morbidities.
For example, it may be more taxing to remember when to take eight medicines rather than one.
This would be reflected by a higher total price � (including time costs) in our analysis and
clearly lowers adherence.
The overall effect of comorbidities on adherence will be determined by the relationship
of these three effects.

20
Section 4: Normative Implications for Efficient Adherence
In this section we discuss the efficiency implications of non-adherence.19 Inefficient
adherence transpires as the direct result of heterogeneous and unknown personalized treatment
effects. The process in which individuals learn about their own value of the treatment creates the
potential for both under and over-adherence.
4.1 Ex-ante vs Ex-post Efficient Adherence
Ex-ante efficient behavior occurs if an individual cannot be made better off given their
individual information at a given point in time. By definition, our stopping behavior is ex-ante
efficient unless there are external effects across patients that are not internalized (we discuss such
issues in the conclusion). Ex-post efficient adherence behavior occurs when only those who
actuality truly value the treatment adhere to it. Let �∗ be threshold level of health or treatment
quality at which the patient is indifferent between the treatment and the alternative treatment
�(�∗, �) = �(ℎ�, ��) We will refer to individuals who value treatment, such that � > �∗, as “valuers” and the
remaining group as “non-valuers”. Naturally, the reservation level of health �∗ is increasing in
the price of the treatment and the quality of the alternative treatment but decreasing in the price
of the alternative treatment; RU∗RQ > 0,
RU∗RhS>0, and
RU∗RQS < 0.
It is ex-post efficient for valuers to be on the treatment but ex-post inefficient for non-
valuers to be on the treatment. Therefore, there are two types of ex-post inefficiencies. The first
19 Both medical and economic discussions of adherence often state that patients do not adhere enough, although there is no explicit criteria discussed defining whom and why a patient should adhere. In some sense, our theory suggests an explanation of this normative claim by third party bystanders about the under-consumption of patients; the selection effect inherent in learning means that those that adhere do better than those who do not adhere. With the inherent upward bias in adherence effects under optimal learning, it maybe ill-advised to argue everyone should adhere.

21
inefficiency is under-adherence. Even though treatment is valuable for a fraction 1 − �(�∗) of
patients, some of those patients will stop treatment because of incorrect inferences about
treatment value. The second type of inefficiency is over-adherence. Treatment is not valuable for
the fraction �(�∗) of non-valuers even though they may initially adhere to the treatment before
learning that it is not valuable for them.
Figure 2 illustrates the general pattern of ex-post inefficient adherence. The survival
curve @i(�) reflects the proportion of valuers that adhere for each period. Under-adherence by
valuers is reflected by the fact that the survival curve @i(�) is not equal to one. The shaded area
above represents @i(�) thus reflects the proportion of valuers that inefficiently under-adhere to
treatment. Inefficient under-adherence occurs because some of the patients experiencing poor
initial performance on the treatment leave even though it is in fact valuable.
The survival curve @j(⋅) reflects the proportion of non-valuers that adhere at each period.
Treatment is not valuable for non-valuers, thus @j(⋅) represents inefficient adherence. The
shaded area underneath the curve @j(⋅) thus represents the fraction of non-valuers that
inefficiently adhere to treatment. Such inefficient over-adherence is reflected by a strictly
positive survival curve for this group. Inefficient adherence occurs because of either the option
value of treatment and/or because the patient experienced good initial performance on the
treatment. However, sooner or later all of the non-valuers will learn that the treatment is
invaluable such that no non-valuers adhere; lim�→k @j(�) = 0.

22
FIGURE 2: ADHERENCE BEHAVIOR BY VALUERS AND NON-VALUERS
Notes: The non-valuers survival function, @j(�)represents adherence for those for whom treatment is not valuable. The valuers survival function, @i(�)represents adherence for those for whom treatment is valuable.
Because true treatment quality raises adherence, as discussed previously, adherence by
non-valuers will always be lower than that by valuers, @j(�) < @i(�)∀�, as depicted in Figure
2. The overall solid survival curve is the mixture of the two conditional survival functions with
the mixture weights given by the fraction of true valuers and non-valuers:
@(�) = �(�∗)@j(�) + �1 − �(�∗)�@i(�) It follows that in the short-run there will be both under-adherence for valuers and over-adherence
for non-valuers. However, in the long run there will always be under-adherence because there are
valuers who drop out and will never find it optimal to re-adhere. The dotted line in Figure 2
reflects the optimal adherence level which is simply the fraction of the population that responds
to treatment, 1 − �(�∗), assumed half in the Figure. In the long run, the overall adherence
survival function @(⋅) goes below the optimal level of adherence because non-valuers all

23
disappear and valuers who leave never return. It asymptotes to a stable level since learning
makes the non-adherence hazard goes to zero. The survival function @j(⋅) of non-valuers goes to
zero as non-valuers learn that the treatment is not worthwhile for them.
This previous discussion concerned the inefficiency in quantities, that is, who is on the
treatment or not compared to who should be. The monetary value lost from under- and over-
adherence results from how much the foregone therapy is valued. Let the reservation price for
the treatment beyond the going price for an individual of type � be denoted m(�) and defined by
���, � + m(�)� = �(��, ��) Thus the sign of m(�) reflects whether the treatment is truly valued or not relative to the
alternative treatment. It follows directly that higher performing treatments have a higher
reservation price, mZ(�) > 0, and that the reservation price is positive for valuers and negative
for non-valuers. The dollar value of the welfare loss at time can then be written as the total loss
of the two groups
nopqrmost__r�� = sj(�) + si(�) = u −m(�)@(�|�)G�(�) + u m(�)[1 − @(�|�)]G�(�)kU∗
U∗
+k
The first term sj(�)is the loss in welfare at time � from non-valuers over-adhering; those who do
not value the treatment but still adhere to it. The second term si(�) is the loss in welfare at time
� from valuers under-adhering; those who value the treatment but stopped adhering.
Given the welfare loss at each period, the present value of the total welfare loss over time
is the discounted value of the loss from both groups
s = u 3�[sj(�) + si(�)]G�k�
The important aspect of this overall welfare loss is that over-adherence is front-loaded while
under-adherence is back-loaded as displayed in Figure 2 above. This results from the fact that

24
non-adherence occurs early during learning and vanishes in the long run. Therefore, in present
value terms over-adherence often matters more than under-adherence. This is part of the reason
we find that efficiency losses from over-adherence dominate under-adherence in our later
calibration results for cholesterol lowering drugs. More generally, the importance of front-loaded
over-adherence for overall efficiency is in contrast to common arguments of the importance of
raising adherence.
4.2 Welfare Effects of Adherence Interventions
We separate adherence interventions into those that have symmetric- versus asymmetric
effects on valuers and non-valuers.
4.2.1 Adherence Interventions that do not affect Learning
Adherence interventions often target treatment costs or other treatment parameters rather
than target the patent learning process. However, by doing so the adherence intervention affects
true valuers and non-valuers symmetrically by raising adherence for both groups. As a canonical
illustration of such symmetric interventions that do not affect learning, consider price-based
interventions that lower the time- or dollar expense of treatment. However, lowering price raises
adherence for both valuers and non-valuers which implies that over-adherence is increased while
under-adherence decreased; RxyRQ > 0 and
RxzRQ < 0. This implies counteracting effects on the
overall welfare loss given by
GsG� = u 3� c{sj(�){� + {si(�){� d G�k�
Therefore, any intervention that affects adherence behavior by the two groups symmetrically will
have indeterminate effects on ex-post efficiency. On the other hand, this will likely be the norm

25
as it is extremely difficult to make adherence interventions operate differently across valuers and
non-valuers.
The long-run effects of interventions not based on learning that raise adherence are easier
to sign. In the long run, we discussed over-adherence must go to zero when those truly not
responding eventually learn that they should not adhere. Therefore, in the limit the welfare loss
must fall from an intervention that raises adherence
lim�→k{sj(�){� = 0 ⟹ lim�→k
Gs(�)G� < 0
4.2.1 Adherence Interventions that affects learning
An optimal intervention would have an asymmetric effect on adherence, raising
adherence among valuers while decreasing adherence among non-valuers. One such asymmetric
adherence intervention is personalized medicine. Personalized medicine, by use of so called
companion diagnostics, aims to provide patients with better information about treatment value
before undertaking treatment. The companion diagnostic is taken before treatment and is aimed
at better diagnosing the value of the treatment given the disease, as opposed to the disease itself.
In other words, the companion diagnostic essentially “speeds up” the patient learning process.
The emergence of personalized medicine is therefore explained by learning being central to
adherence. In particular, personalized medicine replaces learning about the treatment value from
health experience with learning about the treatment value from a diagnostic test. It thereby
changes the therapy from being a so called experience good, for which consumption is necessary
to determine its quality, to a search good, for which it consumption is not necessary to determine
its quality.

26
Consider the scenario where a companion diagnostic prior to treatment provides a
potentially noisy signal G = � + } of the personalized value of the treatment (similar to the
provider case discussed in 3.6). However, learning from the diagnostic may be imperfect just as
learning from health experience may be, through a noisy test distributed according to } ∼�(0, �~�). It is straightforward to show the analog threshold property in optimal stopping with
diagnostics as before; patients will test into treatment with such a diagnostic if it is above a
threshold, G > � and test out of the treatment if they are below it, ≤ � .
The sign of the normative welfare effect of having access to a companion diagnostic is
clear. A companion diagnostic always raises ex-ante welfare as the patient can always choose not
to use it, and be as well off as without the diagnostic.20 The magnitude of this positive welfare
gain depends on the quality of the diagnostic and is highest with a fully accurate diagnostic.
Consider a fully accurate companion diagnostic represented by �~ = 0 and thus the diagnostic
reveals the quality fully; G = �. In this case the diagnostic is fully informative and true valuers
always adhere to treatment and non-valuers never initiate treatment. Thus, the threshold level of
the diagnostic is the reservation level of quality defining whether a treatment is valuable, � = �∗. True valuers test into treatment and non-valuers test out of it thereby producing an asymmetric
effect on adherence of the two groups. It raises adherence by valuers and lowers it for non-
valuers. The positive welfare effect is maximized by an accurate diagnostic in the sense that
personalized medicine eliminates all ex-post inefficient adherence.
�~ = 0 ⇒@i(�) = 1&@j(�) = 0∀� ⇒ s = 0
20 It is often argued that the contraction of treatment demand that follows from personalized medicine when patients test out of treatment will result in lower profits. However, the new combined product with a companion diagnostic always raises patient welfare so should be able to be sold at higher prices than the treatment alone.

27
This implies that an upper bound on the value of personalized medicine is given by the ex-post
efficiency loss s discussed and this bound is obtained for a fully accurate test.21 An implication
of this value of personalized medicine is that for classes where learning about treatment quality
through experience is very costly relative to learning through a companion diagnostic, we would
expect personalized medicine to emerge. This is one explanation of why companion diagnostics
have emerged primarily in oncology where learning through treatment experience may induce
premature mortality. One of the primary benefits of personalized medicine is that it reduces over-
adherence in the treatment classes where learning through experience is costly relative to testing;
this is in stark contrast to the common belief that there is too little adherence overall.
Although these normative implications of personalized medicine are clear, the positive
implications of how personalized medicine affects adherence behavior are less clear. If we
consider the case of a perfect test, it follows directly that secondary adherence rises with
personalized medicine as everyone testing into therapy know they value it. However, primary
adherence may rise or fall with personalized medicine. This is because some patients that
initially did not adhere may test into therapy, thereby expanding the market for the treatment22.
On the other hand, some patients who adhered may test out of therapy, thereby contracting the
market for the treatment. Thus the overall effect on primary adherence is indeterminate and
depends on the relative sizes of the two groups.23
For imperfect companion diagnostics, it is straightforward to show that both primary and
secondary adherence may rise or fall with personalized medicine. As opposed to the case with a
21 We have elsewhere discussed other value aspects of personalized medicine using evidence from COX-2 inhibitors, see Sood et al. (2013). 22 This is the case for so called “rescue diagnostics” that are developed to test patients out of any side-effects preventing a drug from getting FDA approval. 23 This is assuming the indicated population remains the same. Alternatively one could redefine the adherence and the indicated population based on the diagnostic test.

28
fully accurate diagnostic, secondary adherence does not always rise with personalized medicine
for reasons similar to the non-standard price effects on secondary adherence. With an imperfect
test just as with price effects, both the denominator and the numerator of the ratio of secondary
adherence @(�)/@(1) are affected by the personalized medicine.
Section 5: Calibrating Adherence Inefficiencies: The Case of Simvastatin
(Zocor)
In this section we calibrate our model of non-adherence to assess the welfare losses
induced by ex-post inefficient adherence. We show how this is feasible given readily available
data. We consider adherence associated with cholesterol lowering treatments taken by adult
males. More specifically, we consider adult males taking the drug simvastatin (Zocor) as a
cholesterol lowering treatment regime. Our main result is that even though a majority of these
patients do not adhere fully, the welfare loss of over-adherence dominates that of under-
adherence. In particular, the loss due to over-adherence is over 80% larger than the loss due to
under-adherence.
In our framework, we interpret simvastatin as the unknown treatment while the
alternative is not taking any treatments. Our interpretation assumes that the sole objective of the
treatment is to lower low-density lipoprotein cholesterol (LDL-C). The per-period (quarterly)
benefit of simvastatin ℎ� represents the patient’s percentage point decline in LDL-C levels
relative to their initial baseline levels. The percentage point decline in LDL-C levels of a patient
in a given period reflects the true personalized treatment effect plus some idiosyncratic shock
according to
ℎ� = � + ��

29
where � ∼ �(�, ��) and � ∼ �(0, ���). Our calibration is for 58 year old males and we assume
that patients expect to live the average life expectancy of 23 years without treatment but longer if
responding to the simvastatin treatment.24
Patients observe their cholesterol levels through lab tests and update their adherence
decision on a quarterly basis. We assume patients learn their true value of treatment fully after
one year of treatment. Therefore, patients continue with the treatment after a year (hazard rate
goes to zero) if and only if they are true valuers i.e. (�(�, �) > �(��, ��) = 0) for the remainder
of their lives.
Calibrating our model requires knowledge of the distribution of treatment effects,
(�, ��), how well the symptoms reflect treatment or signal noise(���), the costs of treatment (�), and the utility parameters (3, �). Clinical trial data often provide information on the treatment
quality and noise parameters. In particular, the treatment mean and variance,(�, ��), is often
directly reported from such trials and individual longitudinal data can be used to estimate the
noise distribution(���). Table 1 summarizes the parameters values used in calibrating the model for simvastatin.
We use clinical trial data on the distribution of effectiveness of simvastatin from (Bays et al.
2004). On average, the simvastatin treatment therapy in the Bays et al. study lowered LDL-C
levels by 37.00% over a quarter relative to no treatment (placebo).25 In the context of our model
this implies 8[ℎ] = 8[�] = � = 37.00% and ℎ� = �� = 0.00%. We use simvastatin treatment
cost estimates from Hoadley et al. (2012) who using Medicare Part D data find that the median
24 We calculate life expectancy according to the 2009 CDC National Vital Statistics Report and the Social Security
Administration. 25 Patients studied in Bays et al (2004) received dosages of 10-80 mg respectively of simvastatin per day.

30
out of pocket cost paid by users for a one quarter supply of branded simvastatin was $231.25.26
The health consumption trade-off parameter � represents a patient’s willingness to pay to lower
his cholesterol for one quarter. As described in the Appendix A2, this parameter is calculated
using data on the longevity gains from simvastatin (Jönsson et. al 1996) valued in terms of
dollars using standard value-of-life estimates (Murphy and Topel 2005). We calculate that a
patient is willing to pay one dollar to lower his LDL-C levels by a bit more than a sixth of a
percentage point, 0.17%, per quarter. We calibrate the remaining parameters 3 and �� to match
observed adherence patterns for simvastatin as described in the Appendix. The calibrated health
discount factor is 0.90 which is in-line with the estimates from Moore and Viscusi (1988) and
Viscusi and Moore (1989).27 The noise parameter implies that an adhering patient’s cholesterol
level varies naturally from quarter-quarter with a standard deviation of �� = 7.40%.28
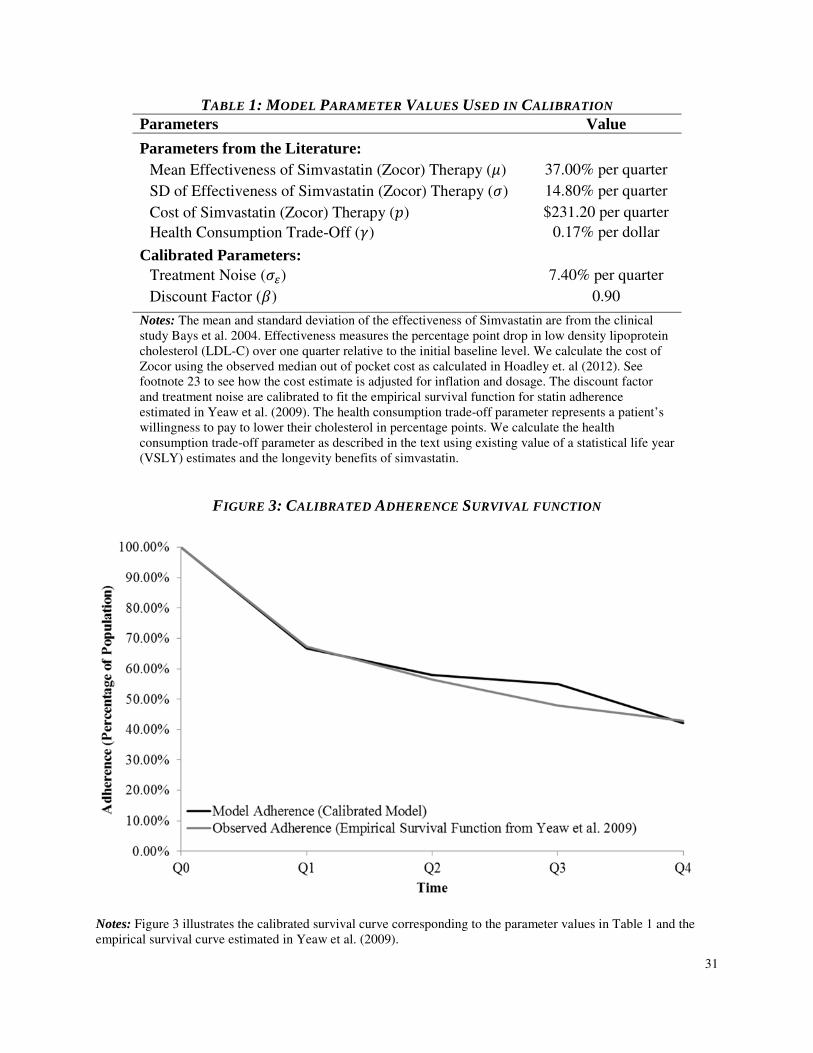
Figure 3 below displays the adherence survival function from the calibrated model. We
calculate the survival function by simulating 10 million hypothetical patients using the parameter
values displayed in Table 1. The solid black line reflects the survival function corresponding to
the calibrated model while the solid gray line reflects the observed adherence survival function
as reported in Yeaw et al. (2009). The calibrated survival function exhibits a correlation with the
observed empirical survival function of 0.94.
26 Hoadely et al. (2012) find that the median 30-day out of pocket cost for branded Zocor was $71 in 2008. We convert their cost estimates into the cost of a one quarter supply in 2014 by scaling the cost by 3.257 to account for the quantity and inflation. We account for inflation according to the BLS inflation calculator [http://www.bls.gov/data/inflation_calculator.htm]. We find similar cost estimates using CVS Pharmaceutical data from GoodRx.com . GoodRx reports estimated cash price of a one month dosage (taken daily) of 20mg simvastatin Zocor at CVS Pharmacy is $38. Assuming that each patient receives 30mg of simvastatin daily implies the cost of a one quarter dosage is then $171. 27 See Moore and Viscusi (1990) for further discussion on estimating discount rates for health outcomes. 28 Note that in principle, the degree to which health symptoms reveal treatment quality (signal-to-noise ratio) could be estimated using longitudinal clinical trial data on health outcomes. When such data is available, one would not need to observe adherence data in order to calibrate the noise distribution, thereby allowing for out-of-sample predictions about future post-approval adherence behavior from trial data obtained pre-approval.
31
TABLE 1: MODEL PARAMETER VALUES USED IN CALIBRATION
Parameters Value
Parameters from the Literature:
Mean Effectiveness of Simvastatin (Zocor) Therapy (�) 37.00% per quarter
SD of Effectiveness of Simvastatin (Zocor) Therapy (�) 14.80% per quarter
Cost of Simvastatin (Zocor) Therapy (�) $231.20 per quarter
Health Consumption Trade-Off (�) 0.17% per dollar
Calibrated Parameters:
Treatment Noise (��) 7.40% per quarter
Discount Factor (3) 0.90
Notes: The mean and standard deviation of the effectiveness of Simvastatin are from the clinical study Bays et al. 2004. Effectiveness measures the percentage point drop in low density lipoprotein cholesterol (LDL-C) over one quarter relative to the initial baseline level. We calculate the cost of Zocor using the observed median out of pocket cost as calculated in Hoadley et. al (2012). See footnote 23 to see how the cost estimate is adjusted for inflation and dosage. The discount factor and treatment noise are calibrated to fit the empirical survival function for statin adherence estimated in Yeaw et al. (2009). The health consumption trade-off parameter represents a patient’s willingness to pay to lower their cholesterol in percentage points. We calculate the health consumption trade-off parameter as described in the text using existing value of a statistical life year (VSLY) estimates and the longevity benefits of simvastatin.
FIGURE 3: CALIBRATED ADHERENCE SURVIVAL FUNCTION
Notes: Figure 3 illustrates the calibrated survival curve corresponding to the parameter values in Table 1 and the empirical survival curve estimated in Yeaw et al. (2009).
32
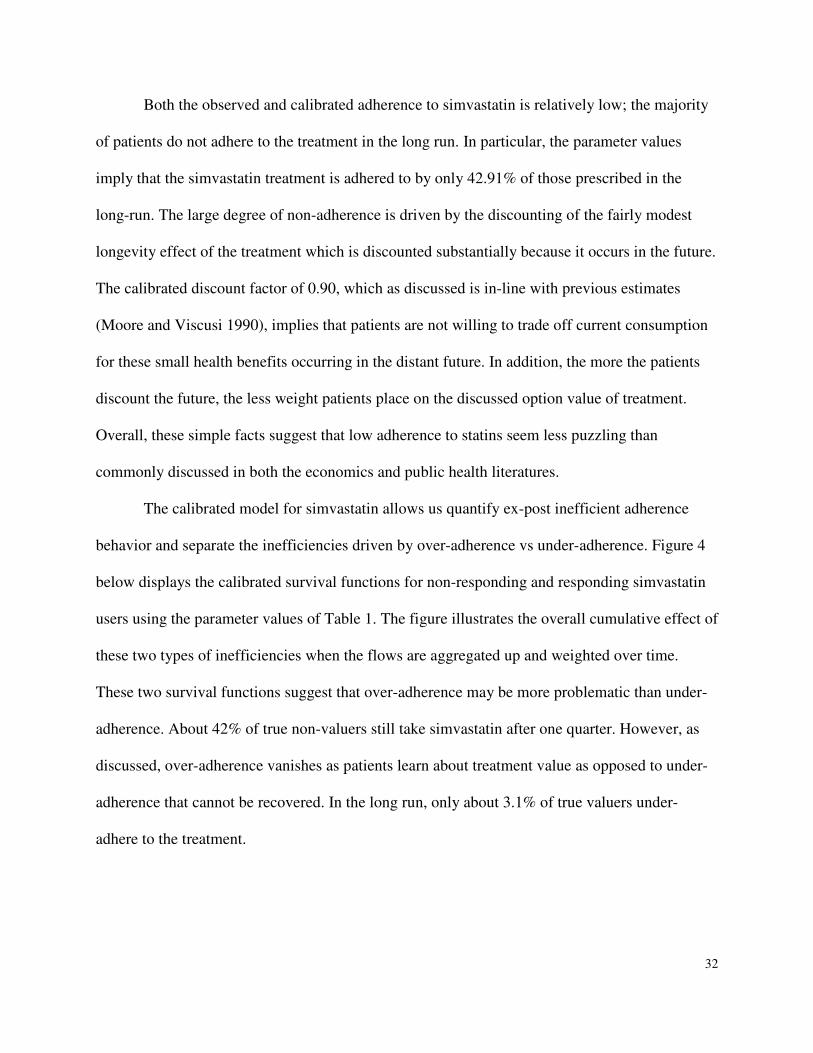
Both the observed and calibrated adherence to simvastatin is relatively low; the majority
of patients do not adhere to the treatment in the long run. In particular, the parameter values
imply that the simvastatin treatment is adhered to by only 42.91% of those prescribed in the
long-run. The large degree of non-adherence is driven by the discounting of the fairly modest
longevity effect of the treatment which is discounted substantially because it occurs in the future.
The calibrated discount factor of 0.90, which as discussed is in-line with previous estimates
(Moore and Viscusi 1990), implies that patients are not willing to trade off current consumption
for these small health benefits occurring in the distant future. In addition, the more the patients
discount the future, the less weight patients place on the discussed option value of treatment.
Overall, these simple facts suggest that low adherence to statins seem less puzzling than
commonly discussed in both the economics and public health literatures.
The calibrated model for simvastatin allows us quantify ex-post inefficient adherence
behavior and separate the inefficiencies driven by over-adherence vs under-adherence. Figure 4
below displays the calibrated survival functions for non-responding and responding simvastatin
users using the parameter values of Table 1. The figure illustrates the overall cumulative effect of
these two types of inefficiencies when the flows are aggregated up and weighted over time.
These two survival functions suggest that over-adherence may be more problematic than under-
adherence. About 42% of true non-valuers still take simvastatin after one quarter. However, as
discussed, over-adherence vanishes as patients learn about treatment value as opposed to under-
adherence that cannot be recovered. In the long run, only about 3.1% of true valuers under-
adhere to the treatment.

33
FIGURE 4: CALIBRATED UNDER-AND OVER-ADHERENCE
Notes: Figure 4 illustrates calibrated survival curves. The non-valuers survival function, @j(�), illustrates adherence for those individuals for whom treatment is not valuable/inefficient. Similarly the valuers survival function, @i(�), illustrates adherence for those individuals for whom treatment is valuable/efficient.
The calibrated model also allows us to dollarize the welfare losses associated with this
inefficient adherence. Consider a patient adhering to the simvastatin treatment inefficiently
which occurs whenever the health benefits do not exceed the cost of care; (U � T �. The
associated welfare loss of over-adherence is equal to the cost treatment minus dollarized health
effect.
��rm�omp�st__��o�t��om�G�omo��o = s\ = � � 1� �
An analogous expression applies to those who truly value the new treatment but do not adhere ��rm�omp�st__��o�t��Gom�G�omo��o = s] = 1
� � � �
34
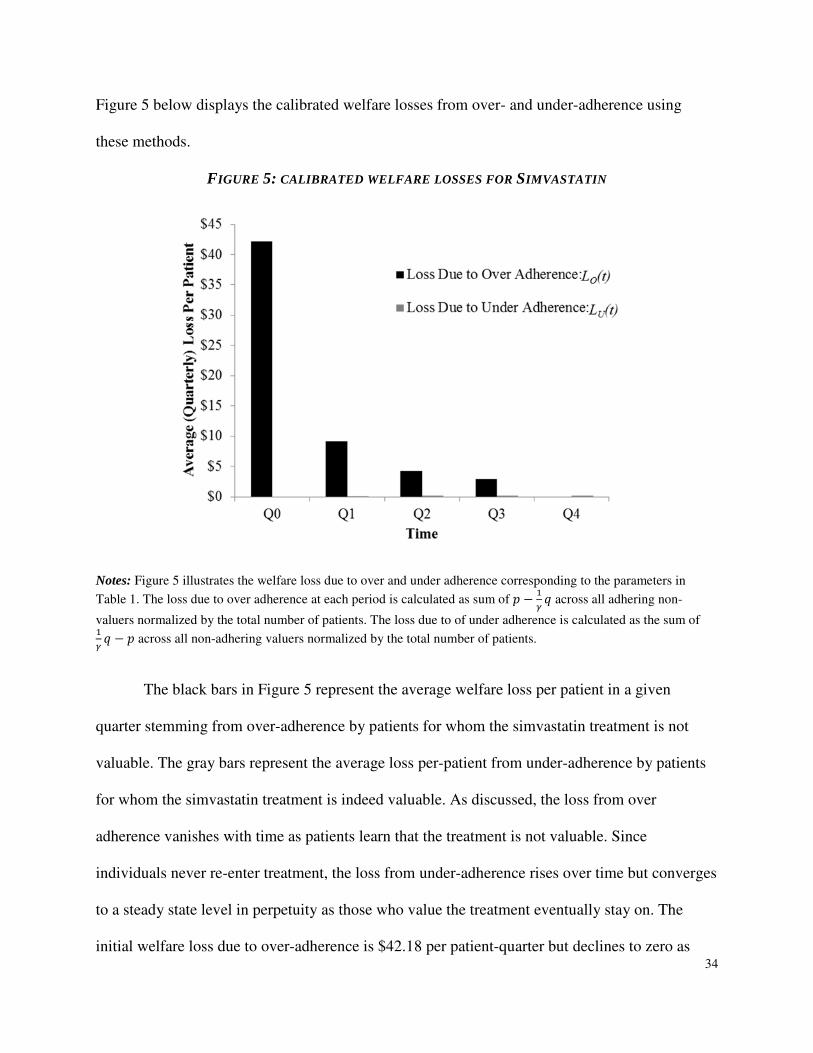
Figure 5 below displays the calibrated welfare losses from over- and under-adherence using
these methods.
FIGURE 5: CALIBRATED WELFARE LOSSES FOR SIMVASTATIN
Notes: Figure 5 illustrates the welfare loss due to over and under adherence corresponding to the parameters in
Table 1. The loss due to over adherence at each period is calculated as sum of � − (V � across all adhering non-
valuers normalized by the total number of patients. The loss due to of under adherence is calculated as the sum of (V � − � across all non-adhering valuers normalized by the total number of patients.
The black bars in Figure 5 represent the average welfare loss per patient in a given
quarter stemming from over-adherence by patients for whom the simvastatin treatment is not
valuable. The gray bars represent the average loss per-patient from under-adherence by patients
for whom the simvastatin treatment is indeed valuable. As discussed, the loss from over
adherence vanishes with time as patients learn that the treatment is not valuable. Since
individuals never re-enter treatment, the loss from under-adherence rises over time but converges
to a steady state level in perpetuity as those who value the treatment eventually stay on. The
initial welfare loss due to over-adherence is $42.18 per patient-quarter but declines to zero as
35
non-valuers drop out of treatment. Conversely, the loss due to under-adherence is initially zero as
everyone exhibits primary adherence but is $0.21 per patient-quarter in the long run. In present
value terms, the total loss due to under-adherence is $6.52 per patient and for over-adherence is
$57.87 per patient.29 As discussed in the theoretical analysis, the larger present value effects of
over-adherence steams from that it is front loaded in time as opposed under-adherence that is
back-loaded. The total per capita loss due to inefficient adherence (over-adherence plus under-
adherence) is $64.39. To put these numbers in perspective, a quantity of 94.1m simvastatin
prescriptions were dispensed in the US in 2010 and the total spending on lipid regulators was
$18.7bn (IMS Health 2011). The potential aggregate losses due to inefficient adherence are thus
on the order of billions of dollars. Regardless, the major finding is that over-adherence losses
greatly dominate under-adherence ones for statins, especially in present value terms.
Section 6: Concluding Remarks and Future Research
Little explicit positive and normative analysis exists in health economics on the dynamic
demand behavior implicit in non-adherence, which is thereby often associated with uninformed
patients. We analyzed the implications for adherence behavior stemming from patients learning
about personalized treatment value. Although providers may be more informed about the
population-wide effects of treatments, patients may be more informed about their own value of
care in terms of how they trade off effectiveness, side effects, costs of care, and compliance. We
derived the optimal stopping problem corresponding to non-adherence under patient learning,
and characterized its observable determinants. The model produces strong normative
implications resulting from such non-adherence, and is used to calibrate the welfare losses
29 This is calculated using an annual discount factor of 0.90 and assuming that non-adhering patients live 23 years.

36
implied for the cholesterol-reducing therapy simvastatin (Zocor). The calibration results suggest
that losses due to over-adherence are over 80% larger than losses from under-adherence, even
though only 43% of patients adhered to the therapy. In addition, we evaluated the efficiency
effects of personalized medicine, a technological advance we argued was explained by the
importance of learning to adherence.
Our analysis is in contrast to traditional analysis of adherence, which almost uniformly
assumes it should be raised. This traditional view may be interpreted as a special case of our
analysis in which the entire population truly benefits from the treatment but patients misconceive
these benefits of treatment. More precisely, this occurs when the true share of patients who do
not value the treatment is zero (�(� ∗) = 0 ) but prior treatment beliefs are inconsistent with this
(��(� ∗) > 0).In this case, factors that raise or lower adherence also raise or lower ex-post
efficiency, and which is often an implicit assumption of much of the existing policy discussions
of adherence. However, when not everyone benefits from treatment, as revealed by the fact that
some patients do not adhere, factors that raise adherence may lower ex-post efficiency, and
factors that lower adherence may raise such efficiency. This broken link between greater
adherence and efficiency is central to assessing the value of adherence interventions under
patient learning, such as personalized medicine.
We believe the analysis raises a host of important research questions that can be
addressed in future research.
Medical Innovation and Individual vs Aggregate Adherence
Our analysis predicted that adherence to a drug is decreasing in the quality of available
alternative treatments. This implies that as the number and quality of treatments available to treat
a given disease increases (i.e. through medical innovation) then short-run adherence to a given

37
individual treatment may fall as patients substitute to other treatments. However, the overall
long-run aggregate adherence to any treatment in the class may well rise with medical
innovation as a heterogeneous patient population segments into treatments more suitable for each
segment. A better understanding of the effects of medical innovation on individual vs aggregate
adherence is needed when such innovation increases the number and quality of available
treatment options.
Behavioral Adherence vs Therapeutic Adherence
Most of empirical analysis of adherence has centered on the demand for medical products
after they have been prescribed by providers. However, the same type of behavior applies to
behavioral recommendations by providers that usually concerns behavior that improves health
such as weight reduction. Many patients do not adhere to such behavioral recommendations by
providers partly because they bear the costs of adhering which providers do not. Even if they
engage in primary adherence, they later non-adhere by not say following diet or exercise regimes
in the long run. Even though data constraints make it harder to study behavioral adherence, e.g it
does not show up in claims data, more research is needed to understanding differences between
the two forms of adherence.
Pay for Performance and Performance-Based Adherence
If optimal learning drives adherence, it greatly impacts how various pay for performance
or risk-contracting policies set by payers to affect providers and manufacturers alters care. If
patients do not adhere when a therapy does not perform, reimbursements are not spent on poorly
performing care. Put differently, when patients engage themselves in “pay for performance” as
implied by our analysis, pay for performance reimbursements by payers may have small effects
as payers do not pay for ineffective care when patients do not adhere to it. The patient stopping

38
rules implied by our analysis mimic on the individual level the population wide pay-for-
performance schemes from payers to manufacturers, under which manufacturers only receive
payment when a therapy performs well at a population level.
External Effects and Non-adherence
We only considered adherence from the private-choice perspective of the patient.
However, privately optimal adherence may not be socially optimal when adherence behavior
confers external effects. For example, adherence to treatments for infectious diseases such as TB
may involve positive externalities and thus may be inefficiently low when non-infected
individuals benefit from adherence by infected patients. Classes of drugs such as antibiotics or
antiretrovirals raise a similar issue-adherence confers a positive externality by preventing
resistance. Or external effects may operate through insurance premiums when non-adherence
raises the total cost of care through cost offsets (Goldman and Philipson 2007, Chandra et al.
2010). Pigouvian subsidies to stimulate adherence under positive external effects may then be
relevant and may be implemented through lower copays or other methods that raise adherence.
More careful analysis of the role of adherence programs is needed in the context of external
effects.
Selection and the Effects of Adherence on Health
Medical studies stress the importance of adherence because of the positive impacts on a
patient’s health. For example, many analysts think patients need to be better educated about
treatments for breast cancer given that compliance is poor but the health benefits seem
substantial. However, our analysis directly implies that those that adhere perform better than
those that do not, and thus the adherence effects are overestimated when optimal stopping occurs
because of poor performance. The basic view of the medical community—that patients under-

39
consume care—needs to be evaluated not from the average experience but from the patient-
specific experience. In addition, standard forms of selection bias evaluating therapies may of
course be present, such as e.g. otherwise healthier patients being the ones that adheres the most.
This selection also affects the optimal targeting of adherence interventions; low levels of
adherence may reveal preferences that imply small effects for adherence interventions.
Insurance Design: Price Discrimination and Adherence
Future analysis may consider optimal insurance design when patient learning drives
adherence. One direct way in which insurance design may affect adherence is through copays, as
generally recognized in the literature and as implied by the analysis above. When differential
treatment performance differentiates the value of a therapy across the population there is a role
for price discrimination across patients.30 Put simply, both profits and adherence may be raised
by charging low-performing patients lower co-pays and high-performing patients larger co-pays.
More precisely, in our analysis profit maximizing firms would discriminate based on treatment
performance through a pricing function �(ℎ�) that is not constant across all treatment experiences
ℎ�. However, this essentially amounts to a pricing scheme that involves pay-for-performance on
the patient level which is induced by optimal price discrimination.
Charging less for low-value care and more for high-value care is in contrast with an
interesting recent health policy literature that exists on so-called value-based insurance design
(VBID). However, to our knowledge, that policy literature does not explicitly discuss the
30
For experience goods such as medical treatments, price discrimination over time, as opposed to across
patients, has often been discussed. Optimal policies often reduce prices initially to subsidize learning after which
prices are raised. This is indeed observed for medical technologies through so called free “samples” being offered
initially although the impact of such samples on optimal adherence seems largely unknown.
40
optimality criteria that determine whether copays should be set high or low, that is, the definition
of V in VBID. This policy literature is in contrast to the economic analysis of the value of
insurance designs in which the value V is defined as economic efficiency (see Pauly, 1968, and
Zeckhauser, 1970, for copay design for single treatments, and Goldman and Philipson, 2007, for
multiple ones). When value is defined as economic efficiency, the implied VBID is that copays
should be lower for less price-elastic treatments.
Structural Estimation of Trial Attrition to Predict Post-approval Adherence
The structural model of adherence discussed implies strong relationships between so-
called “real-world” versus clinical trial performance of treatments, sometimes distinguished by
the names efficacy versus effectiveness. However, attrition behavior in clinical trials may stem
from the same type of behavior analyzed here (Philipson and DeSimone 1999). The central
testable empirical implication of that past analysis as well as the adherence analysis here is that
past performance drives current hazard rates into non-adherence. This prediction may be tested
by longitudinal outcomes data in trials and data on both adherence and health outcomes in real-
world settings, the latter of which may become more abundant as data on insurance claims
(measuring adherence) and electronic medical records (measuring performance) are merged.
Because of this similarity in behavior, under some conditions, one can estimate the
structural parameters from only having attrition behavior from clinical trial data. The parameters
can then be used to predict or forecast out-of-sample post-marketing adherence behavior. In
other words, structural estimation of attrition behavior in trials can allow for counter-factual
predictions of future real-world adherence and effectiveness.
In summary, we believe more explicit theoretical analysis of non-adherence would better
expand our understanding of this important type of dynamic health care demand. Empirical

41
testing of explicit theories seems needed before we can make credible normative claims about
the efficiency gains of various private or public interventions aimed at raising adherence.

42
References
American College of Physicians. 1990. “Physicians and the Pharmaceutical Industry.” Annals of
Internal Medicine, 112:624–626.
Baum, Stephanie. 2013. “Health IT startup claims pillbox app has boosted adherence rate to 81% in two months.” MedCity News, January 8, 2013. http://medcitynews.com/2013/01/ health-it-startup-claims-pillbox-app-has-boosted-adherence-rate-to-81-in-two-months/
Bays, Harold E., Leiv Ose, Neil Fraser, Diane L. Tribble, Katherine Quinto, Robert Reyes, Amy O. Johnson-Levonas, Aditi Sapre, and Steven R. Donahue. 2004. "A Multicenter, Randomized, Double-Blind, Placebo-Controlled, Factorial Design Study to Evaluate the Lipid-Altering Efficacy and Safety Profile of the Ezetimibe/Simvastatin Tablet Compared with Ezetimibe and Simvastatin Monotherapy in Patients with Primary Hypercholesterolemia." Clinical therapeutics 26(11): 1758-1773.
Black, Dennis M., Richard J. Brand, Merwyn Greenlick, Glenn Hughes, and Jacqueline Smith. 1987. "Compliance to treatment for hypertension in elderly patients: the SHEP pilot study." Journal of Gerontology 42(5): 552-557.
Bosworth, Hayden B., Bradi B. Granger, Phil Mendys, Ralph Brindis, Rebecca Burkholder, Susan M. Czajkowski, Jodi G. Daniel et al. 2011. "Medication adherence: a call for action." American Heart Journal 162(3): 412-42.
Bradt, Russell N., S. M. Johnson, and Samuel Karlin. 1956. "On Sequential Designs for Maximizing the Sum of n Observations." The Annals of Mathematical Statistics 27(4): 1060-1074.
Cardon, James H. and Mark H. Showalter. 2015. “The Effects of Direct-to-Consumer Advertising of Pharmaceuticals on Adherence,” Applied Economics: 1-13.
Chan, Tat Y. and Barton H. Hamilton. 2006. “Learning, Private Information and the Economic Evaluation of Randomized Experiments.” Journal of Political Economy, 114(6): 997-1040.
Chandra, Amitabh, Jonathan Gruber, and Robin McKnight, (2010), “Patient Cost-Sharing and Hospitalization Offsets in the Elderly”, American Economic Review 100(1): 193–213.
Chernew, Michael E., Mayur R. Shah, Arnold Wegh, Stephen N. Rosenberg, Iver A. Juster, Allison B. Rosen, Michael C. Sokol, Kristina Yu-Isenberg, and A. Mark Fendrick. 2008 "Impact of decreasing copayments on medication adherence within a disease management environment." Health Affairs 27(1): 103-112.
Comstock, Jonah. 2013 “GlowCaps now sold through CVS, new randomized control trial launches.” MobiHealthNews, March 11, 2013. http://mobihealthnews.com/20750/ glowcaps-now-sold-through-cvs-new-randomized-control-trial-launches/
43
Dickstein, Michael J. 2014. “Efficient Provision of Experience Goods: Evidence from Antidepressant Choice.” http://www.stanford.edu/~mjd/papers/eff_prov_experience _goods _mjdickstein.pdf
Engelberg, Joseph, Christopher A. Parsons and Nathan Tefft. 2014. “Financial Conflicts of Interest in Medicine.” Working Paper.
Feldman, Ross, Marilyn Bacher, Norman Campbell, Aidan Dover, and Arun Chockalingam. 1998. “Adherence to Pharmacologic Management of Hypertension.” Canadian Journal of Public
Health 89(5): I16-18.
Fernandez, Jose M. 2013. “An Empirical Model of Learning Under Ambiguity: The Case of Clinical Trials.” International Economic Review, 54(2): 549-573.
Flack, John M. , Serguei V. Novikov, and Carlos M. Ferrario. 1996. "Benefits of adherence to anti-hypertensive drug therapy." European Heart Journal 17(Suppl A): 16-20.
Gittins, John C., Kevin Glazebrook, and Richard Weber. 2011. Multi-armed Bandit Allocation
Indices, 2nd Edition., Wiley.
Gittins, John C. and David M. Jones. 1974. “A dynamic allocation index for the sequential design of experiments”, in J. Gani, K. Sarkadi and I. Vince, eds. Progress in
Statistics,European Meeting of Statisticians 1972, Vol 1 Amsterdam: North Holland, 241-266.
Gittins, John C. and David M. Jones. 1979. “A dynamic allocation index for the discounted multiarmed bandit problem.” Biometrika 66(3): 561-565.
Goldman, Dana. Geoffrey F. Joyce, and Yuhui Zheng. 2007."Prescription Drug Cost Sharing" Journal of the American Medical Association 298(1): 61-69.
Goldman, Dana and Tomas J. Philipson. 2007. “Integrated Insurance Design in the Presence of Multiple Medical Technologies.”, American Economic Review 97(2): 427-432.
GoodRx.com. 2014. “Simvastatin Prices.” Accessed May 22, 2014, http://www.goodrx.com/simvastatin
Grossman, Michael. 1972. “On the Concept of Health Capital and the Demand for Health.” Journal of Political Economy 80(2): 223-255
Haynes, R. Brian, K. Ann McKibbon, and Ronak Kanani. 1996. "Systematic review of randomised trials of interventions to assist patients to follow prescriptions for medications." The Lancet 348(9024 ): 383-386.
Heart Protection Study Collaborative Group. 2006. “Lifetime cost effectiveness of simvastatin in a range of risk groups derived from a randomised trial of 20536 people.” BMJ: British
Medical Journal, 333(7579): 1145-1148

44
Hershey, John C., Bruce G. Morton, Jane Braithwaite Davis, and Michael J. Reichgott. 1980 "Patient Compliance with Antihypertensive Medication." American Journal of Public
Health 70(10): 1081-1089.
Hoadley, John F., Katie Merrell, Elizabeth Hargrave, and Laura Summer. 2012. "In Medicare Part D plans, low or zero copays and other features to encourage the use of generic statins work, could save billions." Health Affairs, 31(10): 2266-2275.
IMS Health. 2011. “ The Use of Medicines in the United States: Review of 2010.” Accessed May 14, 2014, http://www.imshealth.com/deployedfiles/imshealth/Global/Content /IMS%20Institute/Static%20File/IHII_UseOfMed_report.pdf
Jönsson, B., M. Johannesson, J. Kjekshus, A. G. Olsson, T. R. Pedersen, and H. Wedel. 1996. "Cost-effectiveness of cholesterol lowering Results from the Scandinavian Simvastatin Survival Study (4S)." European Heart Journal, 17 (7): 1001-1007.
Jovanovic, Boyan. 1979. "Job Matching and a Theory of Turnover." The Journal of Political
Economy 87(5): 972-990.
Lesselroth, Blake J., Patricia J. Holahan, Kathleen Adams, Zhen Z. Sullivan, Victoria L. Church, Susan Woods, Robert Felder, Shawn Adams, and David A. Dorr. 2011. "Primary care provider perceptions and use of a novel medication reconciliation technology." Informatics in Primary Care 19(2): 105-118.
Lien, Hsien-Ming, Mingshan Lu, Ching-To Albert Ma, and Thomas G. McGuire. 2010. “Progress and Compliance in Alcohol Abuse Treatment.” Journal of Health Economics. 29(2): 213-225.
Ljungqvist, Lars and Thomas J. Sargent. 2012. Recursive Macroeconomic Theory, Third Edition, MIT Press.
Mallion, Jean-Michel, Jean-Philippe Baguet, Jean-Philippe Siche, Frederic Tremel, and R. De Gaudemaris. 1998. "Compliance, electronic monitoring and antihypertensive drugs." Journal of Hypertension. Supplement 16(1): S75-79.
Moore, Michael J. and W. Kip Viscusi. 1988. “The Quantity Adjusted Value of Life.” Economic
Inquiry, 26(3): 369-388.
Moore, Michael J. and W. Kip Viscusi. 1990. “Models for Estimating Discount Rates for Long-Term Health Risks Using Labor Market Data.” Journal of Risk and Uncertainty, 3: 381-401.
Murphy, Kevin M., and Robert H. Topel. 2006. “The Value of Health and Longevity.” Journal
of Political Economy 114(5): 871-904.
Nelson, Eugene C., William B. Stason, Raymond R. Neutra, and Harold S. Solomon. 1980 "Identification of the noncompliant hypertensive patient." Preventive medicine 9(4): 504-517.

45
New England Healthcare Institute. 2009. “Thinking Outside the Pillbox: A System-side Approach to Improving Patient Medication Adherence to Chronic Disease.” Accessed June 2, 2014, http://www.nehi.net/writable/publication_files/file/pa_issue_brief_final.pdf
Pandey, Sandeep, Deepayan Chakrabarti, and Deepak Agarwal. 2007 "Multi-armed bandit problems with dependent arms." In Proceedings of the 24th international conference on
Machine learning, (ACM): 721-728.
Pauly, Mark V. 1968. "The Economics of Moral Hazard: Comment." American Economic Review 58(3): pp. 531-37.
Pedersen, T., Kjekshus, J., Berg, K., & Haghfelt, T. 1994. “Randomised trial of cholesterol lowering in 4444 patients with coronary heart disease: the Scandinavian Simvastatin Survival Study (4S). The Lancet, 344: 1383-89.
Pharmaceutical Research and Manufacturers of America. 2013. “Current Organizations Funding Adherence Research.”, accessed August 5, 2013, http://www.phrma.org/value/ sources-of-adherence-research-funding.
Philipson, Tomas J. 1997. "Data Markets and the Production of Surveys." Review of Economic
Studies 64(1): 47-73.
Philipson, Tomas, and Jeffrey DeSimone. 1997. "Experiments and Subject Sampling."Biometrika 84(3): 619-630.
Philipson, Tomas J., and Larry V. Hedges. 1998. "Subject Evaluation in Social Experiments." Econometrica 66(2): 381-408.
Powell, Warren B. and Ilya O. Ryzhov. 2012. Optimal Learning. Wiley.
Rusmevichientong, Paat, and John N. Tsitsiklis. 2010. "Linearly parameterized bandits." Mathematics of Operations Research 35(2): 395-411.
Seabury, Seth A., Gupta, Charu, Philipson, Tomas J., Henkhaus, Laura E. and the PhRMA Medication Adherence Advisory Council. 2014 “Understanding and overcoming barriers to medication adherence: A review of research priorities,” Journal of Managed
Care Pharmacy, in press.
Sood, Neeraj, Tomas J. Philipson and Peter Huckfeldt. 2013. “Quantifying the Value of Personalized Medicines: Evidence from COX-2 Inhibitors.” Forum for Health Economics
& Policy, 16(1): 101-122..
Smith, M.E. Beth, Nancy J. Lee, Elizabeth Haney, Susan Carson, Mark Helfand and Cathy Kelley. 2009. Drug Class Review: HMG-CoA Reductase Inhibitors (Statins) and Fixed-
dose Combination Products Containing a Statin: Final Report Update 5. Oregon Health & Science University.
Viscusi, W. Kip and Michael J. Moore. 1989. “Rates of Time Preference and Valuations of the Duration of Life.” Journal of Public Economics, 38: 279-317

46
Vollmer, William M., Adrianne Feldstein, David Smith, Joan Dubanoski, Amy Waterbury, Jennifer Schneider, Shelley Clark, and Cynthia Rand. 2011. "Use of Health Information Technology to Improve Medication Adherence." The American Journal of Managed
Care 17(12 Spec No.): SP79-87.
Wazana, Ashley. 2000. “Physicians and the Pharmaceutical Industry: Is a Gift Just Ever a Gift?” JAMA, 283: 373-380.
Yao, Yi Ching. 2006. “Some results on the Gittins index for a normal reward process.” in H. Ho, C. Ing & T. Lai, eds., Time Series and Related Topics: In Memory of Ching-Zong Wei, Institute of Mathematical Statistics, Beachwood, OH.
Yeaw, Jason, Joshua S. Benner, John G. Walt, Sergey Sian, and Daniel B. Smith. 2009. “Comparing Adherence and Persistence Across 6 Chronic Medication Classes.” Journal
of Managed Care Pharmacy, 15(9): 728-740
Zeckhauser, Richard. 1970. "Medical Insurance: A Case Study of the Tradeoff between Risk Spreading and Appropriate Incentives." Journal of Economic Theory 2(1): 10-26

47
Appendix
A1. Multiple Treatments and Partial Adherence on a Single Treatment
This Appendix generalizes the discussion to the case when the quality of more than one
treatment is unknown to the patient. Instead of two treatment alternatives, one uncertain
treatment and one certain alternative treatment, the more general setting with � uncertain
treatment alternatives is considered. One can think of the � treatments as completely different
treatments or alternatively as different levels of adherence with the same treatment.
Multiple uncertain treatments involve a so called multi-armed bandit problem in
statistical decision theory. We assume that each of the � treatment alternatives produces a
personalized health benefit which is a function of the treatment quality, ��, and an idiosyncratic
noise term ���,
ℎ�� = �� + ��� , � = 1,2, …�
The personalized quality of treatment � is distributed i.i.d. across individuals from the
distribution �� ∼ ��(⋅). As before, each treatment generates utility ��ℎ��, ��� = ℎ�� − ���.
Patients’ prior belief over the quality at time �for treatment � id denoted ���(⋅ |�����) where
����� is the history of experienced personal health outcomes on treatment �. This formulation
assumes that treatment qualities for a patient are distributed conditionally independently across
the treatment alternatives.31 Further we assume that each patients initial prior reflects the true
distribution of treatment heterogeneity, ���(⋅) = ��(⋅). Under the maintained assumption that the
prior and shocks are normally distributed,��(�) ∼ �(��, ���) and ��� ∼ �(0, ���� ), standard
31 See Pandey et al. (2007), Rusmevichientong and Tsitsiklis (2010) and Dickstein (2014) for a discussion of multi-armed bandit problems with correlated arms.

48
normality results imply that a patient’s posterior distribution is optimally updated according to
the previous equation (1) the single treatment case.
The patient’s adherence problem now involves selecting the optimal treatment regime
among the � alternatives each period. The value function of a patient adhering to treatment
option � at time � is
1�ℎ��, ��, ������� = ��ℎ�� , ��� + 3max<891�ℎ�/(( , ��/(, ��������������:, … , 891�ℎ�/(� , ��/(, ��������������:> Here, ��, represents the matrix of outcomes across the �different treatments and the vectors ������ and ������ represent the patient’s prior and posterior distributions over the �different treatment
alternatives. The previous discussion with a single uncertain treatment (� = 1) and a certain
alternative treatment (� = 2) corresponds to � = 2 with ��� = 0.
The optimal adherence rule generalizes to selecting the treatment alternative with the
highest Gittins index (Gittins and Jones 1974, Gittins and Jones 1979, Gittins et al. 2011). The
Gittins index, ���, for a particular treatment � at time � corresponds to the level of utility
generated by some hypothetical known alternative treatment for which the patient is indifferent
between treatment and the alternative treatment in the simple two treatment alternative case.32
���1 − 3 = 8 c��ℎ�/(� , ��� + 3max 7891�ℎ�/�� , ℎ���/�, ���, ���/(:, ���1 − 3; |��d The Gittins Index Theorem (Gittins and Jones 1974, Gittins and Jones 1979) shows that in each
period, patients optimally adhere by selecting the treatment alternative with the highest Gittins
index at that time. The Gittin’s Index Theorem essentially reduces the K multi-armed bandit
problem into a set of K single-armed bandit problems.
32 See Powell and Ryzhov (2012) for a full discussion of Gittins indices.
49
Implications for Non-Adherence among Multiple Treatments
Computing Gittins indices correspond directly to the single armed bandit problem and
optimal stopping rules described for the two treatments govern optimal adherence. Furthermore,
since Gittins indices in the multiple treatment framework are computed using the simple two
treatment framework (with one known treatment alternative), the comparative statics discussed
generalize to the multiple treatment setting. For example, the Gittins index for a particular
treatment �is increasing in the perceived quality of treatment ��while decreasing in the cost of
treatment ��. Similarly, conditional on the perceived quality of treatment, the Gittins index for
an alternative � is increasing in the variance of treatment quality ��� while decreasing in the
variance of the treatment noise���� .
Implications Partial Adherence on a Single Treatment
The multiple-treatment framework allows one to assess behavior involving partial
adherence. Different levels of adherence, such as fractions of prescribed medications taken, can
be thought of as separate treatments in the multiple treatment framework. Consider a patient
facing the option of fully adhering versus partially adhering to a treatment regime. On one hand,
fully adhering to the treatment regime likely generates superior and less noisy health outcomes
relative to partial adherence. Both of these attributes (higher mean and lower treatment noise
variance) make full adherence an attractive alternative relative to partial adherence. On the other
hand, partial adherence is likely at substantially lower cost than full adherence, whether in direct
treatment costs or time costs of compliance. Because of its lower cost and greater variance of
treatment effectiveness, patients may find it optimal to partially rather than fully adhere to

50
treatment. The general point is that whatever effects that one believes are true for different levels
of adherence can be viewed as multiple treatments with different health outcomes and costs.
A2. Model Calibration
A calibration of our model requires knowledge of the distribution of treatment effects,
(�, ��), how well the symptoms reflect treatment or signal noise (���), the costs of treatment (�), and the utility parameters (3, �). We pull estimates of the cost and effectiveness of simvastatin
directly from the data. We use a combination of data and economic theory to calculate/calibrate
the remaining parameters (�, 3, ���). The health consumption trade-off parameter � represents a patient’s willingness to pay to
lower his cholesterol for one quarter. The value of lowering cholesterol is induced from the value
of the longevity increase it generates. In particular, is parameter is calculated using data on the
longevity gains from simvastatin priced out to dollars using standard value-of-life estimates.
Based on the results from the Scandinavian Simvastatin Survival Study (S4)33, Jönsson et. al
(1996) find that simvastatin treatment raised longevity by an estimated 0.377 undiscounted life
years. These estimated longevity effects are in-line with the results from the Heart Protection
Study Collaborative Group (2006) study. This implies that taking simvastatin for an average 58
year old male increases his life expectancy from roughly 81 to 81.377 years.34,35 Standard
existing estimates of the value of a life year at 81 (1@s��() is about $230,000 in 2014 (Murphy
33 Patients were given 20-40mg of simvastatin daily over a roughly five year period (5.4 years on average). Over the whole course of the study, simvastatin lowered LDL-C levels by 35% on average (Pederson et al. 1994). These findings are similar to those in Bays et. al 2004 study. 34 The average age in S4 study for males was 58 .1 years old (Pederson et al. 1994). The average age in the Bays et al. (2004) study was 56 years old. 35 We calculate life expectancy according to the 2009 CDC National Vital Statistics Report and the Social Security
Administration.

51
and Topel (2006)).36 Under the assumption that the only benefit of simvastatin is increased
longevity, we equate the discounted stream of health benefits (V � (expressed in dollars) with the
longevity benefits.
∑ 3�.��� (V � = 3��1@s��( × 0.377��×����� (2)
The value of lowering cholesterol can then be induced from the value of the longevity increase it
generates. In particular, given our parameter estimates of the parameters�, 1@s��(, and 3above,
the health consumption trade-off parameter satisfying equation (2) is � = 0.17%$ . In other words,
patients are willing to pay one dollar to lower their LDL-C levels by a bit more than a sixth of a
percentage point, 0.17%, per quarter.
The calibrated parameters in the model are the discount factor 3and the treatment noise
��. We calibrate 3 and ��to match observed adherence patterns for simvastatin. Using claims
data, Yeaw et al. (2009) implicitly estimate the adherence survival function we discussed for the
cases of statins.37 We calibrate 3 and the ratio %)%& to minimize squared differences between the
calibrated and empirical adherence survival function at each quarter for the first year.38 The
calibrated health discount factor is 0.90 which is line with the estimates from Moore and Viscusi
(1988) and Viscusi and Moore (1989).39 The calibrated ratio %)%& is 2.00. This implies that an
36 See Figure 2(b) in Murphy and Topel (2006). Since Murphy and Topel’s value of life year estimates are expressed in USD 2000 we adjust them by a factor of 1.38 to express the estimate in USD 2014 according to the BLS [http://www.bls.gov/data/inflation_calculator.htm]. 37 Although Yeaw et al. examine adherence to all statins, not just simvastatin, studies have shown that any of the statins available in the US are effective for moderate (up to 35%) LDL-C cholesterol reductions (Smith et al. 2009). 38 More precisely, we calibrate the values of 3 and ��/�� by implementing a grid search over the parameter space 3 ∈ {0.90,0.95,0.99} and ��/�� ∈ {0.50,0.75,1.00,1.25,1.50}. 39 See Moore and Viscusi (1990) for further discussion on estimating discount rates for health outcomes.

52
adhering patient’s cholesterol level varies naturally from quarter-quarter with a standard
deviation of �� = 7.40%.40
40 Note that in principle, the degree to which health symptoms reveal treatment quality (signal-to-noise ratio) could
be estimated using longitudinal clinical trial data on health outcomes. When such data is available, one would not need to observe adherence data in order to calibrate the noise distribution, thereby allowing for out-of-sample
predictions about future post-approval adherence behavior from trial data obtained pre-approval.


![Interventions for enhancing adherence to treatment in ... · [Intervention Review] Interventions for enhancing adherence to treatment in adults with bronchiectasis Amanda McCullough](https://img.pdfslide.us/doc/110x75/5f3f3db211fb1568232d56e7/interventions-for-enhancing-adherence-to-treatment-in-intervention-review.jpg)