Embed Size (px)
Citation preview
A6 statistics 10.indd 1 10/22/10 11:14:37 AM
The Health and Safety Executive Statistics 2009/10

2
A6 statistics 10.indd 2 10/22/10 11:14:37 AM
Statistician lead: Kate Sweeney Contact: [email protected]
A National Statistics publication
National Statistics are produced to high professional standards set out in the National Statistics Code of Practice. They undergo regular quality assurance reviews to ensure that they meet customer needs. They are produced free from any political interference.
A6 statistics 10.indd 3 10/22/10 11:14:37 AM
Health and safety statistics highlights 2005
ww
w.h
se.g
ov.u
k/st
atis
tics/
xxxx
xxxx
x
Contents
Key facts page 4
Work-related ill health pages 5–7
Workplace injuries pages 8–10
Enforcement pages 11–13
Countries and regions pages 14–15
Industry sectors page 16
Occupation groups page 17
Progress since 2000 pages 18–23
Sources and definitions pages 24–27
3
A6 statistics 10.indd 4 10/22/10 11:14:37 AM
Health and safety statistics highlights 2005w
ww
.hse
.gov
.uk/
stat
istic
s/
Key facts
Ill health 1.3 million people who worked during the last year were suffering from an illness (long-standing as well as new cases) they believed was caused or made worse by their current or past work. 555 000 of these were new conditions which started during the year.
A further 0.8 million former workers (who last worked over 12 months ago) were suffering from an illness which was caused or made worse by their past work.
2249 people died from mesothelioma in 2008 and thousands more from other occupational cancers and diseases such as COPD.
Injuries 152 workers were killed at work, a rate of 0.5 fatalities per 100 000 workers.
121 430 other injuries to employees were reported under RIDDOR, a rate of 473 per 100 000 employees.
233 000 reportable injuries occurred, according to the Labour Force Survey, a rate of 840 per 100 000 workers.
Working days lost 28.5 million days were lost overall (1.2 days per worker), 23.4 million due to work-related ill health and 5.1 million due to workplace injury.
Enforcement 1033 offences were prosecuted by HSE and ORR. 287 offences were prosecuted by local authorities. 15 881 enforcement notices were issued by all enforcing authorities
4
A6 statistics 2010.indd 5 10/25/10 4:14:26 PM
Health and safety statistics highlights 2005
ww
w.h
se.g
ov.u
k/st
atis
tics/
over
pic.
htm
Health and safety statistics highlights 2005
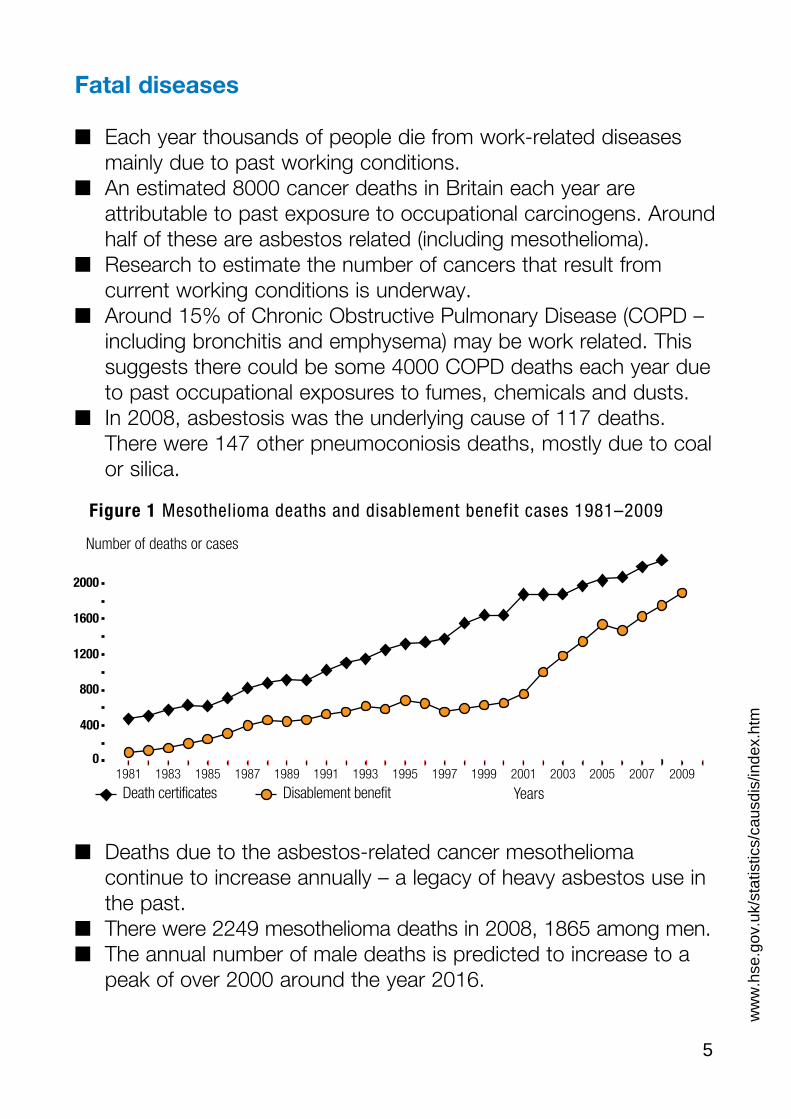
Fatal diseases
■ Each year thousands of people die from work-related diseases mainly due to past working conditions.
■ An estimated 8000 cancer deaths in Britain each year are attributable to past exposure to occupational carcinogens. Around half of these are asbestos related (including mesothelioma).
■ Research to estimate the number of cancers that result from current working conditions is underway.
■ Around 15% of Chronic Obstructive Pulmonary Disease (COPD – including bronchitis and emphysema) may be work related. This suggests there could be some 4000 COPD deaths each year due to past occupational exposures to fumes, chemicals and dusts.
■ In 2008, asbestosis was the underlying cause of 117 deaths. There were 147 other pneumoconiosis deaths, mostly due to coal or silica.
Figure 1 Mesothelioma deaths and disablement benefit cases 1981–2009
Number of deaths or cases
2000
1600
1200
800
400
0 1981 1983 1985 1987 1989 1991 1993 1995 1997 1999 2001 2003 2005 2007 2009
Death certificates Disablement benefit Years
■ Deaths due to the asbestos-related cancer mesothelioma continue to increase annually – a legacy of heavy asbestos use in the past.
■ There were 2249 mesothelioma deaths in 2008, 1865 among men. ■ The annual number of male deaths is predicted to increase to a
peak of over 2000 around the year 2016.
5
ww
w.h
se.g
ov.u
k/st
atis
tics/
caus
dis/
inde
x.ht
m
Health and safety statistics highlights 2005Health and safety statistics highlights 2005
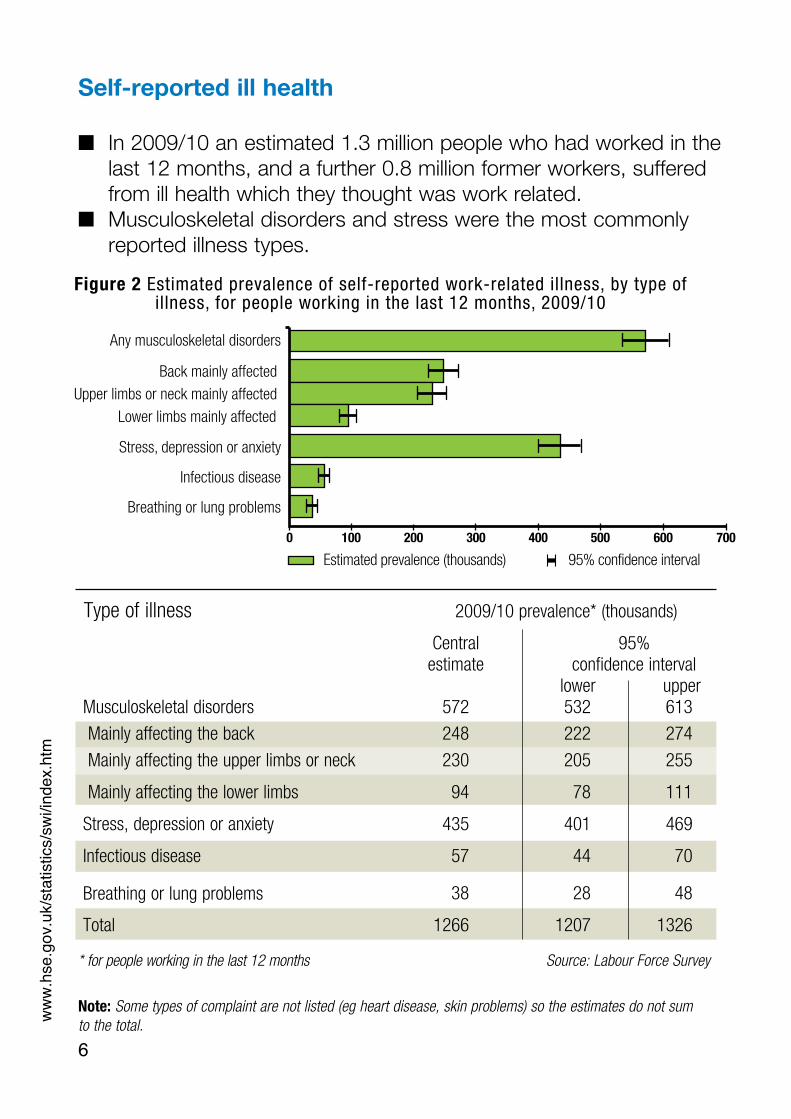
Self-reported ill health
■ In 2009/10 an estimated 1.3 million people who had worked in the last 12 months, and a further 0.8 million former workers, suffered from ill health which they thought was work related.
■ Musculoskeletal disorders and stress were the most commonly reported illness types.
Figure 2 Estimated prevalence of self-reported work-related illness, by type of illness, for people working in the last 12 months, 2009/10
Any musculoskeletal disorders
Back mainly affected
Upper limbs or neck mainly affected
Lower limbs mainly affected
Stress, depression or anxiety
Infectious disease
Breathing or lung problems
Estimated prevalence (thousands) 95% confidence interval
0 100 200 300 400 500 600 700
Type of illness 2009/10 prevalence* (thousands)
ww
w.h
se.g
ov.u
k/st
atis
tics/
swi/i
ndex
.htm
Central 95% estimate
lower upper 572 532 613
248 222 274
230 205 255
94 78 111
435 401 469
57 44 70
38 28 48
Total 1266 1207 1326
confidence interval
Musculoskeletal disorders
Mainly affecting the back
Mainly affecting the upper limbs or neck
Mainly affecting the lower limbs
Stress, depression or anxiety
Breathing or lung problems
Infectious disease
* for people working in the last 12 months Source: Labour Force Survey
Note: Some types of complaint are not listed (eg heart disease, skin problems) so the estimates do not sum to the total.
6
A6 statistics 2010.indd 7 10/25/10 4:15:23 PM
Health and safety statistics highlights 2005
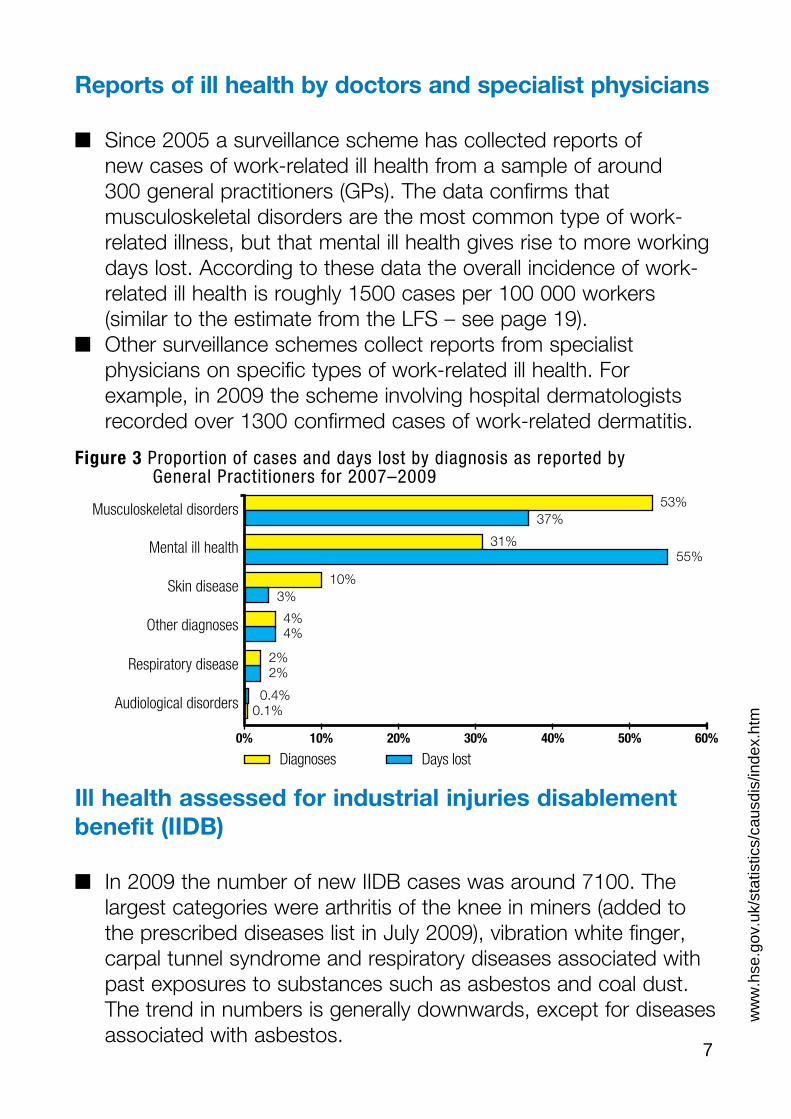
Reports of ill health by doctors and specialist physicians
■ Since 2005 a surveillance scheme has collected reports of new cases of work-related ill health from a sample of around 300 general practitioners (GPs). The data confirms that musculoskeletal disorders are the most common type of work-related illness, but that mental ill health gives rise to more working days lost. According to these data the overall incidence of work-related ill health is roughly 1500 cases per 100 000 workers (similar to the estimate from the LFS – see page 19).
■ Other surveillance schemes collect reports from specialist physicians on specific types of work-related ill health. For example, in 2009 the scheme involving hospital dermatologists recorded over 1300 confirmed cases of work-related dermatitis.
Figure 3 Proportion of cases and days lost by diagnosis as reported by General Practitioners for 2007–2009
Musculoskeletal disorders
Mental ill health
Skin disease
Other diagnoses
Respiratory disease
Audiological disorders 0.1%
2% 2%
4% 4%
0.4%
10% 3%
31% 55%
53% 37%
0% 10% 20% 30% 40% 50% 60%
Diagnoses Days lost
Ill health assessed for industrial injuries disablement benefit (IIDB)
■ In 2009 the number of new IIDB cases was around 7100. The largest categories were arthritis of the knee in miners (added to the prescribed diseases list in July 2009), vibration white finger, carpal tunnel syndrome and respiratory diseases associated with past exposures to substances such as asbestos and coal dust. The trend in numbers is generally downwards, except for diseases associated with asbestos.
7
ww
w.h
se.g
ov.u
k/st
atis
tics/
caus
dis/
inde
x.ht
m
A6 statistics 10.indd 8 10/22/10 1:21:19 PM
Health and safety statistics highlights 2005
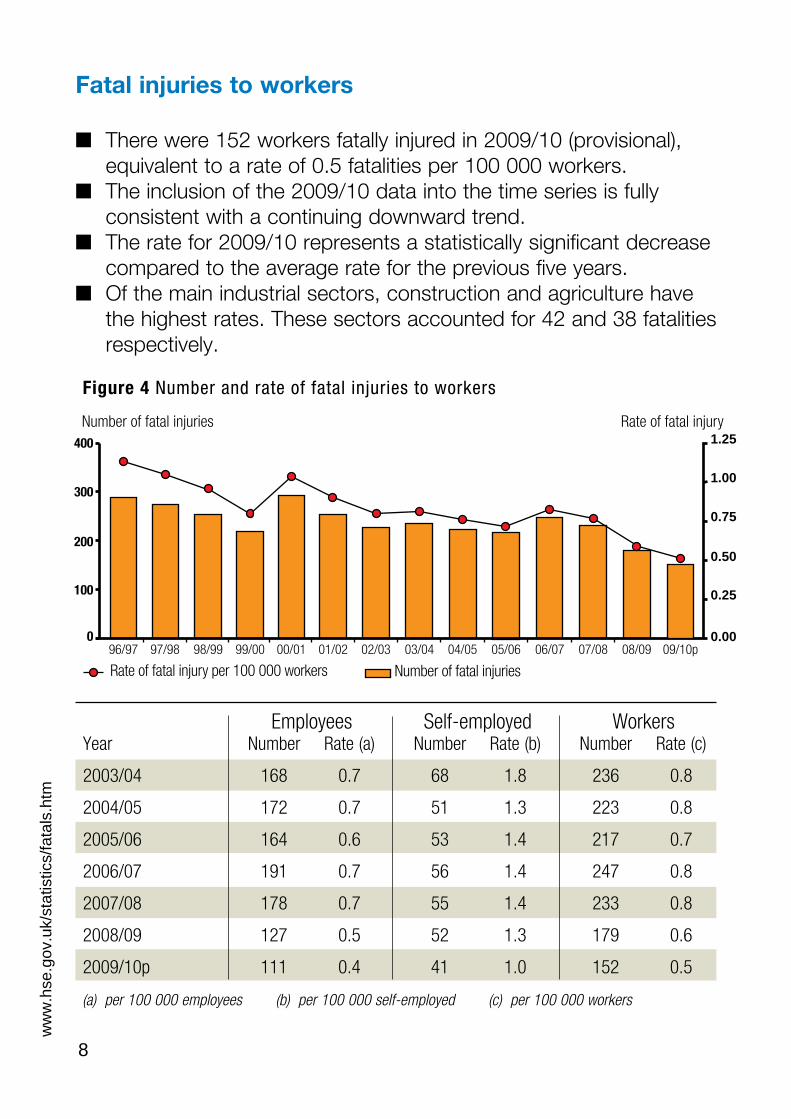
Fatal injuries to workers
■ There were 152 workers fatally injured in 2009/10 (provisional), equivalent to a rate of 0.5 fatalities per 100 000 workers.
■ The inclusion of the 2009/10 data into the time series is fully consistent with a continuing downward trend.
■ The rate for 2009/10 represents a statistically significant decrease compared to the average rate for the previous five years.
■ Of the main industrial sectors, construction and agriculture have the highest rates. These sectors accounted for 42 and 38 fatalities respectively.
Figure 4 Number and rate of fatal injuries to workers
Number of fatal injuries Rate of fatal injury 1.25 400
1.00 300
0.75
200 0.50
100 0.25
0 0.00 96/97 97/98 98/99 99/00 00/01 01/02 02/03 03/04 04/05 05/06 06/07 07/08 08/09 09/10p
Rate of fatal injury per 100 000 workers Number of fatal injuries
ww
w.h
se.g
ov.u
k/st
atis
tics/
fata
ls.h
tm
Employees Self-employed Workers Year Number Number Number
2003/04 168 0.7 68 1.8 236 0.8
2004/05 172 0.7 51 1.3 223 0.8
2005/06 164 0.6 53 1.4 217 0.7
2006/07 191 0.7 56 1.4 247 0.8
2007/08 178 0.7 55 1.4 233 0.8
2008/09 127 0.5 52 1.3 179 0.6
2009/10p 111 0.4 41 1.0 152 0.5
Rate (a) Rate (b) Rate (c)
(a) per 100 000 employees (b) per 100 000 self-employed (c) per 100 000 workers
8
A6 statistics 2010.indd 9 10/25/10 4:15:54 PM
Health and safety statistics highlights 2005Health and safety statistics highlights 2005Health and safety statistics highlights 2005
0
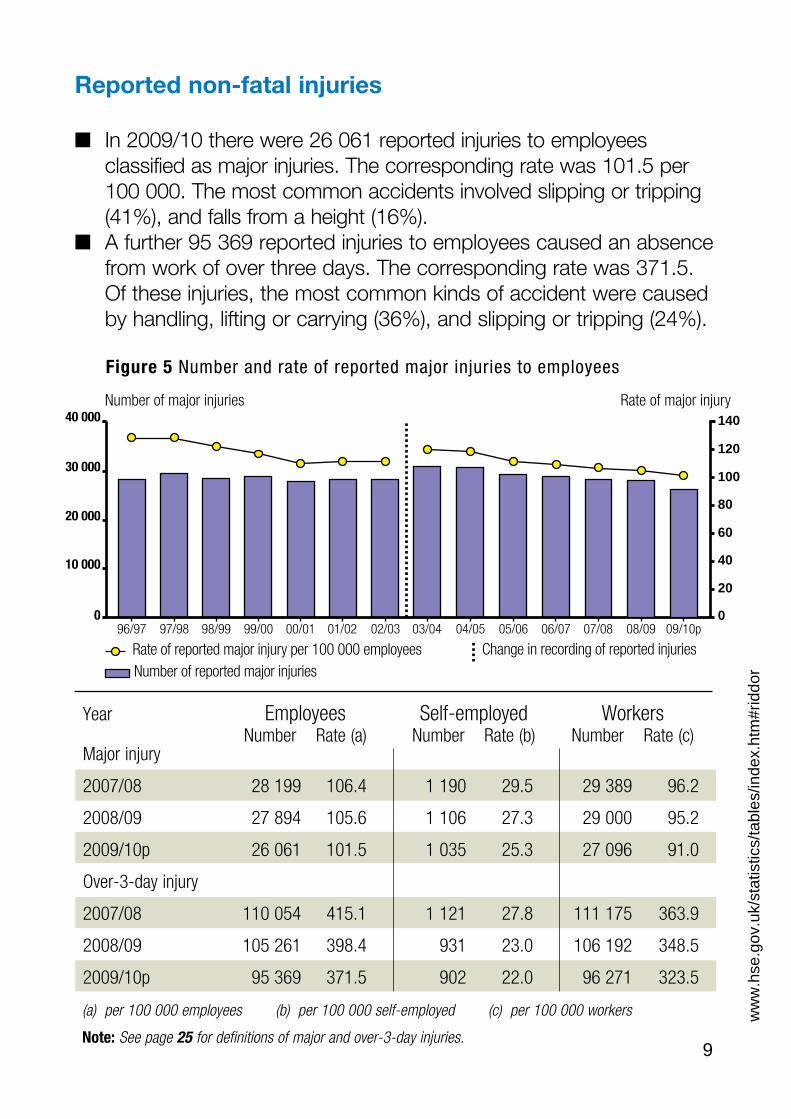
Reported non-fatal injuries
■ In 2009/10 there were 26 061 reported injuries to employees classified as major injuries. The corresponding rate was 101.5 per 100 000. The most common accidents involved slipping or tripping (41%), and falls from a height (16%).
■ A further 95 369 reported injuries to employees caused an absence from work of over three days. The corresponding rate was 371.5. Of these injuries, the most common kinds of accident were caused by handling, lifting or carrying (36%), and slipping or tripping (24%).
Figure 5 Number and rate of reported major injuries to employees
Number of major injuries Rate of major injury 40 000 140
120 30 000
100
80 20 000
60
40 10 000
20
0 96/97 97/98 98/99 99/00 00/01 01/02 02/03 03/04 04/05 05/06 06/07 07/08 08/09 09/10p
Rate of reported major injury per 100 000 employees Change in recording of reported injuries Number of reported major injuries
ww
w.h
se.g
ov.u
k/st
atis
tics/
tabl
es/in
dex.
htm
#rid
dor
2007/08 106.4 29.5 96.2
2008/09 105.6 27.3 95.2
2009/10p 101.5 25.3 91.0
2007/08 415.1 27.8 363.9
2008/09 398.4 931 23.0 348.5
2009/10p 371.5 902 22.0 323.5
Major injury
28 199 1 190 29 389
27 894 1 106 29 000
26 061 1 035 27 096
Over-3-day injury
110 054 1 121 111 175
105 261 106 192
95 369 96 271
(a) per 100 000 employees (b) per 100 000 self-employed (c) per 100 000 workers
Note: See page 25 for definitions of major and over-3-day injuries. 9
Year Employees Self-employed Workers Number Rate (a) Number Rate (b) Number Rate (c)
A6 statistics 2010.indd 10 10/25/10 4:16:24 PM
Health and safety statistics highlights 2005
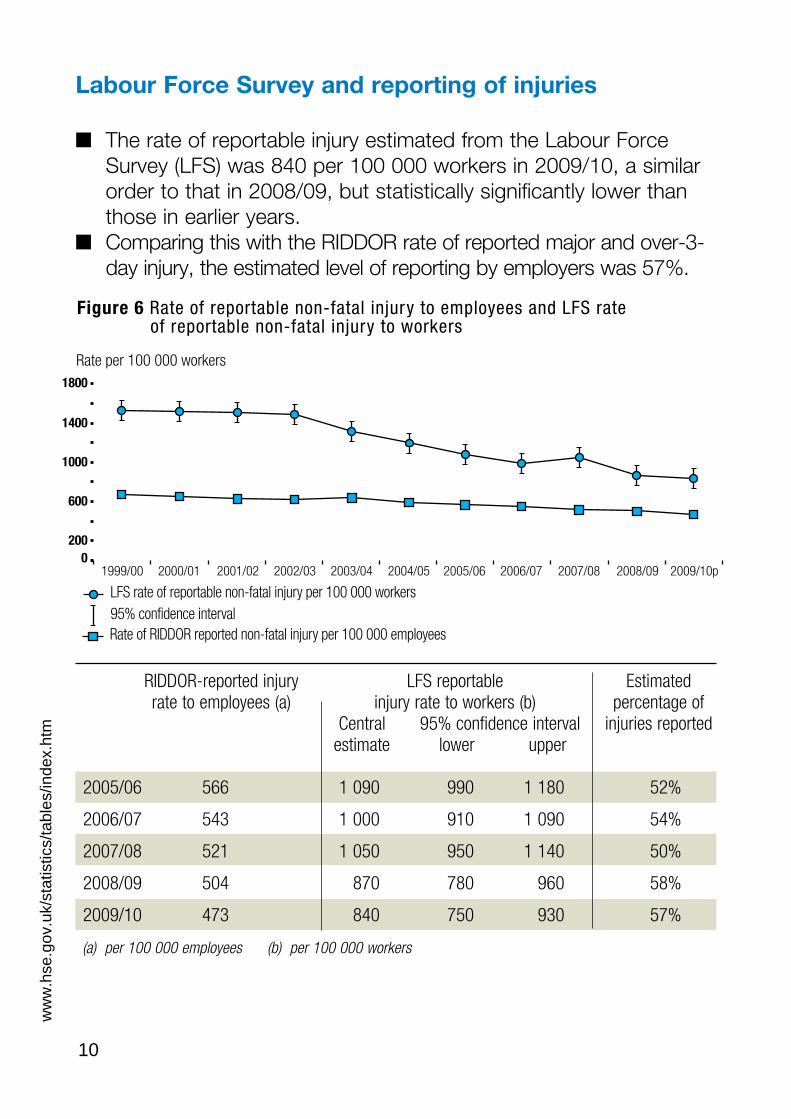
Labour Force Survey and reporting of injuries
■ The rate of reportable injury estimated from the Labour Force Survey (LFS) was 840 per 100 000 workers in 2009/10, a similar order to that in 2008/09, but statistically significantly lower than those in earlier years.
■ Comparing this with the RIDDOR rate of reported major and over-3day injury, the estimated level of reporting by employers was 57%.
Figure 6 Rate of reportable non-fatal injury to employees and LFS rate of reportable non-fatal injury to workers
Rate per 100 000 workers
LFS rate of reportable non-fatal injury per 100 000 workers 95% confidence interval Rate of RIDDOR reported non-fatal injury per 100 000 employees
1800
1400
1000
600
200 0
1999/00 2000/01 2001/02 2002/03 2003/04 2004/05 2005/06 2006/07 2007/08 2008/09 2009/10p
ww
w.h
se.g
ov.u
k/st
atis
tics/
tabl
es/in
dex.
htm
Estimated
Central estimate lower upper
2005/06 566 990 52%
2006/07 543 910 54%
2007/08 521 950 50%
2008/09 504 870 780 960 58%
2009/10 473 840 750 930 57%
RIDDOR-reported injury LFS reportable rate to employees (a) injury rate to workers (b) percentage of
95% confidence interval injuries reported
1 090 1 180
1 000 1 090
1 050 1 140
(a) per 100 000 employees (b) per 100 000 workers
10
A6 statistics 2010.indd 11 10/25/10 4:16:52 PM
Health and safety statistics highlights 2005
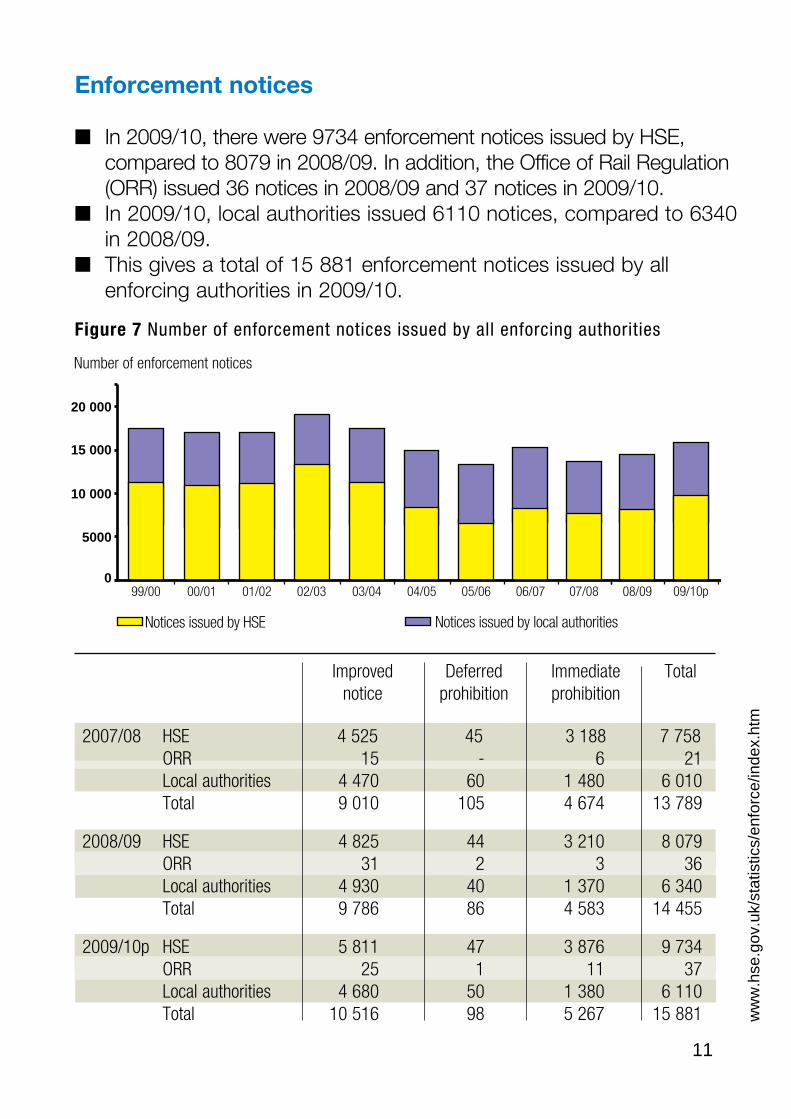
Enforcement notices
■ In 2009/10, there were 9734 enforcement notices issued by HSE, compared to 8079 in 2008/09. In addition, the Office of Rail Regulation (ORR) issued 36 notices in 2008/09 and 37 notices in 2009/10.
■ In 2009/10, local authorities issued 6110 notices, compared to 6340 in 2008/09.
■ This gives a total of 15 881 enforcement notices issued by all enforcing authorities in 2009/10.
Figure 7 Number of enforcement notices issued by all enforcing authorities
Number of enforcement notices
20 000
15 000
10 000
5000
0 99/00 00/01 01/02 02/03 03/04 04/05 05/06 06/07 07/08 08/09 09/10p
Notices issued by HSE Notices issued by local authorities
ww
w.h
se.g
ov.u
k/st
atis
tics/
enfo
rce/
inde
x.ht
m
Improved Deferred Immediate Total notice prohibition prohibition
HSE 45 ORR 15 - 6 21
60 Total 105
2008/09 HSE 44 ORR 31 2 3 36
40 Total 86
2009/10p HSE 47 ORR 25 1 11 37
50 Total 98
2007/08 4 525 3 188 7 758
Local authorities 4 470 1 480 6 010 9 010 4 674 13 789
4 825 3 210 8 079
Local authorities 4 930 1 370 6 340 9 786 4 583 14 455
5 811 3 876 9 734
Local authorities 4 680 1 380 6 110 10 516 5 267 15 881
11
A6 statistics 2010.indd 12 10/25/10 4:17:24 PM
Health and safety statistics highlights 2005
Health and safety statistics highlights 2005
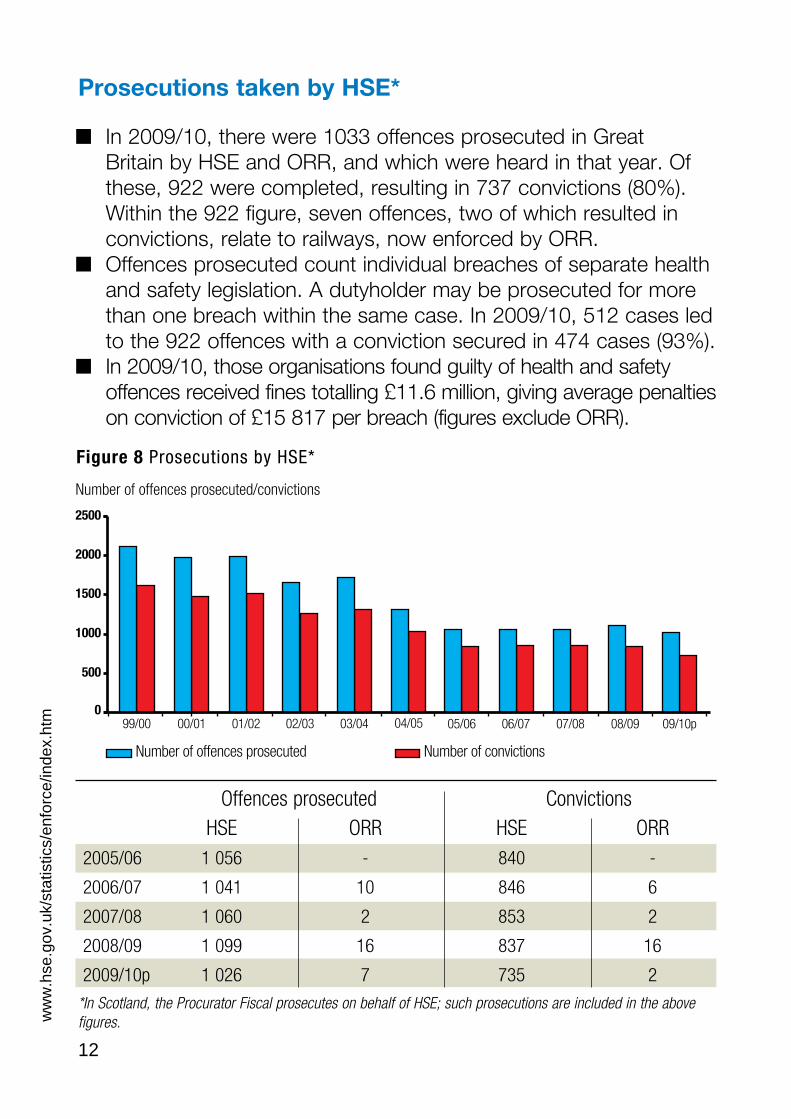
Prosecutions taken by HSE*
■ In 2009/10, there were 1033 offences prosecuted in Great Britain by HSE and ORR, and which were heard in that year. Of these, 922 were completed, resulting in 737 convictions (80%). Within the 922 figure, seven offences, two of which resulted in convictions, relate to railways, now enforced by ORR.
■ Offences prosecuted count individual breaches of separate health and safety legislation. A dutyholder may be prosecuted for more than one breach within the same case. In 2009/10, 512 cases led to the 922 offences with a conviction secured in 474 cases (93%).
■ In 2009/10, those organisations found guilty of health and safety offences received fines totalling £11.6 million, giving average penalties on conviction of £15 817 per breach (figures exclude ORR).
Figure 8 Prosecutions by HSE*
Number of offences prosecuted/convictions
2500
2000
1500
1000
500
0
Convictions HSE ORR HSE ORR
2005/06 - 840 -
2006/07 10 846 6
2007/08 2 853 2
2008/09 16 837 16
2009/10p 7 735 2
ww
w.h
se.g
ov.u
k/st
atis
tics/
enfo
rce/
inde
x.ht
m
Offences prosecuted
1 056
1 041
1 060
1 099
1 026
*In Scotland, the Procurator Fiscal prosecutes on behalf of HSE; such prosecutions are included in the above figures.
12
99/00 00/01 01/02 02/03 03/04 04/05 05/06 06/07 07/08 08/09 09/10p
Number of offences prosecuted Number of convictions
A6 statistics 2010.indd 13 10/25/10 4:17:55 PM
Health and safety statistics highlights 2005
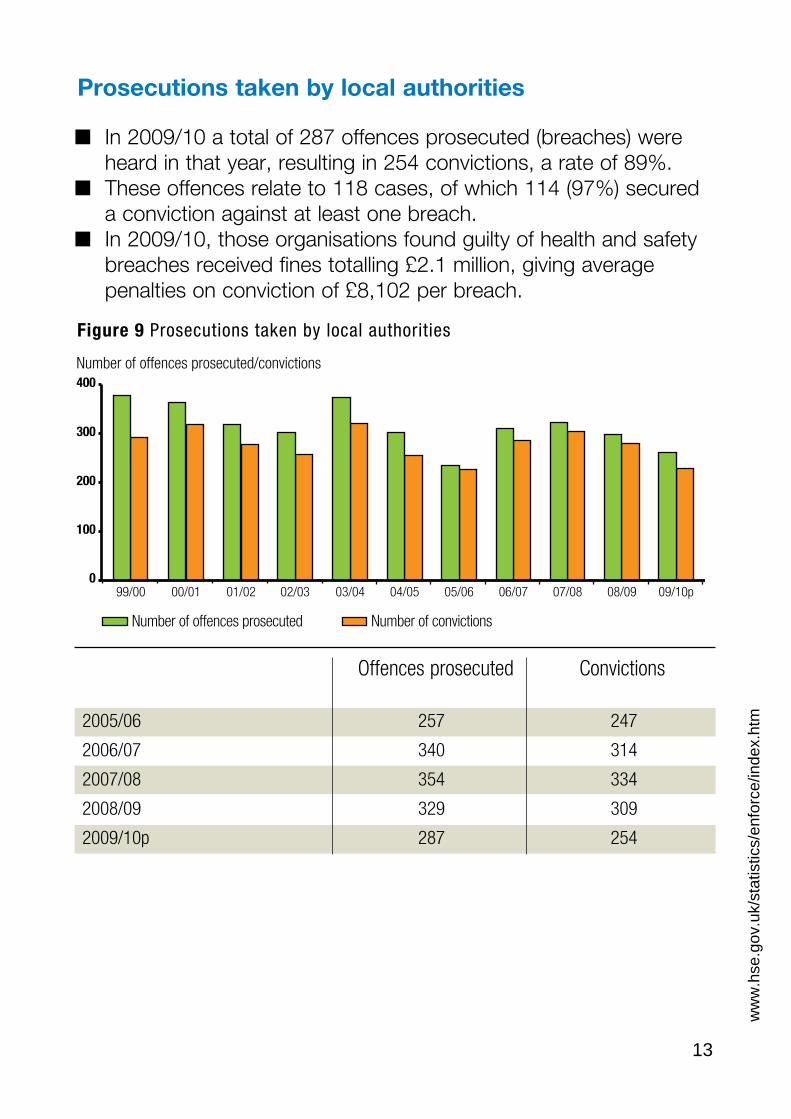
Prosecutions taken by local authorities
■ In 2009/10 a total of 287 offences prosecuted (breaches) were heard in that year, resulting in 254 convictions, a rate of 89%.
■ These offences relate to 118 cases, of which 114 (97%) secured a conviction against at least one breach.
■ In 2009/10, those organisations found guilty of health and safety breaches received fines totalling £2.1 million, giving average penalties on conviction of £8,102 per breach.
Figure 9 Prosecutions taken by local authorities
Number of offences prosecuted/convictions
99/00 00/01 01/02 02/03 03/04 04/05 05/06 06/07 07/08 08/09 09/10p
Number of offences prosecuted Number of convictions
400
300
200
100
0
Convictions
2005/06 257 247
2006/07 340 314
2007/08 354 334
2008/09 329 309
2009/10p 287 254
Offences prosecuted
ww
w.h
se.g
ov.u
k/st
atis
tics/
enfo
rce/
inde
x.ht
m
13
8919No
rth
Wes
t 1000
3900
3215 36
114124500
2056 41
4500
11323
York
shir
e an
dth
e H
umb
er11
0048
00
2635 27
10511Lo
ndo
n 560
3600
2433 35
11615So
uth
Eas
t 910
4600
3433 23
1089W
est
Mid
land
s92
040
00
2375 29
So
uth
Wes
t
8517
1000
4600
2207 22
347Wal
es95
046
00
1424 19
12410
Eas
t
Eas
tM
idla
nds
820
4300
2298 41
1000
A6 statistics 2010.indd 14 10/25/10 4:18:25 PM
ww
w.h
se.g
ov.u
k/st
atis
tics/
regi
ons/
inde
x.ht
m
14
Rat
e o
f se
lf-re
po
rted
ill h
ealth
p
reva
lenc
e p
er 1
00 0
00 p
eop
le e
mp
loye
d
in t
he la
st 1
2 m
ont
hs 2
009/
10 (L
FS
)
Rat
e o
f re
po
rtab
le in
jury
per
100
000
w
ork
ers,
200
8/09
(LF
S a
vera
ged
)
Num
ber
of
fata
l inj
urie
s to
wo
rker
sin
200
9/10
p (R
IDD
OR
)
Num
ber
of
maj
or
inju
ries
to
wo
rker
sin
200
9/10
p (R
IDD
OR
)
Off
ence
s p
rose
cute
d b
yH
SE
, 200
9/10
pS
cotl
and
3700
88
0O
ffen
ces
pro
secu
ted
by
loca
l aut
hori
ties,
200
9/10
23
2548
93
7
No
rth
Eas
t45
00
1300
3 12
19
35
7
Health and safety statistics highlights 2005
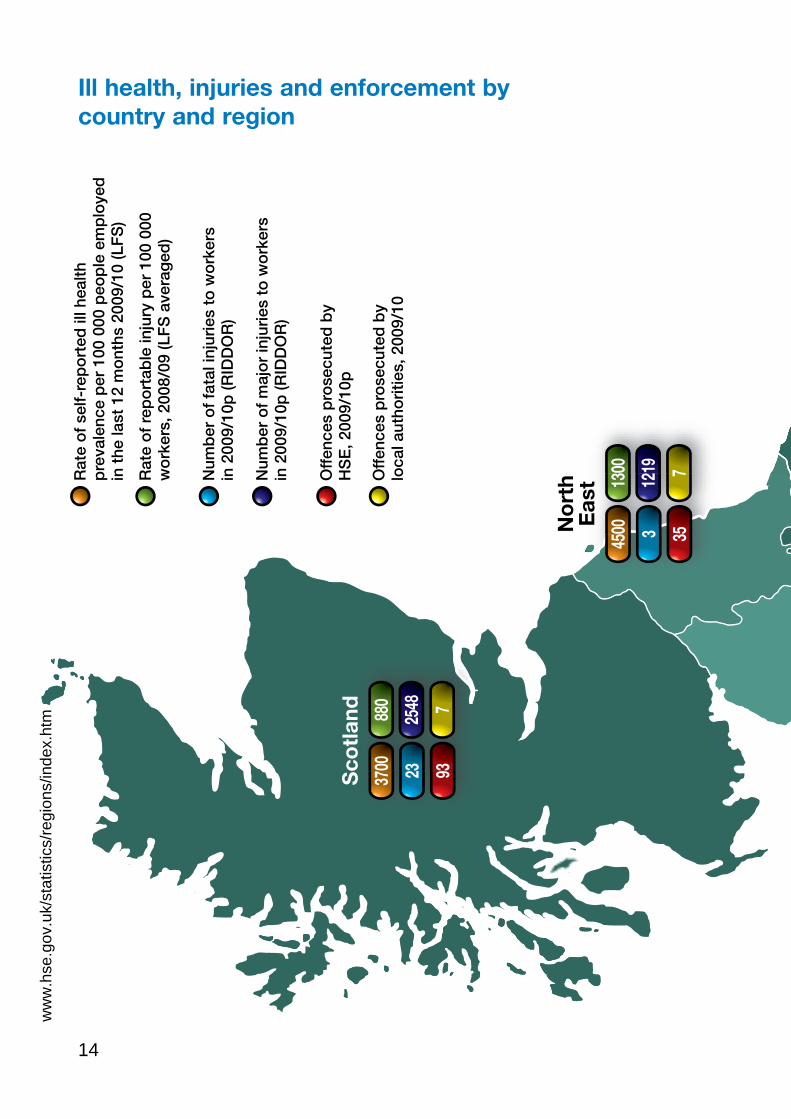
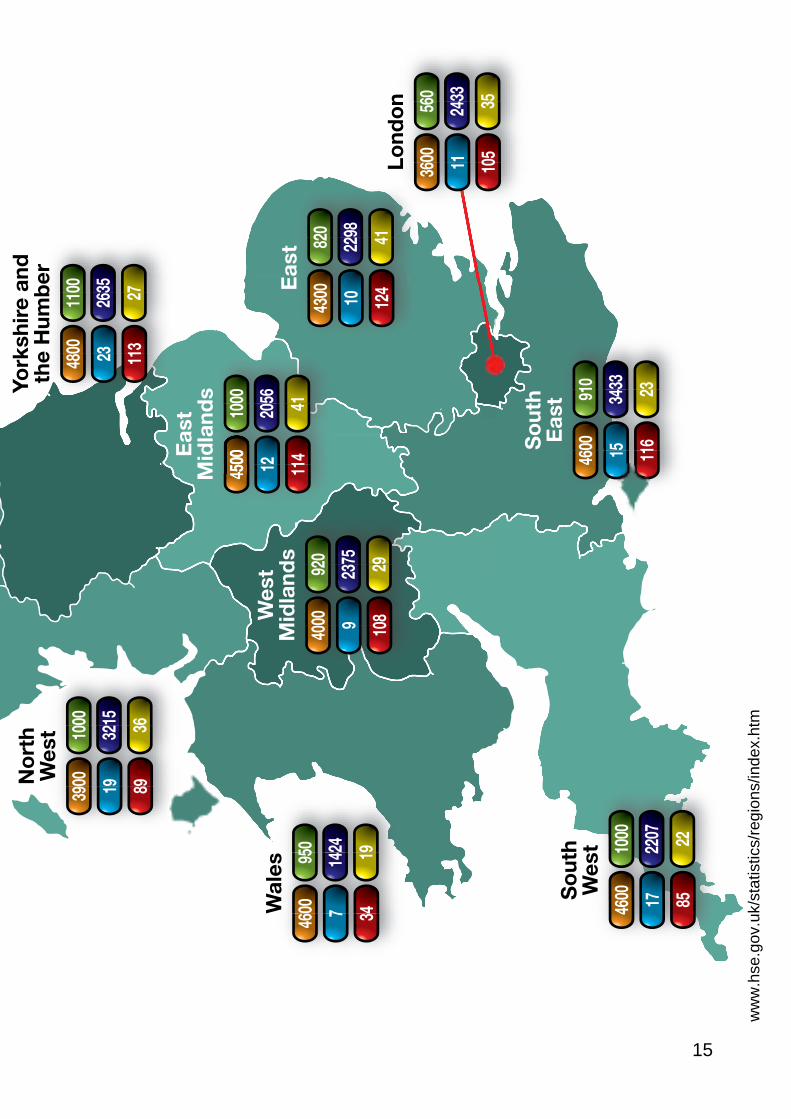
Ill health, injuries and enforcement by country and region
Rat
e o
f re
po
rtab
le in
jury
per
100
000
w
ork
ers,
200
8/09
(LF
S a
vera
ged
)
Rat
e o
f se
lf-re
po
rted
ill h
ealth
p
reva
lenc
e p
er 1
00 0
00 p
eop
le e
mp
loye
d
in t
he la
st 1
2 m
ont
hs 2
009/
10 (L
FS
)
353No
rth
Eas
t 1300
4500
1219 7
9323Sco
tlan
d88
037
00
2548 7
Num
ber
of
fata
l inj
urie
s to
wo
rker
s in
200
9/10
p (R
IDD
OR
)
Num
ber
of
maj
or
inju
ries
to
wo
rker
sin
200
9/10
p (R
IDD
OR
)
Off
ence
s p
rose
cute
d b
yH
SE
, 200
9/10
p
Off
ence
s p
rose
cute
d b
y lo
cal a
utho
ritie
s, 2
009/
10
A6 statistics 2010.indd 15 10/25/10 4:18:56 PM
York
shir
e an
dN
ort
hth
e H
umb
erW
est
4800
11
0039
00
1000
23
2635
19
3215
113
27
89
36
Eas
tM
idla
nds
4500
10
0045
00
Wes
t12
20
56W
ales
Mid
land
sE
ast
114
41
4600
95
040
00
920
4300
82
07
1424
9 23
7510
22
9834
19
10
8 29
12
4 41
Lo
ndo
n36
00
560
11
2433
105
35
So
uth
Eas
tS
out
h46
00
910
Wes
t15
34
3346
00
1000
11
6 23
17
22
07
85
22
ww
w.h
se.g
ov.u
k/st
atis
tics/
regi
ons/
inde
x.ht
m
15
A6 statistics 2010.indd 16 10/25/10 4:19:32 PM
3050
3400
2050
5690
4910
4190
3760
3580
3640
Health and safety statistics highlights 2005
ww
w.h
se.g
ov.u
k/st
atis
tics/
indu
stry
/inde
x.ht
m
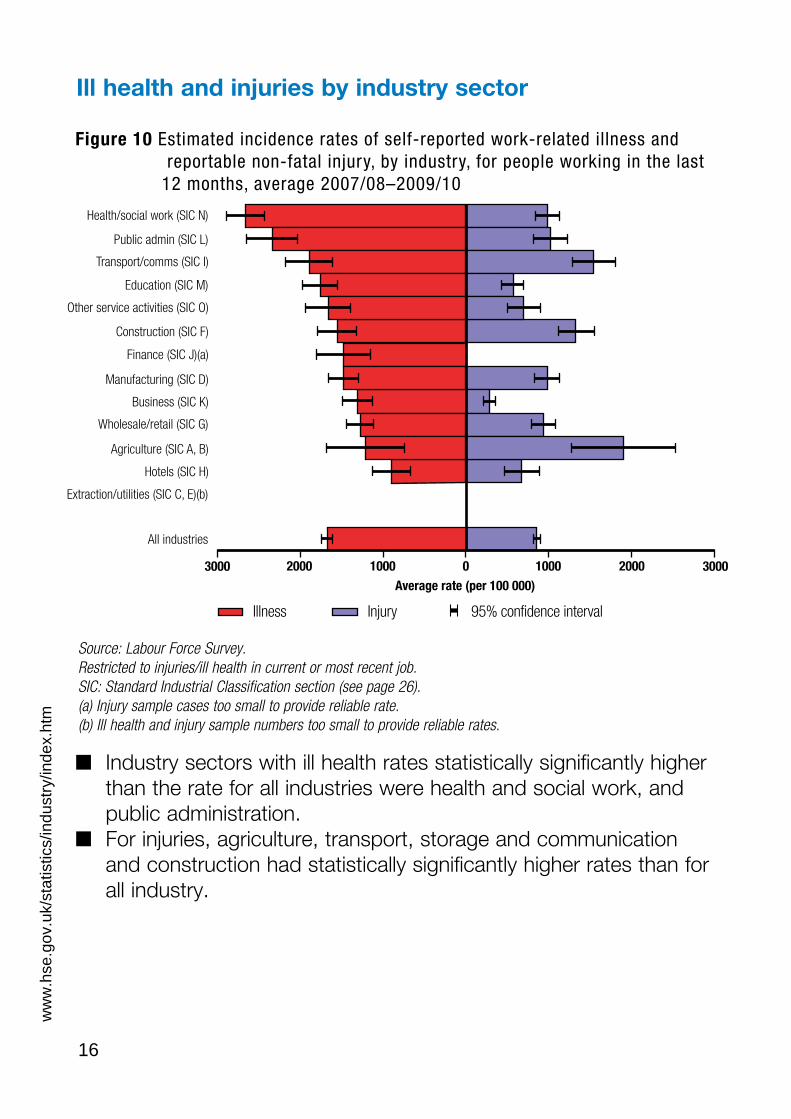
Ill health and injuries by industry sector
Figure 10 Estimated incidence rates of self-reported work-related illness and reportable non-fatal injury, by industry, for people working in the last
12 months, average 2007/08–2009/10
Health/social work (SIC N)
Public admin (SIC L)
Transport/comms (SIC I)
Education (SIC M)
Other service activities (SIC O)
Construction (SIC F)
Finance (SIC J)(a)
Manufacturing (SIC D)
Business (SIC K)
Wholesale/retail (SIC G)
Agriculture (SIC A, B)
Hotels (SIC H)
Extraction/utilities (SIC C, E)(b)
All industries
3000 2000 1000 0 1000 2000 Average rate (per 100 000)
Illness Injury 95% confidence interval
Source: Labour Force Survey. Restricted to injuries/ill health in current or most recent job. SIC: Standard Industrial Classification section (see page 26). (a) Injury sample cases too small to provide reliable rate. (b) Ill health and injury sample numbers too small to provide reliable rates.
■ Industry sectors with ill health rates statistically significantly higher than the rate for all industries were health and social work, and public administration.
■ For injuries, agriculture, transport, storage and communication and construction had statistically significantly higher rates than for all industry.
16
3000
3050
3400
4910
4190
3760
3580
3640
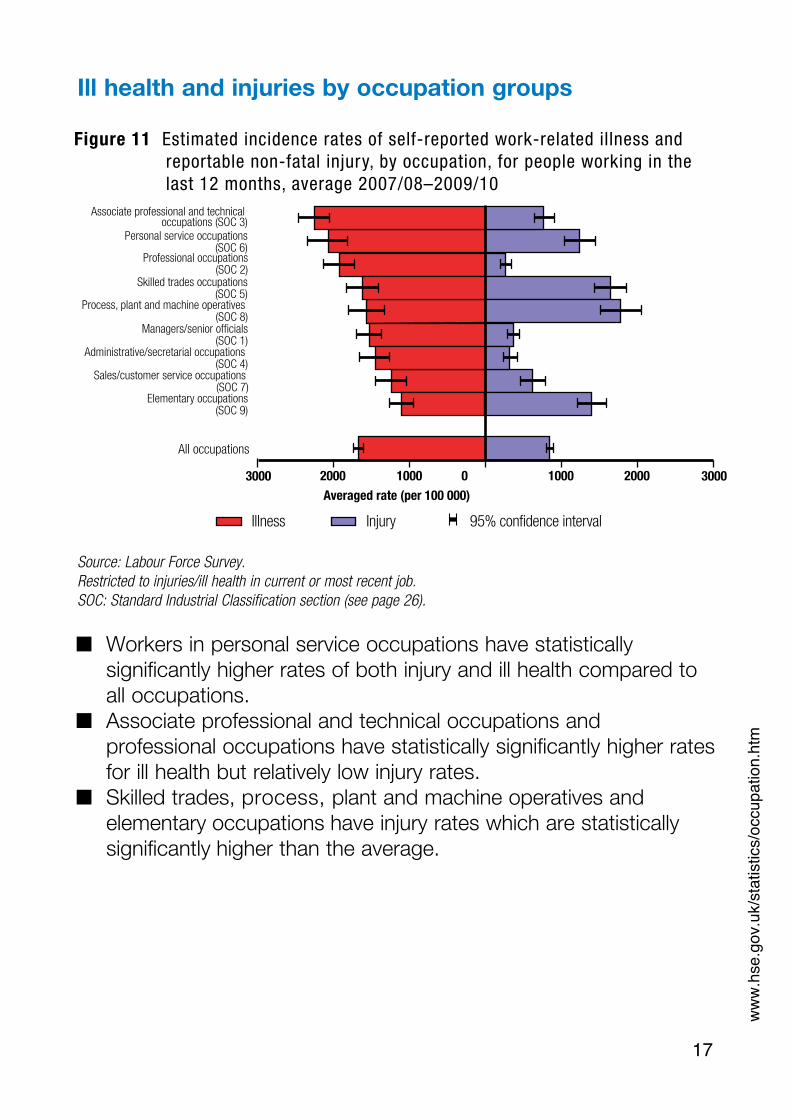
Ill health and injuries by occupation groups
Figure 11 Estimated incidence rates of self-reported work-related illness and reportable non-fatal injury, by occupation, for people working in the last 12 months, average 2007/08–2009/10
Associate professional and technicaloccupations (SOC 3)
Personal service occupations (SOC 6)
Professional occupations (SOC 2)
Skilled trades occupations (SOC 5)
Process, plant and machine operatives (SOC 8)
Managers/senior officials (SOC 1)
Administrative/secretarial occupations (SOC 4)
Sales/customer service occupations (SOC 7)
Elementary occupations (SOC 9)
All occupations
3000 2000 1000 0 1000 2000 3000 Averaged rate (per 100 000)
Illness Injury 95% confidence interval
Source: Labour Force Survey. Restricted to injuries/ill health in current or most recent job. SOC: Standard Industrial Classification section (see page 26).
■ Workers in personal service occupations have statistically significantly higher rates of both injury and ill health compared to all occupations.
■ Associate professional and technical occupations and professional occupations have statistically significantly higher rates for ill health but relatively low injury rates.
■ Skilled trades, process, plant and machine operatives and elementary occupations have injury rates which are statistically significantly higher than the average.
ww
w.h
se.g
ov.u
k/st
atis
tics/
occu
patio
n.ht
m
17
A6 statistics 2010.indd 18 10/25/10 4:20:29 PM
Health and safety statistics highlights 2005
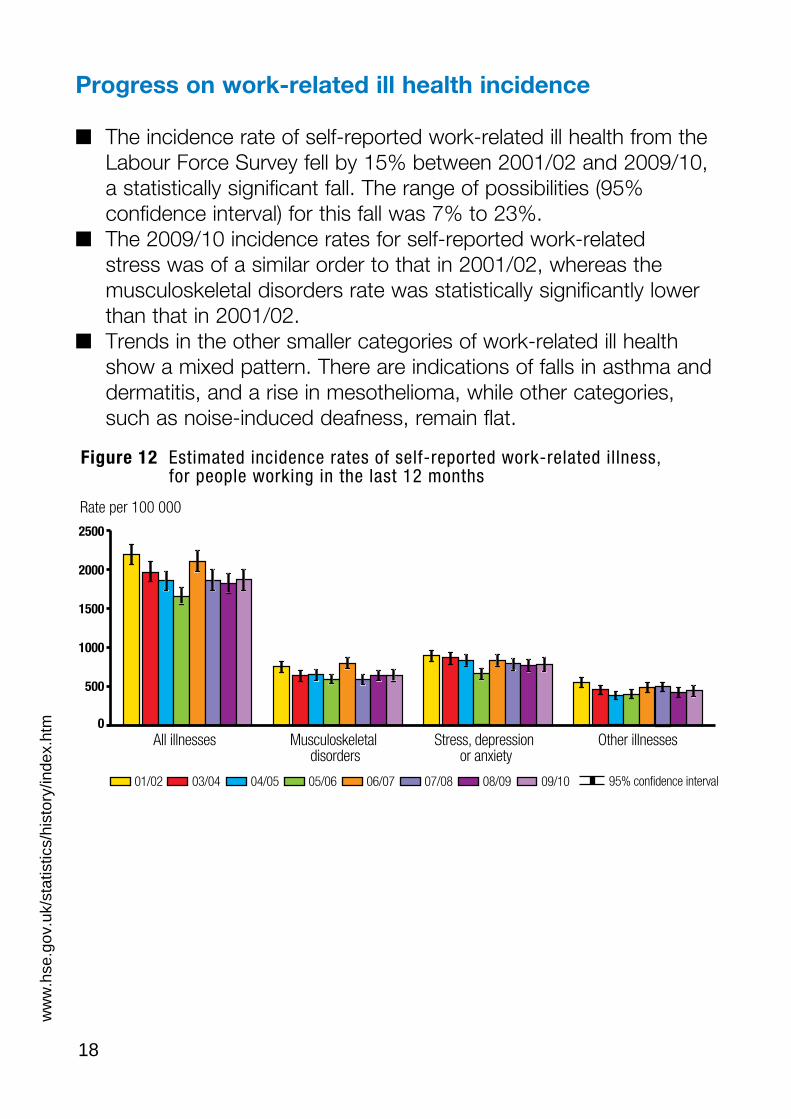
Progress on work-related ill health incidence
■ The incidence rate of self-reported work-related ill health from the Labour Force Survey fell by 15% between 2001/02 and 2009/10, a statistically significant fall. The range of possibilities (95% confidence interval) for this fall was 7% to 23%.
■ The 2009/10 incidence rates for self-reported work-related stress was of a similar order to that in 2001/02, whereas the musculoskeletal disorders rate was statistically significantly lower than that in 2001/02.
■ Trends in the other smaller categories of work-related ill health show a mixed pattern. There are indications of falls in asthma and dermatitis, and a rise in mesothelioma, while other categories, such as noise-induced deafness, remain flat.
Figure 12 Estimated incidence rates of self-reported work-related illness, for people working in the last 12 months
Rate per 100 000
All i lnesses l l l Stress, depress on i Other nesses l Muscu oske eta ill di sorders or anx ety i
fi i95% con dence nterva l/01 02 /03 04 /04 05 /05 06 /06 07 /07 08 /08 09 /09 10
ww
w.h
se.g
ov.u
k/st
atis
tics/
hist
ory/
inde
x.ht
m 0
500
1000
1500
2000
2500
18
A6 statistics 2010.indd 19 10/25/10 3:35:25 PM
Health and safety statistics highlights 2005
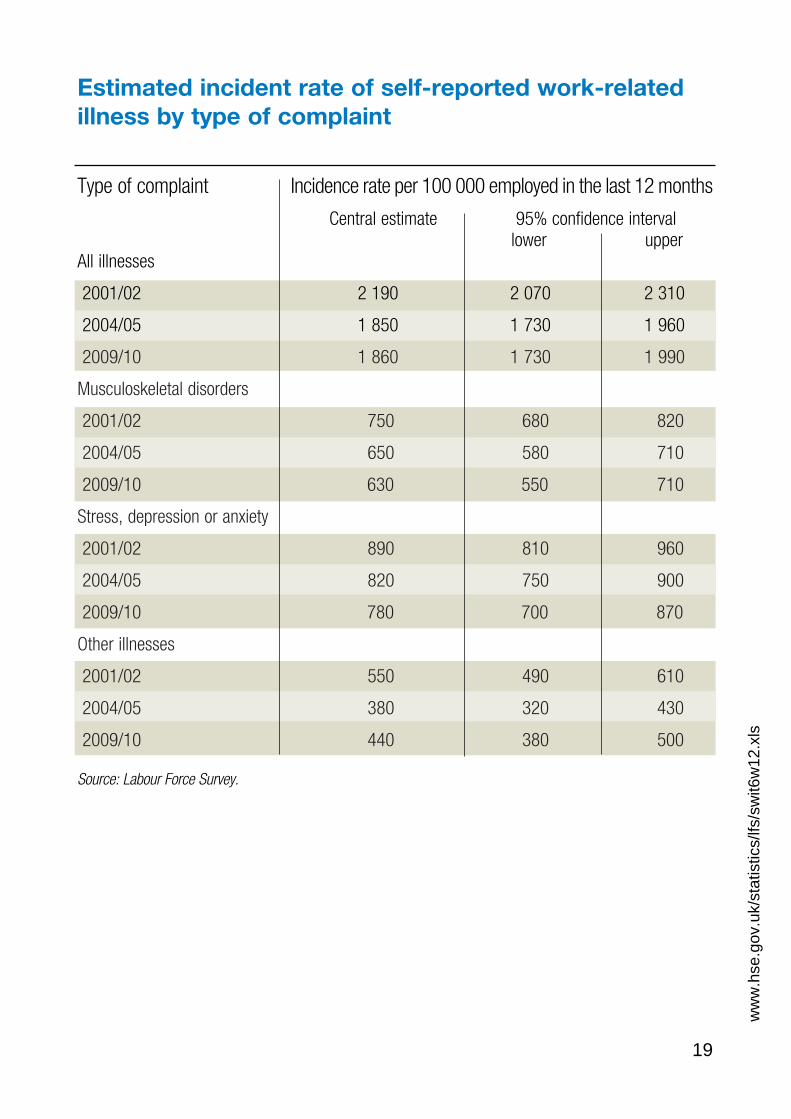
Estimated incident rate of self-reported work-related illness by type of complaint
Type of comp lai nt
All illnesses
2001/02
2004/05
2009/10
Musculoskeletal disorders
2001/02
2004/05
2009/10
Stress, depression or anxiety
2001/02
2004/05
2009/10
Other illnesses
2001/02
2004/05
2009/10
Source: Labour Force Survey.
Inc dence rate per 100 000 emp oyed n the ast 12 months i l i l
Central estimate 95% confidence interval lower upper
2 190 2 070 2 310
1 850 1 730 1 960
1 860 1 730 1 990
750 680 820
650 580 710
630 550 710
890 810 960
820 750 900
780 700 870
550 490 610
380 320 430
440 380 500 w
ww
.hse
.gov
.uk/
stat
istic
s/lfs
/sw
it6w
12.x
ls
19
A6 statistics 2010.indd 20 10/25/10 4:21:02 PM
Health and safety statistics highlights 2005
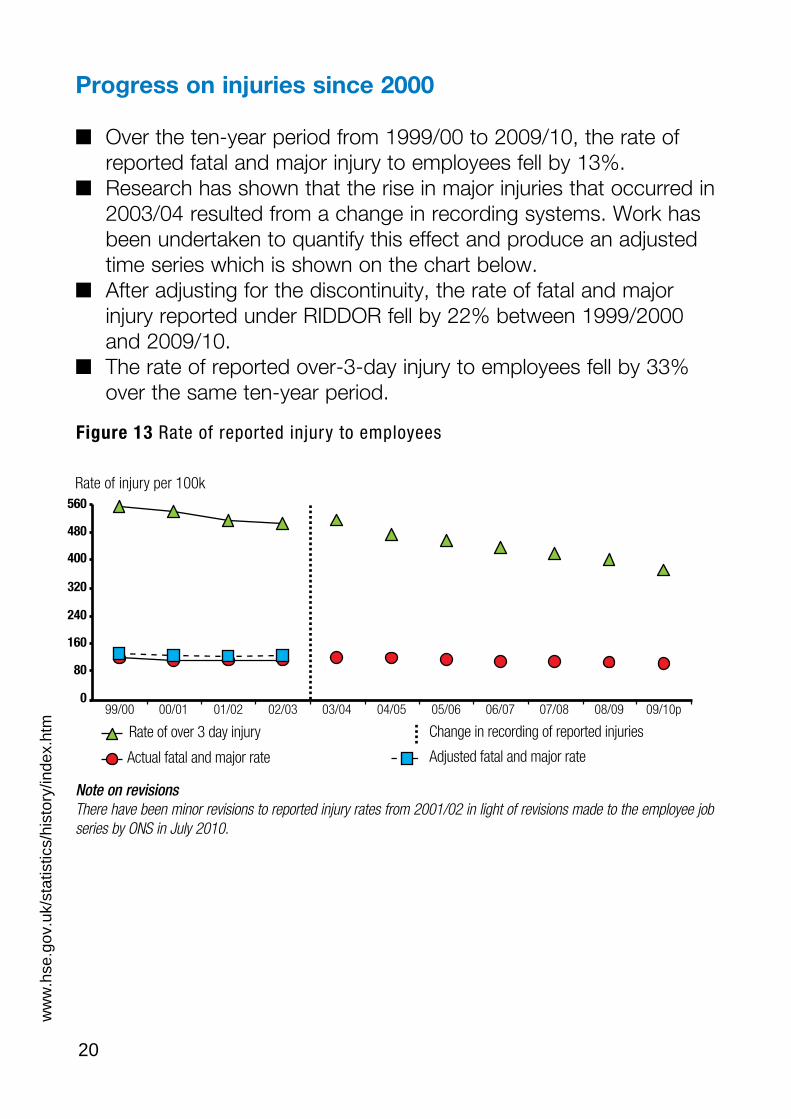
Progress on injuries since 2000
■ Over the ten-year period from 1999/00 to 2009/10, the rate of reported fatal and major injury to employees fell by 13%.
■ Research has shown that the rise in major injuries that occurred in 2003/04 resulted from a change in recording systems. Work has been undertaken to quantify this effect and produce an adjusted time series which is shown on the chart below.
■ After adjusting for the discontinuity, the rate of fatal and major injury reported under RIDDOR fell by 22% between 1999/2000 and 2009/10.
■ The rate of reported over-3-day injury to employees fell by 33% over the same ten-year period.
Figure 13 Rate of reported injury to employees
Rate of injury per 100k 560
480
400
320
240
160
80
0 99/00 00/01 01/02 02/03 03/04 04/05 05/06 06/07 07/08 08/09 09/10p
Rate of over 3 day injury Change in recording of reported injuries
Actual fatal and major rate Adjusted fatal and major rate
Note on revisions There have been minor revisions to reported injury rates from 2001/02 in light of revisions made to the employee job series by ONS in July 2010.
ww
w.h
se.g
ov.u
k/st
atis
tics/
hist
ory/
inde
x.ht
m
20
A6 statistics 2010.indd 21 10/25/10 4:21:26 PM
Health and safety statistics highlights 2005
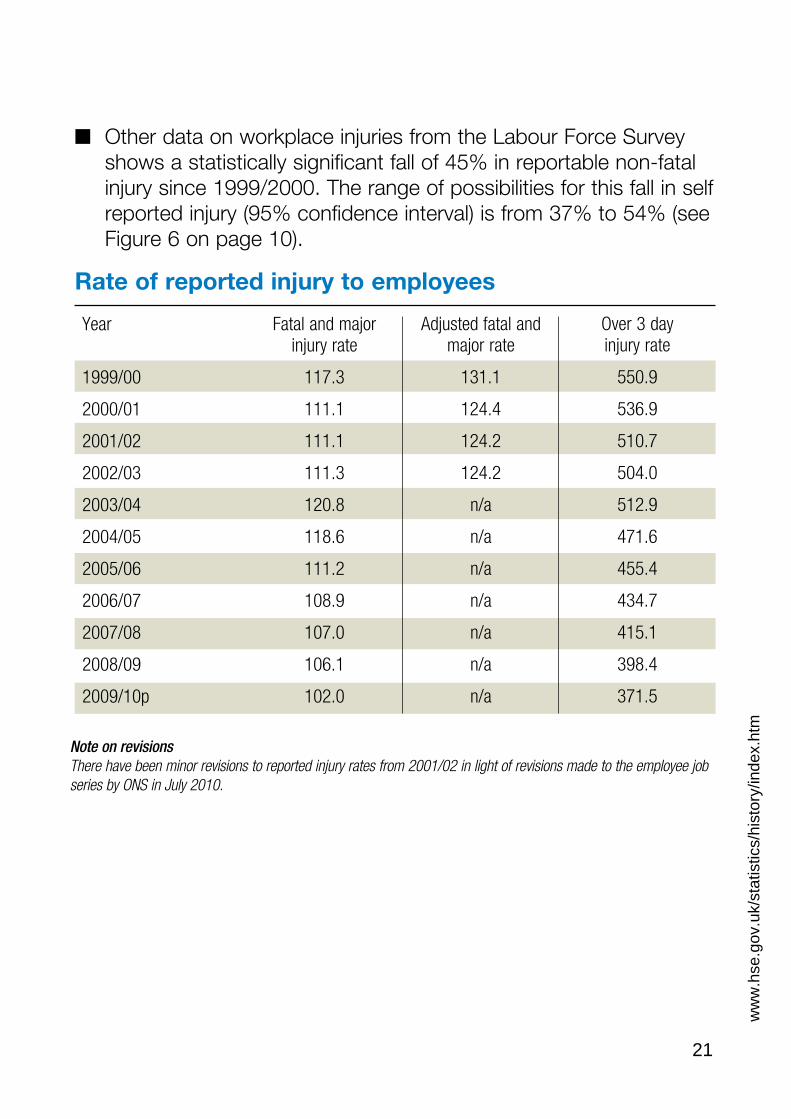
■ Other data on workplace injuries from the Labour Force Survey shows a statistically significant fall of 45% in reportable non-fatal injury since 1999/2000. The range of possibilities for this fall in self reported injury (95% confidence interval) is from 37% to 54% (see Figure 6 on page 10).
Rate of reported injury to employees
Year
1999/00
2000/01
2001/02
2002/03
2003/04
2004/05
2005/06
2006/07
2007/08
2008/09
2009/10p
117.3
111.1
111.1
111.3
120.8
118.6
111.2
108.9
107.0
106.1
102.0
131.1
124.4
124.2
124.2
n/a
n/a
n/a
n/a
n/a
n/a
n/a
550.9
536.9
510.7
504.0
512.9
471.6
455.4
434.7
415.1
398.4
371.5
Fatal and major injury rate
Adjusted fatal and major rate
Over 3 day injury rate
Note on revisions There have been minor revisions to reported injury rates from 2001/02 in light of revisions made to the employee job series by ONS in July 2010.
ww
w.h
se.g
ov.u
k/st
atis
tics/
hist
ory/
inde
x.ht
m
21
A6 statistics 2010.indd 22 10/25/10 3:34:48 PM
Health and safety statistics highlights 2005
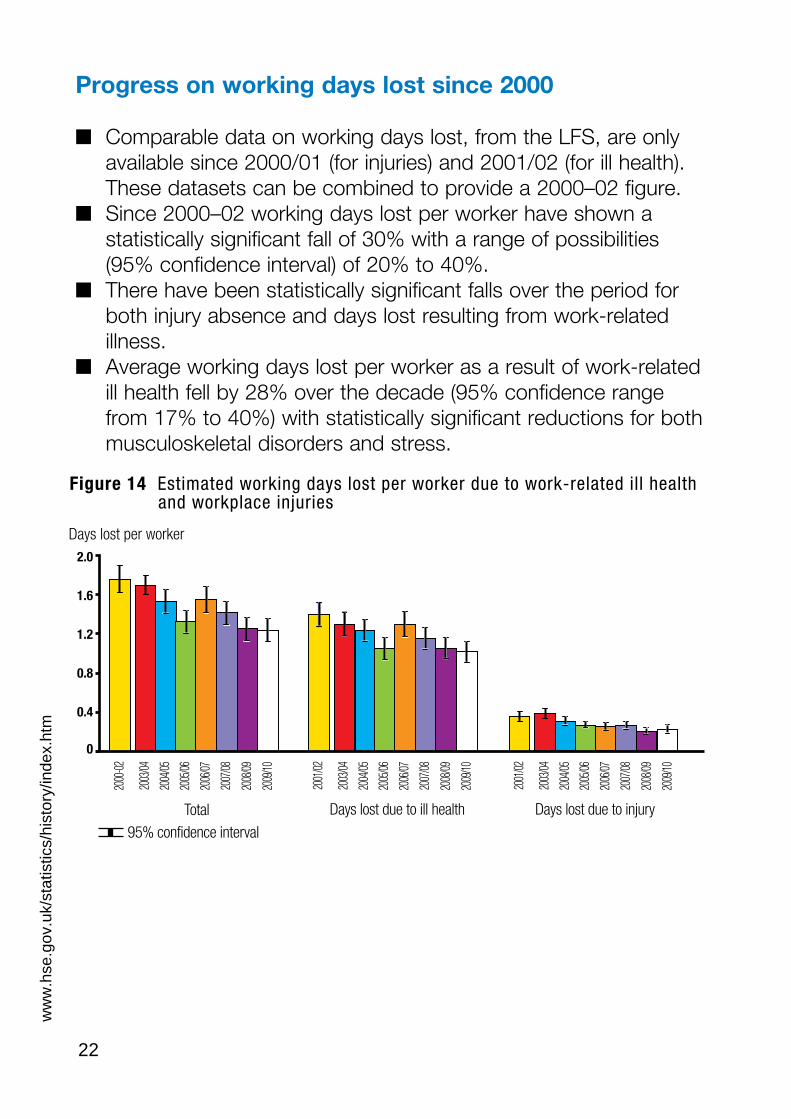
Progress on working days lost since 2000
■ Comparable data on working days lost, from the LFS, are only available since 2000/01 (for injuries) and 2001/02 (for ill health). These datasets can be combined to provide a 2000–02 figure.
■ Since 2000–02 working days lost per worker have shown a statistically significant fall of 30% with a range of possibilities (95% confidence interval) of 20% to 40%.
■ There have been statistically significant falls over the period for both injury absence and days lost resulting from work-related illness.
■ Average working days lost per worker as a result of work-related ill health fell by 28% over the decade (95% confidence range from 17% to 40%) with statistically significant reductions for both musculoskeletal disorders and stress.
Figure 14 Estimated working days lost per worker due to work-related ill health and workplace injuries
Days lost per worker
ww
w.h
se.g
ov.u
k/st
atis
tics/
hist
ory/
inde
x.ht
m
2.0
1.6
1.2
0.8
0.4
0
2000
-02
2003
/04
2004
/05
2005
/06
2006
/07
2007
/08
2008
/09
2009
/10
2001
/02
2003
/04
2004
/05
2005
/06
2006
/07
2007
/08
2008
/09
2009
/10
2001
/02
2003
/04
2004
/05
2005
/06
2006
/07
2007
/08
2008
/09
2009
/10
Total Days lost due to ill health Days lost due to injury
95% confidence interval
22
A6 statistics 2010.indd 23 10/25/10 3:34:18 PM
Health and safety statistics highlights 2005
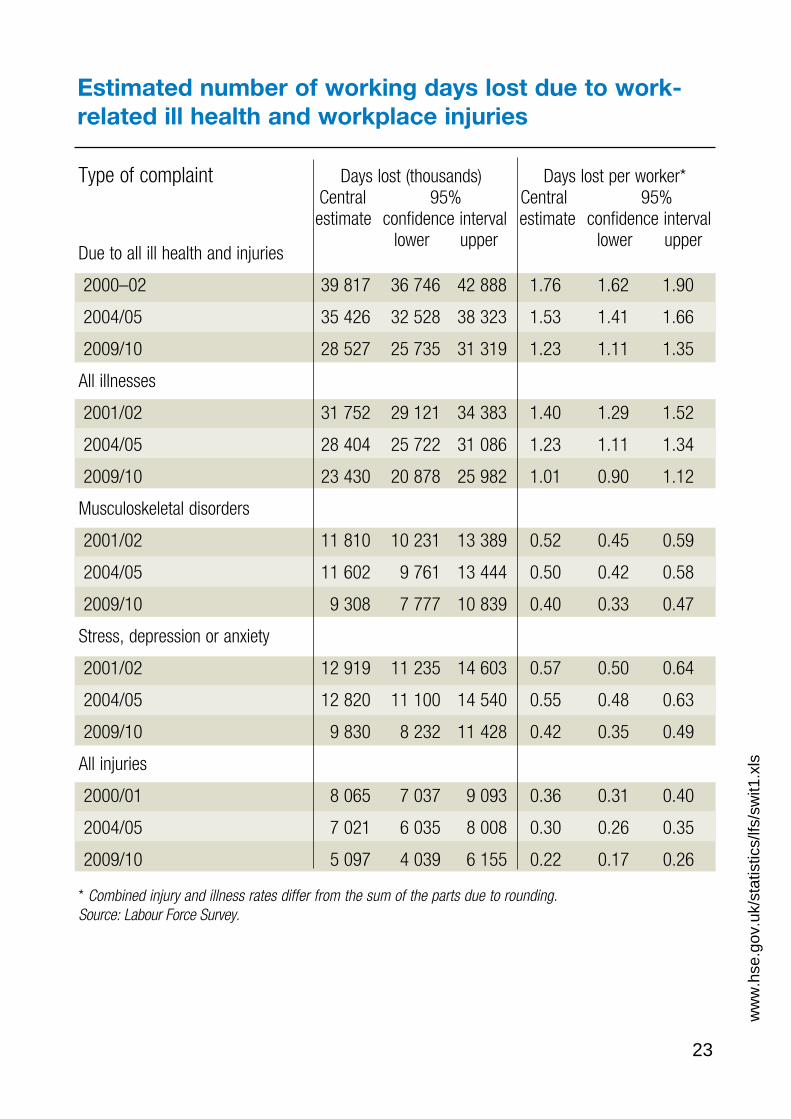
Estimated number of working days lost due to work-related ill health and workplace injuries
Type of complaint
Due to all ill health and injuries
2000–02
2004/05
2009/10
All illnesses
2001/02
2004/05
2009/10
Musculoskeletal disorders
2001/02
2004/05
2009/10
Stress, depression or anxiety
2001/02
2004/05
2009/10
All injuries
2000/01
2004/05
2009/10
Days lost (thousands) Central 95% estimate confidence interval
lower upper
39 817 36 746 42 888
35 426 32 528 38 323
28 527 25 735 31 319
31 752 29 121 34 383
28 404 25 722 31 086
23 430 20 878 25 982
11 810 10 231 13 389
11 602 9 761 13 444
9 308 7 777 10 839
12 919 11 235 14 603
12 820 11 100 14 540
9 830 8 232 11 428
8 065 7 037 9 093
7 021 6 035 8 008
5 097 4 039 6 155
Days lost per worker* Central 95% estimate confidence interval
lower upper
1.76 1.62 1.90
1.53 1.41 1.66
1.23 1.11 1.35
1.40 1.29 1.52
1.23 1.11 1.34
1.01 0.90 1.12
0.52 0.45 0.59
0.50 0.42 0.58
0.40 0.33 0.47
0.57 0.50 0.64
0.55 0.48 0.63
0.42 0.35 0.49
0.36 0.31 0.40
0.30 0.26 0.35
0.22 0.17 0.26
* Combined injury and illness rates differ from the sum of the parts due to rounding. Source: Labour Force Survey.
ww
w.h
se.g
ov.u
k/st
atis
tics/
lfs/s
wit1
.xls
23
A6 statistics 10.indd 24 10/22/10 1:28:09 PM
Health and safety statistics highlights 2005
ww
w.h
se.g
ov.u
k/st
atis
tics/
sour
ces.
htm
Sources and definitions
The Labour Force Survey (LFS): A national survey of over 50 000 households each quarter which provides information on the UK labour market. HSE commissions annual questions in the LFS to gain a view of work-related illness and workplace injury based on individuals’ perceptions. The analysis and interpretation of these data are the sole responsibility of HSE. Further details about the LFS, and more specifically the HSE commissioned questions, are available from www.hse.gov.uk/statistics/lfs/technicalnote.htm
Self-reported work-related illness (SWI): People who have conditions which they think have been caused or made worse by their current or past work, as estimated from the LFS. ‘Prevalence’ estimates include long-standing as well as new cases; ‘incidence’ comprises those who first became aware of their illness in the last 12 months. HSE has carried out SWI surveys, linked to the LFS, periodically since 1990 and annually since 2003/04.
Reports of ill health by doctors and specialist physicians: These reports of work-related ill health are gathered in surveillance schemes run by the The Health and Occupation Reporting network (THOR and THOR-GP). Statistical tables covering patients seen by specialists are available annually from the early 1990s for work-related respiratory disorders and skin disease, from 1998 for musculoskeletal disorders and from 1999 for mental ill health. THOR-GP has been fully established for two years and data are available from 2006.
Ill health assessed for disablement benefit (IIDB): New cases of specified ‘prescribed diseases’ (with an established occupational cause) assessed for compensation under the Industrial Injuries Disablement Benefit scheme. IIDB statistics are available annually from the 1980s or earlier.
Death certificates: Page 5 refers to deaths from some types of occupational lung disease, including the asbestos-related diseases mesothelioma and asbestosis.
24
A6 statistics 10.indd 25 10/22/10 1:28:34 PM
RIDDOR 95: The Reporting of Injuries, Diseases and Dangerous Occurrences Regulations 1995, under which fatal and specified non-fatal injuries to workers and members of the public arising from work activity are reported by employers and others to the relevant enforcing authority. These are HSE, local authorities and the Office of Rail Regulation (ORR). Prior to 1 April 2006 safety on railways was enforced by HSE, and ORR since. The RIDDOR figures include railways data, provided by ORR, although the breakdown by country/ region on pages 14–15 excludes railways.
Certain types of work-related injury are not reportable under RIDDOR and hence are excluded from these figures. Particular exclusions include fatalities and injuries to the armed forces and injuries from work-related road collisions. For more information on the coverage of RIDDOR, see www.hse.gov.uk/statistics/sources
Reported major injuries: Specified serious injuries to workers, including most fractures, amputations and other injuries leading to resuscitation or 24-hour admittance to hospital.
Reported over-3-day injuries: Other (non-major) injuries to workers that lead to absence from work, or inability to do their usual job, for over three days.
Reportable injuries from the Labour Force Survey (LFS): Injuries to workers which meet the criteria to be reportable under RIDDOR, as estimated from the LFS. HSE has placed a set of injury questions on the LFS in 1990 and annually since 1993. LFS injury rates are generally presented as three-year averages to provide a more robust series of estimates.
Level of reporting: Reported non-fatal injury rate (from RIDDOR) as a percentage of the reportable injury rate (from the LFS).
ww
w.h
se.g
ov.u
k/st
atis
tics/
sour
ces.
htm
25
A6 statistics 10.indd 26 10/22/10 1:28:58 PM
Health and safety statistics highlights 2005
Working days lost: Days off work due to workplace injuries and work-related ill health, as estimated from the LFS. The figures are expressed as full-day equivalents, to allow for variation in daily hours worked, and are available for 2000/01 (injuries), 2001/02 (ill health), and annually (for both injuries and ill health) from 2003/04.
Standard Industrial Classification (SIC): The system used in UK official statistics for classifying businesses by the type of activity they are engaged in. This has been revised several times since first introduced in 1948. The version used in these statistics, SIC 2003, made minor revisions to SIC 1992.
Standard Occupational Classification (SOC): The system used in UK official statistics for classifying workers by the type of job they are engaged in. The version used in these statistics is SOC 2000.
Rate per 100 000: The number of injuries or cases of ill health per 100 000 employees or workers, either overall or for a particular industry or area. For reported injuries, the rates use estimates of the number of jobs produced by the Office for National Statistics (ONS). For reportable injuries from the LFS, and ill-health cases from various sources, the rates are based on LFS employment estimates. In the light of revisions made by the ONS to the employee job series in July 2010, the RIDDOR-reported injury rates have been revised back to 2001/02. The impact on whole economy rates is less than 1%.
95% confidence intervals: The range of values which we are 95% confident contains the true value, in the absence of bias. This reflects the potential error that results from surveying a sample rather than the entire population. A difference between two estimates is ‘statistically significant’ if there is a less than 5% chance that it is due to sampling error alone.
ww
w.h
se.g
ov.u
k/st
atis
tics/
sour
ces.
htm
26
A6 statistics 10.indd 27 10/22/10 1:29:23 PM
Health and safety statistics highlights 2005
Enforcement notices and offences prosecuted: The relevant enforcing authorities are HSE, local authorities and the Office of Rail Regulation (ORR) – prior to 1 April 2006 safety on railways was enforced by HSE, and ORR since. The numbers of enforcement notices issued and offences prosecuted are provided by the relevant enforcing authority.
Enforcement notices cover improvement, prohibition and deferred prohibition. Offences prosecuted refer to individual breaches of health and safety legislation; a prosecution case may include more than one offence. Where prosecution statistics are allocated against a particular year, unless otherwise stated the year relates to the date of final hearing with a known outcome. They exclude those cases not completed, for example adjourned.
p: Provisional.
n/a: Not available.
ww
w.h
se.g
ov.u
k/st
atis
tics/
sour
ces.
htm
27

2828
ww
w.h
se.g
ov.u
k/st
atis
tics/
fata
land
maj
or
A6 statistics 10.indd 28 10/22/10 1:29:47 PM
Health and safety statistics highlights 2005Health and safety statistics highlights 2005
Further information
HSE priced and free publications can be viewed online or ordered from www.hse.gov.uk or contact HSE Books, PO Box 1999, Sudbury, Suffolk CO10 2WA Tel: 01787 881165 Fax: 01787 313995. HSE priced publications are also available from bookshops.
i i l i i iFor nformat on about hea th and safety, or to report ncons stenc es or i i i i i i Infoline Te : 0845 345 0055lnaccurac es n th s gu dance, r ng HSE’s Fax: 0845 408 9566 Textphone: 0845 408 9577 e-mail: [email protected] or write to HSE Information Services, Caerphilly Business Park, Caerphilly CF83 3GG.
This document contains notes on good practice which are not compulsory but which you may find helpful in considering what you need to do.
This document is available at: www.hse.gov.uk/statistics/overall/ hssh0910.pdf
© Crown copyright 2010 If you wish to reuse this information visit www.hse.gov.uk/copyright.htm for details.
Published by the Health and Safety Executive 10/10