Embed Size (px)
Citation preview

Health and health services in the Free
State: Key issues

Overview
• The Free State in the context of South Africa overall
• Between districts in the FS

Number of people per province
EC FS GP KZN LP MP NC NW WC0
2
4
6
8
10
12
TotalNo med aid
[CMS data]
Source: Day C, Gray A. Health & related indicators. SAHR 2010
Million people: total and those not on medical schemes

Infant deaths (less than 1 year)
Easte
rn Cape
Free S
tate
Gauten
g
KwaZulu-N
atal
Limpopo
Mpumalanga
Northern
Cape
North W
est
West
ern Cap
e
South Afric
a0
10
20
30
40
50
60
70
Infa
nt d
eath
s per
100
0 liv
e bi
rths

Children who die before age 5
EC FS GP KZN LP MP NC NW WC SA0
20
40
60
80
100
120
140
200220062010
Source: Day C, Gray A. Health & related indicators. SAHR 2010
Under 5 mortality rate [ASSA 2003 projections]
Electricity for lighting
Easte
rn Cape
Free S
tate
Gauten
g
KwaZulu-N
atal
Limpopo
Mpumalanga
Northern
Cape
North W
est
West
ern Cap
e
South Afric
a0
10
20
30
40
50
60
70
80
90
100
Perc
enta
ge o
f hou
seho
lds

Electricity for cooking
EC FS GP KZN LP MP NC NW WC SA0
10
20
30
40
50
60
70
80
90
100
199620052009
Source: Day C, Gray A. Health & related indicators. SAHR 2010
Percent households using electricity for cooking

Access to piped water
EC FS GP KZN LP MP NC NW WC SA0
20
40
60
80
100
120
199620052009
Source: Day C, Gray A. Health & related indicators. SAHR 2010
Percent households with access to piped water by province

Flush toilet
0102030405060708090
100
Perc
enta
ge o
f hou
seho
lds

Households with no toilet
EC FS GP KZN LP MP NC NW WC SA0
5
10
15
20
25
30
35
199620052009
Percent households without a toilet
Source: Day C, Gray A. Health & related indicators. SAHR 2010

Number of people per province
EC FS GP KZN LP MP NC NW WC0
2
4
6
8
10
12
TotalNo med aid
[CMS data]
Source: Day C, Gray A. Health & related indicators. SAHR 2010
Million people: total and those not on medical schemes
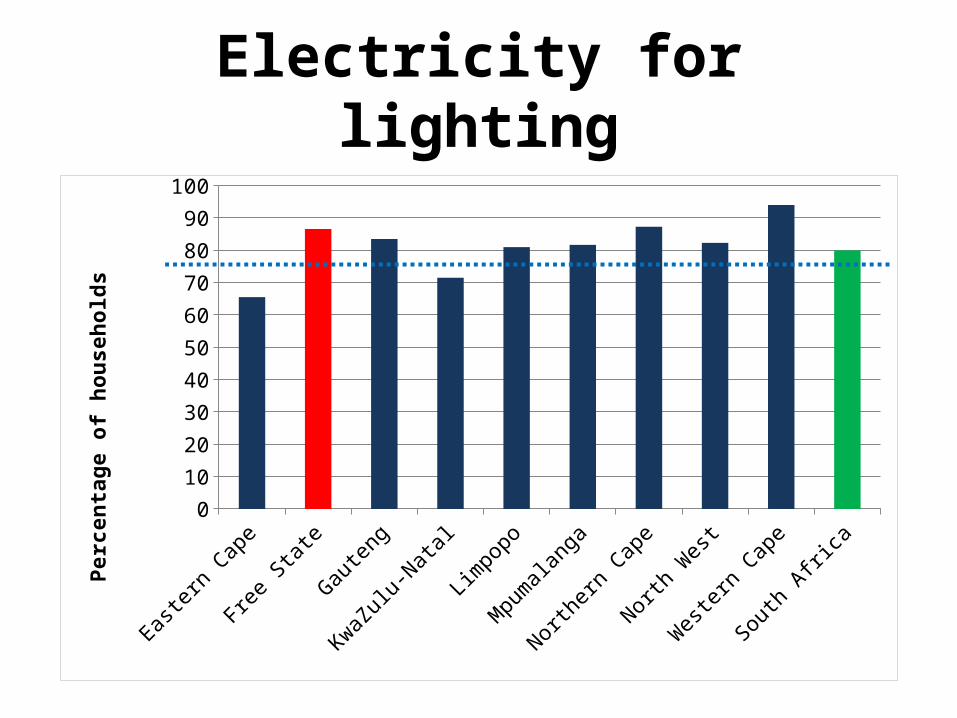
Government health spending
Easte
rn Cape
Free S
tate
Gauten
g
KwaZulu-N
atal
Limpopo
Mpumalanga
Northern
Cape
North W
est
West
ern Cap
e
South Afric
a0
500
1000
1500
2000
2500
Gove
rnm
ent s
pend
ing
on h
ealth
per
per
son

Public sector doctors & specialists
EC FS GP KZN LP MP NC NW WC SA0
5
10
15
20
25
30
35
40
doctorsspecialists
General doctors & specialists per 100000 uninsured population
Source: Day C, Gray A. Health & related indicators. SAHR 2010

Adults & children getting ART
EC FS GP KZN LP MP NC NW WC0
20000
40000
60000
80000
100000
120000
140000
160000
180000
200120052008
Source: Day C, Gray A. Health & related indicators. SAHR 2010
Number on ART by province

Private hospitals

Public hospitals
= District hospitals
= Regional hospitals= Provincial tertiary hospitals

Blue
Green
Red
G
R
B
G
B
R G B
R
G B
R
Selected indicators for Free State Province