Embed Size (px)
Citation preview

2016 - 2017
Dubai Health Insurance CorporationHealth Accounts System of Dubai

تـقــريـر الحــســابـات الصحــيـة إلمـــارة دبــي
Health Accounts System of Dubai

تـقــريـر الحــســابـات الصحــيـة إلمـــارة دبــي
Health Accounts System of Dubai
Table of Contents258
10 111111141414151617192223262831313131323232333333 3435
AcknowledgementList of Abbreviations and Definitions Executive Summary Introduction Methodology Population boundaries for HASD Data Collection and Analysis Health Accounts Production Tool Projection of Health Expenditure Limitations Results of HASD 2017 Sources and flow of funds Financing schemes that managed the healthcare expenditure Types of health providers that received the healthcare expenditure amount through the various financing schemes Health services expenditure through the various financing schemes Types of health services that received the healthcare expenditure amount through the various health providers Comparative Analysis Marketplace Insights Appendix Comparative Analysis with OECD Countries Appendix Figure 1. Current Health Expenditure (CHE) per Capita (US$) Appendix Figure 2. Current Health Expenditure (CHE) as Percentage of GDP Appendix Figure 3. General Government Expenditure on Health (GGHE) as Percentage of Current Health Expenditure (CHE) Appendix Figure 4. Share of Out of Pocket Expenditure of Current Health Expenditure (CHE) Appendix Figure 5. Share of Curative Care Expenditure of Current Health Expenditure (CHE) SHA Tables for 2016 Appendix Table 1. Health Financing Schemes X Funds Of Health Care Financing Schemes Appendix Table 2. Health Providers X Health Financing Schemes Appendix Table 3. Health care Functions X Health Financing Schemes Appendix Table 4. Health care Functions X Health Providers

تـقــريـر الحــســابـات الصحــيـة إلمـــارة دبــي
Health Accounts System of Dubai4
Foreword
Under the leadership of His Highness Sheikh Mohammed Bin Rashid Al Maktoum,
Vice President and Prime Minister and Ruler of Dubai significant, advancements
have been made in all services and economic sectors. The general aim is to build a
sustainable socio-economic environment that can respond to the healthcare needs
of the Dubai population.
With the introduction of a Mandatory Health Insurance Law 11 of 2013, Dubai’s
health sector landscape is evolving rapidly. The regulatory role of the Dubai Health
Authority is to ensure accessibility, quality and continuity in the provision of health
services to residents of and visitors to Dubai.
Allocating sufficient and sustainable funds for healthcare is a cornerstone of the
success of any health system
The Dubai Health Authority is pleased to publish the third account of health expen-
ditures for the Emirate of Dubai. The 2016-2017 HASD report is the reflection of
Dubai’s progress towards universal health coverage with a mandate to track health
expenditures for evidence based policy and making healthcare accessible, affordable
and of better quality. This report also acts as a benchmark for the production of a
National Health Accounts system for the United Arab Emirates (UAE).
Our decision to implement HASD was based on two needs:
• To measure the financial dimensions of Dubai’s healthcare system, allowing
efficiency in allocating funds between the private and public health sectors.
• To monitor changes in the financial distribution between governmental and
private health sectors, compared with regional and international countries.
Monitoring changes that occur over time will give the government and investors
the information needed to gauge investment size and trends.
In successfully completing this exercise DHA greatly appreciates the participation of
all stakeholders for their contribution to ensuring the establishment of an efficient
and dynamic healthcare system in Dubai.
I look forward to continued support from all stakeholders in producing the annual
HASD Report. I also invite the stakeholders to utilize the information contained in
this report to support their decisions on how to better deliver healthcare for resi-
dents of Dubai.
His Excellence Humaid Al Qatami, Chairman of the Board and Director General
Dubai Health Authority

تـقــريـر الحــســابـات الصحــيـة إلمـــارة دبــي
Health Accounts System of Dubai
تـقــريـر الحــســابـات الصحــيـة إلمـــارة دبــي
Health Accounts System of Dubai5
As Dubai has established ISAHD (Insurance System of Advancing Health in Dubai)
scheme, monitoring progress of the health financing dimension is important for de-
cision on fiscal space for health, sustainable financing, and appropriate resource al-
location.
In-line with WHO NHA standards, institutionalized Health Accounts provides key
health financing indicators every year enabling critical policy reflections. It allows
global comparison of select indicators enabling us to improve financing of interven-
tions for better health accounts. HASD 2016-2017 report provides an insightful
reflection of the healthcare financing indicators for Dubai.
I applaud the efforts of HASD technical team for working on the health accounts
estimates by improving methodologies and rigorous efforts to get accurate data.
These estimates will help us reorient our existing policies for an equitable and effi-
cient health system.
Message
Saleh Al HashimiCEO, Dubai Health Insurance Corporation
Dubai Health Authority

تـقــريـر الحــســابـات الصحــيـة إلمـــارة دبــي
Health Accounts System of Dubai6
Executive SummaryIn 2013, the Emirate of Dubai implemented Law 11 to provide universal health cov-
erage for all of its residents. Also known as Insurance System of Advancing Health in
Dubai (ISAHD), the law went into effect in the first quarter of 2014 and brought sig-
nificant changes to the healthcare sector. The goal of ISAHD was to achieve universal
coverage by mid-2016, and increase the affordability and accessibility of health care.
It is imperative to analyze and monitor the flow of expenditure through the system to
ensure that ISAHD has been properly implemented and to shape future policies. This
requires reliable and standardized data collection and analysis. The Health Accounts
System of Dubai (HASD) provides a factual account of health expenditures by gov-
ernment and private sector, by health care functions and by health care provider type.
This report is based on data collected from 2016 and 2017 and is inflation ad-
justed (using consumer price index (CPI) with a base of year 2014) so that it
can be compared to the 2012 and 2013 findings to see how much has changed
since the period before ISAHD was implemented in 2014. In keeping with prior
analysis, we define the boundaries of Dubai’s Health Care Spending as all health
care related transactions made by or on behalf of a citizen of Dubai or a non-cit-
izen with a work visa from Dubai regardless of domicile. We include their spend-
ing even if it occurred outside the physical boundaries of Dubai. The account-
ing excludes health care spending by short term tourists. Also, excluded is the
health care spending inside the physical boundaries of Dubai on behalf of citi-
zens of other emirates or by non-citizen workers with visas from other emirates.
In 2017, Dubai spent 16,773 Million AED on healthcare (4.3% of GDP), of which
16,047 Million AED was spent within Dubai and 726 Million AED was spent outside
Dubai. The annual growth between 2016 and 2017 was 6% after adjusting for inflation.
The growth in health expenditure was not uniform across all sources. Com-
pared to the 2016 estimates, the 2017 growth rates were +3%, +2%, and
-5% per year for private insurance, government and household spending re-
spectively in 2017. Compared to 2014 when household out of pocket spend-
ing accounted for 25% of healthcare spending, the 2017 share of out of pock-
et health spending was reduced to 13%. Private insurance spent 8,282 Million
AED (49%) on healthcare compared to 6,338 Million AED (38%) spent by the
government and 2,152 Million AED (13%) spent out of pocket by households.
The share of all health spending received by various providers was 45%, 24%,
15%, and 2% for hospitals, clinics, retail pharmacies and ancillary providers, re-
spectively. There was a slight decline in the share of expenditure going to hospi-
tals and going to providers outside of Dubai. The implementation of ISAHD could
partially explain the reduction in spending on non-Dubai based providers be-
cause it made providers inside Dubai more financially affordable and accessible.

تـقــريـر الحــســابـات الصحــيـة إلمـــارة دبــي
Health Accounts System of Dubai
تـقــريـر الحــســابـات الصحــيـة إلمـــارة دبــي
Health Accounts System of Dubai7
The share of all health spending going to various services was 57%, 14%, 18%,
8% and 2% for curative care, ancillary services, medical goods, administration
and preventive services, respectively. Over the last 5 years, curative care has ac-
counted for the bulk of the healthcare services provided and has stayed in the
range of 55% to 60% of the total costs. There has been a significant increase
in expenditure on medical goods, health system and financial administration.
Compared to other OECD countries, and given the size of the healthcare mar-
ket, Dubai has high expenditures for administrative and ancillary services and low
spending on prevention. Future policy goals could include streamlining and effi-
ciency as well as allocating more resources towards preventive health care while
limiting the extent of out of pocket spending by those with limited resources.
Executive Summary
تـقــريـر الحــســابـات الصحــيـة إلمـــارة دبــي
Health Accounts System of Dubai8
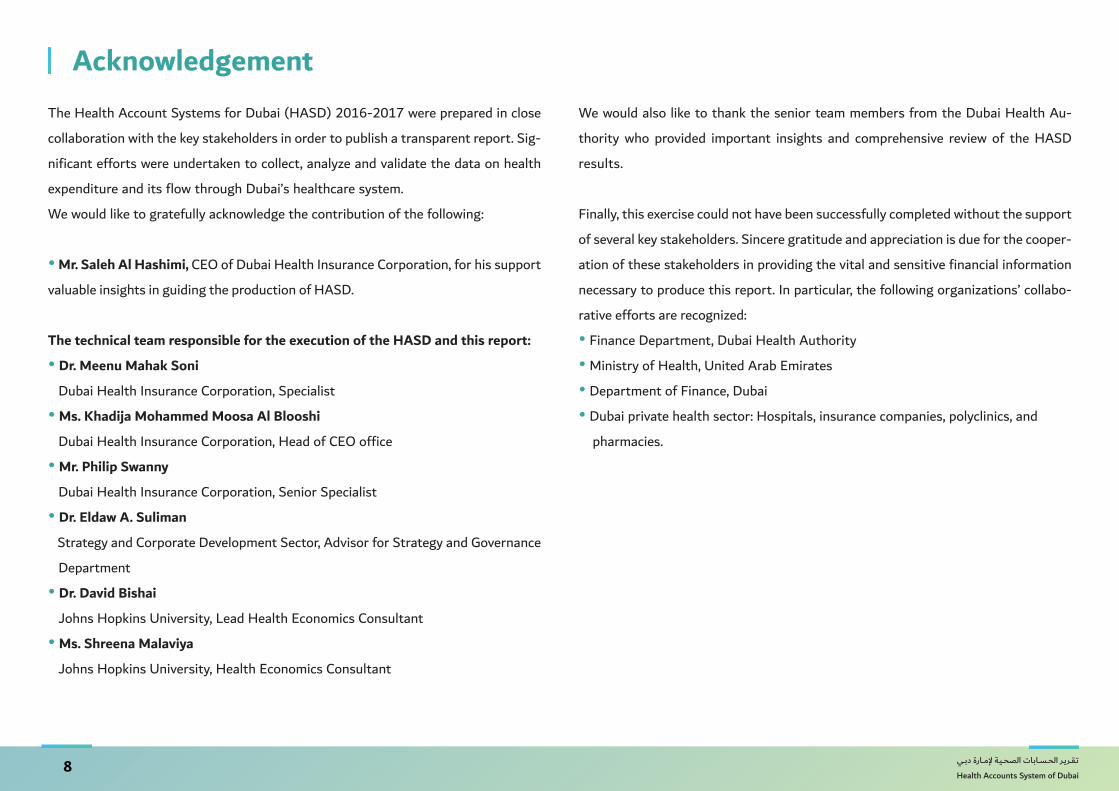
The Health Account Systems for Dubai (HASD) 2016-2017 were prepared in close
collaboration with the key stakeholders in order to publish a transparent report. Sig-
nificant efforts were undertaken to collect, analyze and validate the data on health
expenditure and its flow through Dubai’s healthcare system.
We would like to gratefully acknowledge the contribution of the following:
• Mr. Saleh Al Hashimi, CEO of Dubai Health Insurance Corporation, for his support
valuable insights in guiding the production of HASD.
The technical team responsible for the execution of the HASD and this report:
• Dr. Meenu Mahak Soni
Dubai Health Insurance Corporation, Specialist
• Ms. Khadija Mohammed Moosa Al Blooshi
Dubai Health Insurance Corporation, Head of CEO office
• Mr. Philip Swanny
Dubai Health Insurance Corporation, Senior Specialist
• Dr. Eldaw A. Suliman
Strategy and Corporate Development Sector, Advisor for Strategy and Governance
Department
• Dr. David Bishai
Johns Hopkins University, Lead Health Economics Consultant
• Ms. Shreena Malaviya
Johns Hopkins University, Health Economics Consultant
AcknowledgementWe would also like to thank the senior team members from the Dubai Health Au-
thority who provided important insights and comprehensive review of the HASD
results.
Finally, this exercise could not have been successfully completed without the support
of several key stakeholders. Sincere gratitude and appreciation is due for the cooper-
ation of these stakeholders in providing the vital and sensitive financial information
necessary to produce this report. In particular, the following organizations’ collabo-
rative efforts are recognized:
• Finance Department, Dubai Health Authority
• Ministry of Health, United Arab Emirates
• Department of Finance, Dubai
• Dubai private health sector: Hospitals, insurance companies, polyclinics, and
pharmacies.

تـقــريـر الحــســابـات الصحــيـة إلمـــارة دبــي
Health Accounts System of Dubai
تـقــريـر الحــســابـات الصحــيـة إلمـــارة دبــي
Health Accounts System of Dubai9
List of Abbreviations and DefinitionsAbbreviations
AED
CHE
DHA
DHCC
DHCCA
DHIC
DHHS
DM
DoF
DSC
FS
GDP
GGHE
HASD
HC
HF
United Arab Emirate Dirham
Current Health Expenditure
Dubai Health Authority
Dubai Health Care City
Dubai Health Care City Authority
Dubai Health Insurance Corporation
Dubai Health Household Survey
Dubai Municipality
Dubai Department of Finance
Dubai Statistics Center
Funds of Financing Scheme
Gross Domestic Product
General Government Expenditure on Health
Health Accounts System of Dubai
Health care Functions
Health Financing Schemes
HP
ISAHD
MOH
MOHAP
OECD
OOP
n.e.c
NCU
PPP
PvHE
RoW
SHA
THE
UAE
US$
WHO
Health care Providers
Insurance System of Advancing Health in Dubai
Ministry of Health
Ministry of Health and Prevention
Organization for Economic Co-operation and Development
Out-of-Pocket
Not Elsewhere Classified
National Currency Unit
Purchasing Power Parity
Private Expenditure on Health
Rest of the World
System of Health Accounts
Total Health Expenditures
United Arab Emirates
United States Dollars
World Health Organization

تـقــريـر الحــســابـات الصحــيـة إلمـــارة دبــي
Health Accounts System of Dubai10
DefinitionsAncillary services: A variety of services such as laboratory tests, diagnostic imaging
and patient transport, usually performed by paramedical or medical technical per-
sonnel with or without the direct supervision of a medical doctor.
Investment: Investment in health care facilities and equipment that creates assets
that are typically used over a long period of time.
Curative care: Medical and paramedical services delivered during an episode of cu-
rative care. An episode of curative care occurs when the principal medical intent is
to: relieve the symptoms of injury or illness; to reduce severity of an illness or injury;
or to protect against injury or exacerbation of an injury which could threaten life or
normal function.
Current health expenditure (CHE): Comprises all services such as curative care
(including services provided to residents by non-residents providers), rehabilitative
care, prevention, public health, and ancillary health care. Also includes expenditures
for administration of these services and drugs, medical goods, and salaries and fees
of health personnel. This excludes investment expenditures, and exports (services
provided to non-residents).
Day care: Planned medical and paramedical services delivered to patients who have
been formally admitted for diagnosis, treatment or other types of health care but
with the intention to discharge the patient on the same day.
Exports (of health care goods and services): Health care goods and services ac-
quired by non-residents (visitors) from resident providers.
Financing agents (FA): Institutional units that manage health finance schemes. For
example, collecting Funds and premiums, purchase services, and pay for these ser-
vices.
Financing schemes (HF): Components of a country’s health financial system that
channel funds to pay for, or purchase, the activities within the health accounts
boundary.
Health care functions (HC): The goods and services provided and activities per-
formed within the health accounts boundary.
Health care system administration and financing: Establishments that are primar-
ily engaged in the regulation of the activities of agencies that provide health care and
in the overall administration of the health care sector, including the administration
of health financing.
Imports of healthcare goods and services (Imports): Health care goods and ser-
vices acquired by residents from nonresident providers. In other words, healthcare
services provided outside the geographical boundaries of the health care system.

تـقــريـر الحــســابـات الصحــيـة إلمـــارة دبــي
Health Accounts System of Dubai
تـقــريـر الحــســابـات الصحــيـة إلمـــارة دبــي
Health Accounts System of Dubai11
DefinitionsInpatient care (IP): Formal admission into a health care facility for treatment and/
or care that is expected to constitute an overnight stay.
Not Elsewhere Classified (n.e.c): A category used to reflect those activities or
transactions that fall within the boundaries of the health accounts but which cannot
be definitively allocated to a specific category due to insufficient documentation.
Out-Of-Pocket (OOP) spending: The direct outlays of households, including gra-
tuities and payments in-kind, made to health practitioners and suppliers of pharma-
ceuticals, therapeutic appliances, and other goods and services whose primary intent
is to contribute to the restoration or enhancement of the health status of individuals
or population groups. Includes household payments to public services, non-profit
institutions or non-governmental organizations.
Outpatient care (OP): Any care offered to a non-admitted patient regardless of
where it. It may be delivered in a hospital, an ambulatory care center, or a physician’s
private office.
Preventive services: Services provided as having the primary purpose of risk avoid-
ance, of acquiring diseases or suffering injuries, which can frequently involve a direct
and active interaction of the consumer with the health care system.
Providers (HP): Encompass organizations and actors that deliver health care goods
and services as their primary activity, as well as those for which health care provision
is only one among a number of activities.
Inflow Funds of financing schemes (FS): The funds of the health financing schemes
received or collected through specific contribution mechanisms.
System of Health Accounts (SHA): A system developed by the OECD, Eurostat, and
WHO to provide international comparability standards for member and non-mem-
ber countries. The manual was produced first in 2010 with the latest iteration pub-
lished in 2011.
Total health expenditure (THE): Total health expenditure is no longer part of the
health accounts as per SHA 2011. It is defined as the sum of current health expen-
diture (CHE) and the expenditure on capital goods. In this report, the term is used
only to draw comparison with other countries.
Prepayment schemes: Schemes that receive payments from the insurer or other in-
stitutional units on behalf of the insured, to secure entitlement to benefits of health
insurance schemes.
تـقــريـر الحــســابـات الصحــيـة إلمـــارة دبــي
Health Accounts System of Dubai12
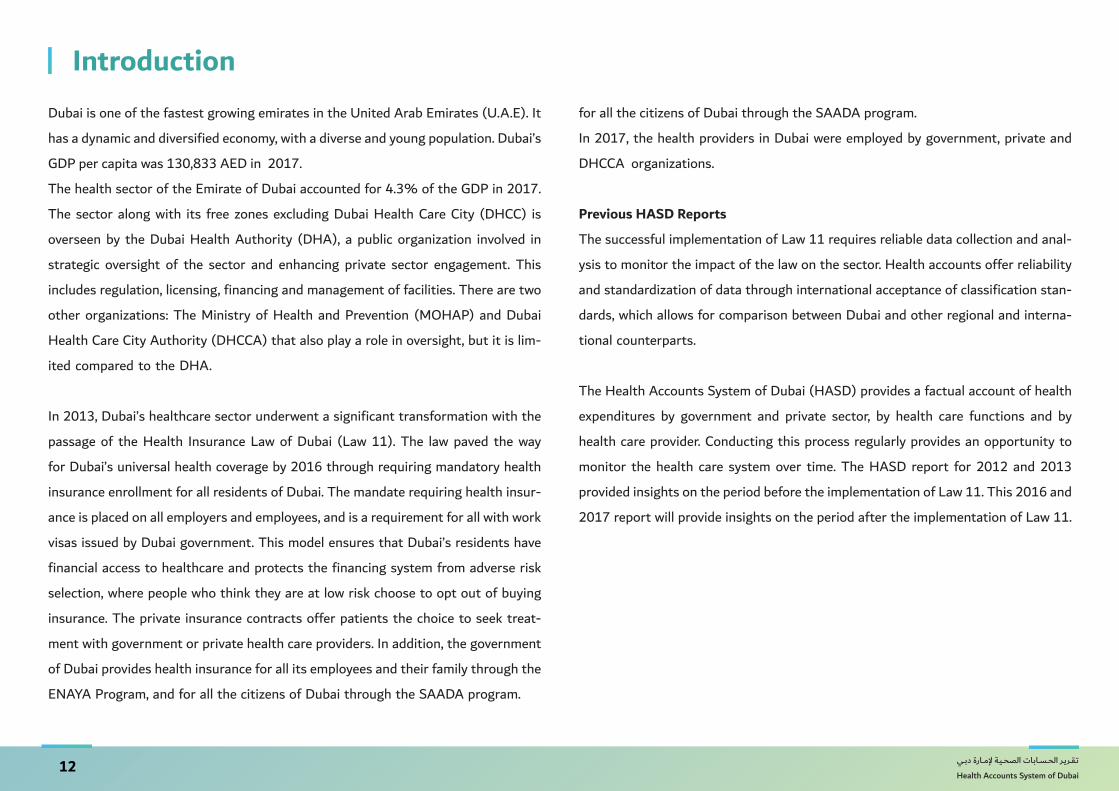
IntroductionDubai is one of the fastest growing emirates in the United Arab Emirates (U.A.E). It
has a dynamic and diversified economy, with a diverse and young population. Dubai’s
GDP per capita was 130,833 AED in 2017.
The health sector of the Emirate of Dubai accounted for 4.3% of the GDP in 2017.
The sector along with its free zones excluding Dubai Health Care City (DHCC) is
overseen by the Dubai Health Authority (DHA), a public organization involved in
strategic oversight of the sector and enhancing private sector engagement. This
includes regulation, licensing, financing and management of facilities. There are two
other organizations: The Ministry of Health and Prevention (MOHAP) and Dubai
Health Care City Authority (DHCCA) that also play a role in oversight, but it is lim-
ited compared to the DHA.
In 2013, Dubai’s healthcare sector underwent a significant transformation with the
passage of the Health Insurance Law of Dubai (Law 11). The law paved the way
for Dubai’s universal health coverage by 2016 through requiring mandatory health
insurance enrollment for all residents of Dubai. The mandate requiring health insur-
ance is placed on all employers and employees, and is a requirement for all with work
visas issued by Dubai government. This model ensures that Dubai’s residents have
financial access to healthcare and protects the financing system from adverse risk
selection, where people who think they are at low risk choose to opt out of buying
insurance. The private insurance contracts offer patients the choice to seek treat-
ment with government or private health care providers. In addition, the government
of Dubai provides health insurance for all its employees and their family through the
ENAYA Program, and for all the citizens of Dubai through the SAADA program.
for all the citizens of Dubai through the SAADA program.
In 2017, the health providers in Dubai were employed by government, private and
DHCCA organizations.
Previous HASD Reports
The successful implementation of Law 11 requires reliable data collection and anal-
ysis to monitor the impact of the law on the sector. Health accounts offer reliability
and standardization of data through international acceptance of classification stan-
dards, which allows for comparison between Dubai and other regional and interna-
tional counterparts.
The Health Accounts System of Dubai (HASD) provides a factual account of health
expenditures by government and private sector, by health care functions and by
health care provider. Conducting this process regularly provides an opportunity to
monitor the health care system over time. The HASD report for 2012 and 2013
provided insights on the period before the implementation of Law 11. This 2016 and
2017 report will provide insights on the period after the implementation of Law 11.


تـقــريـر الحــســابـات الصحــيـة إلمـــارة دبــي
Health Accounts System of Dubai14
MethodologyThe Health Accounts System of Dubai (HASD) follows the methodology and the in-
ternational classification of System of Health Accounts (SHA) 2011 [World Health
Organization, 2011]. The WHO system explains the rationale for producing the re-
ports at a state level and requires the definition of population boundaries to accom-
pany each system of health accounts.
Population boundaries for HASD
The population of health system users of Dubai can be classified as follows:
1. Nationals in the Emirate of Dubai
2. Non-Nationals with employment visas from Dubai and residence inside Dubai
3. Non-Nationals with employment visas from Dubai and residence outside Dubai
4. Tourists who visit Dubai
The Dubai Statistics Centre considers only the first two groups as part of Dubai’s
population. However, according to the law, government agencies and private employ-
ers in Dubai are mandated to offer healthcare coverage to all employees with Dubai
employment visas regardless of their geographical residence. Thus, for the purposes
of the HASD report, the first three groups will be considered. The total long-term
population in 2017 within the HASD boundaries is estimated to be 4.56 million.
Health spending by tourists is not included in this report. The population of short-
term tourists varies seasonally.
Data Collection and Analysis
The 2016 and 2017 data for HASD were collected and analyzed in accordance with
the international guidelines provided in SHA 2011. It should be noted that since the
inception of the Dubai health spending report in 2012, new spending data sources
have been identified and existing sources have been improved for accuracy and reli-
ability. Furthermore, there has been a change in the methodology used for the esti-
mation of the household out-of-pocket expenditure as described below. Therefore,
trend analysis between the previous and current reports should be considered with
this in mind
Data Sources
Government
Ministry of Health of U.A.E (MoH)
The MoH provided the HASD team with detailed expenditure data that were broken
down by facility type and cost center, along with data on the workforce and utiliza-
tion rate of each facility type. The team imputed the proportion of wages and salary
included in each healthcare service using existing data from 2015. Any MoH collec-
tion of revenue from service users was not reported and has been necessarily omit-
ted from this report (See Limitations). This will lead to a potential underestimate
of total out of pocket spending if there is omitted out of pocket spending by service
users at Ministry of Health facilities. It also forces the omission of small amounts of
health financing contributed by other governmental units paying for MoH services
via intergovernmental financial transfers.

تـقــريـر الحــســابـات الصحــيـة إلمـــارة دبــي
Health Accounts System of Dubai
تـقــريـر الحــســابـات الصحــيـة إلمـــارة دبــي
Health Accounts System of Dubai15
MethodologyDubai Department of Finance (DoF)
The DoF provided the HASD team with data on health expenditures paid by the
Dubai government to three recipients: Dubai Municipality, Dubai Police, and Dubai
Ambulance for health services rendered. The available data included a detailed
breakdown of expenditures and funds based on the Dubai Government Chart of Ac-
counts, which includes the cost center and line item details. The breakdown was
essential in accurately identifying and mapping health expenditures, and to ensure
consistency with reports from the recipients of the funds. The DoF also provided
data for amounts paid towards insurance claims for government employees distin-
guishing clearly between funds paid towards insurance premiums and health care
claims. These data were adjusted based on the government claims data for ENAYA
and Al-Madallah schemes in eClaim Link Data. The DoF data did not indicate which
providers and health services were used.
Dubai Municipality, Dubai Police, and Dubai Ambulance service also independently
reported the receipt of some revenue for health services. However, these amounts
were excluded from the analysis as it could not be established whether the revenue
was double counting receipts from DoF1.
Dubai Health Authority (DHA)
Two datasets were used to analyze DHA’s activities and map them to SHA 2011
classifications.
1. DHA Revenue Dataset: Detailed revenue data were collected by DHA for each
cost-center and type of payment. However, the details regarding the nature of the
healthcare services and the sources of revenue could not be definitively established
from the data. These revenue data were not included in total health spending calcu-
lations, but they were used to triangulate and validate estimates of out-of-pocket
(OOP) expenditures.
2. DHA Expenditure Dataset: Detailed government expenditure data were collected
by DHA for each cost-center by item definition, and facility type. The cost-centers
were classified into outpatient, inpatient and daycare services using utilization data
published by DHA Health Information and Statistics department.
1 It is possible, but less likely that the revenue reported by Dubai Municipality, Dubai Police, and Dubai
Ambulance represent out of pocket payments by service users. The total amount of DoF revenue excluded
in this manner accounts for less than 1% of total health spending in Dubai

تـقــريـر الحــســابـات الصحــيـة إلمـــارة دبــي
Health Accounts System of Dubai16
MethodologyeClaim Link Data
The administrative data for private health insurance in 2016 and 2017 were extract-
ed from eClaim Link, operated by the DHA. The system records all health insurance
transactions reported through the system for 2016 and 2017. The datasets included
the claims transactions data for all Dubai based policies with details of the services
provided, and the financial transaction information for each service episode. The
patient’s out of pocket share for claims was missing in 29% of service episodes. The
missing data for patient share of claims was imputed by modeling first the proba-
bility of incurring any out-of-pocket cost for an episode and then multiplying this
probability by an estimate of average out of pocket payment for episodes by type of
facility. The data were then classified by payer type, provider type, and service type
so that it could be mapped to SHA 2011. The raw and imputed patient share data
were also used to triangulate OOP expenditures.
Dubai Household Health Survey (DHHS) 2018
The DHHS is the largest comprehensive household survey of healthcare and health
issues carried out in the Emirate of Dubai. The survey provides a statistically accu-
rate and representative outlook of key health and healthcare variables across the
entire population of Dubai. It was first conducted in 2009, and repeated in 2014 and
2018.
The surveys of 2014 and 2018 were based on a multi-stage stratified cluster sam-
ple. The sampling was designed so that after weighting it would be representative of
four sub-populations: UAE citizens, Non-Citizens living in households, Non-citizens
living in collective housing, and Non-citizens living in labor camps. Surveyors per-
sonally visited these randomly selected households to obtain detailed information
on issues ranging from household health expenditure, and access to health services
to questions on exercise levels, dietary habits, lifestyle diseases, mental health, and a
detailed module on the use of public and private health services in Dubai. The 2018
survey was designed and led by the Dubai Statistics Center (DSC), and had a re-
sponse rate of 96%. The design and methodology of the survey were adopted from
those used in the World Bank’s Living standards Measurement Surveys (LSMS), the
World Health Organization’s World Health Surveys (WHS) and the US Center for
Disease Control’s National Health Interview and Examination Surveys (NHIES).
Importance weights were assigned by Dubai Statistics Center because UAE citizens
were oversampled. After weighting, the sample was representative of a population
of 3.2 million Dubai residents as of 2018. The sample size for 2018 was a total of
9,630 persons in 2200 housing units of whom 5,665 were UAE citizens, 2,342 were
Non-Citizens in Households, 1,335 were Non-Citizens in collective housing, and 288
were Non-Citizens in labor camps. The samples in 2014 and 2018 included a total
of 3271 and 2200 separate household units respectively. The survey was sanctioned
by the institutional review board of the Dubai Health Authority.
The surveyors each received extensive training in the collection of self-reported ex-
penditure data and interviewed the person in the household most knowledgeable
about recent medical utilization. After collecting a household roster and basic de-
mographics for each household member, the surveyor asked whether each house-
hold member had had any outpatient utilization in the last 30 days, made any dis-

تـقــريـر الحــســابـات الصحــيـة إلمـــارة دبــي
Health Accounts System of Dubai
تـقــريـر الحــســابـات الصحــيـة إلمـــارة دبــي
Health Accounts System of Dubai17
cretionary purchases of medical supplies or over the counter medicines (mentioning
blood pressure cuffs, blood sugar monitors, orthopedic supplies, medicines, etc.) in
the last 30 days and whether each household member had an overnight inpatient
stay in the last 12 months. For households where more than one member had ex-
perienced these events, an individual member was selected at random and details of
their medical events were collected to investigate the total of out of pocket spending
for various categories of discretionary spending, outpatient spending and inpatient
spending, after adjusting for the appropriate weights.
The analysis calculated the probability that each of the 4 categories of household
would have any discretionary, or any outpatient, or any inpatient out of pocket
spending. For outpatient spending the reporter noted the number of outpatient en-
counters experienced in a 30-day period and the number of hospital admissions
experienced in a 12-month period. Then for each type of household the probability
of any spending was multiplied by a weighted estimate of the average total out of
pocket expenditure for households who incurred that type of event. Estimates were
adjusted for the incidence of multiple outpatient visits in a month. Only 5 house-
holds reported greater than one hospitalization, so this adjustment was negligible
for hospitalization. Health care spending data can be dominated by outliers that can
dramatically skew estimates of average expected spending in small samples. This
was found to be true of the DHHS health spending data. Consequently, all calcu-
lations of average health spending excluded outliers above the 99th percentile to
reduce the skewness of the data.
Estimates of outpatient and discretionary spending in the last 30 days were annu-
alized to offer estimates of total annual out of pocket spending for each of the four
types of households. Finally, total annual spending for each type of household in
2018 was multiplied by estimates of the proportion of these households in the pop-
ulation of Dubai in 2014 based on the evidence that at this time there were 8% UAE
citizens, 42% UAE non-citizens living in households, 11% UAE non-citizens living in
collective housing, and 39% living in labor camps.
The findings on out of pocket spending for both 2014 and 2018 were used to inter-
polate to 2016 and 2017 by adjusting for population growth of the total population
and assuming that the proportion of each type of household remained constant.
Costs were deflated from 2018 to 2016 and 2017 using the consumer price index so
that costs are expressed in real AED with a baseline of 2014.
The data from the DHA revenue dataset and eClaimLink were used for triangulation
to ensure the OOP expenditure estimate from the survey data was accurately cap-
tured.
Methodology

تـقــريـر الحــســابـات الصحــيـة إلمـــارة دبــي
Health Accounts System of Dubai18
MethodologyMajor employers
Data from major employers in Dubai such as Emirates Airlines that provided health
insurance coverage for their employees and families were collected and classified by
provider type, and service type, and mapped to SHA 2011
Health Accounts Production Tool
Summary expenditure data were analyzed and tabulated first in Microsoft Excel and
then validated using the HA Production Tool (HAPT). The HAPT tool was devel-
oped by Health Systems 20/20 with inputs and support from key NHA stakehold-
ers including the WHO and World Bank. The tool streamlines and simplifies the
estimation and mapping process, thereby ensuring an internationally standardized
production of SHA.
Projection of Health Expenditure
The health expenditure for 2016 and 2017 was projected into the future until 2021
using two parameters: (1) the growth of health expenditure per capita, (2) the popu-
lation growth. The growth rate of health expenditure per capita was estimated using
linear regression. The historical growth rate of the population of Dubai was assumed
to be a constant 2.7% based on previous evaluations and expert opinions.
Limitations
There are some limitations of the results from HASD. First, a portion of the revenue
data from public providers did not clearly identify possible outside sources of rev-
enue to rule out double-counting of sources of expenditure. Second, the insurance
payment data obtained from some government entities did not indicate financial
allocations by category of health care providers and services used. Third, the data
did not reflect the portion of collected premiums for private insurance that was not
used to pay claims. Thus, the operating costs of the private insurance companies
that would be attributed to the medical loss ratio or “loading” are omitted. Finally,
the data needs to include more information about the precise nature of medical
treatments provided outside of Dubai based on SHA definitions.


تـقــريـر الحــســابـات الصحــيـة إلمـــارة دبــي
Health Accounts System of Dubai20
Results of HASD 2017 As shown in Table 1, between 2016 and 2017 health expenditure grew at approximately the same rate as GDP and remains in the range of 4.2% to 4.3% of GDP. The relative
shares of out of pocket, private insurance, and government health spending remained roughly similar across 2016 and 2017.
Table 1. Health Accounts Summary Indicators for 2016 and 2017 (adjusted for inflation)
Indicators 2016 2017
1. Health expenditure (HE) % Gross Domestic Product (GDP) 4.2% 4.3%
2. General Government Expenditure on Health (GGHE) as % of GDP 1.8% 1.6%3. General Government Expenditure on Health (GGHE) as % of HE 43.3% 37.8%4. Private Expenditure on Health (PvHE) as % of HE 56.7% 62.2%5. Out-Of-Pocket expenditure as % of PvHE 19.4% 20.6%6. Out-Of-Pocket expenditure as % of HE 11.0% 12.8%7. Private Insurance Claims as % of PvHE 80.6% 79.4%8. Expenditure on Inpatient care as % of HE 22.5% 25.7%9. Government Expenditure on Inpatient care as % of GGHE 25.2% 32.4%
10. Prevention and Public Health services as % of HE 1.5% 1.6%11. Medical goods as % of HE (not including IP) 18.4% 18.0%12. Current expenditure on health / capita at exchange rate (NCU per US$) 1,167 1,00213. Current expenditure on health / capita at Purchasing Power Parity (NCU per US$) 2,218 200414. General government expenditure on health / cap x-rate 505 37915. General government expenditure on health / cap Purchasing Power Parity (NCU per US$) 960 75716. OOPS / capita at exchange rate (NCU per US$) 129 12917. Exchange Rate (NCU per US$) 3.67 3.6718. PPP 2016 (NCU per US$) 1.9 219. Gross domestic product - Price index (2006=100) Million AED 378,765 390,54320. Financial Population* 3,700,000* 4,560,000*21. Current Health Expenditure – Million AED 15,851 16,773
*The estimates of financial population are based on the data provided. Further explanation of the data is provided under the section Marketplace Insights – Households

تـقــريـر الحــســابـات الصحــيـة إلمـــارة دبــي
Health Accounts System of Dubai
تـقــريـر الحــســابـات الصحــيـة إلمـــارة دبــي
Health Accounts System of Dubai21
Results of HASD 2017 Sources and flow of funds
In 2017, the biggest source of funds and financing schemes were employers who accounted for 49%, of funding followed by the government who accounted for 38%. Hospi-
tals received less than half of the pooled funds (45%) with the majority of the funds being used towards curative care (57%) which includes inpatient, outpatient and daycare.
Healthcare expenditure outside Dubai (“Import”) is estimated at 4%. Expenditure for preventive care remains very low at 2%. (Preventive care not shown in Figure 1).
Figure 1. Flow of Health Funds from Source to Schemes to Providers to Services, Dubai 2017
0%
10%
20%
30%
40%
50%
60%
70%
80%
90%
100%
Source of Fund
Government, 38%
Employers, 49%
Households, 13%
Services Provided
Curative, 57%
Administrative, 8%
Medical goods 18%
Ancillary, 14%
Other, 3%
Financing Schemes
Government, 38%
PrivateEmployers 49%
OOP, 13%
16.77 B
Health Providers
Hospitals, 45%
Retailers, 15%
Unspecified, 1%
Ancillary, 2%
Import, 4%
HQ, 9%
Clinics, 24%16.77 B
16.77 B
16.77 B
Flow of Funds

تـقــريـر الحــســابـات الصحــيـة إلمـــارة دبــي
Health Accounts System of Dubai22
Results of HASD 2017
Inflow funds of health care financing schemes
U.A.Emirates dirham (AED), MillionFinancing schemes
FS.1
Transfers from government domestic revenue (allocated
to health purposes)
FS.4.2
Compulsory prepayment from
employers
FS.6.1
Other funds from households n.e.c
All FS Share of FS
HF.1 Government schemes and compulsory contributory health care financing schemes 6,338 8,282 14,620 87%
HF.1.1 Government schemes 6,338 6,338 38%
HF.1.1.1 Central government schemes 386 386 2%
HF.1.1.2 State/regional/local government schemes 5,952 5,952 35%
HF.1.2 Compulsory contributory health insurance schemes 8,282 8,282 49%
HF.1.2.2 Compulsory private insurance schemes 8,282 8,282 49%
HF.3 Household out-of-pocket payment 2,152 2,152 13%
All HF 6,338 8,282 2,152 16,773 100%Share of HF 38% 49% 13% 100%
Financing schemes that managed the healthcare expenditure
The current health expenditure of Dubai increased by 6% from 2016 to 2017. As shown in Table 2, private employers were the largest source of funds estimated at 8,282 M
AED (49%) in 2017. The government financing schemes accounted for 6,338 M AED (38%) in 2017. Household out of pocket contribution was estimated at 2,152 M AED
(13%) in 2017. Figure 1 shows that the overall flow of funds in 2017 generally resembles past financial flow patterns in the health care system.
Within the 6338 M AED in funds managed by government entities, the majority of spending was by the government of the Emirate of Dubai, estimated at 5952M AED (94%)
while the federal government contributed only 386 M AED (6%).
In 2017, Dubai experienced complete implementation of Law 11 – ISAHD resulting in universal health insurance coverage. Over the last 5 years, there was a significant in-
crease in funds from private employers and government and a decrease in funds from households. ISAHD successfully decreased the financial burden borne out of pocket and
shifted that burden to collective financing operations of corporations and the government. Comparing data from 2017 to 2014 in Table 4, there was a 15.6% annual increase
in government funds, a 10.6% decrease in household funds and an 18.7% increase in the health sector funds coming from corporations.
Table 2. Financing Schemes (HF) by Financing Sources (FS) in 2017 (HF X FS)

تـقــريـر الحــســابـات الصحــيـة إلمـــارة دبــي
Health Accounts System of Dubai
تـقــريـر الحــســابـات الصحــيـة إلمـــارة دبــي
Health Accounts System of Dubai23
Estimates of Health Financing by Financing Scheme (HF x FS) for 2016 are in Appendix Table 1.
Tables 3 and 4 detail the annual growth of health spending by revenue source and financing scheme indicating how there was a sudden switch away from voluntary prepayment
schemes prior to 2015 to compulsory prepayment schemes after 2015. Healthcare expenditure in Dubai experienced a steady increase since 2012. Annual growth rates in
health spending were 15%, 11%, 12%, and 6% in 2013, 2014, 2016, and 2017 respectively.
Table 3. Funds of Health Care Financing over Time, Dubai (2012-2017)
Inflow Funds of health care financing schemes (Million AED)
FS.1 Transfers from government domestic revenue (allocated to health purposes)
FS.4.2 Compulsory prepayment from employers
FS.5 Voluntary prepayment
FS.6.1 Other funds from households
Total
2012 2013 2014 2016 2017
3,242
936
3,605
2,152
9,934
3,299
1,435
3,789
2,931
11,455
3,816
1,559
4,238
3,159
12,772
6,858
7,246
0
1,746
15,851
6,338
8,282
0
2,152
16,773
Table 4. Financing Schemes over Time, Dubai (2012-2017)
Financing schemes, Million AED
HF.1.1 Government schemes
HF.1.2 Compulsory contributory health care financing schemes
HF.2 Voluntary health care payment schemes
HF.3 Household out-of-pocket payment
Total
2012 2013 2014 2016 2017
3,740
-
4,043
2,152
9,934
3,800
-
4,723
2,931
11,455
4,311
-
5,302
3,159
12,772
6,858
7,246
0
1,746
15,851
6,338
8,282
0
2,152
16,773

تـقــريـر الحــســابـات الصحــيـة إلمـــارة دبــي
Health Accounts System of Dubai24
Figure 2 re-iterates the 2016 switch from voluntary to compulsory schemes as a share of total health spending.
Figure 2. Trends in Health Financing Schemes, Dubai (2012-2017)
Trends in Health Financing Schemes
0%
10%
20%
30%
40%
50%
60%
70%
80%
90%
100%
HouseholdsVoluntary inurance schemesCompulsory insurance schemesGovernment
20172016201420132012
13%
49%
38%
11%
46%
43%
25%
42%
34%
26%
41%
33%
22%
41%
38%
Types of health providers that received the healthcare expenditure amount through the various financing schemesAs shown in Table 5, the largest amount of expenditure for 2017 went to hospitals amounting to 7,567 M AED (45%), followed by the primary health care centers 4,104 M AED
(24%). Ancillary providers such as ambulance, medical and diagnostic labs, and imaging centers received 253 M AED (2%) while pharmacies received 2,511 M AED (15%).
Health governance and providers of health care system administration and financing received 1,508 M AED (9%) of the funds. Households allocated 834 M AED towards
discretionary health care spending. Only 726 M (4%) was given to providers outside Dubai. An insignificant share of total expenditure (1%) was classified as HP.n.e.c. since it
was unclear from the data which category of provider received these funds.
The HF.1.1 column of Table 5 shows that large shares of the government scheme’s spending goes towards hospitals (52%) and health system administration (24%). In
comparison, private insurance schemes provide a large share of their funds to hospitals (44%) and pharmacies (19%). As noted earlier, data about private health insurance
spending on administration and claims management was not available.
The estimates of HP X HF table for 2016 are provided in the Appendix (Table 2).

تـقــريـر الحــســابـات الصحــيـة إلمـــارة دبــي
Health Accounts System of Dubai
تـقــريـر الحــســابـات الصحــيـة إلمـــارة دبــي
Health Accounts System of Dubai25
Table 5. Health Providers (HP) by Financing Schemes (HF) in 2017 (HP X HF)
Financing schemesU.A.Emirates dirham (AED), Million
Health care providers
HF.1
Government schemes and compulsory contributory
health care financing schemes
HF.1.1
Government schemes
HF.1.1.1
Central government schemes
HF.1.1.2
State/regional/local government
schemes
HF.1.2
Compulsory contributory
health insurance schemes
HF.3
Household out-of-pocket
payment
All FS Share of FS
HP.1 Hospitals 6,898 3,296 273 3,022 3,602 670 7,567 45%
HP.3 Providers of ambulatory health care
3,455 1,074 97 977 2,381 649 4,104 24%
HP.4 Providers of ancillary services 253 244 244 9 253 2%
HP.5 Retailers and Other providers of medical goods
1,677 113 113 1,564 834 2,511 15%
HP.7 Providers of health care system administration and financing
1,508 1,508 16 1,492 [a] 1,508 9%
HP.9 Rest of the world 726 726 726 4%
HP.nec Unspecified health care provid-ers (n.e.c.)
103 103 103 103 1%
All HP 14,620 6,338 386 5,952 8,282 2,152 16,773 100%Share of HP 87% 38% 2% 35% 49% 13% 100%
[a] The available data sources had no information on internal health insurance resources devoted to administration

تـقــريـر الحــســابـات الصحــيـة إلمـــارة دبــي
Health Accounts System of Dubai26
As shown in Table 6 and Figure 3 over the last 4 years there has been a slow decline in the share of expenditure towards hospitals (47% in 2014 to 45% in 2017). There was
also a significant decrease in the share of healthcare expenditure outside of Dubai. The implementation of ISAHD could partially explain the shift of outside expenditure to
within Dubai as providers in Dubai have become more financially affordable and accessible. Furthermore, there has been a sharp increase in the funds spent on retailers and
providers of medical goods (9% in 2014 to 15% in 2017).
ISAHD has also resulted in higher government expenditures towards healthcare system administration and financing (6% in 2014 to 9% in 2016 and 2017). This measure
should be monitored closely in the coming years to ensure efficiency via economies of scales. The bottom three rows of Table 6 show a reclassification away from Rest of the
World and towards not elsewhere classified and towards health care system administration. These changes occurred because better data sources were added in 2016 that
offered a clearer indication of funds going to the rest of the world and to administration. However, roughly 1% of spending in the new data system is going to health care
providers that are not classifiable. Meaningful comparisons to past spending allocations are difficult to make.
Table 6. Funding received by Health Providers over time (Million AED), Dubai (2012-2017)
Provider Type
Hospitals
Providers of ambulatory health care
Providers of ancillary services
Retailers and Other providers of medical goods
Providers of health care system administration and financing
Rest of the world
Unspecified health care providers (n.e.c.)
2012 2013 2014 2016 2017
HP Code
HP.1
HP.3
HP.4
HP.5
HP.7
HP.9
HP.nec
All HP
4,756
2,219
368
745
379
1,434
-
9,934
5,593
2,553
190
868
608
1,643
-
11,455
5,986
2,852
219
1,184
706
1,826
-
12,772
7,381
3,498
235
2,160
1,410
633
534
15,851
7,567
4,104
253
2,511
1,508
726
103
16,773

تـقــريـر الحــســابـات الصحــيـة إلمـــارة دبــي
Health Accounts System of Dubai
تـقــريـر الحــســابـات الصحــيـة إلمـــارة دبــي
Health Accounts System of Dubai27
Figure 3. Trends in Health Care Provider Funds Received, Dubai (2012-2017)
0%
10%
20%
30%
40%
50%
60%
70%
80%
90%
100%
2012
14%
4%
7%
48%
22%
2017
4%
15%
24%
45%
9%4%
14%
9%
2016
22%
47%
2014
14%
6%
9%
22%
47%
2013
14%
5%
8%
22%
49%
Hospitals
Providers of ambulatory health cae
providers of ancillary services
Retailers and other providers of medical goods
Providers of health care system administration and financing
Rest of the world
Unpecified health care providers (n.e.c)
Trends in Healthcare Providers

تـقــريـر الحــســابـات الصحــيـة إلمـــارة دبــي
Health Accounts System of Dubai28
Health services expenditure through the various financing schemes
As shown in Table 7, in 2017, curative care received the biggest share of funds at 9,576 M AED (57%). A breakdown of curative cares indicates that inpatient care spending
was 4,312 M AED (26%) and outpatient care spending was 4,851 M AED (29%). Ancillary service spending was 2,318 M AED (14%), medical goods spending was 3,021
M AED (18%) and preventative care spending was 266 M AED (2%). Health governance, administration of health system and financing represented 1,273 M AED (8%).
Data on government schemes indicate that roughly 20% of the AED 6338 of government health spending was spent on health governance and administration. Data on
administrative activities in private schemes was unavailable. Private insurance schemes and households contributed a majority of their funds towards outpatient care, 28%
and 53% respectively. In comparison to the other two schemes, private insurance spent 20% and 22.5% on ancillary services and medical goods respectively.
Estimates of HC X HF table for 2016 are provided in the Appendix (Table 3).
Results of HASD 2017

تـقــريـر الحــســابـات الصحــيـة إلمـــارة دبــي
Health Accounts System of Dubai
تـقــريـر الحــســابـات الصحــيـة إلمـــارة دبــي
Health Accounts System of Dubai29
Financing schemesU.A.Emirates dirham (AED), Million
Health care functions
HF.1
Government schemes and compulsory contributory
health care financing schemes
HF.1.1
Government schemes
HF.1.1.1
Central government schemes
HF.1.1.2
State/regional/local government
schemes
HF.1.2
Compulsory contributory
health insurance schemes
HF.3
Household out-of-pocket
payment
All FS Share of FS
HC.1 Curative care 8,258 3,529 293 3,237 4,729 1,318 9,576 57%
HC.1.1 Inpatient curative care 4,132 2,056 126 1,930 2,076 180 4,312 26%
HC.1.2 Day curative care 413 44 44 369 413 2%
HC.1.3 Outpatient curative care 3,713 1,429 166 1,263 2,284 1,138 4,851 29%
HC.2 Rehabilitative care 55 55 55 55 0%
HC.4 Ancillary services (non-specified by function) 2,318 631 20 611 1,687 2,318 14%
HC.4.1 Laboratory services 1,283 230 12 218 1,053 1,283 8%
HC.4.2 Imaging services 793 159 8 152 634 793 5%
HC.4.3 Patient transportation 242 242 242 242 1%
HP.5 Medical goods (non-specified by function) 2,187 321 57 264 1,865 834 3,021 18%
HP.6 Preventive care 266 266 266 266 2%
HP.7 Governance, and health system and financing administration
1,273 1,273 16 1,257 [a] 1,273[a] 8% [a]
HP.8 Unspecified health care services 261 261 261 261 2%
HC.9 Other health care services not elsewhere classified (n.e.c.)
2 0.5 0.4 0.1 1 2 0%
All HP 14,620 6,338 386 5,952 8,282 2,152 16,773 100%Share of HP 87% 38% 2% 35% 49% 13% 100%
[a] Data sources did not include information on administrative activities by private insurers. This value was not zero, and its omission renders the estimate of the total and the share for HC.7 incomplete.
Table 7. Health Care Functions (HC) by Health Financing Schemes (HF) for 2017 (HC X HF)
تـقــريـر الحــســابـات الصحــيـة إلمـــارة دبــي
Health Accounts System of Dubai30
Types of health services that received the healthcare expenditure amount through the various health providers
As shown in Table 8, in 2017, hospitals received a total of 7,567 M AED of which 6,511 M AED was spent on curative care, 828 M for ancillary services, 125 M for medical goods,
and 49 M for preventive care. Primary healthcare centers received a total of 4,104 M of which 2,671 M was for curative care, 991 M for ancillary, 241 M for medical goods, and
199 M for preventive care. The Rest of the World provided a wide array of services totaling 726 M AED with majority spent towards curative care (336 M).
The majority of preventive care was provided in ambulatory settings (199 M out of 266 M). Similarly, a majority of ancillary services were provided in hospitals (828 M) and
ambulatory settings (991 M).
The estimates of HC X HP table for 2016 are provided in Appendix Table 3.

تـقــريـر الحــســابـات الصحــيـة إلمـــارة دبــي
Health Accounts System of Dubai
تـقــريـر الحــســابـات الصحــيـة إلمـــارة دبــي
Health Accounts System of Dubai31
Financing schemesU.A.Emirates dirham (AED), Million
Health care functions
HP.1
Hospitals
HP.3
Providers of ambulatory health care
HP.4
Providers of ancillary
services
HP.5
Retailers and Other providers of medical goods
HP.7
Providers of health care system administration and
financing
HP.9
Rest of the world
HP.nec
Unspecified health care providers
(n.e.c.)
All HP Share of HP
HC.1 Curative care 6,511 2,671 56 336 3 9,576 57%
HC.1.1 Inpatient curative care 3,784 331 56 142 4,312 26%
HC.1.2 Day curative care 342 63 8 413 2%
HC.1.3 Outpatient curative care 2,385 2,277 186 3 4,851 29%
HC.2 Rehabilitative care 54 1 55 0.33%
HC.4 Ancillary services (non-specified by function) 828 991 253 67 180 2,318 14%
HC.4.1 Laboratory services 433 670 11 43 126 1,283 8%
HC.4.2 Imaging services 395 321 24 54 793 5%
HC.4.3 Patient transportation 242 242 1%
HP.5 Medical goods (non-specified by function) 125 241 2,444 210 3,021 18%
HP.6 Preventive care 49 199 18 266 2%
HP.7 Governance, and health system and financing administration
1,273 1,273 8%
HP.8 Unspecified health care services 161 100 261 2%
HC.9 Other health care services not elsewhere classified (n.e.c.)
0.3 1.3 0.4 2 0.01%
All HP 7,567 4,104 253 2,511 1,508 726 103 16,773 100%Share of HP 45% 24% 2% 15% 9% 4% 1% 100%
Table 8. Health Care Functions by Health Care Providers in 2017

تـقــريـر الحــســابـات الصحــيـة إلمـــارة دبــي
Health Accounts System of Dubai32
In Table 9 one can see that the aggregate of 3 categories of curative care (outpatient, day services, and inpatient) to see that over the last 5 years, curative care has accounted
for the bulk of the healthcare services provided. Figure 4 shows that the aggregate of these 3 categories of curative care has stayed in the range of 55% to 60% of the total
costs. The share of inpatient, outpatient and day care is relatively stable. The appearance of a decrease in preventive care could be attributed to lack of data. It is also important
to note that there has been growth in the government’s expenditure on governance and financing administration.
Table 9. Expenditures on Health Care Functions over Time (Million AED), Dubai (2012-2017)
HC Code Healthcare Service 2012 2013 2014 2016 2017
HC.1 Curative care 5,505 6,820 7,524 8,509 9,576
HC.1.1 Inpatient curative care 2,981 3,043 3,457 3,574 4,312
HC.1.2 Day curative care 232 318 341 363 413
HC.1.3 Outpatient curative care 2,292 3,458 3,726 4,571 4,851
HC.2 Rehabilitative care 52 65 74 56 55
HC.4 Ancillary services (non-specified by function) 1,398 1,734 1,958 2,262 2,318
HC.4.1 Laboratory services 812 984 1,110 1,330 1,283
HC.4.2 Imaging services 435 574 647 708 793
HC.4.3 Patient transportation 151 175 202 224 242
HC.5 Medical goods (non-specified by function) 2,002 1,584 1,805 2,917 3,021
HC.6 Preventive care 550 634 584 245 266
HC.7 Governance, and health system and financing administration 377 607 704 1,327 1,273
HC.8 Unspecified health care services - - - 531 261
HC.9 Other health care services not elsewhere classified (n.e.c.) 49 7 122 3 2
All HC 9,934 11,455 12,772 15,851 16,773

تـقــريـر الحــســابـات الصحــيـة إلمـــارة دبــي
Health Accounts System of Dubai
تـقــريـر الحــســابـات الصحــيـة إلمـــارة دبــي
Health Accounts System of Dubai33
Figure 4. Trends in Healthcare Functions, Dubai (2012-2017)
Trends in Healthcare Functions

تـقــريـر الحــســابـات الصحــيـة إلمـــارة دبــي
Health Accounts System of Dubai

تـقــريـر الحــســابـات الصحــيـة إلمـــارة دبــي
Health Accounts System of Dubai
تـقــريـر الحــســابـات الصحــيـة إلمـــارة دبــي
Health Accounts System of Dubai35
The aim of this section is to compare the results of the SHA analysis for Dubai with other regional and national countries (selected) from the Organization of Economic Cooper-
ation and Development (OECD). Data from Qatar provide the closest regional comparison to Dubai’s Healthcare system given that Qatar’s insurance structure and population
distribution is similar to that of Dubai. In addition, Qatar is the only GCC country that has produced National Health Accounts as recently as 2012. SHA 2011 is institutional-
ized in OECD and the data is produced regularly. This group of healthcare systems were chosen to create a basket of countries that are similar to the current or future health
financing system in Dubai. These health systems are in the USA, United Kingdom, France, Canada, Germany, Switzerland, and South Korea.
The data for the analysis was obtained from the WHO Global Health Expenditure Database and the OECD Health Expenditure and Financing Statistics for the years 2016
or 2017 depending on availability.
Dubai has the lowest value among the selected countries when comparing Current Health Expenditure (CHE) per capita and General Government Health Expenditure (GGHE)
as a percentage of current health expenditure (CHE). It has the second lowest value when comparing CHE as percentage of GDP and preventive care as percentage of CHE. It
has the highest value among the selected countries when comparing administrative and ancillary expenditure as percentage of CHE.
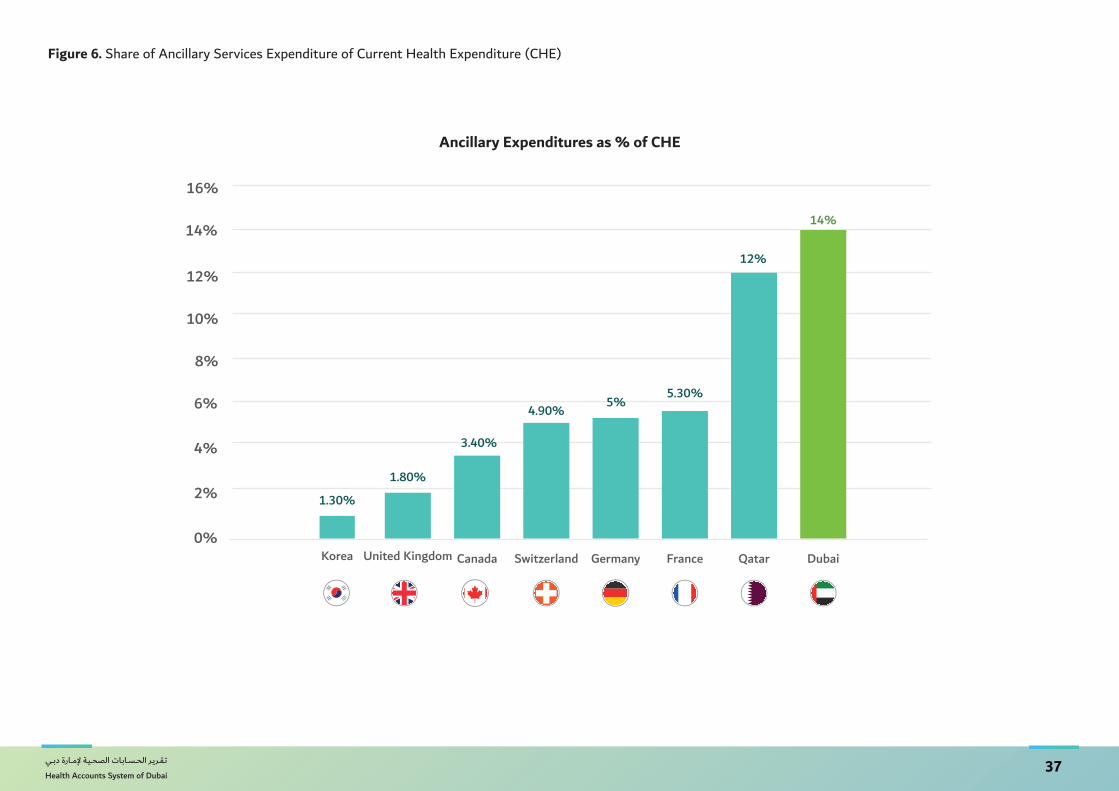
Based on the comparisons shown in Figure 5 and Figure 6, given the size of the healthcare market, Dubai has substantial expenditures in the administrative and ancillary ser-
vices. Future policies could explore streamlining the healthcare system to reduce the administrative burden and higher utilization of ancillary services.
Figure 7 shows how Dubai’s preventive spending share is lower than many OECD countries. Dubai could consider allocating more resources towards preventive health care while
reducing or maintaining the current level of OOP as share of CHE.
Additional comparison figures are provided in the Appendix.
Comparative Analysis

تـقــريـر الحــســابـات الصحــيـة إلمـــارة دبــي
Health Accounts System of Dubai36
Figure 5. Share of Administration and Financing Expenditure of Current Health Expenditure
0%
1%
2%
3%
4%
5%
6%
7%
8%
9%
Qatar
7.20%
France
5.70%
Germany
4.70%
Switzerland
3.80%
Korea
3.30%
Canada
2.90%
United Kingdom
1.80%
Dubai
8%
USA
8.30%
Administrative Expenditures as % of CHE
تـقــريـر الحــســابـات الصحــيـة إلمـــارة دبــي
Health Accounts System of Dubai
تـقــريـر الحــســابـات الصحــيـة إلمـــارة دبــي
Health Accounts System of Dubai37
Figure 6. Share of Ancillary Services Expenditure of Current Health Expenditure (CHE)
Ancillary Expenditures as % of CHE
0%
2%
4%
6%
8%
10%
12%
14%
16%
Qatar
12%
France
5.30%
Germany
5%
Switzerland
4.90%
Canada
3.40%
United Kingdom
1.80%
Korea
1.30%
Dubai
14%

تـقــريـر الحــســابـات الصحــيـة إلمـــارة دبــي
Health Accounts System of Dubai38
Figure 7. Share of Preventive Care Expenditure of Current Health Expenditure (CHE)
Preventive Care Expenditure as % of CHE
0%
1%
2%
3%
4%
5%
6%
7%
USA
2.90%
United Kingdom
5.20%
Qatar
0.40%
Switzerland
2.40%
Germany
3%
Korea
3.80%
Dubai
2%
Canada
6.20%
France
1.90%


تـقــريـر الحــســابـات الصحــيـة إلمـــارة دبــي
Health Accounts System of Dubai40
The implementation of ISAHD in 2014 has led to many significant changes in the healthcare sector. Based on the current analysis, the annual growth rate (adjusted for in-
flation) of the current health expenditure has dropped has slowly declined from 7.6% 2014 to 5.8% in 2016 and 2017. There has been a clear shift of expenditure from the
government to the private sector. The blue bars in Figure 8 extrapolate past growth rates to predict health expenditure to 2021.
Figure 8. Projected Growth Rate of Current Health Expenditure
Marketplace Insights
Projected Growth Rate of Current Health Expenditure

تـقــريـر الحــســابـات الصحــيـة إلمـــارة دبــي
Health Accounts System of Dubai
تـقــريـر الحــســابـات الصحــيـة إلمـــارة دبــي
Health Accounts System of Dubai41
Government
Our analysis of the Health Financing Schemes X Financing Sources table indicates
that there has been a steady increase in the Current Health Expenditure with a de-
cline in the share of the expenditure by the government. The decrease in the gov-
ernment’s share of funds is matched equivalently by a higher share of funds from
employers.
The government spends substantially on governance and administration of the
health system and financing. Dubai places right below United States when com-
paring the share of CHE towards governance and administration. This is striking
because our calculation of governance spending does not even include governance
and administration activities inside private insurance companies. (Data limitations
precluded estimating this private sector expenditure.)
The majority of government funds were allocated towards hospitals especially for
curative care (inpatient and outpatient care) and medical goods. The goal of ISAHD
was to make the primary care model more accessible and affordable, thereby de-
creasing the burden on hospitals. The evidence indicates there still are barriers to
accessing primary care that need to be explored.
Health Insurance Companies and TPAs
Since the implementation of ISAHD, private health insurers and TPAs preside over a
large share of current health expenditure at 49%. This share is expected to increase
as the government slowly decreases its funding, and privately insured households
increase their utilization of healthcare due to higher coverage than previous years.
With the planned implementation of DRGs and prospective payment mechanisms,
the share of expenditure for health insurance companies is expected to stabilize in
the next 3-5 years.
Funds from private insurance are spent mostly on curative care (57%), followed
by ancillary services (20%) and medical goods (22.5%). Dubai currently ranks the
highest in the utilization of ancillary services and has one of the lowest allocations
to preventive care among all OECD countries.
Households
The main goal of ISAHD was to ensure that every resident of Dubai has access to
affordable health care. In 2016, all of the residents were covered under government
or private insurance. Households spent the majority of their out of pocket health
care spending on outpatient care and medical goods. While the utilization of health
services remained relatively stable, there was a steep increase in the purchase of
medical goods as a result of the higher coverage. The presence of insurance lowered
the effective out of pocket prices for medical goods and simultaneously increased
utilization as well as out of pocket spending. This increase was mostly seen among
Non-Emiratis in Households and Emiratis.
The insurance-induced changes in medical utilization post-implementation of ISAHD
closely corroborates the experimental results of the RAND experiment conducted in
the US that showed how more insurance coverage stimulates more utilization for the
above-mentioned populations.
It is important to note that a growth of the financial population from 3.7 million to
4.56 million represents the addition of 860,000 new people to the financial protec-
tion system in Dubai in 2017. This represents an extremely high rate of growth of
23% between 2016 and 2017. This population growth rate is not aligned with the

تـقــريـر الحــســابـات الصحــيـة إلمـــارة دبــي
Health Accounts System of Dubai
6% growth of health expenditure over the same period seen in Table 1.
This apparent anomaly where the financially covered population suddenly grows in
a year could be due to the heavily transient population of the blue-collar workers.
Often, there is a large population of workers temporarily immigrating to Dubai when
there is a high demand in the construction and infrastructure sectors and emigrat-
ing when the projects are completed. It is also important to note that the employer
mandate to insure all workers began to apply to firms under 100 employees in July
2017 and this led to a surge in new insurance contracts in the middle of the year.
The data show that based on the numbers of insurance contracts, many new blue-col-
lar workers did become covered by health insurance policies as mandated by Law 11.
However, blue collar workers did not increase their per capita use of health services
(See Figure 9). Potential explanations would be continued barriers to utilization.
These range from low awareness of new insurance benefits, obstacles in scheduling,
transport, and logistics, cultural and social barriers, fear of stigma, privacy concerns,
and residual financial barriers from the co-payment levels. If the intent of Law 11
was to extend a safety net of effective health care coverage to all residents of the
Emirate, then understanding the remaining barriers to care for Dubai’s blue-collar
workers should become a priority.

تـقــريـر الحــســابـات الصحــيـة إلمـــارة دبــي
Health Accounts System of Dubai
تـقــريـر الحــســابـات الصحــيـة إلمـــارة دبــي
Health Accounts System of Dubai43
Figure 9 (a). OOP Expenditure Trend for Each Population Group
OOP Expenditure Trend for Each Population Group
Figure 9 (b). OOP Expenditure per capita Trend for Each Population Group
OOP Expenditure per capita Trend for Each Population Group

تـقــريـر الحــســابـات الصحــيـة إلمـــارة دبــي
Health Accounts System of Dubai

تـقــريـر الحــســابـات الصحــيـة إلمـــارة دبــي
Health Accounts System of Dubai
تـقــريـر الحــســابـات الصحــيـة إلمـــارة دبــي
Health Accounts System of Dubai45
Comparative Analysis with OECD Countries
Appendix Figure 1. Current Health Expenditure (CHE) per Capita (US$)
Appendix
CHE per capita (US$)
CHE as % of GDP
Appendix Figure 2. Current Health Expenditure (CHE) as Percentage of GDP

تـقــريـر الحــســابـات الصحــيـة إلمـــارة دبــي
Health Accounts System of Dubai46
Appendix Figure 3. General Government Expenditure on Health (GGHE) as Percentage of Current Health Expenditure (CHE)
GGHE as % of CHE
OOP as % of CHE
Appendix Figure 4. Share of Out of Pocket Expenditure of Current Health Expenditure (CHE)

تـقــريـر الحــســابـات الصحــيـة إلمـــارة دبــي
Health Accounts System of Dubai
تـقــريـر الحــســابـات الصحــيـة إلمـــارة دبــي
Health Accounts System of Dubai47
Appendix Figure 5. Share of Curative Care Expenditure of Current Health Expenditure (CHE)
Curative Care Expenditures as % of CHE

تـقــريـر الحــســابـات الصحــيـة إلمـــارة دبــي
Health Accounts System of Dubai48
Appendix Table 1. Health Financing Schemes X Funds Of Health Care Financing Schemes
SHA Tables for 2016
Inflow Funds of health care financing schemesU.A.Emirates dirham (AED), Million
Health care providers
FS.1
Transfers from government domestic revenue (allocated
to health
FS.4.2
Compulsory prepayment from employers
FS.6.1
Other funds from house-holds n.e.c.
All FS
HF.1 Government schemes and compulsory contributory health care financing schemes
6,858 7,246 0 14,104
HF.1.1 Government schemes 6,858 0 0 6,858
HF.1.1. Central government schemes 380 0 0 380
HF.1.1.2 State/regional/local government schemes 6,478 0 0 6,478
HF.1.2 Compulsory contributory health insurance schemes 0 7,246 0 7,246
HF.1.2.2 Compulsory private insurance schemes 0 7,246 0 7,246
HF.3 Household out-of-pocket payment 0 0 1,746 1,746
All HP 6,858 7,246 1,746 15,851

تـقــريـر الحــســابـات الصحــيـة إلمـــارة دبــي
Health Accounts System of Dubai
تـقــريـر الحــســابـات الصحــيـة إلمـــارة دبــي
Health Accounts System of Dubai49
Appendix Table 2. Health Providers X Health Financing Schemes
Financing schemesU.A.Emirates dirham (AED), Million
Health care providers
HF.1
Government schemes and compulsory contributory
health care financing schemes
HF.1.1
Government schemes
HF.1.1.1
Central government schemes
HF.1.1.2
State/regional/local government
schemes
HF.1.2
Compulsory contributory
health insurance schemes
HF.3
Household out-of-pocket
payment
All FS
HP.1 Hospitals 6,754 3,471 198 3,273 3,283 627 7,381
HP.3 Providers of ambulatory health care
3,055 1,124 149 975 1,931 443 3,498
HP.4 Providers of ancillary services 235 226 0 226 9 0 235
HP.5 Retailers and Other providers of medical goods
1,483 93 0 93 1,390 677 2,160
HP.7 Providers of health care system ad-ministration and financing
1,410 1,410 33 1,377 0 0 1,410
HP.9 Rest of the world 633 0 0 0 633 0 633
HP.nec Unspecified health care provid-ers (n.e.c.)
534 534 0 534 0 0 534
All HP 14,104 6,858 380 6,478 7,246 1,746 15,851

تـقــريـر الحــســابـات الصحــيـة إلمـــارة دبــي
Health Accounts System of Dubai50
Appendix Table 3. Health care Functions X Health Financing Schemes
Financing schemesU.A.Emirates dirham (AED), Million
Health care functions
HF.1
Government schemes and compulsory contributory
health care financing schemes
HF.1.1
Government schemes
HF.1.1.1
Central government schemes
HF.1.1.2
State/regional/local government
schemes
HF.1.2
Compulsory contributory
health insurance schemes
HF.3
Household out-of-pocket
payment
All FS
HC.1 Curative care 7,439 3,197 213 2,984 4,242 1,070 8,509
HC.1.1 Inpatient curative care 3,428 1,729 56 1,673 1,699 146 3,574
HC.1.2 Day curative care 363 64 0 64 299 0 363
HC.1.3 Outpatient curative care 3,648 1,404 157 1,247 2,243 923 4,571
HC.2 Rehabilitative care 56 56 0 56 0 0 56
HC.4 Ancillary services (non-specified by function) 2,262 762 52 710 1,501 0 2,262
HC.4.1 Laboratory services 1,330 368 35 333 963 0 1,330
HC.4.2 Imaging services 708 170 17 153 538 0 708
HC.4.3 Patient transportation 224 224 0 224 0 0 224
HC.5 Medical goods (non-specified by function) 2,240 739 82 657 1,501 677 2,917
HC.6 Preventive care 245 245 0 245 0 0 245
HC.7 Governance, and health system and financing administration
1,327 1,327 33 1,294 0 0 1,327
HC.8 Unspecified health care services 531 531 0 531 0 0 531
HC.9 Other health care services not elsewhere classified (n.e.c.)
3 1 0 0 2 0 3
All HP 14,104 6,858 380 6,478 7,246 1,746 15,851

تـقــريـر الحــســابـات الصحــيـة إلمـــارة دبــي
Health Accounts System of Dubai
تـقــريـر الحــســابـات الصحــيـة إلمـــارة دبــي
Health Accounts System of Dubai51
Appendix Table 4. Health care Functions X Health Providers
Health care providersU.A.Emirates dirham (AED), Million
Health care functions
HP.1
Hospitals
HP.3
Providers of ambulatory health care
HP.4
Providers of ancillary
services
HP.5
Retailers and Other providers of medical goods
HP.7
Providers of health care system administration and
financing
HP.9
Rest of the world
HP.nec
Unspecified health care providers
(n.e.c.)
All HP Share of HP
HC.1 Curative care 5,910 2,225 0 0 75 294 3 8,509 57%
HC.1.1 Inpatient curative care 3,297 91 0 0 75 111 0 3,574 26%
HC.1.2 Day curative care 294 65 0 0 0 5 0 363 2%
HC.1.3 Outpatient curative care 2,320 2,069 0 0 0 179 3 4,571 29%
HC.2 Rehabilitative care 56 1 0 0 0 0 0 56 0.33%
HC.4 Ancillary services (non-specified by function) 910 885 234 70 0 163 0 2,262 14%
HC.4.1 Laboratory services 528 635 10 42 0 115 0 1,330 8%
HC.4.2 Imaging services 382 250 0 27 0 48 0 708 5%
HC.4.3 Patient transportation 0 0 224 0 0 0 0 224 1%
HP.5 Medical goods (non-specified by function) 412 232 0 2,090 7 175 0 2,917 18%
HP.6 Preventive care 92 153 0 0 0 0 0 245 2%
HP.7 Governance, and health system and financing administration
0 0 0 0 1,327 0 0 1,327 8%
HP.8 Unspecified health care services 0 0 0 0 0 0 531 531 2%
HC.9 Other health care services not elsewhere classified (n.e.c.)
0 2 0 0 0 0 0 3 0.01%
All HP 7,381 3,498 235 2,160 1,410 633 534 15,851 100%

تـقــريـر الحــســابـات الصحــيـة إلمـــارة دبــي
Health Accounts System of Dubai52
2016 - 2017
الـــــصـــــحـــي للـضـــمـــــان دبـــي مـــــؤســـــــــة تــقـريـــر الحســابـات الصحيــة إلمــارة دبـي

تـقــريـر الحــســابـات الصحــيـة إلمـــارة دبــي
Health Accounts System of Dubai
تـقــريـر الحــســابـات الصحــيـة إلمـــارة دبــي
Health Accounts System of Dubai53
وقد استند إصدار هذه النسخة من التقرير على حاجتين أساسيتين:
• قياس األبعاد المالية لنظام الرعاية الصحية في إمارة دبي والذي بدوره سيتيح الفرصة لتوزيع مبالغ التمويل بين القطاع الصحي الحكومي والخاص بكفاءة وفعالية عالية.
• مراقبة التغيرات في توزيع الموارد المالية بين القطاع الصحي الحكومي والخاص وإتاحة المجال للمقارنات المعيارية مع باقي دول العالم، حيث مراقبة التغيرات المالية على مدى
األعوام القادمة والفائتة ستوفر البيانات الالزمة لقياس حجم االستثمار الصحي في المستقبل
لكل من الحكومة والمستثمرين.
وبعــد النجــاح الالفــت الــذي حققــه إصــدار تقريــر الحســابات الصحيــة إلمــارة دبــي؛ تتقــدم هيئــة الصحــة
بدـبـي بجزيــل الشــكر والعرفــان لجميــع الجهــات الخارجيــة المشــاركة لمســاهمتهم الفعالــة والمهمــة
لتحويــل نظــام دبــي الصحــي إلــى نظــام كــفء وفعــال.
وبالختــام، نتطلــع قدمــا الســتمرار التعــاون مــع جميــع الجهــات المشــاركة والحصــول عـلـى الدعــم
المســتمر والمنشــود إلصــدار التقريــر الســنوي ”حصــد“. كمــا أدعوهــم لالطــالع علــى المعلومــات الــواردة
ـفـي هــذا التقريــر لدعــم اتخــاذ القــرارات التــي ســتمكنهم مــن تقديــم وتأميــن أرـقـى أنــواع الخدمــات
الصحيــة فإلمــارة.
فــي ظــل القيــادة الرشــيدة لصاحــب الســمو الشــيخ محمــد بــن راشــد آل مكتــوم – نائــب رئيــس الدولــة،
رئيــس مجلــس الــوزراء، حاكــم دـبـي – تشــهد كافــة القطاعــات الحيويــة ـفـي إمــارة دـبـي تطــورا ملحوظــا
وتقدمــا يفــوق التوقعــات وخاصــة فــي القطــاع االقتصــادي. ويرتكــز الهــدف األساســي لهــذا التقــدم فــي
بنــاء بيئــة اقتصاديــة واجتماعيــة مســتدامة قــادرة علــى تلبيــة كافــة المتطلبــات واالحتياجــات الصحيــة
لجميــع قاطنــي إمــارة دبــي.
كتمــال تطبيــق قانــون الضمــان الصحــي اإللزامــي رقــم 11 لســنة 2013، شــهد القطــاع وتزامنــا مــع إ
الصحــي فــي إمــارة دبــي تطــورا ملموســا وســريعا. حيــث كرســت هيئــة الصحــة بدبــي جميــع االمكانيــات
المتاحــة لضمــان اســتمرارية وجــودة وســهولة الحصــول علــى الخدمــات الصحيــة لكافــة ســكان إمــارة
دبــي وزوارهــا.
يشكل توفير مصادر تمويل مستدامة وكافية حجر األساس لنجاح أي نظام صحي
ومــن دواعــي ســرورنا أن نطلــق النســخة الثالثــة علــى التوالــي لتقريــر الحســابات الصحيــة فــي إمــارة دبــي
لألعــوام الماليــة 2017-2016. حيــث يعكــس نتائــج التقريــر مــا تــم تحقيقــه فــي ظــل تطبيــق التغطيــة
التأمينيــة الشــاملة، والتــي ســاهمت بشــكل فعــال فــي دعــم عمليــة اتخــاذ القــرار المســتند علــى األدلــة
وذلــك لجعــل الرعايــة الصحيــة فــي متنــاول الجميــع وبــذات جــودة عاليــة. كمــا يعــد هــذا التقريــر المعيــار
األساســي إلنتــاج نظــام الحســابات الصحيــة الوطنيــة لدولــة اإلمــارات العربيــة المتحــدة، بمــا يتماشــى
مــع المنهــج العالمــي لتصنيــف اإلنفــاق علــى الصحــة.
المقدمة
معالي/ حميد القطاميالـــــــــمــــــــديــــــــر الــــــــعــــــــام
هيئــــــــة الصحــــــــة بدبــــــــي

تـقــريـر الحــســابـات الصحــيـة إلمـــارة دبــي
Health Accounts System of Dubai54
شكر وتقديرتــم توفيــر التقريــر الشــامل للحســابات الصحيــة إلمــارة دـبـي (حصــد) ألعــوام الماليــة 2016-2017
بجهــود كبيــرة مــن قبــل فريــق مؤسســة دـبـي للضمــان الصحــي و بالتعــاون مــع الجهــات المشــاركة،
حيــث تطلــب عمليــة جمــع موثوقــة للبيانــات المتعلقــة باإلنفــاق الصحــي المتدفقــة عبــر نظــام الرعايــة
الصحيــة فــي دبــي والتحقــق مــن صحتهــا وتحليلهــا علميــا وذلــك بهــدف نشــر تقريــر يتصــف بالوضــوح
والشــفافية ووضــع الخطــط واالســتراتيجيات المطلوبــة. ونخــص بالشــكر:
• الســيد/ صالــح الهاشــمي – المديــر التنفيــذي لمؤسســة دبــي للضمــان الصحــي – علــى إشــرافه ودعمــه المباشــر فــي إطــالق النســخة الثالثــة مــن الحســابات الصحيــة إلمــارة دبــي
الفريق الفني المسؤول عن تنفيذ “حصد” وإصدار التقرير ضم كل من:
• د. مينو مهاك أخصائي، مؤسسة دبي للضمان الصحي
• السيدة / خديجة محمد المندوس رئيس مكتب المدير التنفيذي، مؤسسة دبي للضمان الصحي
• السيد/ فيليب سواني أخصائي أول، مؤسسة دبي للضمان الصحي
• د. الضو عبدهللا سليمان مستشار، قطاع االستراتيجية والتطوير المؤسسي
• د. ديفيد بيشاي استشاري اقصاديات الصحة رئيسي، جامعة جونز هوبكنز
• السيدة/ شرينا ماالفيا استشاري اقتصاديات الصحة، جامعة جونز هوبكنز
الرسالة
تزامنــا مــع إطــالق وتطبيــق برنامــج اســعاد (منظومــة الضمــان الصحــي بدبــي) ونظــرا لهــذه الخطــوة فإنه
مــن المهــم مراقبــة تطــور التمويــل الصحــي التخــاذ أي قــرار بشــأن الحيــز المالــي الصحــي ومــن أجــل
توفيــر تمويــل مســتدام وتخصيــص المــوارد المناســبة.
وتماشــيا مــع معاييــر منظمــة الصحــة العالميــة والهيئــة الوطنيــة للصحــة، فــإن الحســابات الصحيــة
توفــر مؤشــرات رئيســية للتمويــل الصحــي كل عــام، االمــر الــذي ينعكــس علــى القــرارات والسياســات
ذات الصلــة. كمــا تســمح الحســابات الصحيــة بإنشــاء مقارنــة عالميــة لمؤشــرات تــم اختيارهــا، ممــا
يمكننــا مــن تحســين مدخــالت التمويــل لحســابات صحيــة أفضــل. وباإلضافــة إلــى ذلــك، يقــدم تقريــر
الحســابات الصحيــة إلمــارة دبــي حصــد لألعــوام الماليــة 2017-2016 نظــرة ثاقبــة لمؤشــرات تمويــل
القطــاع الصحــي لدبــي.
مــن الصحيــة الحســابات تقريــر عـلـى لعملهــم الفنــي فريــق حصــد جهــود عـلـى أثنــي أن أود كمــا
خــالل تبنــي وتطويــر المنهجيــات، ولجهودهــم المكثفــة للحصــول علــى بيانــات دقيقــة والتــي بدورهــا
ستســاعدنا عـلـى اعــادة توجيــه سياســاتنا الحاليــة نحــو نظــام صحــي عــادل وفعــال.
صــــــــــالـــــح الــــــــهـــــــــــاشــــــــمــــــي
الــــــــمــــــديـــــــــر الـــــــتـــــــنــــــفــــيــــــــذي
مؤسسة دبي للضمان الصحي

تـقــريـر الحــســابـات الصحــيـة إلمـــارة دبــي
Health Accounts System of Dubai
تـقــريـر الحــســابـات الصحــيـة إلمـــارة دبــي
Health Accounts System of Dubai55
فــي عــام 2013 طبقــت إمــارة دبــي القانــون رقــم 11 بشــأن الضمــان الصحــي فــي إمــارة دبــي لتزويــد جميــع
المقيميــن لديهــا بتغطيــة تأمينيــة عالميــة، والــذي يطلــق عليــه كذلــك منظومــة الضمــان لتعزيــز الصحــة
فــي دبــي ( اســعاد)، حيــث أصبــح القانــون قيــد التنفيــذ فــي الربــع األول مــن 2014 و أحــدث تغييــرات
كبيــرة لقطــاع الرعايــة الصحيــة. وقــد كان الهــدف مــن اســعاد هــو تحقيــق التغطيــة الشــاملة بحلــول
منتصــف 2016 وزيــادة القــدرة علــى تحمــل تكاليــف الرعايــة الصحيــة وتســهيل الحصــول عليهــا.
وعليــه البــد مــن تحليــل ومراقبــة ســريان االنفــاق خــالل النظــام لضمــان تطبيــق منظومــة اســعاد بشــكل
جيــد ولتشــكيل سياســات مســتقبلية، وذلــك يتطلــب جمعــا وتحليــال معتمــدا للبيانــات بنــاء عـلـى
المعاييــر المعتمــدة.
يقــدم نظــام الحســابات الصحيــة لدبــي (حصــد) حســابا واقعيــا للنفقــات الصحيــة مــن قبــل الحكومــة
والقطــاع الخــاص، مــن خــالل مهــام الرعايــة الصحيــة ونــوع مقــدم الرعايــة الصحيــة.
حيــث يســتند التقريــر علــى البيانــات التــي تــم جمعهــا بيــن عامــي 2016 و 2017 مــع التعديــل القائــم
عـلـى معــدل التضخــم باســتخدام مؤشــر ســعر المســتهلك مــع خــط اســاس ســنة 2014 حتــى تتــم
مقارنتــه بنتائــج 2012 و 2013 ولمالحظــة كميــة التغيــرات منــذ الفتــرة التــي ســبقت تطبيــق منظومــة
اســعاد فــي 2014. وتماشــيا مــع التحليــل الســابق ذكــره نقــوم بتعريــف حــدود إنفــاق القطــاع الصحــي
لدبــي التــي تمــت مــن قبــل مواطنــي امــارة دبــي أو غيــر المواطنيــن حاملــي تأشــيرات صــادرة مــن دبــي
بغــض النظــر عــن موطنهــم، علمــا بــأن التقريــر شــمل نفقــات حتــى خــارج الحــدود الجغرافيــة لإلمــارة.
كمــا يســتثني الحســاب نفقــات الرعايــة الصحيــة الخاصــة بالســياح الذيــن اقامــوا فــي دبــي لفتــرة زمنيــة
قصيــرة، إلــى جانــب ذلــك تــم اســتثناء نفقــات الرعايــة الصحيــة ضمــن الحــدود الجغرافيــة إلمــارة لدبــي
التــي تــم انفاقهــا بالنيابــة عــن مواطنــي االمــارات االخــرى أو مــن قبــل العامليــن غيــر المواطنيــن حاملــي
تأشــيرات صــادرة مــن إمــارات أخــرى.
الملخص التنفيذيوبنــاء عـلـى التحليــالت القائمــة عـلـى أســس ومعاييــر عالميــة تبيــن بــأن إمــارة دـبـي أنفقــت ـفـي 2017
مبلــغ 16,773 مليــون درهــم علــى قطــاع الرعايــة الصحيــة ( %4.3 مــن اجمالــي الناتــج المحلــي) منهــا
726 مليــون درهــم تــم انفاقهــا خــارج دبــي. حيــث بلــغ معــدل النمــو الســنوي %6 بيــن 2016 و 2017
بعــد التعديــل الــذي تــم بنــاء علــى معــدل التضخــم.
ـفـي االنفــاق الصحــي متماثــال عـلـى مســتوى جميــع المصــادر، ومقارنــة بتقديــرات ولــم يكــن النمــو
2016، كانــت معــدالت النمــو التــي تــم رصدهــا ـفـي 2017 كاآلـتـي: 3+% ، 2+% و 5-% ـفـي العــام
الواحــد لشــركات التأميــن والضمــان الصحــي الحكومــي والتكاليــف المدفوعــة مــن قبــل االفــراد وذلــك
علــى التوالــي خــالل 2017. وبالمقارنــة مــع حســابات2014 التــي شــملت %25مــن المبالــغ التــي تــم
دفعهــا مــن قبــل االفــراد للحصــول علــى الرعايــة الصحيــة، تــم تخفيــض حصــة النفقــات الصحيــة التــي
تــم تغطيتهــا مــن قبــل االفــراد واالســر لســنة 2017 لتصــل اـلـى مــا نســبته %13. كمــا انفــق قطــاع
الضمــان الصحــي الخــاص 8,282 مليــون درهــم ( %49) عـلـى الرعايــة الصحيــة مقارنــة ب6,338
مليــون درهــم ( %38) تــم انفاقهــا مــن قبــل الحكومــة و التكاليــف التــي تــم تحملهــا مــن قبــل االفــراد
والتــي وصلــت اـلـى 2,152 مليــون درهــم أي ( 13%).
وبلغــت نســب حصــص جميــع النفقــات الصحيــة التــي تــم اســتقبالها مــن قبــل شــتى مقدمــي الخدمــة
الطبيــة %45، %24، %15 و %2 لــكل مــن المستشــفيات والعيــادات وصيدليــات البيــع بالتجزئــة
ومقدمــي الخدمــات المســاعدة علــى التوالــي. حيــث شــهدت هــذه النفقــات انخفاضــا طفيفــا فــي حصــة
االنفــاق الصــادر الــى المستشــفيات وذلــك الصــادر الــى مقدمــي الخدمــة الطبيــة خــارج امــارة دبــي. وقــد
يفســر بشــكل جزئــي هــذا االنخفــاض فــي نســبة النفقــات الــواردة لمقدمــي الخدمــة الطبيــة خــارج امــارة
دبــي كنتيجــة لتطبيــق برنامــج اســعاد الــذي كان الســبب فــي جعــل مقدمــي الخدمــة الطبيــة داخــل امــارة
كثــر ســهولة بالنســبة للعمــالء فــي الحصــول علــى الرعايــة الصحيــة وبتكاليــف معقولــة. دبــي أ