Embed Size (px)
Citation preview
1
HEALTH ACCESS AND UTILIZATION SURVEY
ACCESS TO HEALTH SERVICES IN JORDAN AMONG IRAQI REFUGEES
Baseline Survey
December 2016
FOR:
United Nations High Commissioner for Refugees
BY:
2
DOCUMENT CONTENTS
3
Table of Contents DOCUMENT CONTENTS ................................................................................................................................ 2
Executive summary ....................................................................................................................................... 7
1. INTRODUCTION ......................................................................................................................................... 9
1.1 Background & Objective ................................................................................................................... 9
1.2 Overview of Health Services Available to UNHCR PoCs in Jordan .................................................... 9
1.3 Research context ................................................................................................................................... 10
1.4 Research design & methodology .......................................................................................................... 10
1.5 Research limitations .............................................................................................................................. 13
2. SAMPLE STRUCTURE ............................................................................................................................... 14
2.1 Iraqi refugees profile ............................................................................................................................. 14
2.2 Household head profile ......................................................................................................................... 15
2. 3 Household Profile ................................................................................................................................. 16
2.4 Sample structure summary ................................................................................................................... 18
3. HEALTH SERVICES AWARENESS .............................................................................................................. 19
3.1 Health services awareness summary .................................................................................................... 20
4. CHILD VACCINATION ............................................................................................................................... 21
4.1 Child vaccination summary ................................................................................................................... 23
5. Antenatal care ......................................................................................................................................... 24
5.1 Access to antenatal care ....................................................................................................................... 24
5.2 Family planning ..................................................................................................................................... 27
5.3 Contraceptives ...................................................................................................................................... 28
5.4 Antenatal care summary ....................................................................................................................... 28
6. CHRONIC DISEASE ................................................................................................................................... 29
6.1 Type of disease...................................................................................................................................... 29
6.2 Access to medicine for chronic conditions ........................................................................................... 30
6.3 Access to medical services for chronic conditions ................................................................................ 30
6.4 Chronic disease summary ..................................................................................................................... 31
7. DISABILITY & IMPAIRMENT ..................................................................................................................... 32
7.1 Type of disability & impairment ............................................................................................................ 32
7.2 Disability & impairment therapy ........................................................................................................... 33
7.3 Barriers to proper care .......................................................................................................................... 33
4
7.4 Disability & impairment summary ........................................................................................................ 34
8. MONTHLY HEALTH ACCESS ASSESMENT................................................................................................. 35
8.1 First facility ............................................................................................................................................ 35
8.2 Second facility ....................................................................................................................................... 37
8.3 Household spending ............................................................................................................................. 38
8.4 Monthly household assesment summary ............................................................................................. 38
5
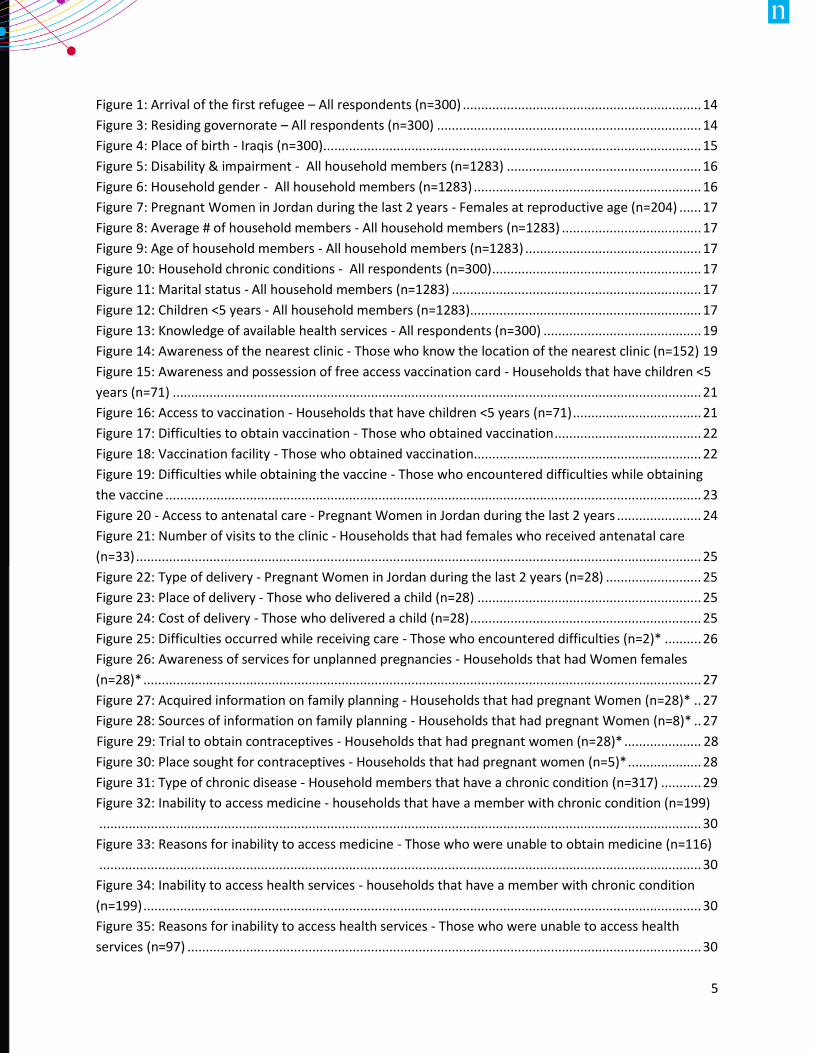
Figure 1: Arrival of the first refugee – All respondents (n=300) ................................................................. 14
Figure 3: Residing governorate – All respondents (n=300) ........................................................................ 14
Figure 4: Place of birth - Iraqis (n=300) ....................................................................................................... 15
Figure 5: Disability & impairment - All household members (n=1283) ..................................................... 16
Figure 6: Household gender - All household members (n=1283) .............................................................. 16
Figure 7: Pregnant Women in Jordan during the last 2 years - Females at reproductive age (n=204) ...... 17
Figure 8: Average # of household members - All household members (n=1283) ...................................... 17
Figure 9: Age of household members - All household members (n=1283) ................................................ 17
Figure 10: Household chronic conditions - All respondents (n=300) ......................................................... 17
Figure 11: Marital status - All household members (n=1283) .................................................................... 17
Figure 12: Children <5 years - All household members (n=1283)............................................................... 17
Figure 13: Knowledge of available health services - All respondents (n=300) ........................................... 19
Figure 14: Awareness of the nearest clinic - Those who know the location of the nearest clinic (n=152) 19
Figure 15: Awareness and possession of free access vaccination card - Households that have children <5
years (n=71) ................................................................................................................................................ 21
Figure 16: Access to vaccination - Households that have children <5 years (n=71) ................................... 21
Figure 17: Difficulties to obtain vaccination - Those who obtained vaccination ........................................ 22
Figure 18: Vaccination facility - Those who obtained vaccination.............................................................. 22
Figure 19: Difficulties while obtaining the vaccine - Those who encountered difficulties while obtaining
the vaccine .................................................................................................................................................. 23
Figure 20 - Access to antenatal care - Pregnant Women in Jordan during the last 2 years ....................... 24
Figure 21: Number of visits to the clinic - Households that had females who received antenatal care
(n=33) .......................................................................................................................................................... 25
Figure 22: Type of delivery - Pregnant Women in Jordan during the last 2 years (n=28) .......................... 25
Figure 23: Place of delivery - Those who delivered a child (n=28) ............................................................. 25
Figure 24: Cost of delivery - Those who delivered a child (n=28) ............................................................... 25
Figure 25: Difficulties occurred while receiving care - Those who encountered difficulties (n=2)* .......... 26
Figure 26: Awareness of services for unplanned pregnancies - Households that had Women females
(n=28)* ........................................................................................................................................................ 27
Figure 27: Acquired information on family planning - Households that had pregnant Women (n=28)* .. 27
Figure 28: Sources of information on family planning - Households that had pregnant Women (n=8)* .. 27
Figure 29: Trial to obtain contraceptives - Households that had pregnant women (n=28)* ..................... 28
Figure 30: Place sought for contraceptives - Households that had pregnant women (n=5)* .................... 28
Figure 31: Type of chronic disease - Household members that have a chronic condition (n=317) ........... 29
Figure 32: Inability to access medicine - households that have a member with chronic condition (n=199)
.................................................................................................................................................................... 30
Figure 33: Reasons for inability to access medicine - Those who were unable to obtain medicine (n=116)
.................................................................................................................................................................... 30
Figure 34: Inability to access health services - households that have a member with chronic condition
(n=199) ........................................................................................................................................................ 30
Figure 35: Reasons for inability to access health services - Those who were unable to access health
services (n=97) ............................................................................................................................................ 30
6
Figure 36: Type of disability/impairment - Household members who had a disability/impairment (n=78)
.................................................................................................................................................................... 32
Figure 37: Cause of disability/impairment - Household members who are disabled/impaired (n=78) ..... 32
Figure 38: Place of first treatment - those who had a violence/war related disability/impairment (n=12)*
.................................................................................................................................................................... 33
Figure 39: Type of treatment received - Household members who are disabled/impaired (n=78) .......... 33
Figure 40: Barriers to proper care - Household members who are disabled / impaired (n=78) ................ 33
Figure 41: Need to access health care in the past month - All household members (n=1283).................. 35
Figure 42: Sought health care services in the past month - All household members (n=1283) ................. 35
Figure 43: First facility - Those who sought health care services (n=324) .................................................. 36
Figure 44: Sought healthcare elsewhere - Those who sought healthcare services (n=171) ...................... 37
Figure 45: Second facility - Those who sought care elsewhere (n=32) ...................................................... 37
Figure 46: Household spending in the last month - All respondents (n=300) ............................................ 38
Figure 47: Mean household income & expenditure ................................................................................... 38
7
Executive summary
Approximately 80% of the more than 727,000 refugees in Jordan live in major urban centres. More and
more, UNHCR and partners recognize the link between robust support of non-camp refugees and local
host communities, and the preservation of existing protection space. Compared to camp refugees,
reliable data on the health service needs of non-camp refugees is more difficult to collect on a routine
basis. In an effort to develop a cost-effective and efficient mechanism for regularly monitoring the
health access and utilization of non-camp refugees, UNHCR in collaboration with Nielsen have carried
out a household telephone survey. The main objectives of the survey were to evaluate access to and
utilization of key health services and challenges faced by registered non-camp refugees.
The health access & utilization survey is a tool used by UNHCR on annual basis to monitor non-camp
refugees’ access and utilization behaviors over time and it assess each of the following attributes:
Sample structure
Iraqi refugees living in non-camp settings are predominantly concentrated in Amman (90%).
Among the 300 interviewed Iraqi households, 1283 members were reported living within these
households given an average of 4 members per household.
An average of 1 child was reported living among the 300 interviewed Iraqi households
Health services access & awareness
35% of the respondents lack awareness of free access to health services in UNHCR facilities
49% of the respondents lacked awareness on the location of the nearest clinic
Childhood vaccination
77% of the households who had children less than 5 years old have been aware of the free
access to the child vaccination care while 83% obtained the child vaccination card.
From the households who had children less than 5 years old, 9 in 10 of them had their children
vaccination for both MMR & Polio where governmental facilities were the main source of
vaccination.
Antenatal care
From those who needed antenatal care (17%), 2 in 10 of them didn’t receive the needed care.
Private hospitals and clinics were predominantly the main place of delivery followed by
governmental hospitals
Majority of the deliveries were not free of charge (64%) as a result of 50% of the deliveries took
place in private hospitals.
8
Chronic diseases
Hypertension is predominantly the most reported disease followed by Diabetes among
household members who had a chronic disease
37% and 31% were unable to access medicine and health services respectively. Inability to
afford user fees was the most reported reason for not accessing medicine and health services
scoring 58% and 64% respectively.
Disability & impairment
Half of the impaired/disabled households reported natural reason as cause of disability while 2
in 10 reported that accidents was the cause of their disability
Rehabilitation (42%) followed by Surgical (36%) treatments were the main types of treatment
received by the disabled/impaired household members.
Inability to afford user fees (41%) is predominantly the main barrier to proper care followed by
the respondent’s personal sentiment that the treatment is unnecessary (19%)
Monthly health access assessment
1 in 4 household members sought health care during the last month of the interview
Private hospitals/clinics were the first sought facility scoring 37% followed by private pharmacies
28%
69% of the interviewed households spent an average of 166.4 JDs on health care during the last
month of the interview although their combined monthly income is 366.6 JDs
9
1. INTRODUCTION
1.1 Background & Objective
The increase in the number of refugees from the Syrian Arab Republic (Syria) across the region
in 2016 continued and the need remains for a large-scale response to address the needs of both
refugees already present in the host community and those who arrived recently. As of end of
2016, 655,455 Syrian refugees were registered with UNHCR, including refugees hosted in
Za’atari, Azraq camps, Cyber City and King Abdullah Park.
Additionally, the continuous violence and insecurity in Iraq, after the 2003 military intervention,
led to the displacement of Iraqis to the neighboring countries. The Jordanian government
estimates that there are some 450,000 to 500,000 Iraqis hosted in Jordan. At the end of
December 2016 60,875 Iraqis are registered with UNHCR in Jordan. Due to the escalating
violence in Iraq, it is expected to see an increase the number of Iraqis seeking asylum. Until the
security situation in Iraq improves, and/or durable solutions are found, these Iraqi refugees
require protection and assistance including the provision of essential and life-saving health
services.
Apart from the Iraqi refugees, UNHCR also assists refugees of other nationalities including
Sudanese, Somalis, Yemenis and others and had registered 10,889 non-Iraqi non-Syrian
refugees by the end of December 2016.
1.2 Overview of Health Services Available to UNHCR PoCs in Jordan
In 2016 UNHCR will continue supporting the provision of health service to its PoCs through
implementing partners and affiliated hospitals and other partners if needed. UNHCR will work
to encourage Iraqis and Syrian refugees to increasingly utilize the governmental health services
especially at the Primary Health Care level.
10
1.3 Research context
In relation to Iraqis UNHCR reached an agreement with the Ministry of Planning and
International Co-operation (MOPIC) to provide PHC services including all services provided to
Jordanians in the comprehensive health care centers to all Iraqis regardless of their UNHCR
registration. The user has to pay for utilizing these services at the same rates as those paid by
uninsured Jordanians who do not participate in the national health insurance scheme (i.e. non-
insured Jordanian rates).
Services provided include outpatient consultations by a PHC general practitioner/family doctor
or a specialist for management of acute and chronic illnesses and free of charge basic
preventative services such as vaccinations. For antenatal care and family planning the
consultation is free but medications and investigations are charged.
Note that for Iraqis, only services at PHCs are available at a non-insured Jordanian rate, while in
governmental hospitals they will have to pay the foreigners rate.
1.4 Research design & methodology
1.4.1 Methodology
Quantitative Interviews were carried out among target respondents through telephonic Interviews.
Representativeness was ensured throughout the interviewing process beginning with the starting points
which were chosen randomly from the provided database by UNHCR, in case more than one respondent
was eligible for answering any part of the questionnaire, the classification grid/random function concept
was applied to select who will continue answering the interview.
1.4.2 Target respondents
Iraqi refugees who live in non-camp settings.
The study will be carried out with one adult household member (18 years or more)
1.4.3 Data analysis
Data was collected using CATI (Computer Aided Telephonic Interviews) through QPSMR Software. This
approach was selected to eliminate errors while completing the questionnaire and allow exporting of
the data immediately for further analysis, thus cutting down on time required for data editing, punching
and cleaning. Data analysis and significance testing (t-test with two tails) was conducted through
Quantum IBM software, a highly sophisticated and very flexible computer language designed to simplify

11
the process of obtaining useful information from a set of questionnaires. Quantum is also used for
checking, validating, editing and correcting data.
1.4.4 Survey tools and guidelines
Draft questionnaires were developed for respective categories of respondents in consultation with
partners. Previous questionnaires were reviewed to develop the draft questionnaires. These were sent
to partners for comment. After finalization, the questionnaire (available in both English/Arabic); the
questionnaires were pretested by a team of expert researchers and finalized in consultation with
partners.
Pretesting plan and finalization of questionnaires:
Process testing
During pre-testing, process testing of cluster identification/mapping, sampling frame preparation,
household identification, sampling technique, CATI process, and so on was also piloted for better
understanding of the sampling procedure.
1.5.5 Training
Formal training of survey teams was arranged for proper understanding of all the survey tools and
survey procedures. All investigators and supervisors were trained and provided with a detailed field
instruction manual.
The training included both classroom session as well as field practice; it consisted of sessions on
interviewing techniques and rapport building with respondents; how to identify selected households; a
thorough explanation of all questions; how to fill the questionnaires; how to handle non-response; how
to check questionnaires for errors; and how to handle their daily schedules.
1.6.6 Fieldwork
The validity and quality of the data collected was ensured via committing to the following
responsibilities:
• Study Manager: oversaw and documented all required quality checks. Furthermore the study
manager verified that the supervisor did validate and verify the data.
• Supervisor participated and assisted the interviewers where needed moreover the supervisor
verified data entries and attended a sample of the interviews for each the interviewers.
• Interviewers with the assistance of their supervisor’s ensured consistency of the data collected
and corrected any skip patterns.
1.6.7 Quality Assurance
12
Quality assurance was assiduously sought, and as a guiding principle ‘Quality Control at all levels’ is the
basic policy of the survey company (Nielsen). Especially at the stage of research designing, data
collection and analysis, the uppermost quality at all levels was maintained. The ESOMAR (Europe) code
of conduct is used as a basic guideline in all the aspects of marketing and social research. Only
employing interviewers with adequate experience is one of the norms of the operational policy.
Adequate records were kept in a computerized database about each individual to track him or her for
maintaining field management standards. Moreover, checking procedure was even more rigid.
Team selection and mobilization:
As for the selection and recruitment of supervisors and interviewers; it was carefully done by the field
manager. The recruitment was made from the existing panel of field supervisors and interviewers,
where all supervisors must have a minimum qualifications of graduation and fluent in both English and
Arabic. Interviewers had previous experience on similar projects where final selection was based on
interviewer’s performance during the pre-training sessions.
Execution phase:
Pretesting: The questionnaire was pre-tested before conducting the pilot interviews and fieldwork for
flow of questions, clarity and translation errors if any. The pre-testing was conducted in an area similar
in demographics to the original area of the survey. One team of 4 interviewers accompanied with one
supervisor conducted the pre-test.
Pilot phase:
Following the training, all trained interviewers participated in the pilot. They were organized in teams
and accompanied with 1 supervisor
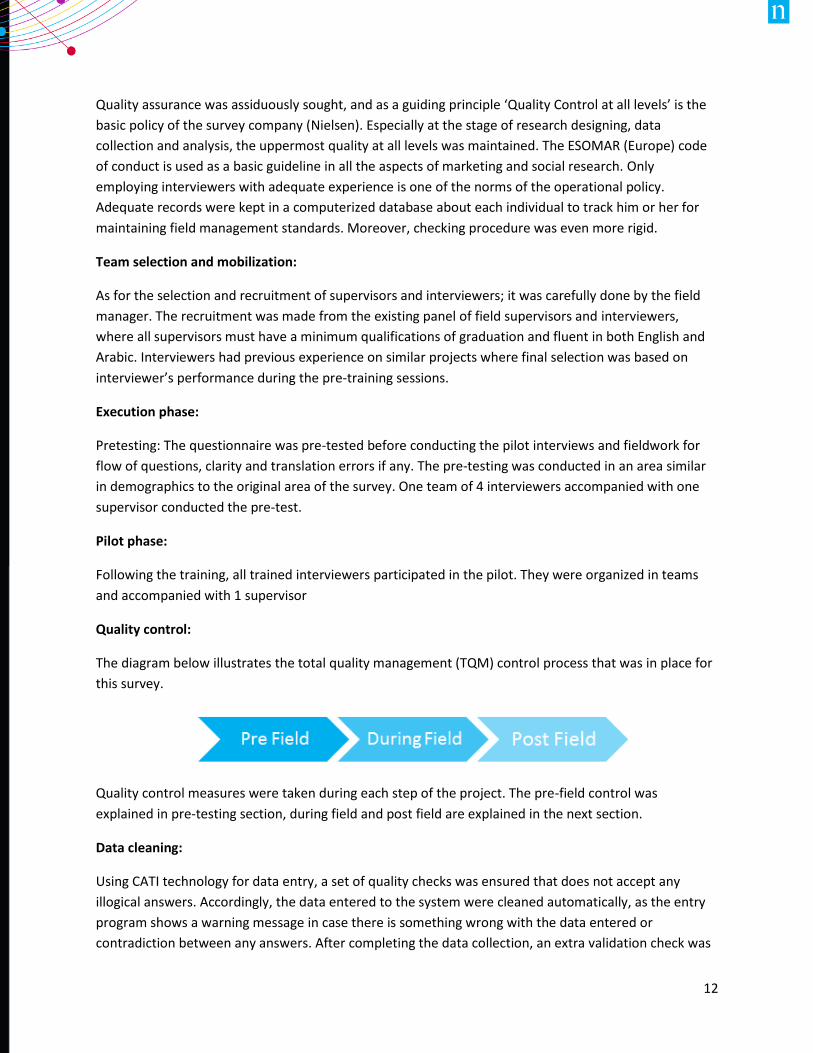
Quality control:
The diagram below illustrates the total quality management (TQM) control process that was in place for
this survey.
Quality control measures were taken during each step of the project. The pre-field control was
explained in pre-testing section, during field and post field are explained in the next section.
Data cleaning:
Using CATI technology for data entry, a set of quality checks was ensured that does not accept any
illogical answers. Accordingly, the data entered to the system were cleaned automatically, as the entry
program shows a warning message in case there is something wrong with the data entered or
contradiction between any answers. After completing the data collection, an extra validation check was
13
done through Error Check Report to identify any further errors that might be missed during the
punching stage.
1.5 Research limitations
The study aims to evaluate the access of Syrian and non-Syrian refugees to health services & utilization
in Jordan; although the study achieved its goals it had various limitations in which were inevitable.
First of all the study was absolutely dependent on the respondent to disclose the requested information
on every household individual which in this case is combined with the second limitation of this study
that is the respondents ability to recall the requested information.
Inadequacy to recall the information on the household members leaves a possibility to favoritism and
preference to bias the information disclosed by the respondent regardless of all assorted preventative
measures applied.
In addition, the Survey was also limited to only refugees who are have registered with UNHCR and have
a telephone number on the database. Even though almost all registered refugees (99%) had a phone
number on the database, a lot of the contacts sampled (47%) had invalid phone numbers or could not
be reached. However, if excluded non-camp refugees are systemically different from those we
interviewed, then findings may not be generalizable to the excluded population.
14
2. SAMPLE STRUCTURE
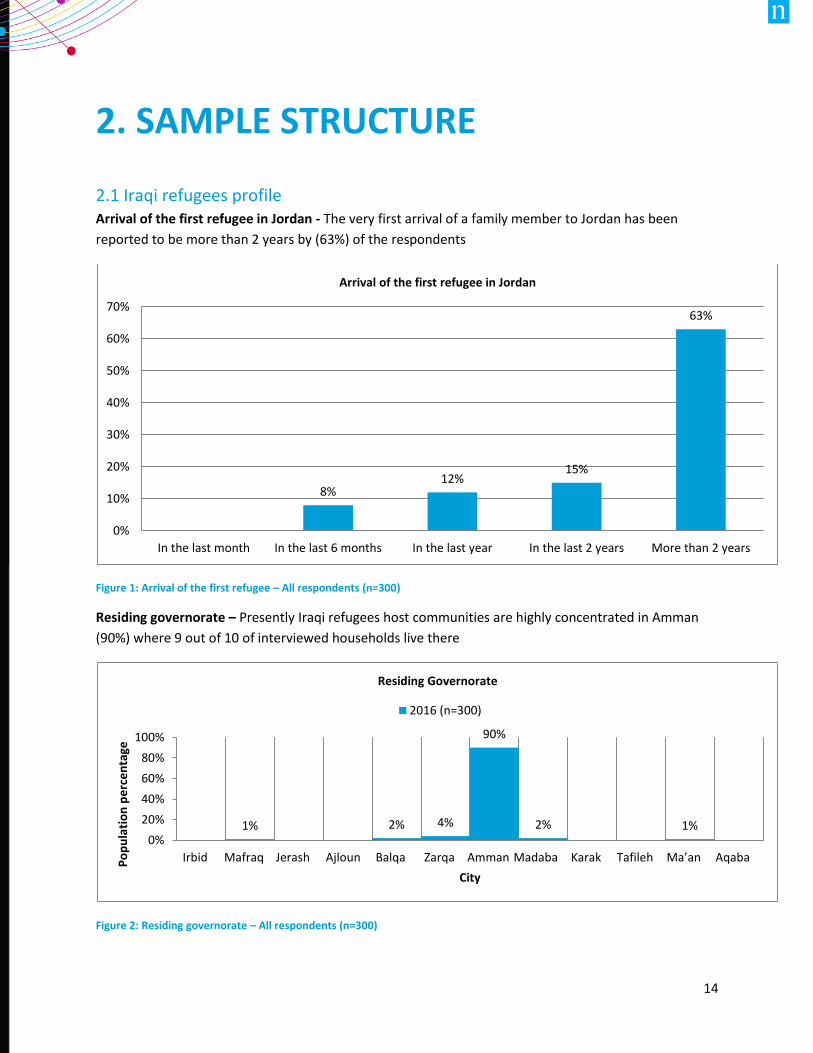
2.1 Iraqi refugees profile Arrival of the first refugee in Jordan - The very first arrival of a family member to Jordan has been
reported to be more than 2 years by (63%) of the respondents
Figure 1: Arrival of the first refugee – All respondents (n=300)
Residing governorate – Presently Iraqi refugees host communities are highly concentrated in Amman
(90%) where 9 out of 10 of interviewed households live there
Figure 2: Residing governorate – All respondents (n=300)
8%12%
15%
63%
0%
10%
20%
30%
40%
50%
60%
70%
In the last month In the last 6 months In the last year In the last 2 years More than 2 years
Arrival of the first refugee in Jordan
1% 2% 4%
90%
2% 1%0%
20%
40%
60%
80%
100%
Irbid Mafraq Jerash Ajloun Balqa Zarqa Amman Madaba Karak Tafileh Ma’an AqabaPo
pu
lati
on
pe
rce
nta
ge
City
Residing Governorate
2016 (n=300)
15
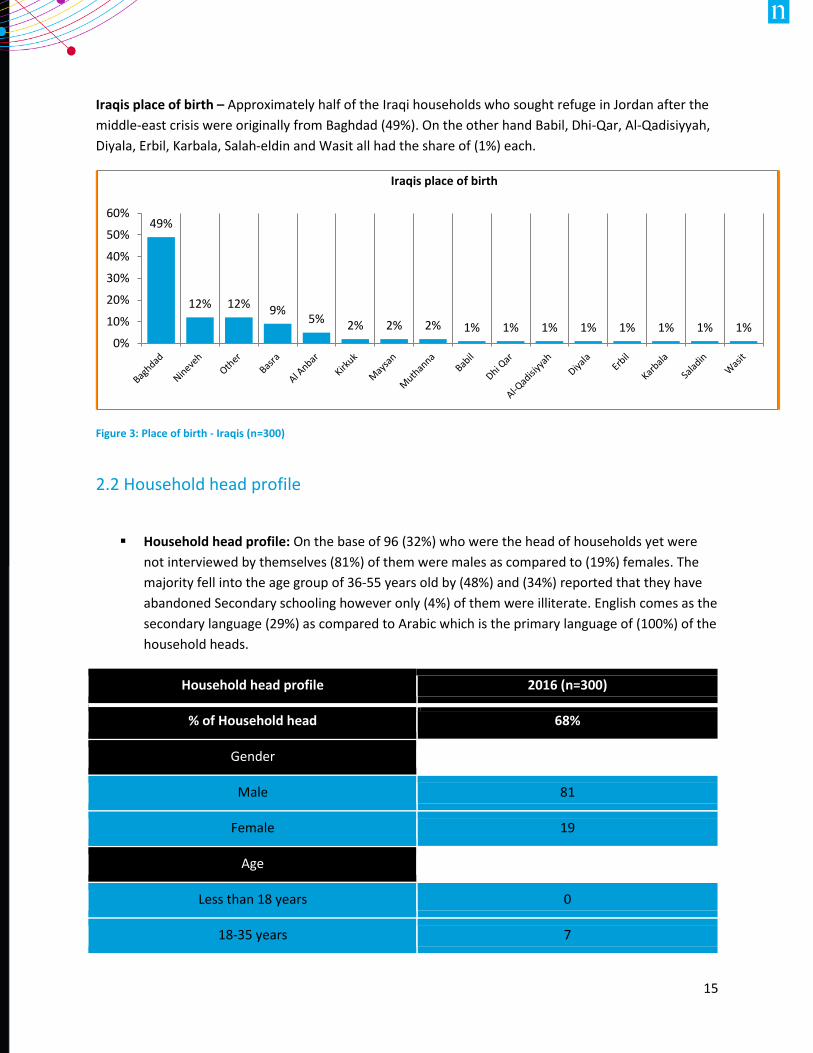
Iraqis place of birth – Approximately half of the Iraqi households who sought refuge in Jordan after the
middle-east crisis were originally from Baghdad (49%). On the other hand Babil, Dhi-Qar, Al-Qadisiyyah,
Diyala, Erbil, Karbala, Salah-eldin and Wasit all had the share of (1%) each.
Figure 3: Place of birth - Iraqis (n=300)
2.2 Household head profile
Household head profile: On the base of 96 (32%) who were the head of households yet were
not interviewed by themselves (81%) of them were males as compared to (19%) females. The
majority fell into the age group of 36-55 years old by (48%) and (34%) reported that they have
abandoned Secondary schooling however only (4%) of them were illiterate. English comes as the
secondary language (29%) as compared to Arabic which is the primary language of (100%) of the
household heads.
Household head profile 2016 (n=300)
% of Household head 68%
Gender
Male 81
Female 19
Age
Less than 18 years 0
18-35 years 7
49%
12% 12% 9%5% 2% 2% 2% 1% 1% 1% 1% 1% 1% 1% 1%
0%
10%
20%
30%
40%
50%
60%
Iraqis place of birth
16
36-55 years 48
More than 55 years 44
Education
Knows how to read and write 3
Primary School 15
Intermediate/complementary school 16
Secondary school 8
2 years Diploma 14
University 40
None 4
Language spoken
Arabic 100
Kurdish 1
Turkish 2
English 29
French 3
Somali 0
Other 13
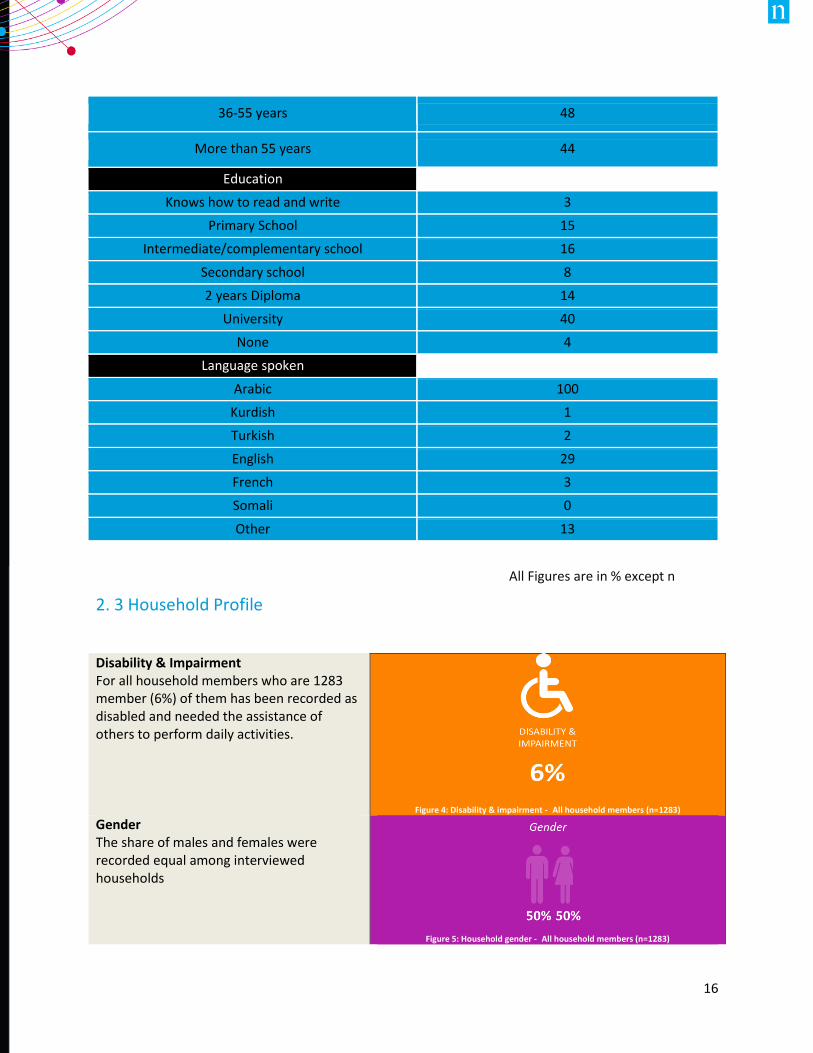
2. 3 Household Profile
Disability & Impairment For all household members who are 1283 member (6%) of them has been recorded as disabled and needed the assistance of others to perform daily activities.
Figure 4: Disability & impairment - All household members (n=1283)
Gender The share of males and females were recorded equal among interviewed households
Figure 5: Household gender - All household members (n=1283)
All Figures are in % except n
17
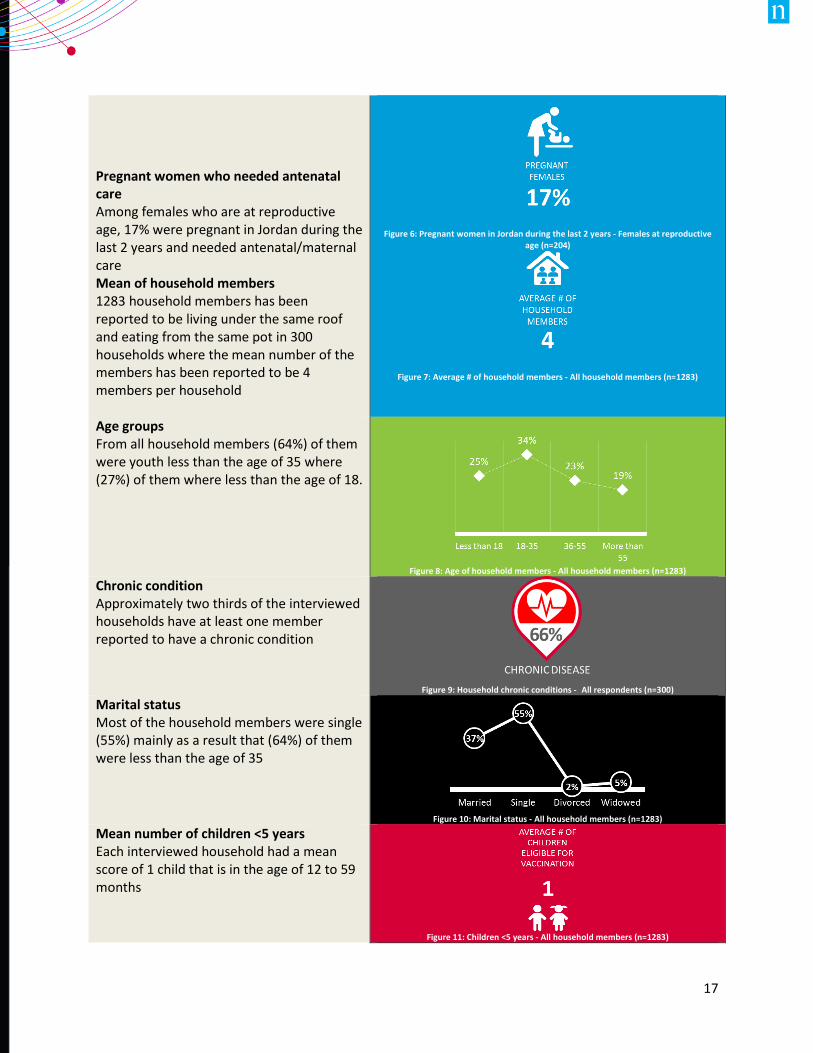
Pregnant women who needed antenatal care Among females who are at reproductive age, 17% were pregnant in Jordan during the last 2 years and needed antenatal/maternal care
Figure 6: Pregnant women in Jordan during the last 2 years - Females at reproductive
age (n=204)
Figure 7: Average # of household members - All household members (n=1283)
Mean of household members 1283 household members has been reported to be living under the same roof and eating from the same pot in 300 households where the mean number of the members has been reported to be 4 members per household Age groups From all household members (64%) of them were youth less than the age of 35 where (27%) of them where less than the age of 18.
Figure 8: Age of household members - All household members (n=1283)
Chronic condition Approximately two thirds of the interviewed households have at least one member reported to have a chronic condition
Figure 9: Household chronic conditions - All respondents (n=300)
Marital status Most of the household members were single (55%) mainly as a result that (64%) of them were less than the age of 35
Figure 10: Marital status - All household members (n=1283)
Mean number of children <5 years Each interviewed household had a mean score of 1 child that is in the age of 12 to 59 months
Figure 11: Children <5 years - All household members (n=1283)
18
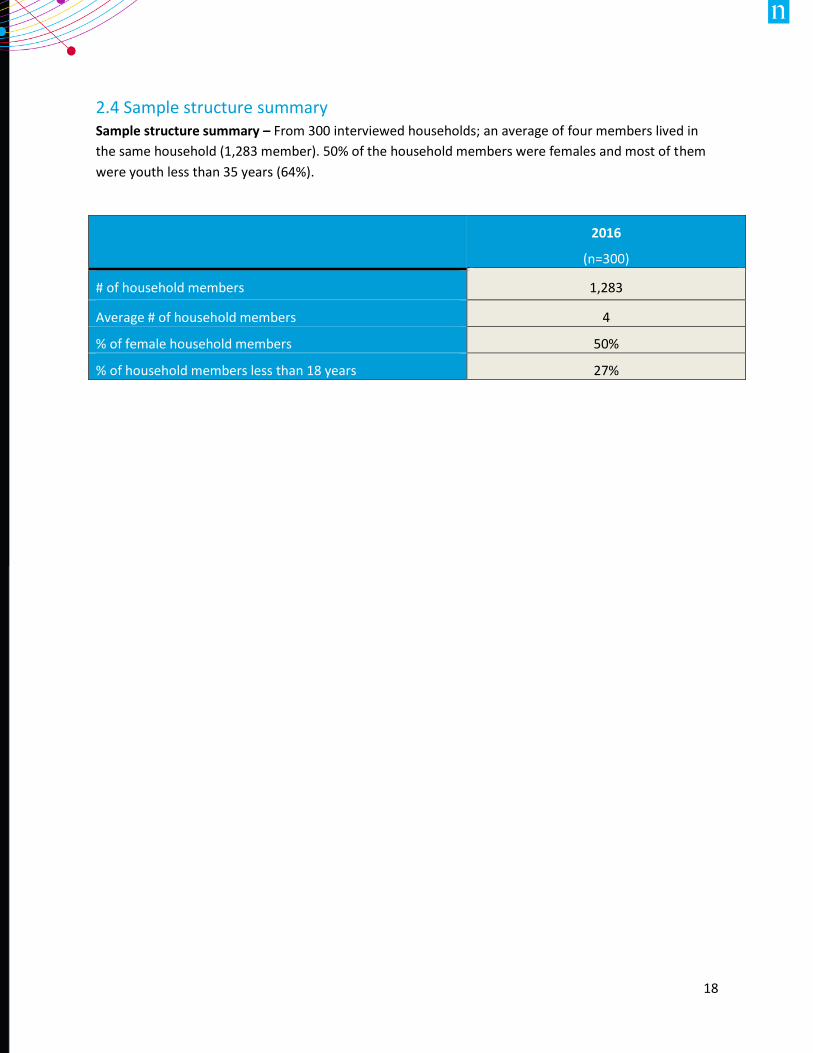
2.4 Sample structure summary Sample structure summary – From 300 interviewed households; an average of four members lived in
the same household (1,283 member). 50% of the household members were females and most of them
were youth less than 35 years (64%).
2016
(n=300)
# of household members 1,283
Average # of household members 4
% of female household members 50%
% of household members less than 18 years 27%
19
3. HEALTH SERVICES AWARENESS
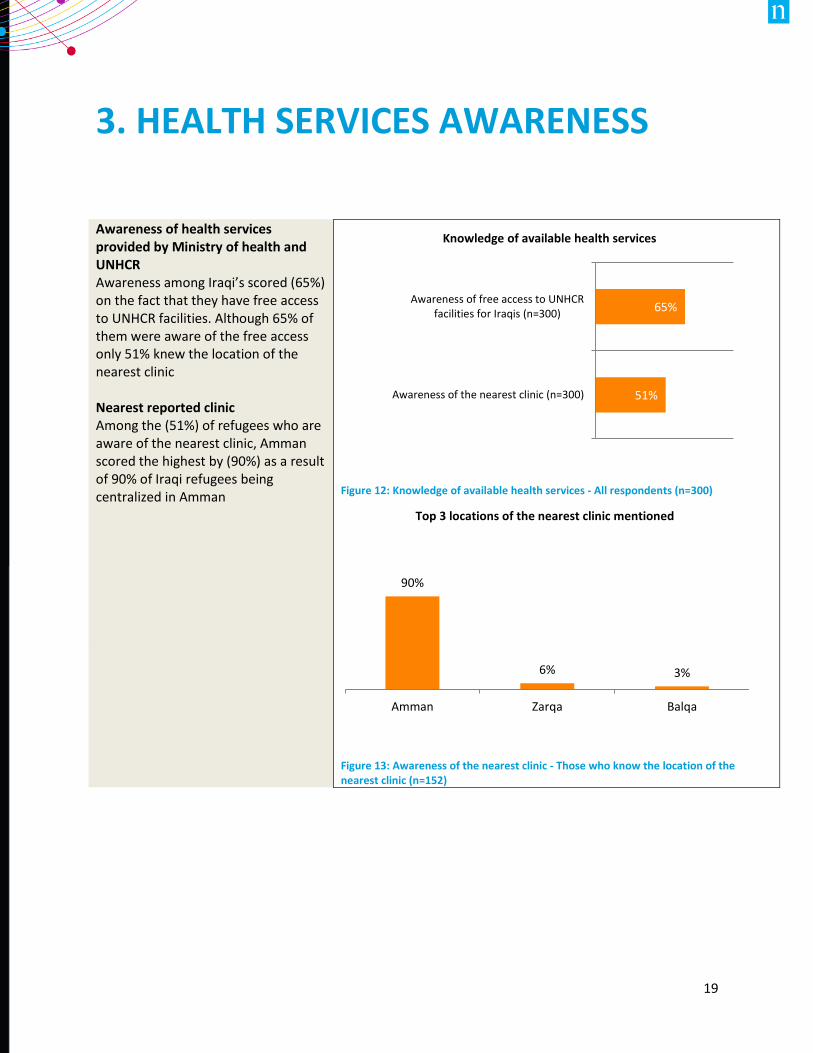
Awareness of health services provided by Ministry of health and UNHCR Awareness among Iraqi’s scored (65%) on the fact that they have free access to UNHCR facilities. Although 65% of them were aware of the free access only 51% knew the location of the nearest clinic Nearest reported clinic Among the (51%) of refugees who are aware of the nearest clinic, Amman scored the highest by (90%) as a result of 90% of Iraqi refugees being centralized in Amman
Figure 12: Knowledge of available health services - All respondents (n=300)
Figure 13: Awareness of the nearest clinic - Those who know the location of the nearest clinic (n=152)
65%
51%
Awareness of free access to UNHCRfacilities for Iraqis (n=300)
Awareness of the nearest clinic (n=300)
Knowledge of available health services
90%
6% 3%
Amman Zarqa Balqa
Top 3 locations of the nearest clinic mentioned
20
3.1 Health services awareness summary
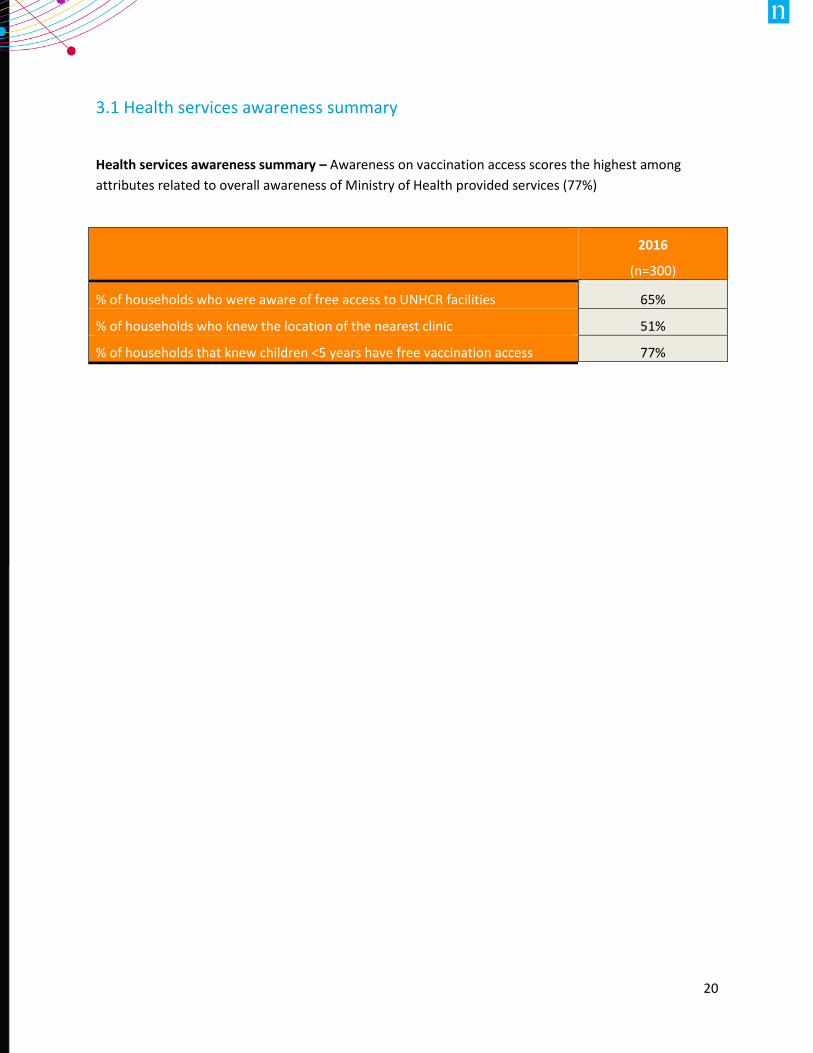
Health services awareness summary – Awareness on vaccination access scores the highest among
attributes related to overall awareness of Ministry of Health provided services (77%)
2016
(n=300)
% of households who were aware of free access to UNHCR facilities 65%
% of households who knew the location of the nearest clinic 51%
% of households that knew children <5 years have free vaccination access 77%
21
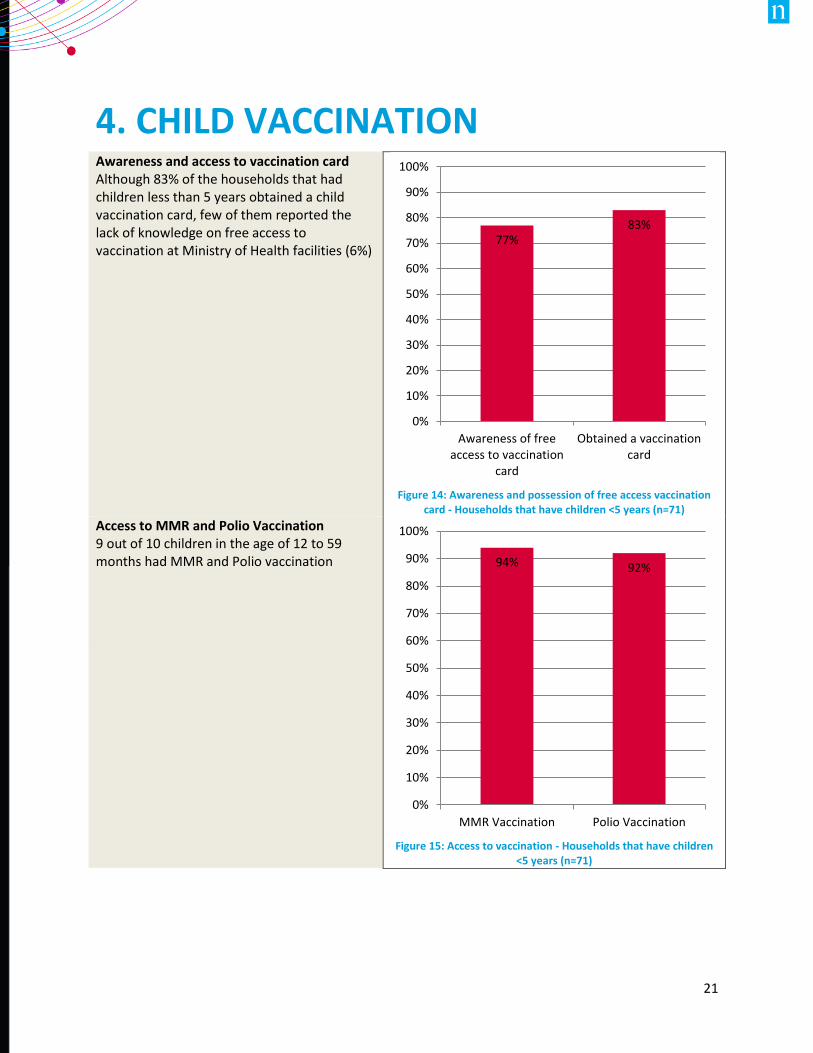
4. CHILD VACCINATION Awareness and access to vaccination card Although 83% of the households that had children less than 5 years obtained a child vaccination card, few of them reported the lack of knowledge on free access to vaccination at Ministry of Health facilities (6%)
Figure 14: Awareness and possession of free access vaccination
card - Households that have children <5 years (n=71)
Access to MMR and Polio Vaccination 9 out of 10 children in the age of 12 to 59 months had MMR and Polio vaccination
Figure 15: Access to vaccination - Households that have children
<5 years (n=71)
77%83%
0%
10%
20%
30%
40%
50%
60%
70%
80%
90%
100%
Awareness of freeaccess to vaccination
card
Obtained a vaccinationcard
94% 92%
0%
10%
20%
30%
40%
50%
60%
70%
80%
90%
100%
MMR Vaccination Polio Vaccination
22
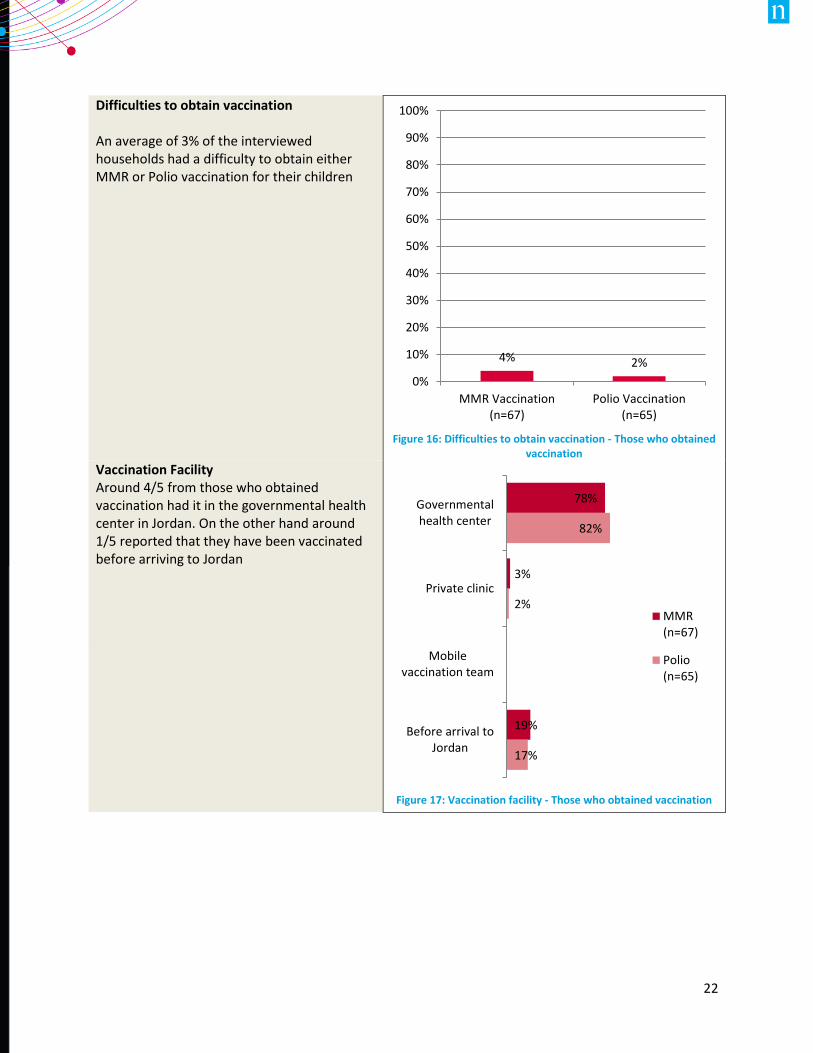
Difficulties to obtain vaccination An average of 3% of the interviewed households had a difficulty to obtain either MMR or Polio vaccination for their children
Figure 16: Difficulties to obtain vaccination - Those who obtained
vaccination
Vaccination Facility Around 4/5 from those who obtained vaccination had it in the governmental health center in Jordan. On the other hand around 1/5 reported that they have been vaccinated before arriving to Jordan
Figure 17: Vaccination facility - Those who obtained vaccination
4% 2%
0%
10%
20%
30%
40%
50%
60%
70%
80%
90%
100%
MMR Vaccination(n=67)
Polio Vaccination(n=65)
78%
3%
19%
82%
2%
17%
Governmentalhealth center
Private clinic
Mobilevaccination team
Before arrival toJordan
MMR(n=67)
Polio(n=65)
23
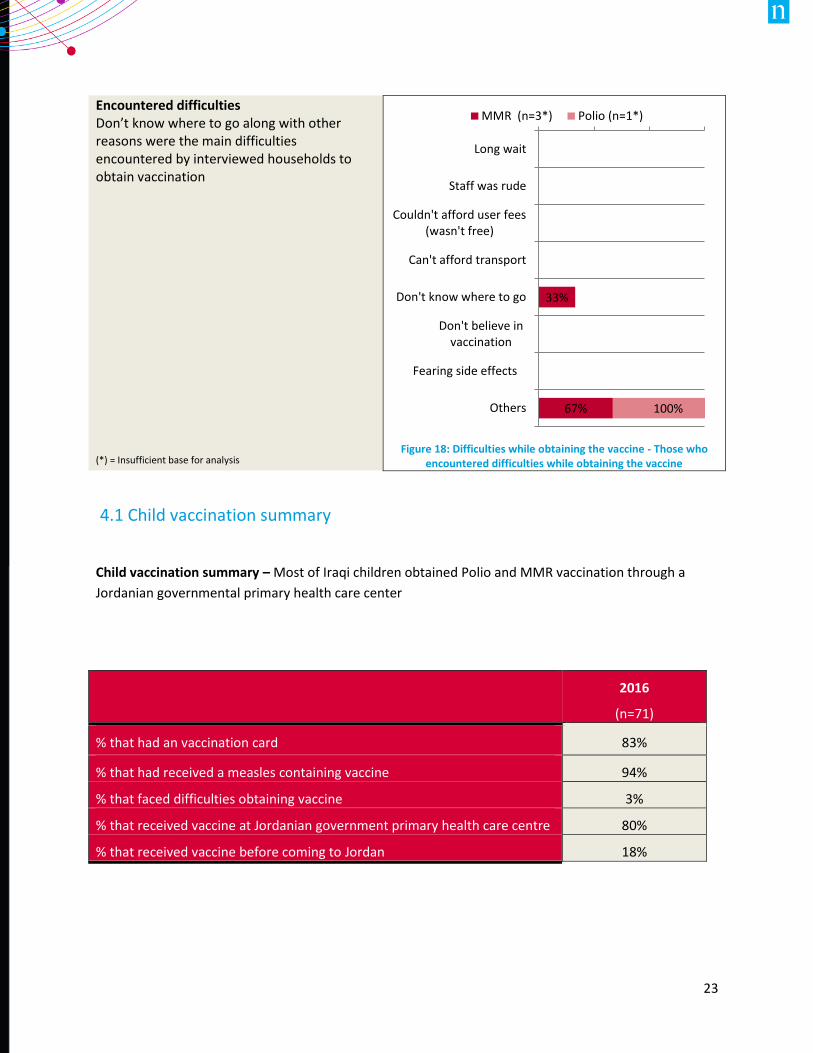
Encountered difficulties Don’t know where to go along with other reasons were the main difficulties encountered by interviewed households to obtain vaccination (*) = Insufficient base for analysis
Figure 18: Difficulties while obtaining the vaccine - Those who
encountered difficulties while obtaining the vaccine
4.1 Child vaccination summary
Child vaccination summary – Most of Iraqi children obtained Polio and MMR vaccination through a
Jordanian governmental primary health care center
33%
67% 100%
Long wait
Staff was rude
Couldn't afford user fees(wasn't free)
Can't afford transport
Don't know where to go
Don't believe invaccination
Fearing side effects
Others
MMR (n=3*) Polio (n=1*)
2016
(n=71)
% that had an vaccination card 83%
% that had received a measles containing vaccine 94%
% that faced difficulties obtaining vaccine 3%
% that received vaccine at Jordanian government primary health care centre 80%
% that received vaccine before coming to Jordan 18%
24
5. Antenatal care
5.1 Access to antenatal care
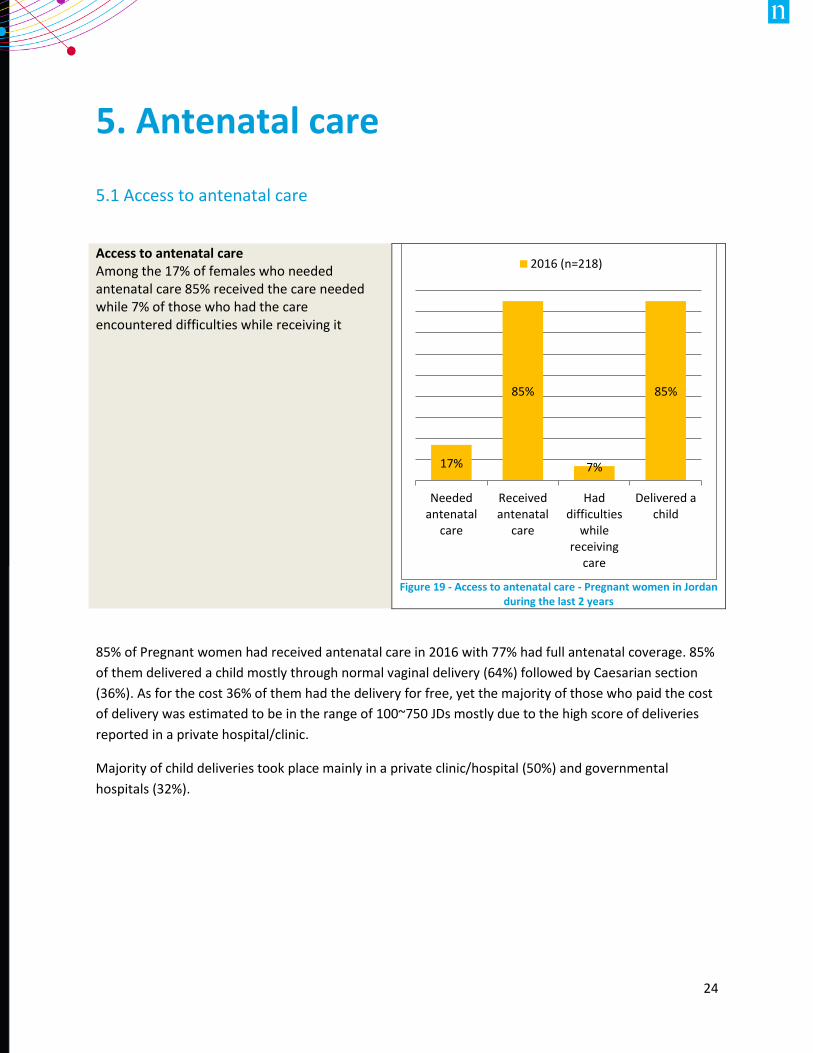
Access to antenatal care Among the 17% of females who needed antenatal care 85% received the care needed while 7% of those who had the care encountered difficulties while receiving it
Figure 19 - Access to antenatal care - Pregnant women in Jordan
during the last 2 years
85% of Pregnant women had received antenatal care in 2016 with 77% had full antenatal coverage. 85%
of them delivered a child mostly through normal vaginal delivery (64%) followed by Caesarian section
(36%). As for the cost 36% of them had the delivery for free, yet the majority of those who paid the cost
of delivery was estimated to be in the range of 100~750 JDs mostly due to the high score of deliveries
reported in a private hospital/clinic.
Majority of child deliveries took place mainly in a private clinic/hospital (50%) and governmental
hospitals (32%).
17%
85%
7%
85%
Neededantenatal
care
Receivedantenatal
care
Haddifficulties
whilereceiving
care
Delivered achild
2016 (n=218)
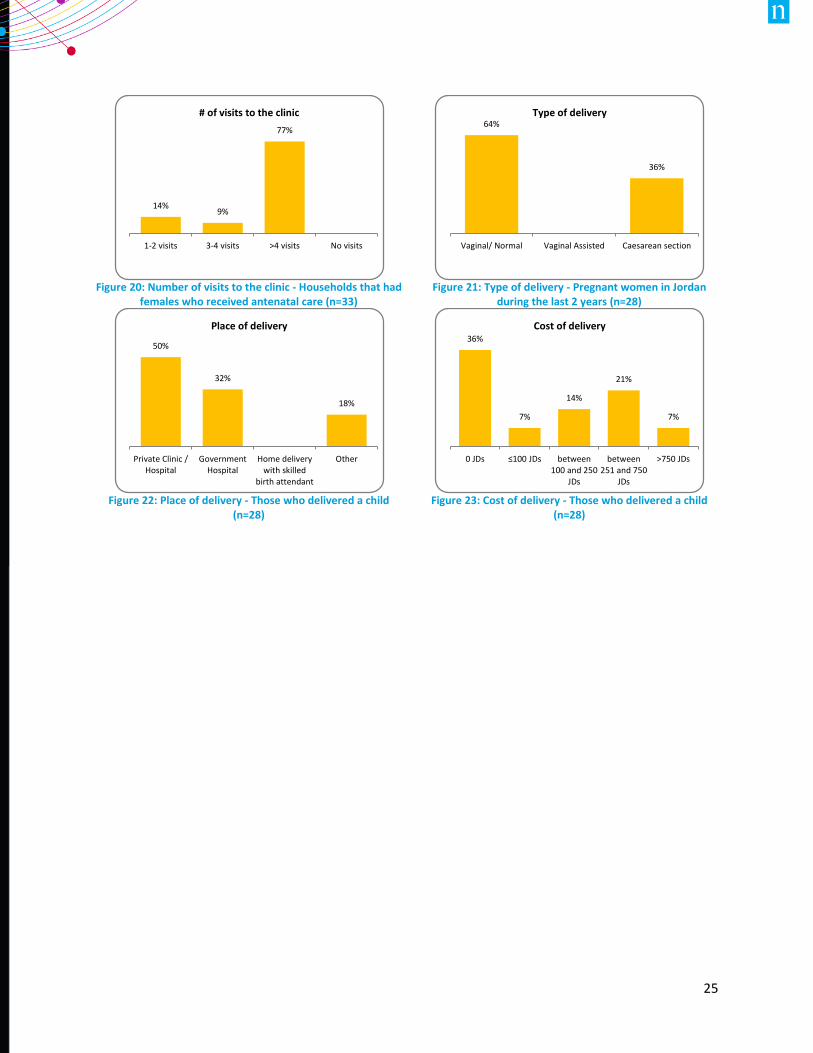
25
Figure 20: Number of visits to the clinic - Households that had
females who received antenatal care (n=33)
Figure 21: Type of delivery - Pregnant women in Jordan
during the last 2 years (n=28)
Figure 22: Place of delivery - Those who delivered a child
(n=28)
Figure 23: Cost of delivery - Those who delivered a child
(n=28)
14%9%
77%
1-2 visits 3-4 visits >4 visits No visits
# of visits to the clinic64%
36%
Vaginal/ Normal Vaginal Assisted Caesarean section
Type of delivery
50%
32%
18%
Private Clinic /Hospital
GovernmentHospital
Home deliverywith skilled
birth attendant
Other
Place of delivery36%
7%
14%
21%
7%
0 JDs ≤100 JDs between100 and 250
JDs
between251 and 750
JDs
>750 JDs
Cost of delivery
26
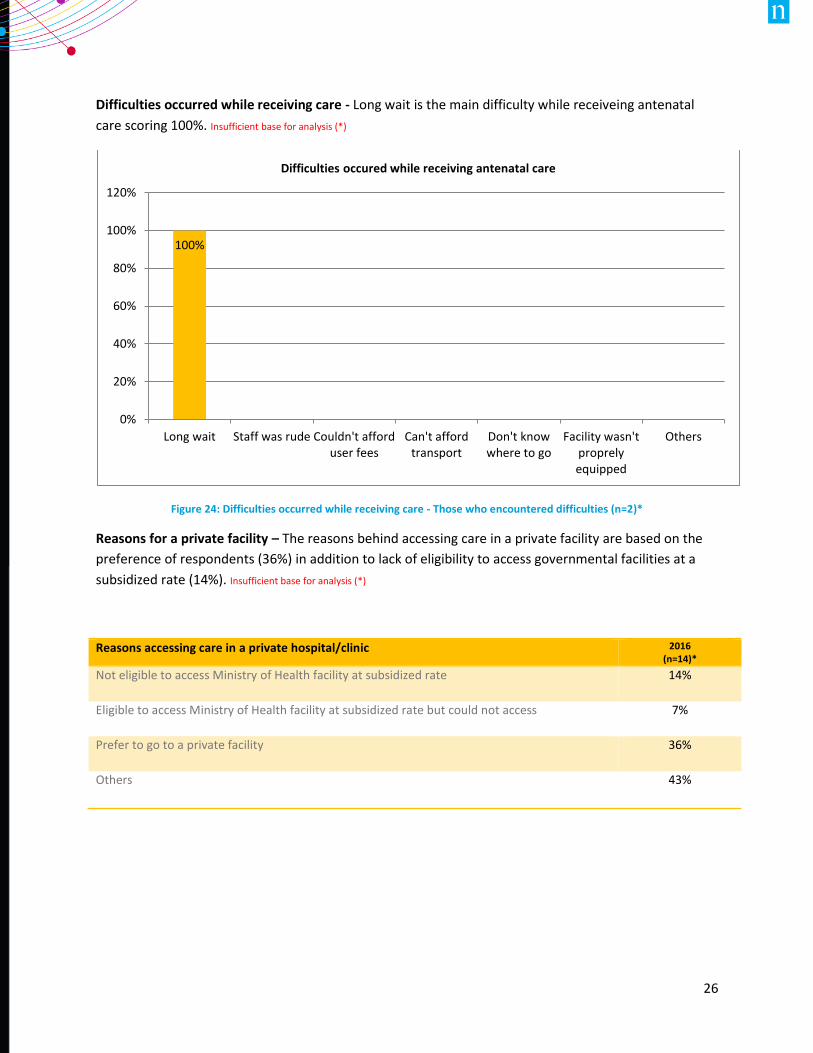
Difficulties occurred while receiving care - Long wait is the main difficulty while receiveing antenatal
care scoring 100%. Insufficient base for analysis (*)
Figure 24: Difficulties occurred while receiving care - Those who encountered difficulties (n=2)*
Reasons for a private facility – The reasons behind accessing care in a private facility are based on the
preference of respondents (36%) in addition to lack of eligibility to access governmental facilities at a
subsidized rate (14%). Insufficient base for analysis (*)
100%
0%
20%
40%
60%
80%
100%
120%
Long wait Staff was rude Couldn't afforduser fees
Can't affordtransport
Don't knowwhere to go
Facility wasn'tproprelyequipped
Others
Difficulties occured while receiving antenatal care
Reasons accessing care in a private hospital/clinic 2016 (n=14)*
Not eligible to access Ministry of Health facility at subsidized rate 14%
Eligible to access Ministry of Health facility at subsidized rate but could not access 7%
Prefer to go to a private facility 36%
Others 43%
27
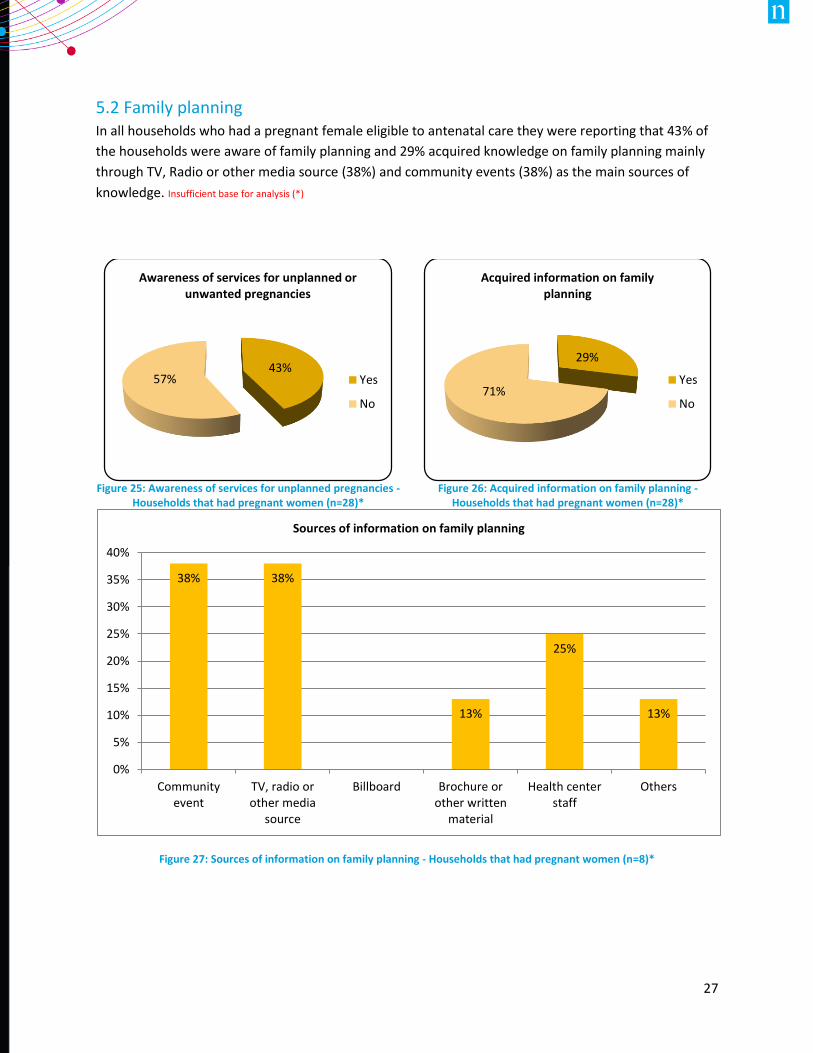
5.2 Family planning In all households who had a pregnant female eligible to antenatal care they were reporting that 43% of
the households were aware of family planning and 29% acquired knowledge on family planning mainly
through TV, Radio or other media source (38%) and community events (38%) as the main sources of
knowledge. Insufficient base for analysis (*)
Figure 27: Sources of information on family planning - Households that had pregnant women (n=8)*
38% 38%
13%
25%
13%
0%
5%
10%
15%
20%
25%
30%
35%
40%
Communityevent
TV, radio orother media
source
Billboard Brochure orother written
material
Health centerstaff
Others
Sources of information on family planning
Figure 25: Awareness of services for unplanned pregnancies -
Households that had pregnant women (n=28)*
Figure 26: Acquired information on family planning -
Households that had pregnant women (n=28)*
43%57%
Awareness of services for unplanned or unwanted pregnancies
Yes
No
29%
71%
Acquired information on family planning
Yes
No
28
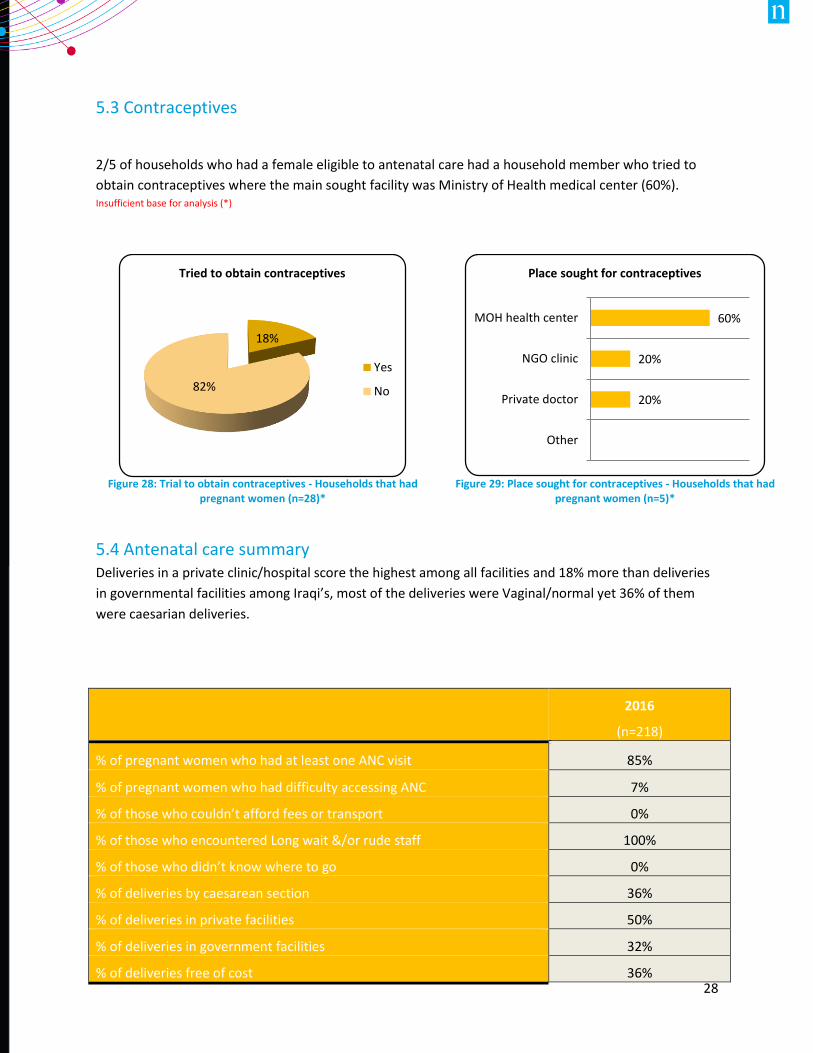
5.3 Contraceptives
2/5 of households who had a female eligible to antenatal care had a household member who tried to
obtain contraceptives where the main sought facility was Ministry of Health medical center (60%). Insufficient base for analysis (*)
5.4 Antenatal care summary Deliveries in a private clinic/hospital score the highest among all facilities and 18% more than deliveries
in governmental facilities among Iraqi’s, most of the deliveries were Vaginal/normal yet 36% of them
were caesarian deliveries.
Figure 28: Trial to obtain contraceptives - Households that had
pregnant women (n=28)*
Figure 29: Place sought for contraceptives - Households that had
pregnant women (n=5)*
2016
(n=218)
% of pregnant women who had at least one ANC visit 85%
% of pregnant women who had difficulty accessing ANC 7%
% of those who couldn’t afford fees or transport 0%
% of those who encountered Long wait &/or rude staff 100%
% of those who didn’t know where to go 0%
% of deliveries by caesarean section 36%
% of deliveries in private facilities 50%
% of deliveries in government facilities 32%
% of deliveries free of cost 36%
18%
82%
Tried to obtain contraceptives
Yes
No
60%
20%
20%
MOH health center
NGO clinic
Private doctor
Other
Place sought for contraceptives
29
6. CHRONIC DISEASE
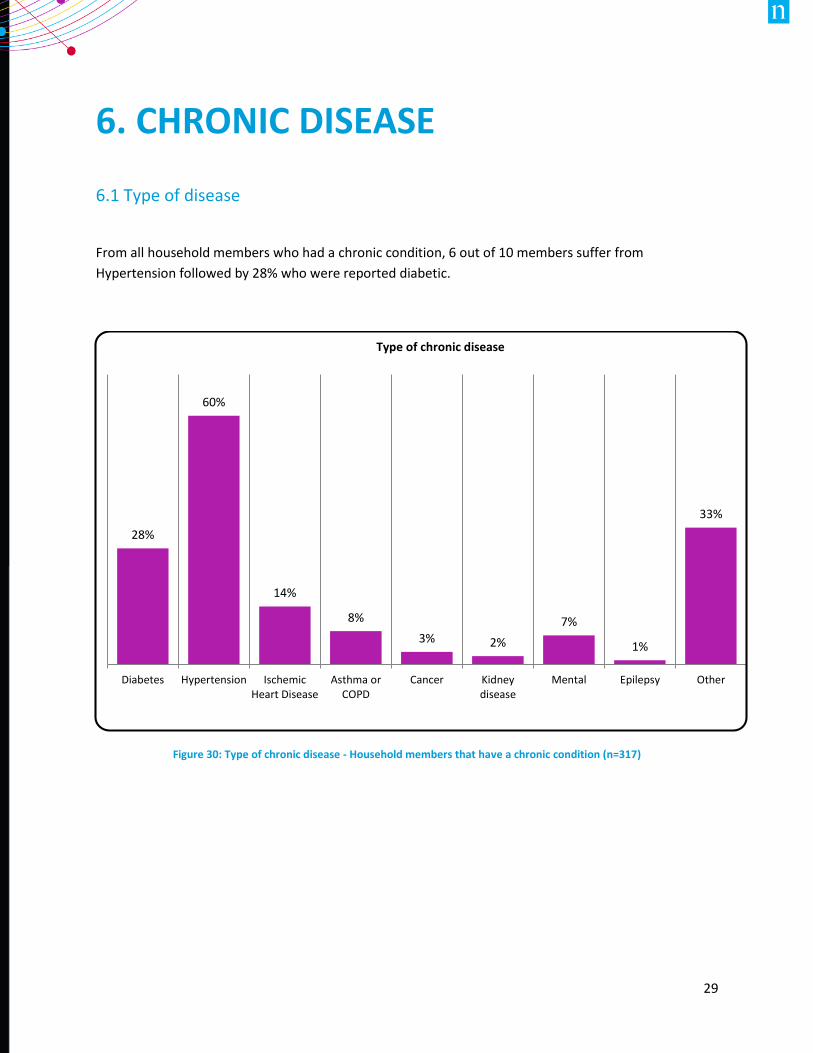
6.1 Type of disease
From all household members who had a chronic condition, 6 out of 10 members suffer from
Hypertension followed by 28% who were reported diabetic.
Figure 30: Type of chronic disease - Household members that have a chronic condition (n=317)
28%
60%
14%
8%
3% 2%
7%
1%
33%
Diabetes Hypertension IschemicHeart Disease
Asthma orCOPD
Cancer Kidneydisease
Mental Epilepsy Other
Type of chronic disease
30
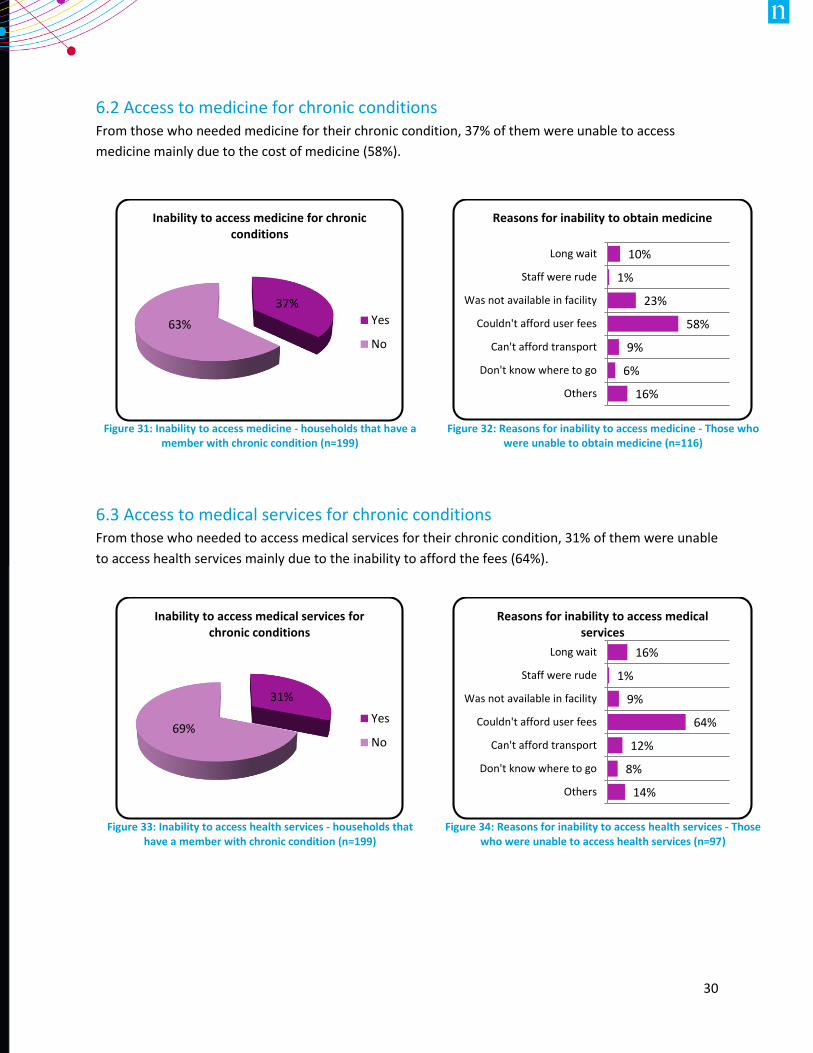
6.2 Access to medicine for chronic conditions From those who needed medicine for their chronic condition, 37% of them were unable to access
medicine mainly due to the cost of medicine (58%).
6.3 Access to medical services for chronic conditions From those who needed to access medical services for their chronic condition, 31% of them were unable
to access health services mainly due to the inability to afford the fees (64%).
Figure 31: Inability to access medicine - households that have a
member with chronic condition (n=199)
Figure 32: Reasons for inability to access medicine - Those who
were unable to obtain medicine (n=116)
Figure 33: Inability to access health services - households that
have a member with chronic condition (n=199)
Figure 34: Reasons for inability to access health services - Those
who were unable to access health services (n=97)
37%
63%
Inability to access medicine for chronic conditions
Yes
No
10%
1%
23%
58%
9%
6%
16%
Long wait
Staff were rude
Was not available in facility
Couldn't afford user fees
Can't afford transport
Don't know where to go
Others
Reasons for inability to obtain medicine
31%
69%
Inability to access medical services for chronic conditions
Yes
No
16%
1%
9%
64%
12%
8%
14%
Long wait
Staff were rude
Was not available in facility
Couldn't afford user fees
Can't afford transport
Don't know where to go
Others
Reasons for inability to access medical services
31
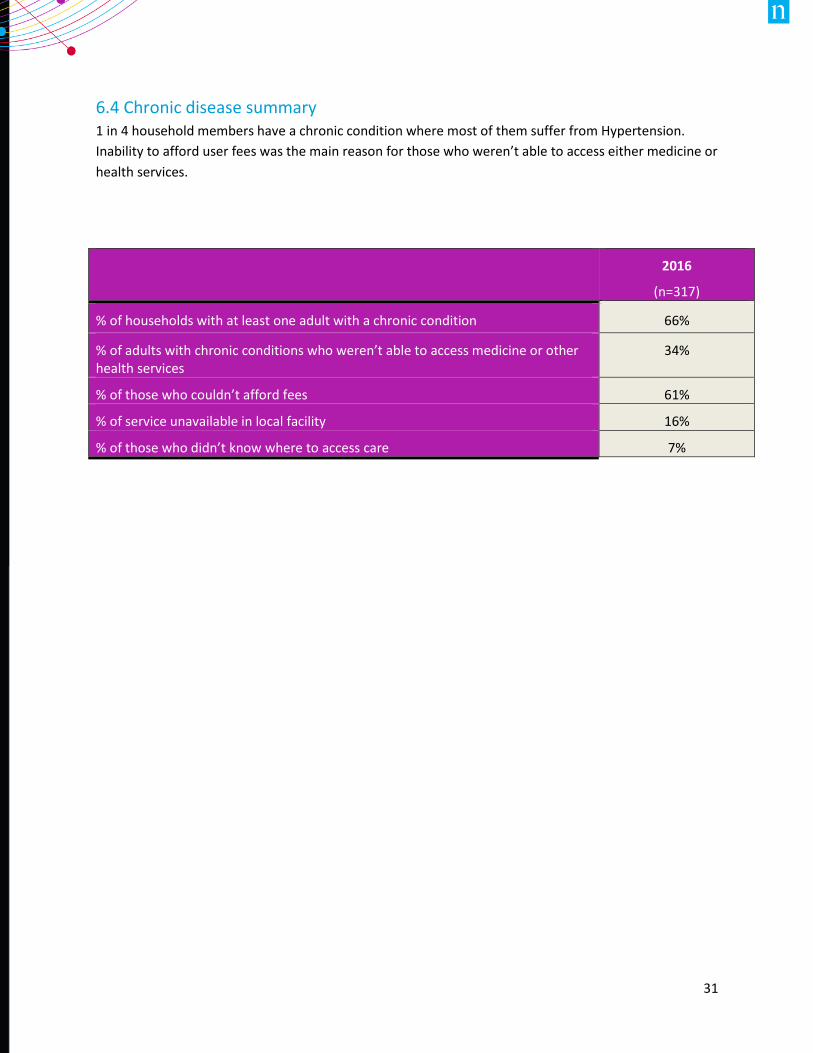
6.4 Chronic disease summary 1 in 4 household members have a chronic condition where most of them suffer from Hypertension.
Inability to afford user fees was the main reason for those who weren’t able to access either medicine or
health services.
2016
(n=317)
% of households with at least one adult with a chronic condition 66%
% of adults with chronic conditions who weren’t able to access medicine or other health services
34%
% of those who couldn’t afford fees 61%
% of service unavailable in local facility 16%
% of those who didn’t know where to access care 7%
32
7. DISABILITY & IMPAIRMENT
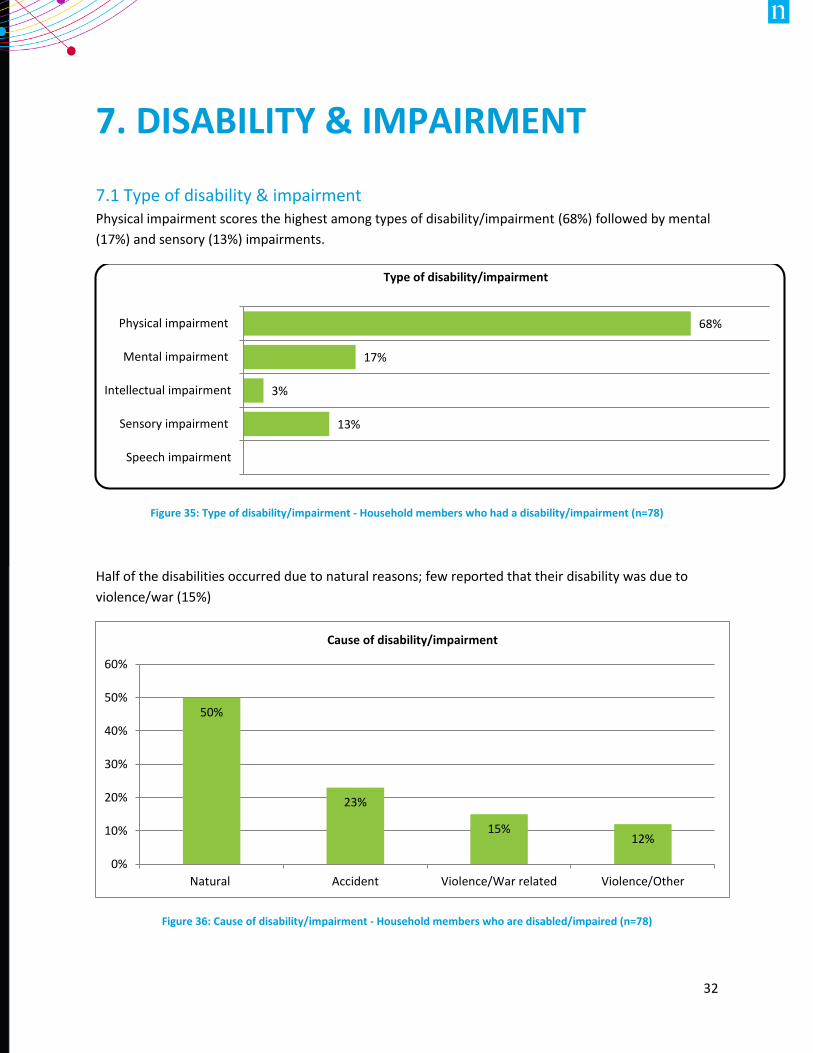
7.1 Type of disability & impairment Physical impairment scores the highest among types of disability/impairment (68%) followed by mental
(17%) and sensory (13%) impairments.
Figure 35: Type of disability/impairment - Household members who had a disability/impairment (n=78)
Half of the disabilities occurred due to natural reasons; few reported that their disability was due to
violence/war (15%)
Figure 36: Cause of disability/impairment - Household members who are disabled/impaired (n=78)
13%
3%
17%
68%
Speech impairment
Sensory impairment
Intellectual impairment
Mental impairment
Physical impairment
Type of disability/impairment
50%
23%
15%12%
0%
10%
20%
30%
40%
50%
60%
Natural Accident Violence/War related Violence/Other
Cause of disability/impairment
33
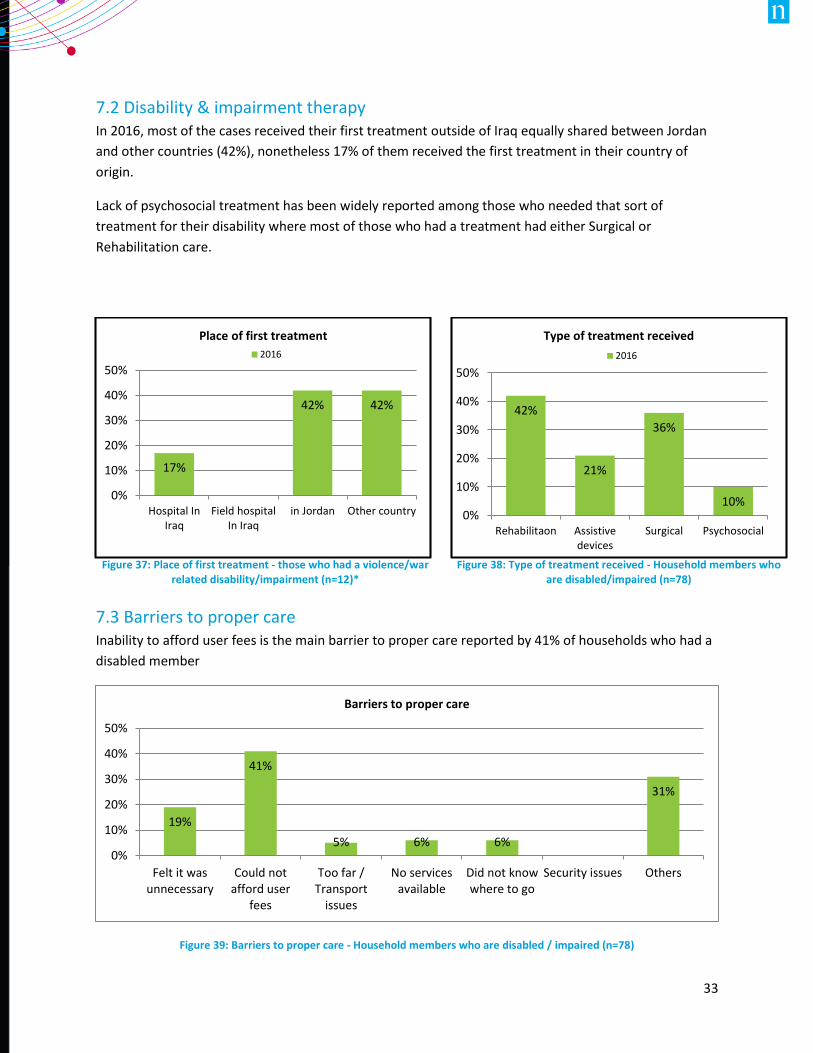
7.2 Disability & impairment therapy In 2016, most of the cases received their first treatment outside of Iraq equally shared between Jordan
and other countries (42%), nonetheless 17% of them received the first treatment in their country of
origin.
Lack of psychosocial treatment has been widely reported among those who needed that sort of
treatment for their disability where most of those who had a treatment had either Surgical or
Rehabilitation care.
7.3 Barriers to proper care Inability to afford user fees is the main barrier to proper care reported by 41% of households who had a
disabled member
Figure 39: Barriers to proper care - Household members who are disabled / impaired (n=78)
19%
41%
5% 6% 6%
31%
0%
10%
20%
30%
40%
50%
Felt it wasunnecessary
Could notafford user
fees
Too far /Transport
issues
No servicesavailable
Did not knowwhere to go
Security issues Others
Barriers to proper care
Figure 37: Place of first treatment - those who had a violence/war
related disability/impairment (n=12)*
Figure 38: Type of treatment received - Household members who
are disabled/impaired (n=78)
17%
42% 42%
0%
10%
20%
30%
40%
50%
Hospital InIraq
Field hospitalIn Iraq
in Jordan Other country
Place of first treatment
2016
42%
21%
36%
10%0%
10%
20%
30%
40%
50%
Rehabilitaon Assistivedevices
Surgical Psychosocial
Type of treatment received
2016
34
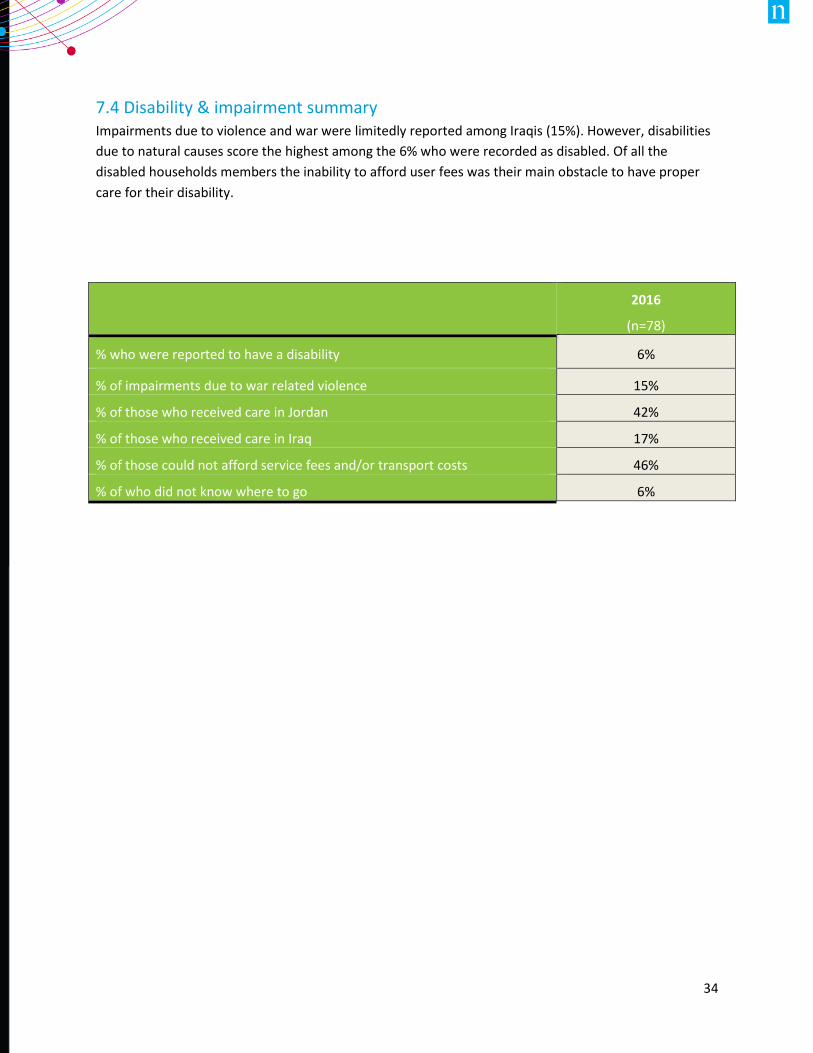
7.4 Disability & impairment summary Impairments due to violence and war were limitedly reported among Iraqis (15%). However, disabilities
due to natural causes score the highest among the 6% who were recorded as disabled. Of all the
disabled households members the inability to afford user fees was their main obstacle to have proper
care for their disability.
2016
(n=78)
% who were reported to have a disability 6%
% of impairments due to war related violence 15%
% of those who received care in Jordan 42%
% of those who received care in Iraq 17%
% of those could not afford service fees and/or transport costs 46%
% of who did not know where to go 6%
35
8. MONTHLY HEALTH ACCESS
ASSESMENT
8.1 First facility
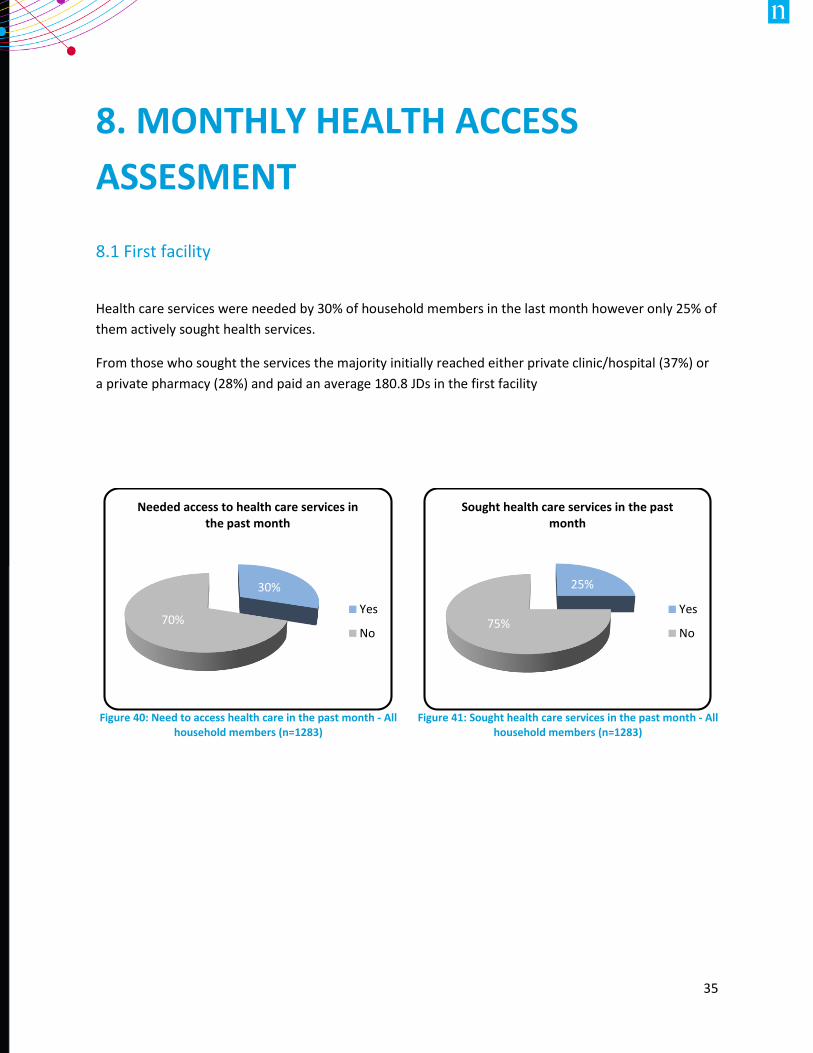
Health care services were needed by 30% of household members in the last month however only 25% of
them actively sought health services.
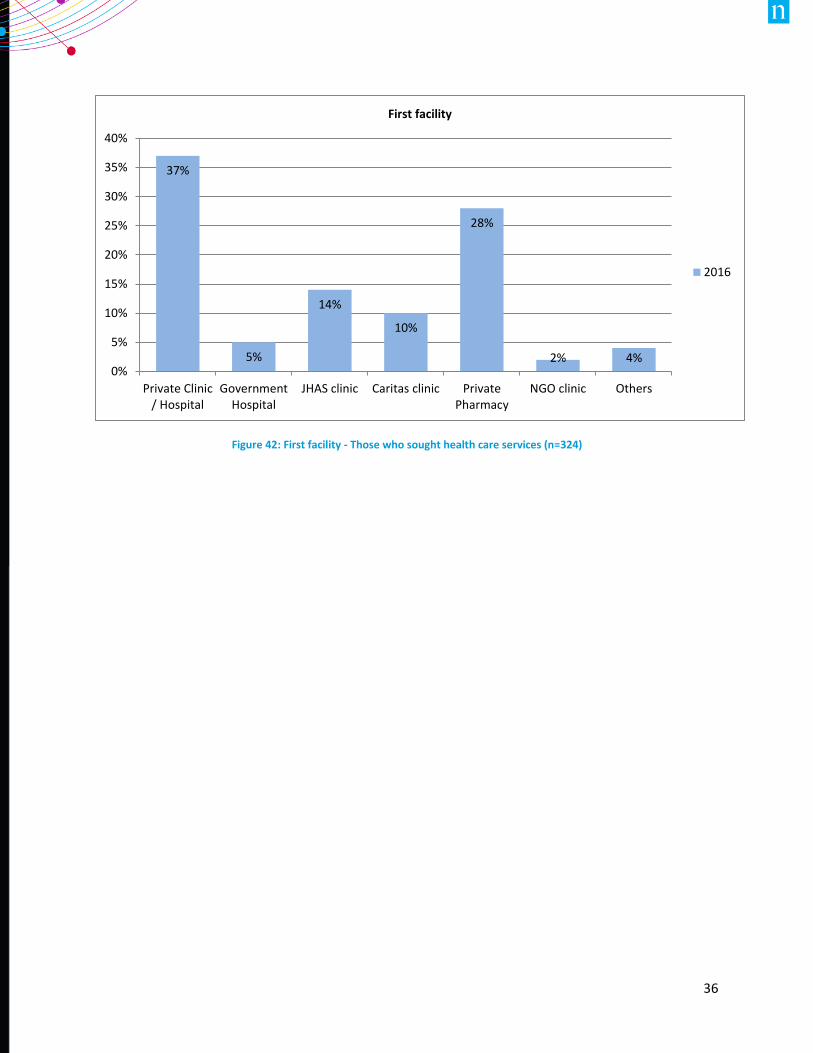
From those who sought the services the majority initially reached either private clinic/hospital (37%) or
a private pharmacy (28%) and paid an average 180.8 JDs in the first facility
Figure 40: Need to access health care in the past month - All
household members (n=1283)
Figure 41: Sought health care services in the past month - All
household members (n=1283)
30%
70%
Needed access to health care services in the past month
Yes
No
25%
75%
Sought health care services in the past month
Yes
No
36
Figure 42: First facility - Those who sought health care services (n=324)
37%
5%
14%
10%
28%
2% 4%0%
5%
10%
15%
20%
25%
30%
35%
40%
Private Clinic/ Hospital
GovernmentHospital
JHAS clinic Caritas clinic PrivatePharmacy
NGO clinic Others
First facility
2016
37
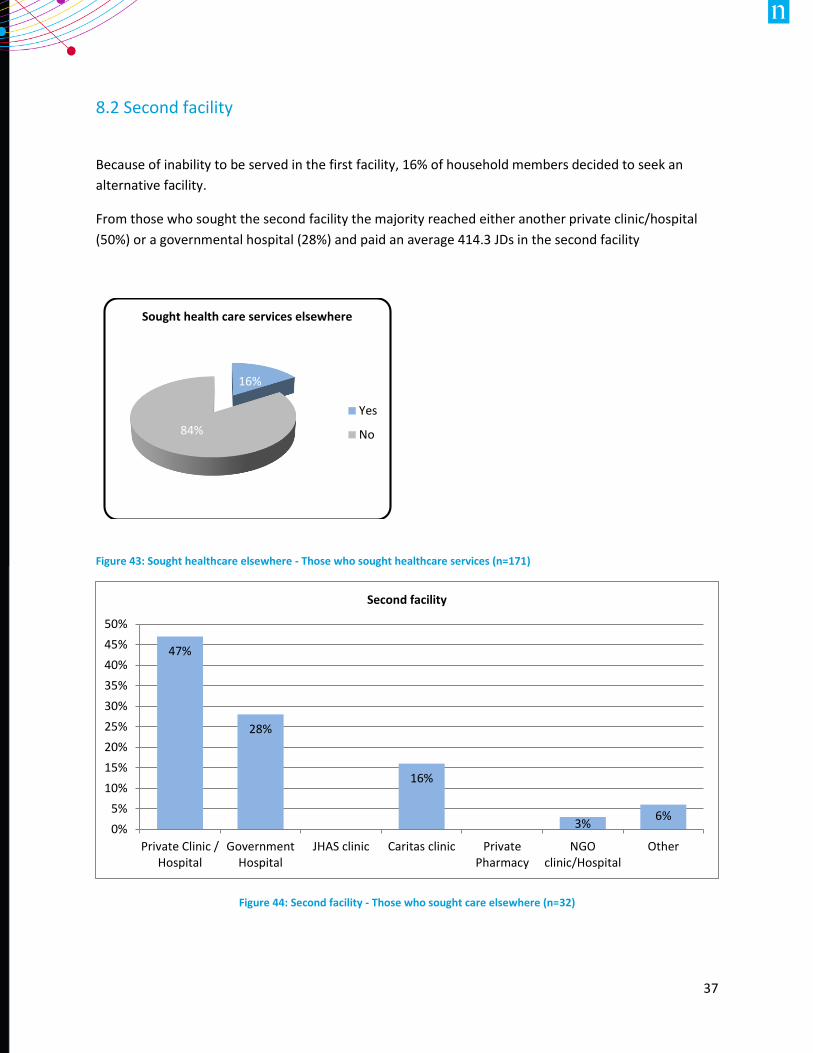
8.2 Second facility
Because of inability to be served in the first facility, 16% of household members decided to seek an
alternative facility.
From those who sought the second facility the majority reached either another private clinic/hospital
(50%) or a governmental hospital (28%) and paid an average 414.3 JDs in the second facility
Figure 43: Sought healthcare elsewhere - Those who sought healthcare services (n=171)
Figure 44: Second facility - Those who sought care elsewhere (n=32)
16%
84%
Sought health care services elsewhere
Yes
No
47%
28%
16%
3%6%
0%
5%
10%
15%
20%
25%
30%
35%
40%
45%
50%
Private Clinic /Hospital
GovernmentHospital
JHAS clinic Caritas clinic PrivatePharmacy
NGOclinic/Hospital
Other
Second facility
38
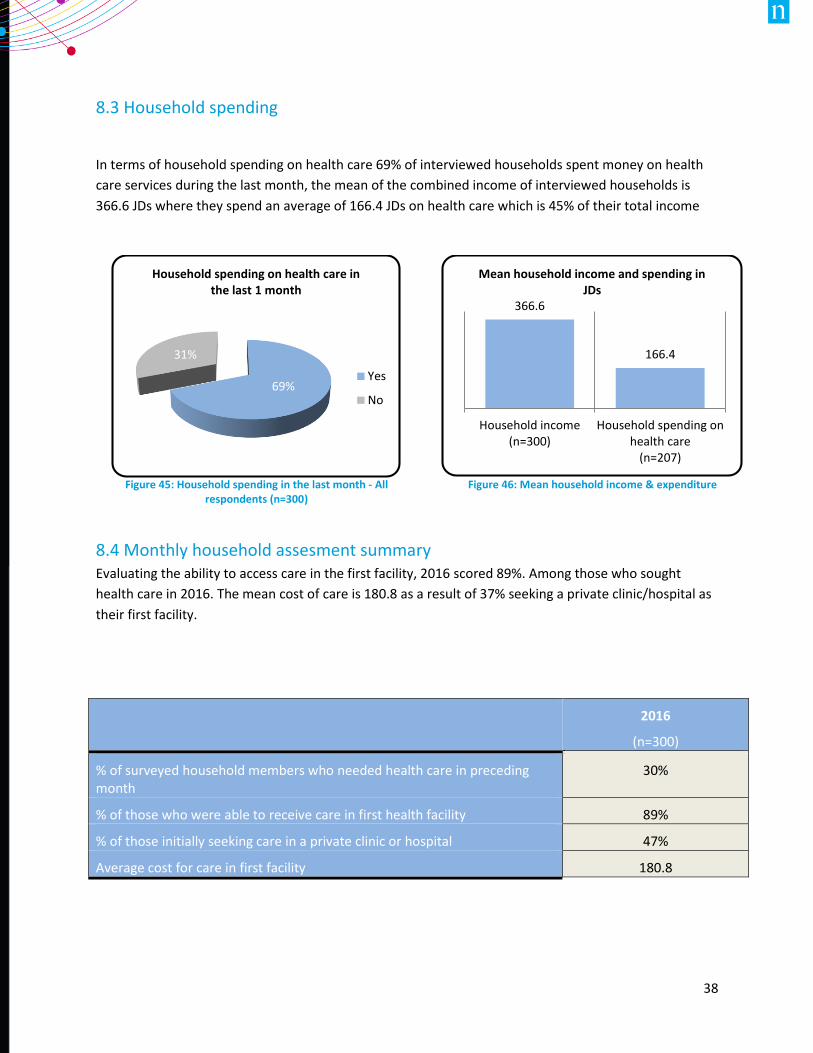
8.3 Household spending
In terms of household spending on health care 69% of interviewed households spent money on health
care services during the last month, the mean of the combined income of interviewed households is
366.6 JDs where they spend an average of 166.4 JDs on health care which is 45% of their total income
8.4 Monthly household assesment summary Evaluating the ability to access care in the first facility, 2016 scored 89%. Among those who sought
health care in 2016. The mean cost of care is 180.8 as a result of 37% seeking a private clinic/hospital as
their first facility.
Figure 45: Household spending in the last month - All
respondents (n=300)
Figure 46: Mean household income & expenditure
2016
(n=300)
% of surveyed household members who needed health care in preceding month
30%
% of those who were able to receive care in first health facility 89%
% of those initially seeking care in a private clinic or hospital 47%
Average cost for care in first facility 180.8
69%
31%
Household spending on health care in the last 1 month
Yes
No
366.6
166.4
Household income(n=300)
Household spending onhealth care
(n=207)
Mean household income and spending in JDs