Embed Size (px)
Citation preview
Paper 2: Changing Economic World1. Define “Quality of life” (2 marks) 2. Study the table and graph to the right.
a. Name the country at point A on the scattergraph (1 mark)
b. Complete the scattergraph by plotting the data for Uruguay. (1 mark) GNI: 15,180 Infant mortality: 10
c. Draw a line of best fit (trend line) on the scattergraph to show the relationship between GNI and infant mortality. (1 mark)
d. Suggest one reason for the relationship between GNI and infant mortality shown on the scattergraph. (2 marks)
e. Using the data in Figure 5, calculate the average infant mortality rate for the twelve countries shown. Show your working in the space below. (2 marks)
3. Why are some development indicators considered less reliable (or accurate) than others? (4 marks)
4. Suggest two ways that the level of economic development of a country might affect the quality of life of its people. (4 marks)
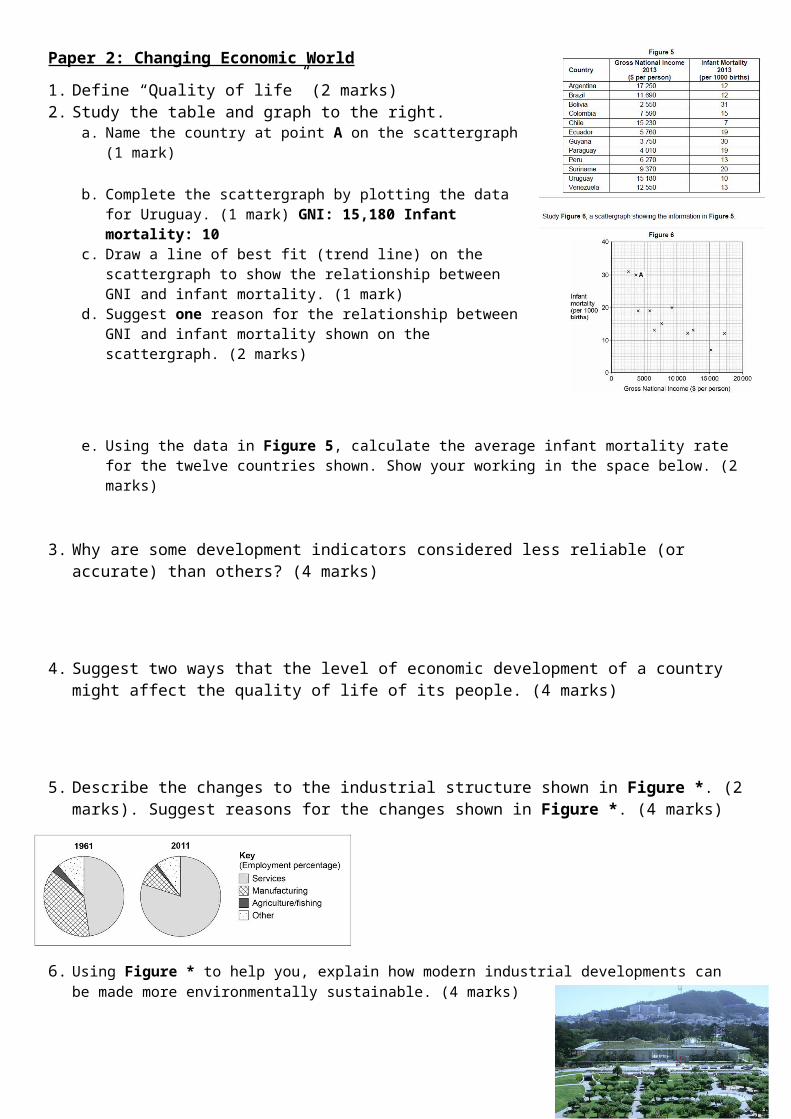
5. Describe the changes to the industrial structure shown in Figure *. (2 marks). Suggest reasons for the changes shown in Figure *. (4 marks)
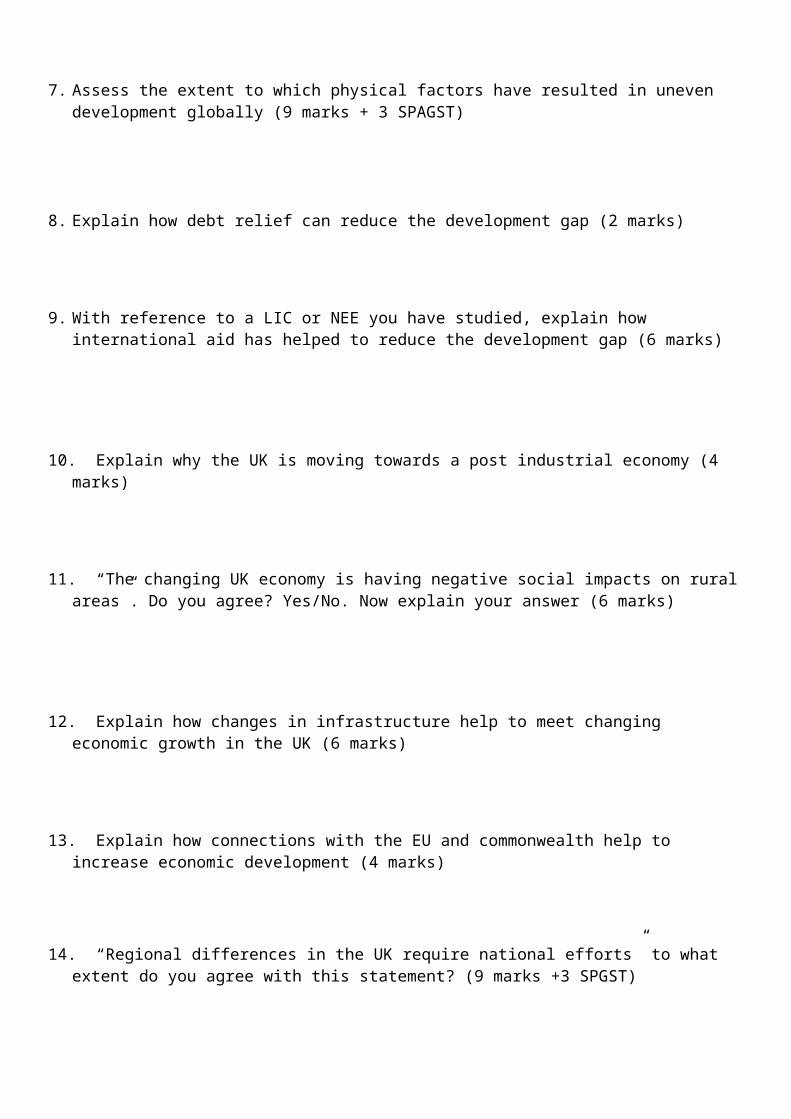
6. Using Figure * to help you, explain how modern industrial developments can be made more environmentally sustainable. (4 marks)
7. Assess the extent to which physical factors have resulted in uneven development globally (9 marks + 3 SPAGST)
8. Explain how debt relief can reduce the development gap (2 marks)
9. With reference to a LIC or NEE you have studied, explain how international aid has helped to reduce the development gap (6 marks)
10. Explain why the UK is moving towards a post industrial economy (4 marks)
11. “The changing UK economy is having negative social impacts on rural areas”. Do you agree? Yes/No. Now explain your answer (6 marks)
12. Explain how changes in infrastructure help to meet changing economic growth in the UK (6 marks)
13. Explain how connections with the EU and commonwealth help to increase economic development (4 marks)
14. “Regional differences in the UK require national efforts” to what extent do you agree with this statement? (9 marks +3 SPGST)