Embed Size (px)
Citation preview
HE in England from 2012: Funding and finance
Standard Note: SN/SG/6206
Last updated: 31 October 2014
Author: Paul Bolton
Section Social & General Statistics
The Government raised the cap on tuition fees for new student to £9,000 in 2012/13 and cut
most ongoing direct public funding for tuition in England. This shifted the balance of higher
education funding further away from the state and further towards the individual who benefits.
Students can take out publicly subsided student loans to pay these higher fees. There is
uncertainty about the final size of this subsidy and the Government’s estimate of it has
increased considerably since the reforms were first announced. This also affects the size of
any saving in public expenditure and the extent of the shift in costs from the state to the
individual beneficiary.
This note looks at the impact of these changes and subsequent announcements on public
expenditure on higher education in England and on funding available for higher education
institutions in England. It builds on the analysis of funding in Changes to higher education
funding and student support in England from 2012/13. That note summarises the
Government’s reforms and looks at the potential impact on graduates, universities and public
spending. It looks in detail at a number of areas which are only touched on in this note,
including, the possible impacts on graduate repayments by income decile, the earnings
assumptions behind the loan repayments model and the effect of different average fee levels.
The note HE in England from 2012: Student numbers looks at how student numbers figured in
the 2012 higher education reforms and subsequent announcements and summarises the
evidence on applications from new students.
This information is provided to Members of Parliament in support of their parliamentary duties and is not intended to
address the specific circumstances of any particular individual. It should not be relied upon as being up to date; the
law or policies may have changed since it was last updated; and it should not be relied upon as legal or professional
advice or as a substitute for it. A suitably qualified professional should be consulted if specific advice or information
is required.
This information is provided subject to our general terms and conditions which are available online or may be
provided on request in hard copy. Authors are available to discuss the content of this briefing with Members and
their staff, but not with the general public.
2
Contents
1 Background 2
2 Public spending on higher education in England 3
2.1 Comprehensive Spending Review and Spending Round 2013 settlements 3
2.2 Autumn Statement 2013 announcement on student numbers 4
2.3 Direct funding through the funding council 5
Teaching 6
Research 7
Other 7
2.4 Student loans 8
Subsidy elements of loans 8
Estimates of the resource costs of loans 8
Impact of loans on the national debt 10
2.5 Student support 11
2.6 Overall spending 11
3 Funding for institutions from HEFCE 12
3.1 2012/13 12
3.2 2013/14 13
3.3 2014/15 13
1 Background
The Independent Review of Higher Education Funding – the Browne Report1- was published
in October 2010. It made recommendations on the future funding and organisation of the
higher education sector and on student finance. The main recommendations directly
connected to funding were:
Remove the direct public funding for most undergraduate courses and retain a much
smaller amount (around 20%) to contribute towards higher cost subjects.
Remove the cap from tuition fees. Institutions would keep all the income from fees of
up to £6,000, but at higher fee levels the additional income would be shared with the
Government. The share going to the Government would increase with the fee level.
Extend student loans to part-time students
Increase the student loans repayment threshold for graduates from £15,000 to £21,000
and review the threshold regularly to keep it in line with earnings growth.
1 Securing a sustainable future for higher education –An independent review of higher education funding &
student finance
3
Introduce a real interest rate on student loans for graduates earning above the
repayment threshold equal to the Government’s cost of borrowing (inflation plus 2.2%)
and ensure no one repaying their loan sees its real value increase.
Extend the write-off period of loans from 25 to 30 years
Increase student numbers by 10% to remove excess demand
The report concluded that, with static number of students, the reforms would eventually cut
core public spending on undergraduate study by around £1.8 billion or almost 30%, graduates
would repay more (55% more with fees of £8,000) but additional repayments would come from
higher earning graduates and institutions could see an increase in their income2 with fees of
around £7,000 or more (10% with fees of £8,000).3
The Government announced its plans for reform of higher education and student finance in
November 2010.4 These followed many of the recommendations set out in the Browne Report.
The major differences with an impact on funding were:
A cap on fees of £9,000, no levy on fees above this level, but obligations on the
institution to spend more on access for disadvantaged students
A real interest of 3% above inflation for graduates earning above £41,000 (in 2016)
with a sliding scale rising from inflation only at £21,000
Annual uprating of both thresholds in line with growth in average earnings5
No growth in student number
The general arrangements for the fees and loan repayment remain much the same as for
pre-2012 students–they can take out loans to cover fees, they do not need to be paid up front,
and graduates start repay 9% of any income above the earnings threshold. Higher fees will
mean average loans will increase. This increases the potential duration of loan repayments as
monthly repayments depend on income and the level of the earnings threshold, not debt
levels.
2 Public spending on higher education in England
There are four main elements of public spending on higher education –direct funding through
the Higher Education Funding Council for England (HEFCE) which covers both teaching and
research, student maintenance grants and student loans.
2.1 Comprehensive Spending Review and Spending Round 2013 settlements
The Comprehensive Spending Review (CSR) set out the parameters for public spending over
the period 2011-12 to 2014-15. The Spending Round 2013 extended this to 2015-16. The
settlement for the Department for Business Innovation and Skills (BIS) gave the total level of
resources for higher education (excluding research) at the baseline year and at the end of this
period. This was to fall from £7.1 billion in 2010-11 to £4.2 billion in 2014-15;6 a cut of 41% in
cash terms and 46% in real terms.7 This spending covers funding for teaching via HEFCE,
direct maintenance support and spending by BIS on access. It excludes direct funding for
research which was added to funding for the Research Councils under the heading ‘science 2 Income from these fees and teaching grants only 3 ibid. pp43-44 4 Reform for higher education and student finance, BIS (3 November 2010) 5 The initial proposal was for five-yearly upratings. 6 BIS news release 20 October 2010, The Department for Business Innovation and Skills Spending Review
Settlement 7 Adjusted using December 2013 GDP deflators and OBR projections.
4
and research funding’. This latter total would be kept constant in cash terms over the CSR
period; a real terms cut of around 8%.8
The Spending Round 2013 announced a series of further savings from the higher education
budget –the continued cuts in funding for teaching as the 2012 system applies to more
students, freezing grants, requiring HEFCE to make additional savings and cutting access
spending- but did not give a total figure.9
The headline CSR settlement figure excludes the cost of the subsidy element of student loans
which at the time was expected to increase from £1.7 billion in 2010-11 to £3.3 billion in 2014-
15.10 Adding the higher education and loan cost elements together made total public funding
for higher education (excluding research) in England £8.8 billion in 2010-11 and £7.5 billion in
2014-15; a cash fall of 15% or a real cut of 22%. The CSR did not give separate figures on
capital funding for higher education. The overall capital settlement for all BIS functions was
planned to fall by a greater amount than resource spending.
More detail has on spending has been published since the CSR, particularly around the
subsidy element of student loans. Autumn Statement 2013 announced the cap on student
numbers would be raised in 2014-15 and lifted in 2015-16 which will increase spending
compared to what it would otherwise have been.
2.2 Autumn Statement 2013 announcement on student numbers
In the Autumn Statement 2013 the Chancellor announced that the cap on student numbers in
England would be increased by 30,000 in 2014/15 and removed in 2015/16. It is estimated
that this could mean an additional 60,000 students starting each year11 described as “...young
people ... who have the grades to enter higher education but cannot currently secure a
place.”12 The annual cash cost of removing the cap on student numbers is estimated at
£2.6 billion in 2018-19; £0.7 billion in maintenance grants and direct spending on teaching13
and £1.9 billion on the full face-value of loans. The resource cost of this policy –which only
includes the subsidy element of the loans14- is expected to be around £1.4 billion per year in
the medium term; just over half of this is the subsidy element of loans the rest is grants and
teaching costs.
The Autumn Statement explained that the additional outlay of loans over the period to 2018/19
would be more than covered by sales of pre-2012 income-contingent loans. It was estimated
that gross proceeds from these sales over the five years from 2015-16 will be in the range of
£10-15 billion, with a central estimate of £12 billion.15 Sales of pre-2012 loans cannot go on
indefinitely and even if it were assumed that pre-2012 loan sales continued (as far as
possible) it is highly likely that the cumulative proceeds from loan sales would be less than the
8 ibid. 9 Spending Round 2013, HM Treasury 10 Economic and fiscal outlook, Office of Budget Responsibility November 2010). Supplementary table 1.10 11 The Government assumes £345,000 full-time entrants in 2013/14 (HC Deb 24 February 2014 c156-7W 12 Autumn Statement 2013, HM Treasury 13 Includes the cost of the knock on-impact of this spending increase on Treasury grant to Scotland, Wales and
Northern Ireland (‘Barnet consequentials’) 14 The proportion of their face value which is not expected to be repaid, in present value terms. 15 Autumn Statement 2013, HM Treasury
5
cumulative cost of lifting the cap within a decade.16 If these costs still had to be met through
loan sales at that point then sell offs would need to move to the post-2012 loan book.
The Institute for Fiscal Studies made the following comments after the Autumn Statement:17
…in his speech the Chancellor claimed that the additional cost of student loans arising
from lifting the cap on the number of students in higher education would be “financed by
selling the old student loan book”. This may work in the near-term fiscal numbers, but
economically it makes little sense. Selling the loan book will be broadly fiscally neutral in
the long run, bringing in more money now at the expense of less money later on. Lifting
the cap on numbers will cost money every year.
The Office for Budget Responsibility (OBR) makes the same point in their long-term fiscal
projections. These conclude that so long as these loans are sold at a ‘fair’ value the expected
return (on these assets) to the Government at the point of sale would be zero. In other words
the sale price is equal to the present value of the lost future repayments. Selling loans at a fair
price would only affect the flow of receipts not their present value.18
In July 2014 the Secretary of State is reported to have ruled out any sale of these loans (in
this Parliament) because recent evidence suggested there was “…no longer any public
benefit…” to the sales.19 The Government have subsequently said that the expansion of
student numbers has been agreed with the Treasury and “Student numbers are not contingent
on the sale…”20
The next sections look at each main element of public spending in turn.
2.3 Direct funding through the funding council
The Secretary of State writes to HEFCE around the turn of each year to set out funding,
priorities, student numbers and related matters for the following financial year. Occasionally
these letters cover more than one year and sometimes revised versions are published. The
most recent funding letter was published in mid February 2014. It covered funding in 2014-15
and gave indicative allocations for 2015-16. This is the first time that such detailed spending
figures have been published for the periods covered by the CSR and the Spending Round
2013 and the first indication of the impact of Autumn Statement announcement on direct
funding. All these funding letters from the mid-1990s onwards can be found at:
http://www.hefce.ac.uk/whatwedo/invest/institns/annallocns/governmentgrantletter/
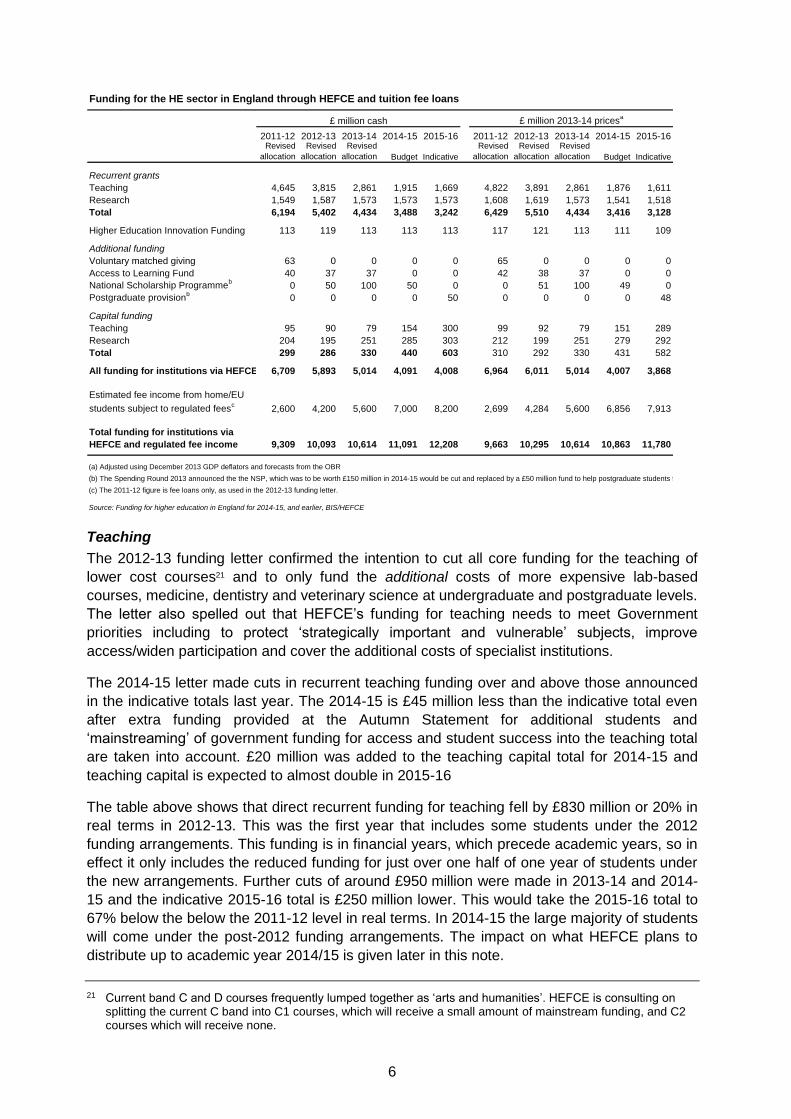
The following table gives details of HEFCE funding and estimated fee loans from the latest
funding letter
16 The cost of the policies is the sum of the cash value of new loans and direct spending on additional students,
plus the value of lost repayments from loans which are sold. This calculation assumes that the gross proceeds estimates in the Autumn Statement are met and further tranches are sold with gross proceeds of £2.5 billion per year after 2019-20. Cumulative gross costs are larger than cumulative gross proceeds by 2023-24 with an assumed 40% write down on all loan sales. Changes in the write-down rate have a large impact on the total proceeds.
17 Autumn Statement 2013: Introductory Remarks, IFS 18 Fiscal Sustainability Report – July 2014, OBR 19 Student loans sell-off abandonment raises tension in cabinet, The Guardian 20 July 2014 20 PQ HL1512 [on Higher and further education: Admissions], 11 August 2014
6
Funding for the HE sector in England through HEFCE and tuition fee loans
£ million cash £ million 2013-14 pricesa
2011-12 2012-13 2013-14 2014-15 2015-16 2011-12 2012-13 2013-14 2014-15 2015-16Revised
allocation
Revised
allocation
Revised
allocation Budget Indicative
Revised
allocation
Revised
allocation
Revised
allocation Budget Indicative
Recurrent grants
Teaching 4,645 3,815 2,861 1,915 1,669 4,822 3,891 2,861 1,876 1,611
Research 1,549 1,587 1,573 1,573 1,573 1,608 1,619 1,573 1,541 1,518
Total 6,194 5,402 4,434 3,488 3,242 6,429 5,510 4,434 3,416 3,128
Higher Education Innovation Funding 113 119 113 113 113 117 121 113 111 109
Additional funding
Voluntary matched giving 63 0 0 0 0 65 0 0 0 0
Access to Learning Fund 40 37 37 0 0 42 38 37 0 0
National Scholarship Programmeb
0 50 100 50 0 0 51 100 49 0
Postgraduate provisionb
0 0 0 0 50 0 0 0 0 48
Capital funding
Teaching 95 90 79 154 300 99 92 79 151 289
Research 204 195 251 285 303 212 199 251 279 292
Total 299 286 330 440 603 310 292 330 431 582
All funding for institutions via HEFCE 6,709 5,893 5,014 4,091 4,008 6,964 6,011 5,014 4,007 3,868
Estimated fee income from home/EU
students subject to regulated feesc
2,600 4,200 5,600 7,000 8,200 2,699 4,284 5,600 6,856 7,913
Total funding for institutions via
HEFCE and regulated fee income 9,309 10,093 10,614 11,091 12,208 9,663 10,295 10,614 10,863 11,780
(a) Adjusted using December 2013 GDP deflators and forecasts from the OBR
(b) The Spending Round 2013 announced the the NSP, which was to be worth £150 million in 2014-15 would be cut and replaced by a £50 million fund to help postgraduate students from 2015-16.
(c) The 2011-12 figure is fee loans only, as used in the 2012-13 funding letter.
Source: Funding for higher education in England for 2014-15, and earlier, BIS/HEFCE
Teaching
The 2012-13 funding letter confirmed the intention to cut all core funding for the teaching of
lower cost courses21 and to only fund the additional costs of more expensive lab-based
courses, medicine, dentistry and veterinary science at undergraduate and postgraduate levels.
The letter also spelled out that HEFCE’s funding for teaching needs to meet Government
priorities including to protect ‘strategically important and vulnerable’ subjects, improve
access/widen participation and cover the additional costs of specialist institutions.
The 2014-15 letter made cuts in recurrent teaching funding over and above those announced
in the indicative totals last year. The 2014-15 is £45 million less than the indicative total even
after extra funding provided at the Autumn Statement for additional students and
‘mainstreaming’ of government funding for access and student success into the teaching total
are taken into account. £20 million was added to the teaching capital total for 2014-15 and
teaching capital is expected to almost double in 2015-16
The table above shows that direct recurrent funding for teaching fell by £830 million or 20% in
real terms in 2012-13. This was the first year that includes some students under the 2012
funding arrangements. This funding is in financial years, which precede academic years, so in
effect it only includes the reduced funding for just over one half of one year of students under
the new arrangements. Further cuts of around £950 million were made in 2013-14 and 2014-
15 and the indicative 2015-16 total is £250 million lower. This would take the 2015-16 total to
67% below the below the 2011-12 level in real terms. In 2014-15 the large majority of students
will come under the post-2012 funding arrangements. The impact on what HEFCE plans to
distribute up to academic year 2014/15 is given later in this note.
21 Current band C and D courses frequently lumped together as ‘arts and humanities’. HEFCE is consulting on
splitting the current C band into C1 courses, which will receive a small amount of mainstream funding, and C2 courses which will receive none.
7
The figures in this and other sections include changes for part-time students from 2012. At the
time the reforms were announced the Government estimated that savings from removing
direct funding and fee/course grants would be greater than the additional costs of providing
fee loans. The net saving on part-time funding in 2014-15 was estimated at £150 million.22
Research
The 2012 changes in university funding directly affect teaching rather than research. Since the
CSR funding for research paid to institutions through HEFCE has been included in public
spending figures with other science funding, rather than other higher education funding. Plans
were set out for each year to 2014-15 soon after the CSR was published. The earlier table
shows that recurrent funding for research will broadly keep its cash value up to 2014-15. The
2013 Spending Round keeps the total resource (recurrent) science budget for 2015-16, which
includes funding for Research Councils and other areas, at the same cash level as earlier
years. Total capital funding for science will increase.23 The 2015-16 total in the table above is
still below the 2010-11 allocation by around 18% in real terms.
Research funding paid to higher education institutions through HEFCE funds the research
capacity and infrastructure –such as the salaries of permanent academic staff, premises,
libraries etc- while the Research Councils fund specific research projects.
Other
The 2012-13 funding letter highlighted the ‘significant and increasing pressures’ on BIS
budgets. It announced the creation of a £62 million ‘unallocated provision’ to meet any
unforeseen pressures on the Department’s higher education budget. This has been created by
cutting the Voluntary Matched Giving fund in 2012-13 from its earlier indicative level of
£52 million to zero and by cutting the Access to Learning Fund by £10 million (compared to
the indicative level). The funding letter restated earlier instructions to HEFCE about recouping
funding from institutions that over recruit students in 2012 and again warned of the prospect of
cutting HEFCE’s grant in 2012-13 or future years if over recruitment results in higher student
support costs or causes other pressures on BIS budgets.24 The note HE in England from 2012:
Student numbers looks in more detail at the changes to student number control and financial
implications of over recruitment.
The 2013-14 funding letter made some changes to the treatment of student numbers in
response to recruitment in 2012/13 which was down, particularly among those liable for higher
fees.25 These included greater flexibility in how HEFCE operates the ‘core and margin’ model
of student number control and giving institutions a 3% over-recruitment ‘buffer zone’ before
penalties are imposed.
The 2014-15 letter incorporated the cut to the National Scholarship Programme announced in
the Spending Round 2013, ended separate funding for the Access to Learning Fund (which
provided hardship payments), directed HEFCE to combine this with its student opportunity
funding26 for institutions and also included the implications of the Autumn Statement 2013 for
funding through HEFCE.
22 Interim impact assessment –Urgent reforms to higher education funding and student finance, BIS (26
November 2010). Table 9 23 Spending Round 2013, HM Treasury 24 ibid. 25 The note Entrants to Higher Education looks in detail at 2012 recruitment 26 The student opportunity stream is meant to support institutions’ efforts to widen participation and allow then to
meet the higher costs of supporting disadvantaged and under-represented students through their courses
8
2.4 Student loans
There are two types of student loans –fees and maintenance. Full-time home and EU students
on qualifying courses can take out a loan to cover the tuition fees for their course. From 2012
new part-time students on courses with an intensity of 25% or greater will also be eligible for
loans. Maintenance loans are available to home students only. The amount someone can take
out as a maintenance loan depends on their household income, where they live and where
they study. The value of student maintenance support gives more details and Student loan
statistics gives more background about the system.
Subsidy elements of loans
The earlier table gave BIS estimates of the face value of fee loans to English students and EU
students studying at English institutions. Only part of the face value of fee and maintenance
loans paid out in any one year counts as public expenditure. This is what the Government
expects the subsidy element to be and is viewed as the permanent costs of the loan to the
taxpayer. This system is known as resource accounting and budgeting (RAB) or accruals
accounting and has been in place in the public sector for more than a decade. The subsidy
element is calculated as the face value of loans made in any one year less the discounted or
present value of future repayments. This can be thought of as the amount of money lent to
students that the Government does not expect to get back. It is frequently expressed as a
proportion of the value of loans, the so-called RAB charge.
There are two main parts to the subsidy in student loans: i) their interest rate and ii) their write
off terms. The cost arises in i) where interest rates are set below the Government’s cost of
borrowing, they represent a cost to Government even if they are repaid in full. This cost
increases the longer it takes to repay the loan. Costs arise in ii) for all elements of write-off. As
loan repayments depend on income some or all of a borrower’s debt may be written off at the
end of the loan period (30 years for new starters from 2012) –write off for low lifetime
earnings. Debts will also be written off for long term disability or death. The introduction of a
real interest rate and higher repayment thresholds will mean the subsidy from 2012 will be
shifted away from the interest rate and towards write off (for low lifetime earnings).
Estimates of the resource costs of loans
The Government made estimates of the percentage RAB rate on new loans from 2012 when it
published proposals for changes to funding. These are discussed in some detail in Changes to
higher education funding and student support in England from 2012/13. The estimated RAB
rate on new loans of around 30% has since been increased to ‘around 35%’ 27 then to 35%-
40%28, revised upwards again to ‘around 40%’29 and most recently to ‘around 45%’.30 These
increases have been largely due to changes in economic forecasts, particularly on earnings.31
These less optimistic forecast reduce the expected cash value of repayments and or delay
when they will be made. Other factors behind the increase in the RAB rate include the higher
than expected level of average tuition fee loans, a change to the timing of repayment
threshold uprating, lower assumed repayments from the extra students who start higher
education because the numbers cap is lifted32 and improvements to the Governments loan 27 HC Deb 4 July 2013 c775-6W 28 HC Deb 9 December 2013 c5W 29 HC Deb 19 December 2013 c780W 30 HC Deb 20 March 2014 c706W 31 The OBR links lower earnings growth to “…much weaker-than-expected growth in productivity.” They also note
that the data now used for modelling repayments, including that from the Student Loans Company, have widened the modelled distribution of earnings among graduates. This wider distribution cuts expected repayments, even if average earnings remain unchanged. Fiscal Sustainability Report – July 2014, OBR
32 HC Deb 10 December 2013 c130W
9
repayment model which is used to forecast repayments and hence calculate the resource
costs of loans.33
Loan repayment models BIS estimates of the RAB cost of student loans are calculated using a student loan repayment
model. This makes long term forecasts of repayments for individual borrowers and is highly
complex. There is a substantial amount of uncertainty about future repayment levels which are
connected in large part to earnings growth forecasts. The 2013-14 model assumes short-term
average earnings growth in line with Office of Budget Responsibility forecasts34 and long-term
growth of 4.4%.35 The BIS accounts state that there is ‘significant’ potential for actual
repayments to vary from forecast ones in the short and long-term. As examples the accounts
state that if real earnings growth were 0.5 percentage points lower than assumed each year
the value of the loans held would be £1.2 billion lower and if graduate income profiles36 were
5% lower than assume each year the value of loans held would also be £1.2 billion lower. In
both cases the relationship between the value of loans issued and the assumed indicator are
not linear and further reductions would have an even greater additional impact.37
A substantial degree of uncertainty remains despite improvements to the model used to
forecast repayments. In November 2013 the National Audit Office published a report on how
BIS manages and forecasts repayments. This pointed out a number of weaknesses in the
model used at the time. A new model was introduced in 2013-14 and in his report on the
accounted the Comptroller and Auditor General concluded that it could forecast repayments
with more precision and is “..substantially more accurate…” in its short term forecasts38.
However, the expected growth in the scale of loans could magnify what are currently small
differences between forecast and actual repayments and the model would need to “..keep
pace…” with these matters.39
A simplified version of the model used to produce estimates for their accounts was made
public to inform debate around the changes to funding in 2012. There was much debate
around the assumptions used for this model. Some commentators said the earnings
assumptions over optimistic and the actual level of public spending would be above the BIS
estimates –conclusions the recent increases in the RAB charge estimates seem to support.
An updated version of the publicly available model was made available in January 2014. This
calculated an overall RAB rate of 35% for standard assumptions of average loans, some way
below the estimated rate at the time. This model was revised and updated in June 2014 and
this version calculated the overall RAB at just over 45% for standard assumptions of average
loans. This was in line with the most recent official estimates.
33 These are summarised in the National Audit Office report Student loan repayments 34 The latest online (simplified) model assumes growth in the cash value of earnings of 3.2% in 2014, 3.8% to
3.9% in 2015 to 2019, increasing to 4.1% in 2021 35 It is important to recognise that these are not expected annual increases in salaries of individual graduates over
their career, but uprating factors for the assumed income profiles which themselves generally show rapid increases in early career earnings
36 These are actual lifetime earnings profiles for modelled graduates which give income in each year post graduation. They are affected by assumptions about starting salaries, early career income growth, employment rates etc.
37 Annual report and accounts 2013-14, BIS 38 Based on retrospective testing against historic repayments 39 Annual report and accounts 2013-14, BIS
10
Changes to higher education funding and student support in England from 2012/13 looks at
the original model ready reckoner in more detail.40 That note also looks at the implications for
public spending of fee levels that are different from the Government’s planning assumption. All
the BIS estimates assumed an average tuition fee loan of £7,500 for new students from 2012.
This is below the estimate (£8,123) of the average fee after deductions which was derived by
the access regulator from institutions’ access agreements. This is expected to increase further
in each year to 2015/16 despite the freeze on the fee cap at £9,000. The increase is due to a
combination of increases in headline fee levels (for those charging below £9,000) and a
reduction in fee waivers. The provisional estimated fee level in 2015/16 is £8,830 or £8,761
after waivers.41 A larger average fee loan increases the Government’s cash outlay on loans
and increases the percentage RAB charge by a small amount. If this increase were directly
reflected in average total student loans then the modelled RAB rate could increase to the high
40 percents. The Browne proposal for a levy on additional fee income above £6,000 would
have meant that higher fees above this level had little or no impact on public spending.
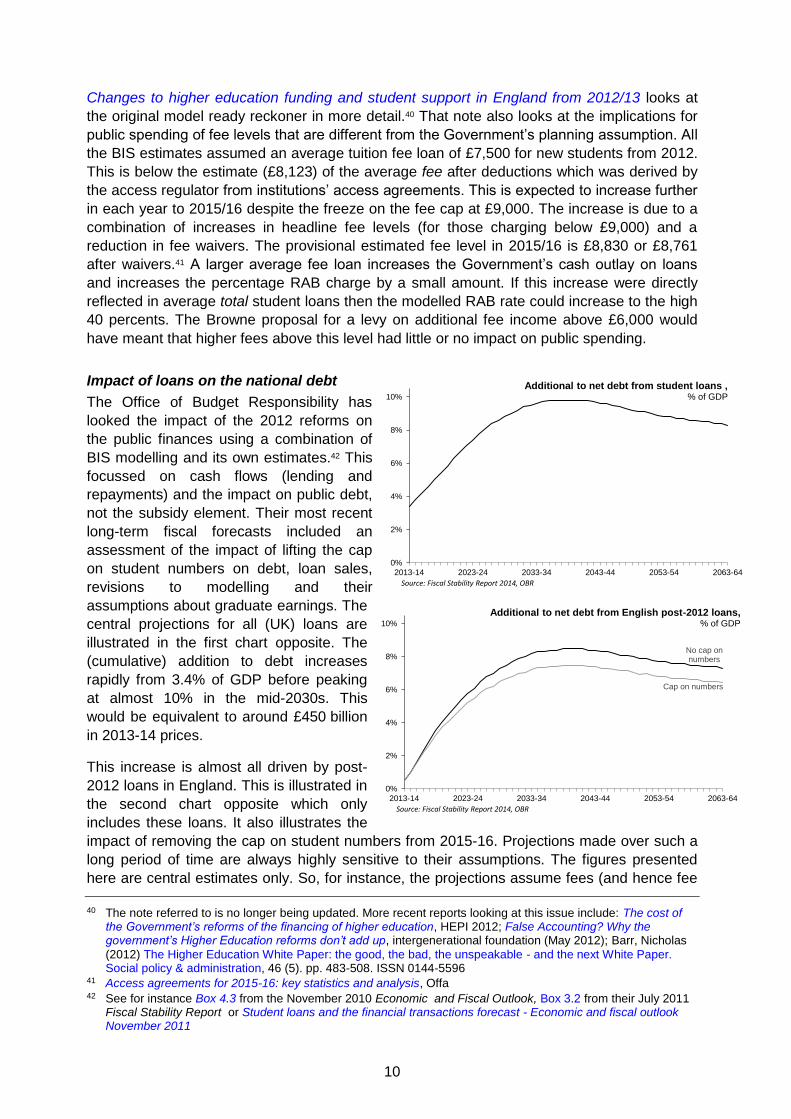
Impact of loans on the national debt
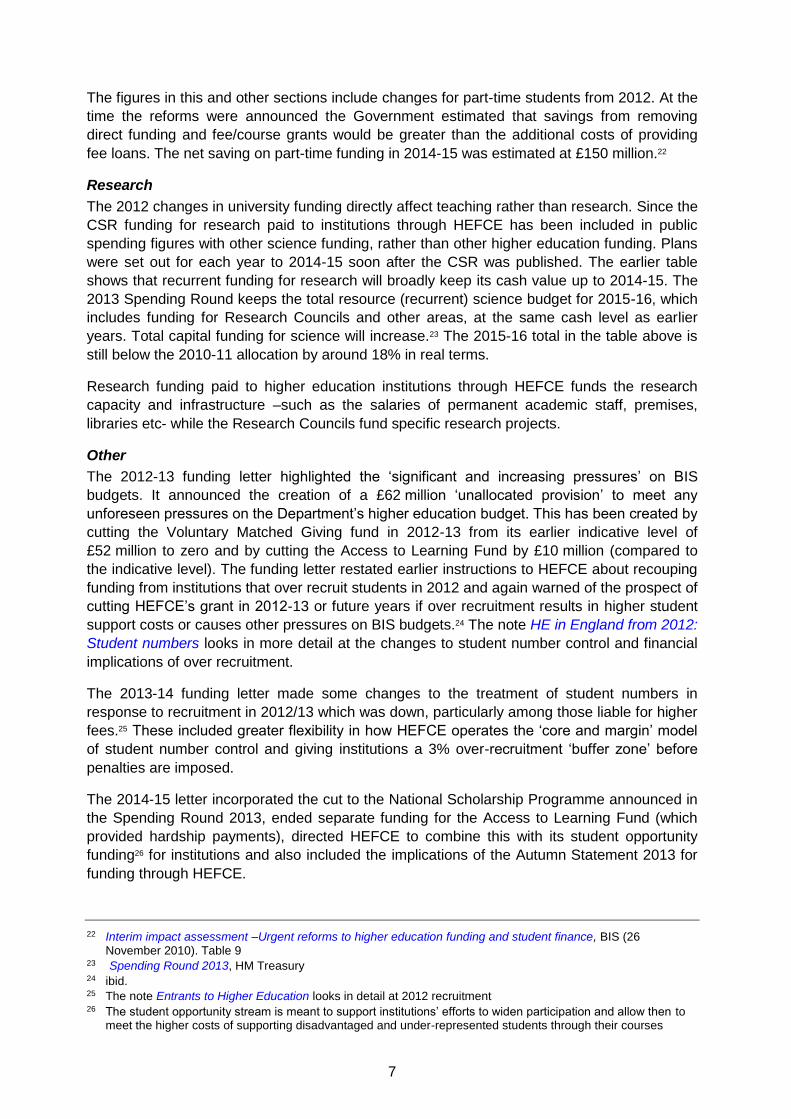
The Office of Budget Responsibility has
looked the impact of the 2012 reforms on
the public finances using a combination of
BIS modelling and its own estimates.42 This
focussed on cash flows (lending and
repayments) and the impact on public debt,
not the subsidy element. Their most recent
long-term fiscal forecasts included an
assessment of the impact of lifting the cap
on student numbers on debt, loan sales,
revisions to modelling and their
assumptions about graduate earnings. The
central projections for all (UK) loans are
illustrated in the first chart opposite. The
(cumulative) addition to debt increases
rapidly from 3.4% of GDP before peaking
at almost 10% in the mid-2030s. This
would be equivalent to around £450 billion
in 2013-14 prices.
This increase is almost all driven by post-
2012 loans in England. This is illustrated in
the second chart opposite which only
includes these loans. It also illustrates the
impact of removing the cap on student numbers from 2015-16. Projections made over such a
long period of time are always highly sensitive to their assumptions. The figures presented
here are central estimates only. So, for instance, the projections assume fees (and hence fee 40 The note referred to is no longer being updated. More recent reports looking at this issue include: The cost of
the Government’s reforms of the financing of higher education, HEPI 2012; False Accounting? Why the government’s Higher Education reforms don’t add up, intergenerational foundation (May 2012); Barr, Nicholas
(2012) The Higher Education White Paper: the good, the bad, the unspeakable - and the next White Paper. Social policy & administration, 46 (5). pp. 483-508. ISSN 0144-5596
41 Access agreements for 2015-16: key statistics and analysis, Offa 42 See for instance Box 4.3 from the November 2010 Economic and Fiscal Outlook, Box 3.2 from their July 2011
Fiscal Stability Report or Student loans and the financial transactions forecast - Economic and fiscal outlook November 2011
0%
2%
4%
6%
8%
10%
2013-14 2023-24 2033-34 2043-44 2053-54 2063-64
Additional to net debt from student loans , % of GDP
Source: Fiscal Stability Report 2014, OBR
No cap on numbers
Cap on numbers
0%
2%
4%
6%
8%
10%
2013-14 2023-24 2033-34 2043-44 2053-54 2063-64
Additional to net debt from English post-2012 loans, % of GDP
Source: Fiscal Stability Report 2014, OBR
11
loans) increase in line with earnings each year, but if this is changes to uprating with inflation
the peak rate is lower by around 1% of GDP and the early 2060s rate by around 3.3% of GDP.
2.5 Student support
Spending on student maintenance grants was expected to increase from £1.3 billion in
2011-12 to £1.6 billion in 2014-1543 although this forecast was made before the announcement
on increases in student numbers. The additional students are expected to be more likely (than
‘existing’ students) to receive a grant and to repay a smaller proportion of their loans.44 No
2015-16 forecasts have been yet been published. The Government announced the creation of
National Scholarship Programme at the time of other proposed changes to higher education
funding. This was central government support aimed at disadvantaged students attending
institutions with fees of over £6,000. The institutions themselves were expected to at least
match this funding. BIS spending under this heading is given in the earlier table. It was
expected to increase to £150 million in 2014-15.45 The Spending Round 2013 announced that
the value of the government contribution to the NSP would be cut to £50 million in 2015-16
and it would be refocused on postgraduate students only.46
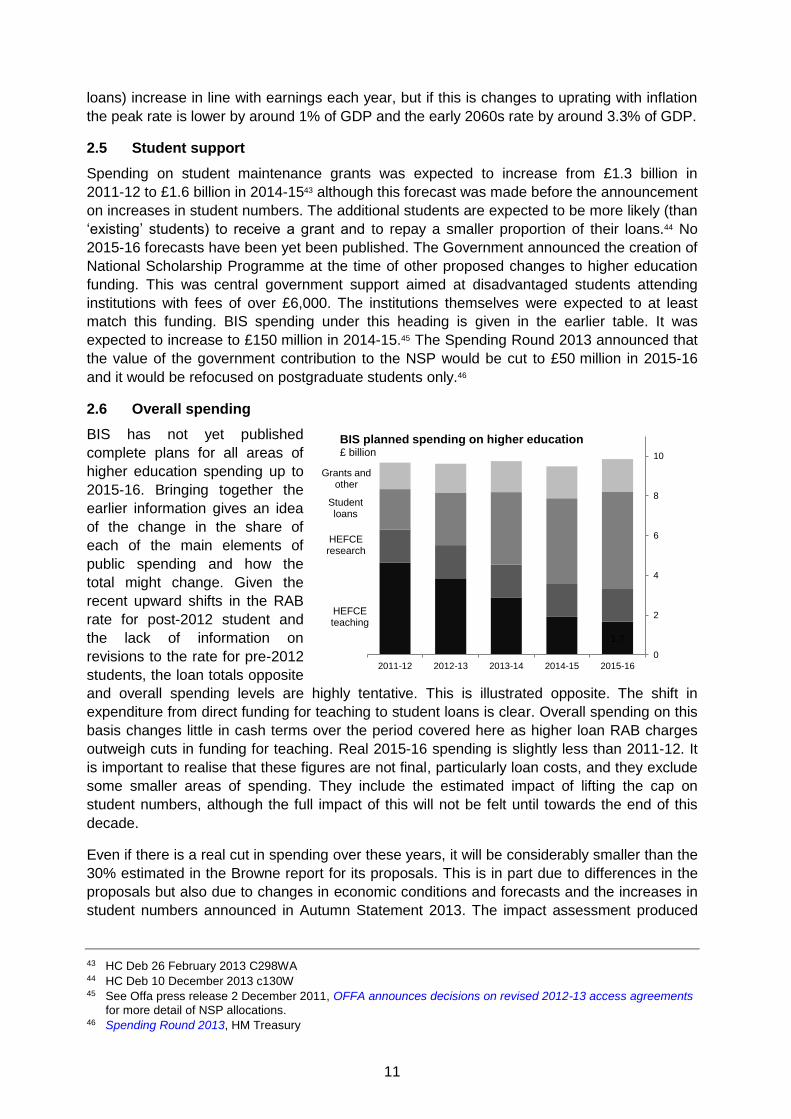
2.6 Overall spending
BIS has not yet published
complete plans for all areas of
higher education spending up to
2015-16. Bringing together the
earlier information gives an idea
of the change in the share of
each of the main elements of
public spending and how the
total might change. Given the
recent upward shifts in the RAB
rate for post-2012 student and
the lack of information on
revisions to the rate for pre-2012
students, the loan totals opposite
and overall spending levels are highly tentative. This is illustrated opposite. The shift in
expenditure from direct funding for teaching to student loans is clear. Overall spending on this
basis changes little in cash terms over the period covered here as higher loan RAB charges
outweigh cuts in funding for teaching. Real 2015-16 spending is slightly less than 2011-12. It
is important to realise that these figures are not final, particularly loan costs, and they exclude
some smaller areas of spending. They include the estimated impact of lifting the cap on
student numbers, although the full impact of this will not be felt until towards the end of this
decade.
Even if there is a real cut in spending over these years, it will be considerably smaller than the
30% estimated in the Browne report for its proposals. This is in part due to differences in the
proposals but also due to changes in economic conditions and forecasts and the increases in
student numbers announced in Autumn Statement 2013. The impact assessment produced
43 HC Deb 26 February 2013 C298WA 44 HC Deb 10 December 2013 c130W 45 See Offa press release 2 December 2011, OFFA announces decisions on revised 2012-13 access agreements
for more detail of NSP allocations. 46 Spending Round 2013, HM Treasury
HEFCEteaching
1.7
HEFCE research
Studentloans
Grants and other
0
2
4
6
8
10
2011-12 2012-13 2013-14 2014-15 2015-16
BIS planned spending on higher education£ billion
12
for the 2012 changes estimated that the steady-state savings, when all students are under the
new arrangements, will be around 20% greater than those in 2014-15.47
BIS has a performance indicator on levels of funding per student. These are updated annually,
but do not cover the whole of the current planning period. The latest version can be found
alongside other BIS performance indicators. This shows that total spending fell in cash terms
in 2011-12, 2012-13 and 2013-14, but falls in the number of full-time equivalent students
meant that estimated cash spending per student went from £6,130 in 2010-11 to £6,280 in
2013-14. Spending per student fell by around 8% in real terms over this period.48 Clearly these
figures do not yet include the full impact of the 2012 reforms.
3 Funding for institutions from HEFCE
3.1 2012/13
Initial allocations for individual institutions for 2012/13 were announced at the end of March
2012 and firmed up in July. They give a breakdown of funding and student number controls for
all institutions for academic year 2012/13.
Compared to recurrent funding in 2011/12 all but three of the 129 higher education institutions
saw a fall in provisional funding and this was by more than 20% at 74 of them. Cuts tended to
be smaller at universities who receive more income for research including Oxford (-5%),
Cambridge (-4%), Imperial (-3%) and Kings (-6%).49
Funding totals are subject to revision when more is known about actual student numbers. The
2012 reforms mean revisions are expected to be larger than in previous years. The first stage
of revision came in March 2013 with adjusted allocations which reflected actual in-year
student numbers. Most higher education institutions saw their initial allocations adjusted by
less than 2% and around one in six has adjustments of more than 5% (plus or minus).50 In
October 2013 these tables were revised. Final allocations were confirmed in March 2014.
Student number controls for 2012/13 can also be compared to those for 2011/12. The
implementation of the ‘core and margin’ model and the reduction in the total limit meant that
totals given for individual institutions varied to a much greater extent than in the past. 34 of
129 higher education institutions were shown to have a limit more than 10% below their
2011/12 total. 22 were shown to have an increase; most of these are below 5%. The largest
increases among larger institutions were for Oxford (14%, Cambridge (13%) and LSE (9%).
Overall higher education institutions were expected to lose around 19,500 places;51 a cut of
5.6%. Further education colleges gained additional places through the allocation of the
‘flexible margin’ for lower cost courses. Their net increase was 10,900 places; an increase of
48%.52 HEFCE is due to publish analysis of the impact of the new funding arrangements on
2012/13 student numbers in March 2013.
The student number controls calculated by HEFCE include an estimate for each institution of
the number of students who were no longer subject to student number controls. These are the
‘AAB+’ and medicine and dentistry students. HEFCE has apportioned them to institutions
47 Interim impact assessment –Urgent reforms to higher education funding and student finance, BIS (26
November 2010). Table 8 48 Funding per student in higher education –BIS Performance Indicators, BIS (June 2014) 49 Allocations of recurrent funding for 2012-13 (July)- Summary tables, HEFCE (July 2012). Table 2 50 Recurrent grants for 2012-13 Adjusted allocations, HEFCE (March 2013) 51 Full-time undergraduate and PGCE entrants 52 2012-13 Student number control limits, HEFCE (March 2012)
13
based on 2011/12 student numbers uprated for the expected growth in 2012/13. This means
that their totals are not, strictly speaking, limits on recruitment for each institution. It also
explains why higher education institutions with high proportions of ‘AAB+’ and medicine and
dentistry students were shown as having the highest increases in their totals. More importantly
it means that as institutions would be able to compete for these students with no restriction on
their recruitment; their actual number of new entrants in 2012 could be substantially different
from the totals given in this document.
In February 2013 it said that full-time undergraduate entrants in 2012/13 were around 28,000
below Government assumptions. This was in large part to changes in deferred entry in 2011
which is looked at in more detail in HE in England from 2012: Student numbers. They added
that there were also ‘modest’ reductions in taught postgraduate entrants and a ‘very
significant’ reduction in part-time undergraduate entrants.53 In March 2013 it published its first
comprehensive assessment of the impact of the reforms54. It found that full-time home and EU
graduate numbers were 47,000 (12%) fewer than 2011/12 and 33,000 (9%) down on 2010/11.
Full-time home and EU postgraduate student numbers were around 5% down on 2011/12 and
2% down on 2010/11. Falls in part-time entrants were substantially larger and are described
by HEFCE as ‘significant’. Part-time undergraduate entrants in 2012 were down by 40%
compared to 2010 and there was a 27% reduction in part-time taught postgraduate entrants.
Again the note HE in England from 2012: Student numbers gives more detail on this and the
possible reasons put forward by HEFCE for the fall in part-time recruitment.
3.2 2013/14
HEFCE announced sector-level funding totals for academic year 2013/14 in February 2013.55
Total recurrent teaching grant was set at £2.3 billion, down from £4.3 billion in 2011/12 and
£3.2 billion in 2012/13.56 Within this total mainstream teaching grant fell from £3.6 billion in
2011/12 to £2.4 billion in 2012/13 and £1.4 billion in 2013/14. Support for widening
participation is to be cut by around one-third, smaller proportionate cuts are planned for ‘other
target allocations’ and funding for improving retention is broadly maintained.
Initial allocations for institutions for 2013/14 were made by HEFCE in March 2013. Unlike in
earlier years these have not been directly compared to allocations from the previous year.
Student number controls for 2013/14 are included in the same document. While these are
presented alongside the 2012/13 controls they include no estimate for the number of students
no longer subject to controls (‘ABB+’ and equivalent for 2013/14) so do not give any estimate,
however tentative, of the total intake (controlled plus unrestricted recruitment). Funding tables
were updated in October 2013. These were relatively minor changes and adjusted allocations
were made in March 2014 which showed some larger changes in funding.
3.3 2014/15
In March 2014 HEFCE announced sector wide funding allocations and initial allocations for
institutions for academic year 2014/15.57 Total recurrent teaching grant will be cut to
£1.7 billion which includes funding for 30,000 additional entrants before the cap is completely
removed in 2015/16. Within this the student opportunity allocation (formerly widening
participation) has been increased by around 10%, but now includes what was the Access for
53 Funding for universities and colleges for 2013-14: Board decisions, HEFCE. para 30 54 Higher education in England: Impact of the 2012 reforms, HEFCE 55 Funding for universities and colleges for 2013-14: Board decisions, HEFCE 56 Funding for universities and colleges for 2012-13: Board decisions, HEFCE 57 Recurrent grants and student number controls for 2014-15, HEFCE
14
Learning Fund. Recurrent grant for research remains as in 2013/14 and capital funding
increases to £440 million.
HEFCE has pointed out pointed out that the total value of resources available to institutions
from 2012/13, after the expected fee income is included, is set to increase. Wider variations
were expected at the level of individual institutions. The change in distribution of student
numbers resulting from the new ‘core and margin’ allocation model is likely to mean a small
shift in resources away from higher education institutions overall and towards further
education colleges. It could also change the distribution of students, and hence direct and fee
loan funding, between institutions. All institutions charging fees of £6,000 or more have
additional requirements to provide access support for disadvantaged students. Higher fees
may also create more general cost pressure from new students.