Embed Size (px)
Citation preview
HDice Technical Note 28Development of fast rasters for eHD test runs and experiments
C. D. Bass
July 25, 2013
Abstract
The polarized HD targets used during the 2012 eHD irradiation tests showed signs of excessive heatingfrom electron beam energy deposition in the target. The Hall B raster used for these tests was not fastenough to move the electron beam spot across the target, which resulted in substantial temperature spikes.An existing 6-GeV raster system previously used in Halls A and C could be used to substantially lower themagnitude of temperature spikes. Such a fast raster, combined with an improved HD target cell design,is expected to result in much lower operating temperatures in future eHD measurements. A new 11-GeVraster system would need to be developed for eHD experiments at higher energies. This report detailsthe performance of the existing Hall B and 6-GeV raster systems and provides design specifications for an11-GeV raster system.
1 Rastering experiences during the 2012eHD tests
During the February 2012 and March 2012 eHD testruns, H- and D-polarization losses were measured us-ing NMR. Subsequent calculations indicated that thetarget cell design and electron beam rastering systemwere inadequate and resulted in significant heating oftarget material from Møller scattering. The design ofthe g14 target was optimized for γHD runs and notfor the removal of heat due to electron beam interac-tion with the target. A redesign of the target cell forimproved heat removal is being developed for eHDexperiments and will be discussed in a future techni-cal note.
Local heating of target material due to electronbeam energy deposition is a function of current den-sity, irradiation time, specific heat capacities of tar-get materials, and the base target temperature (seeAppendix A). Current density is determined by thebeam current and spot size at the target. The choice
of beam current is a compromise between experimen-tal data rates and target irradiation effects such asdepolarization from radiation damage.
The beam spot size is constrained by beam lineoptics and the rate of high-energy electron interac-tions with high-Z material surrounding the target(e.g. copper). The arrangement of focusing andsteering magnets on the beam line produces a beamwith an approximately Gaussian density profile andsets a minimum beam radius of about 50 µm.
High-energy electrons that irradiate high-Z mate-rials surrounding the target can generate a cascadeshower of gamma-rays and electron-positron pairs.Limiting the shower production rate places a con-straint on the allowable current density in the radialtail of the beam that extends beyond the edge of thetarget, and so determines a minimum separation dis-tance between the centroid of the beam and the edgeof the target. Increasing the beam spot size to lowerthe current density will reduce the target volume thatis available for uniform irradiation and creates a zone
1
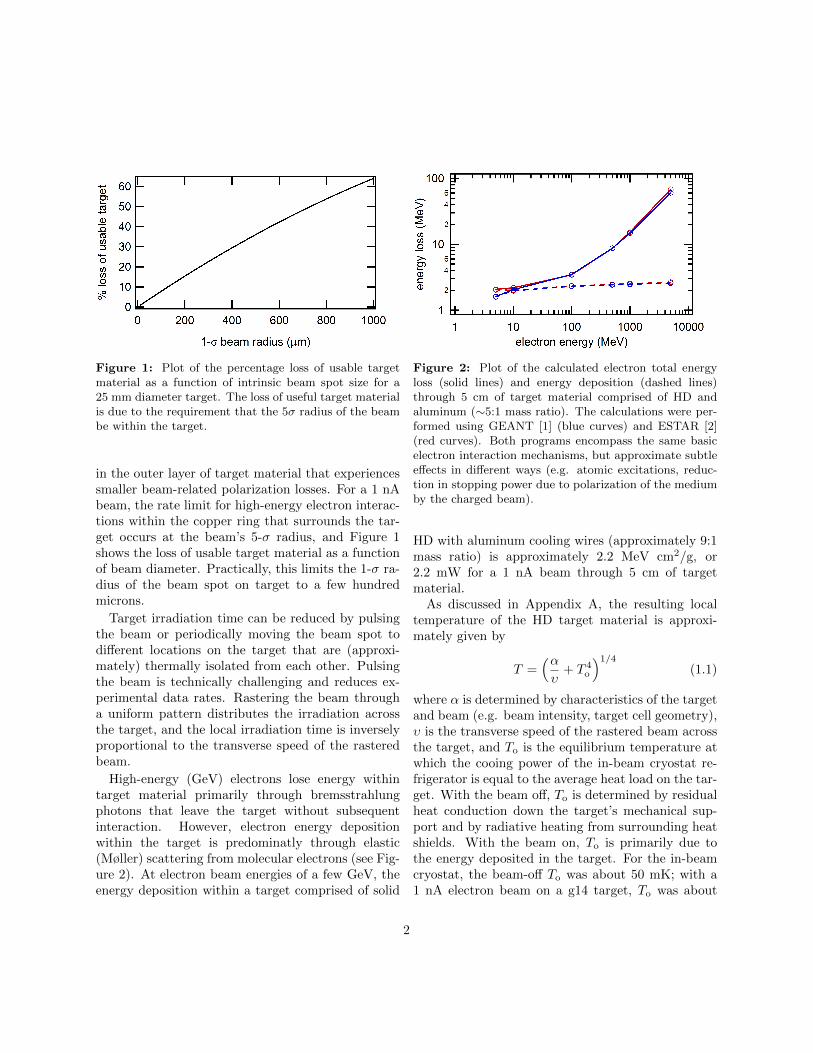
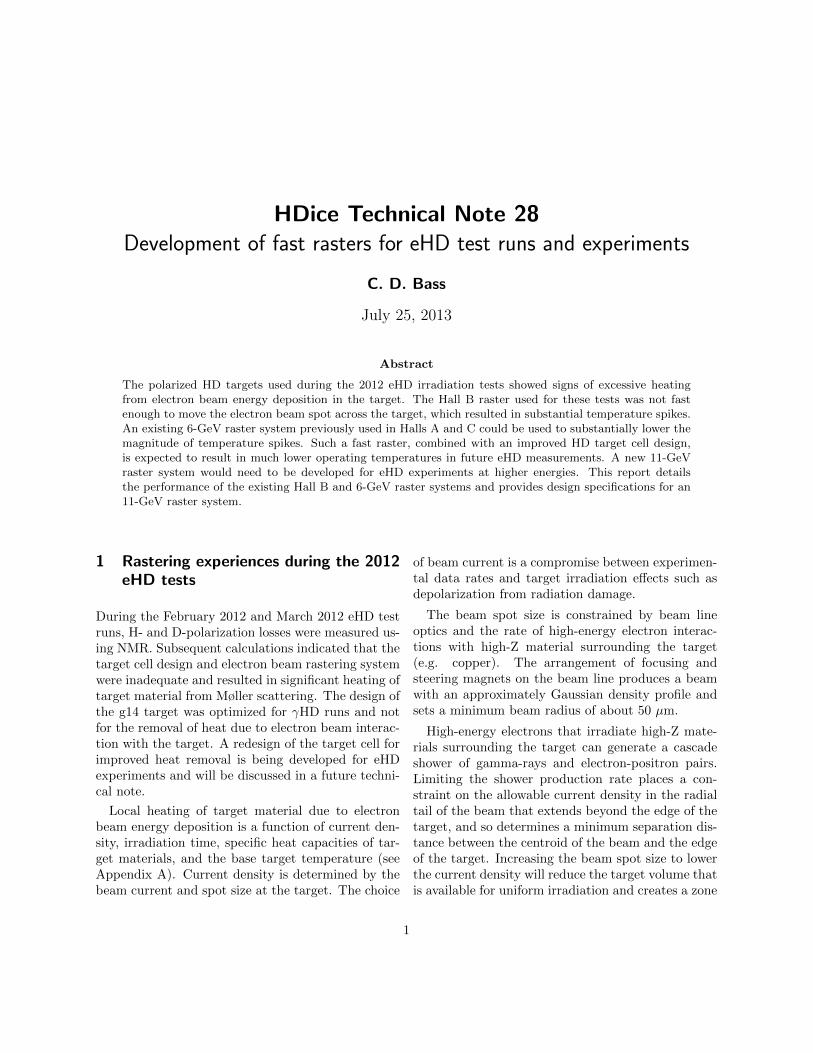
Figure 1: Plot of the percentage loss of usable targetmaterial as a function of intrinsic beam spot size for a25 mm diameter target. The loss of useful target materialis due to the requirement that the 5σ radius of the beambe within the target.
in the outer layer of target material that experiencessmaller beam-related polarization losses. For a 1 nAbeam, the rate limit for high-energy electron interac-tions within the copper ring that surrounds the tar-get occurs at the beam’s 5-σ radius, and Figure 1shows the loss of usable target material as a functionof beam diameter. Practically, this limits the 1-σ ra-dius of the beam spot on target to a few hundredmicrons.
Target irradiation time can be reduced by pulsingthe beam or periodically moving the beam spot todifferent locations on the target that are (approxi-mately) thermally isolated from each other. Pulsingthe beam is technically challenging and reduces ex-perimental data rates. Rastering the beam througha uniform pattern distributes the irradiation acrossthe target, and the local irradiation time is inverselyproportional to the transverse speed of the rasteredbeam.
High-energy (GeV) electrons lose energy withintarget material primarily through bremsstrahlungphotons that leave the target without subsequentinteraction. However, electron energy depositionwithin the target is predominatly through elastic(Møller) scattering from molecular electrons (see Fig-ure 2). At electron beam energies of a few GeV, theenergy deposition within a target comprised of solid
Figure 2: Plot of the calculated electron total energyloss (solid lines) and energy deposition (dashed lines)through 5 cm of target material comprised of HD andaluminum (∼5:1 mass ratio). The calculations were per-formed using GEANT [1] (blue curves) and ESTAR [2](red curves). Both programs encompass the same basicelectron interaction mechanisms, but approximate subtleeffects in different ways (e.g. atomic excitations, reduc-tion in stopping power due to polarization of the mediumby the charged beam).
HD with aluminum cooling wires (approximately 9:1mass ratio) is approximately 2.2 MeV cm2/g, or2.2 mW for a 1 nA beam through 5 cm of targetmaterial.
As discussed in Appendix A, the resulting localtemperature of the HD target material is approxi-mately given by
T =(αυ
+ T 4o
)1/4(1.1)
where α is determined by characteristics of the targetand beam (e.g. beam intensity, target cell geometry),υ is the transverse speed of the rastered beam acrossthe target, and To is the equilibrium temperature atwhich the cooing power of the in-beam cryostat re-frigerator is equal to the average heat load on the tar-get. With the beam off, To is determined by residualheat conduction down the target’s mechanical sup-port and by radiative heating from surrounding heatshields. With the beam on, To is primarily due tothe energy deposited in the target. For the in-beamcryostat, the beam-off To was about 50 mK; with a1 nA electron beam on a g14 target, To was about
2
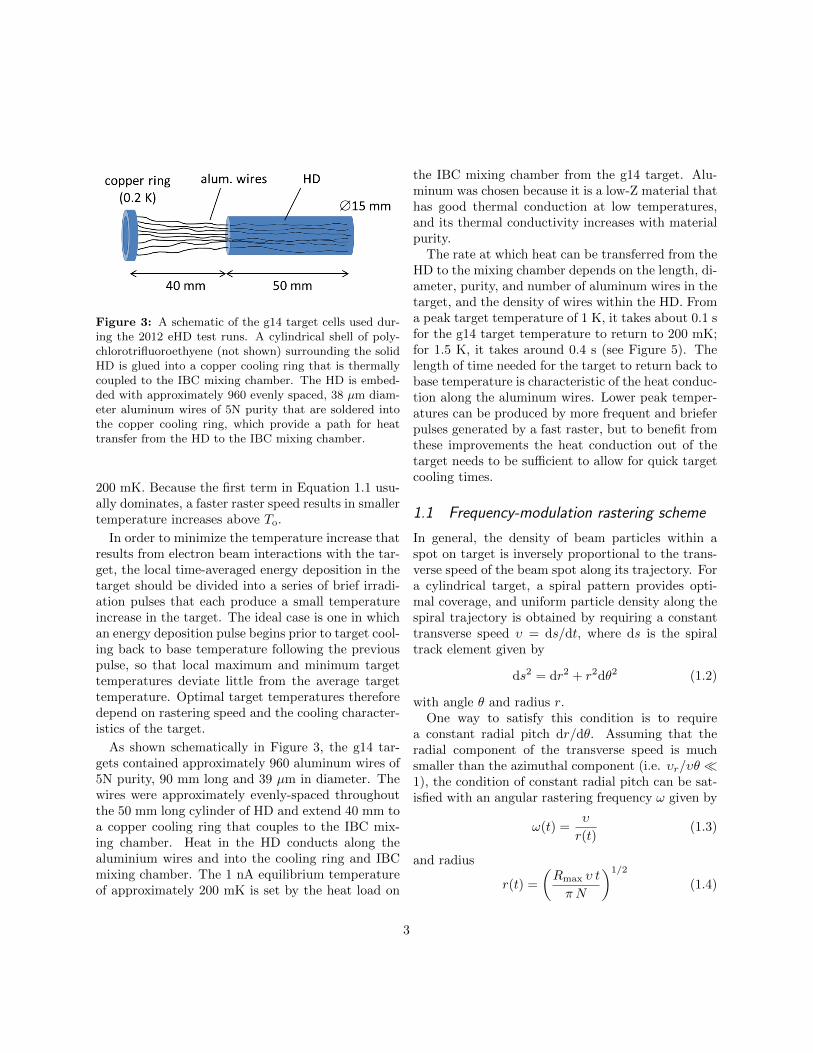
Figure 3: A schematic of the g14 target cells used dur-ing the 2012 eHD test runs. A cylindrical shell of poly-chlorotrifluoroethyene (not shown) surrounding the solidHD is glued into a copper cooling ring that is thermallycoupled to the IBC mixing chamber. The HD is embed-ded with approximately 960 evenly spaced, 38 µm diam-eter aluminum wires of 5N purity that are soldered intothe copper cooling ring, which provide a path for heattransfer from the HD to the IBC mixing chamber.
200 mK. Because the first term in Equation 1.1 usu-ally dominates, a faster raster speed results in smallertemperature increases above To.
In order to minimize the temperature increase thatresults from electron beam interactions with the tar-get, the local time-averaged energy deposition in thetarget should be divided into a series of brief irradi-ation pulses that each produce a small temperatureincrease in the target. The ideal case is one in whichan energy deposition pulse begins prior to target cool-ing back to base temperature following the previouspulse, so that local maximum and minimum targettemperatures deviate little from the average targettemperature. Optimal target temperatures thereforedepend on rastering speed and the cooling character-istics of the target.
As shown schematically in Figure 3, the g14 tar-gets contained approximately 960 aluminum wires of5N purity, 90 mm long and 39 µm in diameter. Thewires were approximately evenly-spaced throughoutthe 50 mm long cylinder of HD and extend 40 mm toa copper cooling ring that couples to the IBC mix-ing chamber. Heat in the HD conducts along thealuminium wires and into the cooling ring and IBCmixing chamber. The 1 nA equilibrium temperatureof approximately 200 mK is set by the heat load on
the IBC mixing chamber from the g14 target. Alu-minum was chosen because it is a low-Z material thathas good thermal conduction at low temperatures,and its thermal conductivity increases with materialpurity.
The rate at which heat can be transferred from theHD to the mixing chamber depends on the length, di-ameter, purity, and number of aluminum wires in thetarget, and the density of wires within the HD. Froma peak target temperature of 1 K, it takes about 0.1 sfor the g14 target temperature to return to 200 mK;for 1.5 K, it takes around 0.4 s (see Figure 5). Thelength of time needed for the target to return back tobase temperature is characteristic of the heat conduc-tion along the aluminum wires. Lower peak temper-atures can be produced by more frequent and brieferpulses generated by a fast raster, but to benefit fromthese improvements the heat conduction out of thetarget needs to be sufficient to allow for quick targetcooling times.
1.1 Frequency-modulation rastering scheme
In general, the density of beam particles within aspot on target is inversely proportional to the trans-verse speed of the beam spot along its trajectory. Fora cylindrical target, a spiral pattern provides opti-mal coverage, and uniform particle density along thespiral trajectory is obtained by requiring a constanttransverse speed υ = ds/dt, where ds is the spiraltrack element given by
ds2 = dr2 + r2dθ2 (1.2)
with angle θ and radius r.One way to satisfy this condition is to require
a constant radial pitch dr/dθ. Assuming that theradial component of the transverse speed is muchsmaller than the azimuthal component (i.e. υr/υθ 1), the condition of constant radial pitch can be sat-isfied with an angular rastering frequency ω given by
ω(t) =υ
r(t)(1.3)
and radius
r(t) =
(Rmax υ t
π N
)1/2
(1.4)
3
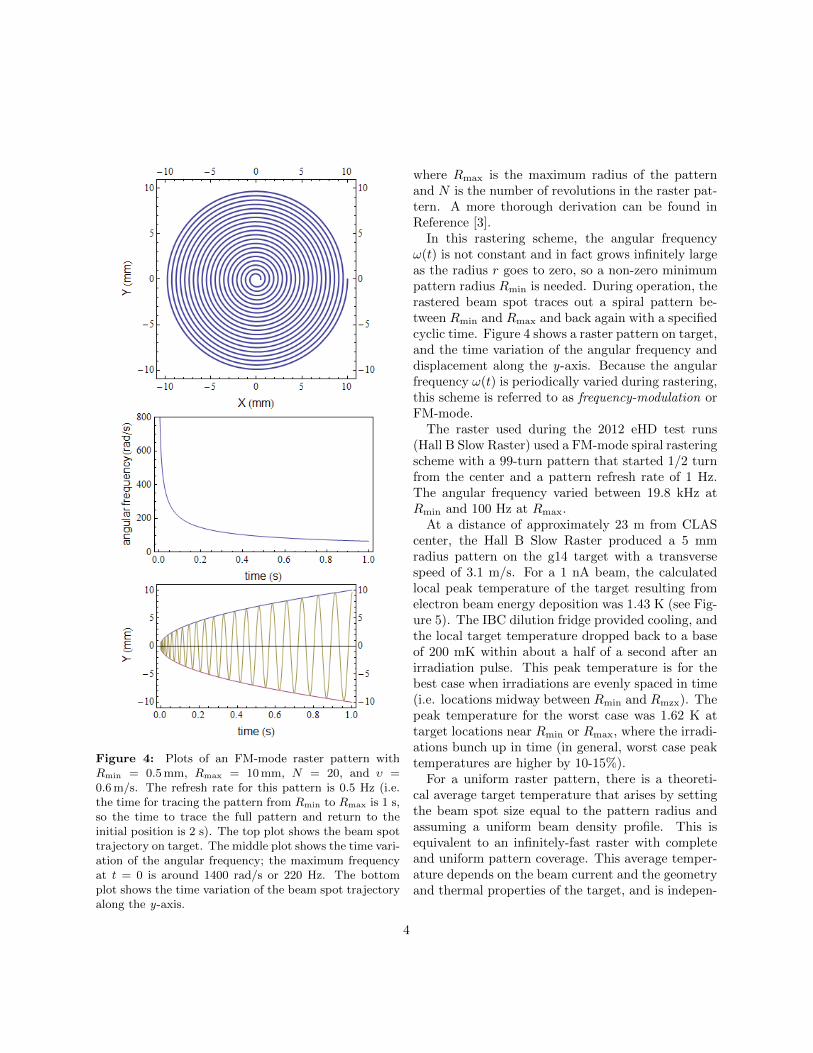
Figure 4: Plots of an FM-mode raster pattern withRmin = 0.5 mm, Rmax = 10 mm, N = 20, and υ =0.6 m/s. The refresh rate for this pattern is 0.5 Hz (i.e.the time for tracing the pattern from Rmin to Rmax is 1 s,so the time to trace the full pattern and return to theinitial position is 2 s). The top plot shows the beam spottrajectory on target. The middle plot shows the time vari-ation of the angular frequency; the maximum frequencyat t = 0 is around 1400 rad/s or 220 Hz. The bottomplot shows the time variation of the beam spot trajectoryalong the y-axis.
where Rmax is the maximum radius of the patternand N is the number of revolutions in the raster pat-tern. A more thorough derivation can be found inReference [3].
In this rastering scheme, the angular frequencyω(t) is not constant and in fact grows infinitely largeas the radius r goes to zero, so a non-zero minimumpattern radius Rmin is needed. During operation, therastered beam spot traces out a spiral pattern be-tween Rmin and Rmax and back again with a specifiedcyclic time. Figure 4 shows a raster pattern on target,and the time variation of the angular frequency anddisplacement along the y-axis. Because the angularfrequency ω(t) is periodically varied during rastering,this scheme is referred to as frequency-modulation orFM-mode.
The raster used during the 2012 eHD test runs(Hall B Slow Raster) used a FM-mode spiral rasteringscheme with a 99-turn pattern that started 1/2 turnfrom the center and a pattern refresh rate of 1 Hz.The angular frequency varied between 19.8 kHz atRmin and 100 Hz at Rmax.
At a distance of approximately 23 m from CLAScenter, the Hall B Slow Raster produced a 5 mmradius pattern on the g14 target with a transversespeed of 3.1 m/s. For a 1 nA beam, the calculatedlocal peak temperature of the target resulting fromelectron beam energy deposition was 1.43 K (see Fig-ure 5). The IBC dilution fridge provided cooling, andthe local target temperature dropped back to a baseof 200 mK within about a half of a second after anirradiation pulse. This peak temperature is for thebest case when irradiations are evenly spaced in time(i.e. locations midway between Rmin and Rmzx). Thepeak temperature for the worst case was 1.62 K attarget locations near Rmin or Rmax, where the irradi-ations bunch up in time (in general, worst case peaktemperatures are higher by 10-15%).
For a uniform raster pattern, there is a theoreti-cal average target temperature that arises by settingthe beam spot size equal to the pattern radius andassuming a uniform beam density profile. This isequivalent to an infinitely-fast raster with completeand uniform pattern coverage. This average temper-ature depends on the beam current and the geometryand thermal properties of the target, and is indepen-
4
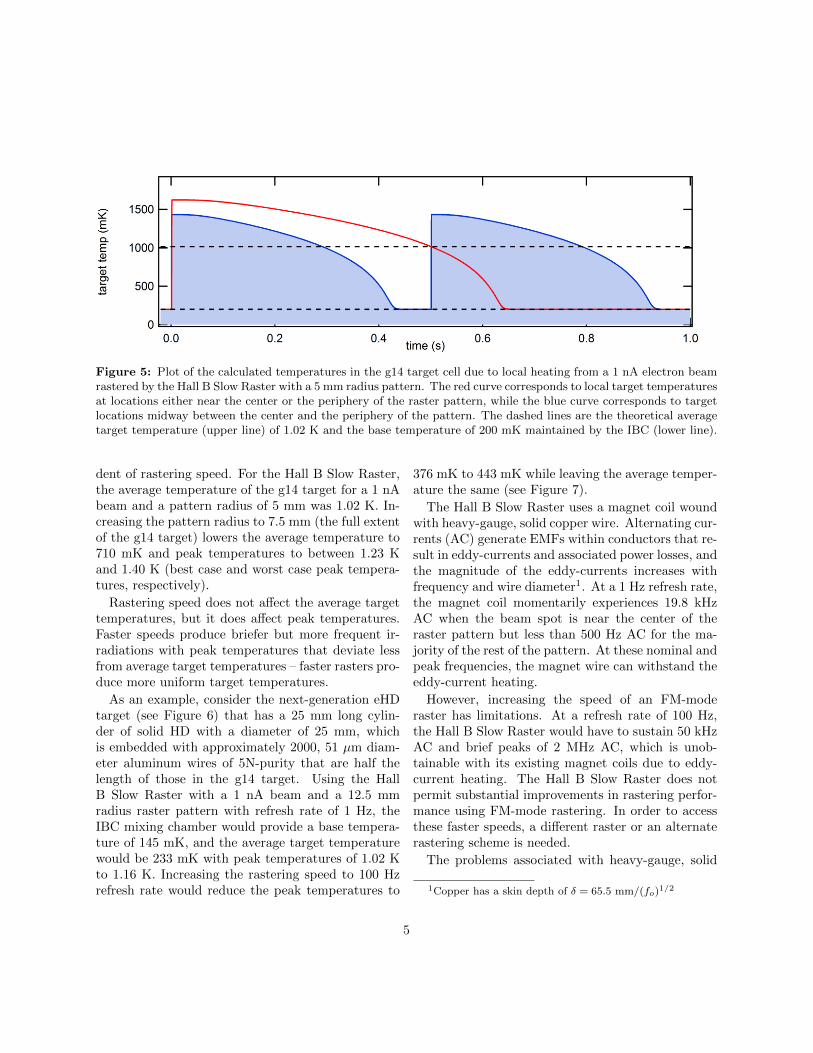
Figure 5: Plot of the calculated temperatures in the g14 target cell due to local heating from a 1 nA electron beamrastered by the Hall B Slow Raster with a 5 mm radius pattern. The red curve corresponds to local target temperaturesat locations either near the center or the periphery of the raster pattern, while the blue curve corresponds to targetlocations midway between the center and the periphery of the pattern. The dashed lines are the theoretical averagetarget temperature (upper line) of 1.02 K and the base temperature of 200 mK maintained by the IBC (lower line).
dent of rastering speed. For the Hall B Slow Raster,the average temperature of the g14 target for a 1 nAbeam and a pattern radius of 5 mm was 1.02 K. In-creasing the pattern radius to 7.5 mm (the full extentof the g14 target) lowers the average temperature to710 mK and peak temperatures to between 1.23 Kand 1.40 K (best case and worst case peak tempera-tures, respectively).
Rastering speed does not affect the average targettemperatures, but it does affect peak temperatures.Faster speeds produce briefer but more frequent ir-radiations with peak temperatures that deviate lessfrom average target temperatures – faster rasters pro-duce more uniform target temperatures.
As an example, consider the next-generation eHDtarget (see Figure 6) that has a 25 mm long cylin-der of solid HD with a diameter of 25 mm, whichis embedded with approximately 2000, 51 µm diam-eter aluminum wires of 5N-purity that are half thelength of those in the g14 target. Using the HallB Slow Raster with a 1 nA beam and a 12.5 mmradius raster pattern with refresh rate of 1 Hz, theIBC mixing chamber would provide a base tempera-ture of 145 mK, and the average target temperaturewould be 233 mK with peak temperatures of 1.02 Kto 1.16 K. Increasing the rastering speed to 100 Hzrefresh rate would reduce the peak temperatures to
376 mK to 443 mK while leaving the average temper-ature the same (see Figure 7).
The Hall B Slow Raster uses a magnet coil woundwith heavy-gauge, solid copper wire. Alternating cur-rents (AC) generate EMFs within conductors that re-sult in eddy-currents and associated power losses, andthe magnitude of the eddy-currents increases withfrequency and wire diameter1. At a 1 Hz refresh rate,the magnet coil momentarily experiences 19.8 kHzAC when the beam spot is near the center of theraster pattern but less than 500 Hz AC for the ma-jority of the rest of the pattern. At these nominal andpeak frequencies, the magnet wire can withstand theeddy-current heating.
However, increasing the speed of an FM-moderaster has limitations. At a refresh rate of 100 Hz,the Hall B Slow Raster would have to sustain 50 kHzAC and brief peaks of 2 MHz AC, which is unob-tainable with its existing magnet coils due to eddy-current heating. The Hall B Slow Raster does notpermit substantial improvements in rastering perfor-mance using FM-mode rastering. In order to accessthese faster speeds, a different raster or an alternaterastering scheme is needed.
The problems associated with heavy-gauge, solid
1Copper has a skin depth of δ = 65.5 mm/(fo)1/2
5
1 Hz Pattern Refresh
100 Hz Pattern Refresh
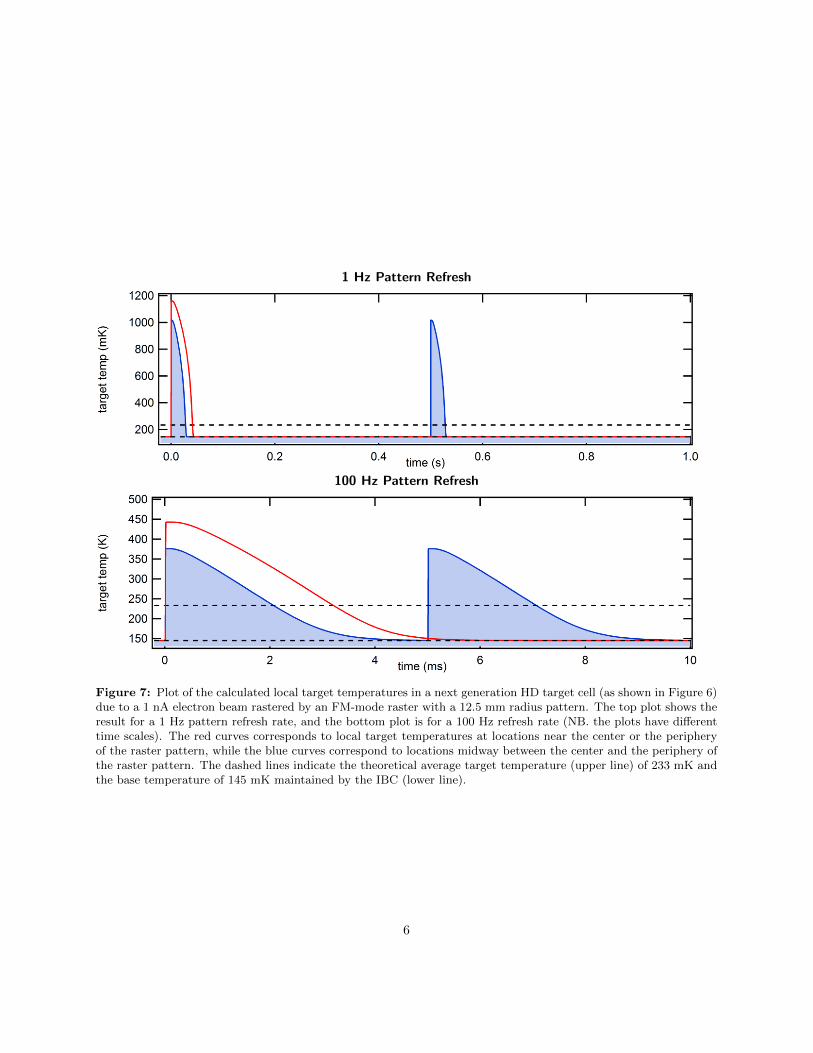
Figure 7: Plot of the calculated local target temperatures in a next generation HD target cell (as shown in Figure 6)due to a 1 nA electron beam rastered by an FM-mode raster with a 12.5 mm radius pattern. The top plot shows theresult for a 1 Hz pattern refresh rate, and the bottom plot is for a 100 Hz refresh rate (NB. the plots have differenttime scales). The red curves corresponds to local target temperatures at locations near the center or the peripheryof the raster pattern, while the blue curves correspond to locations midway between the center and the periphery ofthe raster pattern. The dashed lines indicate the theoretical average target temperature (upper line) of 233 mK andthe base temperature of 145 mK maintained by the IBC (lower line).
6
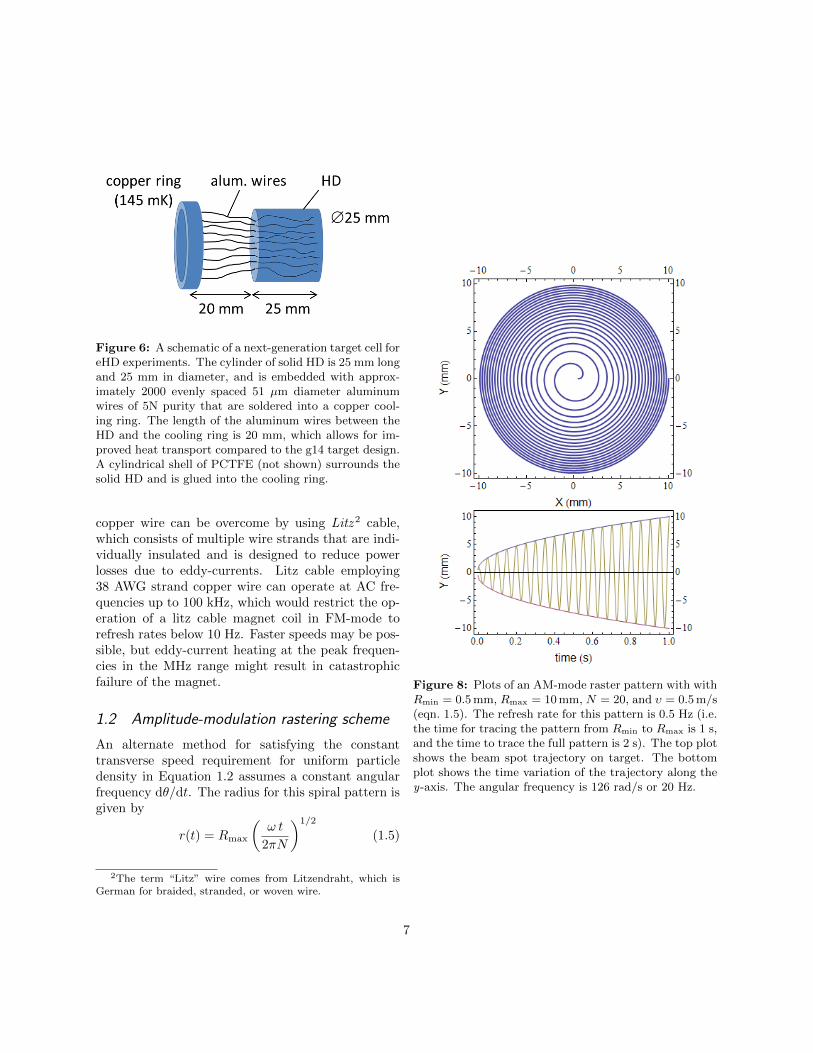
Figure 6: A schematic of a next-generation target cell foreHD experiments. The cylinder of solid HD is 25 mm longand 25 mm in diameter, and is embedded with approx-imately 2000 evenly spaced 51 µm diameter aluminumwires of 5N purity that are soldered into a copper cool-ing ring. The length of the aluminum wires between theHD and the cooling ring is 20 mm, which allows for im-proved heat transport compared to the g14 target design.A cylindrical shell of PCTFE (not shown) surrounds thesolid HD and is glued into the cooling ring.
copper wire can be overcome by using Litz 2 cable,which consists of multiple wire strands that are indi-vidually insulated and is designed to reduce powerlosses due to eddy-currents. Litz cable employing38 AWG strand copper wire can operate at AC fre-quencies up to 100 kHz, which would restrict the op-eration of a litz cable magnet coil in FM-mode torefresh rates below 10 Hz. Faster speeds may be pos-sible, but eddy-current heating at the peak frequen-cies in the MHz range might result in catastrophicfailure of the magnet.
1.2 Amplitude-modulation rastering scheme
An alternate method for satisfying the constanttransverse speed requirement for uniform particledensity in Equation 1.2 assumes a constant angularfrequency dθ/dt. The radius for this spiral pattern isgiven by
r(t) = Rmax
(ω t
2πN
)1/2
(1.5)
2The term “Litz” wire comes from Litzendraht, which isGerman for braided, stranded, or woven wire.
Figure 8: Plots of an AM-mode raster pattern with withRmin = 0.5 mm, Rmax = 10 mm, N = 20, and υ = 0.5 m/s(eqn. 1.5). The refresh rate for this pattern is 0.5 Hz (i.e.the time for tracing the pattern from Rmin to Rmax is 1 s,and the time to trace the full pattern is 2 s). The top plotshows the beam spot trajectory on target. The bottomplot shows the time variation of the trajectory along they-axis. The angular frequency is 126 rad/s or 20 Hz.
7
where Rmax is the maximum radius of the pattern,ω = dθ/dt is the angular frequency, and N is thenumber of revolutions in the raster pattern. A moredetailed derivation can be found in Reference [4].
In this rastering scheme, the raster pattern radiusfollows a
√t dependence between a Rmin and Rmax
like the FM-mode scheme; however, the radial pitchdr/dθ is no longer constant. Figure 8 shows a rasterpattern on target and the time variation of the dis-placement along the y-axis. Because the beam de-flection amplitude of a raster magnet (i.e. the radiusr(t) of the pattern) is periodically varied in time,this scheme is referred to as amplitude-modulation,or AM-mode.
The advantage of AM-mode rastering is the ab-sence of high-frequency spikes. However, the disad-vantage is the non-uniform coverage near the centerof the raster pattern. This non-uniformity can be cor-rected by operating an AM-mode raster at higher fre-quencies or configuring the pattern to precess. In thecase of the Hall B Slow Raster, the magnet coils can-not withstand the approximately 3 kHz AC requiredfor reasonable pattern uniformity associated with apattern refresh rate of 100 Hz. However, a magnetcoil made from litz cable could be used to raster inAM-mode at pattern refresh rates up to 1 kHz. Whileimproving the speed of the Hall B Slow Raster is notpossible due to limitations of its magnet coil, substan-tial increases in speed are feasible with an AM-moderaster employing magnet coils made from litz cable.
2 Fast raster specifications
Loss of H- and D-polarization during eHD runningis coupled the depolarization of unpaired electrons inHD+ ions, which in turn is related to target tem-perature. During electron beam irradiation, the av-erage target temperature is a function of beam cur-rent, raster pattern size, and target geometry. A re-designed target geometry and larger raster patternwould allow average target temperatures for a 1 nAbeam to drop to 208 mK. However, rastering speedaffects peak target temperatures as well as the uni-formity of temperature in time, and faster rasteringgenerates peak temperatures with smaller deviations
away from the average target temperature.In order to obtain substantial reductions in peak
temperatures with the new HD target design, a rasterneeds to increase the pattern refresh rate by about afactor of 1000 over the current Hall B Slow Raster.An AM-mode raster with a a 900 Hz refresh rate and24 kHz frequency could provide a uniform 12.4 mmradius pattern with a transverse speed of 1885 m/s(suitable for a 100 µm radius beam spot on a 12.5 mmradius target). The ratio of 900 Hz refresh rate to24 kHz angular frequency allows the pattern to pre-cess, which reduces the degree of non-uniformity nearthe center of the pattern. This raster configurationwould produce peak target temperatures of 286 mKto 331 mK while maintaining an average target tem-perature of 233 mK (see Figure 9).
2.1 Low energy test runs
A design that incorporates a litz cable magnet coiland operates in AM-mode can achieve the desiredperformance. An existing 6-GeV fast raster [5, 6]previously used in Hall A and C has been operatedat 24 kHz. Operational parameters for the 6-GeVFast Raster are given in Table 1.
The 6-GeV Fast Raster system consists of two pairsof air-cooled bedstead coils, one each for the horizon-tal and vertical axes. The coils are mounted on aceramic vacuum pipe, which avoids the eddy-currentheating associated with the induced currents fromhigh frequency magnetic fields. A thin coating ofmetal on the inner surface of the ceramic pipe con-ducts away the image current produced by the elec-tron beam.
At 25 kHz, the 6-GeV Fast Raster is driven by ahigh voltage power supply controlled by an H-bridgepower switch. This solid state switch produces abipolar current waveform in the magnet coil that isapproximately linear and is used to generate a squareLissajous raster pattern. Unfortunately, the H-bridgeswitch cannot produce a sinusoidal current waveformand so cannot generate a spiral raster pattern. How-ever, the slow raster used in Hall A is driven at muchlower frequencies by an LC resonant circuit that cangenerate an AM-mode spiral raster pattern. The sup-ply consists of a power amplifier, a function genera-
8
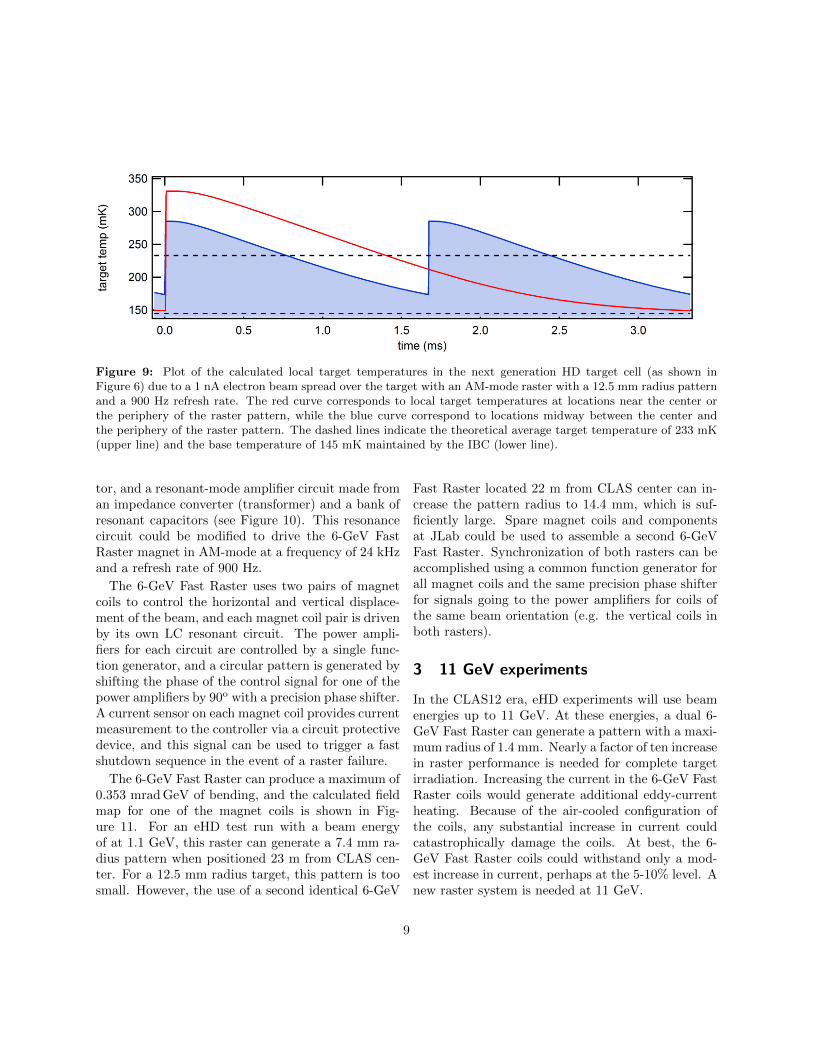
Figure 9: Plot of the calculated local target temperatures in the next generation HD target cell (as shown inFigure 6) due to a 1 nA electron beam spread over the target with an AM-mode raster with a 12.5 mm radius patternand a 900 Hz refresh rate. The red curve corresponds to local target temperatures at locations near the center orthe periphery of the raster pattern, while the blue curve correspond to locations midway between the center andthe periphery of the raster pattern. The dashed lines indicate the theoretical average target temperature of 233 mK(upper line) and the base temperature of 145 mK maintained by the IBC (lower line).
tor, and a resonant-mode amplifier circuit made froman impedance converter (transformer) and a bank ofresonant capacitors (see Figure 10). This resonancecircuit could be modified to drive the 6-GeV FastRaster magnet in AM-mode at a frequency of 24 kHzand a refresh rate of 900 Hz.
The 6-GeV Fast Raster uses two pairs of magnetcoils to control the horizontal and vertical displace-ment of the beam, and each magnet coil pair is drivenby its own LC resonant circuit. The power ampli-fiers for each circuit are controlled by a single func-tion generator, and a circular pattern is generated byshifting the phase of the control signal for one of thepower amplifiers by 90o with a precision phase shifter.A current sensor on each magnet coil provides currentmeasurement to the controller via a circuit protectivedevice, and this signal can be used to trigger a fastshutdown sequence in the event of a raster failure.
The 6-GeV Fast Raster can produce a maximum of0.353 mrad GeV of bending, and the calculated fieldmap for one of the magnet coils is shown in Fig-ure 11. For an eHD test run with a beam energyof at 1.1 GeV, this raster can generate a 7.4 mm ra-dius pattern when positioned 23 m from CLAS cen-ter. For a 12.5 mm radius target, this pattern is toosmall. However, the use of a second identical 6-GeV
Fast Raster located 22 m from CLAS center can in-crease the pattern radius to 14.4 mm, which is suf-ficiently large. Spare magnet coils and componentsat JLab could be used to assemble a second 6-GeVFast Raster. Synchronization of both rasters can beaccomplished using a common function generator forall magnet coils and the same precision phase shifterfor signals going to the power amplifiers for coils ofthe same beam orientation (e.g. the vertical coils inboth rasters).
3 11 GeV experiments
In the CLAS12 era, eHD experiments will use beamenergies up to 11 GeV. At these energies, a dual 6-GeV Fast Raster can generate a pattern with a maxi-mum radius of 1.4 mm. Nearly a factor of ten increasein raster performance is needed for complete targetirradiation. Increasing the current in the 6-GeV FastRaster coils would generate additional eddy-currentheating. Because of the air-cooled configuration ofthe coils, any substantial increase in current couldcatastrophically damage the coils. At best, the 6-GeV Fast Raster coils could withstand only a mod-est increase in current, perhaps at the 5-10% level. Anew raster system is needed at 11 GeV.
9
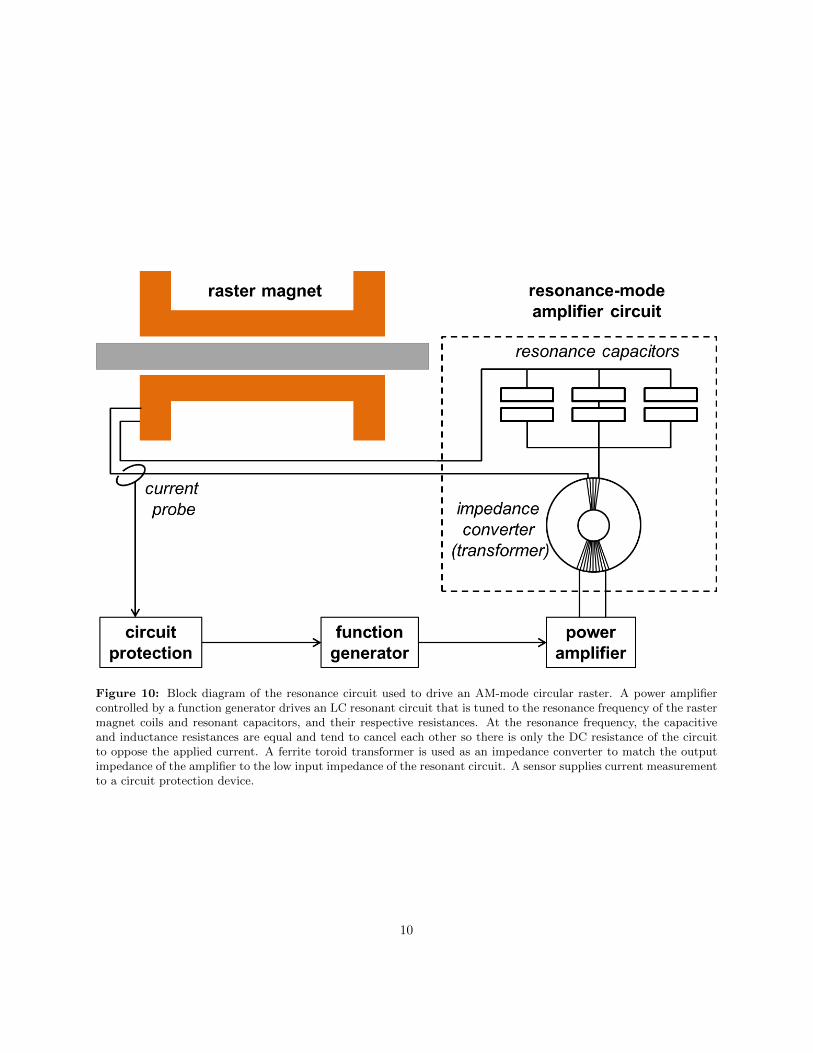
Figure 10: Block diagram of the resonance circuit used to drive an AM-mode circular raster. A power amplifiercontrolled by a function generator drives an LC resonant circuit that is tuned to the resonance frequency of the rastermagnet coils and resonant capacitors, and their respective resistances. At the resonance frequency, the capacitiveand inductance resistances are equal and tend to cancel each other so there is only the DC resistance of the circuitto oppose the applied current. A ferrite toroid transformer is used as an impedance converter to match the outputimpedance of the amplifier to the low input impedance of the resonant circuit. A sensor supplies current measurementto a circuit protection device.
10
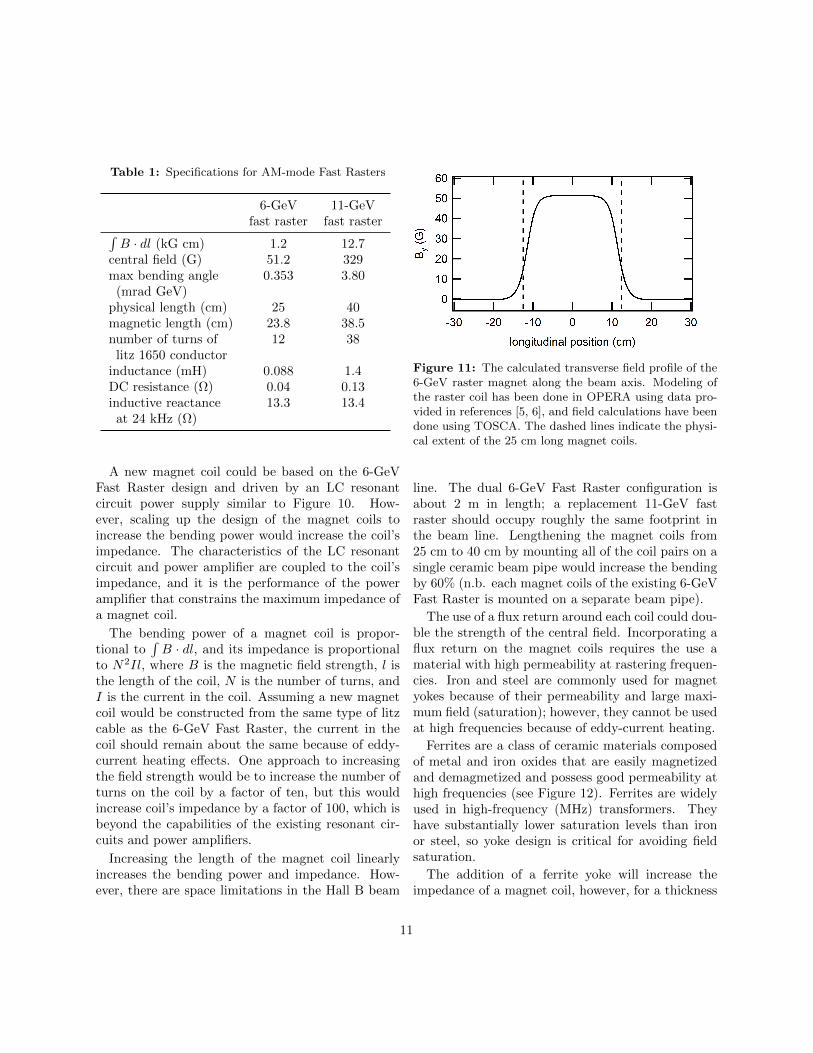
Table 1: Specifications for AM-mode Fast Rasters
6-GeV 11-GeVfast raster fast raster∫
B · dl (kG cm) 1.2 12.7central field (G) 51.2 329max bending angle 0.353 3.80
(mrad GeV)physical length (cm) 25 40magnetic length (cm) 23.8 38.5number of turns of 12 38
litz 1650 conductorinductance (mH) 0.088 1.4DC resistance (Ω) 0.04 0.13inductive reactance 13.3 13.4
at 24 kHz (Ω)
A new magnet coil could be based on the 6-GeVFast Raster design and driven by an LC resonantcircuit power supply similar to Figure 10. How-ever, scaling up the design of the magnet coils toincrease the bending power would increase the coil’simpedance. The characteristics of the LC resonantcircuit and power amplifier are coupled to the coil’simpedance, and it is the performance of the poweramplifier that constrains the maximum impedance ofa magnet coil.
The bending power of a magnet coil is propor-tional to
∫B · dl, and its impedance is proportional
to N2Il, where B is the magnetic field strength, l isthe length of the coil, N is the number of turns, andI is the current in the coil. Assuming a new magnetcoil would be constructed from the same type of litzcable as the 6-GeV Fast Raster, the current in thecoil should remain about the same because of eddy-current heating effects. One approach to increasingthe field strength would be to increase the number ofturns on the coil by a factor of ten, but this wouldincrease coil’s impedance by a factor of 100, which isbeyond the capabilities of the existing resonant cir-cuits and power amplifiers.
Increasing the length of the magnet coil linearlyincreases the bending power and impedance. How-ever, there are space limitations in the Hall B beam
Figure 11: The calculated transverse field profile of the6-GeV raster magnet along the beam axis. Modeling ofthe raster coil has been done in OPERA using data pro-vided in references [5, 6], and field calculations have beendone using TOSCA. The dashed lines indicate the physi-cal extent of the 25 cm long magnet coils.
line. The dual 6-GeV Fast Raster configuration isabout 2 m in length; a replacement 11-GeV fastraster should occupy roughly the same footprint inthe beam line. Lengthening the magnet coils from25 cm to 40 cm by mounting all of the coil pairs on asingle ceramic beam pipe would increase the bendingby 60% (n.b. each magnet coils of the existing 6-GeVFast Raster is mounted on a separate beam pipe).
The use of a flux return around each coil could dou-ble the strength of the central field. Incorporating aflux return on the magnet coils requires the use amaterial with high permeability at rastering frequen-cies. Iron and steel are commonly used for magnetyokes because of their permeability and large maxi-mum field (saturation); however, they cannot be usedat high frequencies because of eddy-current heating.
Ferrites are a class of ceramic materials composedof metal and iron oxides that are easily magnetizedand demagmetized and possess good permeability athigh frequencies (see Figure 12). Ferrites are widelyused in high-frequency (MHz) transformers. Theyhave substantially lower saturation levels than ironor steel, so yoke design is critical for avoiding fieldsaturation.
The addition of a ferrite yoke will increase theimpedance of a magnet coil, however, for a thickness
11
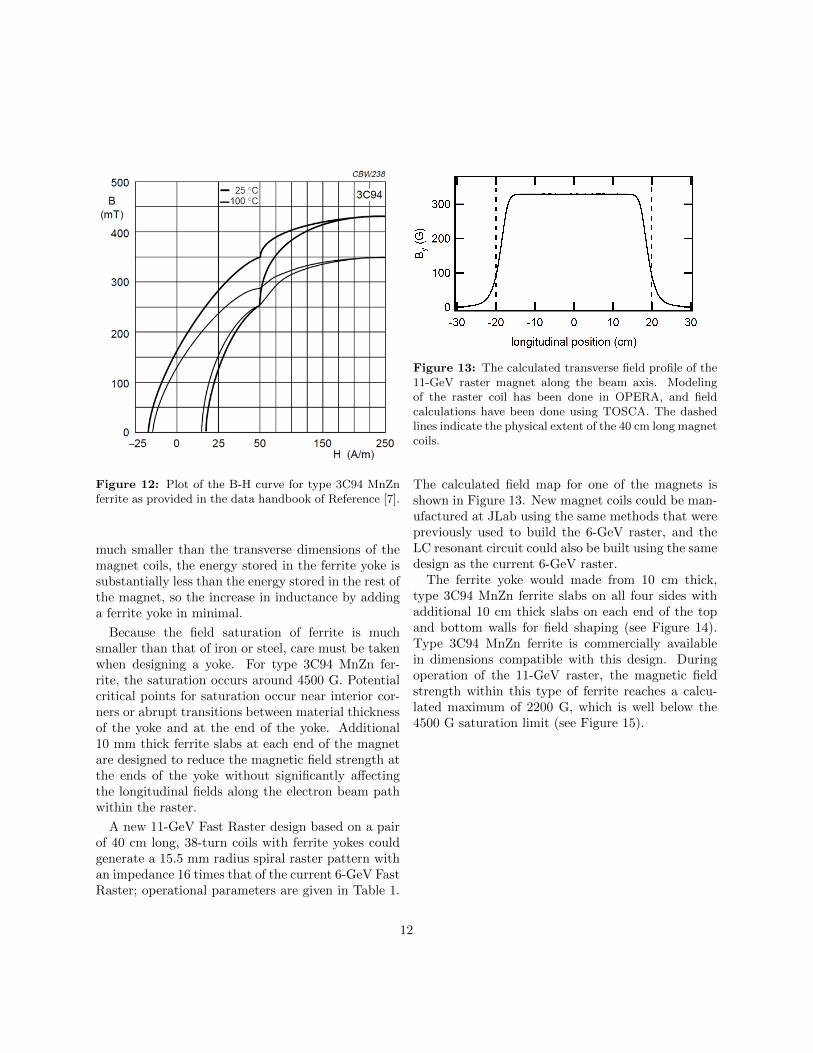
Figure 12: Plot of the B-H curve for type 3C94 MnZnferrite as provided in the data handbook of Reference [7].
much smaller than the transverse dimensions of themagnet coils, the energy stored in the ferrite yoke issubstantially less than the energy stored in the rest ofthe magnet, so the increase in inductance by addinga ferrite yoke in minimal.
Because the field saturation of ferrite is muchsmaller than that of iron or steel, care must be takenwhen designing a yoke. For type 3C94 MnZn fer-rite, the saturation occurs around 4500 G. Potentialcritical points for saturation occur near interior cor-ners or abrupt transitions between material thicknessof the yoke and at the end of the yoke. Additional10 mm thick ferrite slabs at each end of the magnetare designed to reduce the magnetic field strength atthe ends of the yoke without significantly affectingthe longitudinal fields along the electron beam pathwithin the raster.
A new 11-GeV Fast Raster design based on a pairof 40 cm long, 38-turn coils with ferrite yokes couldgenerate a 15.5 mm radius spiral raster pattern withan impedance 16 times that of the current 6-GeV FastRaster; operational parameters are given in Table 1.
Figure 13: The calculated transverse field profile of the11-GeV raster magnet along the beam axis. Modelingof the raster coil has been done in OPERA, and fieldcalculations have been done using TOSCA. The dashedlines indicate the physical extent of the 40 cm long magnetcoils.
The calculated field map for one of the magnets isshown in Figure 13. New magnet coils could be man-ufactured at JLab using the same methods that werepreviously used to build the 6-GeV raster, and theLC resonant circuit could also be built using the samedesign as the current 6-GeV raster.
The ferrite yoke would made from 10 cm thick,type 3C94 MnZn ferrite slabs on all four sides withadditional 10 cm thick slabs on each end of the topand bottom walls for field shaping (see Figure 14).Type 3C94 MnZn ferrite is commercially availablein dimensions compatible with this design. Duringoperation of the 11-GeV raster, the magnetic fieldstrength within this type of ferrite reaches a calcu-lated maximum of 2200 G, which is well below the4500 G saturation limit (see Figure 15).
12
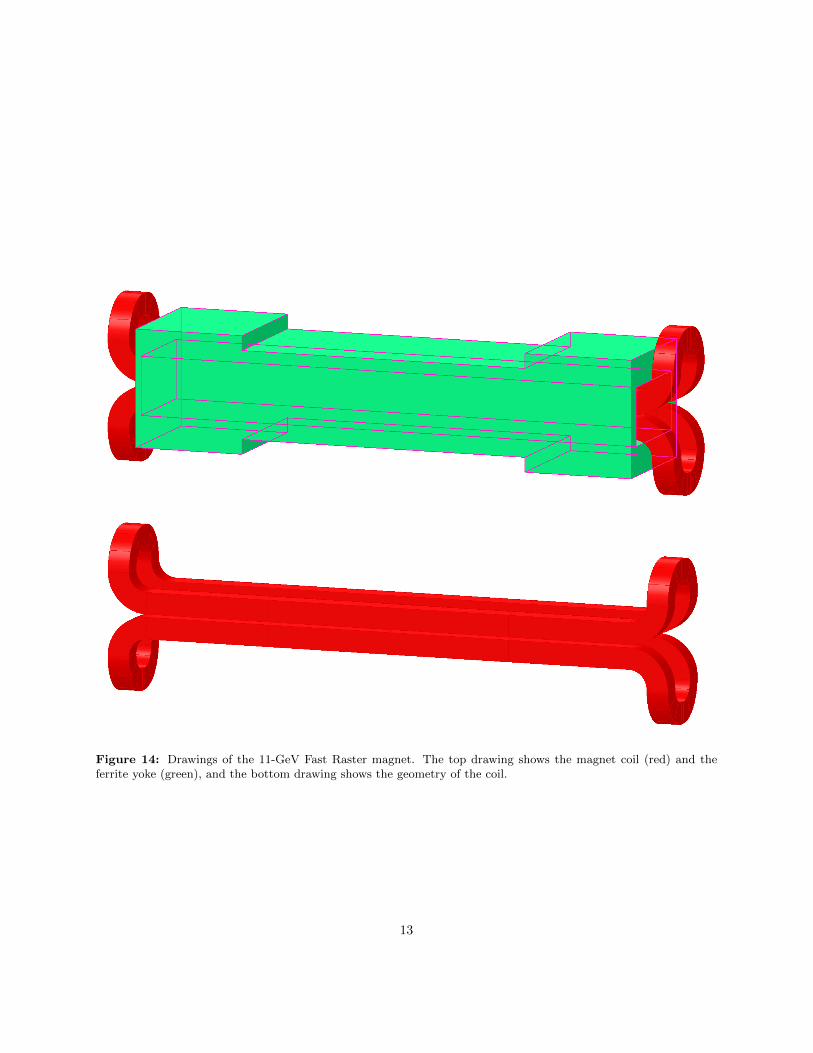
Figure 14: Drawings of the 11-GeV Fast Raster magnet. The top drawing shows the magnet coil (red) and theferrite yoke (green), and the bottom drawing shows the geometry of the coil.
13
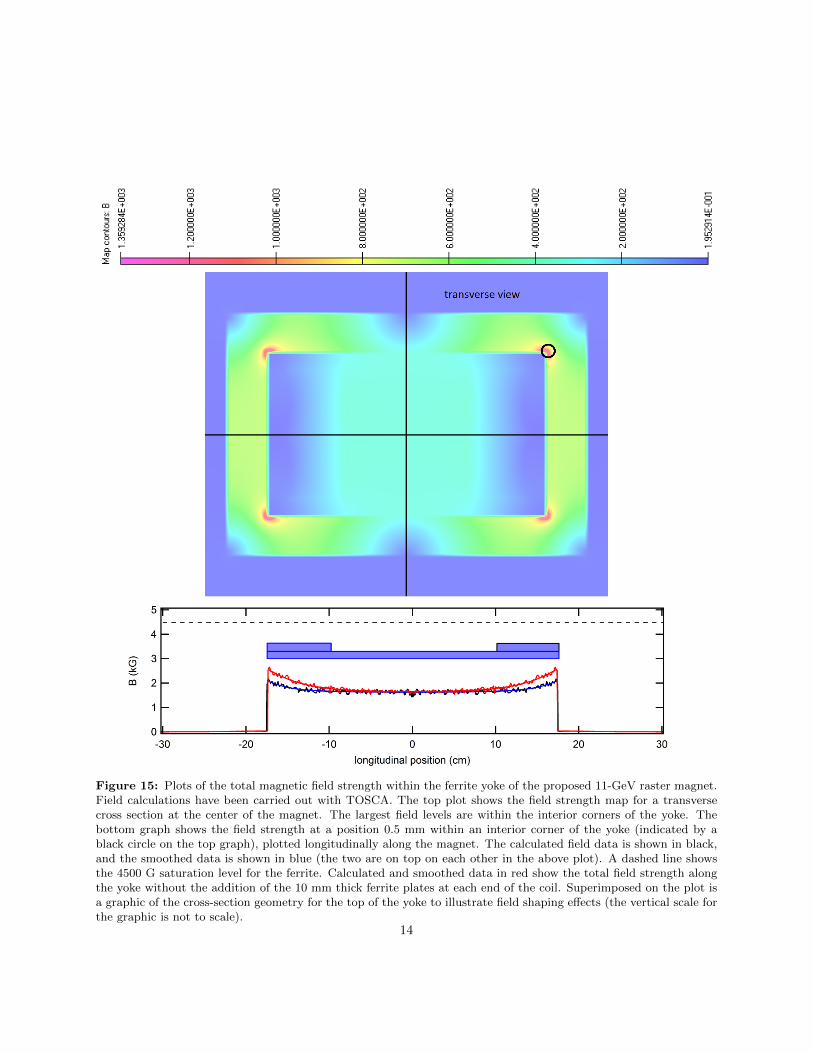
Figure 15: Plots of the total magnetic field strength within the ferrite yoke of the proposed 11-GeV raster magnet.Field calculations have been carried out with TOSCA. The top plot shows the field strength map for a transversecross section at the center of the magnet. The largest field levels are within the interior corners of the yoke. Thebottom graph shows the field strength at a position 0.5 mm within an interior corner of the yoke (indicated by ablack circle on the top graph), plotted longitudinally along the magnet. The calculated field data is shown in black,and the smoothed data is shown in blue (the two are on top on each other in the above plot). A dashed line showsthe 4500 G saturation level for the ferrite. Calculated and smoothed data in red show the total field strength alongthe yoke without the addition of the 10 mm thick ferrite plates at each end of the coil. Superimposed on the plot isa graphic of the cross-section geometry for the top of the yoke to illustrate field shaping effects (the vertical scale forthe graphic is not to scale).
14
A Local temperature rise in HD due to electron beam heating
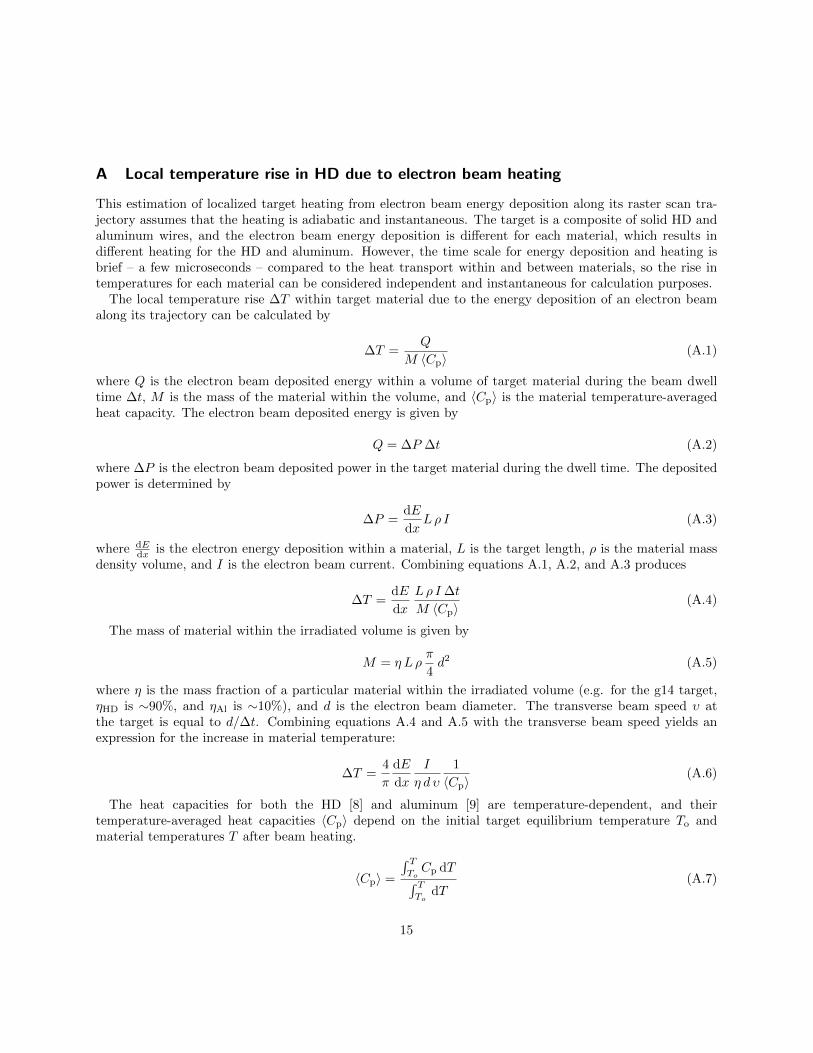
This estimation of localized target heating from electron beam energy deposition along its raster scan tra-jectory assumes that the heating is adiabatic and instantaneous. The target is a composite of solid HD andaluminum wires, and the electron beam energy deposition is different for each material, which results indifferent heating for the HD and aluminum. However, the time scale for energy deposition and heating isbrief – a few microseconds – compared to the heat transport within and between materials, so the rise intemperatures for each material can be considered independent and instantaneous for calculation purposes.
The local temperature rise ∆T within target material due to the energy deposition of an electron beamalong its trajectory can be calculated by
∆T =Q
M 〈Cp〉(A.1)
where Q is the electron beam deposited energy within a volume of target material during the beam dwelltime ∆t, M is the mass of the material within the volume, and 〈Cp〉 is the material temperature-averagedheat capacity. The electron beam deposited energy is given by
Q = ∆P ∆t (A.2)
where ∆P is the electron beam deposited power in the target material during the dwell time. The depositedpower is determined by
∆P =dE
dxLρ I (A.3)
where dEdx is the electron energy deposition within a material, L is the target length, ρ is the material mass
density volume, and I is the electron beam current. Combining equations A.1, A.2, and A.3 produces
∆T =dE
dx
Lρ I ∆t
M 〈Cp〉(A.4)
The mass of material within the irradiated volume is given by
M = η L ρπ
4d2 (A.5)
where η is the mass fraction of a particular material within the irradiated volume (e.g. for the g14 target,ηHD is ∼90%, and ηAl is ∼10%), and d is the electron beam diameter. The transverse beam speed υ atthe target is equal to d/∆t. Combining equations A.4 and A.5 with the transverse beam speed yields anexpression for the increase in material temperature:
∆T =4
π
dE
dx
I
η d υ
1
〈Cp〉(A.6)
The heat capacities for both the HD [8] and aluminum [9] are temperature-dependent, and theirtemperature-averaged heat capacities 〈Cp〉 depend on the initial target equilibrium temperature To andmaterial temperatures T after beam heating.
〈Cp〉 =
∫ T
ToCp dT∫ T
TodT
(A.7)
15
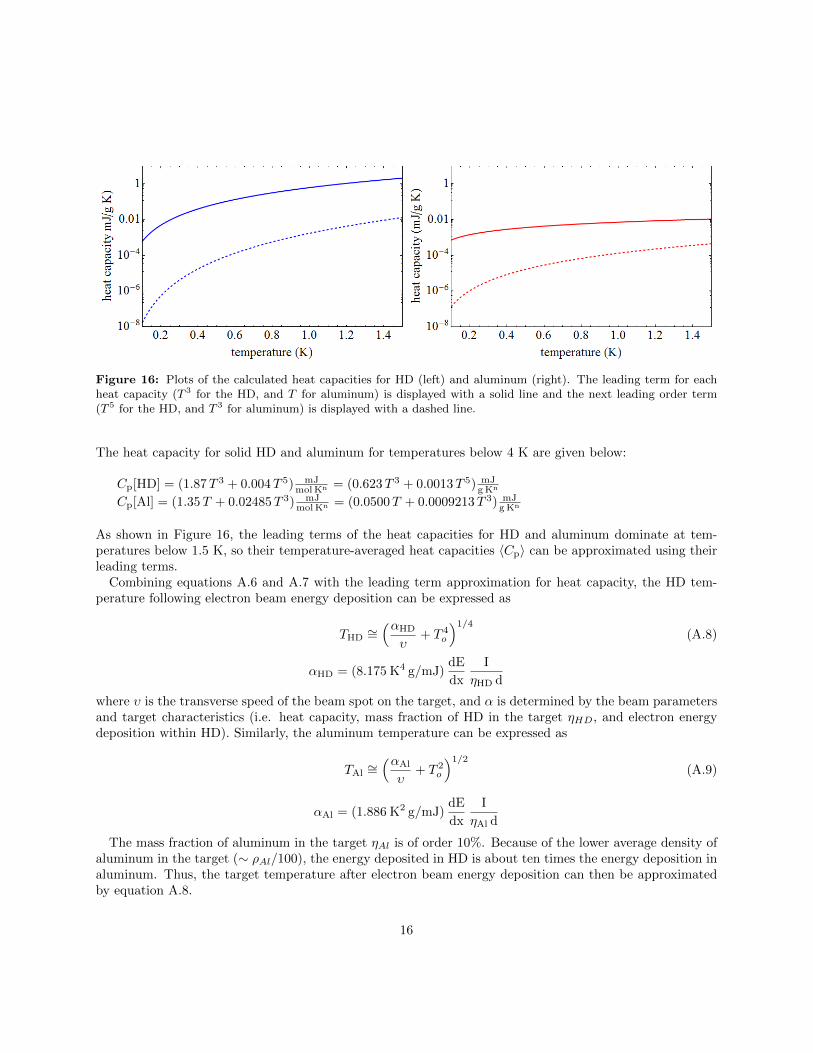
Figure 16: Plots of the calculated heat capacities for HD (left) and aluminum (right). The leading term for eachheat capacity (T 3 for the HD, and T for aluminum) is displayed with a solid line and the next leading order term(T 5 for the HD, and T 3 for aluminum) is displayed with a dashed line.
The heat capacity for solid HD and aluminum for temperatures below 4 K are given below:
Cp[HD] = (1.87T 3 + 0.004T 5) mJmolKn = (0.623T 3 + 0.0013T 5) mJ
gKn
Cp[Al] = (1.35T + 0.02485T 3) mJmolKn = (0.0500T + 0.0009213T 3) mJ
gKn
As shown in Figure 16, the leading terms of the heat capacities for HD and aluminum dominate at tem-peratures below 1.5 K, so their temperature-averaged heat capacities 〈Cp〉 can be approximated using theirleading terms.
Combining equations A.6 and A.7 with the leading term approximation for heat capacity, the HD tem-perature following electron beam energy deposition can be expressed as
THD∼=(αHD
υ+ T 4
o
)1/4(A.8)
αHD = (8.175 K4 g/mJ)dE
dx
I
ηHD d
where υ is the transverse speed of the beam spot on the target, and α is determined by the beam parametersand target characteristics (i.e. heat capacity, mass fraction of HD in the target ηHD, and electron energydeposition within HD). Similarly, the aluminum temperature can be expressed as
TAl∼=(αAl
υ+ T 2
o
)1/2(A.9)
αAl = (1.886 K2 g/mJ)dE
dx
I
ηAl d
The mass fraction of aluminum in the target ηAl is of order 10%. Because of the lower average density ofaluminum in the target (∼ ρAl/100), the energy deposited in HD is about ten times the energy deposition inaluminum. Thus, the target temperature after electron beam energy deposition can then be approximatedby equation A.8.
16
References
[1] GEANT 3.2.1, CERN Library W5013 (1993).
[2] Stopping-power and range tables for electrons program, available online atphysics.nist.gov/PhysRefData/Star/Text/ESTAR.html
[3] M. Fukuda, S. Okumura, and K. Arakawa. Nucl. Instrum. Methods A 396 (1997) 45-49.
[4] Y.K. Batygin, V.V. Kushin, and S.V. Plotnikov. Nucl. Instrum. Methods A 363 (1995) 128-130.
[5] C. Yan et al. Proc. Part. Accel. Conf. 4 (1993) 3109-3105.
[6] C. Yan, N. Sinkine, and R. Wojcik. Nucl. Instrum. Methods A 539 (2005) 1-15.
[7] Soft Ferrites and Accessories 2009 Data Handbook. Ferroxcube, Yageo Corp. www.ferroxcube.com.
[8] J.H. Constable, A.Q. McGee and J.R. Gaines. Phys. Rev B 11 (1975) 3045-3051.
[9] N.Phillips, Phys. Rev. 114 (1959) 676.
17