Embed Size (px)
Citation preview

HCV RNA monitoring in the era of new potent HCV therapies
Johannes Vermehren, Frankfurt am Main, Germany

HCV RNA monitoring in the era of IFN-based tx.
IFN-based treatments:
• low efficacy (40-50% in genotype 1) • long treatment durations (16-72 weeks) • multitude of side effects associated with both IFN + RBV
• many contraindications
• risk of hepatic decompensation in those with advanced disease
Advantages of HCV RNA monitoring:
• adherence
• response prediction
• efficacy – futility

AU Neumann et al. Science 1998
Viral Kinetics Modeling
Free virion clearance rate (c)
Infected cell death rate (δ)

RVR is the best predictor for SVR
MW Fried et al. J Hepatol 2011

Response guided treatment
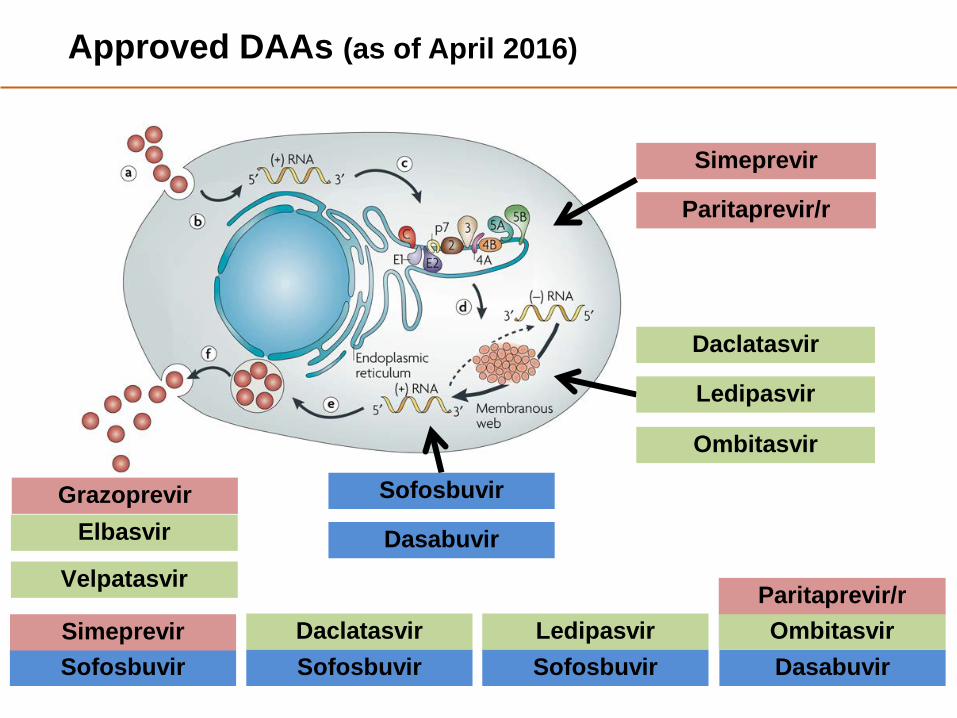
Approved DAAs (as of April 2016)
Simeprevir
Ledipasvir
Sofosbuvir
Dasabuvir
Ombitasvir
Daclatasvir Sofosbuvir
Daclatasvir
Paritaprevir/r
Simeprevir Sofosbuvir
Ledipasvir Sofosbuvir Dasabuvir
Ombitasvir Paritaprevir/r
Grazoprevir Elbasvir
Velpatasvir

99 97 94 91 94 93 96
0
20
40
60
80
100
LDV/SOF 12WLDV/SOF+RBV 12WLDV/SOF 8W LDV/SOF 8WLDV/SOF 12W LDV/SOF 8WLDV/SOF 12W
SVR
(%)
209 214
211 217
202 215
n N
Afdhal et al. NEJM 2014; Kowdley et al. NEJM 2014; Backus et al. AASLD 2015; Buggisch et al. EASL 2016
1070 1171
1718 1830
SVR rates in treatment-naive non-cirrhotic GT1 patients ION-1 und ION-3 Department of DHC-Register Veterans Affairs
632 677
1023 1066
Efficacy of current DAA regimens...in clinical trials

99 97 94 91 94 93 96
0
20
40
60
80
100
LDV/SOF 12WLDV/SOF+RBV 12WLDV/SOF 8W LDV/SOF 8WLDV/SOF 12W LDV/SOF 8WLDV/SOF 12W
SVR
(%)
209 214
211 217
202 215
n N
Afdhal et al. NEJM 2014; Kowdley et al. NEJM 2014; Backus et al. AASLD 2015; Buggisch et al. EASL 2016
1070 1171
1718 1830
SVR rates in treatment-naive non-cirrhotic GT1 patients ION-1 und ION-3 Department of DHC-Registry Veterans Affairs
632 677
1023 1066
Efficacy of current DAA regimens...in real world

Efficacy of current DAA regimens...in clinical trials
Horizontal dashed line indicates the overall SVR12 rate in patients receiving the label-recommended regimen,97%. BMI, body mass index in kg/m2; PR, peginterferon/ribavirin
N Reau et al. EASL 2015
SVR by Baseline Host Characteristics 3D phase III trials

Efficacy of current DAA regimens...in real world
H Hinrichsen et al. EASL 2016

EASL Guidelines
EASL Clinical Practice Guidelines 2015; J Hepatol 2015

B Maasoumy, J Vermehren in prep.
Commercial Assays
Assay Manufacturer Extraction device Amplification device
IVD approval status
Limit of detection (LOD)
in IU/mL
Range of quantification
in IU/mL COBAS TaqMan HCV Test v2.0 For Use With The High Pure System (HPS/CTM)
Roche Molecular Diagnostics
High Pure System (manual) COBAS TaqMan CE (Europe)
FDA (USA)
8.8-9.3 (GT1; Europe)
20 (all GTs; USA)
25-3.91×10⁸ (GT1; Europe)
25-3×10⁸ (all GTs; USA)
COBAS AmpliPrep/COBAS TaqMan HCV Test, v2.0 (CAP/CTM)
Roche Molecular Diagnostics COBAS AmpliPrep COBAS TaqMan CE (Europe)
FDA (USA) 15 15-1.0x10⁸
RealTime HCV Abbott Molecular m2000SP m2000RT CE (Europe) FDA (USA) 12 12-1.0x10⁸
Artus HCV QS-RGQ Assay Qiagen QIAsymphony SP/AS Rotor-Gene Q CE (Europe) 36.2 67.6-17.7x10⁶
Versant HCV 1.0 kPCR assay Siemens Healthcare kPCR Sample Prep
kPCR Amplification and Detection (AD)
Module CE (Europe) 15 15-1.0x10⁸

6 Million Baseline Viral Load: ION-3
IM Jacobson et al. AASLD 2014

6 Million Baseline Viral Load
FDA data, available online
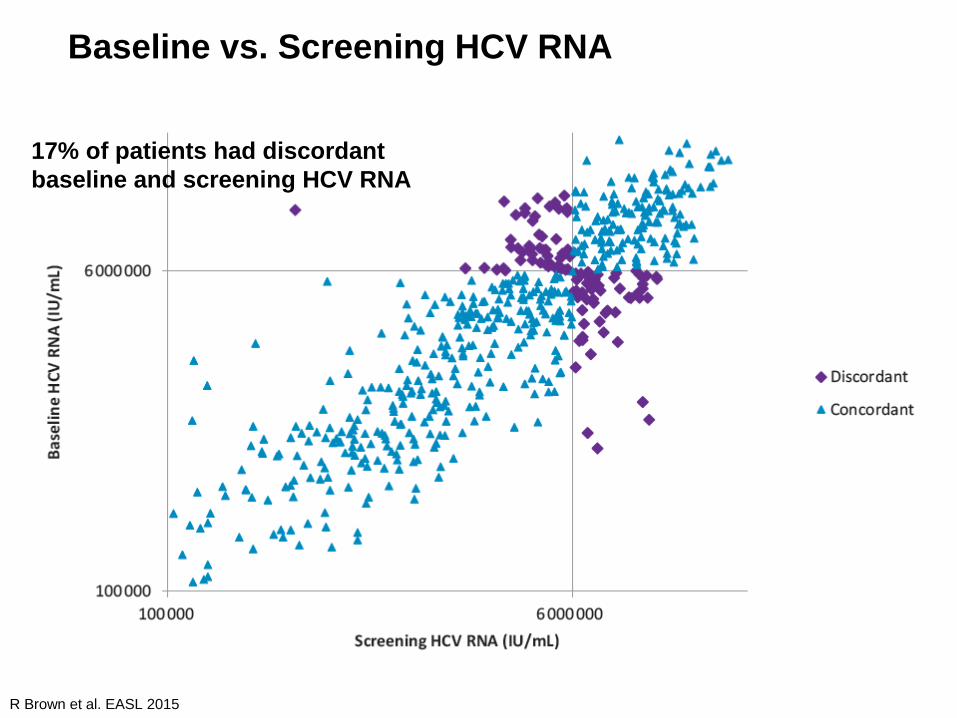
R Brown et al. EASL 2015
• Overall, screening and baseline HCV RNA measurements differed by>1M IU/mL in 55%, by >2M IU/mL in 35%, and by >3M IU/mL in 26% of patients
• Intrapatient variability in HCV RNA (IU/mL) increased with increasing screening HCV RNA; in patients with a screening HCV RNA above 2M IU/mL, 53% differed by >2M IU/mL
17% of patients had discordant baseline and screening HCV RNA
Baseline vs. Screening HCV RNA

6 Million Baseline Viral Load: CAP vs. ART assay
J Vermehren, B Maasoumy et al. CID 2016

Abbott GmbH
6 Million Baseline Viral Load
HPS/CTM (IU/mL)
ART Calculation IU/mL
CAP/CTM Calculation
IU/mL
Treatment Duration
1.000.000 ~350.000 ~500.000 8 Wks.
2.000.000 ~700.000 ~900.000 8 Wks.
4.000.000 ~1.400.000 ~1.600.000 8 Wks.
6.000.000 ~2.000.000 ~2.300.000 8-12 Wks
8.000.000 ~2.800.000 ~2.900.000 8-12 Wks

N Terrault et al. AASLD 2015
6 Million Baseline Viral Load: Real Life adherence
SVR
12 (%
)
242/254 127/131 119/123 LDV/SOF 8 Wochen
LDV/SOF 12 Wochen
215/215 127/131 187/192
97% 97%
323 patients qualified for 8 weeks but only 41% received 8 weeks
8 wks. LDV/SOF in the TARGET HCV Study (Real World Obervational Cohort)

100 94 96 98 98 96
0
20
40
60
80
100
Week 1 Week 2 Weeks 4-6
SVR1
2 (%
)
CirrhosisNo Cirrhosis
On-treatment HCV RNA – predictive of SVR?
SVR by Time of First Undetectable HCV RNA (<15 IU/mL; n=2022 patients) Pooled Analysis from 6 clinical trials (3D regimen)
M Sulkowski et al. AASLD 2014

On-treatment HCV RNA – predictive of SVR?
S Sidharthan et al. CID 2015
HCV RNA at EoT not predictive of Relapse: what is observed may be non-infectious HCV RNA

B Maasoumy, J Vermehren et al. J Hepatol 2016
On-treatment HCV RNA: difficult-to-treat patients
Week 2 viral load during SOF/RBV therapy in HCV GT3 SVR vs. Relapse

On-treatment HCV RNA: difficult-to-treat patients
Pts. with cirrhosis and detectable HCV RNA at wks. 1 and 2 had significantly higher SVR rates if treated for 24 vs. 12 weeks
TM Welzel et al. AASLD 2014

Potential for RGT in patients with cirrhosis
P Ferenci et al. J Hepatol 2015

Can Viral Kinetics be used for RGT?
L Rong et al. Plos Comput Med 2013
Phases of viral decline affected by the effectiveness of therapy in blocking intracellular viral production and assembly/secretion.
Free virion clearance rate (c)
Infected cell death rate (δ)
Blockage of intracellular secretion (εs)
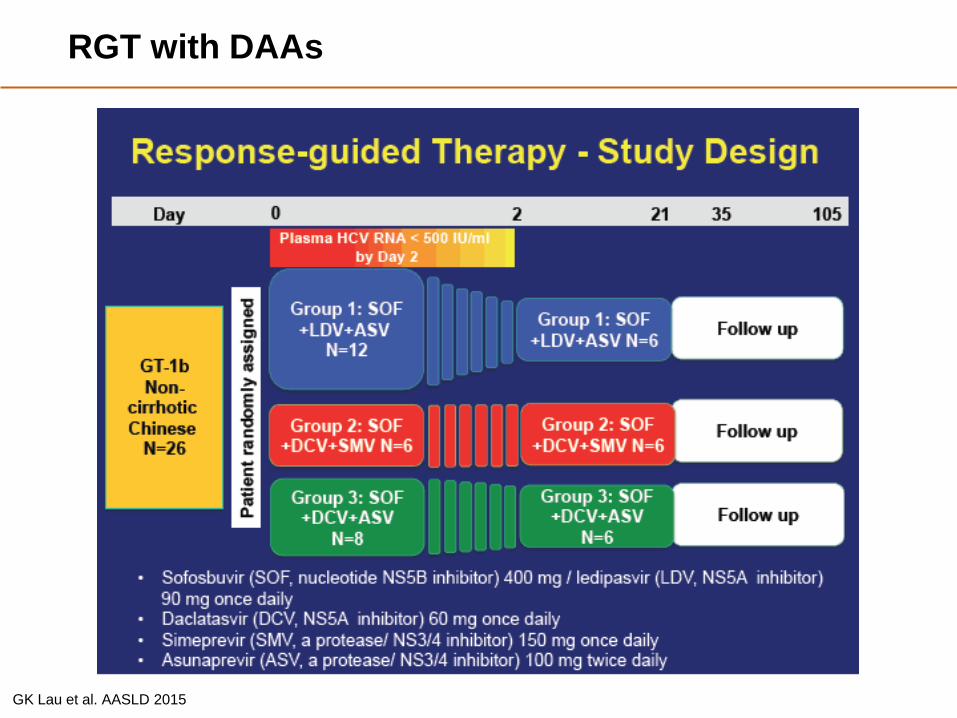
RGT with DAAs
GK Lau et al. AASLD 2015

Model predicts no patient hits cure boundary <10-4
GK Lau et al. AASLD 2015

H Dahari et al. J Hepatol 2016
Projected duration according to model
n=23: 6 wks.; n=16: 8 wks.; n=7: 10 wks.

Conclusions
• There is no statistical evidence for 6 million cut-off
• Intra-patient and inter-assay variability may influence the decision on treatment duration
• DAA treatment leads to fast, triphasic HCV RNA decline • On-treatment HCV RNA not predictive of SVR in most patients treated with
highly potent DAA regimens
• VL monitoring not required in the majority of patients
• Cirrhotic patients have slower early HCV RNA kinetics
• Early on-treatment HCV RNA may be useful for further optimization of treatment duration in difficult-to-treat patient populations
• Ultra-fast cure is not predicted by current models
• Non-infectious HCV RNA enhanced by DAAs vs. restored immune control of virus


![Hepatitis C virus: Virology, diagnosis and treatment · VIROLOGY HCV life cycle[21-23] HCV is a small enveloped RNA virus belonging to the family Flaviviridae and genus hepacivirus](https://img.pdfslide.us/doc/110x75/5f0ab3cd7e708231d42ceb92/hepatitis-c-virus-virology-diagnosis-and-treatment-virology-hcv-life-cycle21-23.jpg)