Embed Size (px)
Citation preview
HCP Inc. - Climate Change 2019
C0. Introduction
C0.1
(C0.1) Give a general description and introduction to your organization.
HCP, an S&P 500 company, invests primarily in real estate serving the healthcare industry in the United States. We are a Marylandcorporation organized in 1985 and qualify as a self-administered real estate investment trust (“REIT”). We are headquartered inIrvine, California, with offices in Nashville and San Francisco. Our diverse portfolio is comprised of investments in the followinghealthcare segments: (i) life science and (iii) medical office and (iii) senior housing operating portfolio and senior housing triple-net.
Environmental Boundary: HCP includes properties where the company has operational control—i.e., buildings that we maintain,provide service to, and/or have the authority to implement operating policies with respect to energy usage, water usage and/or wastedisposal. Where HCP retains operational control over a limited space of the property, the proportion of the consumption controlled byHCP has been reported. For 2018, 467 properties out of the 744 properties in our portfolio (assets under management), werecontrolled by HCP. 2017 data has been adjusted downward by 8 properties to provide a like-comparison to the 2018 boundary.
Labor Metric Boundary: HCP reports on persons employed by HCP as of December 31, 2018 (201 persons).
C0.2
(C0.2) State the start and end date of the year for which you are reporting data.
Start date End date Indicate if you are providing emissions data for pastreporting years
Select the number of past reporting years you will be providingemissions data for
Row1
January 12018
December 312018
No <Not Applicable>
C0.3
(C0.3) Select the countries/regions for which you will be supplying data.United States of America
C0.4
(C0.4) Select the currency used for all financial information disclosed throughout your response.USD
C0.5
CDP Page of 481
(C0.5) Select the option that describes the reporting boundary for which climate-related impacts on your business are beingreported. Note that this option should align with your consolidation approach to your Scope 1 and Scope 2 greenhouse gasinventory.Operational control
C1. Governance
C1.1
(C1.1) Is there board-level oversight of climate-related issues within your organization?Yes
C1.1a
(C1.1a) Identify the position(s) (do not include any names) of the individual(s) on the board with responsibility for climate-related issues.
Position ofindividual(s)
Please explain
ChiefExecutiveOfficer(CEO)
The individual on our Board with the responsibility for oversight of climate-related issues is our Director Tom Herzog, who is also our President andCEO. This position is the highest in our corporate structure, and is responsible for making the ultimate decisions regarding climate-related issues forour Company based on climate-related data provided by members of the Sustainability Committee. Responsibilities for climate-related issues wereassigned to the CEO as a member of the Board to ensure that our sustainability initiatives and targets are aligned with our business strategy, andthat climate-related risks and opportunities are monitored at the Board level in addition to the management level.
C1.1b
CDP Page of 482
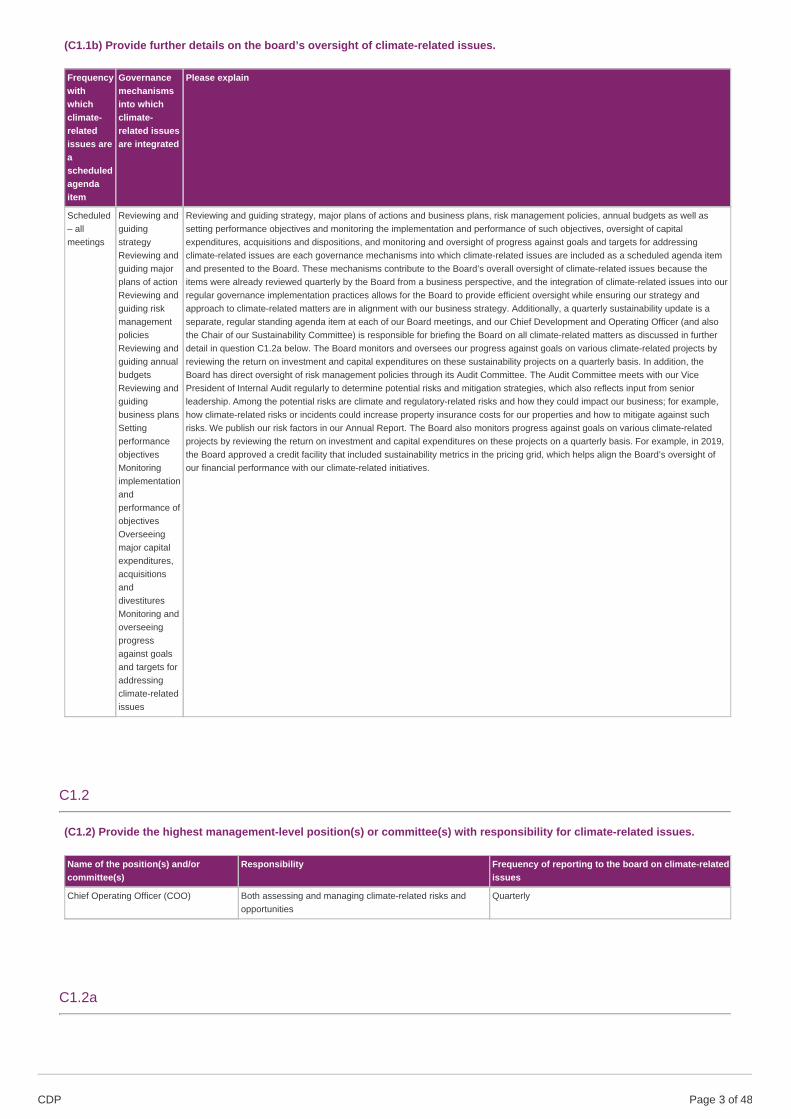
(C1.1b) Provide further details on the board’s oversight of climate-related issues.
Frequencywithwhichclimate-relatedissues areascheduledagendaitem
Governancemechanismsinto whichclimate-related issuesare integrated
Please explain
Scheduled– allmeetings
Reviewing andguidingstrategyReviewing andguiding majorplans of actionReviewing andguiding riskmanagementpoliciesReviewing andguiding annualbudgetsReviewing andguidingbusiness plansSettingperformanceobjectivesMonitoringimplementationandperformance ofobjectivesOverseeingmajor capitalexpenditures,acquisitionsanddivestituresMonitoring andoverseeingprogressagainst goalsand targets foraddressingclimate-relatedissues
Reviewing and guiding strategy, major plans of actions and business plans, risk management policies, annual budgets as well assetting performance objectives and monitoring the implementation and performance of such objectives, oversight of capitalexpenditures, acquisitions and dispositions, and monitoring and oversight of progress against goals and targets for addressingclimate-related issues are each governance mechanisms into which climate-related issues are included as a scheduled agenda itemand presented to the Board. These mechanisms contribute to the Board’s overall oversight of climate-related issues because theitems were already reviewed quarterly by the Board from a business perspective, and the integration of climate-related issues into ourregular governance implementation practices allows for the Board to provide efficient oversight while ensuring our strategy andapproach to climate-related matters are in alignment with our business strategy. Additionally, a quarterly sustainability update is aseparate, regular standing agenda item at each of our Board meetings, and our Chief Development and Operating Officer (and alsothe Chair of our Sustainability Committee) is responsible for briefing the Board on all climate-related matters as discussed in furtherdetail in question C1.2a below. The Board monitors and oversees our progress against goals on various climate-related projects byreviewing the return on investment and capital expenditures on these sustainability projects on a quarterly basis. In addition, theBoard has direct oversight of risk management policies through its Audit Committee. The Audit Committee meets with our VicePresident of Internal Audit regularly to determine potential risks and mitigation strategies, which also reflects input from seniorleadership. Among the potential risks are climate and regulatory-related risks and how they could impact our business; for example,how climate-related risks or incidents could increase property insurance costs for our properties and how to mitigate against suchrisks. We publish our risk factors in our Annual Report. The Board also monitors progress against goals on various climate-relatedprojects by reviewing the return on investment and capital expenditures on these projects on a quarterly basis. For example, in 2019,the Board approved a credit facility that included sustainability metrics in the pricing grid, which helps align the Board’s oversight ofour financial performance with our climate-related initiatives.
C1.2
(C1.2) Provide the highest management-level position(s) or committee(s) with responsibility for climate-related issues.
Name of the position(s) and/orcommittee(s)
Responsibility Frequency of reporting to the board on climate-relatedissues
Chief Operating Officer (COO) Both assessing and managing climate-related risks andopportunities
Quarterly
C1.2a
CDP Page of 483
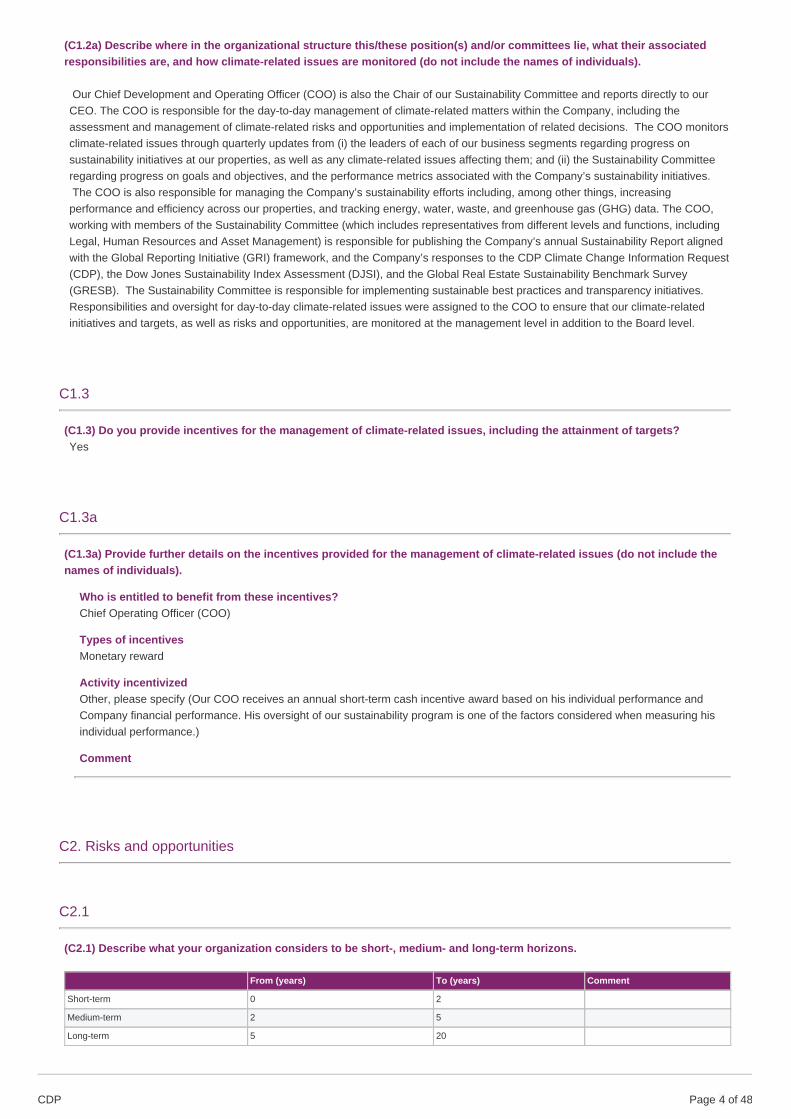
(C1.2a) Describe where in the organizational structure this/these position(s) and/or committees lie, what their associatedresponsibilities are, and how climate-related issues are monitored (do not include the names of individuals).
Our Chief Development and Operating Officer (COO) is also the Chair of our Sustainability Committee and reports directly to ourCEO. The COO is responsible for the day-to-day management of climate-related matters within the Company, including theassessment and management of climate-related risks and opportunities and implementation of related decisions. The COO monitorsclimate-related issues through quarterly updates from (i) the leaders of each of our business segments regarding progress onsustainability initiatives at our properties, as well as any climate-related issues affecting them; and (ii) the Sustainability Committeeregarding progress on goals and objectives, and the performance metrics associated with the Company’s sustainability initiatives. The COO is also responsible for managing the Company’s sustainability efforts including, among other things, increasingperformance and efficiency across our properties, and tracking energy, water, waste, and greenhouse gas (GHG) data. The COO,working with members of the Sustainability Committee (which includes representatives from different levels and functions, includingLegal, Human Resources and Asset Management) is responsible for publishing the Company’s annual Sustainability Report alignedwith the Global Reporting Initiative (GRI) framework, and the Company’s responses to the CDP Climate Change Information Request(CDP), the Dow Jones Sustainability Index Assessment (DJSI), and the Global Real Estate Sustainability Benchmark Survey(GRESB). The Sustainability Committee is responsible for implementing sustainable best practices and transparency initiatives.Responsibilities and oversight for day-to-day climate-related issues were assigned to the COO to ensure that our climate-relatedinitiatives and targets, as well as risks and opportunities, are monitored at the management level in addition to the Board level.
C1.3
(C1.3) Do you provide incentives for the management of climate-related issues, including the attainment of targets?Yes
C1.3a
(C1.3a) Provide further details on the incentives provided for the management of climate-related issues (do not include thenames of individuals).
Who is entitled to benefit from these incentives?Chief Operating Officer (COO)
Types of incentivesMonetary reward
Activity incentivizedOther, please specify (Our COO receives an annual short-term cash incentive award based on his individual performance andCompany financial performance. His oversight of our sustainability program is one of the factors considered when measuring hisindividual performance.)
Comment
C2. Risks and opportunities
C2.1
(C2.1) Describe what your organization considers to be short-, medium- and long-term horizons.
From (years) To (years) Comment
Short-term 0 2
Medium-term 2 5
Long-term 5 20
CDP Page of 484
C2.2
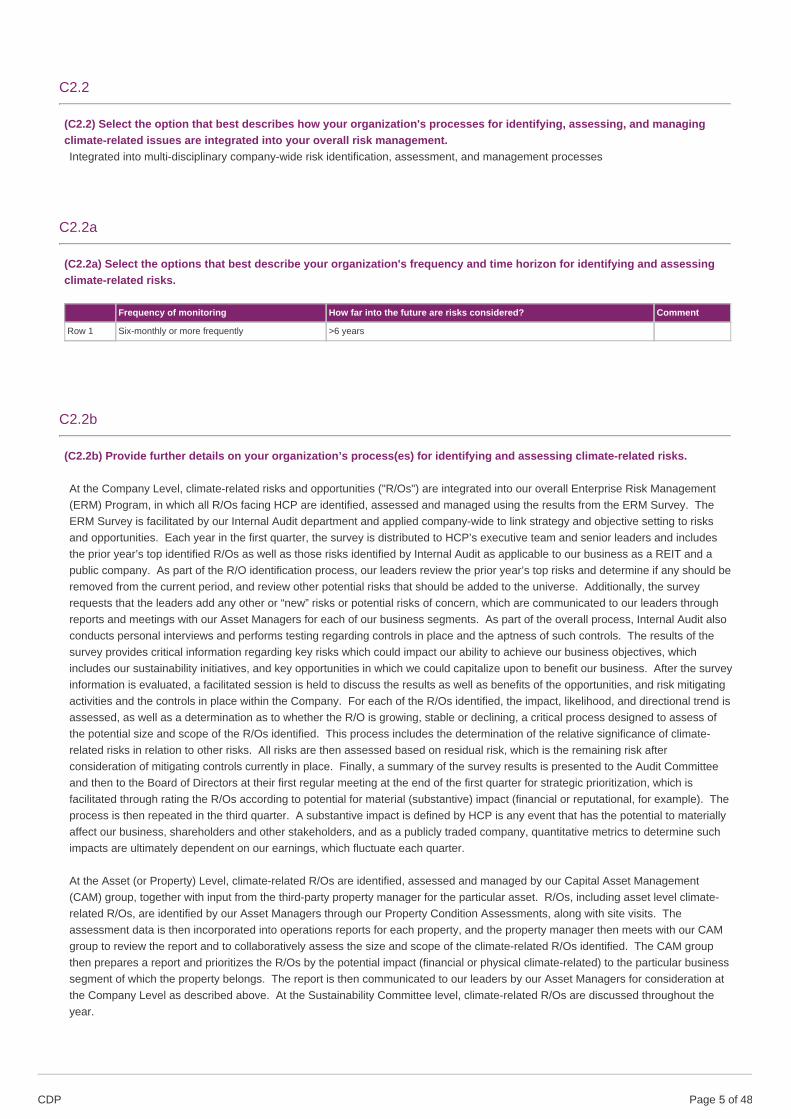
(C2.2) Select the option that best describes how your organization's processes for identifying, assessing, and managingclimate-related issues are integrated into your overall risk management.Integrated into multi-disciplinary company-wide risk identification, assessment, and management processes
C2.2a
(C2.2a) Select the options that best describe your organization's frequency and time horizon for identifying and assessingclimate-related risks.
Frequency of monitoring How far into the future are risks considered? Comment
Row 1 Six-monthly or more frequently >6 years
C2.2b
(C2.2b) Provide further details on your organization’s process(es) for identifying and assessing climate-related risks.
At the Company Level, climate-related risks and opportunities ("R/Os") are integrated into our overall Enterprise Risk Management(ERM) Program, in which all R/Os facing HCP are identified, assessed and managed using the results from the ERM Survey. TheERM Survey is facilitated by our Internal Audit department and applied company-wide to link strategy and objective setting to risksand opportunities. Each year in the first quarter, the survey is distributed to HCP’s executive team and senior leaders and includesthe prior year’s top identified R/Os as well as those risks identified by Internal Audit as applicable to our business as a REIT and apublic company. As part of the R/O identification process, our leaders review the prior year’s top risks and determine if any should beremoved from the current period, and review other potential risks that should be added to the universe. Additionally, the surveyrequests that the leaders add any other or “new” risks or potential risks of concern, which are communicated to our leaders throughreports and meetings with our Asset Managers for each of our business segments. As part of the overall process, Internal Audit alsoconducts personal interviews and performs testing regarding controls in place and the aptness of such controls. The results of thesurvey provides critical information regarding key risks which could impact our ability to achieve our business objectives, whichincludes our sustainability initiatives, and key opportunities in which we could capitalize upon to benefit our business. After the surveyinformation is evaluated, a facilitated session is held to discuss the results as well as benefits of the opportunities, and risk mitigatingactivities and the controls in place within the Company. For each of the R/Os identified, the impact, likelihood, and directional trend isassessed, as well as a determination as to whether the R/O is growing, stable or declining, a critical process designed to assess ofthe potential size and scope of the R/Os identified. This process includes the determination of the relative significance of climate-related risks in relation to other risks. All risks are then assessed based on residual risk, which is the remaining risk afterconsideration of mitigating controls currently in place. Finally, a summary of the survey results is presented to the Audit Committeeand then to the Board of Directors at their first regular meeting at the end of the first quarter for strategic prioritization, which isfacilitated through rating the R/Os according to potential for material (substantive) impact (financial or reputational, for example). Theprocess is then repeated in the third quarter. A substantive impact is defined by HCP is any event that has the potential to materiallyaffect our business, shareholders and other stakeholders, and as a publicly traded company, quantitative metrics to determine suchimpacts are ultimately dependent on our earnings, which fluctuate each quarter.
At the Asset (or Property) Level, climate-related R/Os are identified, assessed and managed by our Capital Asset Management(CAM) group, together with input from the third-party property manager for the particular asset. R/Os, including asset level climate-related R/Os, are identified by our Asset Managers through our Property Condition Assessments, along with site visits. Theassessment data is then incorporated into operations reports for each property, and the property manager then meets with our CAMgroup to review the report and to collaboratively assess the size and scope of the climate-related R/Os identified. The CAM groupthen prepares a report and prioritizes the R/Os by the potential impact (financial or physical climate-related) to the particular businesssegment of which the property belongs. The report is then communicated to our leaders by our Asset Managers for consideration atthe Company Level as described above. At the Sustainability Committee level, climate-related R/Os are discussed throughout theyear.
CDP Page of 485
C2.2c
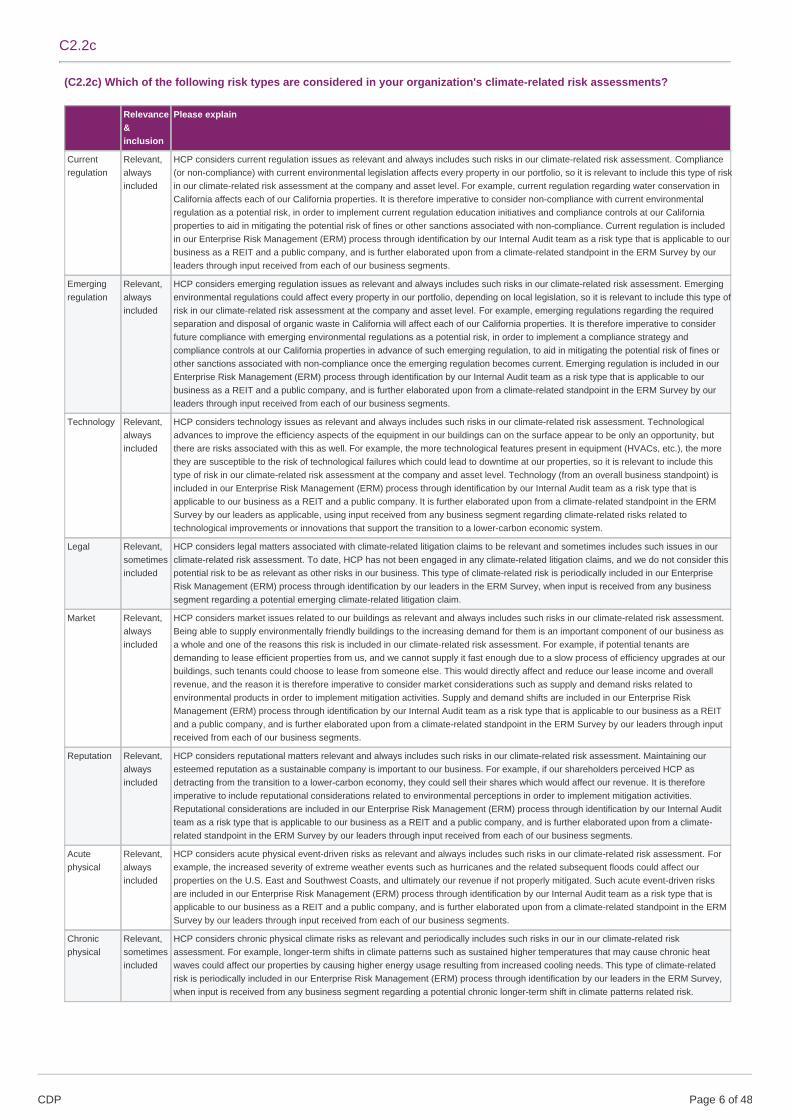
(C2.2c) Which of the following risk types are considered in your organization's climate-related risk assessments?
Relevance&inclusion
Please explain
Currentregulation
Relevant,alwaysincluded
HCP considers current regulation issues as relevant and always includes such risks in our climate-related risk assessment. Compliance(or non-compliance) with current environmental legislation affects every property in our portfolio, so it is relevant to include this type of riskin our climate-related risk assessment at the company and asset level. For example, current regulation regarding water conservation inCalifornia affects each of our California properties. It is therefore imperative to consider non-compliance with current environmentalregulation as a potential risk, in order to implement current regulation education initiatives and compliance controls at our Californiaproperties to aid in mitigating the potential risk of fines or other sanctions associated with non-compliance. Current regulation is includedin our Enterprise Risk Management (ERM) process through identification by our Internal Audit team as a risk type that is applicable to ourbusiness as a REIT and a public company, and is further elaborated upon from a climate-related standpoint in the ERM Survey by ourleaders through input received from each of our business segments.
Emergingregulation
Relevant,alwaysincluded
HCP considers emerging regulation issues as relevant and always includes such risks in our climate-related risk assessment. Emergingenvironmental regulations could affect every property in our portfolio, depending on local legislation, so it is relevant to include this type ofrisk in our climate-related risk assessment at the company and asset level. For example, emerging regulations regarding the requiredseparation and disposal of organic waste in California will affect each of our California properties. It is therefore imperative to considerfuture compliance with emerging environmental regulations as a potential risk, in order to implement a compliance strategy andcompliance controls at our California properties in advance of such emerging regulation, to aid in mitigating the potential risk of fines orother sanctions associated with non-compliance once the emerging regulation becomes current. Emerging regulation is included in ourEnterprise Risk Management (ERM) process through identification by our Internal Audit team as a risk type that is applicable to ourbusiness as a REIT and a public company, and is further elaborated upon from a climate-related standpoint in the ERM Survey by ourleaders through input received from each of our business segments.
Technology Relevant,alwaysincluded
HCP considers technology issues as relevant and always includes such risks in our climate-related risk assessment. Technologicaladvances to improve the efficiency aspects of the equipment in our buildings can on the surface appear to be only an opportunity, butthere are risks associated with this as well. For example, the more technological features present in equipment (HVACs, etc.), the morethey are susceptible to the risk of technological failures which could lead to downtime at our properties, so it is relevant to include thistype of risk in our climate-related risk assessment at the company and asset level. Technology (from an overall business standpoint) isincluded in our Enterprise Risk Management (ERM) process through identification by our Internal Audit team as a risk type that isapplicable to our business as a REIT and a public company. It is further elaborated upon from a climate-related standpoint in the ERMSurvey by our leaders as applicable, using input received from any business segment regarding climate-related risks related totechnological improvements or innovations that support the transition to a lower-carbon economic system.
Legal Relevant,sometimesincluded
HCP considers legal matters associated with climate-related litigation claims to be relevant and sometimes includes such issues in ourclimate-related risk assessment. To date, HCP has not been engaged in any climate-related litigation claims, and we do not consider thispotential risk to be as relevant as other risks in our business. This type of climate-related risk is periodically included in our EnterpriseRisk Management (ERM) process through identification by our leaders in the ERM Survey, when input is received from any businesssegment regarding a potential emerging climate-related litigation claim.
Market Relevant,alwaysincluded
HCP considers market issues related to our buildings as relevant and always includes such risks in our climate-related risk assessment.Being able to supply environmentally friendly buildings to the increasing demand for them is an important component of our business asa whole and one of the reasons this risk is included in our climate-related risk assessment. For example, if potential tenants aredemanding to lease efficient properties from us, and we cannot supply it fast enough due to a slow process of efficiency upgrades at ourbuildings, such tenants could choose to lease from someone else. This would directly affect and reduce our lease income and overallrevenue, and the reason it is therefore imperative to consider market considerations such as supply and demand risks related toenvironmental products in order to implement mitigation activities. Supply and demand shifts are included in our Enterprise RiskManagement (ERM) process through identification by our Internal Audit team as a risk type that is applicable to our business as a REITand a public company, and is further elaborated upon from a climate-related standpoint in the ERM Survey by our leaders through inputreceived from each of our business segments.
Reputation Relevant,alwaysincluded
HCP considers reputational matters relevant and always includes such risks in our climate-related risk assessment. Maintaining ouresteemed reputation as a sustainable company is important to our business. For example, if our shareholders perceived HCP asdetracting from the transition to a lower-carbon economy, they could sell their shares which would affect our revenue. It is thereforeimperative to include reputational considerations related to environmental perceptions in order to implement mitigation activities.Reputational considerations are included in our Enterprise Risk Management (ERM) process through identification by our Internal Auditteam as a risk type that is applicable to our business as a REIT and a public company, and is further elaborated upon from a climate-related standpoint in the ERM Survey by our leaders through input received from each of our business segments.
Acutephysical
Relevant,alwaysincluded
HCP considers acute physical event-driven risks as relevant and always includes such risks in our climate-related risk assessment. Forexample, the increased severity of extreme weather events such as hurricanes and the related subsequent floods could affect ourproperties on the U.S. East and Southwest Coasts, and ultimately our revenue if not properly mitigated. Such acute event-driven risksare included in our Enterprise Risk Management (ERM) process through identification by our Internal Audit team as a risk type that isapplicable to our business as a REIT and a public company, and is further elaborated upon from a climate-related standpoint in the ERMSurvey by our leaders through input received from each of our business segments.
Chronicphysical
Relevant,sometimesincluded
HCP considers chronic physical climate risks as relevant and periodically includes such risks in our in our climate-related riskassessment. For example, longer-term shifts in climate patterns such as sustained higher temperatures that may cause chronic heatwaves could affect our properties by causing higher energy usage resulting from increased cooling needs. This type of climate-relatedrisk is periodically included in our Enterprise Risk Management (ERM) process through identification by our leaders in the ERM Survey,when input is received from any business segment regarding a potential chronic longer-term shift in climate patterns related risk.
CDP Page of 486
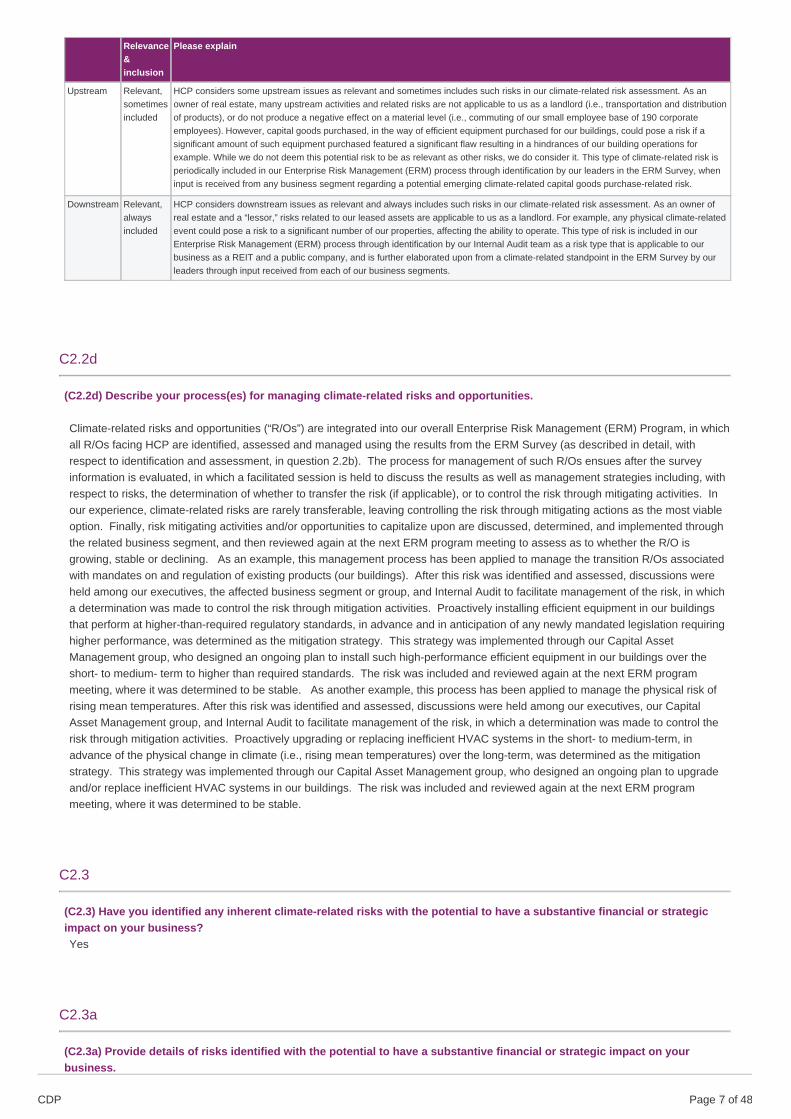
Upstream Relevant,sometimesincluded
HCP considers some upstream issues as relevant and sometimes includes such risks in our climate-related risk assessment. As anowner of real estate, many upstream activities and related risks are not applicable to us as a landlord (i.e., transportation and distributionof products), or do not produce a negative effect on a material level (i.e., commuting of our small employee base of 190 corporateemployees). However, capital goods purchased, in the way of efficient equipment purchased for our buildings, could pose a risk if asignificant amount of such equipment purchased featured a significant flaw resulting in a hindrances of our building operations forexample. While we do not deem this potential risk to be as relevant as other risks, we do consider it. This type of climate-related risk isperiodically included in our Enterprise Risk Management (ERM) process through identification by our leaders in the ERM Survey, wheninput is received from any business segment regarding a potential emerging climate-related capital goods purchase-related risk.
Downstream Relevant,alwaysincluded
HCP considers downstream issues as relevant and always includes such risks in our climate-related risk assessment. As an owner ofreal estate and a “lessor,” risks related to our leased assets are applicable to us as a landlord. For example, any physical climate-relatedevent could pose a risk to a significant number of our properties, affecting the ability to operate. This type of risk is included in ourEnterprise Risk Management (ERM) process through identification by our Internal Audit team as a risk type that is applicable to ourbusiness as a REIT and a public company, and is further elaborated upon from a climate-related standpoint in the ERM Survey by ourleaders through input received from each of our business segments.
Relevance&inclusion
Please explain
C2.2d
(C2.2d) Describe your process(es) for managing climate-related risks and opportunities.
Climate-related risks and opportunities (“R/Os”) are integrated into our overall Enterprise Risk Management (ERM) Program, in whichall R/Os facing HCP are identified, assessed and managed using the results from the ERM Survey (as described in detail, withrespect to identification and assessment, in question 2.2b). The process for management of such R/Os ensues after the surveyinformation is evaluated, in which a facilitated session is held to discuss the results as well as management strategies including, withrespect to risks, the determination of whether to transfer the risk (if applicable), or to control the risk through mitigating activities. Inour experience, climate-related risks are rarely transferable, leaving controlling the risk through mitigating actions as the most viableoption. Finally, risk mitigating activities and/or opportunities to capitalize upon are discussed, determined, and implemented throughthe related business segment, and then reviewed again at the next ERM program meeting to assess as to whether the R/O isgrowing, stable or declining. As an example, this management process has been applied to manage the transition R/Os associatedwith mandates on and regulation of existing products (our buildings). After this risk was identified and assessed, discussions wereheld among our executives, the affected business segment or group, and Internal Audit to facilitate management of the risk, in whicha determination was made to control the risk through mitigation activities. Proactively installing efficient equipment in our buildingsthat perform at higher-than-required regulatory standards, in advance and in anticipation of any newly mandated legislation requiringhigher performance, was determined as the mitigation strategy. This strategy was implemented through our Capital AssetManagement group, who designed an ongoing plan to install such high-performance efficient equipment in our buildings over theshort- to medium- term to higher than required standards. The risk was included and reviewed again at the next ERM programmeeting, where it was determined to be stable. As another example, this process has been applied to manage the physical risk ofrising mean temperatures. After this risk was identified and assessed, discussions were held among our executives, our CapitalAsset Management group, and Internal Audit to facilitate management of the risk, in which a determination was made to control therisk through mitigation activities. Proactively upgrading or replacing inefficient HVAC systems in the short- to medium-term, inadvance of the physical change in climate (i.e., rising mean temperatures) over the long-term, was determined as the mitigationstrategy. This strategy was implemented through our Capital Asset Management group, who designed an ongoing plan to upgradeand/or replace inefficient HVAC systems in our buildings. The risk was included and reviewed again at the next ERM programmeeting, where it was determined to be stable.
C2.3
(C2.3) Have you identified any inherent climate-related risks with the potential to have a substantive financial or strategicimpact on your business?Yes
C2.3a
(C2.3a) Provide details of risks identified with the potential to have a substantive financial or strategic impact on yourbusiness.
CDP Page of 487
IdentifierRisk 1
Where in the value chain does the risk driver occur?Direct operations
Risk typePhysical risk
Primary climate-related risk driverAcute: Increased severity of extreme weather events such as cyclones and floods
Type of financial impactIncreased capital costs (e.g., damage to facilities)
Company- specific descriptionRisks identified by HCP that are driven by the increased severity of extreme weather events such as cyclones (hurricanes) andfloods include increased: (i) capital costs related to damages to our buildings; and (ii) insurance premiums and potential for reducedavailability of insurance (i.e., costs not covered by insurance) on assets in “high-risk” locations. Specifically, a significant portion ofour portfolio (approximately one-third) includes properties located in the Gulf Coast, Eastern Coast, and deep South, which areconsidered high-risk locations as those areas most affected by hurricanes and related flooding. According to the U.S. NationalHurricane Center, hurricanes have caused eight of the ten most costly disasters in U.S. history, and the potential for significantdamage-related costs to our properties pose a major risk to us. Correspondingly, we believe the inherent risks cited above have thepotential to cause a substantive financial as well as strategic impact on our business. Many of our properties in Southeastern U.S.are senior housing facilities with residents who may be more frail and difficult to evacuate in the event of a storm, so HCP has hadto ensure protective measures are in place to allow residents to shelter in place, including electric generators strong enough topower the entire facility, sandbags, flood mitigation, etc. Not having these measures in place could result in costly damage and lossof life.
Time horizonMedium-term
LikelihoodVirtually certain
Magnitude of impactMedium-high
Are you able to provide a potential financial impact figure?Yes, a single figure estimate
Potential financial impact figure (currency)5500000
Potential financial impact figure – minimum (currency)<Not Applicable>
Potential financial impact figure – maximum (currency)<Not Applicable>
Explanation of financial impact figureThe financial impact includes higher operating costs resulting from increased capital costs, insurance premiums, and uninsuredcosts relating to damage to our buildings. The 2018 Atlantic hurricane season included 15 named storms and 2 major hurricanes.Approximately 1/3 of HCP’s properties is located in hurricane and flood prone areas in the eastern and southern U.S. Any one ofthese events could significantly impact HCP’s portfolio. Through hurricane modelling over a 250-year return period looking atclusters of HCP properties in higher risk areas, the projected client loss (in deductibles) to HCP would be approximately $6 million.HCP also spends about $3 million on wind and flood insurance. If the combined costs ($9 million) increased 10% on average overthe next 5 years, it would cost HCP an additional $5.5 million compared to 2018, a substantial increase. This increase could impactour financial growth and business operations, affecting long-term value creation.
Management methodMethods we are using to manage these risks include the implementation at our properties of emergency preparedness policies andprocedures outlining the key processes, individuals, tools and equipment, and safety measures necessary in the event of extremeweather including pre-storm preparation and post- storm cleanup activities. For example, each year HCP hosts an annualconference for our tenants and operators, in which best practices, key emergency processes, and safety measures are covered intraining sessions and interactive focus-groups. The knowledge obtained and implemented from these sessions aids in managingthe risk of increased capital costs related to damages to our buildings, because certain damages could be lessened or eliminated ifproper preparation steps are followed (i.e., sandbags added around flood-prone areas of properties when over 2 inches of rain is
CDP Page of 488
forecasted). Additionally, we strive to maintain and build upon our investment grade corporate financial structure to aid indecreasing our insurance rates as a result of demonstrating our financial stability, and we negotiate competitive insurance ratesthrough a bidding process to ensure we receive the lowest rates. Such management methods outlined herein are a part of ournormal business practices, so do not cost us anything ($0.00) in the way of managing these climate-related risks.
Cost of management0
Comment
IdentifierRisk 2
Where in the value chain does the risk driver occur?Direct operations
Risk typePhysical risk
Primary climate-related risk driverChronic: Rising mean temperatures
Type of financial impactIncreased operating costs (e.g., inadequate water supply for hydroelectric plants or to cool nuclear and fossil fuel plants)
Company- specific descriptionRisks driven by changes in physical climate parameters such as a rising mean temperatures include increased operating costs dueto higher cooling expenses, especially in the properties we own throughout the upper Midwest, Southwest and Southeast of theU.S. where it is much warmer. In 2018 155 HVAC units were installed in buildings in these regions. Such increased costs couldpose a significant financial impact to our company as it would affect all of our boundary properties. Proactively upgrading orreplacing inefficient HVAC systems in the short-term, in advance of potential rising mean temperatures over the long-term, allowsus to start incurring efficiency savings immediately to off-set some of the costs associated with the implementation of the efficientHVAC systems.
Time horizonLong-term
LikelihoodVirtually certain
Magnitude of impactHigh
Are you able to provide a potential financial impact figure?Yes, a single figure estimate
Potential financial impact figure (currency)51200000
Potential financial impact figure – minimum (currency)<Not Applicable>
Potential financial impact figure – maximum (currency)<Not Applicable>
Explanation of financial impact figureThe estimated financial implications resulting from a rising mean temperature include increased operating costs from higher coolingexpenses. For example, we spent $64.6 million in energy expenses on our boundary properties in 2018. A 10% increase in suchexpenses due increased cooling needs resulting from a rising mean temperatures could cost us an additional $6.5 million annually,and over the long-term (8 years, for example) could cost $52 million. Over the long-term, temperature rise could substantiallyincrease our expenditures.
Management methodMethods we are using to manage risks driven by rising mean temperatures include proactively upgrading or replacing inefficientHVAC systems with efficient HVAC systems in the short-term to begin incurring cost savings in advance of any rise in meanaverage temperature over the long-term. For example in 2018 , we proactively implemented 123 HVAC projects at our buildings,resulting in these buildings becoming a more efficient product. Implementing such equipment now will aid in mitigating the risks ofany increased costs in the future. The 123 HVAC efficiency projects we implemented cost approximately $9.8 million.
CDP Page of 489
Cost of management9800000
Comment
IdentifierRisk 3
Where in the value chain does the risk driver occur?Direct operations
Risk typeTransition risk
Primary climate-related risk driverReputation: Shifts in consumer preferences
Type of financial impactReduced revenue from decreased demand for goods/services
Company- specific descriptionReputational risks driven by shifts in consumer preferences include not being perceived as a green-minded company by theincreasing number of tenants who consider the sustainability attributes of a building as a key factor in their leasing and leasingrenewal decisions. For example, our life science property, The Cove, is certified LEED silver, and is 100% leased, and is in highdemand, especially among biotechnology companies. “Green” amenities for The Cove include, among other things, energy-efficientfeatures; recycling and composting programs; an outdoor sustainable garden in which tenants grow herbs and vegetables; acommon outdoor recreation area that includes sports courts; open green space; central air quality systems; bike racks; convenientaccess to public transportation; and a consultant that works with tenants to identify and encourage public transportation and energy-efficient commuting options for our tenants’ employees. We have heard from our tenants that these amenities make The Cove ahighly desirable property to lease. If we were unable to provide energy efficient space to those tenants that prefer it, and any of ourtenants chose to relocate due to a negative sustainability-related reputation associated with being unable to provide such space, itcould lessen the demand for our buildings resulting in reduced revenues. As an owner of properties across the U.S., this wouldsubstantively impact HCP financially and strategically, as it would affect our entire portfolio. It is therefore imperative that wemaintain and expand on our esteemed sustainability reputation by offering efficient green space, and retain those tenants thatprefer to lease such space.
Time horizonMedium-term
LikelihoodVery likely
Magnitude of impactHigh
Are you able to provide a potential financial impact figure?Yes, a single figure estimate
Potential financial impact figure (currency)304000000
Potential financial impact figure – minimum (currency)<Not Applicable>
Potential financial impact figure – maximum (currency)<Not Applicable>
Explanation of financial impact figureThe estimated financial implications from reduced demand for our buildings resulting in decreased rental revenue from lost tenantswould be significant. For example, we earned $1.51 billion in rental related revenues for those properties within our boundary in2018 . A 5% decrease from such lost tenants could cost us $76 million in lost revenues annually as compared to 2018, and over themedium-term (4 years, for example) could cost $304 million. We believe the inherent risk of shifts in consumer preferences, suchas tenants increasingly preferring to do business with sustainable companies offering efficient space to lease, will increase and hasthe potential to generate a substantive change in our revenues over time if not properly mitigated.
Management methodMethods we are using to manage the inherent reputational risk of being perceived as an unsustainable company driven by shifts inconsumer preferences who increasingly prefer to lease green space include pursuing LEED certifications and engaging tenants in
CDP Page of 4810
our sustainable business strategy though our annual tenant satisfaction survey. For example, HCP now requires all newdevelopments to be LEED certified, and at this time we are implementing an average of 3 developments and 3 redevelopments ayear. Additionally, in 2018 , our tenant satisfaction survey included several questions related to green Initiatives, including tenantsatisfaction with our commitment to sustainability, their likelihood of participating in our programs, how various initiatives wouldinfluence their rental decision and the importance of sustainability to their employees and customers. The implementation of thesemeasures and practices will appeal to those tenants who prefer to lease from sustainability-minded companies that offer efficientspace, and aid in maintaining our esteemed sustainability reputation among our tenants. We believe these actions are likely toreduce reputational risks driven by shifts in consumer preferences by solidifying our esteemed sustainability reputation to tenants.The costs associated with LEED certified properties can average about $500,000 (x6 a year), while the cost to administer ourannual tenant satisfaction survey is approximately $57,500.
Cost of management3057500
Comment
C2.4
(C2.4) Have you identified any climate-related opportunities with the potential to have a substantive financial or strategicimpact on your business?Yes
C2.4a
(C2.4a) Provide details of opportunities identified with the potential to have a substantive financial or strategic impact onyour business.
IdentifierOpp1
Where in the value chain does the opportunity occur?Direct operations
Opportunity typeProducts and services
Primary climate-related opportunity driverShift in consumer preferences
Type of financial impactIncreased revenue through demand for lower emissions products and services
Company-specific descriptionA climate-related opportunity identified by HCP driven by a shift in consumer preferences includes the increasing number of tenantswho consider efficient space as a key factor in their leasing and leasing renewal decisions. As an owner of healthcare real estateacross the U.S., this opportunity could pose a substantive impact on HCP in the way of increased lease revenue, through theincreased demand by and attraction of new tenants whose changing behavior in the way of combating climate change choose torelocate to our properties because of the sustainable features our buildings offer. For example, our life science property, The Covein San Francisco, CA, is certified LEED silver, 100% leased, and in high demand. Life Science properties in general are in highdemand in San Francisco, but feedback from current and potential tenants indicates a strong preferred and increasing interest inefficient space. “Green” amenities for The Cove include, among other things, energy-efficient features; recycling and compostingprograms; an outdoor sustainable garden in which tenants grow herbs and vegetables; a common outdoor recreation area thatincludes sports courts; open green space; central air quality systems; bike racks; convenient access to public transportation; and aconsultant that works with tenants to identify and encourage public transportation and energy-efficient commuting options for ourtenants’ employees. We have heard from our tenants that these amenities make The Cove a highly desirable property to lease.Additionally, such opportunity could also give us an advantage over those competitors that do not offer or do not offer as much ofthe efficient space increasingly desired by tenants.
Time horizonMedium-term
CDP Page of 4811
LikelihoodVery likely
Magnitude of impactHigh
Are you able to provide a potential financial impact figure?Yes, a single figure estimate
Potential financial impact figure (currency)76000000
Potential financial impact figure – minimum (currency)<Not Applicable>
Potential financial impact figure – maximum (currency)<Not Applicable>
Explanation of financial impact figureThe estimated financial impact includes increased lease revenue derived from the increased demand for efficient lower emissionbuildings. For example, we earned $1.51 billion in rental-related revenues within our boundary in 2018. A 5% increase in suchrevenue due to an increased demand for our sustainable buildings would result in an additional $76 million annually, and over themedium-term could generate hundreds of millions of dollars.
Strategy to realize opportunityThe strategy we are implementing to realize this opportunity includes systematically upgrading or replacing inefficient equipmentwith efficient equipment in our buildings. For example, in 2018, we implemented 243 projects to improve the efficiency of ourbuildings, including lighting retrofits and energy management systems, resulting in these buildings becoming a more efficientproduct. Additionally, we continue to pursue LEED certifications for our buildings, and to the greatest extent feasible, HCP requiresall new developments to be LEED certified. At this time, we are implementing about 3 developments and 3 redevelopments peryear. The 243 efficiency projects cost approximately $17 million, and the costs associated with LEED certifications is approximately$500,000 per building. If we are able to certify 6 buildings per year, it could cost us about $3 million annually. The LEEDcertification cost of $500,000 per building is based upon an average building size of 100,000 ft2 at $5 per sqft for high efficiencyHVAC equipment replacement and LED lighting replacement. Thus the cost to realize opportunity is calculated as follows: Cost =$17 million based on sustainability projects + $3 million for LEED certifications = $20 million.
Cost to realize opportunity20000000
Comment
IdentifierOpp2
Where in the value chain does the opportunity occur?Direct operations
Opportunity typeResource efficiency
Primary climate-related opportunity driverMove to more efficient buildings
Type of financial impactReduced operating costs (e.g., through efficiency gains and cost reductions)
Company-specific descriptionOpportunities identified by HCP that are driven by the use of more efficient buildings include reduced operating costs resulting fromthe efficiency gains and related cost savings generated from the installation and implementation of efficient equipment. As an ownerof healthcare real estate across the U.S., the efficient use of our natural resources is important to protect our planet and provide ouroperators and tenants with space that features efficient equipment. Additionally, as a publicly-traded company, the reducedoperating costs generated can improve our balance sheet, benefiting our shareholders. For example, HCP purchased renewableenergy sources for Medical City medical office building in Dallas, Texas. The renewable energy significantly lowers energy costsand reduces emissions. The lower operating costs make Medical City one of the more attractive medical office buildings for tenantsin that area.
Time horizonMedium-term
CDP Page of 4812
LikelihoodVirtually certain
Magnitude of impactMedium-high
Are you able to provide a potential financial impact figure?Yes, a single figure estimate
Potential financial impact figure (currency)6400000
Potential financial impact figure – minimum (currency)<Not Applicable>
Potential financial impact figure – maximum (currency)<Not Applicable>
Explanation of financial impact figureThe estimated financial implications resulting from use of more efficient equipment in our buildings include reduced energy usageand monthly bills resulting in reduced operating costs. For example, we spent $64.6 million in energy expenses on our boundaryproperties in 2018. A 10% decrease in such expenses due to savings incurred from the installation and implementation of efficientequipment (LED lighting, HVACs, etc.) could generate an additional $6.4 million annually, and over the medium-term (4 years) couldgenerate approximately $26 million.
Strategy to realize opportunityThe strategy we are implementing to realize this opportunity include systematically upgrading or replacing inefficient equipment withefficient equipment in our buildings. For example in 2018, we implemented 243 projects to improve the efficiency of our buildingsincluding lighting retrofits and energy management systems, resulting in these buildings becoming a more efficient product.Additionally, we continue to pursue LEED certifications for our buildings, and to the greatest extent feasible, HCP requires all newdevelopments to be LEED certified. At this time, we are implementing about 3 developments and 3 redevelopments a year. The 243efficiency projects cost approximately $17 million, and the costs associated with LEED certifications is approximately $500,000 perbuilding. If we are able to certify 6 buildings a year, it could cost us about $3 million annually. The LEED certification cost of$500,000 per building is based upon an average building size of 100,000 ft2 at $5 per sqft for high efficiency HVAC equipmentreplacement and LED lighting replacement. Thus, the cost to realize opportunity is calculated as follows: Cost = $17 million basedon sustainability projects + $3 million for LEED certifications = $20 million.
Cost to realize opportunity20000000
Comment
IdentifierOpp3
Where in the value chain does the opportunity occur?Direct operations
Opportunity typeProducts and services
Primary climate-related opportunity driverDevelopment and/or expansion of low emission goods and services
Type of financial impactBetter competitive position to reflect shifting consumer preferences, resulting in increased revenues
Company-specific descriptionA climate-related opportunity identified by HCP driven by the expansion of low emission goods (i.e., increasing the number ofefficient buildings we offer) includes the attraction of an increased number of tenants (and related lease revenue). If we can providemore efficient building leasing options than our competitors in direct response to the shifting (increasing) number of tenantspreferring to lease efficient space, we can capitalize from the tenants gained that choose to lease from us rather than ourcompetitors, due to our expanded efficient leasing options we offer that our competitors do not. As an owner of healthcare realestate across the U.S., this opportunity could pose a substantive impact on HCP, as a better competitive position which couldincrease our revenues. For example, HCP purchased renewable energy sources for Medical City medical office building in Dallas,Texas. The renewable energy significantly lowers energy costs and reduces emissions. The lower operating costs make MedicalCity one of the more attractive medical office buildings for tenants in that area.
CDP Page of 4813
Time horizonMedium-term
LikelihoodAbout as likely as not
Magnitude of impactMedium-high
Are you able to provide a potential financial impact figure?Yes, a single figure estimate
Potential financial impact figure (currency)30200000
Potential financial impact figure – minimum (currency)<Not Applicable>
Potential financial impact figure – maximum (currency)<Not Applicable>
Explanation of financial impact figureThe estimated financial impact from this opportunity includes increased revenue. For example, we earned approximately $1.51billion in operational revenue in 2018, and a 2% increase due to revenue from tenants gained over our competitors could generatean additional $30.2 million, and could generate hundreds of millions over time.
Strategy to realize opportunityThe strategy we are implementing to realize this opportunity include continuing to pursue LEED certifications for our buildings, andto the greatest extent feasible, HCP requires all new developments to be LEED certified, and at this time we are implementingabout 3 developments a year and 3 redevelopments a year. The costs associated with LEED certifications is approximately$500,000 per building. If we are able to certify 6 buildings a year, it could cost us about $3 million annually. The LEED certificationcost of $500,000 per building is based upon an average building size of 100,000 ft2 at $5 per sqft for high efficiency HVACequipment replacement and LED lighting replacement.
Cost to realize opportunity3000000
Comment
C2.5
(C2.5) Describe where and how the identified risks and opportunities have impacted your business.
Impact Description
Productsand services
Impacted Climate-related risks and opportunities have impacted the "products and services" (i.e., our buildings) area of our business, as both haveresulted in the implementation of energy and cost saving equipment at our properties, which decrease operating costs. The magnitude ofthe related impacts are high, as it affects our entire portfolio and ultimately our revenue.
Supply chainand/or valuechain
Impacted Climate-related risks and opportunities have impacted the supply chain (i.e., our building operators) area of our business, as both haveresulted in the implementation of energy and cost saving equipment at our properties, which decrease operating costs. The magnitude ofthe related impacts are high, as it affects our entire portfolio and ultimately our revenue.
Adaptationandmitigationactivities
Impacted Climate-related risks and opportunities have impacted the adaptation and mitigation activities area of our business, as both have resultedin the implementation of energy and cost saving equipment at our properties, which decrease operating costs. The magnitude of therelated impacts are high, as it affects our entire portfolio and ultimately our revenue.
Investmentin R&D
Notimpacted
This is not applicable to HCP as an owner of real estate that does not produce a product in the traditional sense.
Operations Impacted Climate-related risks and opportunities have impacted the supply chain (i.e., our building operators) area of our business, as both haveresulted in the implementation of energy and cost saving equipment at our properties, which decrease operating costs. The magnitude ofthe related impacts are high, as it affects our entire portfolio and ultimately our revenue.
Other,pleasespecify
Pleaseselect
CDP Page of 4814
C2.6
(C2.6) Describe where and how the identified risks and opportunities have been factored into your financial planningprocess.
Relevance Description
Revenues Impacted Climate-related risks and opportunities have factored into our financial planning process of the revenues area of our business, as bothhave resulted in the implementation of energy and cost saving equipment at our properties, which decrease operating costs. Themagnitude of the related impacts are high, as it affects our entire portfolio and ultimately our revenue.
Operatingcosts
Impacted Climate-related risks and opportunities have factored into our financial planning process of the operating costs area of our business, asboth have resulted in the implementation of energy and cost saving equipment at our properties, which decrease operating costs. Themagnitude of the related impacts are high, as it affects our entire portfolio and ultimately our revenue.
Capitalexpenditures/ capitalallocation
Impacted Climate-related risks and opportunities have factored into our financial planning process of the capital expenditures/capital allocation areaof our business, as both have resulted in the implementation of energy and cost saving equipment at our properties, which requiredincreasing our capital expenditure budget. The magnitude of the related impacts are high, as additional expenditures affects our balancesheet.
Acquisitionsanddivestments
Impacted Climate-related risks and opportunities have factored into our financial planning process of the acquisitions and divestments area of ourbusiness, as both have resulted in the consideration of efficiency and the savings generated when considering an acquisition. Themagnitude of the related impact is low, as there are several other considerations included when considering an acquisition.
Access tocapital
Notimpacted
Climate-related risks and opportunities have not impacted our access to capital as a real estate owner.
Assets Impacted Climate-related risks and opportunities have factored into our financial planning process of the assets area of our business, as both haveresulted in investments in our assets (our buildings) to make them more efficient. The magnitude of the related impacts are high, as theefficient operation of our assets (buildings) affect our operating costs and ultimately our revenue.
Liabilities Impacted Climate-related risks and opportunities have factored into our financial planning process of the liabilities area of our business, as bothhave resulted in investments in our assets (our buildings) as mitigation or realization strategies to lessen liabilities. The magnitude of therelated impacts are high, as the efficient operation of our assets (buildings) affect our operating costs and ultimately our revenue.
Other Pleaseselect
C3. Business Strategy
C3.1
(C3.1) Are climate-related issues integrated into your business strategy?Yes
C3.1a
(C3.1a) Does your organization use climate-related scenario analysis to inform your business strategy?No, but we anticipate doing so in the next two years
C3.1c
CDP Page of 4815
(C3.1c) Explain how climate-related issues are integrated into your business objectives and strategy.
(i) Climate-related issues have influenced and are integrated into our business strategy and objectives. Our business strategy is toinvest and manage our real estate portfolio for the long-term to maximize the benefit to our stakeholders and support the growth of ourbusiness, including our dividends. Maintaining a strong, flexible balance sheet, alignment with preferred operators and tenants, andenhancing our operational excellence are strategic objectives in support of our business strategy. The methods in which we investand manage our portfolio for the long-term are primarily driven by financial performance, but also include environmental performanceconsiderations - a specific adjustment to our business strategy directly influenced by climate-related issues. For example, installingenergy efficient equipment and technologies and ensuring that our buildings are managed with environmental efficiency in mind, aidsin reducing emissions while improving environmental performance and cost savings. Each of these outcomes support our strategy ofinvesting and managing our portfolio for the long-term as well as our objective to enhance operational excellence.
(ii) Business Strategy Linked to Emissions Reductions Target. Our strategy to invest in and manage our real estate portfolio for thelong-term includes the continued investments in our buildings to make them high-performing environmentally efficient buildings, andsuch high environmental performance is reliant upon reduced emissions. The energy efficient equipment and technologies in whichwe invest to achieve our business strategy reduces emissions, allowing us to meet our emissions reduction targets (annual and long-term), which represents a direct link between our business strategy and emissions reduction targets.
(iii) Substantial business decisions made influenced by climate change driven aspects of strategy. The most substantial businessdecision made during the reporting year that was influenced by the climate change driven aspects of our strategy was the decision toincrease our capex budget. The increase was to facilitate the implementation of more efficient upgrades at our buildings, which wasa direct result of the influence by the climate change driven aspect of our strategy.
C3.1g
(C3.1g) Why does your organization not use climate-related scenario analysis to inform your business strategy?
HCP is actively studying climate-related scenario analysis and how it might impact our business strategy, with the intention of usingclimate-relate scenario analysis in the next year or so. HCP's risk management is governed by an Enterprise Risk Management(ERM) framework with a materiality threshold that is determined as a percentage of our financial metrics. Historically, any climate-related risk has not exceeded that threshold and therefore, has not required more extensive scenario-based modeling.
C4. Targets and performance
C4.1
(C4.1) Did you have an emissions target that was active in the reporting year?Both absolute and intensity targets
C4.1a
CDP Page of 4816
(C4.1a) Provide details of your absolute emissions target(s) and progress made against those targets.
Target reference numberAbs 1
ScopeScope 1+2 (location-based)
% emissions in Scope95
Targeted % reduction from base year15
Base year2011
Start year2011
Base year emissions covered by target (metric tons CO2e)233194
Target year2020
Is this a science-based target?No, but we anticipate setting one in the next 2 years
% of target achieved100
Target statusAchieved
Please explainOur long-term goal is a 15% reduction in absolute emissions by 2020 from our 2011 baseline. Due to the acquisitions anddispositions affecting our portfolio annually on a quarterly basis, this goal is tracked by comparing rolling base year reductions year-over-year. To date, we have achieved a 26.8% reduction, surpassing our 2020 goal .
C4.1b
CDP Page of 4817
(C4.1b) Provide details of your emissions intensity target(s) and progress made against those target(s).
Target reference numberInt 1
ScopeScope 1+2 (location-based)
% emissions in Scope95
Targeted % reduction from base year15
MetricMetric tons CO2e per square foot*
Base year2011
Start year2011
Normalized base year emissions covered by target (metric tons CO2e)0.012985732
Target year2020
Is this a science-based target?No, but we anticipate setting one in the next 2 years
% of target achieved100
Target statusAchieved
Please explainOur long-term goal is a 15% reduction in emissions intensity by 2020 from our 2011 baseline. Due to the acquisitions anddispositions affecting our portfolio annually on a quarterly basis, this goal is tracked by comparing rolling base year reductions year-over-year, and to date we have achieved a 26.8% reduction, surpassing our 2020 goal.
% change anticipated in absolute Scope 1+2 emissions-26.8
% change anticipated in absolute Scope 3 emissions0
C4.2
(C4.2) Provide details of other key climate-related targets not already reported in question C4.1/a/b.
TargetWaste
KPI – Metric numeratormetric tonnes
KPI – Metric denominator (intensity targets only)N/A
Base year2011
Start year2011
CDP Page of 4818
Target year2020
KPI in baseline year16374
KPI in target year13918
% achieved in reporting year35
Target StatusUnderway
Please explainOur long-term goal is a 15% reduction in waste by 2020 from our 2011 baseline. Due to the acquisitions and dispositions affectingour portfolio annually on a quarterly basis, this goal is tracked by comparing rolling base year reductions year-over-year. To date,we have achieved a 5.26% reduction in waste, which represents 35% of our 2020 reduction goal.
Part of emissions targetN/A
Is this target part of an overarching initiative?No, it's not part of an overarching initiative
TargetEnergy usage
KPI – Metric numeratorkWh
KPI – Metric denominator (intensity targets only)N/A
Base year2011
Start year2011
Target year2020
KPI in baseline year493025000
KPI in target year419071250
% achieved in reporting year50
Target StatusUnderway
Please explainOur long-term goal is a 15% reduction in absolute energy usage by 2020 from our 2011 baseline. Due to the acquisitions anddispositions affecting our portfolio annually on a quarterly basis, this goal is tracked by comparing rolling base year reductions year-over-year. To date, we have achieved a 7.55% reduction in absolute energy usage, which represents 50% of our 2020 reductiongoal.
Part of emissions targetN/A
Is this target part of an overarching initiative?No, it's not part of an overarching initiative
Target
CDP Page of 4819
Energy usage
KPI – Metric numeratorkWh
KPI – Metric denominator (intensity targets only)ft2
Base year2011
Start year2011
Target year2020
KPI in baseline year27.593
KPI in target year23.454
% achieved in reporting year33
Target StatusUnderway
Please explainOur long-term goal is a 15% reduction in energy usage intensity by 2020 from our 2011 baseline. Due to the acquisitions anddispositions affecting our portfolio annually on a quarterly basis, this goal is tracked by comparing rolling base year reductions year-over-year. To date, we have achieved a 4.87% reduction in energy usage intensity, which represents 33% of our 2020 reductiongoal.
Part of emissions targetN/A
Is this target part of an overarching initiative?No, it's not part of an overarching initiative
C4.3
(C4.3) Did you have emissions reduction initiatives that were active within the reporting year? Note that this can includethose in the planning and/or implementation phases.Yes
C4.3a
(C4.3a) Identify the total number of initiatives at each stage of development, and for those in the implementation stages, theestimated CO2e savings.
Number of initiatives Total estimated annual CO2e savings in metric tonnes CO2e (only for rows marked *)
Under investigation 53
To be implemented* 53 4415
Implementation commenced* 91 2735
Implemented* 243 6276
Not to be implemented 0 0
CDP Page of 4820
C4.3b
(C4.3b) Provide details on the initiatives implemented in the reporting year in the table below.
Initiative typeEnergy efficiency: Building services
Description of initiativeLighting
Estimated annual CO2e savings (metric tonnes CO2e)49
ScopeScope 2 (location-based)
Voluntary/MandatoryVoluntary
Annual monetary savings (unit currency – as specified in C0.4)8977
Investment required (unit currency – as specified in C0.4)52042
Payback period4 - 10 years
Estimated lifetime of the initiative6-10 years
CommentLighting motion and occupancy sensor projects
Initiative typeEnergy efficiency: Building services
Description of initiativeHVAC
Estimated annual CO2e savings (metric tonnes CO2e)225
ScopeScope 2 (location-based)
Voluntary/MandatoryVoluntary
Annual monetary savings (unit currency – as specified in C0.4)45212
Investment required (unit currency – as specified in C0.4)361693
Payback period4 - 10 years
Estimated lifetime of the initiative11-15 years
CommentHVAC (building setback) projects
Initiative typeEnergy efficiency: Building services
Description of initiativeBuilding controls
CDP Page of 4821
Estimated annual CO2e savings (metric tonnes CO2e)15
ScopeScope 2 (location-based)
Voluntary/MandatoryVoluntary
Annual monetary savings (unit currency – as specified in C0.4)3068
Investment required (unit currency – as specified in C0.4)5910
Payback period1-3 years
Estimated lifetime of the initiative11-15 years
CommentProgrammable thermostat projects
Initiative typeEnergy efficiency: Building services
Description of initiativeBuilding controls
Estimated annual CO2e savings (metric tonnes CO2e)701
ScopeScope 2 (location-based)
Voluntary/MandatoryVoluntary
Annual monetary savings (unit currency – as specified in C0.4)134019
Investment required (unit currency – as specified in C0.4)970741
Payback period4 - 10 years
Estimated lifetime of the initiative11-15 years
CommentEnergy Management System projects
Initiative typeEnergy efficiency: Building services
Description of initiativeLighting
Estimated annual CO2e savings (metric tonnes CO2e)2410
ScopeScope 2 (location-based)
Voluntary/MandatoryVoluntary
Annual monetary savings (unit currency – as specified in C0.4)
CDP Page of 4822
480990
Investment required (unit currency – as specified in C0.4)3254948
Payback period4 - 10 years
Estimated lifetime of the initiative11-15 years
CommentLighting retrofit projects
Initiative typeEnergy efficiency: Building services
Description of initiativeOther, please specify (Variable Frequency Drives)
Estimated annual CO2e savings (metric tonnes CO2e)819
ScopeScope 2 (location-based)
Voluntary/MandatoryVoluntary
Annual monetary savings (unit currency – as specified in C0.4)164460
Investment required (unit currency – as specified in C0.4)451652
Payback period1-3 years
Estimated lifetime of the initiative11-15 years
CommentApplication of Variable Frequency Drives (VFDs)
Initiative typeEnergy efficiency: Building services
Description of initiativeHVAC
Estimated annual CO2e savings (metric tonnes CO2e)390
ScopeScope 2 (location-based)
Voluntary/MandatoryVoluntary
Annual monetary savings (unit currency – as specified in C0.4)81694
Investment required (unit currency – as specified in C0.4)403085
Payback period4 - 10 years
Estimated lifetime of the initiative11-15 years
CDP Page of 4823
CommentHVAC equipment replacement projects (under 10 tons). Note: Investment required is the premium cost for a high efficiencyreplacement over a standard efficiency unit.
Initiative typeEnergy efficiency: Building services
Description of initiativeHVAC
Estimated annual CO2e savings (metric tonnes CO2e)1489
ScopeScope 2 (location-based)
Voluntary/MandatoryVoluntary
Annual monetary savings (unit currency – as specified in C0.4)272314
Investment required (unit currency – as specified in C0.4)1061357
Payback period4 - 10 years
Estimated lifetime of the initiative16-20 years
CommentHVAC equipment replacement projects (over 10 tons). Note: Investment required is the premium cost for a high efficiencyreplacement over a standard efficiency unit.
Initiative typeEnergy efficiency: Processes
Description of initiativeCombined heat and power
Estimated annual CO2e savings (metric tonnes CO2e)14
ScopeScope 1
Voluntary/MandatoryVoluntary
Annual monetary savings (unit currency – as specified in C0.4)2376
Investment required (unit currency – as specified in C0.4)24254
Payback period4 - 10 years
Estimated lifetime of the initiative16-20 years
CommentBoiler replacement projects. Note: Investment required is the premium cost for a high efficiency replacement over a standardefficiency unit.
Initiative typeEnergy efficiency: Building fabric
CDP Page of 4824
Description of initiativeOther, please specify (White/Reflective surface roof projects)
Estimated annual CO2e savings (metric tonnes CO2e)40
ScopeScope 2 (location-based)
Voluntary/MandatoryVoluntary
Annual monetary savings (unit currency – as specified in C0.4)10930
Investment required (unit currency – as specified in C0.4)0
Payback period<1 year
Estimated lifetime of the initiative16-20 years
CommentWhite and/or reflective surface roof projects. Note: Investment required is the premium cost for a high efficiency replacement over astandard efficiency unit. Since there is no premium costs for a white/reflective roof, the investment for energy savings is zero.
Initiative typeEnergy efficiency: Building services
Description of initiativeOther, please specify (Window tint and sealant projects)
Estimated annual CO2e savings (metric tonnes CO2e)124
ScopeScope 2 (location-based)
Voluntary/MandatoryVoluntary
Annual monetary savings (unit currency – as specified in C0.4)24813
Investment required (unit currency – as specified in C0.4)191716
Payback period4 - 10 years
Estimated lifetime of the initiative11-15 years
CommentWindow tint and sealant projects
C4.3c
CDP Page of 4825
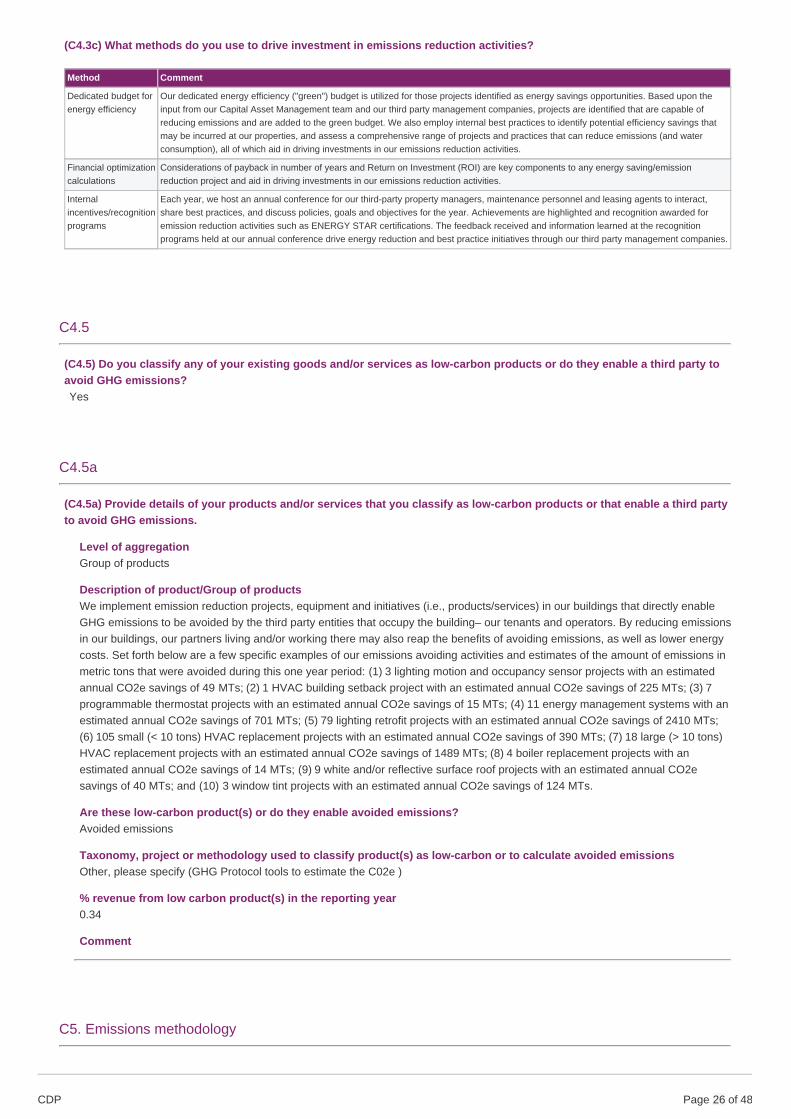
(C4.3c) What methods do you use to drive investment in emissions reduction activities?
Method Comment
Dedicated budget forenergy efficiency
Our dedicated energy efficiency ("green") budget is utilized for those projects identified as energy savings opportunities. Based upon theinput from our Capital Asset Management team and our third party management companies, projects are identified that are capable ofreducing emissions and are added to the green budget. We also employ internal best practices to identify potential efficiency savings thatmay be incurred at our properties, and assess a comprehensive range of projects and practices that can reduce emissions (and waterconsumption), all of which aid in driving investments in our emissions reduction activities.
Financial optimizationcalculations
Considerations of payback in number of years and Return on Investment (ROI) are key components to any energy saving/emissionreduction project and aid in driving investments in our emissions reduction activities.
Internalincentives/recognitionprograms
Each year, we host an annual conference for our third-party property managers, maintenance personnel and leasing agents to interact,share best practices, and discuss policies, goals and objectives for the year. Achievements are highlighted and recognition awarded foremission reduction activities such as ENERGY STAR certifications. The feedback received and information learned at the recognitionprograms held at our annual conference drive energy reduction and best practice initiatives through our third party management companies.
C4.5
(C4.5) Do you classify any of your existing goods and/or services as low-carbon products or do they enable a third party toavoid GHG emissions?Yes
C4.5a
(C4.5a) Provide details of your products and/or services that you classify as low-carbon products or that enable a third partyto avoid GHG emissions.
Level of aggregationGroup of products
Description of product/Group of productsWe implement emission reduction projects, equipment and initiatives (i.e., products/services) in our buildings that directly enableGHG emissions to be avoided by the third party entities that occupy the building– our tenants and operators. By reducing emissionsin our buildings, our partners living and/or working there may also reap the benefits of avoiding emissions, as well as lower energycosts. Set forth below are a few specific examples of our emissions avoiding activities and estimates of the amount of emissions inmetric tons that were avoided during this one year period: (1) 3 lighting motion and occupancy sensor projects with an estimatedannual CO2e savings of 49 MTs; (2) 1 HVAC building setback project with an estimated annual CO2e savings of 225 MTs; (3) 7programmable thermostat projects with an estimated annual CO2e savings of 15 MTs; (4) 11 energy management systems with anestimated annual CO2e savings of 701 MTs; (5) 79 lighting retrofit projects with an estimated annual CO2e savings of 2410 MTs;(6) 105 small (< 10 tons) HVAC replacement projects with an estimated annual CO2e savings of 390 MTs; (7) 18 large (> 10 tons)HVAC replacement projects with an estimated annual CO2e savings of 1489 MTs; (8) 4 boiler replacement projects with anestimated annual CO2e savings of 14 MTs; (9) 9 white and/or reflective surface roof projects with an estimated annual CO2esavings of 40 MTs; and (10) 3 window tint projects with an estimated annual CO2e savings of 124 MTs.
Are these low-carbon product(s) or do they enable avoided emissions?Avoided emissions
Taxonomy, project or methodology used to classify product(s) as low-carbon or to calculate avoided emissionsOther, please specify (GHG Protocol tools to estimate the C02e )
% revenue from low carbon product(s) in the reporting year0.34
Comment
C5. Emissions methodology
CDP Page of 4826
C5.1
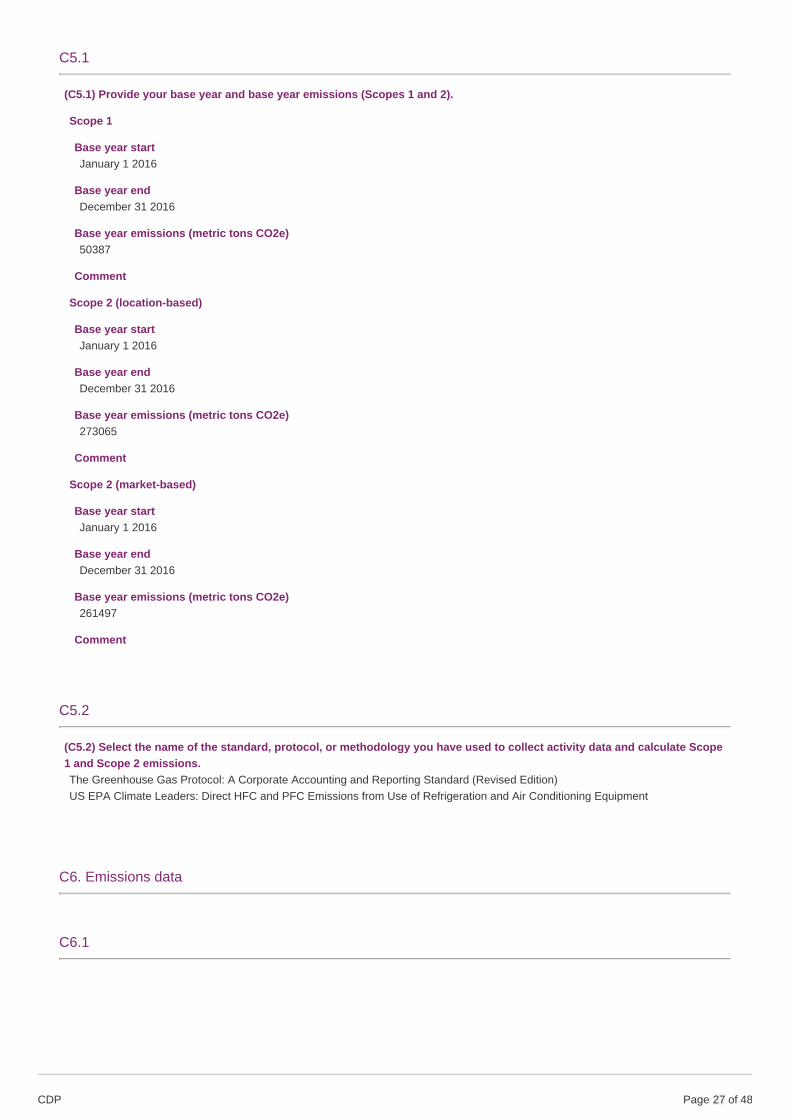
(C5.1) Provide your base year and base year emissions (Scopes 1 and 2).
Scope 1
Base year startJanuary 1 2016
Base year endDecember 31 2016
Base year emissions (metric tons CO2e)50387
Comment
Scope 2 (location-based)
Base year startJanuary 1 2016
Base year endDecember 31 2016
Base year emissions (metric tons CO2e)273065
Comment
Scope 2 (market-based)
Base year startJanuary 1 2016
Base year endDecember 31 2016
Base year emissions (metric tons CO2e)261497
Comment
C5.2
(C5.2) Select the name of the standard, protocol, or methodology you have used to collect activity data and calculate Scope1 and Scope 2 emissions.The Greenhouse Gas Protocol: A Corporate Accounting and Reporting Standard (Revised Edition)US EPA Climate Leaders: Direct HFC and PFC Emissions from Use of Refrigeration and Air Conditioning Equipment
C6. Emissions data
C6.1
CDP Page of 4827
(C6.1) What were your organization’s gross global Scope 1 emissions in metric tons CO2e?
Reporting year
Gross global Scope 1 emissions (metric tons CO2e)54260
Start dateJanuary 1 2018
End dateDecember 31 2018
Comment
C6.2
(C6.2) Describe your organization’s approach to reporting Scope 2 emissions.
Row 1
Scope 2, location-basedWe are reporting a Scope 2, location-based figure
Scope 2, market-basedWe are reporting a Scope 2, market-based figure
Comment
C6.3
(C6.3) What were your organization’s gross global Scope 2 emissions in metric tons CO2e?
Reporting year
Scope 2, location-based224905.77
Scope 2, market-based (if applicable)20225.77
Start dateJanuary 1 2018
End dateDecember 31 2018
Comment
C6.4
(C6.4) Are there any sources (e.g. facilities, specific GHGs, activities, geographies, etc.) of Scope 1 and Scope 2 emissionsthat are within your selected reporting boundary which are not included in your disclosure?No
C6.5
(C6.5) Account for your organization’s Scope 3 emissions, disclosing and explaining any exclusions.
CDP Page of 4828
Purchased goods and services
Evaluation statusNot relevant, explanation provided
Metric tonnes CO2e<Not Applicable>
Emissions calculation methodology<Not Applicable>
Percentage of emissions calculated using data obtained from suppliers or value chain partners<Not Applicable>
ExplanationAs a real estate owner, purchased goods and services comprise supplies for our corporate office, which is insignificant as weemploy only 201 people.
Capital goods
Evaluation statusNot relevant, explanation provided
Metric tonnes CO2e<Not Applicable>
Emissions calculation methodology<Not Applicable>
Percentage of emissions calculated using data obtained from suppliers or value chain partners<Not Applicable>
ExplanationHCP does not own capital goods outside of those already accounted for in Scope 1 and/or Scope 2 emissions
Fuel-and-energy-related activities (not included in Scope 1 or 2)
Evaluation statusNot relevant, explanation provided
Metric tonnes CO2e<Not Applicable>
Emissions calculation methodology<Not Applicable>
Percentage of emissions calculated using data obtained from suppliers or value chain partners<Not Applicable>
ExplanationHCP is an owner of real estate and does not purchase fuels outside of those already accounted for in Scope 1 and/or Scope 2emissions
Upstream transportation and distribution
Evaluation statusNot relevant, explanation provided
Metric tonnes CO2e<Not Applicable>
Emissions calculation methodology<Not Applicable>
Percentage of emissions calculated using data obtained from suppliers or value chain partners<Not Applicable>
ExplanationHCP is an owner of real estate and does not produce goods that require upstream transportation or distribution.
CDP Page of 4829
Waste generated in operations
Evaluation statusRelevant, calculated
Metric tonnes CO2e10355
Emissions calculation methodologyUsing the waste reduction model (WARM) Version 14 for landfill waste of 27,062 metric tons (29,831 short tons), the Scope 3emissions were calculated using the mixed solid waste (MSW) category. The Scope 3 emissions were 10,355 metric tons CO2e.
Percentage of emissions calculated using data obtained from suppliers or value chain partners100
Explanation
Business travel
Evaluation statusRelevant, calculated
Metric tonnes CO2e17971.3
Emissions calculation methodologyWe used the GHG Protocol Calculator (https://ghgprotocol.org/sites/default/files/Transport_Tool_v2_6.xlsx) to calculate the totalmetric tonnes CO2e associated with business travel. There were a total 98 employees who traveled a total of 1,069,462 miles oncommercial aircraft in 2018.
Percentage of emissions calculated using data obtained from suppliers or value chain partners100
Explanation
Employee commuting
Evaluation statusRelevant, calculated
Metric tonnes CO2e613
Emissions calculation methodologyHCP’s methodology for calculating its Scope 3 emissions for employee commuting is based on an estimate of annual distancetraveled by employees during their commute to HCP. Upon surveying our employees, we estimate that the average commutingdistance for each employee is 16.5 miles (one-way), which results in a total commuting distance of 33 miles per day. In addition,estimated that our employees work a total of 47 weeks per year, which assumes a five-day work week and does not include daysnot worked due to vacation, sick time and holidays. Based on these estimates, HCP calculates that each employee commutes atotal of 7,755 miles per year (i.e., 33 miles per day x 5 days per week x 47 weeks). Consequently, to calculate the CO2e emissionsbased on the annual distance traveled by employees during their commute to HCP, we utilized the GHG Protocol Emissions fromMobile Sources Tool (World Resources Institute, 2013, GHG Protocol tool for mobile combustion, version 2.5) and inputted 7,755miles per year and 23 miles per gallon for a passenger car (gasoline powered – Year 2005 to present) resulting in a calculation of3.05 metric tonnes CO2e per employee (excluding biofuel CO2). Multiplying this result by the number of HCP employees (201 )results in total emissions of 613 metric tonnes CO2e. This total likely overestimates HCP’s Scope 3 emissions for employeecommuting given that it assumes 100% of employees commute to work via passenger car, and that each employee alwayscommutes alone to work.
Percentage of emissions calculated using data obtained from suppliers or value chain partners0
Explanation
CDP Page of 4830
Upstream leased assets
Evaluation statusRelevant, calculated
Metric tonnes CO2e195.91
Emissions calculation methodologyThere were 3 properties leased in 2018: Centerview (Irvine), Foster City (SF), and Nashville. The 2018 electricity usage forCenterview was 3,466,986 kWh and Foster City was 24,338 kwh. Based on the national Subregion Output Emission Rates(eGRID2016) (https://www.epa.gov/sites/production/files/2018-02/documents/egrid2016_summarytables.pdf), the national averageof CO2e 1,004.2 lb/MWh, we calculated GHG to be 130.114 MTCO2e for Centerview and 11.085 MTCO2e for Foster City. Wecalculated an intensity based off of their gross square footage of 56,036 square feet and got 0.00252 MTCO2e/sqft. We used thisrate to estimate the GHG for Nashville (0.00252 x 21,713 square feet = 54.712 MTCO2e) to reach out total of 195.91 MTCO2e.
Percentage of emissions calculated using data obtained from suppliers or value chain partners72
Explanation
Downstream transportation and distribution
Evaluation statusNot relevant, explanation provided
Metric tonnes CO2e<Not Applicable>
Emissions calculation methodology<Not Applicable>
Percentage of emissions calculated using data obtained from suppliers or value chain partners<Not Applicable>
ExplanationHCP is an owner of real estate and does not produce goods that require downstream transportation or distribution.
Processing of sold products
Evaluation statusNot relevant, explanation provided
Metric tonnes CO2e<Not Applicable>
Emissions calculation methodology<Not Applicable>
Percentage of emissions calculated using data obtained from suppliers or value chain partners<Not Applicable>
ExplanationHCP is an owner of real estate and does not process sold products.
Use of sold products
Evaluation statusNot relevant, explanation provided
Metric tonnes CO2e<Not Applicable>
Emissions calculation methodology<Not Applicable>
Percentage of emissions calculated using data obtained from suppliers or value chain partners<Not Applicable>
ExplanationHCP is an owner of real estate and does not sell products.
CDP Page of 4831
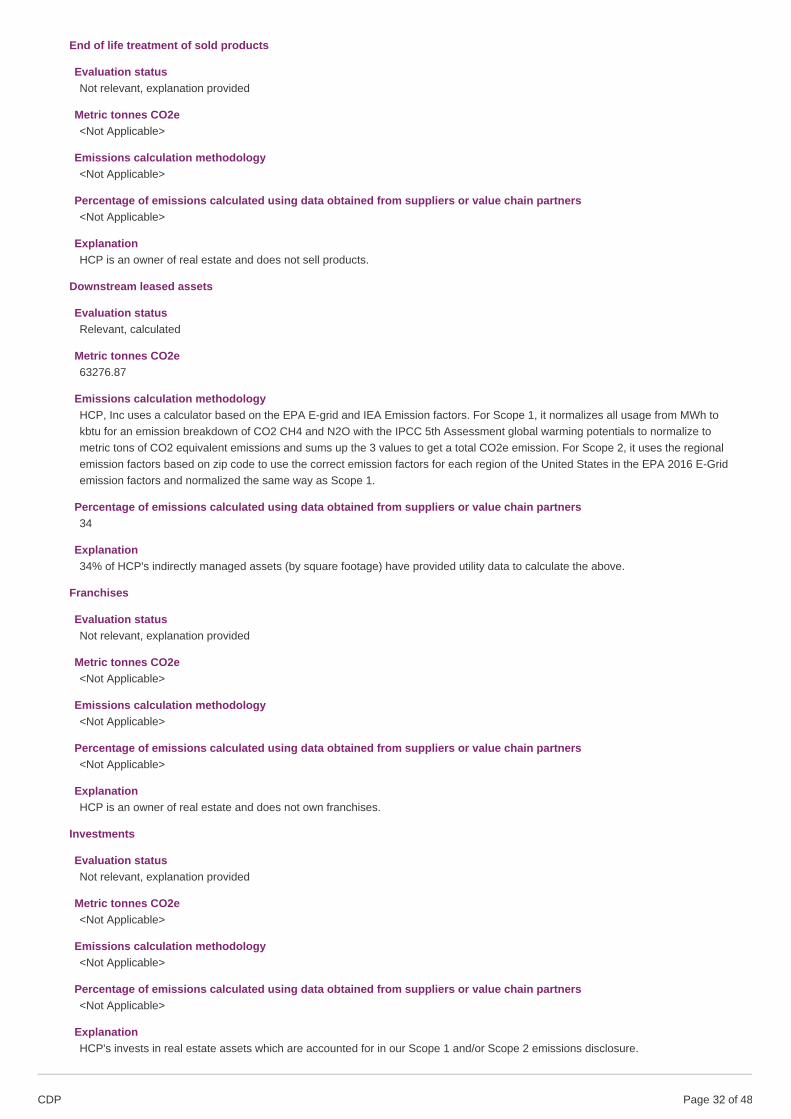
End of life treatment of sold products
Evaluation statusNot relevant, explanation provided
Metric tonnes CO2e<Not Applicable>
Emissions calculation methodology<Not Applicable>
Percentage of emissions calculated using data obtained from suppliers or value chain partners<Not Applicable>
ExplanationHCP is an owner of real estate and does not sell products.
Downstream leased assets
Evaluation statusRelevant, calculated
Metric tonnes CO2e63276.87
Emissions calculation methodologyHCP, Inc uses a calculator based on the EPA E-grid and IEA Emission factors. For Scope 1, it normalizes all usage from MWh tokbtu for an emission breakdown of CO2 CH4 and N2O with the IPCC 5th Assessment global warming potentials to normalize tometric tons of CO2 equivalent emissions and sums up the 3 values to get a total CO2e emission. For Scope 2, it uses the regionalemission factors based on zip code to use the correct emission factors for each region of the United States in the EPA 2016 E-Gridemission factors and normalized the same way as Scope 1.
Percentage of emissions calculated using data obtained from suppliers or value chain partners34
Explanation34% of HCP's indirectly managed assets (by square footage) have provided utility data to calculate the above.
Franchises
Evaluation statusNot relevant, explanation provided
Metric tonnes CO2e<Not Applicable>
Emissions calculation methodology<Not Applicable>
Percentage of emissions calculated using data obtained from suppliers or value chain partners<Not Applicable>
ExplanationHCP is an owner of real estate and does not own franchises.
Investments
Evaluation statusNot relevant, explanation provided
Metric tonnes CO2e<Not Applicable>
Emissions calculation methodology<Not Applicable>
Percentage of emissions calculated using data obtained from suppliers or value chain partners<Not Applicable>
ExplanationHCP's invests in real estate assets which are accounted for in our Scope 1 and/or Scope 2 emissions disclosure.
CDP Page of 4832
Other (upstream)
Evaluation statusNot relevant, explanation provided
Metric tonnes CO2e<Not Applicable>
Emissions calculation methodology<Not Applicable>
Percentage of emissions calculated using data obtained from suppliers or value chain partners<Not Applicable>
ExplanationNone identified.
Other (downstream)
Evaluation statusNot relevant, explanation provided
Metric tonnes CO2e<Not Applicable>
Emissions calculation methodology<Not Applicable>
Percentage of emissions calculated using data obtained from suppliers or value chain partners<Not Applicable>
ExplanationNone identified.
C6.7
(C6.7) Are carbon dioxide emissions from biologically sequestered carbon relevant to your organization?No
C6.10
CDP Page of 4833
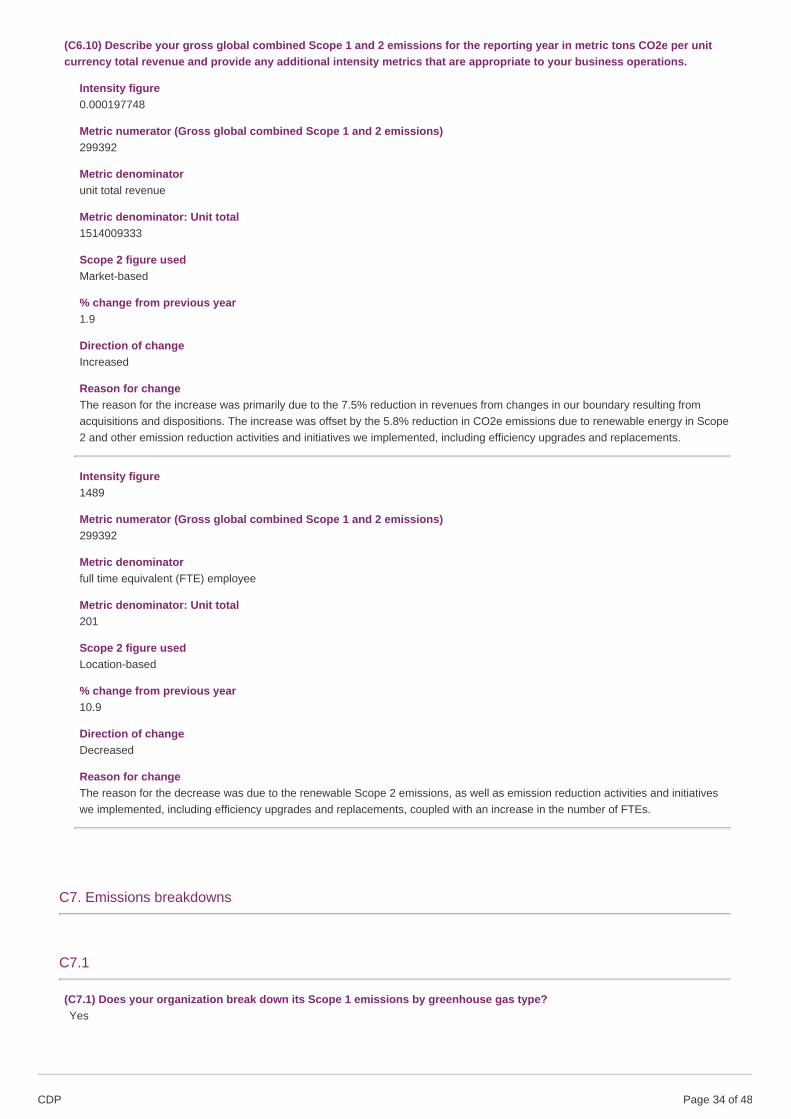
(C6.10) Describe your gross global combined Scope 1 and 2 emissions for the reporting year in metric tons CO2e per unitcurrency total revenue and provide any additional intensity metrics that are appropriate to your business operations.
Intensity figure0.000197748
Metric numerator (Gross global combined Scope 1 and 2 emissions)299392
Metric denominatorunit total revenue
Metric denominator: Unit total1514009333
Scope 2 figure usedMarket-based
% change from previous year1.9
Direction of changeIncreased
Reason for changeThe reason for the increase was primarily due to the 7.5% reduction in revenues from changes in our boundary resulting fromacquisitions and dispositions. The increase was offset by the 5.8% reduction in CO2e emissions due to renewable energy in Scope2 and other emission reduction activities and initiatives we implemented, including efficiency upgrades and replacements.
Intensity figure1489
Metric numerator (Gross global combined Scope 1 and 2 emissions)299392
Metric denominatorfull time equivalent (FTE) employee
Metric denominator: Unit total201
Scope 2 figure usedLocation-based
% change from previous year10.9
Direction of changeDecreased
Reason for changeThe reason for the decrease was due to the renewable Scope 2 emissions, as well as emission reduction activities and initiativeswe implemented, including efficiency upgrades and replacements, coupled with an increase in the number of FTEs.
C7. Emissions breakdowns
C7.1
(C7.1) Does your organization break down its Scope 1 emissions by greenhouse gas type?Yes
CDP Page of 4834
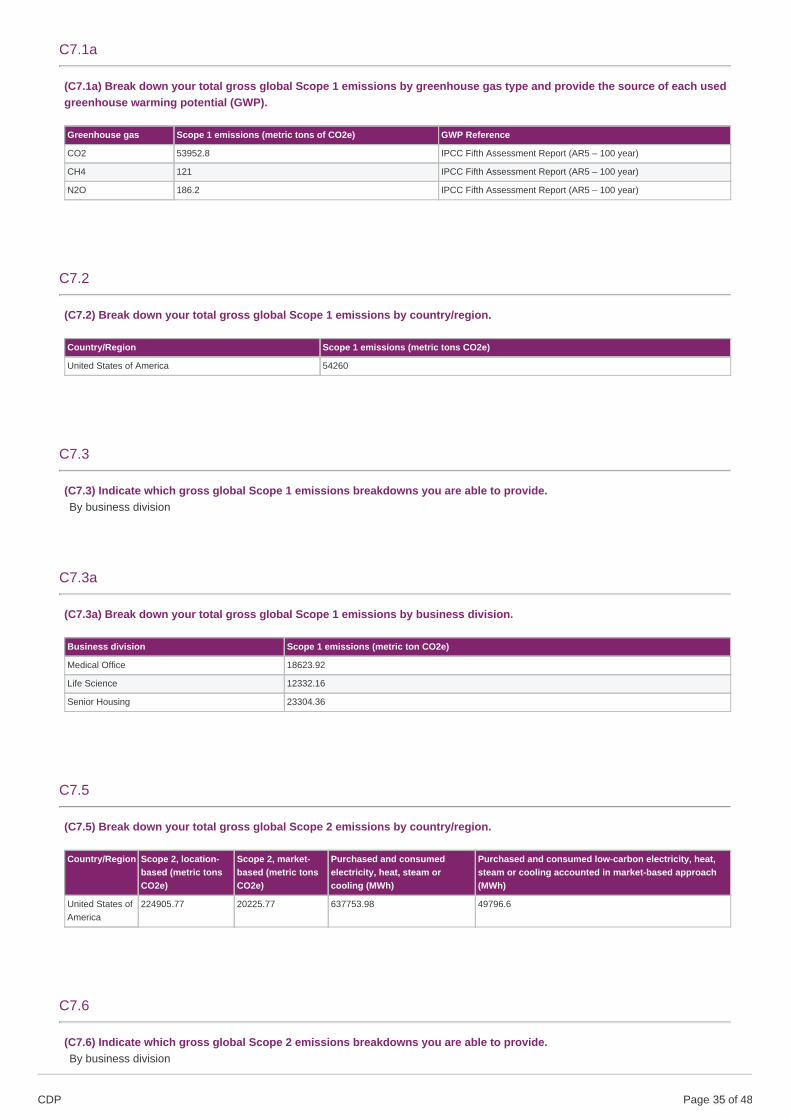
C7.1a
(C7.1a) Break down your total gross global Scope 1 emissions by greenhouse gas type and provide the source of each usedgreenhouse warming potential (GWP).
Greenhouse gas Scope 1 emissions (metric tons of CO2e) GWP Reference
CO2 53952.8 IPCC Fifth Assessment Report (AR5 – 100 year)
CH4 121 IPCC Fifth Assessment Report (AR5 – 100 year)
N2O 186.2 IPCC Fifth Assessment Report (AR5 – 100 year)
C7.2
(C7.2) Break down your total gross global Scope 1 emissions by country/region.
Country/Region Scope 1 emissions (metric tons CO2e)
United States of America 54260
C7.3
(C7.3) Indicate which gross global Scope 1 emissions breakdowns you are able to provide.By business division
C7.3a
(C7.3a) Break down your total gross global Scope 1 emissions by business division.
Business division Scope 1 emissions (metric ton CO2e)
Medical Office 18623.92
Life Science 12332.16
Senior Housing 23304.36
C7.5
(C7.5) Break down your total gross global Scope 2 emissions by country/region.
Country/Region Scope 2, location-based (metric tonsCO2e)
Scope 2, market-based (metric tonsCO2e)
Purchased and consumedelectricity, heat, steam orcooling (MWh)
Purchased and consumed low-carbon electricity, heat,steam or cooling accounted in market-based approach(MWh)
United States ofAmerica
224905.77 20225.77 637753.98 49796.6
C7.6
(C7.6) Indicate which gross global Scope 2 emissions breakdowns you are able to provide.By business division
CDP Page of 4835
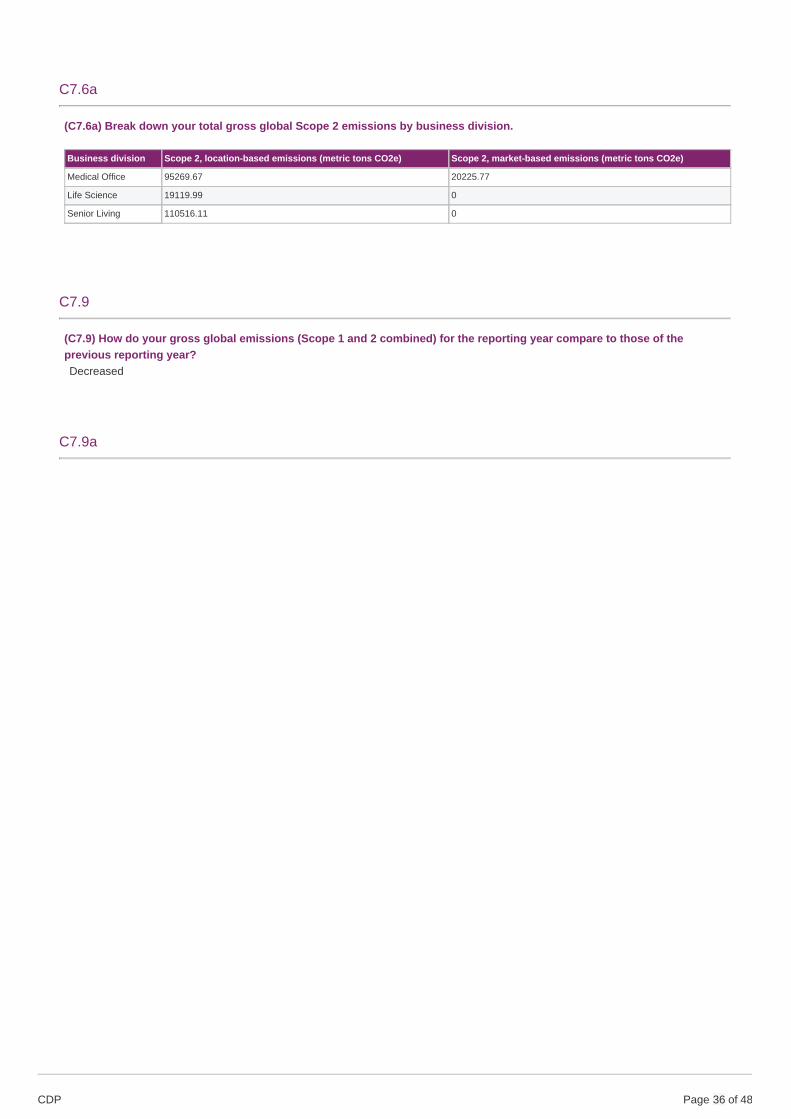
C7.6a
(C7.6a) Break down your total gross global Scope 2 emissions by business division.
Business division Scope 2, location-based emissions (metric tons CO2e) Scope 2, market-based emissions (metric tons CO2e)
Medical Office 95269.67 20225.77
Life Science 19119.99 0
Senior Living 110516.11 0
C7.9
(C7.9) How do your gross global emissions (Scope 1 and 2 combined) for the reporting year compare to those of theprevious reporting year?Decreased
C7.9a
CDP Page of 4836
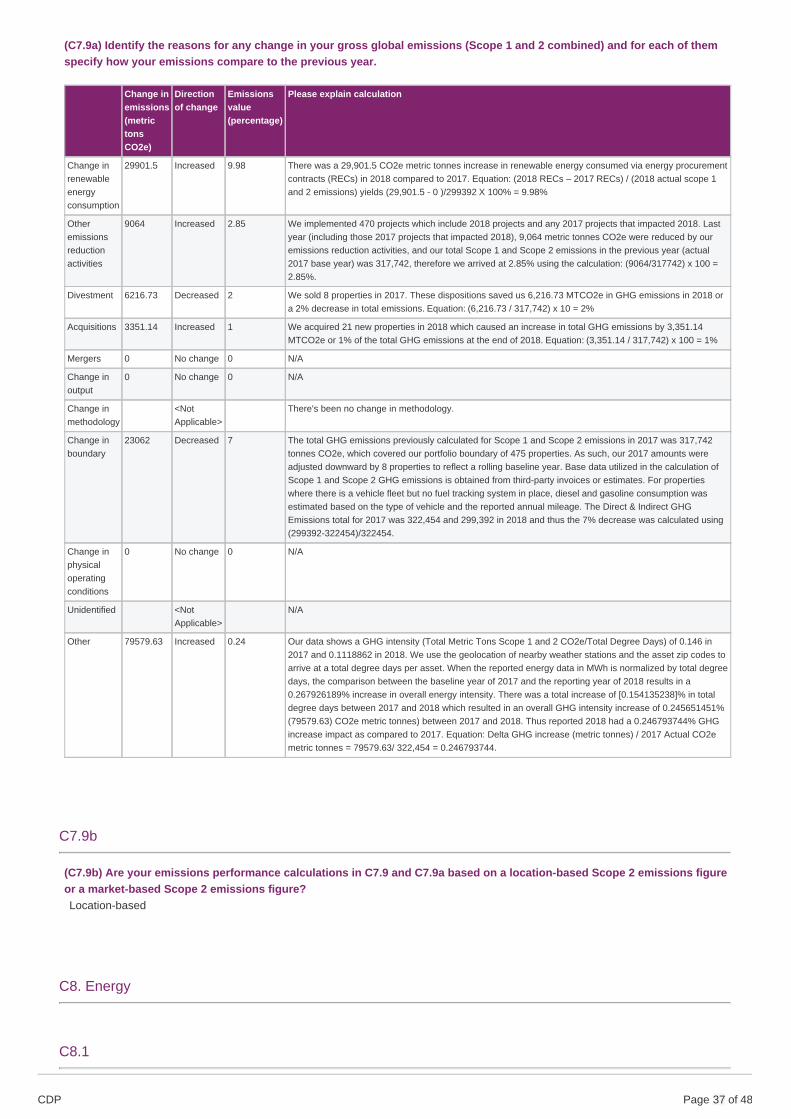
(C7.9a) Identify the reasons for any change in your gross global emissions (Scope 1 and 2 combined) and for each of themspecify how your emissions compare to the previous year.
Change inemissions(metrictonsCO2e)
Directionof change
Emissionsvalue(percentage)
Please explain calculation
Change inrenewableenergyconsumption
29901.5 Increased 9.98 There was a 29,901.5 CO2e metric tonnes increase in renewable energy consumed via energy procurementcontracts (RECs) in 2018 compared to 2017. Equation: (2018 RECs – 2017 RECs) / (2018 actual scope 1and 2 emissions) yields (29,901.5 - 0 )/299392 X 100% = 9.98%
Otheremissionsreductionactivities
9064 Increased 2.85 We implemented 470 projects which include 2018 projects and any 2017 projects that impacted 2018. Lastyear (including those 2017 projects that impacted 2018), 9,064 metric tonnes CO2e were reduced by ouremissions reduction activities, and our total Scope 1 and Scope 2 emissions in the previous year (actual2017 base year) was 317,742, therefore we arrived at 2.85% using the calculation: (9064/317742) x 100 =2.85%.
Divestment 6216.73 Decreased 2 We sold 8 properties in 2017. These dispositions saved us 6,216.73 MTCO2e in GHG emissions in 2018 ora 2% decrease in total emissions. Equation: (6,216.73 / 317,742) x 10 = 2%
Acquisitions 3351.14 Increased 1 We acquired 21 new properties in 2018 which caused an increase in total GHG emissions by 3,351.14MTCO2e or 1% of the total GHG emissions at the end of 2018. Equation: (3,351.14 / 317,742) x 100 = 1%
Mergers 0 No change 0 N/A
Change inoutput
0 No change 0 N/A
Change inmethodology
<NotApplicable>
There's been no change in methodology.
Change inboundary
23062 Decreased 7 The total GHG emissions previously calculated for Scope 1 and Scope 2 emissions in 2017 was 317,742tonnes CO2e, which covered our portfolio boundary of 475 properties. As such, our 2017 amounts wereadjusted downward by 8 properties to reflect a rolling baseline year. Base data utilized in the calculation ofScope 1 and Scope 2 GHG emissions is obtained from third-party invoices or estimates. For propertieswhere there is a vehicle fleet but no fuel tracking system in place, diesel and gasoline consumption wasestimated based on the type of vehicle and the reported annual mileage. The Direct & Indirect GHGEmissions total for 2017 was 322,454 and 299,392 in 2018 and thus the 7% decrease was calculated using(299392-322454)/322454.
Change inphysicaloperatingconditions
0 No change 0 N/A
Unidentified <NotApplicable>
N/A
Other 79579.63 Increased 0.24 Our data shows a GHG intensity (Total Metric Tons Scope 1 and 2 CO2e/Total Degree Days) of 0.146 in2017 and 0.1118862 in 2018. We use the geolocation of nearby weather stations and the asset zip codes toarrive at a total degree days per asset. When the reported energy data in MWh is normalized by total degreedays, the comparison between the baseline year of 2017 and the reporting year of 2018 results in a0.267926189% increase in overall energy intensity. There was a total increase of [0.154135238]% in totaldegree days between 2017 and 2018 which resulted in an overall GHG intensity increase of 0.245651451%(79579.63) CO2e metric tonnes) between 2017 and 2018. Thus reported 2018 had a 0.246793744% GHGincrease impact as compared to 2017. Equation: Delta GHG increase (metric tonnes) / 2017 Actual CO2emetric tonnes = 79579.63/ 322,454 = 0.246793744.
C7.9b
(C7.9b) Are your emissions performance calculations in C7.9 and C7.9a based on a location-based Scope 2 emissions figureor a market-based Scope 2 emissions figure?Location-based
C8. Energy
C8.1
CDP Page of 4837
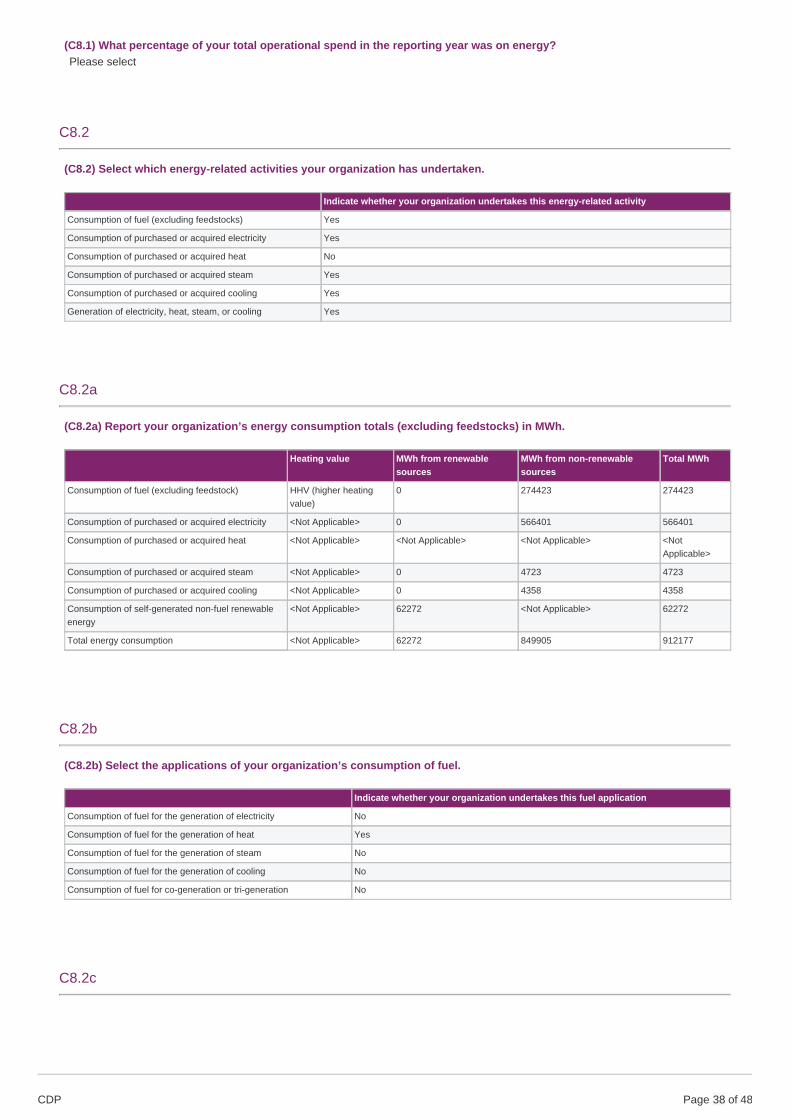
(C8.1) What percentage of your total operational spend in the reporting year was on energy?Please select
C8.2
(C8.2) Select which energy-related activities your organization has undertaken.
Indicate whether your organization undertakes this energy-related activity
Consumption of fuel (excluding feedstocks) Yes
Consumption of purchased or acquired electricity Yes
Consumption of purchased or acquired heat No
Consumption of purchased or acquired steam Yes
Consumption of purchased or acquired cooling Yes
Generation of electricity, heat, steam, or cooling Yes
C8.2a
(C8.2a) Report your organization’s energy consumption totals (excluding feedstocks) in MWh.
Heating value MWh from renewablesources
MWh from non-renewablesources
Total MWh
Consumption of fuel (excluding feedstock) HHV (higher heatingvalue)
0 274423 274423
Consumption of purchased or acquired electricity <Not Applicable> 0 566401 566401
Consumption of purchased or acquired heat <Not Applicable> <Not Applicable> <Not Applicable> <NotApplicable>
Consumption of purchased or acquired steam <Not Applicable> 0 4723 4723
Consumption of purchased or acquired cooling <Not Applicable> 0 4358 4358
Consumption of self-generated non-fuel renewableenergy
<Not Applicable> 62272 <Not Applicable> 62272
Total energy consumption <Not Applicable> 62272 849905 912177
C8.2b
(C8.2b) Select the applications of your organization’s consumption of fuel.
Indicate whether your organization undertakes this fuel application
Consumption of fuel for the generation of electricity No
Consumption of fuel for the generation of heat Yes
Consumption of fuel for the generation of steam No
Consumption of fuel for the generation of cooling No
Consumption of fuel for co-generation or tri-generation No
C8.2c
CDP Page of 4838
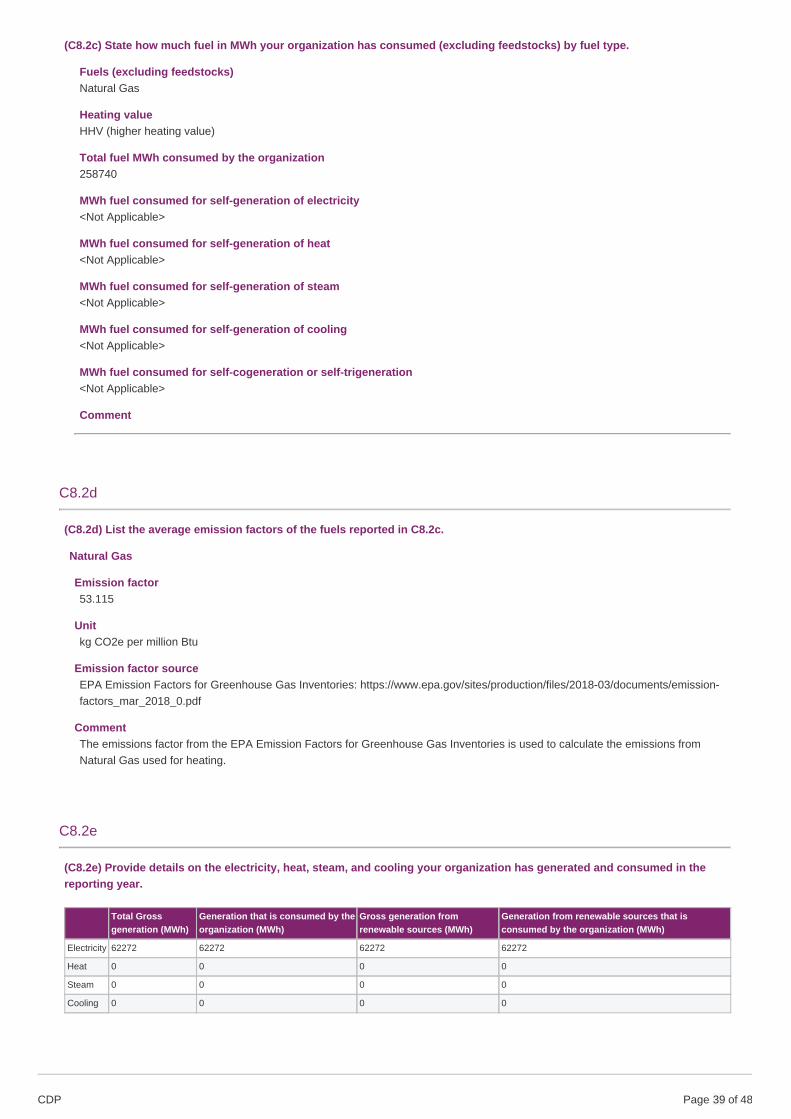
(C8.2c) State how much fuel in MWh your organization has consumed (excluding feedstocks) by fuel type.
Fuels (excluding feedstocks)Natural Gas
Heating valueHHV (higher heating value)
Total fuel MWh consumed by the organization258740
MWh fuel consumed for self-generation of electricity<Not Applicable>
MWh fuel consumed for self-generation of heat<Not Applicable>
MWh fuel consumed for self-generation of steam<Not Applicable>
MWh fuel consumed for self-generation of cooling<Not Applicable>
MWh fuel consumed for self-cogeneration or self-trigeneration<Not Applicable>
Comment
C8.2d
(C8.2d) List the average emission factors of the fuels reported in C8.2c.
Natural Gas
Emission factor53.115
Unitkg CO2e per million Btu
Emission factor sourceEPA Emission Factors for Greenhouse Gas Inventories: https://www.epa.gov/sites/production/files/2018-03/documents/emission-factors_mar_2018_0.pdf
CommentThe emissions factor from the EPA Emission Factors for Greenhouse Gas Inventories is used to calculate the emissions fromNatural Gas used for heating.
C8.2e
(C8.2e) Provide details on the electricity, heat, steam, and cooling your organization has generated and consumed in thereporting year.
Total Grossgeneration (MWh)
Generation that is consumed by theorganization (MWh)
Gross generation fromrenewable sources (MWh)
Generation from renewable sources that isconsumed by the organization (MWh)
Electricity 62272 62272 62272 62272
Heat 0 0 0 0
Steam 0 0 0 0
Cooling 0 0 0 0
CDP Page of 4839
C8.2f
(C8.2f) Provide details on the electricity, heat, steam and/or cooling amounts that were accounted for at a low-carbonemission factor in the market-based Scope 2 figure reported in C6.3.
Basis for applying a low-carbon emission factorEnergy attribute certificates, Renewable Energy Certificates (RECs)
Low-carbon technology typeSolar PVWind
Region of consumption of low-carbon electricity, heat, steam or coolingNorth America
MWh consumed associated with low-carbon electricity, heat, steam or cooling49796.6
Emission factor (in units of metric tons CO2e per MWh)0.41
Comment
C9. Additional metrics
C9.1
CDP Page of 4840
(C9.1) Provide any additional climate-related metrics relevant to your business.
DescriptionOther, please specify (Domestic water usage)
Metric value1432750314
Metric numeratorGallons
Metric denominator (intensity metric only)N/A
% change from previous year6.5
Direction of changeDecreased
Please explainThe reason for domestic water usage decrease is due to utilization of xeriscape – drought resistance plants for landscaping, smarttechnology irrigation systems and equipment such as low flush toilets and motion sensors for toilets.
DescriptionOther, please specify (Recycled waste)
Metric value4951
Metric numeratorMetric Tonnes
Metric denominator (intensity metric only)N/A
% change from previous year1.5
Direction of changeIncreased
Please explainIncreases in recycling have reduced the amount of the landfill waste
C10. Verification
C10.1
(C10.1) Indicate the verification/assurance status that applies to your reported emissions.
Verification/assurance status
Scope 1 Third-party verification or assurance process in place
Scope 2 (location-based or market-based) Third-party verification or assurance process in place
Scope 3 No third-party verification or assurance
C10.1a
CDP Page of 4841
(C10.1a) Provide further details of the verification/assurance undertaken for your Scope 1 and/or Scope 2 emissions andattach the relevant statements.
ScopeScope 1
Verification or assurance cycle in placeAnnual process
Status in the current reporting yearComplete
Type of verification or assuranceLimited assurance
Attach the statementCventure Assurance Letter.pdf
Page/ section referenceSee entire document.
Relevant standardCorporate GHG verification guidelines from ERT
Proportion of reported emissions verified (%)100
ScopeScope 2 location-based
Verification or assurance cycle in placeAnnual process
Status in the current reporting yearComplete
Type of verification or assuranceLimited assurance
Attach the statementCventure Assurance Letter.pdf
Page/ section referenceSee entire document.
Relevant standardCorporate GHG verification guidelines from ERT
Proportion of reported emissions verified (%)100
C10.2
(C10.2) Do you verify any climate-related information reported in your CDP disclosure other than the emissions figuresreported in C6.1, C6.3, and C6.5?No, but we are actively considering verifying within the next two years
C11. Carbon pricing
C11.1
CDP Page of 4842
(C11.1) Are any of your operations or activities regulated by a carbon pricing system (i.e. ETS, Cap & Trade or Carbon Tax)?No, and we do not anticipate being regulated in the next three years
C11.2
(C11.2) Has your organization originated or purchased any project-based carbon credits within the reporting period?No
C11.3
(C11.3) Does your organization use an internal price on carbon?No, but we anticipate doing so in the next two years
C12. Engagement
C12.1
(C12.1) Do you engage with your value chain on climate-related issues?Yes, our suppliersYes, our customers
C12.1a
CDP Page of 4843
(C12.1a) Provide details of your climate-related supplier engagement strategy.
Type of engagementInformation collection (understanding supplier behavior)
Details of engagementCollect climate change and carbon information at least annually from suppliers
% of suppliers by number23
% total procurement spend (direct and indirect)81
% Scope 3 emissions as reported in C6.5100
Rationale for the coverage of your engagementIn the context of this question, our suppliers are the third-parties with which we engage, and include but are not limited to ourproperty managers (i.e., our vendors) that provide services to us as a real estate owner. As part of our information collectionprocess, utility data, fuel consumption, and efficiency practices and/or initiatives are collected at least annually but in someinstances monthly. This particular group was selected because it includes all of the partners with which we do business and havebeen classified as critical suppliers per our DJSI submission (Item 1.7.2), which affects our company on every level. This subset ofsuppliers (23% of operators) not only contribute to 80% of our total procurement spend but also plays a significant role in carbonemissions and are at the core of our business as a real estate owner. Percentage (%) of suppliers has been calculated by thenumber of operators HCP has collected utility data for divided by the total number of operators that manage HCP properties. Pleasenote that the 23% of operators participating in data collection accounts for 78% of HCP's portfolio (by square footage).
Impact of engagement, including measures of successWe feel that the impact of this engagement is significant, as it affects all of the partners with which we do business. As ameasurement of success, positive outcomes achieved include a high cooperation level from our vendors in our informationcollection process. The information gathered better inform the operational performance of our assets and help identify additionalopportunities for improvement related to climate change.
Comment
Type of engagementCompliance & onboarding
Details of engagementCode of conduct featuring climate change KPIs
% of suppliers by number100
% total procurement spend (direct and indirect)100
% Scope 3 emissions as reported in C6.5100
Rationale for the coverage of your engagementIn the context of this question, our suppliers are the third-parties with which we engage, and include but are not limited to ourproperty managers (i.e., our vendors) that provide services to us as a real estate owner. As part of our information collectionprocess, utility data, fuel consumption, and efficiency practices and/or initiatives are collected at least annually but in someinstances monthly. This particular group was selected because it includes all of the partners with which we do business and havebeen classified as critical suppliers per our DJSI submission (Item 1.7.2),which affects our company on every level.
Impact of engagement, including measures of successWe feel that the impact of this engagement is significant, as it affects all of the partners with which we do business. As ameasurement of success, positive outcomes achieved include 100% cooperation from our vendors in our acknowledgementprocess, as well as positive feedback from vendors that our sustainability-related requirements and best practices haveencouraged them to expand upon the sustainability-related engagement mechanisms within their own company.
Comment
CDP Page of 4844
C12.1b
(C12.1b) Give details of your climate-related engagement strategy with your customers.
Type of engagementCollaboration & innovation
Details of engagementRun a campaign to encourage innovation to reduce climate change impacts
% of customers by number100
% Scope 3 emissions as reported in C6.50
Please explain the rationale for selecting this group of customers and scope of engagementEach year HCP holds an annual conference for all of our tenants (i.e., our customers), which serves as an engagement tool and aforum for collaborative sessions to foster discussions and plans of action that we can implement together to aid in reducing theclimate-change impacts of the buildings we own. Energy saving initiatives and campaigns are discussed at the conference andcollaboratively implemented at our properties that year. For example, as part of an initiative/campaign, we as the owner may installefficiency equipment upgrades, and our tenants may engage in energy conservation measures, resulting in a collaborative effort toreduce the climate-related impacts of that particular building. This particular group was selected because as a real estate owner,our tenants includes all of the partners with which we do business, which affects our company on every level.
Impact of engagement, including measures of successWe feel that the impact of this engagement is significant, as tenants represent a key stakeholder group and lease incomerepresents a significant portion of our overall revenue. As a measurement of success, positive outcomes achieved include energyand cost savings generated resulting from the collaborative effort. For example, as a result of feedback from our tenantengagement, we purchased renewable energy sources for certain of our medical office buildings in Dallas, Texas, which are nowstarting to generate renewable energy (62,272 MWh in 2018).
C12.3
(C12.3) Do you engage in activities that could either directly or indirectly influence public policy on climate-related issuesthrough any of the following?Trade associations
C12.3b
(C12.3b) Are you on the board of any trade associations or do you provide funding beyond membership?No
C12.3f
CDP Page of 4845

(C12.3f) What processes do you have in place to ensure that all of your direct and indirect activities that influence policy areconsistent with your overall climate change strategy?
We have several processes in place to ensure that all of our direct and indirect activities that influence policy are consistent with ouroverall climate change strategy. Generally, all of our Company’s procedures are governed by our corporate governance policies andprinciples, such as the Code of Business Conduct and Ethics, Vendor Code of Business Conduct and Ethics, and CorporateGovernance Guidelines, each of which provide safeguards against practices that are inconsistent with the Company’s objectives. OurBoard of Directors reviews our Corporate Governance Guidelines and Code of Business Conduct and Ethics, as well as othergovernance policies, annually to ensure that our activities that influence policy are consistent with our overall climate change strategy.Additionally, our Company and both of our Codes of Conduct support efforts that encourage greater energy efficiency. We haveestablished an internal Sustainability Committee that seeks to evaluate, improve and report on the Company’s approach toenvironmental initiatives. These collective processes help to ensure that our direct and indirect activities that influence policy areconsistent with our overall climate change strategy.
C12.4
CDP Page of 4846
(C12.4) Have you published information about your organization’s response to climate change and GHG emissionsperformance for this reporting year in places other than in your CDP response? If so, please attach the publication(s).
PublicationIn mainstream reports
StatusComplete
Attach the documentHCP 2018 Annual Report (10-K).pdf
Page/Section reference1-6 (Strategy), 10 (Sustainability), 10-28 (Risk Factors, including climate risks on p. 17)
Content elementsGovernanceStrategyOther, please specify (Awards & Achievements)
Comment
PublicationIn mainstream reports
StatusComplete
Attach the documentHCP 2019 Proxy Statement FY2018.pdf
Page/Section reference5, 20-21
Content elementsGovernanceStrategyEmissions figuresOther metricsOther, please specify (Awards and Recognition)
Comment
PublicationIn voluntary sustainability report
StatusComplete
Attach the documentHCP_2018_Sustainability_Report.pdf
Page/Section referenceAll
Content elementsGovernanceStrategyRisks & opportunitiesEmissions figuresEmission targetsOther metricsOther, please specify (Awards and Achievements)
Comment
CDP Page of 4847
C14. Signoff
C-FI
(C-FI) Use this field to provide any additional information or context that you feel is relevant to your organization's response.Please note that this field is optional and is not scored.
C14.1
(C14.1) Provide details for the person that has signed off (approved) your CDP climate change response.
Job title Corresponding job category
Row 1 Chief Development and Operating Officer Chief Operating Officer (COO)
Submit your response
In which language are you submitting your response?English
Please confirm how your response should be handled by CDP
Public or Non-Public Submission I am submitting to
I am submitting my response Public Investors
Please confirm belowI have read and accept the applicable Terms
CDP Page of 4848