Embed Size (px)
Citation preview
MOSS ADAMS LLP | 1
HCCA Regional
Annual Conference
February 14, 2014
Paul Holden, FHFMA│Senior Manager
Medicare Regulatory Update
MOSS ADAMS LLP | 2
The material appearing in this presentation is for informational purposes only and is not legal or accounting advice. Communication of this information is not intended to create, and receipt does not constitute, a legal relationship, including, but not limited to, an accountant-client relationship. Although these materials may have been prepared by professionals, they should not be used as a substitute for professional services. If legal, accounting, or other professional advice is required, the services of a professional should be sought.
MOSS ADAMS LLP | 3
PRESENTERS
Paul Holden, Senior Manager │ Moss Adams LLP
Paul is a Senior Manager in the Health Care Consulting Practice at Moss Adams. He has more than 10 years ofhealth care experience in the areas of business assurance and reimbursement consulting. His areas ofpractice include providers in the acute and post-acute settings mainly in Western states and all levels ofcomplexity. Areas of special interest and thought leadership include:
o The role of the Medicare cost report and claims data in the DRG and APC rate setting processeso Wage Index cost finding and labor market definitions with a focus on Wage Index Reform o Medicare cost report data-mining and benchmarking
MOSS ADAMS LLP | 4
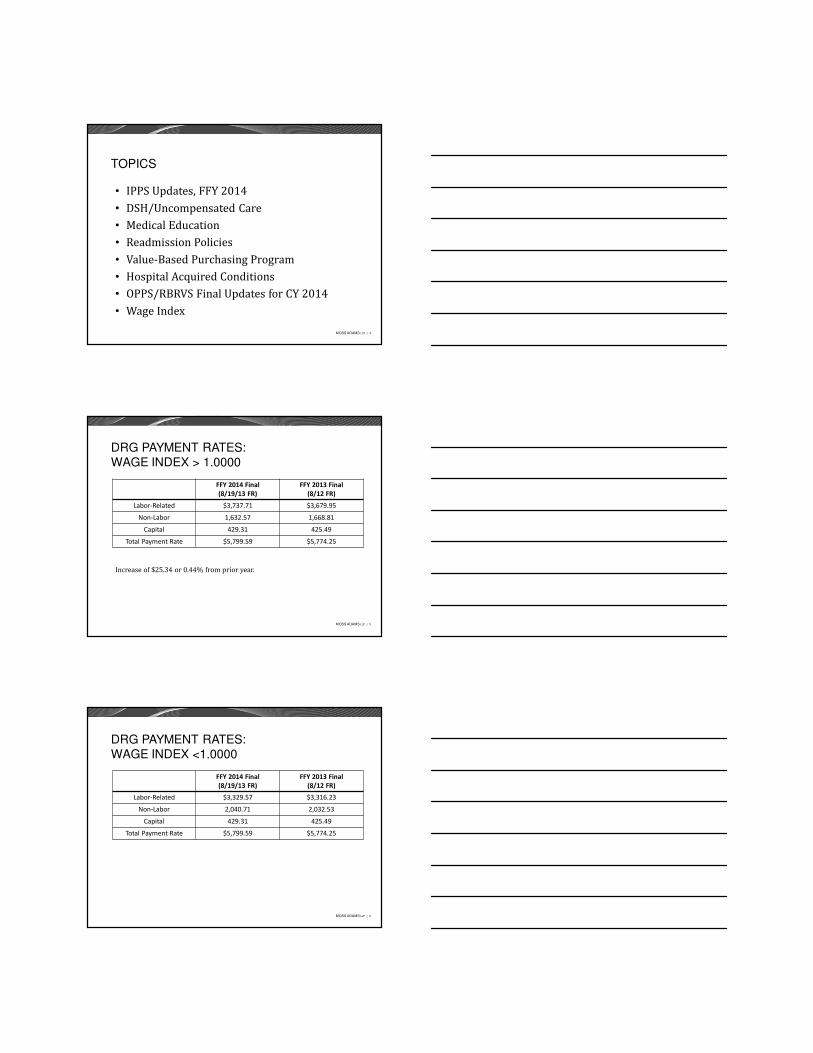
TOPICS
• IPPS Updates, FFY 2014• DSH/Uncompensated Care• Medical Education• Readmission Policies• Value-Based Purchasing Program• Hospital Acquired Conditions• OPPS/RBRVS Final Updates for CY 2014• Wage Index
MOSS ADAMS LLP | 5
DRG PAYMENT RATES:WAGE INDEX > 1.0000
FFY 2014 Final
(8/19/13 FR)
FFY 2013 Final
(8/12 FR)
Labor-Related $3,737.71 $3,679.95
Non-Labor 1,632.57 1,668.81
Capital 429.31 425.49
Total Payment Rate $5,799.59 $5,774.25
Increase of $25.34 or 0.44% from prior year.
MOSS ADAMS LLP | 6
DRG PAYMENT RATES:WAGE INDEX <1.0000
FFY 2014 Final
(8/19/13 FR)
FFY 2013 Final
(8/12 FR)
Labor-Related $3,329.57 $3,316.23
Non-Labor 2,040.71 2,032.53
Capital 429.31 425.49
Total Payment Rate $5,799.59 $5,774.25
MOSS ADAMS LLP | 7
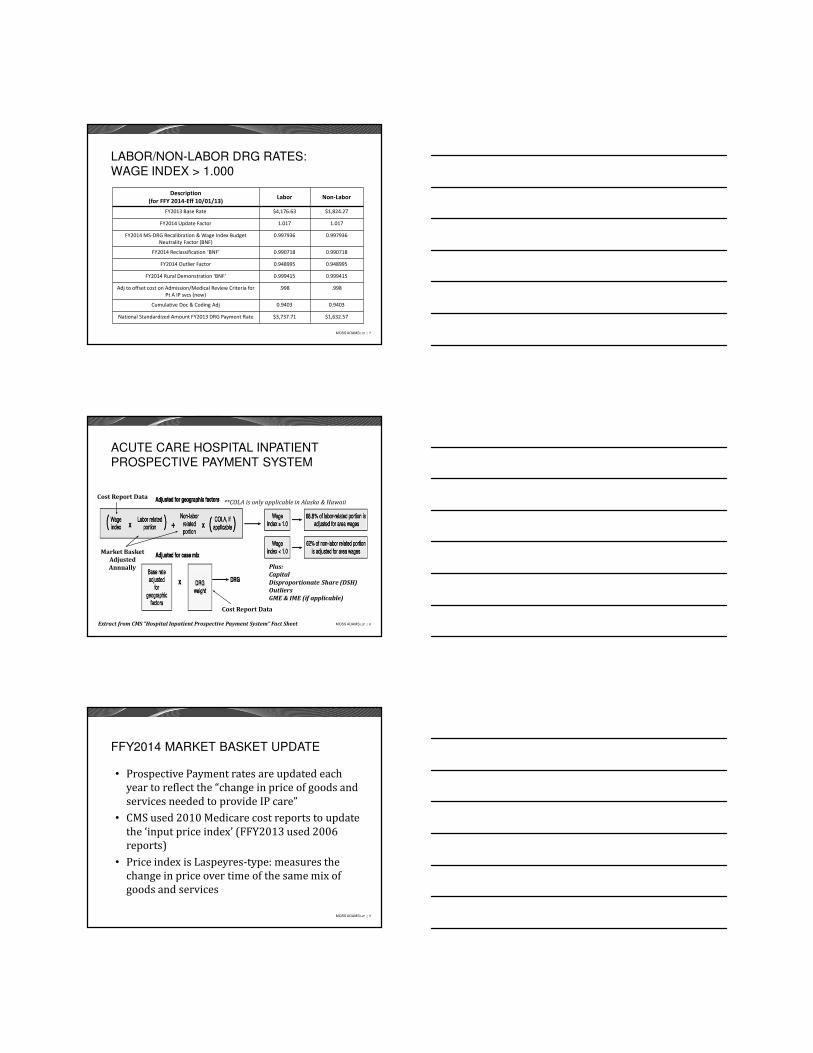
LABOR/NON-LABOR DRG RATES:WAGE INDEX > 1.000
Description
(for FFY 2014-Eff 10/01/13)Labor Non-Labor
FY2013 Base Rate $4,176.63 $1,824.27
FY2014 Update Factor 1.017 1.017
FY2014 MS-DRG Recalibration & Wage Index Budget
Neutrality Factor (BNF)
0.997936 0.997936
FY2014 Reclassification ‘BNF’ 0.990718 0.990718
FY2014 Outlier Factor 0.948995 0.948995
FY2014 Rural Demonstration ‘BNF’ 0.999415 0.999415
Adj to offset cost on Admission/Medical Review Criteria for
Pt A IP svcs (new)
.998 .998
Cumulative Doc & Coding Adj 0.9403 0.9403
National Standardized Amount FY2013 DRG Payment Rate $3,737.71 $1,632.57
MOSS ADAMS LLP | 8
ACUTE CARE HOSPITAL INPATIENT PROSPECTIVE PAYMENT SYSTEM
**COLA is only applicable in Alaska & HawaiiCost Report Data
Cost Report Data
Market Basket Adjusted
Annually Plus:
Capital
Disproportionate Share (DSH)
Outliers
GME & IME (if applicable)
Extract from CMS “Hospital Inpatient Prospective Payment System” Fact Sheet
MOSS ADAMS LLP | 9
FFY2014 MARKET BASKET UPDATE
• Prospective Payment rates are updated each year to reflect the “change in price of goods and services needed to provide IP care”
• CMS used 2010 Medicare cost reports to update the ‘input price index’ (FFY2013 used 2006 reports)
• Price index is Laspeyres-type: measures the change in price over time of the same mix of goods and services
MOSS ADAMS LLP | 10
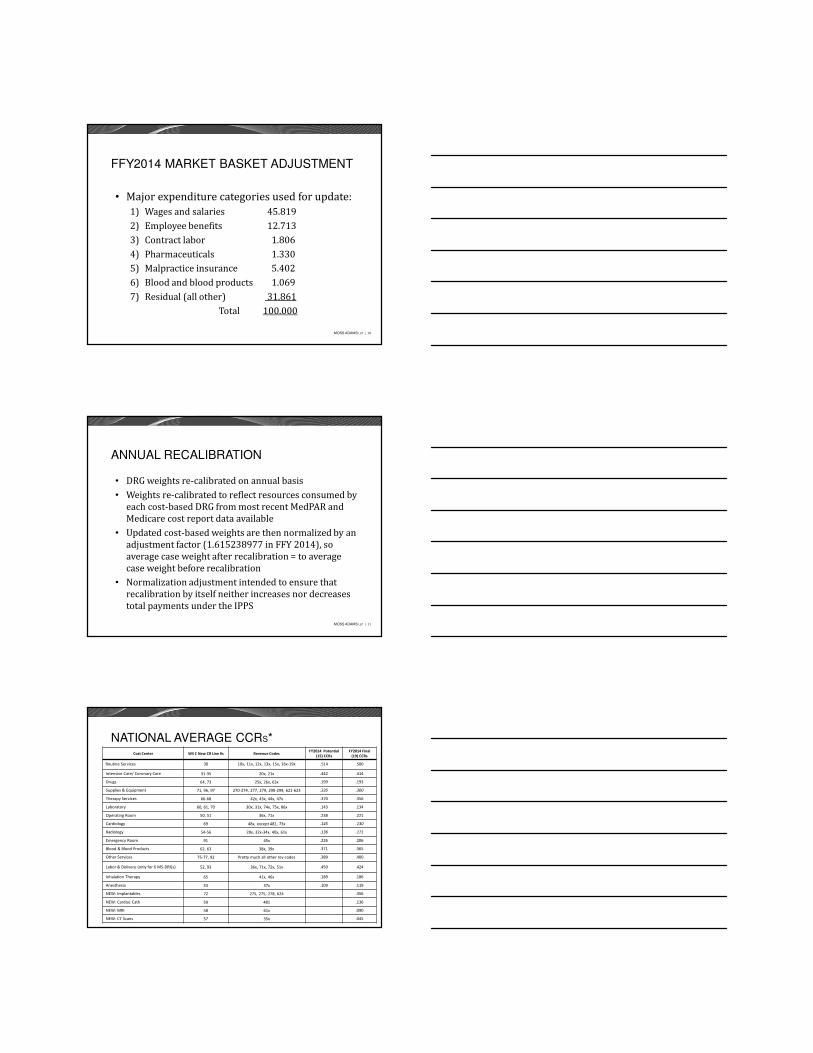
FFY2014 MARKET BASKET ADJUSTMENT
• Major expenditure categories used for update:1) Wages and salaries 45.8192) Employee benefits 12.7133) Contract labor 1.8064) Pharmaceuticals 1.3305) Malpractice insurance 5.4026) Blood and blood products 1.0697) Residual (all other) 31.861
Total 100.000
MOSS ADAMS LLP | 11
ANNUAL RECALIBRATION
• DRG weights re-calibrated on annual basis• Weights re-calibrated to reflect resources consumed by
each cost-based DRG from most recent MedPAR and Medicare cost report data available
• Updated cost-based weights are then normalized by an adjustment factor (1.615238977 in FFY 2014), so average case weight after recalibration = to average case weight before recalibration
• Normalization adjustment intended to ensure that recalibration by itself neither increases nor decreases total payments under the IPPS
MOSS ADAMS LLP | 12
NATIONAL AVERAGE CCRS*Cost Center WS C New CR Line #s Revenue Codes
FY2014 Potential
(15) CCRs
FY2014 Final
(19) CCRs
Routine Services 30 10x, 11x, 12x, 13x, 15x, 16x-19x .514 .500
Intensive Care/ Coronary Care 31-35 20x, 21x .442 .414
Drugs 64, 73 25x, 26x, 63x .199 .193
Supplies & Equipment 71, 96, 97 270-274, 277, 279, 290-299, 621-623 .335 .300
Therapy Services 66-68 42x, 43x, 44x, 47x .370 .356
Laboratory 60, 61, 70 30x, 31x, 74x, 75x, 86x .143 .134
Operating Room 50, 51 36x, 71x .238 .221
Cardiology 69 48x, except 481, 73x .145 .130
Radiology 54-56 28x, 32x-34x, 40x, 61x .136 .171
Emergency Room 91 45x .226 .206
Blood & Blood Products 62, 63 38x, 39x .371 .365
Other Services 75-77, 92 Pretty much all other rev codes .389 .400
Labor & Delivery (only for 6 MS-DRGs) 52, 93 36x, 71x, 72x, 51x .450 .424
Inhalation Therapy 65 41x, 46x .189 .186
Anesthesia 53 37x .109 .119
NEW: Implantables 72 275, 275, 278, 624 .356
NEW: Cardiac Cath 59 481 .136
NEW: MRI 58 61x .090
NEW: CT Scans 57 35x .045
MOSS ADAMS LLP | 13
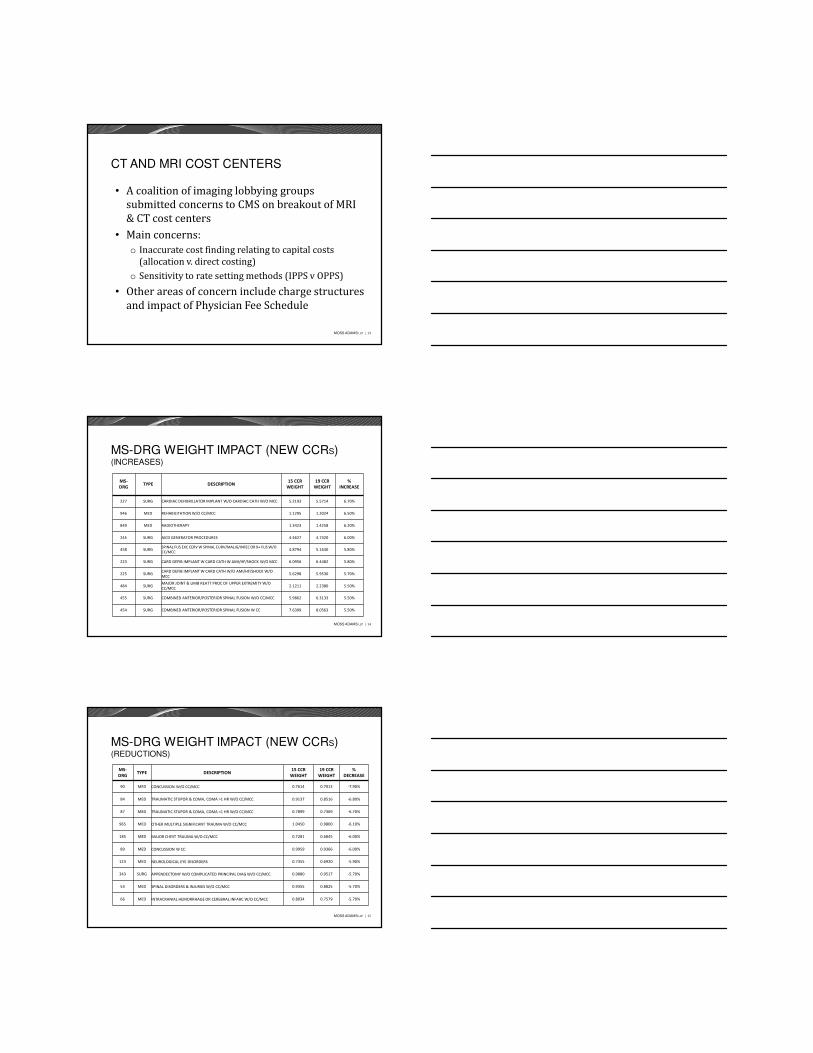
CT AND MRI COST CENTERS
• A coalition of imaging lobbying groups submitted concerns to CMS on breakout of MRI & CT cost centers
• Main concerns:o Inaccurate cost finding relating to capital costs
(allocation v. direct costing)o Sensitivity to rate setting methods (IPPS v OPPS)
• Other areas of concern include charge structures and impact of Physician Fee Schedule
MOSS ADAMS LLP | 14
MS-DRG WEIGHT IMPACT (NEW CCRS)(INCREASES)
MS-
DRGTYPE DESCRIPTION
15 CCR
WEIGHT
19 CCR
WEIGHT
%
INCREASE
227 SURG CARDIAC DEFIBRILLATOR IMPLANT W/O CARDIAC CATH W/O MCC 5.2193 5.5714 6.70%
946 MED REHABILITATION W/O CC/MCC 1.1295 1.2024 6.50%
849 MED RADIOTHERAPY 1.3423 1.4258 6.20%
245 SURG AICD GENERATOR PROCEDURES 4.4627 4.7320 6.00%
458 SURGSPINAL FUS EXC CERV W SPINAL CURV/MALIG/INFEC OR 9+ FUS W/O
CC/MCC4.8794 5.1630 5.80%
223 SURG CARD DEFIB IMPLANT W CARD CATH W AMI/HF/SHOCK W/O MCC 6.0956 6.4482 5.80%
225 SURGCARD DEFIB IMPLANT W CARD CATH W/O AMI/HF/SHOCK W/O
MCC5.6298 5.9530 5.70%
484 SURGMAJOR JOINT & LIMB REATT PROC OF UPPER EXTREMITY W/O
CC/MCC2.1211 2.2380 5.50%
455 SURG COMBINED ANTERIOR/POSTERIOR SPINAL FUSION W/O CC/MCC 5.9862 6.3133 5.50%
454 SURG COMBINED ANTERIOR/POSTERIOR SPINAL FUSION W CC 7.6399 8.0563 5.50%
MOSS ADAMS LLP | 15
MS-DRG WEIGHT IMPACT (NEW CCRS)(REDUCTIONS)
MS-
DRGTYPE DESCRIPTION
15 CCR
WEIGHT
19 CCR
WEIGHT
%
DECREASE
90 MED CONCUSSION W/O CC/MCC 0.7614 0.7013 -7.90%
84 MED TRAUMATIC STUPOR & COMA, COMA >1 HR W/O CC/MCC 0.9137 0.8516 -6.80%
87 MED TRAUMATIC STUPOR & COMA, COMA <1 HR W/O CC/MCC 0.7899 0.7369 -6.70%
965 MED OTHER MULTIPLE SIGNIFICANT TRAUMA W/O CC/MCC 1.0450 0.9800 -6.10%
185 MED MAJOR CHEST TRAUMA W/O CC/MCC 0.7281 0.6845 -6.00%
89 MED CONCUSSION W CC 0.9959 0.9366 -6.00%
123 MED NEUROLOGICAL EYE DISORDERS 0.7355 0.6920 -5.90%
343 SURG APPENDECTOMY W/O COMPLICATED PRINCIPAL DIAG W/O CC/MCC 0.9880 0.9517 -5.70%
53 MED SPINAL DISORDERS & INJURIES W/O CC/MCC 0.9355 0.8825 -5.70%
66 MED INTRACRANIAL HEMORRHAGE OR CEREBRAL INFARC W/O CC/MCC 0.8034 0.7579 -5.70%
MOSS ADAMS LLP | 16
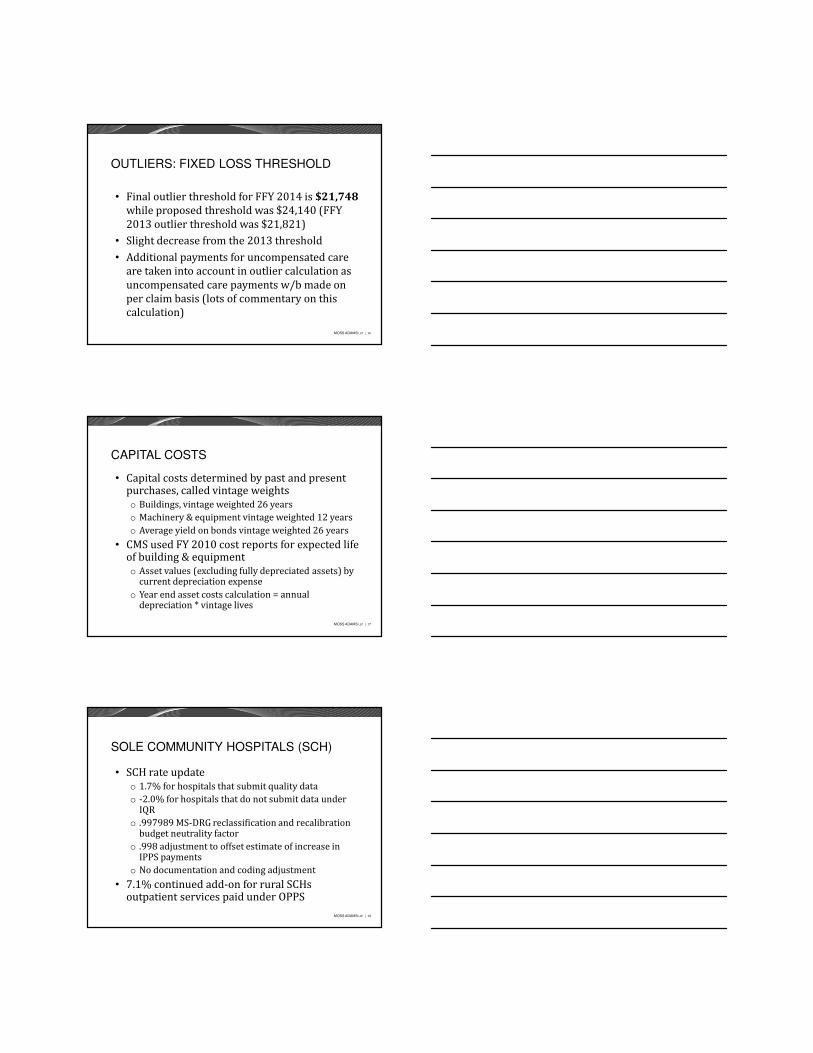
OUTLIERS: FIXED LOSS THRESHOLD
• Final outlier threshold for FFY 2014 is $21,748 while proposed threshold was $24,140 (FFY 2013 outlier threshold was $21,821)
• Slight decrease from the 2013 threshold• Additional payments for uncompensated care
are taken into account in outlier calculation as uncompensated care payments w/b made on per claim basis (lots of commentary on this calculation)
MOSS ADAMS LLP | 17
CAPITAL COSTS
• Capital costs determined by past and present purchases, called vintage weightso Buildings, vintage weighted 26 yearso Machinery & equipment vintage weighted 12 yearso Average yield on bonds vintage weighted 26 years
• CMS used FY 2010 cost reports for expected life of building & equipmento Asset values (excluding fully depreciated assets) by
current depreciation expenseo Year end asset costs calculation = annual
depreciation * vintage lives
MOSS ADAMS LLP | 18
SOLE COMMUNITY HOSPITALS (SCH)
• SCH rate updateo 1.7% for hospitals that submit quality data o -2.0% for hospitals that do not submit data under
IQRo .997989 MS-DRG reclassification and recalibration
budget neutrality factoro .998 adjustment to offset estimate of increase in
IPPS paymentso No documentation and coding adjustment
• 7.1% continued add-on for rural SCHs outpatient services paid under OPPS
MOSS ADAMS LLP | 19
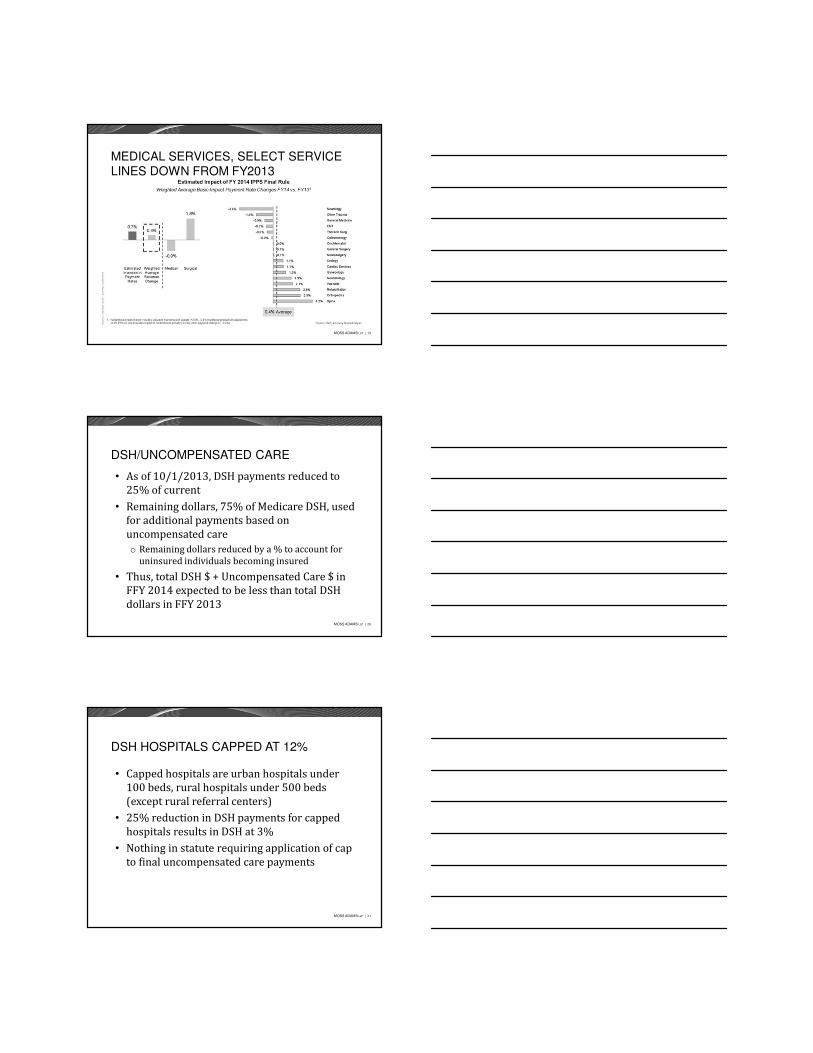
MEDICAL SERVICES, SELECT SERVICE LINES DOWN FROM FY2013
MOSS ADAMS LLP | 20
DSH/UNCOMPENSATED CARE
• As of 10/1/2013, DSH payments reduced to 25% of current
• Remaining dollars, 75% of Medicare DSH, used for additional payments based on uncompensated careo Remaining dollars reduced by a % to account for
uninsured individuals becoming insured
• Thus, total DSH $ + Uncompensated Care $ in FFY 2014 expected to be less than total DSH dollars in FFY 2013
MOSS ADAMS LLP | 21
DSH HOSPITALS CAPPED AT 12%
• Capped hospitals are urban hospitals under 100 beds, rural hospitals under 500 beds (except rural referral centers)
• 25% reduction in DSH payments for capped hospitals results in DSH at 3%
• Nothing in statute requiring application of cap to final uncompensated care payments
MOSS ADAMS LLP | 22
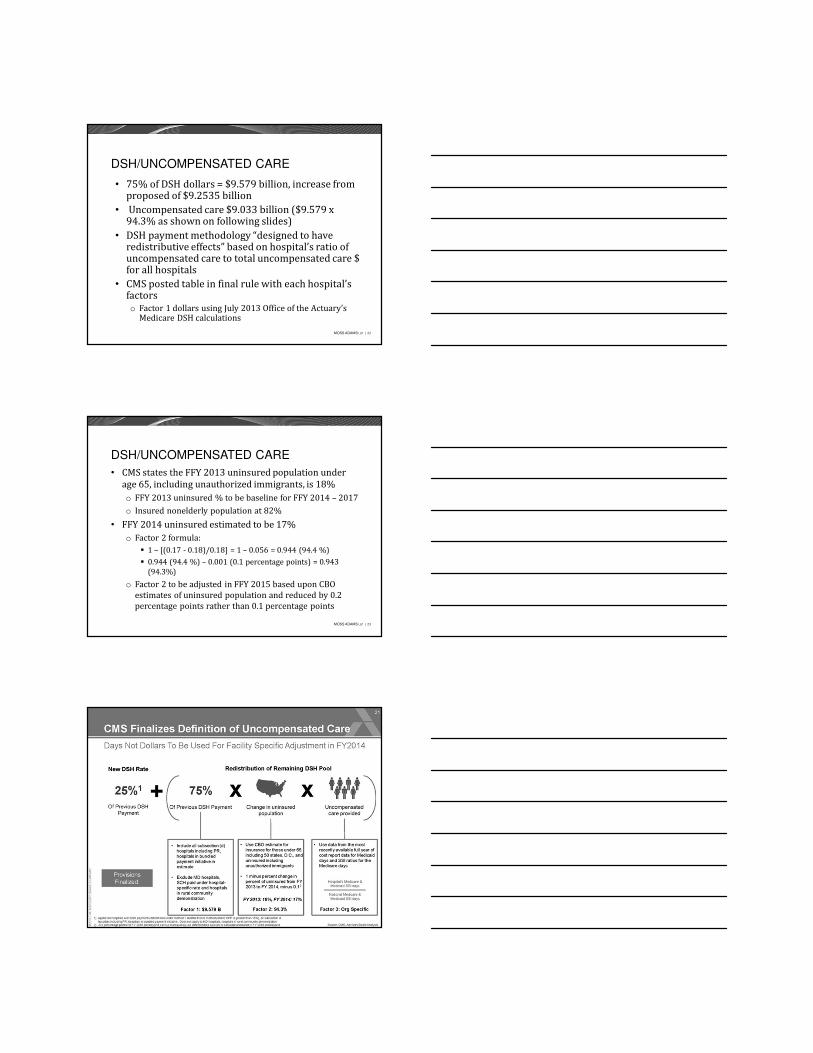
DSH/UNCOMPENSATED CARE
• 75% of DSH dollars = $9.579 billion, increase from proposed of $9.2535 billion
• Uncompensated care $9.033 billion ($9.579 x 94.3% as shown on following slides)
• DSH payment methodology “designed to have redistributive effects” based on hospital’s ratio of uncompensated care to total uncompensated care $ for all hospitals
• CMS posted table in final rule with each hospital’s factorso Factor 1 dollars using July 2013 Office of the Actuary’s
Medicare DSH calculations
MOSS ADAMS LLP | 23
DSH/UNCOMPENSATED CARE
• CMS states the FFY 2013 uninsured population under age 65, including unauthorized immigrants, is 18%o FFY 2013 uninsured % to be baseline for FFY 2014 – 2017o Insured nonelderly population at 82%
• FFY 2014 uninsured estimated to be 17% o Factor 2 formula:
� 1 – [(0.17 - 0.18)/0.18] = 1 – 0.056 = 0.944 (94.4 %)� 0.944 (94.4 %) – 0.001 (0.1 percentage points) = 0.943
(94.3%)
o Factor 2 to be adjusted in FFY 2015 based upon CBO estimates of uninsured population and reduced by 0.2 percentage points rather than 0.1 percentage points
MOSS ADAMS LLP | 24
PROPOSED - DSH/UNCOMPENSATED CARE
MOSS ADAMS LLP | 25
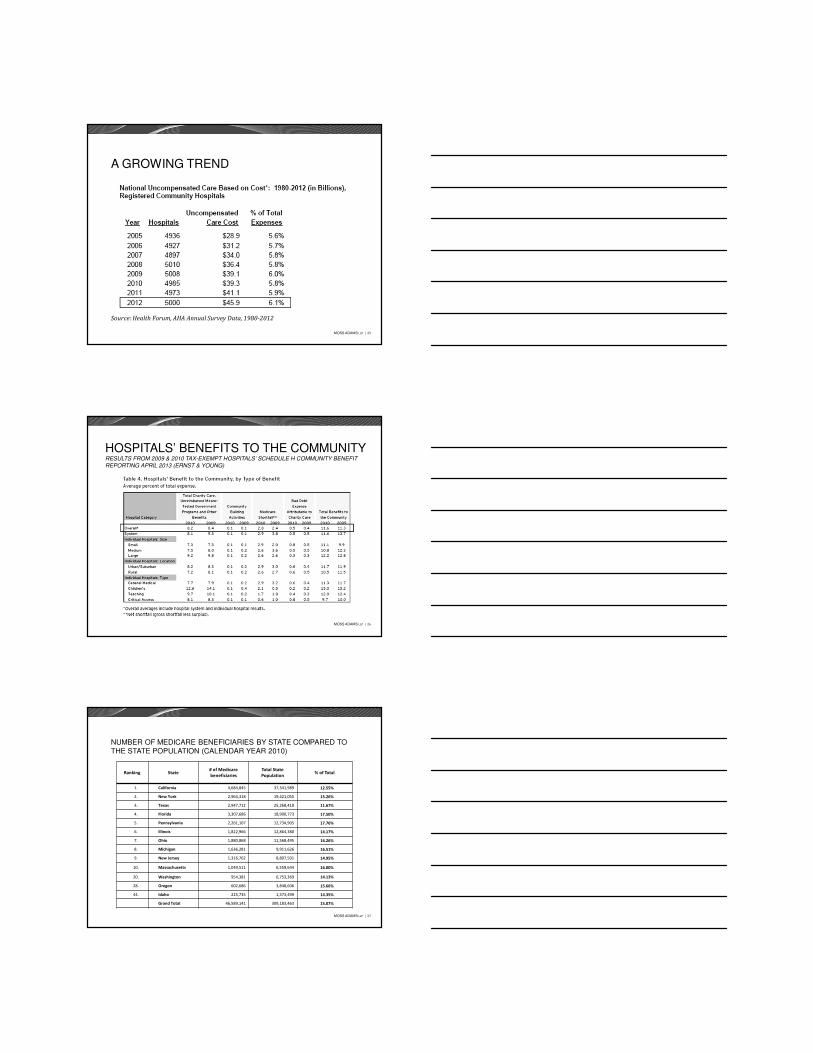
Source: Health Forum, AHA Annual Survey Data, 1980-2012
A GROWING TREND
MOSS ADAMS LLP | 26
HOSPITALS’ BENEFITS TO THE COMMUNITYRESULTS FROM 2009 & 2010 TAX-EXEMPT HOSPITALS’ SCHEDULE H COMMUNITY BENEFIT
REPORTING APRIL 2013 (ERNST & YOUNG)
MOSS ADAMS LLP | 27
NUMBER OF MEDICARE BENEFICIARIES BY STATE COMPARED TO THE STATE POPULATION (CALENDAR YEAR 2010)
Ranking State# of Medicare
beneficiaries
Total State
Population% of Total
1. California 4,684,845 37,341,989 12.55%
2. New York 2,964,318 19,421,055 15.26%
3. Texas 2,947,712 25,268,418 11.67%
4. Florida 3,307,686 18,900,773 17.50%
5. Pennsylvania 2,261,107 12,734,905 17.76%
6. Illinois 1,822,966 12,864,380 14.17%
7. Ohio 1,880,868 11,568,495 16.26%
8. Michigan 1,636,281 9,911,626 16.51%
9. New Jersey 1,316,762 8,807,501 14.95%
10. Massachusetts 1,049,511 6,559,644 16.00%
20. Washington 954,381 6,753,369 14.13%
28. Oregon 602,686 3,848,606 15.66%
44. Idaho 225,735 1,573,499 14.35%
Grand Total 46,589,141 309,183,463 15.07%
MOSS ADAMS LLP | 28
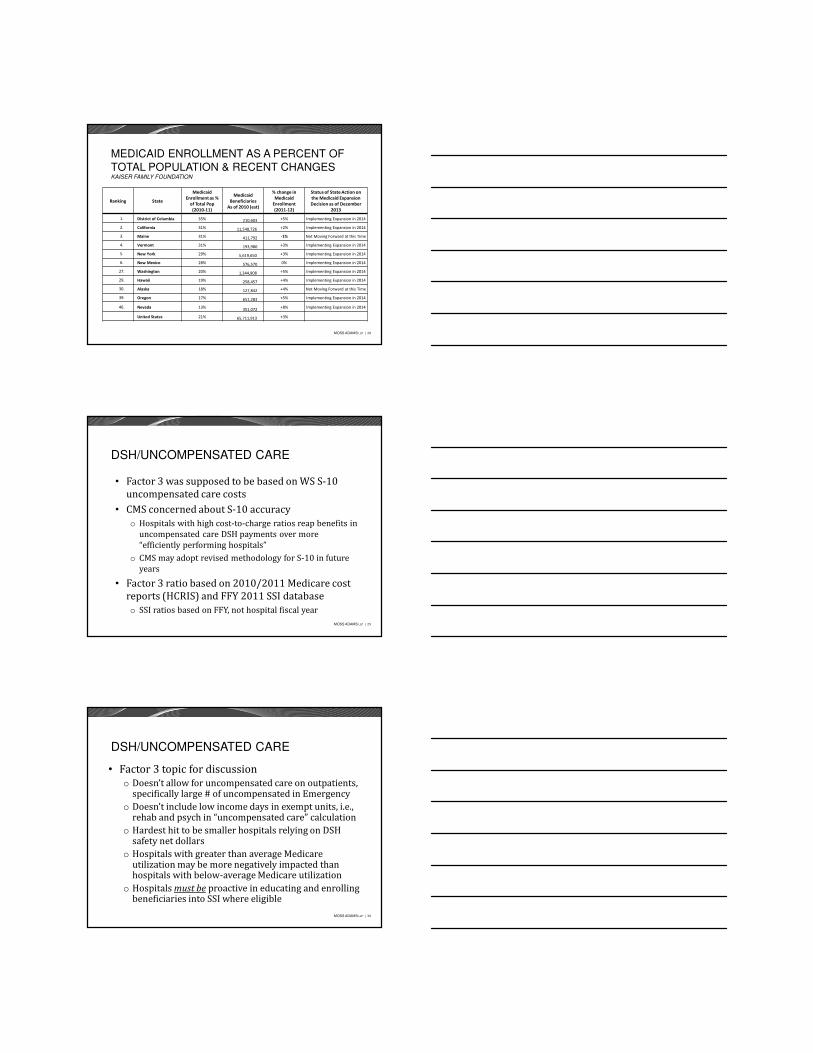
MEDICAID ENROLLMENT AS A PERCENT OF
TOTAL POPULATION & RECENT CHANGESKAISER FAMILY FOUNDATION
Ranking State
Medicaid
Enrollment as %
of Total Pop
(2010-11)
Medicaid
Beneficiaries
As of 2010 (est)
% change in
Medicaid
Enrollment
(2011-12)
Status of State Action on
the Medicaid Expansion
Decision as of December
2013
1. District of Columbia 35% 210,603 +5% Implementing Expansion in 2014
2. California 31% 11,548,726 +2% Implementing Expansion in 2014
3. Maine 31% 411,792 -1% Not Moving Forward at this Time
4. Vermont 31% 193,980 +3% Implementing Expansion in 2014
5. New York 29% 5,619,650 +3% Implementing Expansion in 2014
6. New Mexico 28% 576,570 0% Implementing Expansion in 2014
27. Washington 20% 1,344,908 +5% Implementing Expansion in 2014
29. Hawaii 19% 258,457 +4% Implementing Expansion in 2014
30. Alaska 18% 127,842 +4% Not Moving Forward at this Time
39. Oregon 17% 651,283 +5% Implementing Expansion in 2014
46. Nevada 13%351,072
+8% Implementing Expansion in 2014
United States 21% 65,711,913 +3%
MOSS ADAMS LLP | 29
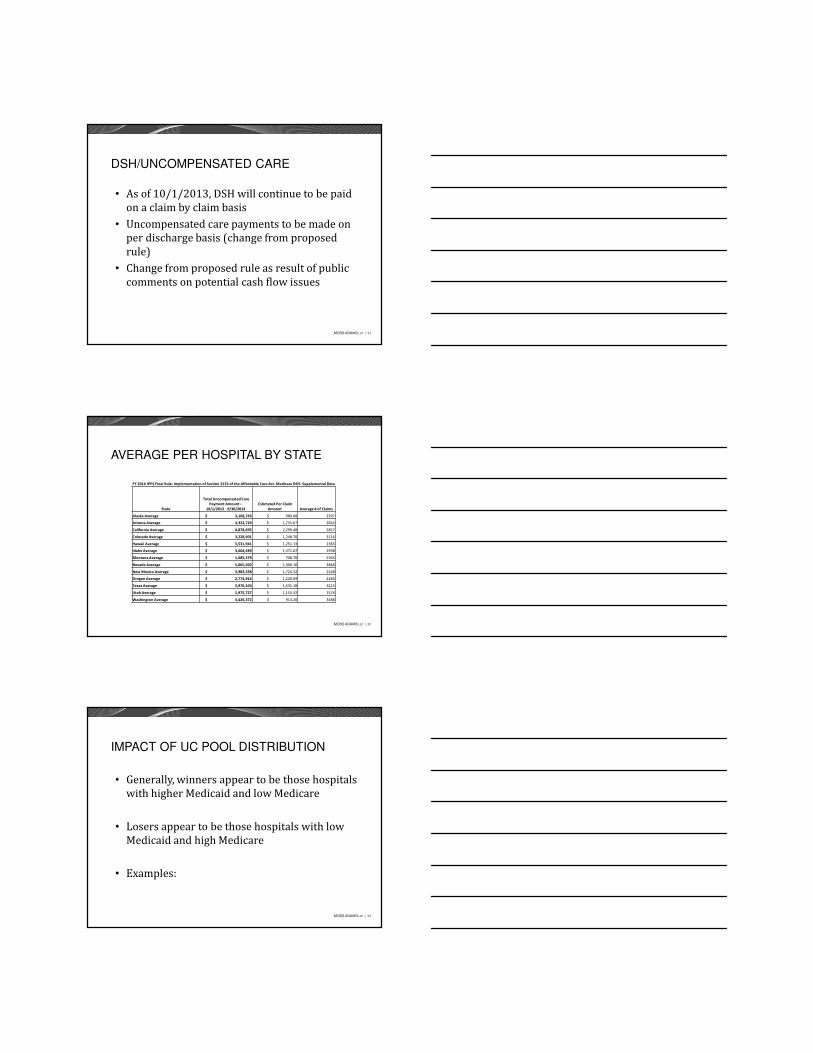
DSH/UNCOMPENSATED CARE
• Factor 3 was supposed to be based on WS S-10 uncompensated care costs
• CMS concerned about S-10 accuracyo Hospitals with high cost-to-charge ratios reap benefits in
uncompensated care DSH payments over more “efficiently performing hospitals”
o CMS may adopt revised methodology for S-10 in future years
• Factor 3 ratio based on 2010/2011 Medicare cost reports (HCRIS) and FFY 2011 SSI databaseo SSI ratios based on FFY, not hospital fiscal year
MOSS ADAMS LLP | 30
DSH/UNCOMPENSATED CARE
• Factor 3 topic for discussiono Doesn’t allow for uncompensated care on outpatients,
specifically large # of uncompensated in Emergencyo Doesn’t include low income days in exempt units, i.e.,
rehab and psych in “uncompensated care” calculationo Hardest hit to be smaller hospitals relying on DSH
safety net dollarso Hospitals with greater than average Medicare
utilization may be more negatively impacted than hospitals with below-average Medicare utilization
o Hospitals must be proactive in educating and enrolling beneficiaries into SSI where eligible
MOSS ADAMS LLP | 31
DSH/UNCOMPENSATED CARE
• As of 10/1/2013, DSH will continue to be paid on a claim by claim basis
• Uncompensated care payments to be made on per discharge basis (change from proposed rule)
• Change from proposed rule as result of public comments on potential cash flow issues
MOSS ADAMS LLP | 32
AVERAGE PER HOSPITAL BY STATE
FY 2014 IPPS Final Rule: Implementation of Section 3133 of the Affordable Care Act- Medicare DSH- Supplemental Data
State
Total Uncompensated Care
Payment Amount –
10/1/2013 - 9/30/2014
Estimated Per Claim
Amount Average # of Claims
Alaska Average $ 3,168,743 $ 980.68 2397
Arizona Average $ 4,322,729 $ 1,755.67 2824
California Average $ 4,878,695 $ 2,299.48 2827
Colorado Average $ 3,228,901 $ 1,248.70 3116
Hawaii Average $ 3,531,941 $ 1,251.13 2383
Idaho Average $ 3,664,589 $ 1,371.67 2598
Montana Average $ 1,685,379 $ 708.70 2263
Nevada Average $ 5,065,502 $ 1,300.10 3848
New Mexico Average $ 3,983,338 $ 1,724.52 2248
Oregon Average $ 2,774,916 $ 1,220.69 2284
Texas Average $ 3,970,104 $ 1,535.18 3213
Utah Average $ 1,975,727 $ 1,153.32 1576
Washington Average $ 3,426,372 $ 913.20 3488
MOSS ADAMS LLP | 33
IMPACT OF UC POOL DISTRIBUTION
• Generally, winners appear to be those hospitals with higher Medicaid and low Medicare
• Losers appear to be those hospitals with low Medicaid and high Medicare
• Examples:
MOSS ADAMS LLP | 34
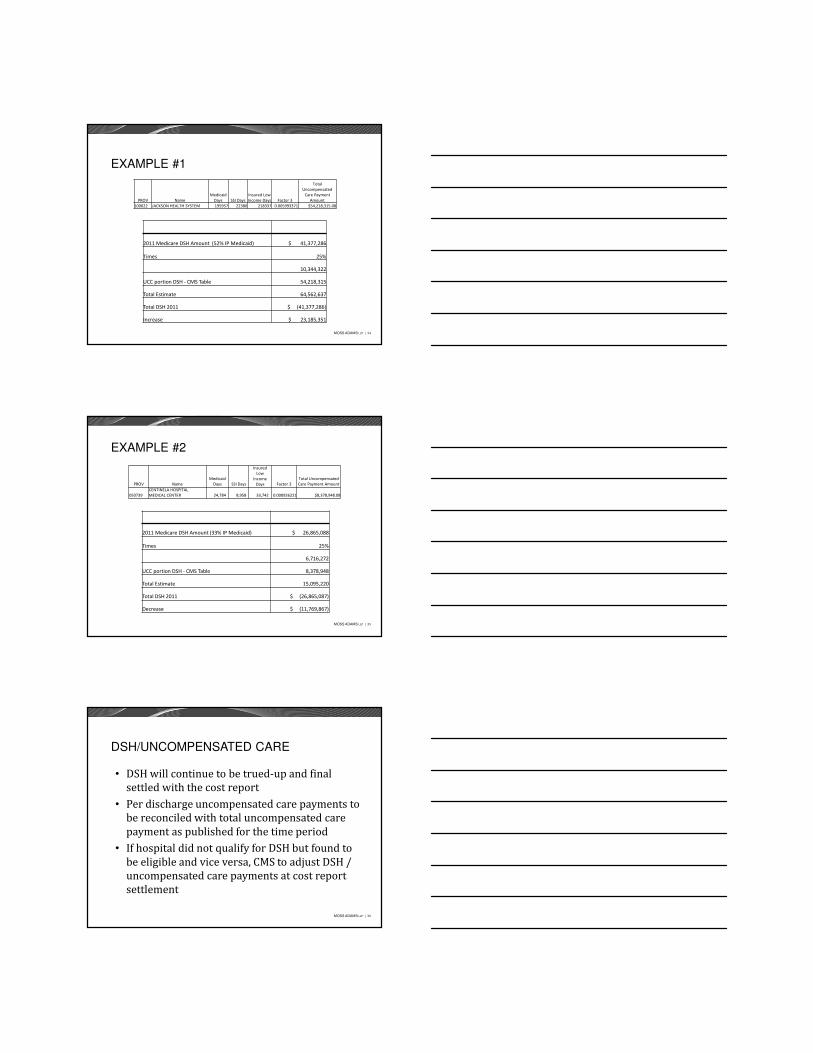
EXAMPLE #1
2011 Medicare DSH Amount (52% IP Medicaid) $ 41,377,286
Times 25%
10,344,322
UCC portion DSH - CMS Table 54,218,315
Total Estimate 64,562,637
Total DSH 2011 $ (41,377,286)
Increase $ 23,185,351
PROV Name
Medicaid
Days SSI Days
Insured Low
Income Days Factor 3
Total
Uncompensated
Care Payment
Amount
100022 JACKSON HEALTH SYSTEM 195957 22380 218337 0.005993371 $54,218,315.08
MOSS ADAMS LLP | 35
EXAMPLE #2
PROV Name
Medicaid
Days SSI Days
Insured
Low
Income
Days Factor 3
Total Uncompensated
Care Payment Amount
050739
CENTINELA HOSPITAL
MEDICAL CENTER 24,784 8,958 33,742 0.000926221 $8,378,948.08
2011 Medicare DSH Amount (33% IP Medicaid) $ 26,865,088
Times 25%
6,716,272
UCC portion DSH - CMS Table 8,378,948
Total Estimate 15,095,220
Total DSH 2011 $ (26,865,087)
Decrease $ (11,769,867)
MOSS ADAMS LLP | 36
DSH/UNCOMPENSATED CARE
• DSH will continue to be trued-up and final settled with the cost report
• Per discharge uncompensated care payments to be reconciled with total uncompensated care payment as published for the time period
• If hospital did not qualify for DSH but found to be eligible and vice versa, CMS to adjust DSH / uncompensated care payments at cost report settlement
MOSS ADAMS LLP | 37
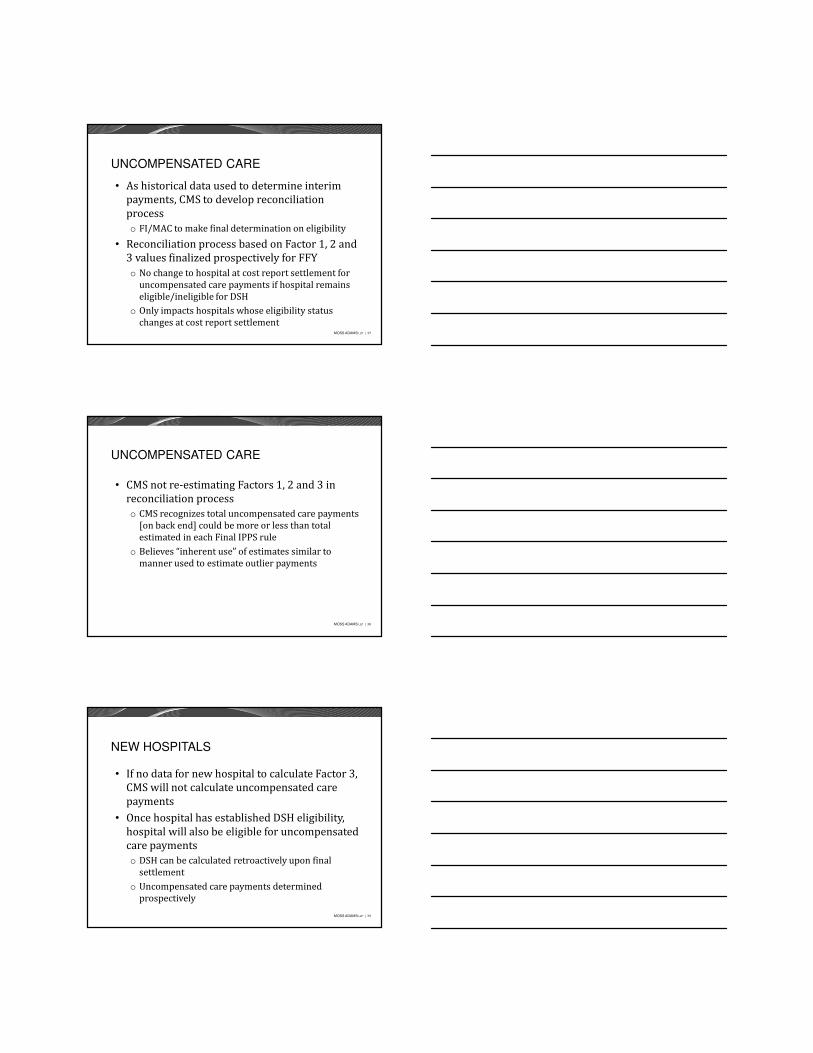
UNCOMPENSATED CARE
• As historical data used to determine interim payments, CMS to develop reconciliation processo FI/MAC to make final determination on eligibility
• Reconciliation process based on Factor 1, 2 and 3 values finalized prospectively for FFYo No change to hospital at cost report settlement for
uncompensated care payments if hospital remains eligible/ineligible for DSH
o Only impacts hospitals whose eligibility status changes at cost report settlement
MOSS ADAMS LLP | 38
UNCOMPENSATED CARE
• CMS not re-estimating Factors 1, 2 and 3 in reconciliation processo CMS recognizes total uncompensated care payments
[on back end] could be more or less than total estimated in each Final IPPS rule
o Believes “inherent use” of estimates similar to manner used to estimate outlier payments
MOSS ADAMS LLP | 39
NEW HOSPITALS
• If no data for new hospital to calculate Factor 3, CMS will not calculate uncompensated care payments
• Once hospital has established DSH eligibility, hospital will also be eligible for uncompensated care paymentso DSH can be calculated retroactively upon final
settlemento Uncompensated care payments determined
prospectively
MOSS ADAMS LLP | 40
MA PLANS AND UNCOMPENSATED CARE
• Uncompensated care to be treated as part of hospital’s Medicare payment from MA plans
• MA plans required to pay non-contract hospitals the same as Medicare FFS
• As uncompensated care to be paid on a per discharge basis, CMS “anticipates” that FY 2014 PPS Pricer will include the per-claim amounto MA plans obligated to make uncompensated care
payments
MOSS ADAMS LLP | 41
DSH – REALIGNMENT & REQUESTS
• 42 CFR 412.106(b)(3) allows a hospital to request to have the SSI ratio recomputed based on the hospital’s cost report yearend
• Latest SSI Ratios issued at end of June 2013 were for FFY 2011
MOSS ADAMS LLP | 42
MEDICAL EDUCATION
• Labor/delivery beds to be counted with total beds for IMEo Effective for cost report periods beginning on/after
10/1/2012o Could impact DSH hospitals under 100 beds (push
them over 100 beds?)
• Labor/delivery days in calculation of Medicare utilization for GME reimbursemento Dilutes Medicare % to total patient dayso Effective for cost report periods beginning on/after
10/1/2013
MOSS ADAMS LLP | 43
MEDICAL EDUCATION
• Resident rotations to critical access hospitals currently counted one of two ways:o Costs incurred by CAH of training residents in CAH
setting folded into CAH allowable costs and reimbursed at 101%
o Or, resident rotations to CAH treated as non-provider setting and countable by PPS hospital
• Section 5504 of ACA, CMS “reevaluated” policy to treat CAH as non-provider settingo CAHs/provider-based CAH RHC no longer allowed to
be treated as non-provider sites as of 10/1/2013� Even if IPPS hospital incurs the training costs
MOSS ADAMS LLP | 44
NEW TEACHING PROGRAMS
• New teaching hospitals have 5-year window to establish and grow program before setting FTE capo Effective for rotations commencing on/after
10/01/2012o Caps to be set in Year 5 of program
• If resident program sponsored by 2 or more hospitals, CMS to establish FTE cap for each hospital o Based on % of FTE residents trained over 5-year
period, not in 5th year
MOSS ADAMS LLP | 45
INPATIENT ADMISSION PROPOSAL
• New benchmark for medical reviewo External review contractors to presume I/P admissions
are reasonable and necessary for patients requiring more than 1 Medicare day (i.e., crossing 2 midnights)
o If hospital found to be abusing 2-midnight presumption by systematically delaying care to surpass 2-midnight frame� Review contractors to disregard 2-midnight presumption for
that hospitalo If less than 2 midnights, CMS maintains services s/b on
outpatient basis� Unless med record documentation clearly supports inpatient� Or inpatient only type services were provided
MOSS ADAMS LLP | 46
CO-PAYS ON OUTPATIENT SERVICES
• CMS concerned about beneficiary liabilities on extended outpatient serviceso Hospitals concerned about financial risk of inpatient
denial putting patients in outpatient status to provide services
• CMS addressing issue by revising Pt B I/P policyo If Part A claim denied as medically unnecessary or
hospital determines post dischargeo Hospital can be paid under Pt B (except those
services specifically requiring outpatient status)
MOSS ADAMS LLP | 47
LOW VOLUME ADJUSTMENT
• Low volume adjustments had been extended thru 9/30/2013o Now trued up in cost report forms via a separate
settlement worksheeto Calculation split based on cost report years crossing
October 1• Adjustment extended thru March 31, 2014 due to
the Pathway for SGR Reform Act of 2013 signed on December 26, 2013
MOSS ADAMS LLP | 48
CRITICAL ACCESS HOSPITAL – CoPs
• CoPs for CAHso 35 mile/15 mile ruleo 24 hour access to ER serviceso Appropriate staffing when an IP is presento IP length of stay < 96 hours
• CMS reviewed data from 1,230 of 1,328 CAHs nationwide (1% showed service gaps in IP services)
• CMS is proposing to clarify CoPs for IP care
MOSS ADAMS LLP | 49
SEQUESTRATION
• Cuts in Medicare payments to providers and insurance plans are limited to 2% each year or $11 billion in 2013 (majority is acute care)
• In comparison:o Defense spending cuts are limited to 7.5% (or $54.7
billion in 2013) and, o Non-Defense Discretionary Programs cuts are
limited to ~8.4% (or $38.5 billion in 2013).
MOSS ADAMS LLP | 50
HOSPITAL READMISSION REDUCTION PROGRAM (HRRP)
• Effective for discharges on/after 10/1/2012• Adjustment made to base DRG payment• Adjustment not made to hospitals’ SCH payment rates• HRRP Adjustment reconciling line item in cost report
for all impacted facilities (E Pt A, Line 70.94)• 3 risk-standardized readmission measures
o Acute Myocardial Infarction (AMI)o Heart Failure (HF)o Pneumonia (PN)
MOSS ADAMS LLP | 51
READMISSIONS
• Readmission measures to be expanded in FFY 2015 to:o Acute exacerbation of COPDo Elective total hip (THA) and total knee arthroplasty
(TKA)o CMS stated not feasible to add readmission
measures for:� CABG � PCI� Other vascular conditions� As procedures are either decreasing or done in outpatient
departments
MOSS ADAMS LLP | 52
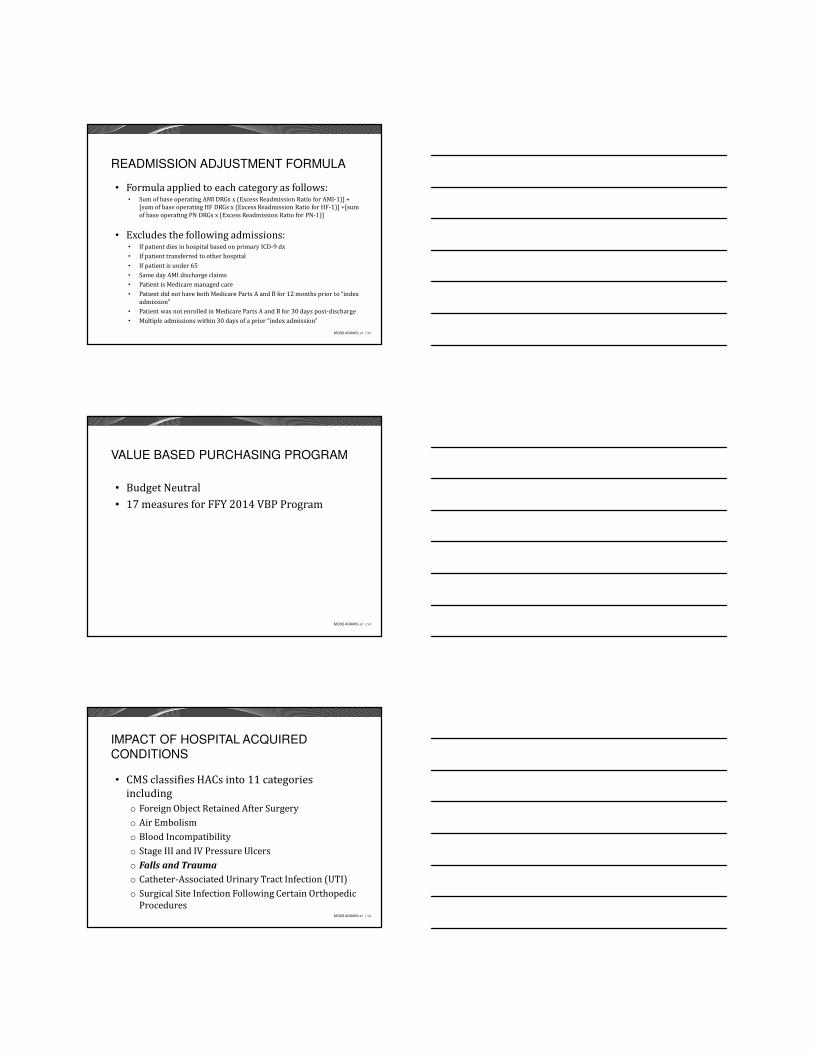
READMISSION ADJUSTMENT FORMULA
• Formula applied to each category as follows:• Sum of base operating AMI DRGs x (Excess Readmission Ratio for AMI-1)] +
[sum of base operating HF DRGs x (Excess Readmission Ratio for HF-1)] +[sum of base operating PN DRGs x (Excess Readmission Ratio for PN-1)]
• Excludes the following admissions:• If patient dies in hospital based on primary ICD-9 dx• If patient transferred to other hospital• If patient is under 65• Same day AMI discharge claims• Patient is Medicare managed care• Patient did not have both Medicare Parts A and B for 12 months prior to “index
admission”• Patient was not enrolled in Medicare Parts A and B for 30 days post-discharge• Multiple admissions within 30 days of a prior “index admission”
MOSS ADAMS LLP | 53
VALUE BASED PURCHASING PROGRAM
• Budget Neutral• 17 measures for FFY 2014 VBP Program
MOSS ADAMS LLP | 54
IMPACT OF HOSPITAL ACQUIRED CONDITIONS
• CMS classifies HACs into 11 categories includingo Foreign Object Retained After Surgeryo Air Embolismo Blood Incompatibilityo Stage III and IV Pressure Ulcerso Falls and Trauma
o Catheter-Associated Urinary Tract Infection (UTI)o Surgical Site Infection Following Certain Orthopedic
Procedures
MOSS ADAMS LLP | 55
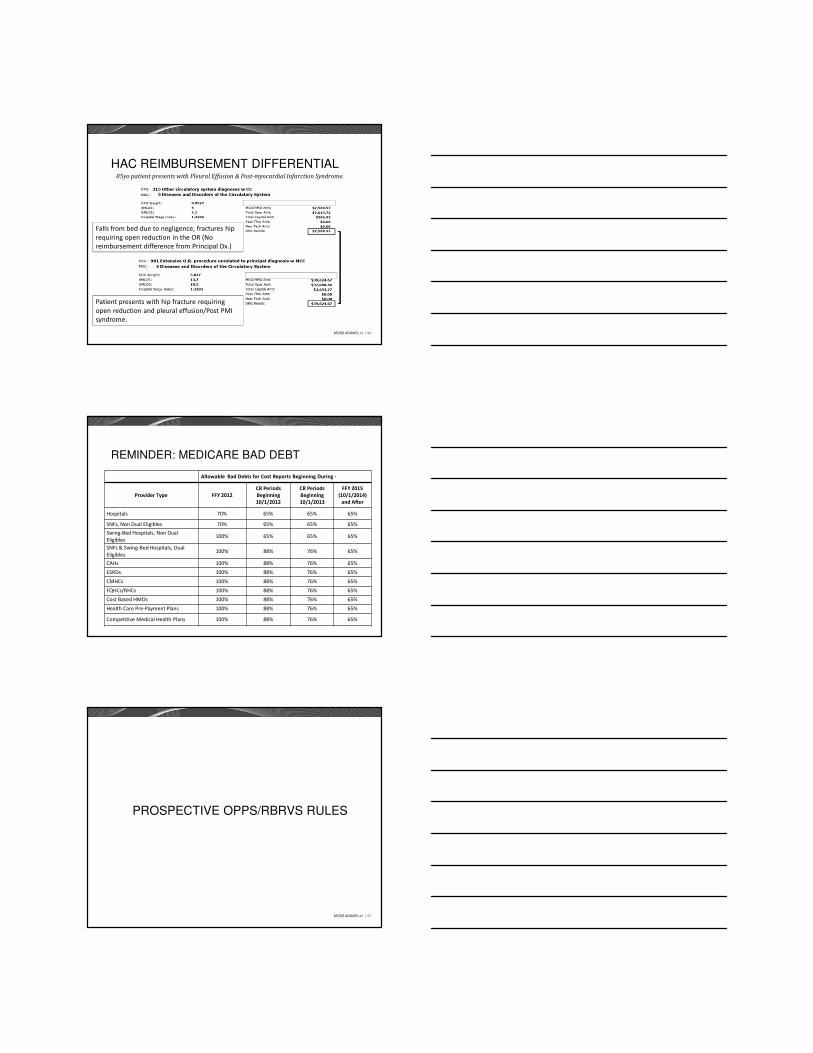
HAC REIMBURSEMENT DIFFERENTIAL85yo patient presents with Pleural Effusion & Post-myocardial Infarction Syndrome.
Falls from bed due to negligence, fractures hip
requiring open reduction in the OR (No
reimbursement difference from Principal Dx.)
Patient presents with hip fracture requiring
open reduction and pleural effusion/Post PMI
syndrome.
MOSS ADAMS LLP | 56
REMINDER: MEDICARE BAD DEBT
Allowable Bad Debts for Cost Reports Beginning During -
Provider Type FFY 2012
CR Periods
Beginning
10/1/2012
CR Periods
Beginning
10/1/2013
FFY 2015
(10/1/2014)
and After
Hospitals 70% 65% 65% 65%
SNFs, Non Dual Eligibles 70% 65% 65% 65%
Swing-Bed Hospitals, Non Dual
Eligibles100% 65% 65% 65%
SNFs & Swing-Bed Hospitals, Dual
Eligibles100% 88% 76% 65%
CAHs 100% 88% 76% 65%
ESRDs 100% 88% 76% 65%
CMHCs 100% 88% 76% 65%
FQHCs/RHCs 100% 88% 76% 65%
Cost Based HMOs 100% 88% 76% 65%
Health Care Pre-Payment Plans 100% 88% 76% 65%
Competitive Medical Health Plans 100% 88% 76% 65%
MOSS ADAMS LLP | 57
PROSPECTIVE OPPS/RBRVS RULES
MOSS ADAMS LLP | 58
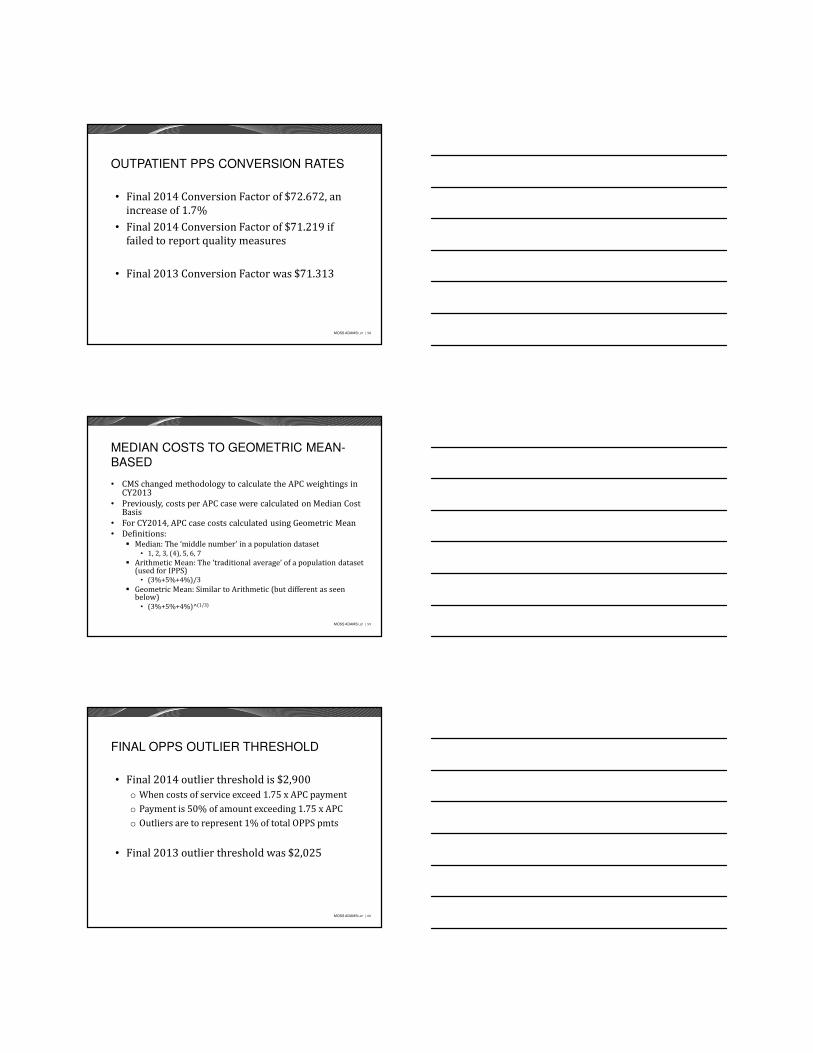
OUTPATIENT PPS CONVERSION RATES
• Final 2014 Conversion Factor of $72.672, an increase of 1.7%
• Final 2014 Conversion Factor of $71.219 if failed to report quality measures
• Final 2013 Conversion Factor was $71.313
MOSS ADAMS LLP | 59
MEDIAN COSTS TO GEOMETRIC MEAN-BASED
• CMS changed methodology to calculate the APC weightings in CY2013
• Previously, costs per APC case were calculated on Median Cost Basis
• For CY2014, APC case costs calculated using Geometric Mean• Definitions:
� Median: The ‘middle number’ in a population dataset• 1, 2, 3, (4), 5, 6, 7
� Arithmetic Mean: The ‘traditional average’ of a population dataset (used for IPPS)
• (3%+5%+4%)/3� Geometric Mean: Similar to Arithmetic (but different as seen
below)• (3%+5%+4%)^(1/3)
MOSS ADAMS LLP | 60
FINAL OPPS OUTLIER THRESHOLD
• Final 2014 outlier threshold is $2,900o When costs of service exceed 1.75 x APC paymento Payment is 50% of amount exceeding 1.75 x APC o Outliers are to represent 1% of total OPPS pmts
• Final 2013 outlier threshold was $2,025
MOSS ADAMS LLP | 61
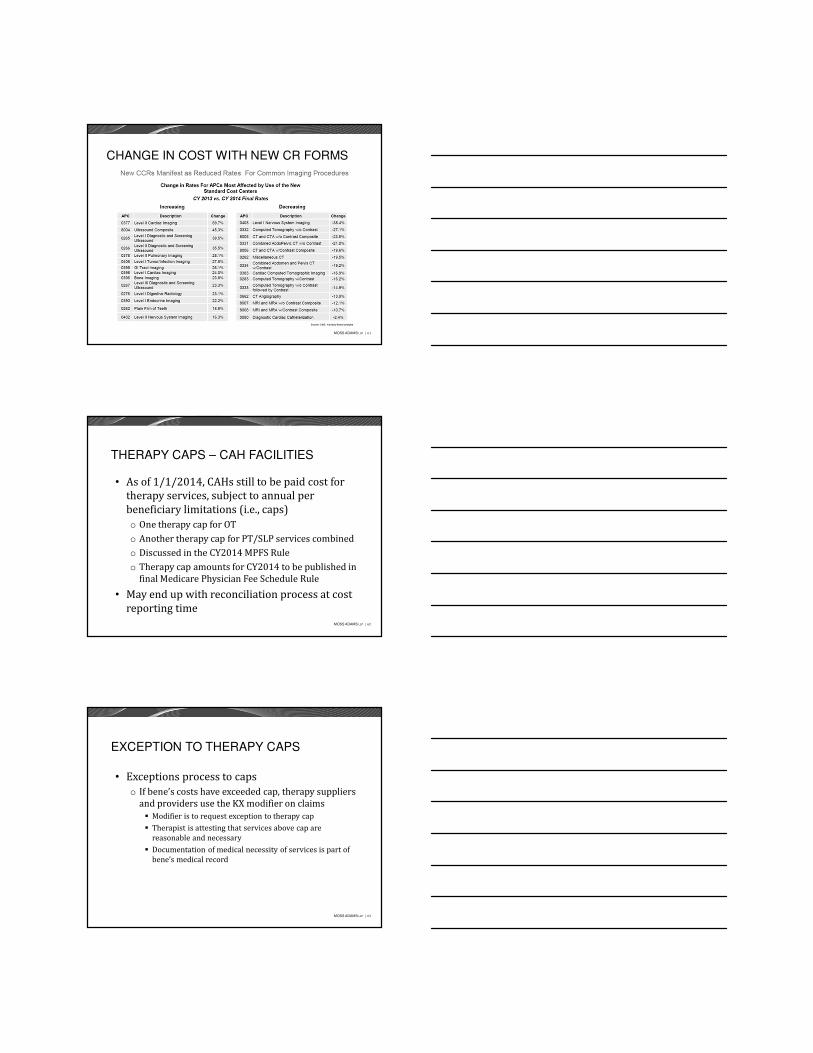
CHANGE IN COST WITH NEW CR FORMS
MOSS ADAMS LLP | 62
THERAPY CAPS – CAH FACILITIES
• As of 1/1/2014, CAHs still to be paid cost for therapy services, subject to annual per beneficiary limitations (i.e., caps)o One therapy cap for OTo Another therapy cap for PT/SLP services combinedo Discussed in the CY2014 MPFS Ruleo Therapy cap amounts for CY2014 to be published in
final Medicare Physician Fee Schedule Rule
• May end up with reconciliation process at cost reporting time
MOSS ADAMS LLP | 63
EXCEPTION TO THERAPY CAPS
• Exceptions process to capso If bene’s costs have exceeded cap, therapy suppliers
and providers use the KX modifier on claims� Modifier is to request exception to therapy cap� Therapist is attesting that services above cap are
reasonable and necessary� Documentation of medical necessity of services is part of
bene’s medical record
MOSS ADAMS LLP | 64
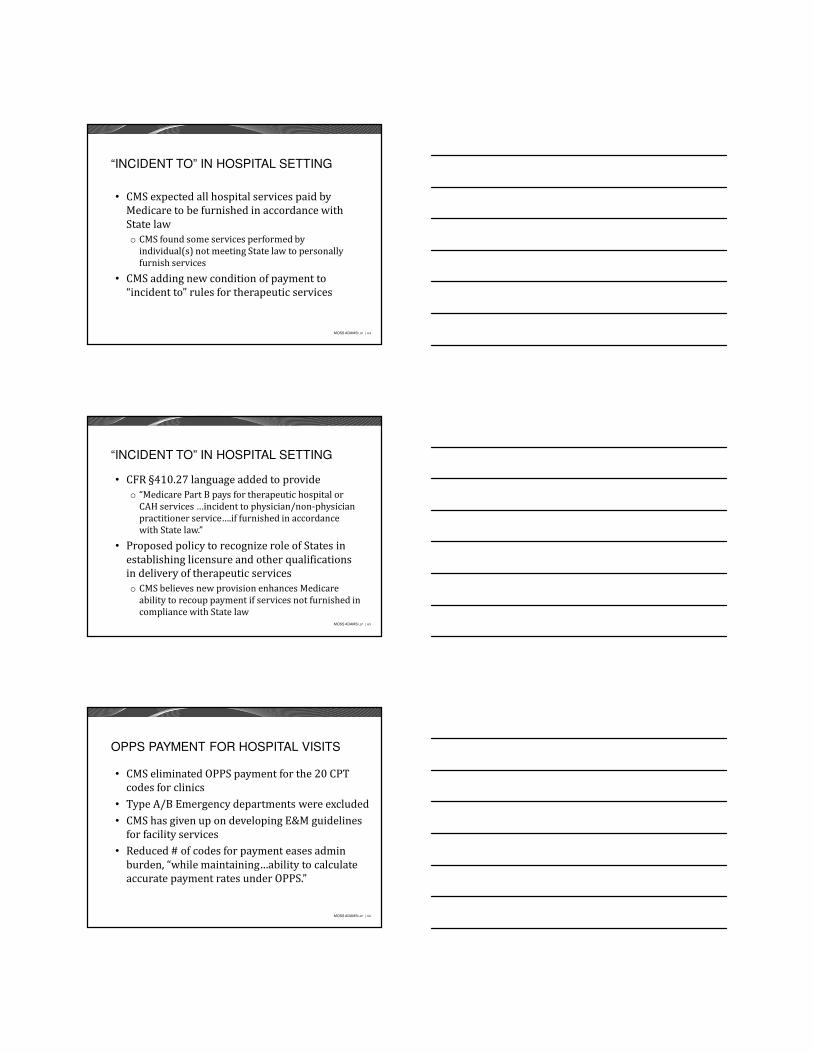
“INCIDENT TO” IN HOSPITAL SETTING
• CMS expected all hospital services paid by Medicare to be furnished in accordance with State lawo CMS found some services performed by
individual(s) not meeting State law to personally furnish services
• CMS adding new condition of payment to “incident to” rules for therapeutic services
MOSS ADAMS LLP | 65
“INCIDENT TO” IN HOSPITAL SETTING
• CFR §410.27 language added to provideo “Medicare Part B pays for therapeutic hospital or
CAH services …incident to physician/non-physician practitioner service….if furnished in accordance with State law.”
• Proposed policy to recognize role of States in establishing licensure and other qualifications in delivery of therapeutic serviceso CMS believes new provision enhances Medicare
ability to recoup payment if services not furnished in compliance with State law
MOSS ADAMS LLP | 66
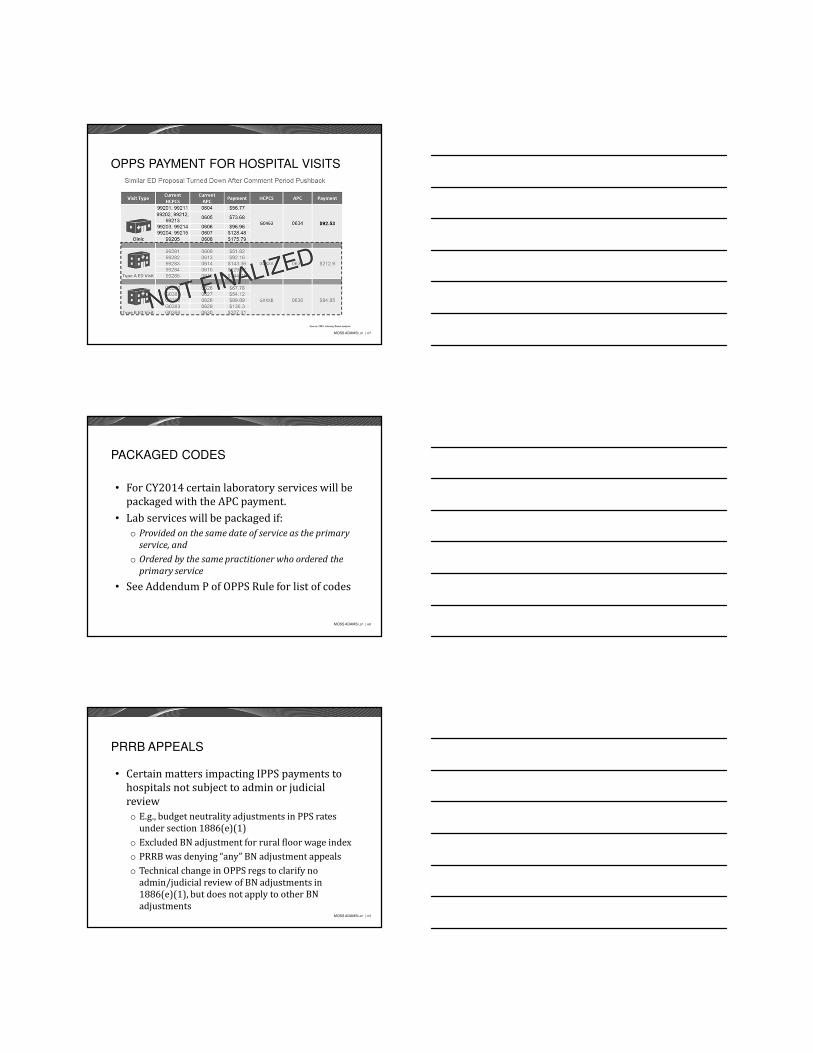
OPPS PAYMENT FOR HOSPITAL VISITS
• CMS eliminated OPPS payment for the 20 CPT codes for clinics
• Type A/B Emergency departments were excluded• CMS has given up on developing E&M guidelines
for facility services• Reduced # of codes for payment eases admin
burden, “while maintaining…ability to calculate accurate payment rates under OPPS.”
MOSS ADAMS LLP | 67
OPPS PAYMENT FOR HOSPITAL VISITS
MOSS ADAMS LLP | 68
PACKAGED CODES
• For CY2014 certain laboratory services will be packaged with the APC payment.
• Lab services will be packaged if:o Provided on the same date of service as the primary
service, and
o Ordered by the same practitioner who ordered the
primary service
• See Addendum P of OPPS Rule for list of codes
MOSS ADAMS LLP | 69
PRRB APPEALS
• Certain matters impacting IPPS payments to hospitals not subject to admin or judicial reviewo E.g., budget neutrality adjustments in PPS rates
under section 1886(e)(1)o Excluded BN adjustment for rural floor wage indexo PRRB was denying “any” BN adjustment appealso Technical change in OPPS regs to clarify no
admin/judicial review of BN adjustments in 1886(e)(1), but does not apply to other BN adjustments
MOSS ADAMS LLP | 70
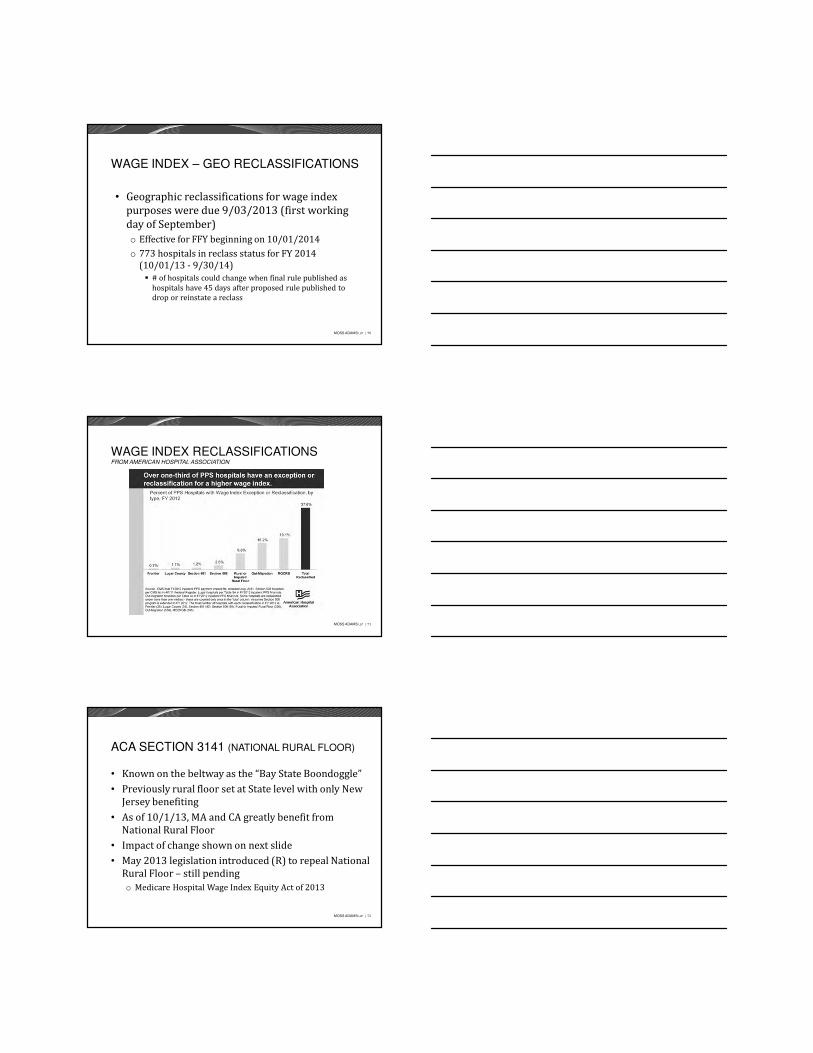
WAGE INDEX – GEO RECLASSIFICATIONS
• Geographic reclassifications for wage index purposes were due 9/03/2013 (first working day of September)o Effective for FFY beginning on 10/01/2014o 773 hospitals in reclass status for FY 2014
(10/01/13 - 9/30/14)� # of hospitals could change when final rule published as
hospitals have 45 days after proposed rule published to drop or reinstate a reclass
MOSS ADAMS LLP | 71
WAGE INDEX RECLASSIFICATIONSFROM AMERICAN HOSPITAL ASSOCIATION
MOSS ADAMS LLP | 72
ACA SECTION 3141 (NATIONAL RURAL FLOOR)
• Known on the beltway as the “Bay State Boondoggle”• Previously rural floor set at State level with only New
Jersey benefiting• As of 10/1/13, MA and CA greatly benefit from
National Rural Floor• Impact of change shown on next slide• May 2013 legislation introduced (R) to repeal National
Rural Floor – still pendingo Medicare Hospital Wage Index Equity Act of 2013
MOSS ADAMS LLP | 73
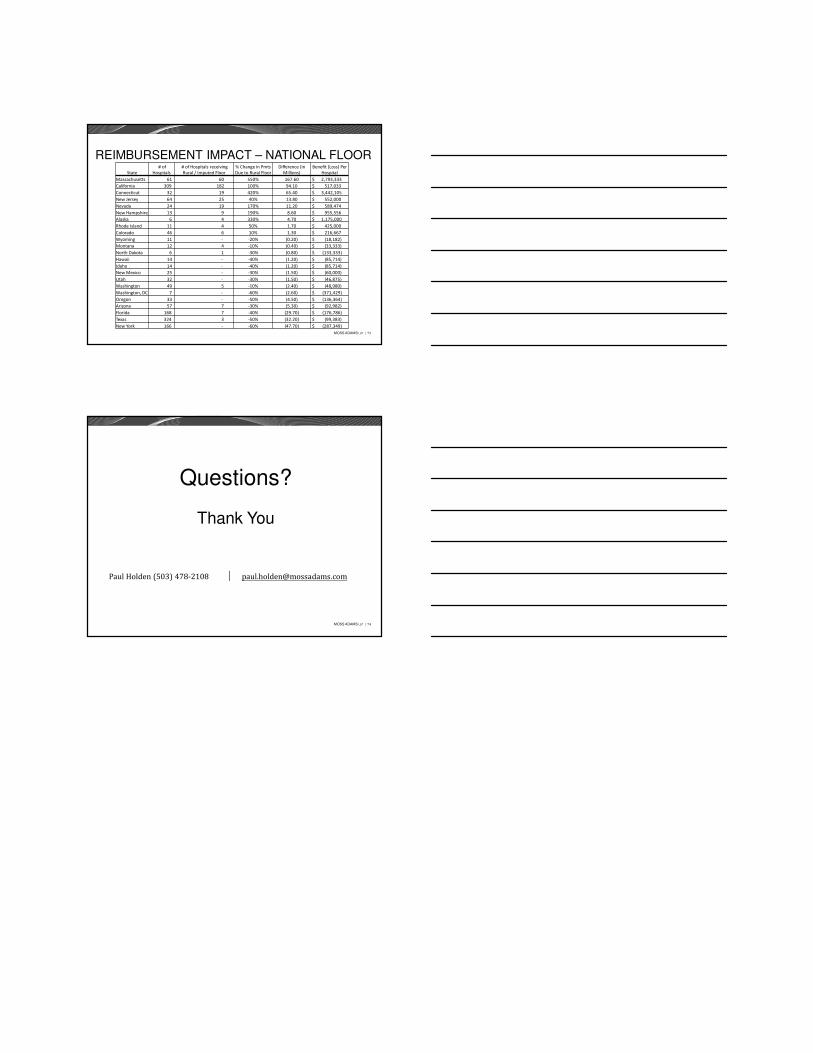
REIMBURSEMENT IMPACT – NATIONAL FLOOR
State
# of
Hospitals
# of Hospitals receiving
Rural / Imputed Floor
% Change in Pmts
Due to Rural Floor
Difference (in
Millions)
Benefit (Loss) Per
Hospital
Massachusetts 61 60 550% 167.60 $ 2,793,333
California 309 182 100% 94.10 $ 517,033
Connecticut 32 19 420% 65.40 $ 3,442,105
New Jersey 64 25 40% 13.80 $ 552,000
Nevada 24 19 170% 11.20 $ 589,474
New Hampshire 13 9 190% 8.60 $ 955,556
Alaska 6 4 330% 4.70 $ 1,175,000
Rhode Island 11 4 50% 1.70 $ 425,000
Colorado 46 6 10% 1.30 $ 216,667
Wyoming 11 - -20% (0.20) $ (18,182)
Montana 12 4 -10% (0.40) $ (33,333)
North Dakota 6 1 -30% (0.80) $ (133,333)
Hawaii 14 - -40% (1.20) $ (85,714)
Idaho 14 - -40% (1.20) $ (85,714)
New Mexico 25 - -30% (1.50) $ (60,000)
Utah 32 - -30% (1.50) $ (46,875)
Washington 49 5 -10% (2.40) $ (48,980)
Washington, DC 7 - -60% (2.60) $ (371,429)
Oregon 33 - -50% (4.50) $ (136,364)
Arizona 57 7 -30% (5.30) $ (92,982)
Florida 168 7 -40% (29.70) $ (176,786)
Texas 324 3 -50% (32.20) $ (99,383)
New York 166 - -60% (47.70) $ (287,349)
MOSS ADAMS LLP | 74
Questions?
Thank You
Paul Holden (503) 478-2108 │ [email protected]