Embed Size (px)
Citation preview
HCA 202: Epidemiological Concepts for Health Care Managers
Dr. Chris Cochran
Associate Professor
895-1400

Course Outline
Description of course syllabus The descriptive nature of epidemiology Using epidemiological analytical tools for
investigating disease, illness and injuries Applying epidemiological tools to the health
care industry Class presentation
What is Health
A state of complete physical, mental and social well-being, not merely the absence of disease or infirmity (WHO).
Preventing premature death and preventing disability, preserving a physical environment that supports human life, cultivating family and community support, enhancing each individual’s inherent abilities to respond to and to act, and assuring that all Americans achieve and maintain a maximum level of functioning. (Healthy People 2010)
Earliest definition of Epidemiology
“Whoever wishes to pursue properly the science of medicine … ought to consider:
The effects of the season of the year The hot winds and the cold The properties of the waters The setting of the town The behavior of the people
Hippocrates

Relationship between Education and Income
What is Epidemiology
Old: Science of the distribution of diseases of mankind (1889).
Course definition: The study of the distribution and determinants of diseases and injuries in human populations.
Think about these two definitions in their context, why does the second one apply more today than the earlier version?
The Relationship of Epidemiology to Health Care Managers
To understand the increase/decrease in size of service populations
To understand the characteristics and health status of the population for planning purposes
To understand the consequences of health care problems To mesh the service organizations to the needs of the
population To monitor performance by the organizations To modify the structure and processes and respond to
environmental change To better formulate and evaluate public policy
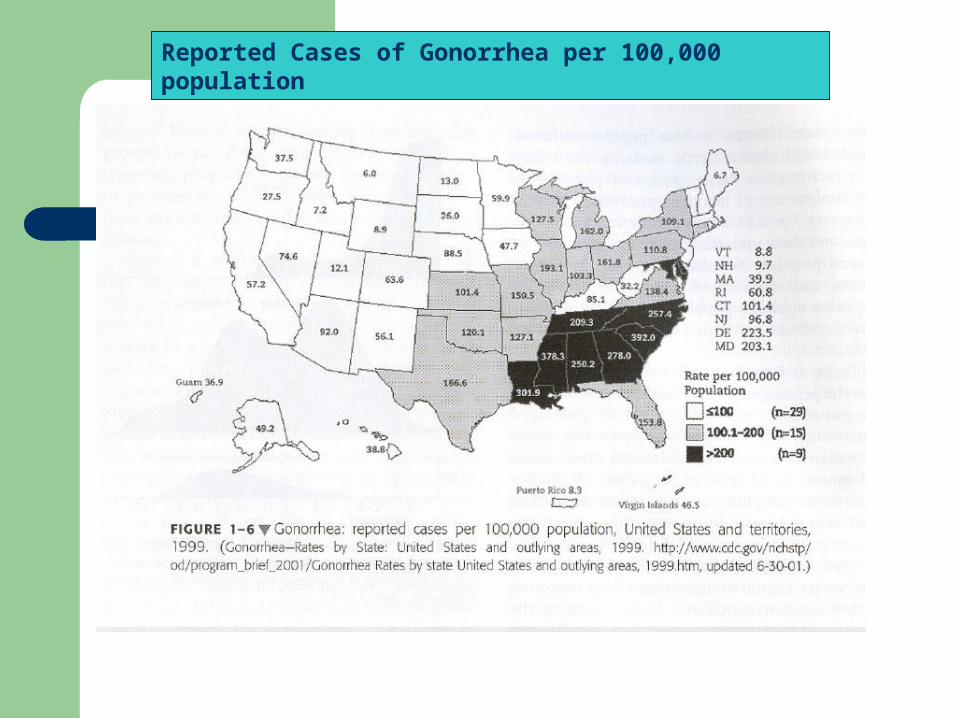
Reported Cases of Gonorrhea per 100,000 population

Life Expectancy at Birth
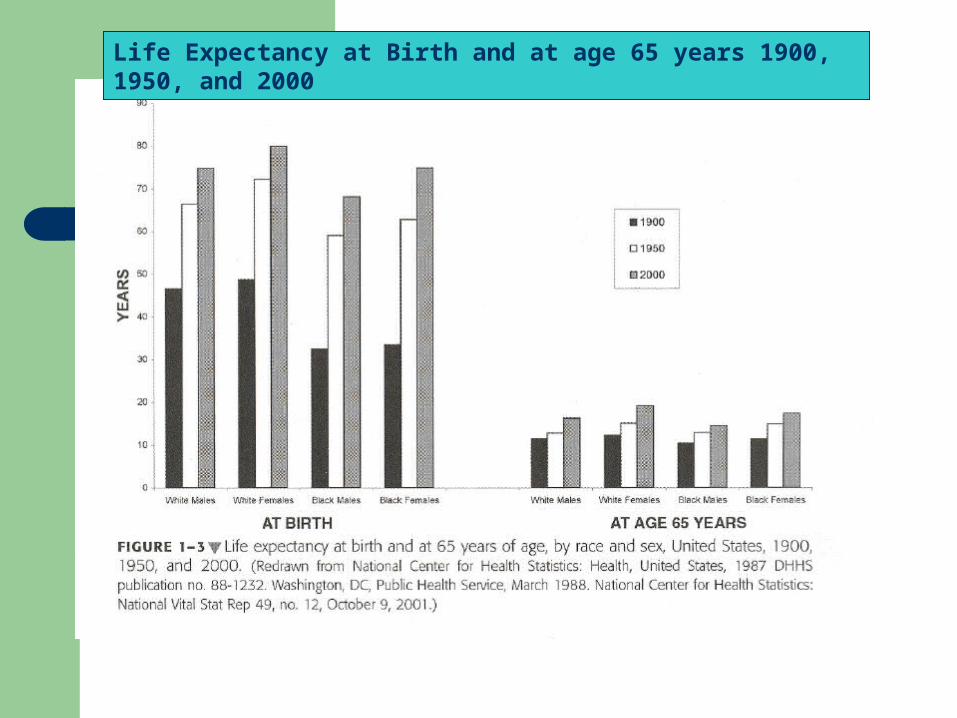
Life Expectancy at Birth and at age 65 years 1900, 1950, and 2000
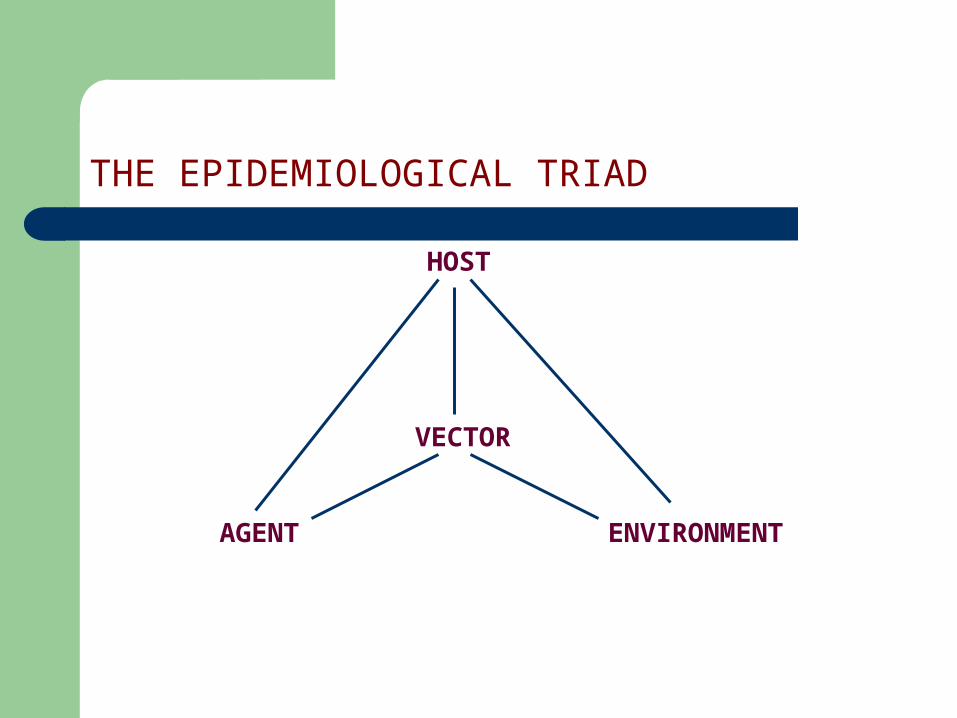
THE EPIDEMIOLOGICAL TRIAD
HOST
VECTOR
AGENT ENVIRONMENT

Developed primarily for infectious diseases Shifts in disease patterns have diminished the
agent’s role and broadened the scope of host and environment
Relies on the assumption of a single cause/single effect model (multiple factors may be at play)
Does not include enough about illness or injury
Problem with the Model
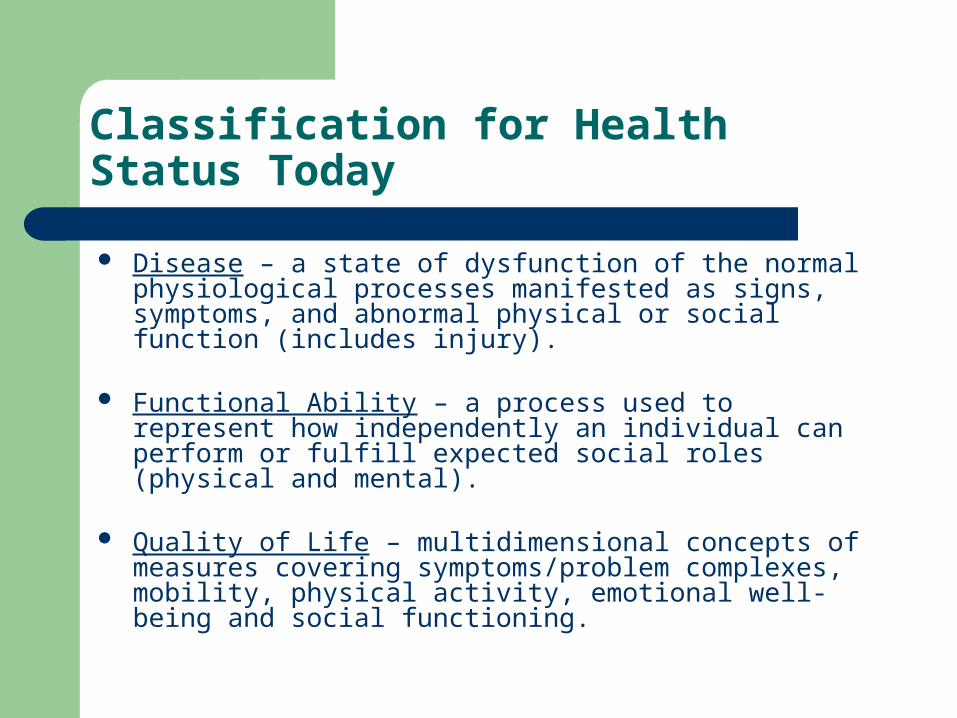
Classification for Health Status Today
Disease – a state of dysfunction of the normal physiological processes manifested as signs, symptoms, and abnormal physical or social function (includes injury).
Functional Ability – a process used to represent how independently an individual can perform or fulfill expected social roles (physical and mental).
Quality of Life – multidimensional concepts of measures covering symptoms/problem complexes, mobility, physical activity, emotional well-being and social functioning.
Descriptive Epidemiology
Using Rates to Give a Snapshot of Health

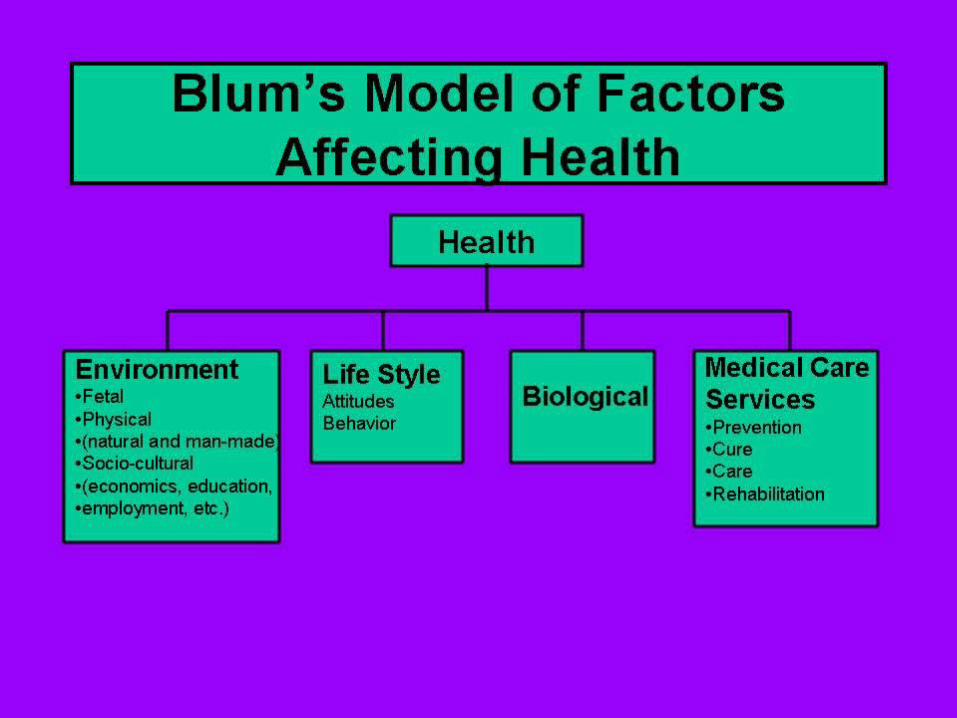
The Four Factors Affecting Health
Environment (physical and social) Lifestyle/Behavior Biology (Gene pool) Health care services
Practical Use of Determinants of Health
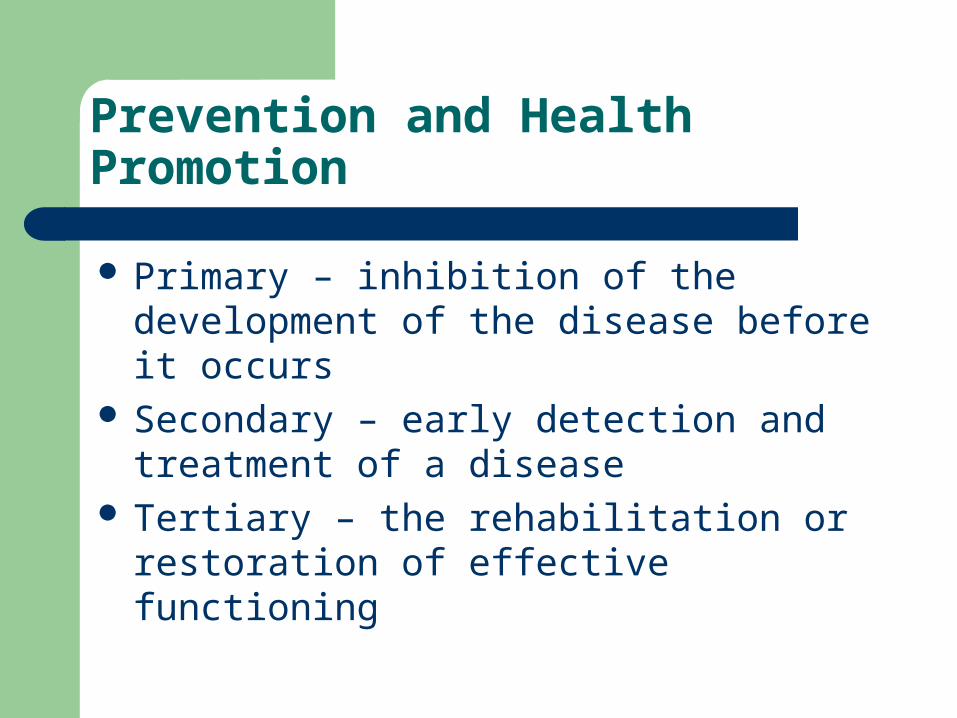
Prevention and Health Promotion
Primary – inhibition of the development of the disease before it occurs
Secondary – early detection and treatment of a disease
Tertiary – the rehabilitation or restoration of effective functioning
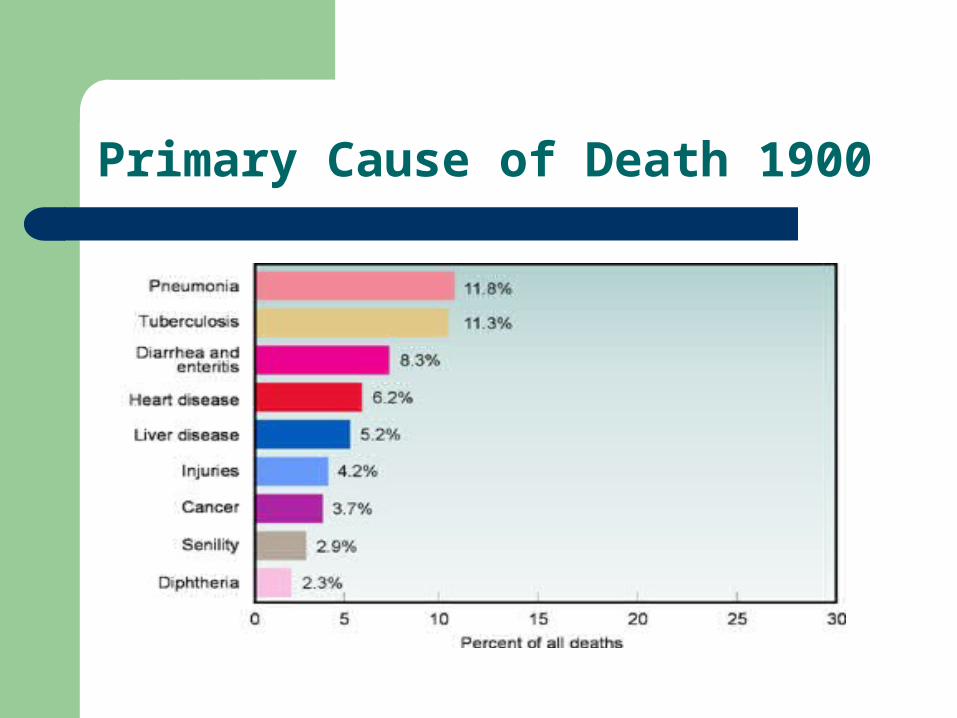
Primary Cause of Death 1900
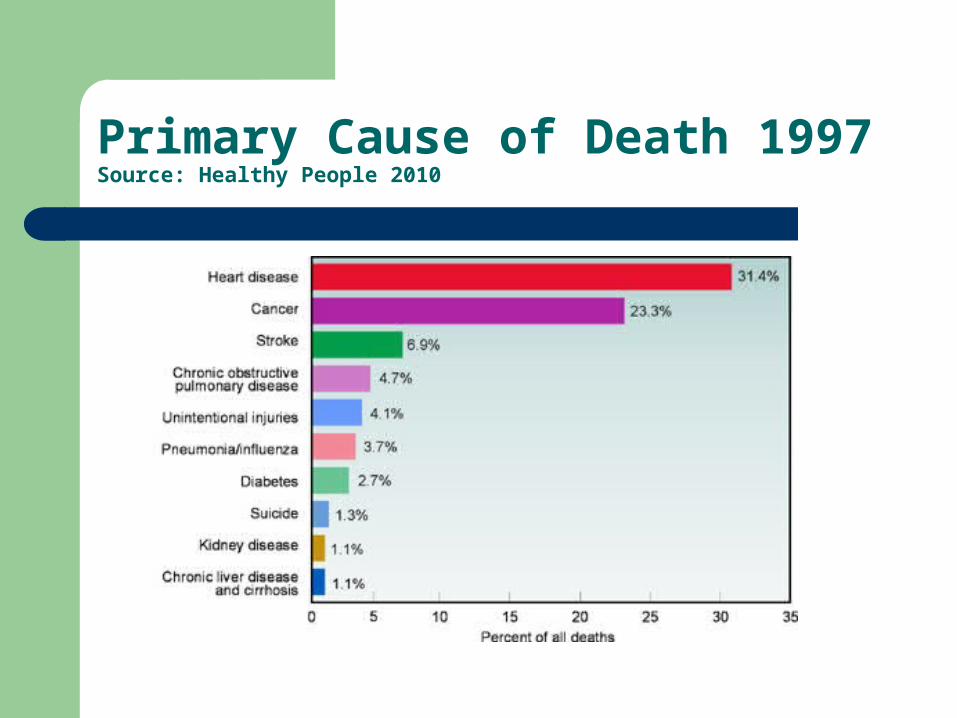
Primary Cause of Death 1997Source: Healthy People 2010
Comparing U.S. with Other Countries
Healthy People 2010 Site See Death rates by country See primary causes of death by age group
Descriptive Epidemiology – Understanding Person, Place and Time
Person Measures– Age– Sex– Ethnic group and race– Social class/social-economic status
Place Measures
Place – related by natural barriers or by political boundaries.– Natural boundaries – characterized by particular
environmental or climatic condition (temperature, humidity, rainfall, altitude, mineral content, etc.).
– Place diseases – parasitic diseases that may be due to certain factors such as tropics, temperate, or other conditions.
– Political subdivisions – vary from entire nations to counties, cities, towns, and boroughs

Time and Place
Time – basic aspect of epidemiology– Secular trends (long-term variations, which occur
over periods of time including years and decades). Good for studying "birth cohorts".
– Cyclic change – recurrent alteration in the frequency of disease (seasonal changes, for example – influenza)
Clusters in time and place – difficult to determine the significance of linkages because there is no defined denominator
Using Rates In Epidemiology
Numerator - the number of people/cases with the disease
Denominator - (the population at risk)
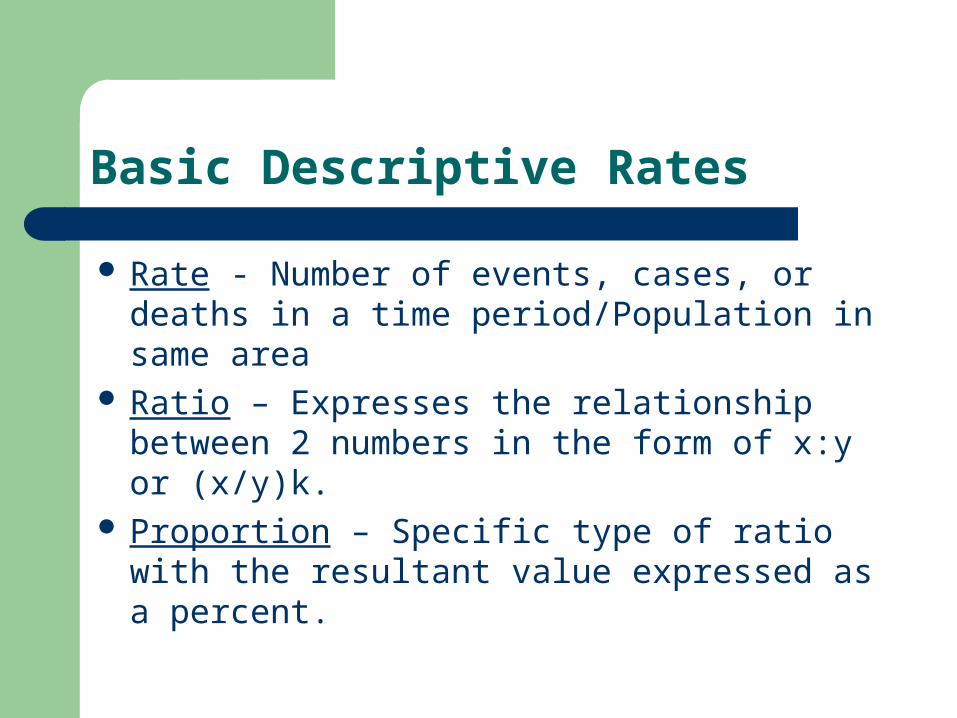
Basic Descriptive Rates
Rate - Number of events, cases, or deaths in a time period/Population in same area
Ratio – Expresses the relationship between 2 numbers in the form of x:y or (x/y)k.
Proportion – Specific type of ratio with the resultant value expressed as a percent.
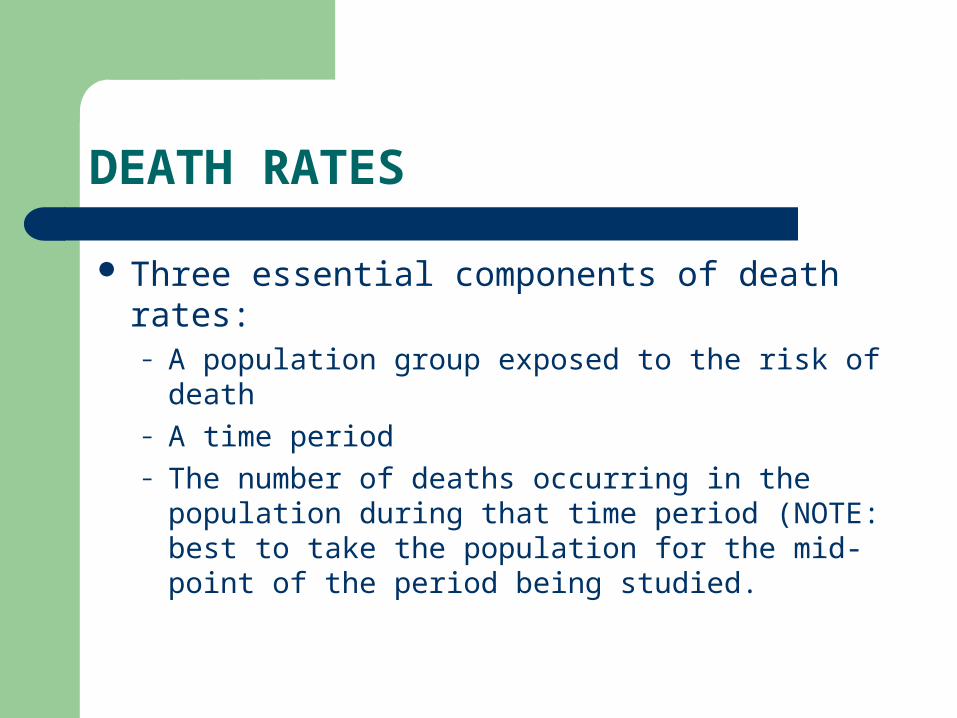
DEATH RATES
Three essential components of death rates:– A population group exposed to the risk of death– A time period– The number of deaths occurring in the population
during that time period (NOTE: best to take the population for the mid-point of the period being studied.
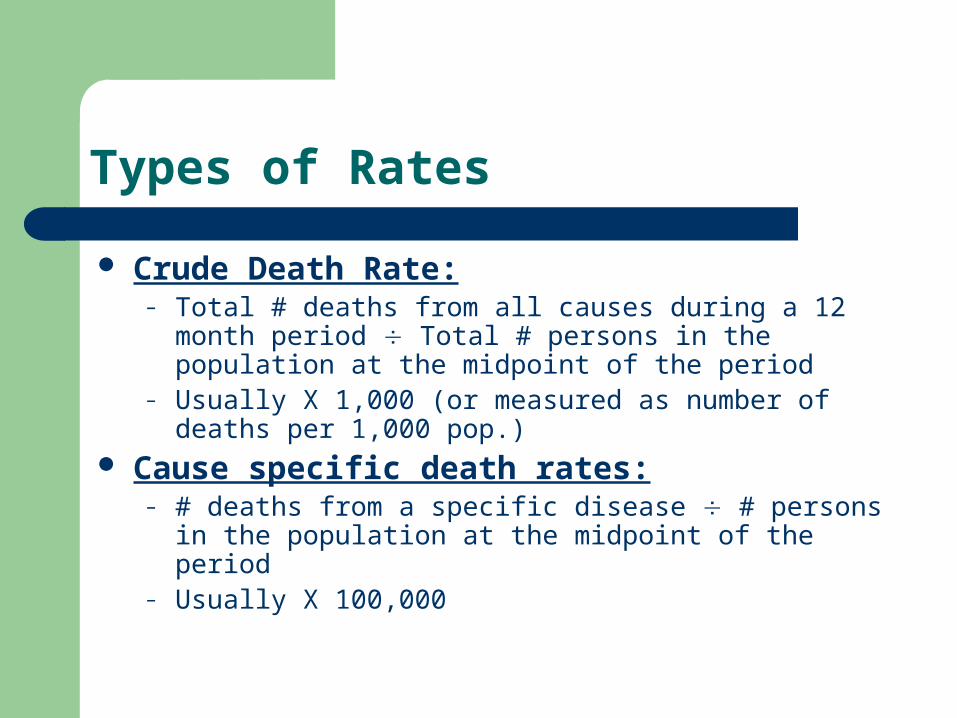
Types of Rates
Crude Death Rate:– Total # deaths from all causes during a 12 month period
Total # persons in the population at the midpoint of the period
– Usually X 1,000 (or measured as number of deaths per 1,000 pop.)
Cause specific death rates:– # deaths from a specific disease # persons in the
population at the midpoint of the period– Usually X 100,000
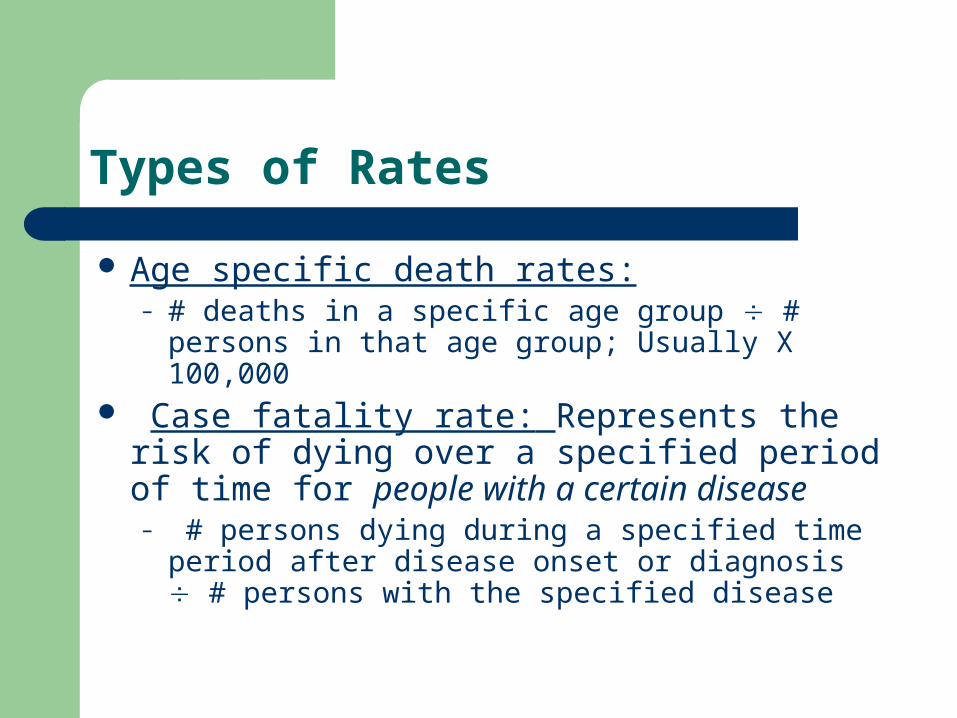
Types of Rates
Age specific death rates:– # deaths in a specific age group # persons in
that age group; Usually X 100,000 Case fatality rate: Represents the risk of
dying over a specified period of time for people with a certain disease– # persons dying during a specified time period
after disease onset or diagnosis # persons with the specified disease
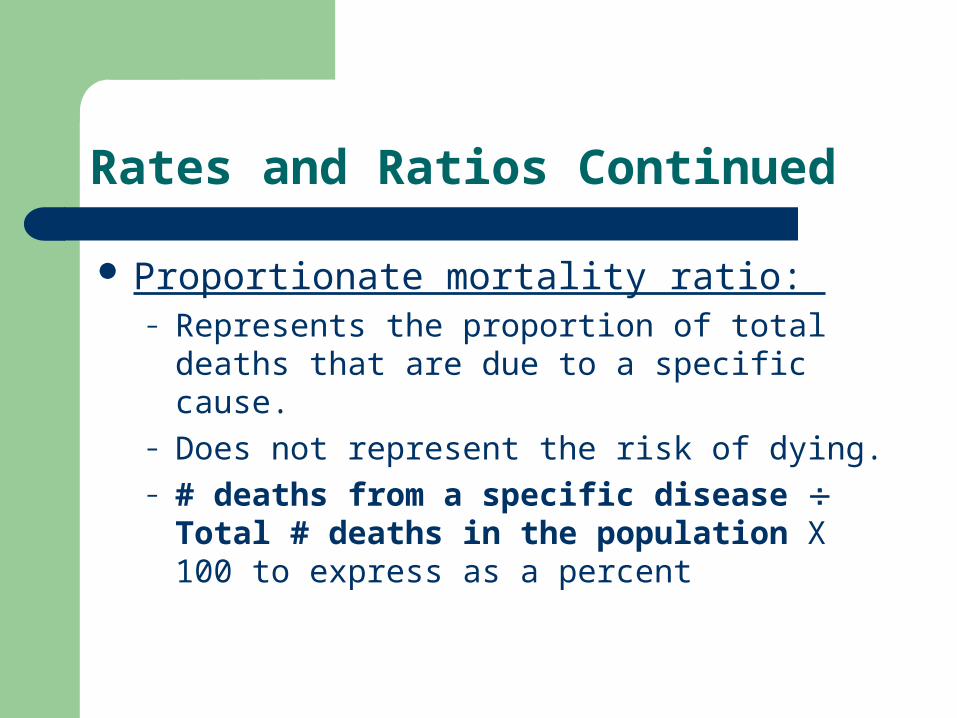
Rates and Ratios Continued
Proportionate mortality ratio: – Represents the proportion of total deaths that are
due to a specific cause. – Does not represent the risk of dying.– # deaths from a specific disease Total #
deaths in the population X 100 to express as a percent
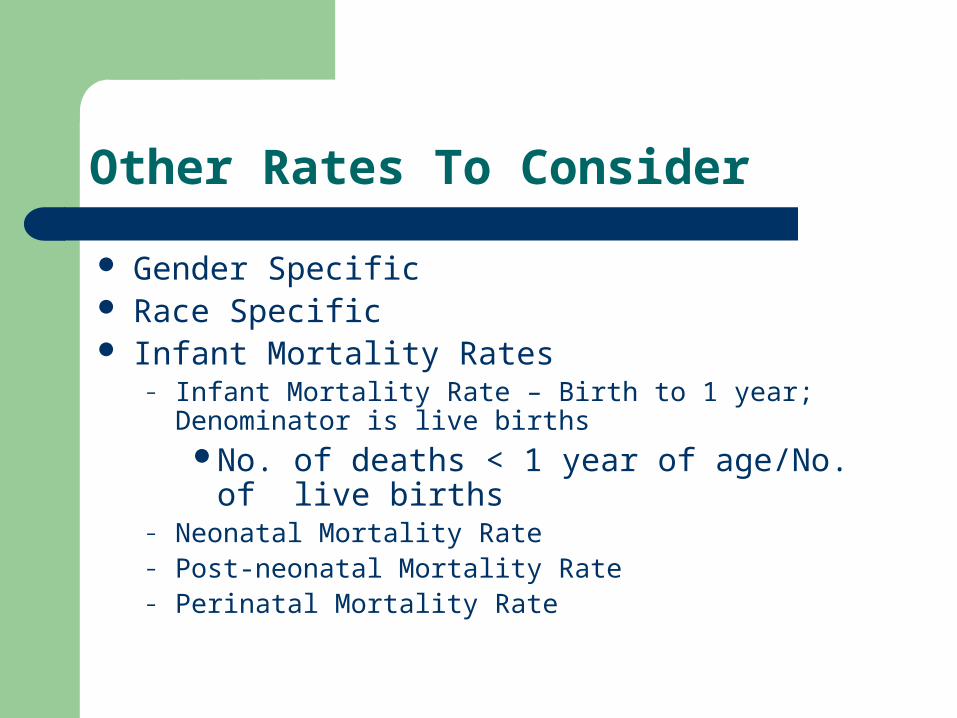
Other Rates To Consider
Gender Specific Race Specific Infant Mortality Rates
– Infant Mortality Rate – Birth to 1 year; Denominator is live births
No. of deaths < 1 year of age/No. of live births – Neonatal Mortality Rate – Post-neonatal Mortality Rate – Perinatal Mortality Rate
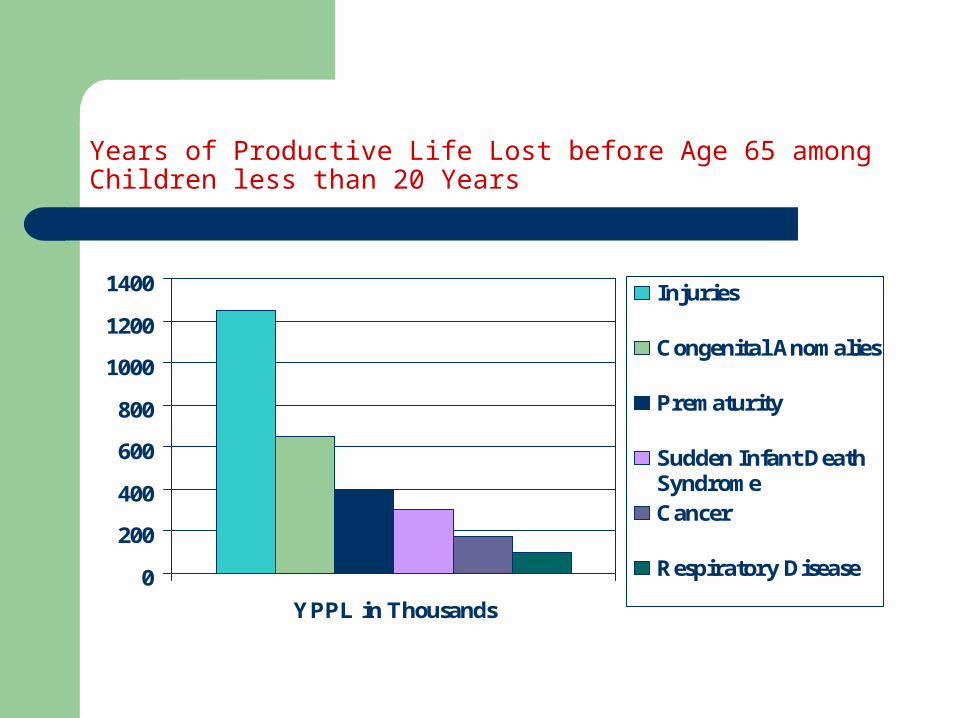
Years of Productive Life Lost before Age 65 among Children less than 20 Years
0
200
400
600
800
1000
1200
1400
YPPL in Thousands
Injuries
Congenital Anomalies
Prematurity
Sudden Infant DeathSyndromeCancer
Respiratory Disease
Incidence And PrevalenceKnowing Which Is Which
Incidence measures the number of new cases in an at-risk population
Prevalence measures the number of existing cases in an at-risk population
Point Prevalence - the number of existing cases of a disease at a specific period of time. This includes new cases (Incidence).
Period Prevalence - refers to the number of cases during a period or interval. This can include new and recurring cases.
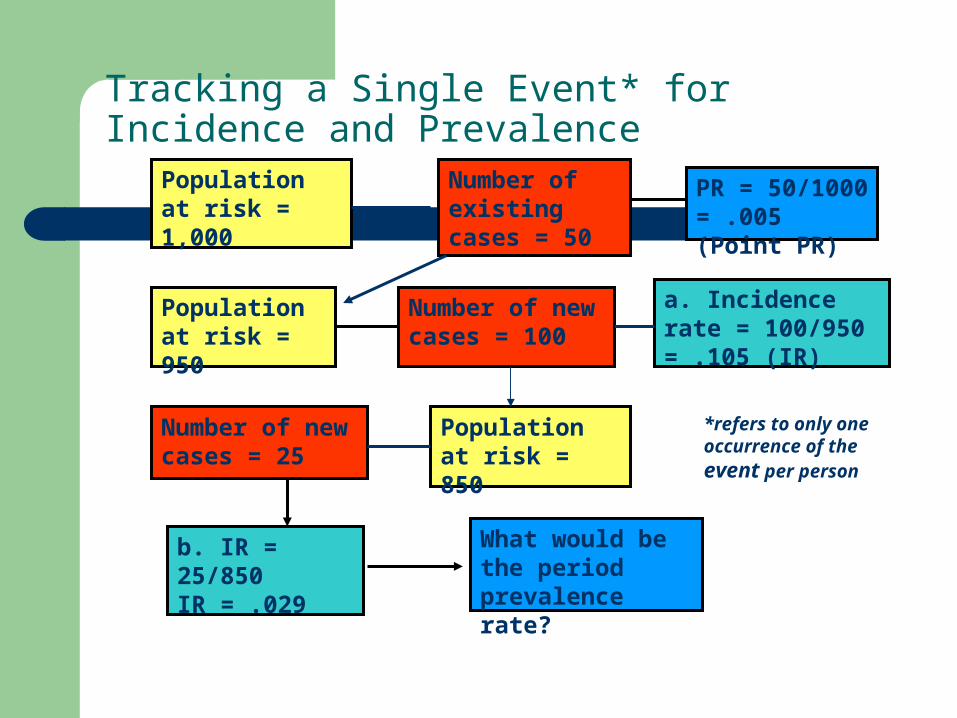
Population at risk = 1,000
Number of existing cases = 50
Population at risk = 950
PR = 50/1000 = .005 (Point PR)
Number of new cases = 100
a. Incidence rate = 100/950 = .105 (IR)
Population at risk = 850
Number of new cases = 25
b. IR = 25/850 IR = .029
What would be the period prevalence rate?
Tracking a Single Event* for Incidence and Prevalence
*refers to only one occurrence of the event per person
Uses of Incidence and Prevalence
Prevalence is useful as planning tool Can be used to express burden of some attribute in
the population Can monitor control programs for chronic illness Point prevalence can track illness over time Incidence rates are fundamental tools for etiologic
studies of acute and chronic illness
Uses of Incidence and Prevalence
Comparing incidence between groups is useful for measuring affects of risk between populations
High prevalence does not signify risk, it may merely reflect a change in survival rate
Low prevalence may reflect a rapidly fatal disease (or easily curable)
Prevalence favors inclusion of chronic illness over acute illness


![Stephen Cochran Poster[1]](https://img.pdfslide.us/doc/110x75/55c45062bb61eb0c5e8b45f0/stephen-cochran-poster1.jpg)