Embed Size (px)
Citation preview
M A Y 2 0 2 1
2
Forward-looking StatementsThese presentation slides and the related presentation contain certain forward-looking statements, as defined under U.S. federal securities laws, with respect to our long-term goals and trends associated with our business, as well as guidance or projections as to future performance. These forward-looking statements are based on our current intent, beliefs, plans and expectations. The audience is cautioned not to place any undue reliance on any forward-looking statements. Forward-looking statements necessarily involve risks and uncertainties, many of which are outside of our control, that could cause actual results to differ materially from such statements and from our historical results and experience. These risks and uncertainties include such things as:
• our ability to successfully execute our Full Potential plan to achieve the desired results;
• the potential impacts of the COVID-19 pandemic, including on consumer spending, global supply chains and the financial markets;
• the highly competitive and evolving nature of the industry in which we compete;
• the rapidly changing retail environment;
• our reliance on a relatively small number of customers for a significant portion of our sales;
• any inadequacy, interruption, integration failure or security failure with respect to our information technology;
• the impact of significant fluctuations and volatility in various input costs, such as cotton and oil-related materials, utilities, freight and wages;
• our ability to attract and retain a senior management team with the core competencies needed to support our growth in global markets;
• significant fluctuations in foreign exchange rates;
• legal, regulatory, political and economic risks related to our international operations;
• our ability to effectively manage our complex multinational tax structure; and
• other risks identified from time to time in our most recent Securities and Exchange Commission reports, including our annual report on Form 10-K and quarterly reports on Form 10-Q.
Since it is not possible to predict or identify all of the risks, uncertainties and other factors that may affect future results, the above list should not be considered a complete list. Any forward-looking statement speaks only as of the date on which such statement is made, and Hanesbrands undertakes no obligation to update or revise any forward-looking statement, whether as a result of new information, future events or otherwise, other than as required by law.
Non-GAAP Terms and DefinitionsTo supplement financial guidance prepared in accordance with GAAP, this presentation contains historical financial results and projections concerning certain non-GAAP financial measures, including adjusted EPS, adjusted net income, adjusted operating profit (and margin), free cash flow, EBITDA, adjusted EBITDA and net debt to EBIDTA. Please see the attached Appendix for more information regarding the definition of these non-GAAP financial measures and a reconciliation to the most directly comparable GAAP financial measure. Hanesbrands is unable to reconcile projections of financial performance beyond 2021 without unreasonable efforts, because the company cannot predict, with a reasonable degree of certainty, the type and extent of certain items that would be expected to impact these figures in 2022 and beyond, such as net sales, operating profit, tax rates and action related charges.
SAFE HARBOR
3
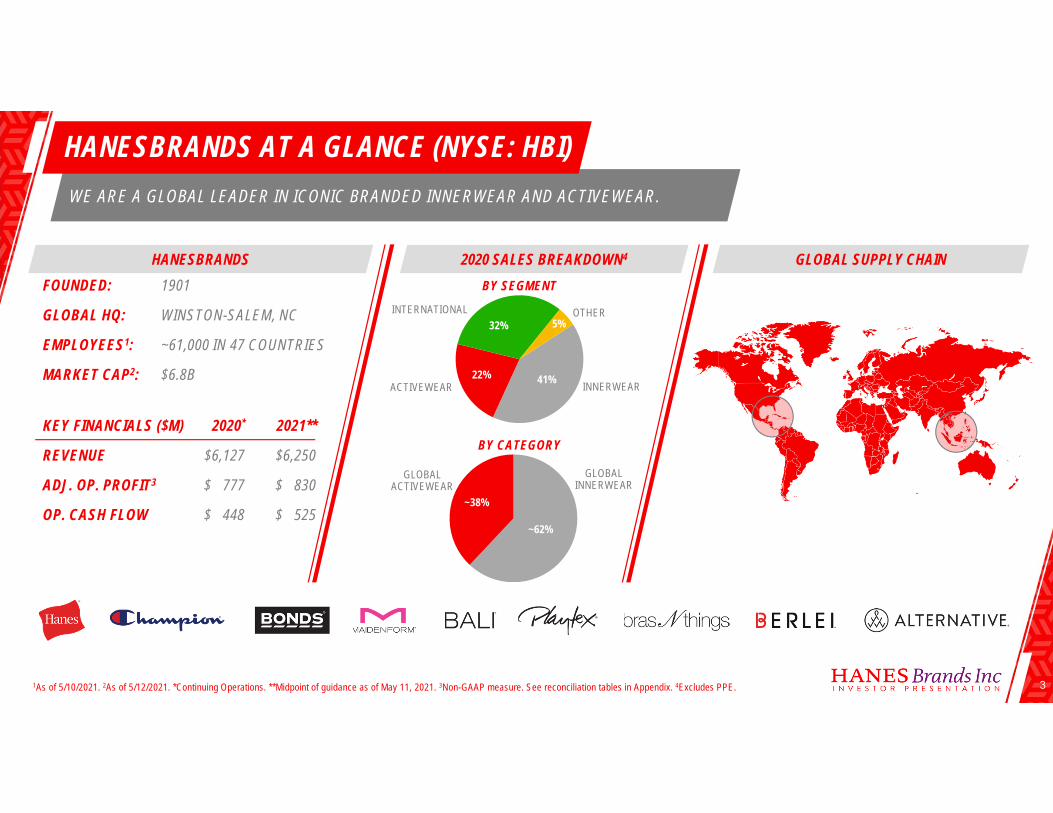
WE ARE A GLOBAL LEADER IN ICONIC BRANDED INNERWEAR AND ACTIVEWEAR.
HANESBRANDS AT A GLANCE (NYSE: HBI)
1As of 5/10/2021. 2As of 5/12/2021. *Continuing Operations. **Midpoint of guidance as of May 11, 2021. 3Non-GAAP measure. See reconciliation tables in Appendix. 4Excludes PPE.
457%
~38%
~62%
41%22%
5%32%
FOUNDED: 1901
GLOBAL HQ: WINSTON-SALEM, NC
EMPLOYEES1: ~61,000 IN 47 COUNTRIES
MARKET CAP2: $6.8B
KEY FINANCIALS ($M) 2020* 2021**
REVENUE $6,127 $6,250
ADJ. OP. PROFIT3 $ 777 $ 830
OP. CASH FLOW $ 448 $ 525
BY SEGMENT
BY CATEGORY
OTHER
GLOBALINNERWEAR
INTERNATIONAL
ACTIVEWEAR
GLOBALACTIVEWEAR
INNERWEAR
HANESBRANDS GLOBAL SUPPLY CHAIN2020 SALES BREAKDOWN4
4
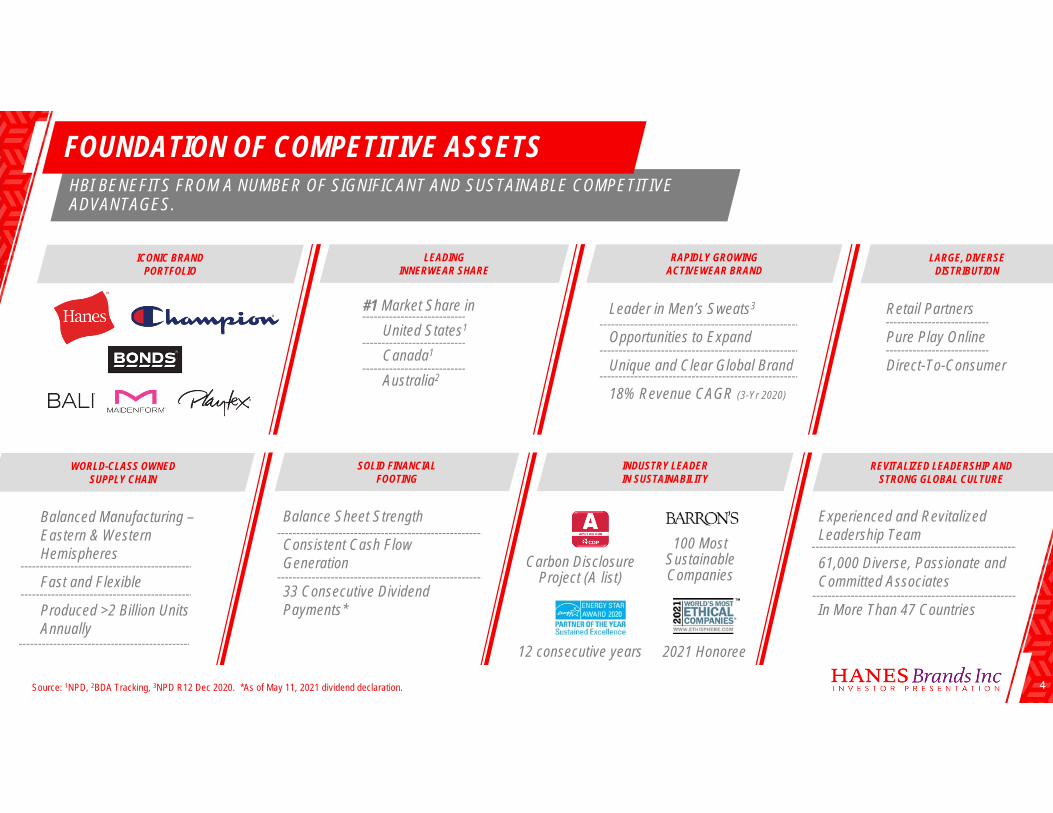
ICONIC BRANDPORTFOLIO
LEADINGINNERWEAR SHARE
LARGE, DIVERSEDISTRIBUTION
FOUNDATION OF COMPETITIVE ASSETS
RAPIDLY GROWINGACTIVEWEAR BRAND
HBI BENEFITS FROM A NUMBER OF SIGNIFICANT AND SUSTAINABLE COMPETITIVE ADVANTAGES.
Balanced Manufacturing –Eastern & Western Hemispheres
Fast and Flexible
Produced >2 Billion Units Annually
Experienced and Revitalized Leadership Team
61,000 Diverse, Passionate and Committed Associates
In More Than 47 Countries
Retail Partners
Pure Play Online
Direct-To-Consumer
Leader in Men’s Sweats3
Opportunities to Expand
Unique and Clear Global Brand
18% Revenue CAGR (3-Yr 2020)
#1 Market Share inUnited States1
Canada1
Australia2
WORLD-CLASS OWNED SUPPLY CHAIN
SOLID FINANCIALFOOTING
INDUSTRY LEADER IN SUSTAINABILITY
REVITALIZED LEADERSHIP AND STRONG GLOBAL CULTURE
12 consecutive years
Carbon Disclosure Project (A list)
2021 Honoree
100 Most Sustainable Companies
Balance Sheet Strength
Consistent Cash Flow Generation
33 Consecutive Dividend Payments*
Source: 1NPD, 2BDA Tracking, 3NPD R12 Dec 2020. *As of May 11, 2021 dividend declaration.
5
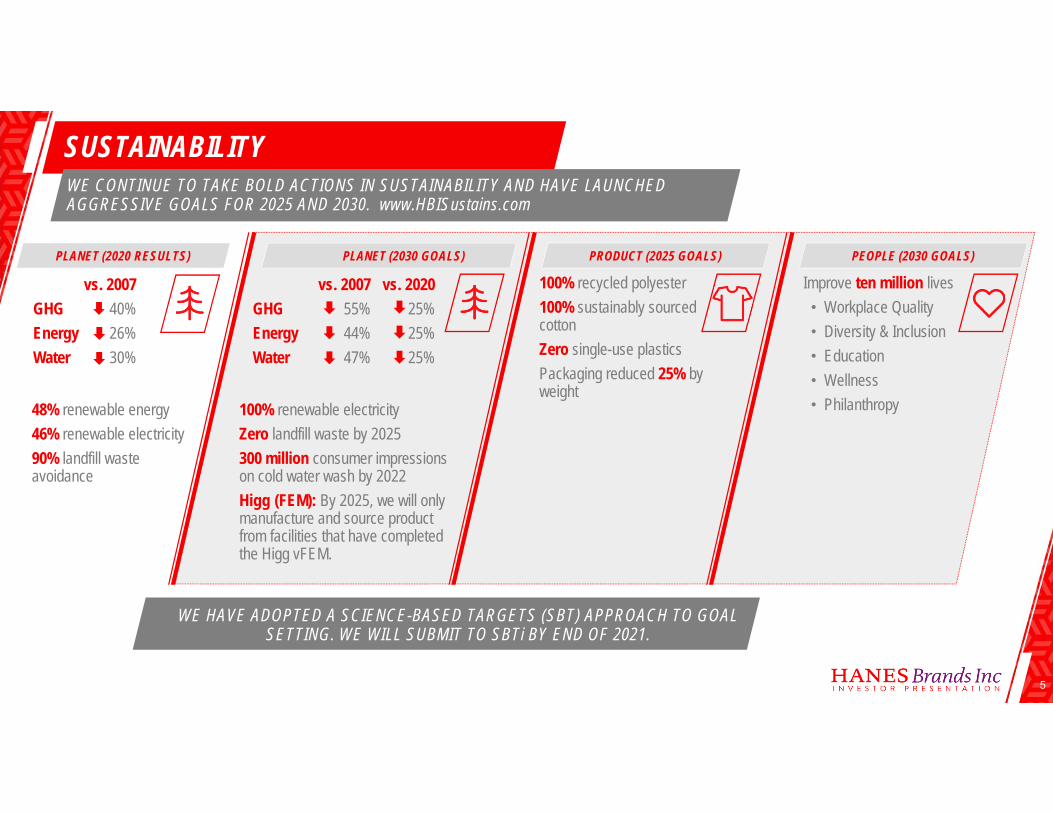
SUSTAINABILITY
100% recycled polyester 100% sustainably sourced cotton Zero single-use plastics Packaging reduced 25% by weight
Improve ten million lives • Workplace Quality• Diversity & Inclusion • Education• Wellness• Philanthropy100% renewable electricity
Zero landfill waste by 2025300 million consumer impressions on cold water wash by 2022Higg (FEM): By 2025, we will only manufacture and source product from facilities that have completed the Higg vFEM.
48% renewable energy46% renewable electricity 90% landfill waste avoidance
vs. 2007 vs. 2020GHG 55% 25%Energy 44% 25%Water 47% 25%
PLANET (2030 GOALS) PRODUCT (2025 GOALS) PEOPLE (2030 GOALS)PLANET (2020 RESULTS)
vs. 2007GHG 40%Energy 26%Water 30%
WE HAVE ADOPTED A SCIENCE-BASED TARGETS (SBT) APPROACH TO GOAL SETTING. WE WILL SUBMIT TO SBTi BY END OF 2021.
WE CONTINUE TO TAKE BOLD ACTIONS IN SUSTAINABILITY AND HAVE LAUNCHED AGGRESSIVE GOALS FOR 2025 AND 2030. www.HBISustains.com
6
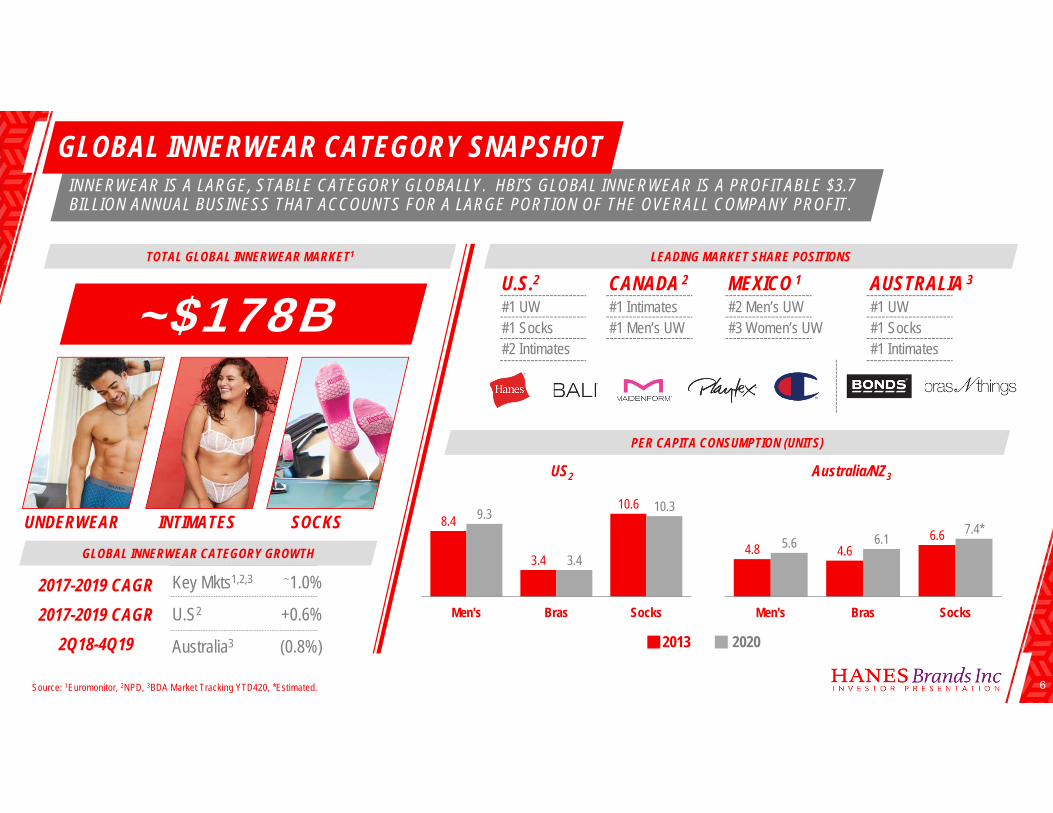
~$178B
Key Mkts1,2,3 ~1.0%
U.S2 +0.6%
Australia3 (0.8%)
TOTAL GLOBAL INNERWEAR MARKET1
KEY MESSAGE TEXT KEY MESSAGE TEXT KEY MESSAGE TEXTKEY MESSAGE TEXT KEY MESSAGE TEXT
UNDERWEAR SOCKSINTIMATES
Source: 1Euromonitor, 2NPD, 3BDA Market Tracking YTD420, *Estimated.
LEADING MARKET SHARE POSITIONS
2017-2019 CAGR2017-2019 CAGR
2Q18-4Q19
8.4
3.4
10.69.3
3.4
10.3
Men's Bras Socks
4.8 4.66.65.6 6.1
7.4*
Men's Bras Socks
PER CAPITA CONSUMPTION (UNITS)
2013
Australia/NZ3
2020
US2
INNERWEAR IS A LARGE, STABLE CATEGORY GLOBALLY. HBI’S GLOBAL INNERWEAR IS A PROFITABLE $3.7 BILLION ANNUAL BUSINESS THAT ACCOUNTS FOR A LARGE PORTION OF THE OVERALL COMPANY PROFIT.
GLOBAL INNERWEAR CATEGORY SNAPSHOT
GLOBAL INNERWEAR CATEGORY GROWTH
U.S.2#1 UW#1 Socks#2 Intimates
CANADA 2
#1 Intimates#1 Men’s UW
MEXICO 1
#2 Men’s UW#3 Women’s UW
AUSTRALIA 3
#1 UW#1 Socks#1 Intimates
7
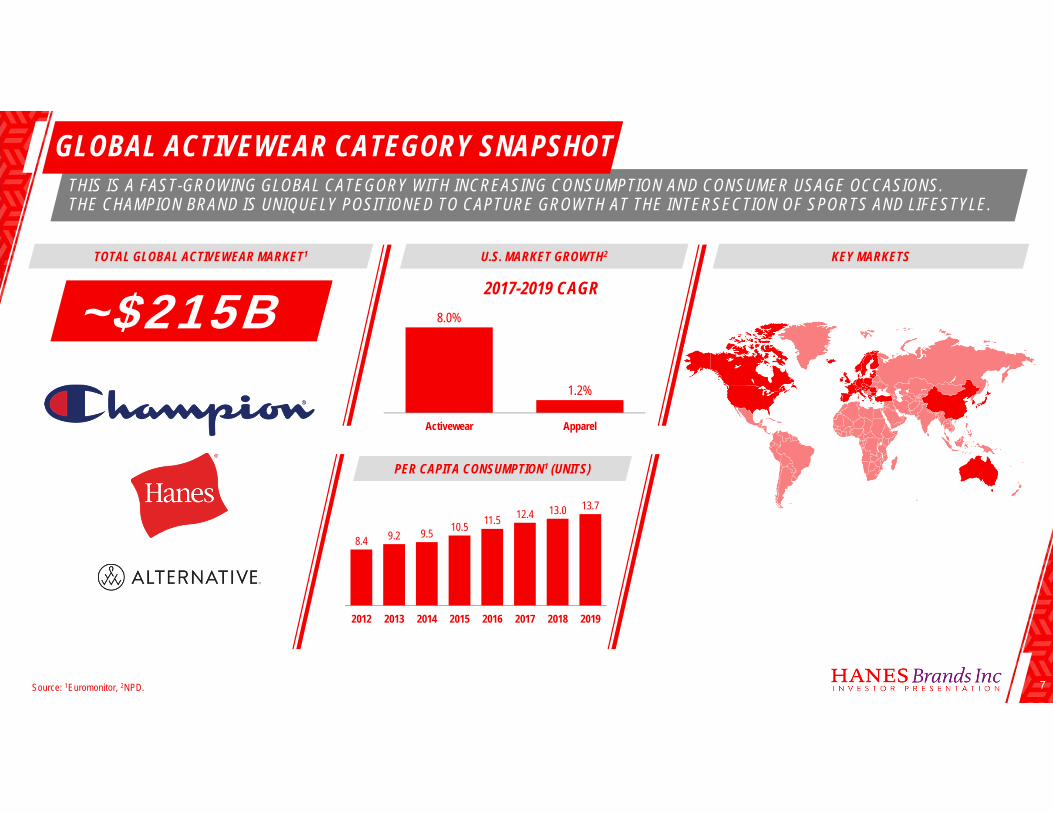
THIS IS A FAST-GROWING GLOBAL CATEGORY WITH INCREASING CONSUMPTION AND CONSUMER USAGE OCCASIONS. THE CHAMPION BRAND IS UNIQUELY POSITIONED TO CAPTURE GROWTH AT THE INTERSECTION OF SPORTS AND LIFESTYLE.
GLOBAL ACTIVEWEAR CATEGORY SNAPSHOT
TOTAL GLOBAL ACTIVEWEAR MARKET1 KEY MARKETSU.S. MARKET GROWTH2
~$215B
PER CAPITA CONSUMPTION1 (UNITS)
2017-2019 CAGR
Source: 1Euromonitor, 2NPD.
8.0%
1.2%
Activewear Apparel
8.4 9.2 9.5 10.5 11.5 12.4 13.0 13.7
2012 2013 2014 2015 2016 2017 2018 2019
8
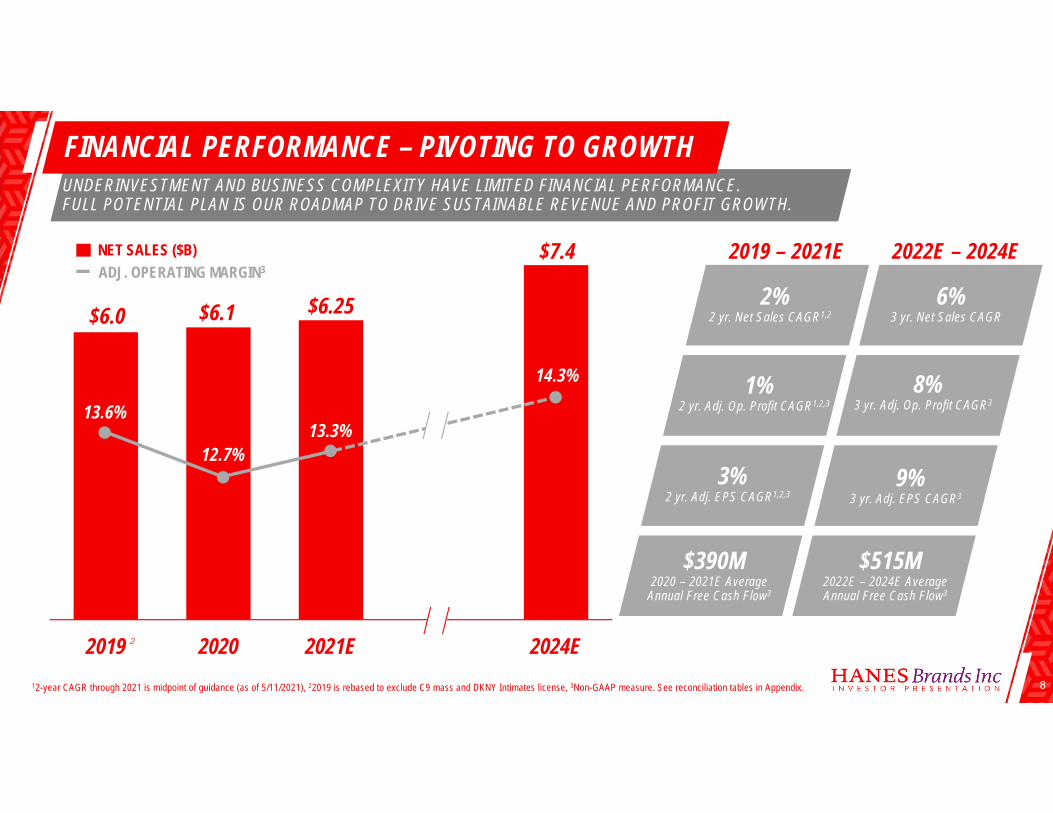
UNDERINVESTMENT AND BUSINESS COMPLEXITY HAVE LIMITED FINANCIAL PERFORMANCE. FULL POTENTIAL PLAN IS OUR ROADMAP TO DRIVE SUSTAINABLE REVENUE AND PROFIT GROWTH.
FINANCIAL PERFORMANCE – PIVOTING TO GROWTH
2019 2020 2021E 2024E
$7.4
$6.0 $6.1 $6.25
NET SALES ($B)ADJ. OPERATING MARGIN3
12-year CAGR through 2021 is midpoint of guidance (as of 5/11/2021), 22019 is rebased to exclude C9 mass and DKNY Intimates license, 3Non-GAAP measure. See reconciliation tables in Appendix.
13.6%
12.7%13.3%
14.3%
2 yr. Adj. EPS CAGR1,2,33%
2020 – 2021E AverageAnnual Free Cash Flow3
$390M
2 yr. Net Sales CAGR1,22%
2 yr. Adj. Op. Profit CAGR1,2,31%
3 yr. Adj. EPS CAGR39%
2022E – 2024E AverageAnnual Free Cash Flow3
$515M
3 yr. Net Sales CAGR6%
3 yr. Adj. Op. Profit CAGR38%
2019 – 2021E 2022E – 2024E
2
9
10
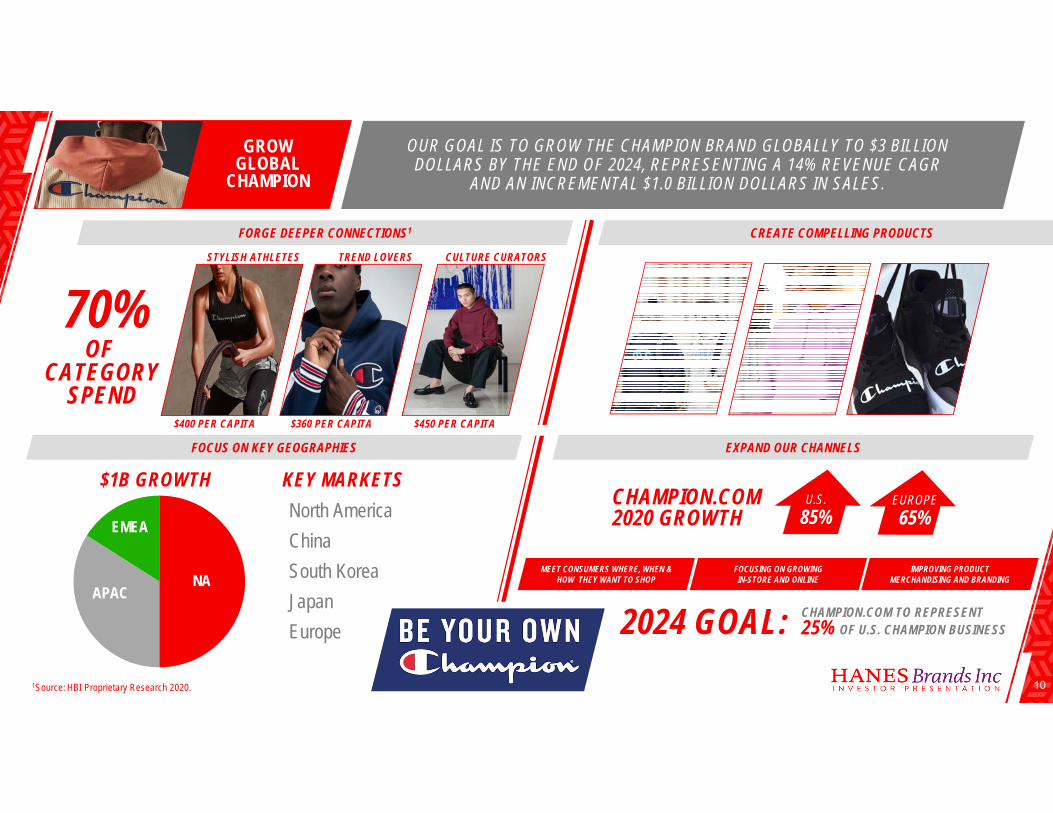
OUR GOAL IS TO GROW THE CHAMPION BRAND GLOBALLY TO $3 BILLION DOLLARS BY THE END OF 2024, REPRESENTING A 14% REVENUE CAGR
AND AN INCREMENTAL $1.0 BILLION DOLLARS IN SALES.
FORGE DEEPER CONNECTIONS1 CREATE COMPELLING PRODUCTS
FOCUS ON KEY GEOGRAPHIES EXPAND OUR CHANNELS
STYLISH ATHLETES TREND LOVERS CULTURE CURATORS
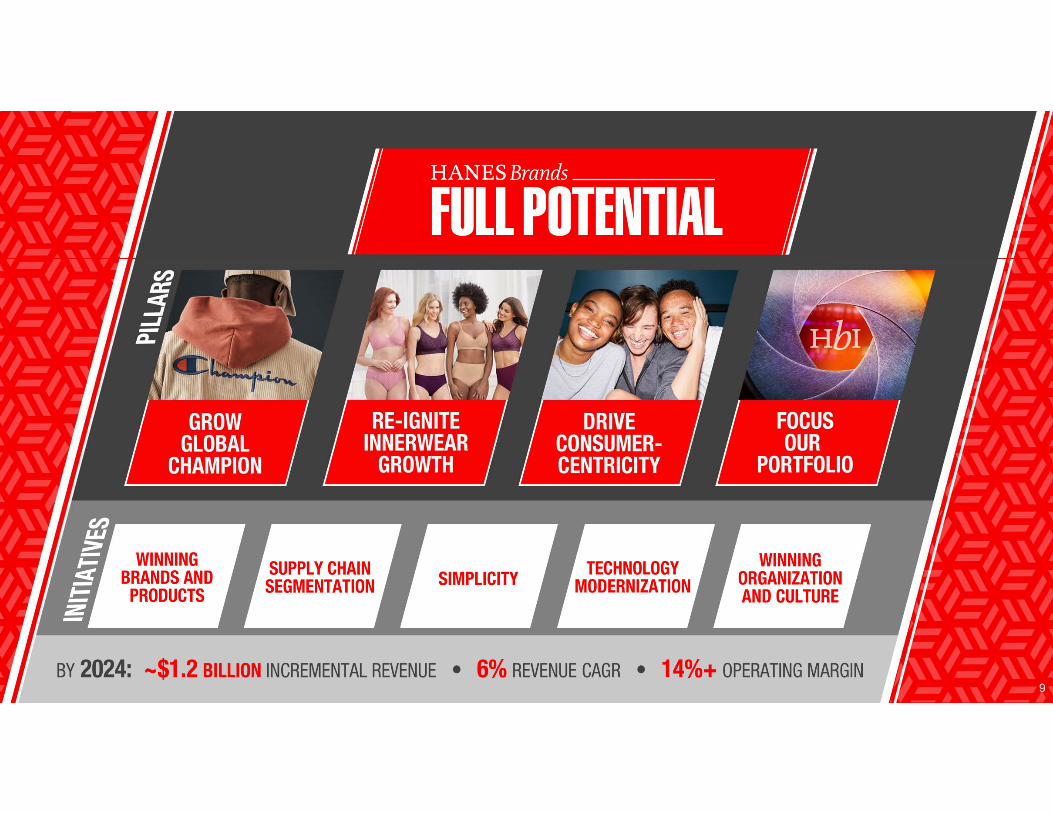
GROWGLOBAL
CHAMPION
$400 PER CAPITA $360 PER CAPITA $450 PER CAPITA
70%OF
CATEGORYSPEND
NAAPAC
EMEA
$1B GROWTH KEY MARKETSNorth AmericaChinaSouth KoreaJapanEurope
MEET CONSUMERS WHERE, WHEN & HOW THEY WANT TO SHOP
FOCUSING ON GROWINGIN-STORE AND ONLINE
IMPROVING PRODUCT MERCHANDISING AND BRANDING
2024 GOAL: CHAMPION.COM TO REPRESENT 25% OF U.S. CHAMPION BUSINESS
CHAMPION.COM2020 GROWTH
EUROPE65%
U.S.85%
1Source: HBI Proprietary Research 2020.
11
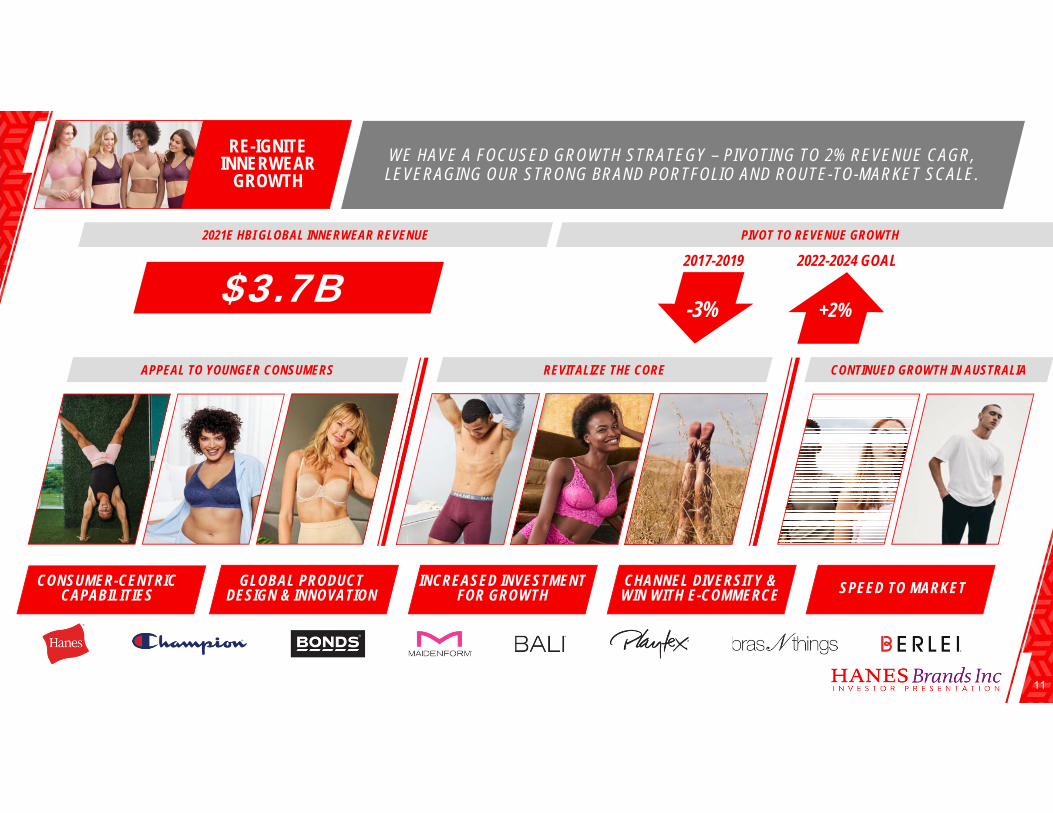
RE-IGNITEINNERWEAR
GROWTHWE HAVE A FOCUSED GROWTH STRATEGY – PIVOTING TO 2% REVENUE CAGR,
LEVERAGING OUR STRONG BRAND PORTFOLIO AND ROUTE-TO-MARKET SCALE.
APPEAL TO YOUNGER CONSUMERS CONTINUED GROWTH IN AUSTRALIAREVITALIZE THE CORE
CONSUMER-CENTRICCAPABILITIES
GLOBAL PRODUCT DESIGN & INNOVATION
INCREASED INVESTMENTFOR GROWTH
CHANNEL DIVERSITY &WIN WITH E-COMMERCE SPEED TO MARKET
$3.7B -3%
2017-2019
+2%
2021E HBI GLOBAL INNERWEAR REVENUE PIVOT TO REVENUE GROWTH
2022-2024 GOAL
12
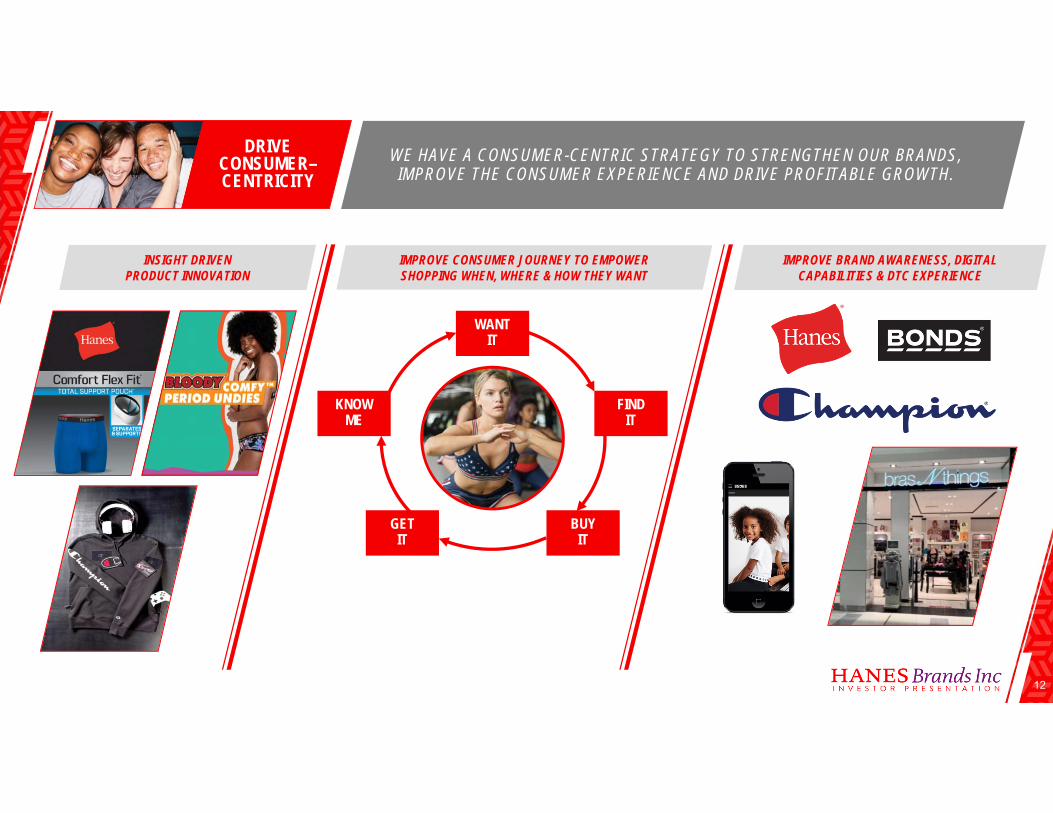
WE HAVE A CONSUMER-CENTRIC STRATEGY TO STRENGTHEN OUR BRANDS, IMPROVE THE CONSUMER EXPERIENCE AND DRIVE PROFITABLE GROWTH.
DRIVECONSUMER–CENTRICITY
IMPROVE CONSUMER JOURNEY TO EMPOWERSHOPPING WHEN, WHERE & HOW THEY WANT
INSIGHT DRIVENPRODUCT INNOVATION
IMPROVE BRAND AWARENESS, DIGITAL CAPABILITIES & DTC EXPERIENCE
KNOWME
GETIT
BUYIT
FINDIT
WANTIT
13
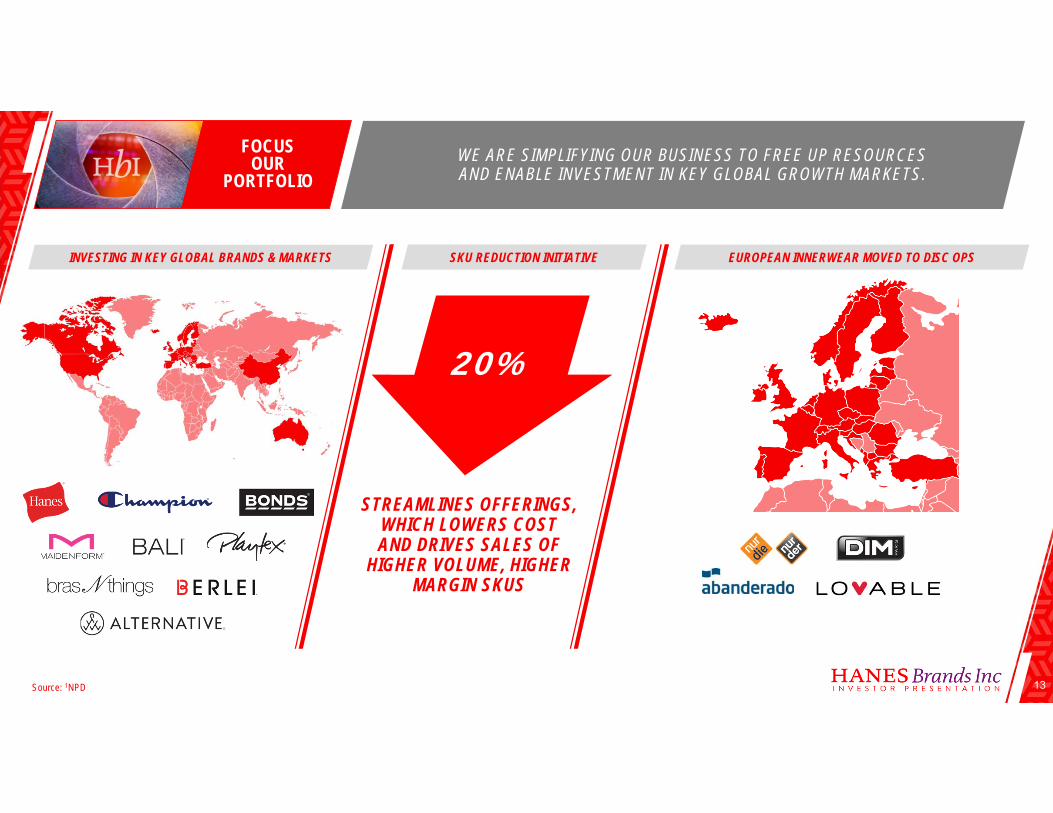
INVESTING IN KEY GLOBAL BRANDS & MARKETS EUROPEAN INNERWEAR MOVED TO DISC OPSSKU REDUCTION INITIATIVE
Source: 1NPD
WE ARE SIMPLIFYING OUR BUSINESS TO FREE UP RESOURCES AND ENABLE INVESTMENT IN KEY GLOBAL GROWTH MARKETS.
FOCUSOUR
PORTFOLIO
20%
MAP OF EUROPE
STREAMLINES OFFERINGS,WHICH LOWERS COSTAND DRIVES SALES OF
HIGHER VOLUME, HIGHERMARGIN SKUS
14
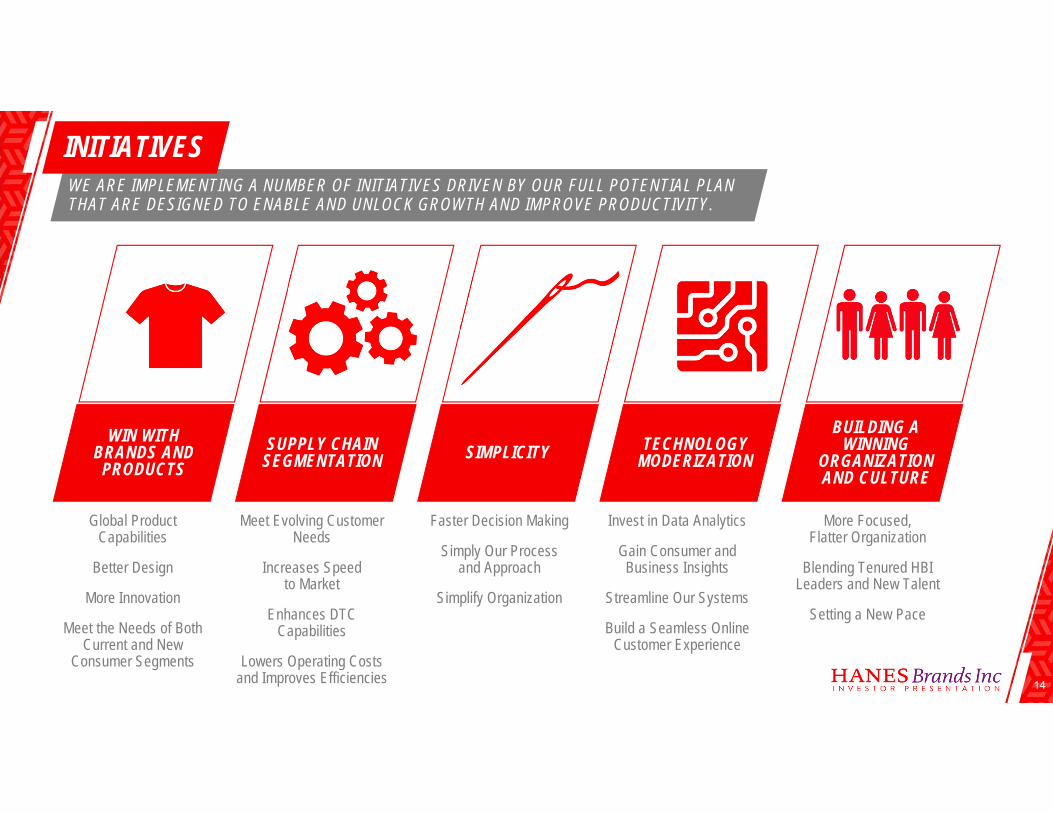
WE ARE IMPLEMENTING A NUMBER OF INITIATIVES DRIVEN BY OUR FULL POTENTIAL PLAN THAT ARE DESIGNED TO ENABLE AND UNLOCK GROWTH AND IMPROVE PRODUCTIVITY.
WIN WITHBRANDS AND
PRODUCTSSUPPLY CHAIN
SEGMENTATION SIMPLICITY TECHNOLOGYMODERIZATION
BUILDING AWINNING
ORGANIZATIONAND CULTURE
INITIATIVES
Global Product Capabilities
Better Design
More Innovation
Meet the Needs of Both Current and New
Consumer Segments
Meet Evolving Customer Needs
Increases Speedto Market
Enhances DTC Capabilities
Lowers Operating Costs and Improves Efficiencies
Faster Decision Making
Simply Our Processand Approach
Simplify Organization
Invest in Data Analytics
Gain Consumer and Business Insights
Streamline Our Systems
Build a Seamless Online Customer Experience
More Focused, Flatter Organization
Blending Tenured HBI Leaders and New Talent
Setting a New Pace
15
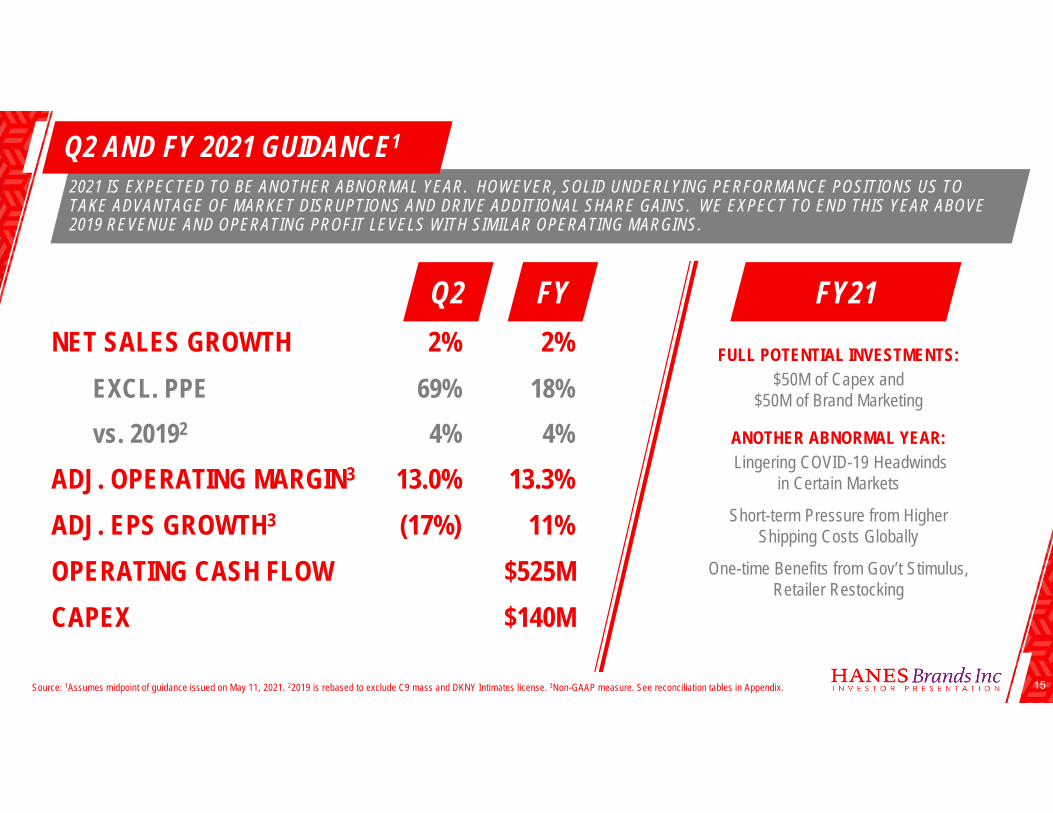
2021 IS EXPECTED TO BE ANOTHER ABNORMAL YEAR. HOWEVER, SOLID UNDERLYING PERFORMANCE POSITIONS US TO TAKE ADVANTAGE OF MARKET DISRUPTIONS AND DRIVE ADDITIONAL SHARE GAINS. WE EXPECT TO END THIS YEAR ABOVE 2019 REVENUE AND OPERATING PROFIT LEVELS WITH SIMILAR OPERATING MARGINS.
Q2 AND FY 2021 GUIDANCE1
NET SALES GROWTH 2% 2%EXCL. PPE 69% 18%vs. 20192 4% 4%
ADJ. OPERATING MARGIN3 13.0% 13.3%ADJ. EPS GROWTH3 (17%) 11%OPERATING CASH FLOW $525MCAPEX $140M
Q2 FY FY21
FULL POTENTIAL INVESTMENTS:$50M of Capex and
$50M of Brand Marketing
ANOTHER ABNORMAL YEAR:Lingering COVID-19 Headwinds
in Certain Markets
Short-term Pressure from Higher Shipping Costs Globally
One-time Benefits from Gov’t Stimulus, Retailer Restocking
Source: 1Assumes midpoint of guidance issued on May 11, 2021. 22019 is rebased to exclude C9 mass and DKNY Intimates license. 3Non-GAAP measure. See reconciliation tables in Appendix.
16
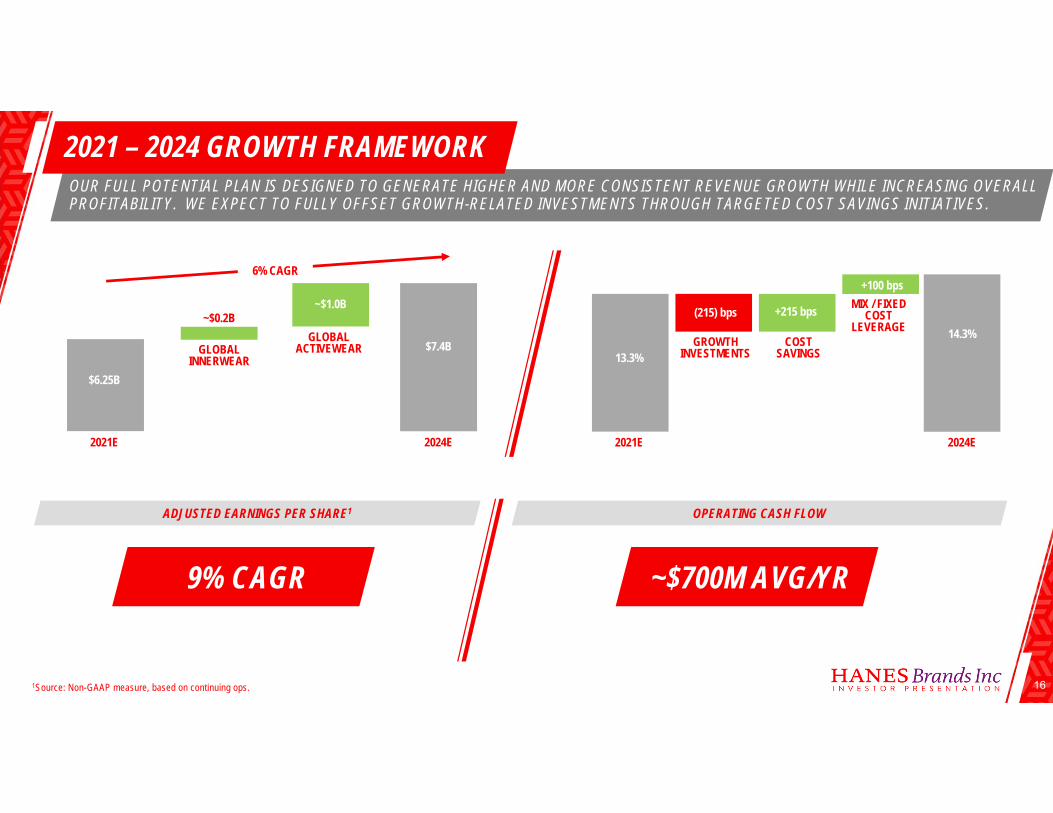
OUR FULL POTENTIAL PLAN IS DESIGNED TO GENERATE HIGHER AND MORE CONSISTENT REVENUE GROWTH WHILE INCREASING OVERALL PROFITABILITY. WE EXPECT TO FULLY OFFSET GROWTH-RELATED INVESTMENTS THROUGH TARGETED COST SAVINGS INITIATIVES.
6% CAGR
2021E 2024E
$6.25B
$7.4BGLOBALINNERWEAR
~$0.2BGLOBAL
ACTIVEWEAR
~$1.0B
2021E 2024E
GROWTHINVESTMENTS13.3%
14.3%
(215) bps
COSTSAVINGS
+215 bps MIX / FIXEDCOST
LEVERAGE
+100 bps
2021 – 2024 GROWTH FRAMEWORK
~$700M AVG/YR9% CAGR
ADJUSTED EARNINGS PER SHARE1 OPERATING CASH FLOW
1Source: Non-GAAP measure, based on continuing ops.
17
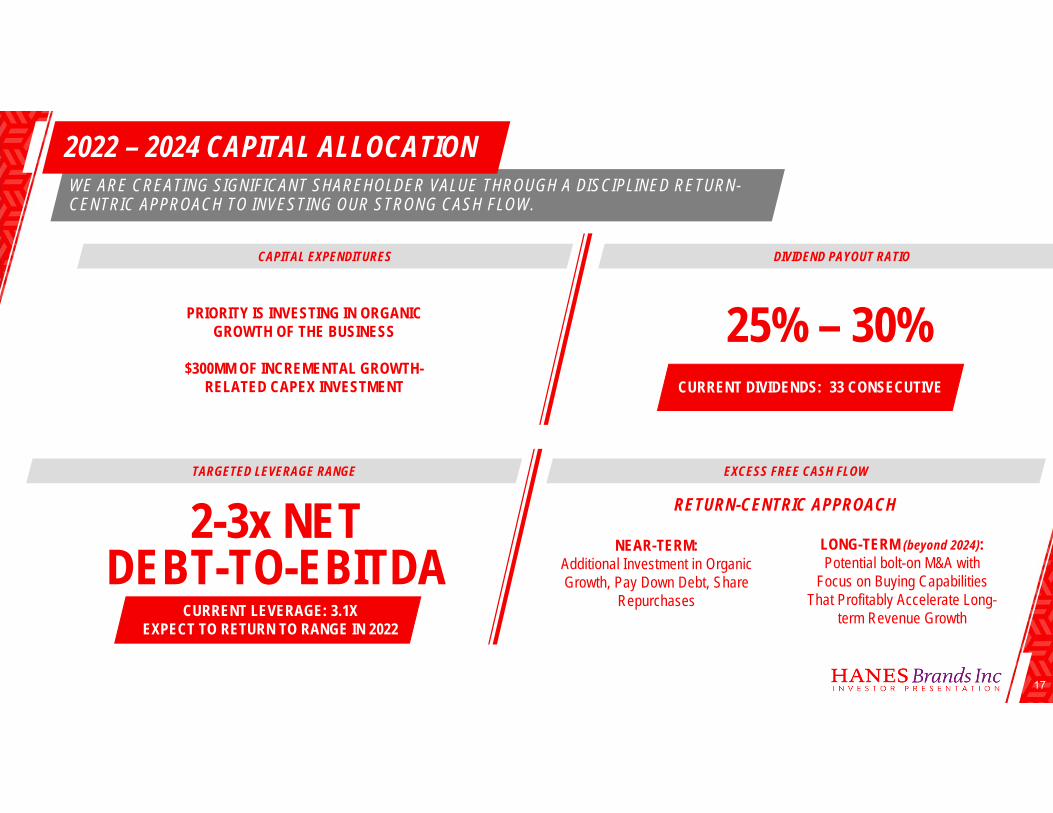
WE ARE CREATING SIGNIFICANT SHAREHOLDER VALUE THROUGH A DISCIPLINED RETURN-CENTRIC APPROACH TO INVESTING OUR STRONG CASH FLOW.
CAPITAL EXPENDITURES DIVIDEND PAYOUT RATIO
TARGETED LEVERAGE RANGE EXCESS FREE CASH FLOW
2022 – 2024 CAPITAL ALLOCATION
25% – 30%
2-3x NETDEBT-TO-EBITDA
PRIORITY IS INVESTING IN ORGANIC GROWTH OF THE BUSINESS
$300MM OF INCREMENTAL GROWTH-RELATED CAPEX INVESTMENT
RETURN-CENTRIC APPROACH
NEAR-TERM: Additional Investment in Organic Growth, Pay Down Debt, Share
Repurchases
LONG-TERM (beyond 2024): Potential bolt-on M&A with
Focus on Buying Capabilities That Profitably Accelerate Long-
term Revenue GrowthCURRENT LEVERAGE: 3.1XEXPECT TO RETURN TO RANGE IN 2022
CURRENT DIVIDENDS: 33 CONSECUTIVE

18

19
APPENDIX
20
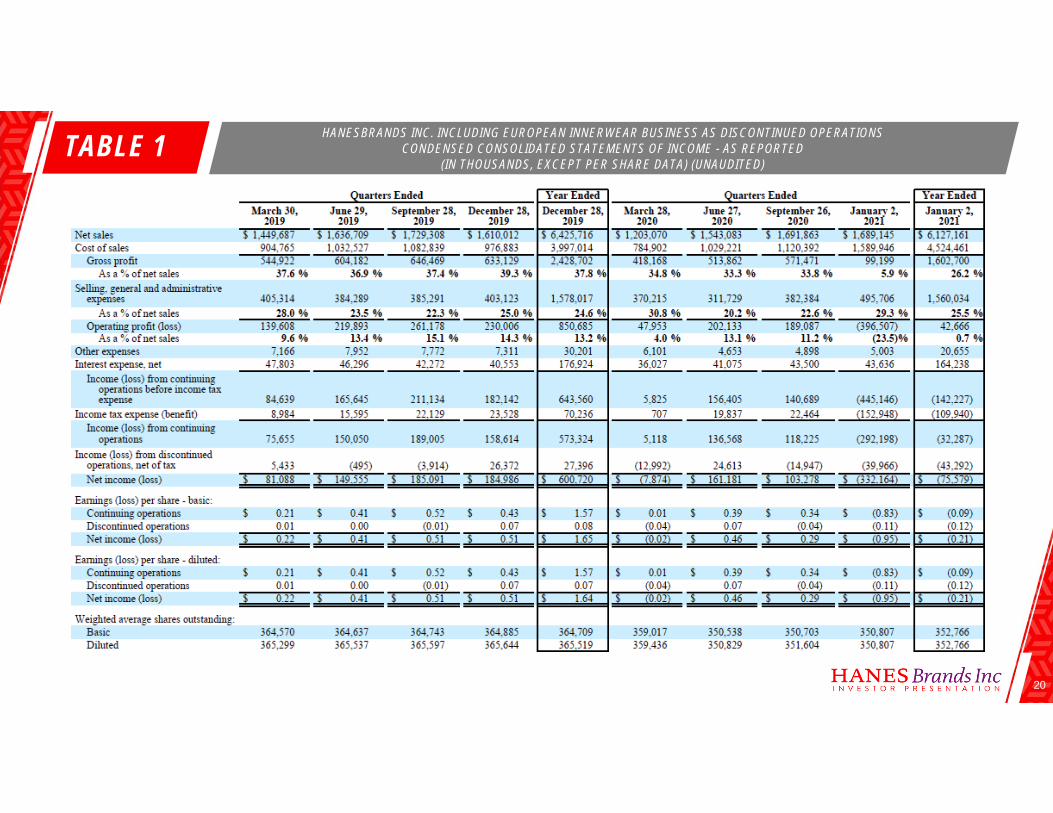
TABLE 1 HANESBRANDS INC. INCLUDING EUROPEAN INNERWEAR BUSINESS AS DISCONTINUED OPERATIONS CONDENSED CONSOLIDATED STATEMENTS OF INCOME - AS REPORTED
(IN THOUSANDS, EXCEPT PER SHARE DATA) (UNAUDITED)
21
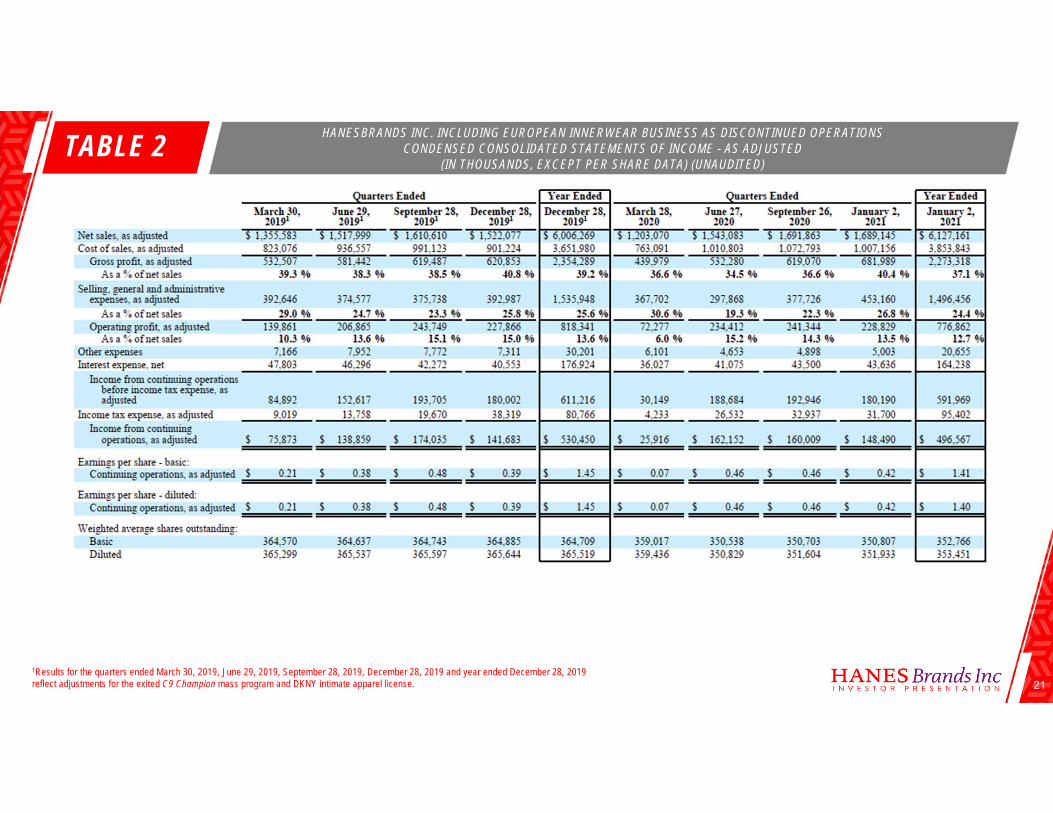
TABLE 2 HANESBRANDS INC. INCLUDING EUROPEAN INNERWEAR BUSINESS AS DISCONTINUED OPERATIONS CONDENSED CONSOLIDATED STATEMENTS OF INCOME - AS ADJUSTED
(IN THOUSANDS, EXCEPT PER SHARE DATA) (UNAUDITED)
1Results for the quarters ended March 30, 2019, June 29, 2019, September 28, 2019, December 28, 2019 and year ended December 28, 2019 reflect adjustments for the exited C9 Champion mass program and DKNY intimate apparel license.
22
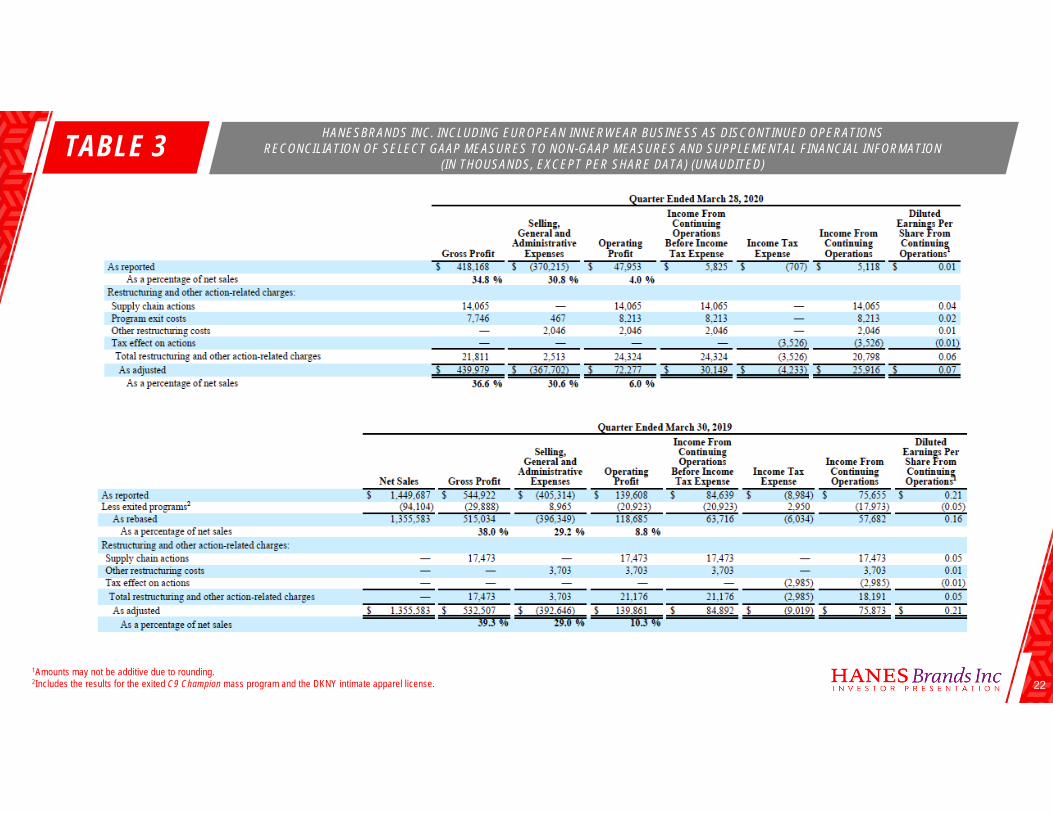
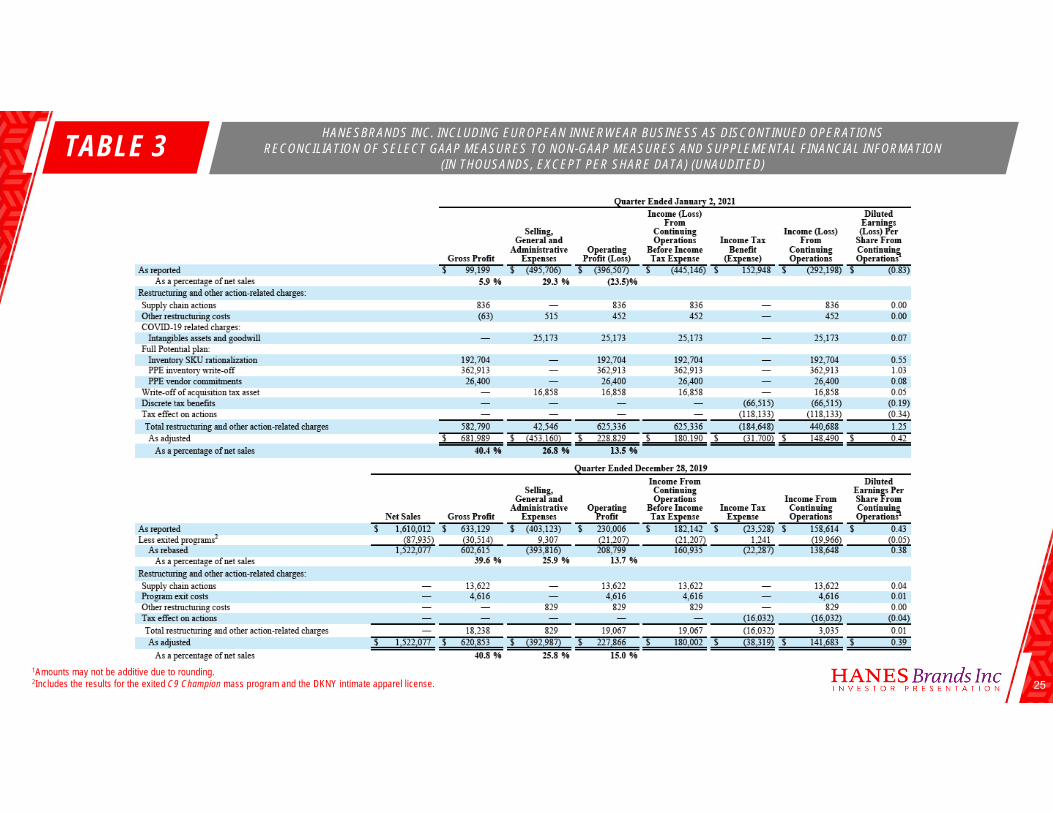
TABLE 3 HANESBRANDS INC. INCLUDING EUROPEAN INNERWEAR BUSINESS AS DISCONTINUED OPERATIONS RECONCILIATION OF SELECT GAAP MEASURES TO NON-GAAP MEASURES AND SUPPLEMENTAL FINANCIAL INFORMATION
(IN THOUSANDS, EXCEPT PER SHARE DATA) (UNAUDITED)
1Amounts may not be additive due to rounding.2Includes the results for the exited C9 Champion mass program and the DKNY intimate apparel license.
23
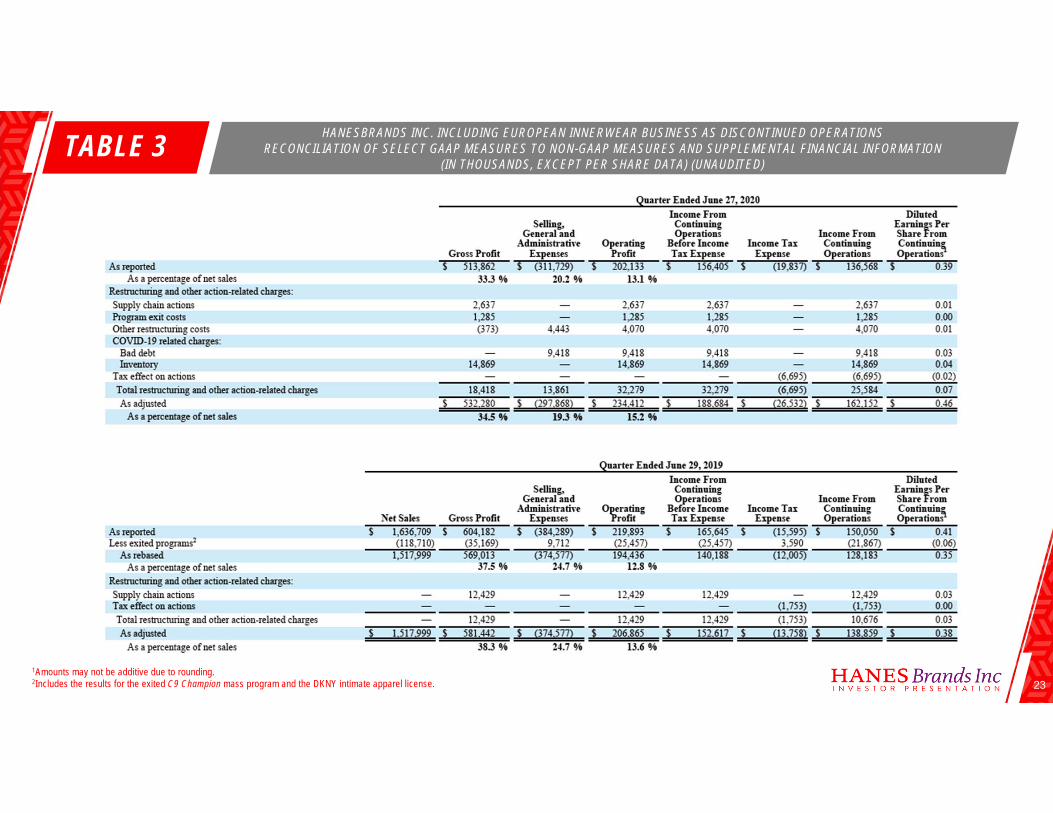
TABLE 3 HANESBRANDS INC. INCLUDING EUROPEAN INNERWEAR BUSINESS AS DISCONTINUED OPERATIONS RECONCILIATION OF SELECT GAAP MEASURES TO NON-GAAP MEASURES AND SUPPLEMENTAL FINANCIAL INFORMATION
(IN THOUSANDS, EXCEPT PER SHARE DATA) (UNAUDITED)
1Amounts may not be additive due to rounding.2Includes the results for the exited C9 Champion mass program and the DKNY intimate apparel license.
24
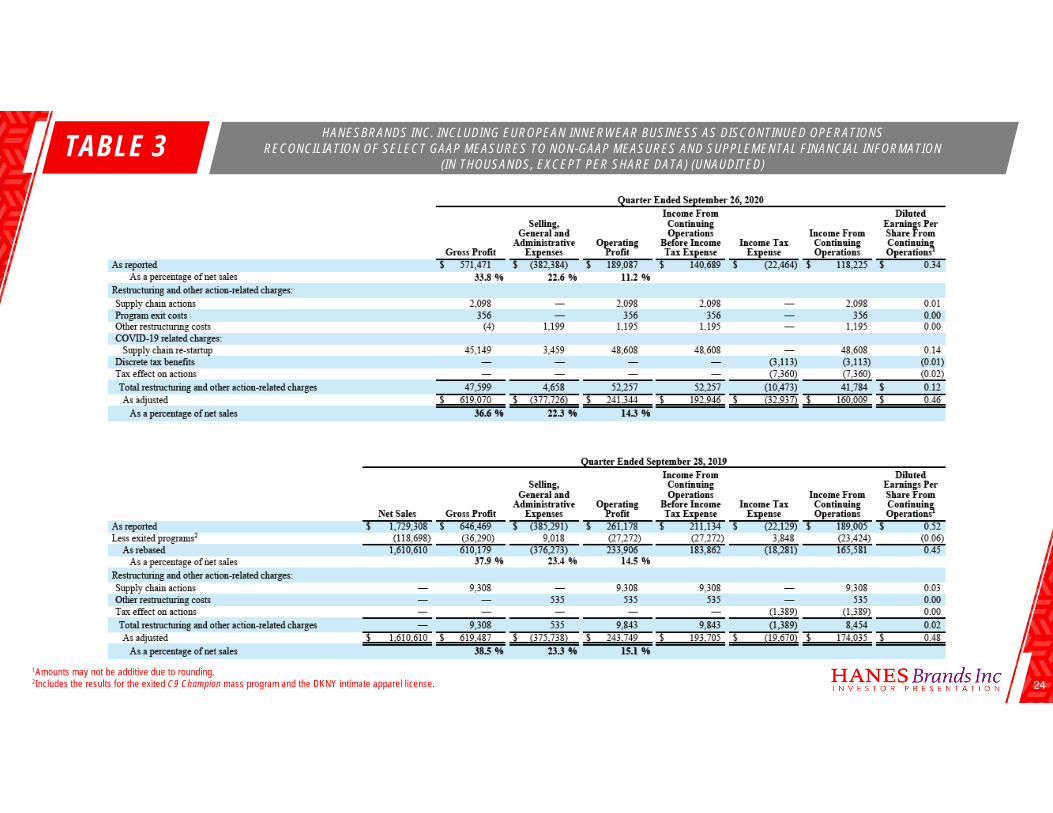
TABLE 3 HANESBRANDS INC. INCLUDING EUROPEAN INNERWEAR BUSINESS AS DISCONTINUED OPERATIONS RECONCILIATION OF SELECT GAAP MEASURES TO NON-GAAP MEASURES AND SUPPLEMENTAL FINANCIAL INFORMATION
(IN THOUSANDS, EXCEPT PER SHARE DATA) (UNAUDITED)
1Amounts may not be additive due to rounding.2Includes the results for the exited C9 Champion mass program and the DKNY intimate apparel license.
25
TABLE 3 HANESBRANDS INC. INCLUDING EUROPEAN INNERWEAR BUSINESS AS DISCONTINUED OPERATIONS RECONCILIATION OF SELECT GAAP MEASURES TO NON-GAAP MEASURES AND SUPPLEMENTAL FINANCIAL INFORMATION
(IN THOUSANDS, EXCEPT PER SHARE DATA) (UNAUDITED)
1Amounts may not be additive due to rounding.2Includes the results for the exited C9 Champion mass program and the DKNY intimate apparel license.
26
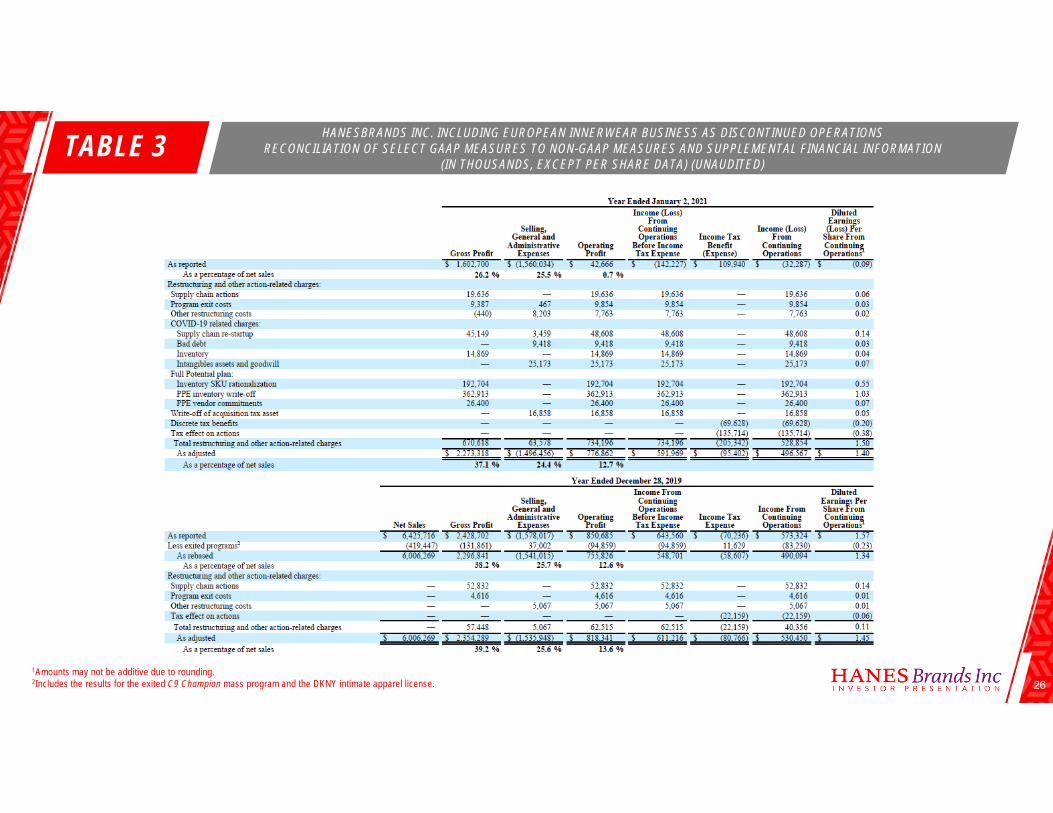
TABLE 3 HANESBRANDS INC. INCLUDING EUROPEAN INNERWEAR BUSINESS AS DISCONTINUED OPERATIONS RECONCILIATION OF SELECT GAAP MEASURES TO NON-GAAP MEASURES AND SUPPLEMENTAL FINANCIAL INFORMATION
(IN THOUSANDS, EXCEPT PER SHARE DATA) (UNAUDITED)
1Amounts may not be additive due to rounding.2Includes the results for the exited C9 Champion mass program and the DKNY intimate apparel license.
27
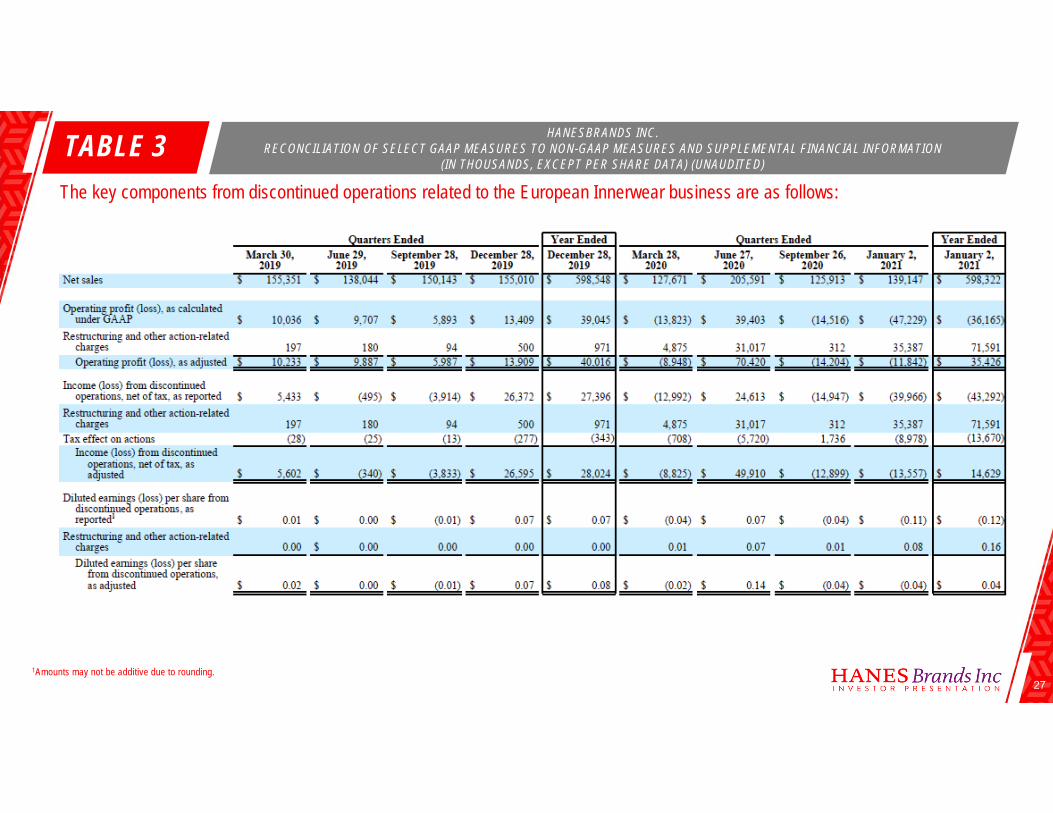
TABLE 3 HANESBRANDS INC. RECONCILIATION OF SELECT GAAP MEASURES TO NON-GAAP MEASURES AND SUPPLEMENTAL FINANCIAL INFORMATION
(IN THOUSANDS, EXCEPT PER SHARE DATA) (UNAUDITED)
1Amounts may not be additive due to rounding.
The key components from discontinued operations related to the European Innerwear business are as follows:
28
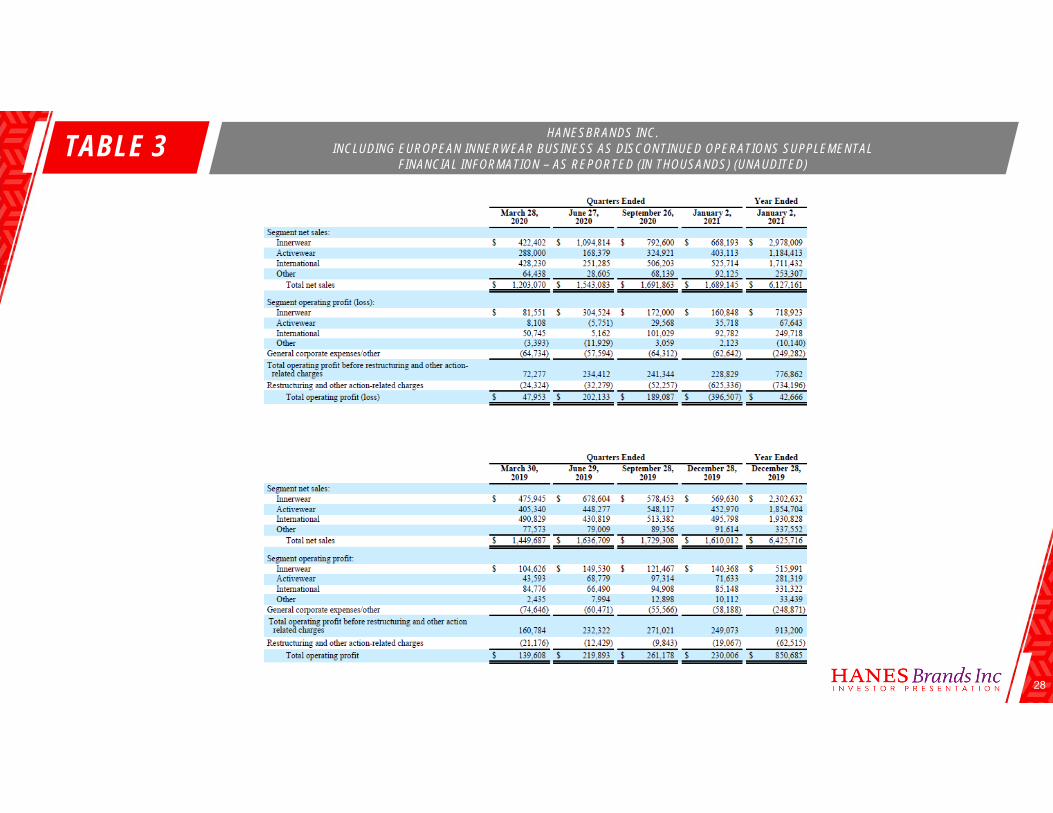
TABLE 3 HANESBRANDS INC.INCLUDING EUROPEAN INNERWEAR BUSINESS AS DISCONTINUED OPERATIONS SUPPLEMENTAL
FINANCIAL INFORMATION – AS REPORTED (IN THOUSANDS) (UNAUDITED)
29
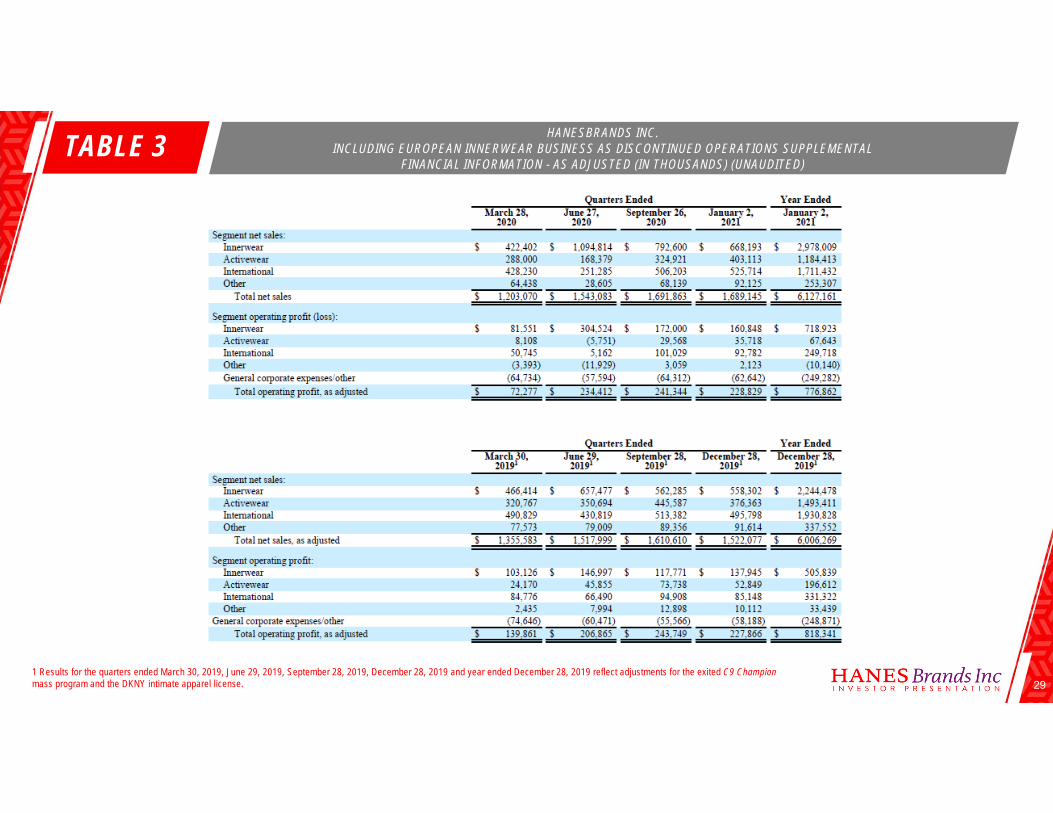
TABLE 3 HANESBRANDS INC.INCLUDING EUROPEAN INNERWEAR BUSINESS AS DISCONTINUED OPERATIONS SUPPLEMENTAL
FINANCIAL INFORMATION - AS ADJUSTED (IN THOUSANDS) (UNAUDITED)
1 Results for the quarters ended March 30, 2019, June 29, 2019, September 28, 2019, December 28, 2019 and year ended December 28, 2019 reflect adjustments for the exited C9 Champion mass program and the DKNY intimate apparel license.
30
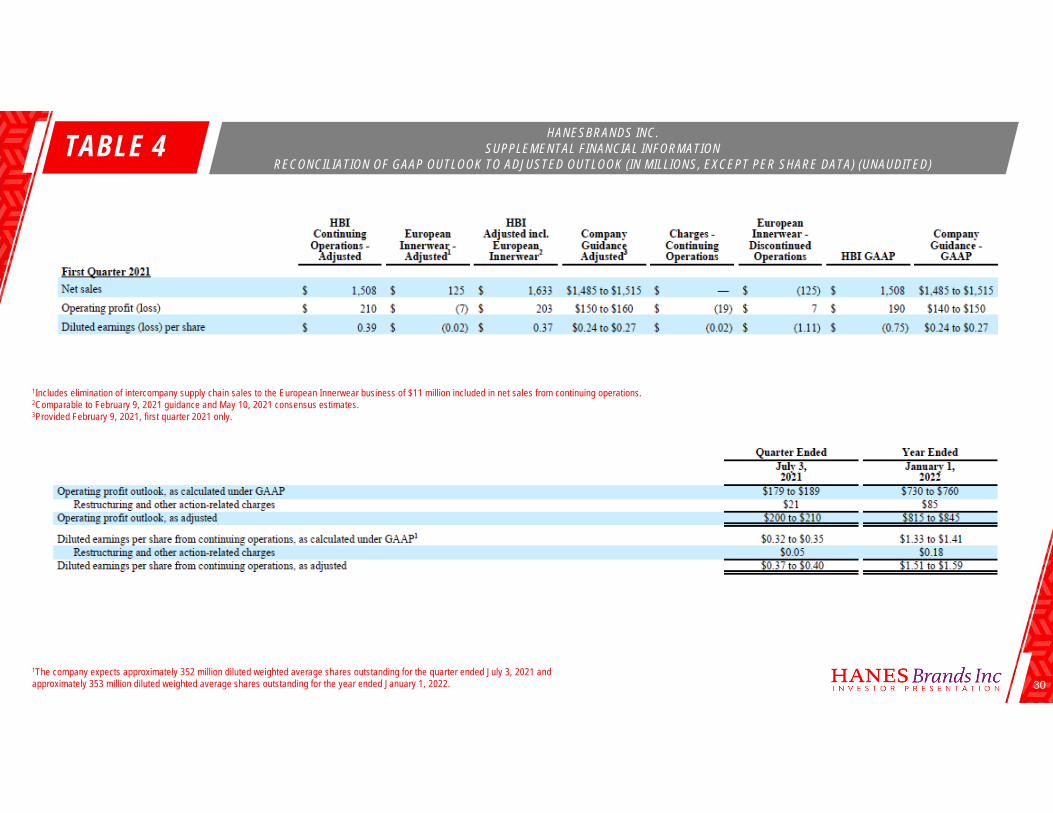
TABLE 4 HANESBRANDS INC.SUPPLEMENTAL FINANCIAL INFORMATION
RECONCILIATION OF GAAP OUTLOOK TO ADJUSTED OUTLOOK (IN MILLIONS, EXCEPT PER SHARE DATA) (UNAUDITED)
1The company expects approximately 352 million diluted weighted average shares outstanding for the quarter ended July 3, 2021 andapproximately 353 million diluted weighted average shares outstanding for the year ended January 1, 2022.
1Includes elimination of intercompany supply chain sales to the European Innerwear business of $11 million included in net sales from continuing operations. 2Comparable to February 9, 2021 guidance and May 10, 2021 consensus estimates.3Provided February 9, 2021, first quarter 2021 only.
31
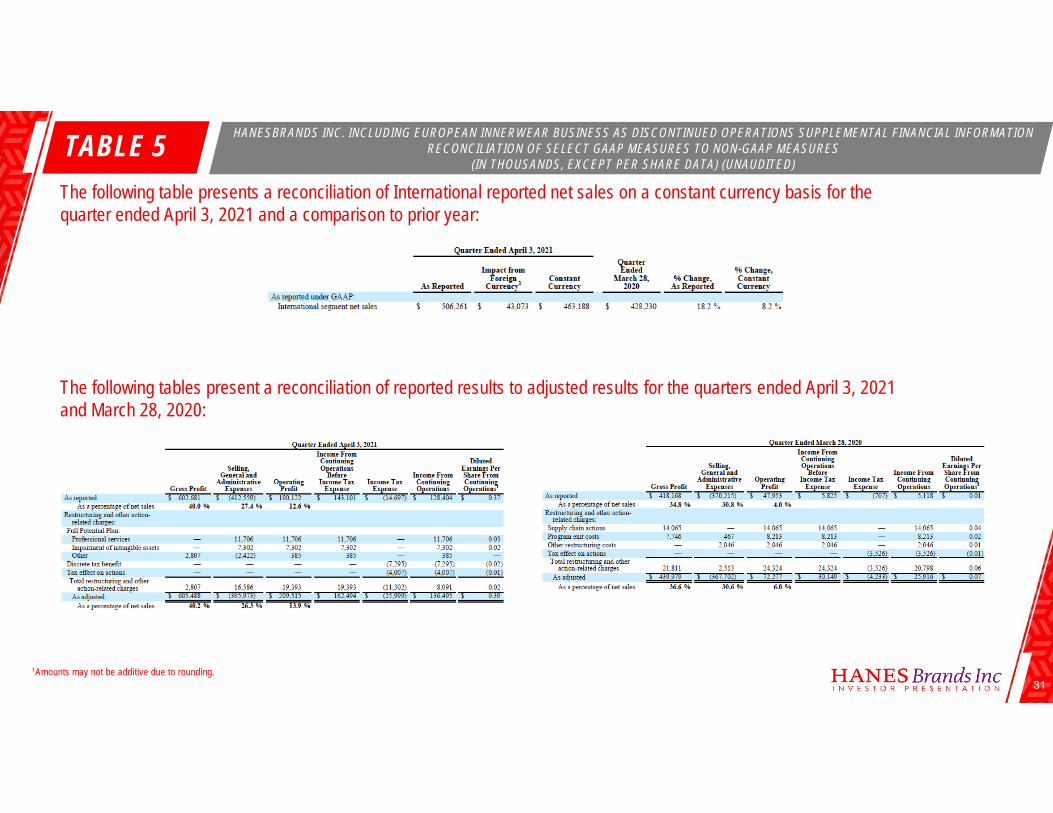
TABLE 5 HANESBRANDS INC. INCLUDING EUROPEAN INNERWEAR BUSINESS AS DISCONTINUED OPERATIONS SUPPLEMENTAL FINANCIAL INFORMATIONRECONCILIATION OF SELECT GAAP MEASURES TO NON-GAAP MEASURES
(IN THOUSANDS, EXCEPT PER SHARE DATA) (UNAUDITED)
1Amounts may not be additive due to rounding.
The following table presents a reconciliation of International reported net sales on a constant currency basis for the quarter ended April 3, 2021 and a comparison to prior year:
The following tables present a reconciliation of reported results to adjusted results for the quarters ended April 3, 2021 and March 28, 2020:
32
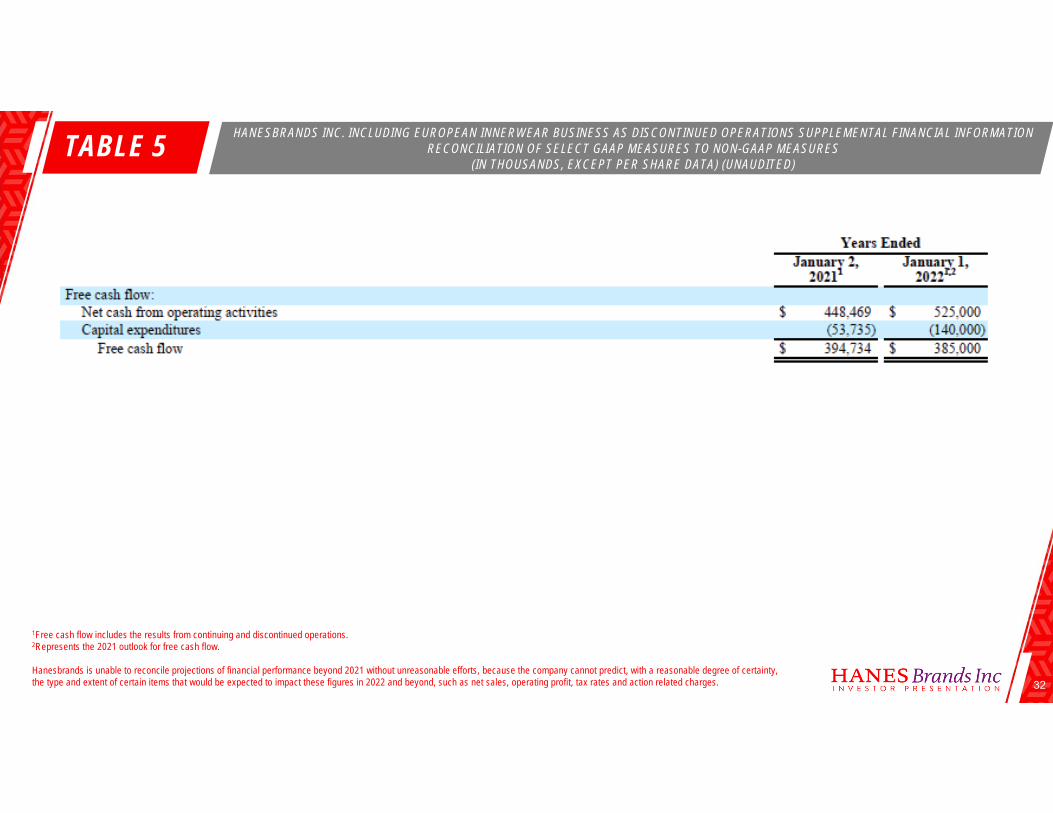
TABLE 5
1Free cash flow includes the results from continuing and discontinued operations. 2Represents the 2021 outlook for free cash flow.
Hanesbrands is unable to reconcile projections of financial performance beyond 2021 without unreasonable efforts, because the company cannot predict, with a reasonable degree of certainty, the type and extent of certain items that would be expected to impact these figures in 2022 and beyond, such as net sales, operating profit, tax rates and action related charges.
HANESBRANDS INC. INCLUDING EUROPEAN INNERWEAR BUSINESS AS DISCONTINUED OPERATIONS SUPPLEMENTAL FINANCIAL INFORMATIONRECONCILIATION OF SELECT GAAP MEASURES TO NON-GAAP MEASURES
(IN THOUSANDS, EXCEPT PER SHARE DATA) (UNAUDITED)
M A Y 2 0 2 1
![CB,HBI,HBN目錄 2019.02.27 (宏聯)¼CBI/HBI/HBN... · 4 - - Nominal flow rate [m³/h] 3 0 HQBE (HBI ) HQQE (HBN ) Number of stages x10 Mechanical Seals HBI (N) 8 , 12 8 - 1](https://img.pdfslide.us/doc/110x75/5f06dfae7e708231d41a29ed/cbhbihbnceoe-20190227-e-cbiihbiihbn-4-nominal-flow-rate.jpg)