Embed Size (px)
Citation preview
HB2 Briefing for Tennessee MPOs & TDOT
June 11, 2015Meadowview Conference Center
2
Agenda
1. VTrans, HB2 and HB1887 – How they relate
2. HB2 Overview
3. HB2 Scoring
4. Implementation Schedule
5. Next Steps
3
VTrans, HB2 and HB1887How they relate
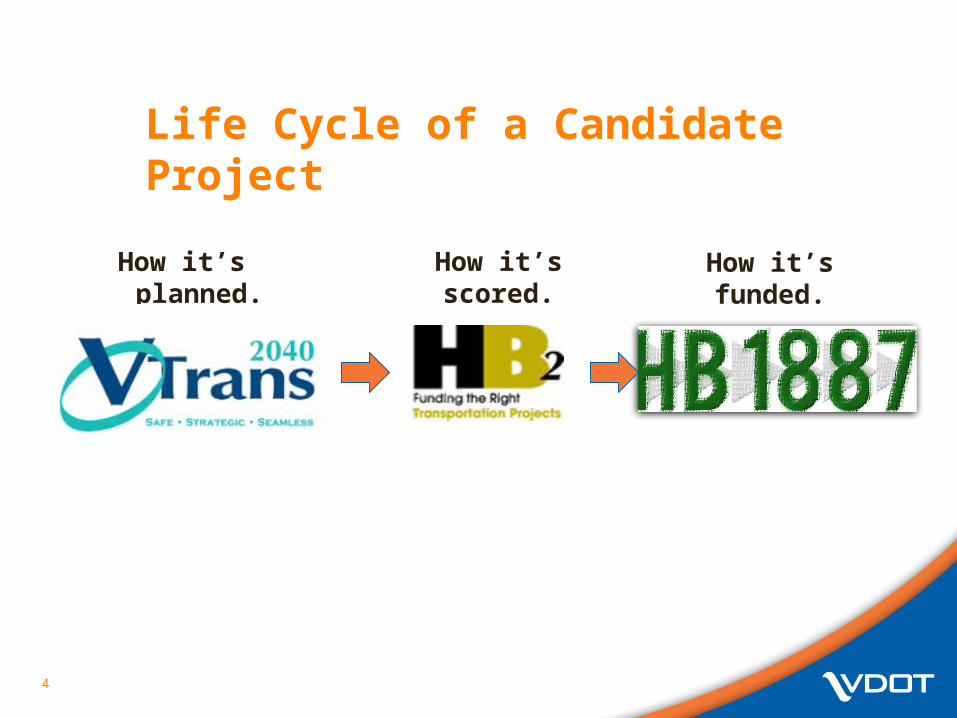
Life Cycle of a Candidate Project
How it’s planned.
4
How it’s scored. How it’s funded.
5
• VTrans is the long-range, statewide multimodal policy plan that lays out overarching Vision and Goals for transportation in the Commonwealth
• It identifies transportation investment priorities and provides direction to transportation agencies on strategies and programs to be incorporated into their plans and programs
How it’s plannedVTrans2040
How it’s plannedVTrans2040• VTrans 2040 serves two functions and produces two
independent, but connected documents:• VTrans 2040 Vision document will outline the policy
vision for Virginia’s transportation system over the next 25 years
• VTrans 2040 Multimodal Transportation Plan (VMTP) includes Multimodal Needs Assessment and will serve as the guiding document for Virginia’s transportation agency business plans and statewide transportation funding programs until the next update in five years
6
How it’s plannedVTrans2040
7
• Needs Assessment:
• VMTP will identify future needs for all modes travel across the Commonwealth – not project specific
• Policy and recommendations of the plan will focus on:
• Corridors of Statewide Significance
• Identified regional networks
• Local designated growth areas
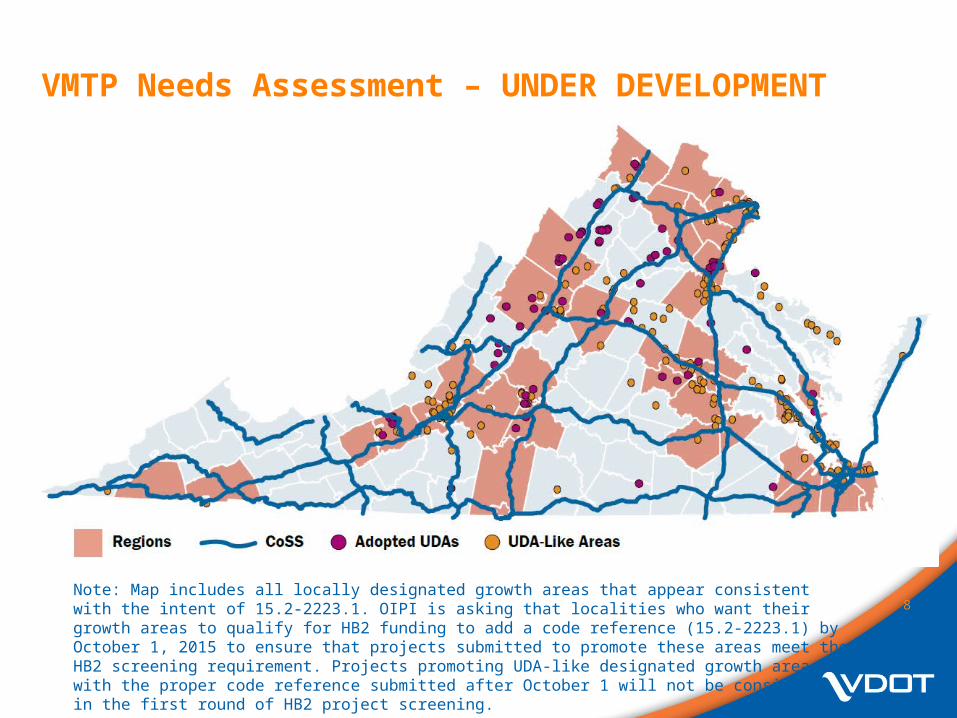
VMTP Needs Assessment – UNDER DEVELOPMENT
8Note: Map includes all locally designated growth areas that appear consistent with the intent of 15.2-2223.1. OIPI is asking that localities who want their growth areas to qualify for HB2 funding to add a code reference (15.2-2223.1) by October 1, 2015 to ensure that projects submitted to promote these areas meet the HB2 screening requirement. Projects promoting UDA-like designated growth areas with the proper code reference submitted after October 1 will not be considered in the first round of HB2 project screening.
9
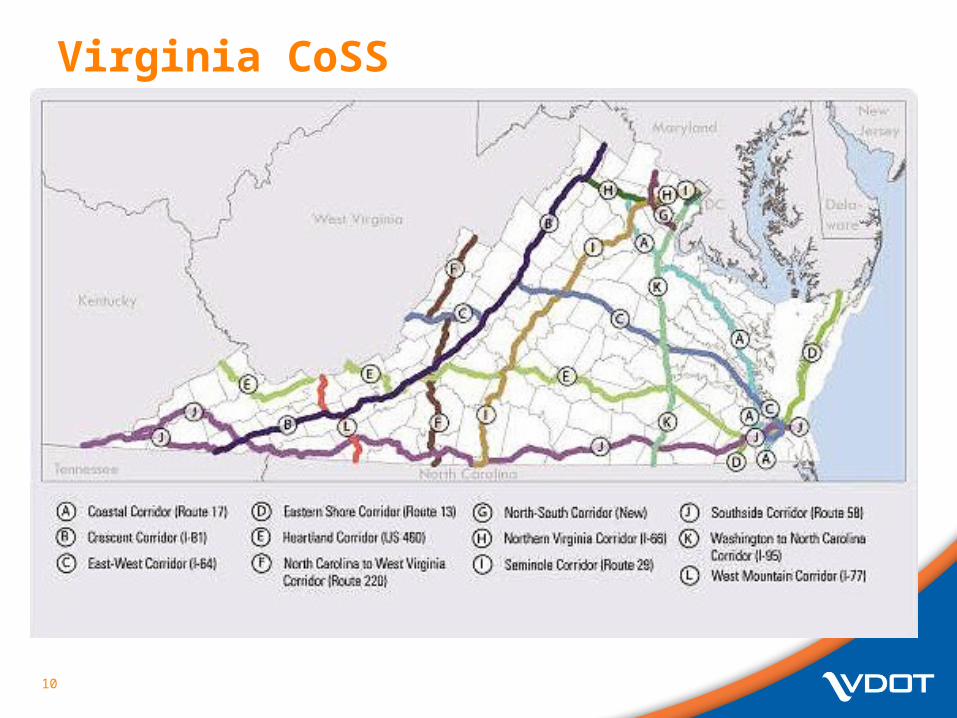
Corridors of Statewide SignificanceCoSS
• Approved by the CTB• Demonstrate the following characteristics:
• Multiple modes and/or an extended freight corridor• Connection among regions, states and/or major
activity centers• High volume of travel• Unique statewide function and/or fulfillment of
statewide goal
10
Virginia CoSS
11
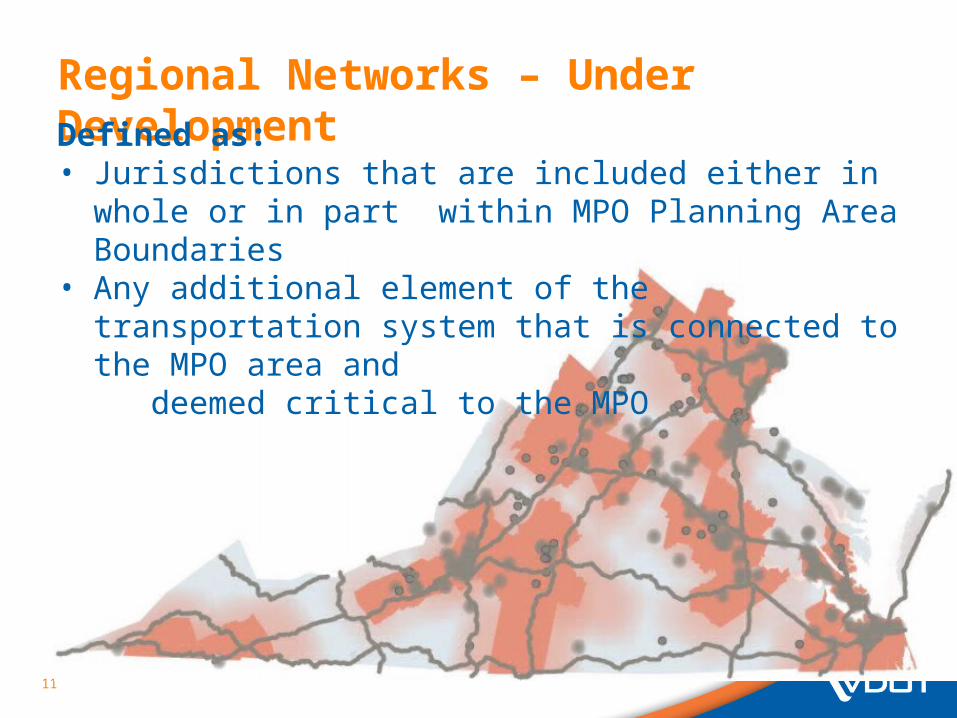
Regional Networks – Under DevelopmentDefined as: • Jurisdictions that are included either in whole or in part
within MPO Planning Area Boundaries• Any additional element of the transportation system that
is connected to the MPO area and deemed critical to the MPO
12
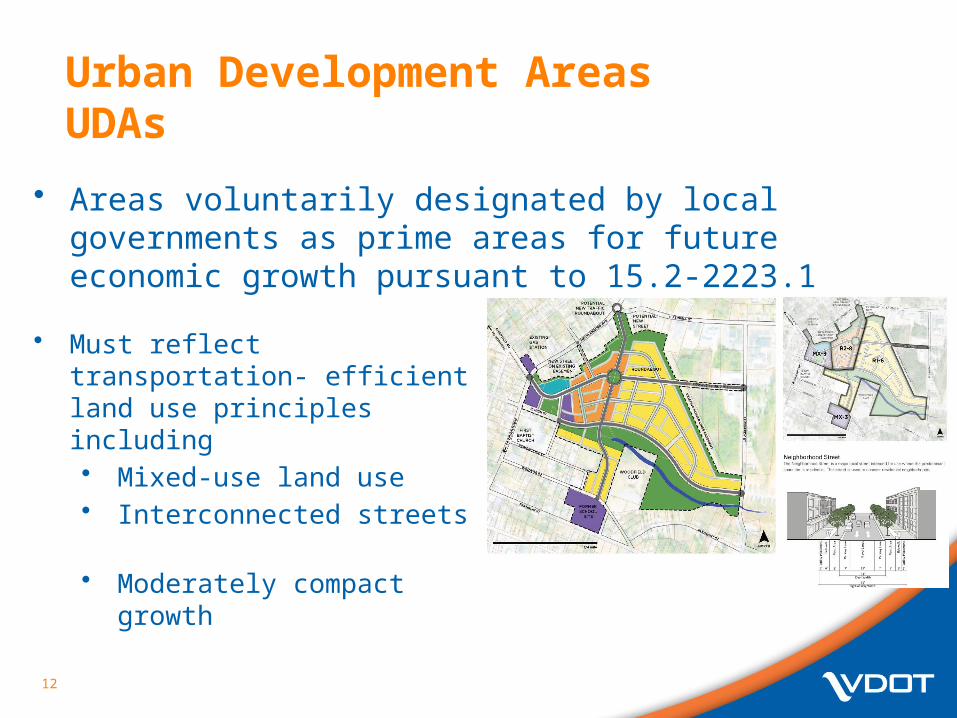
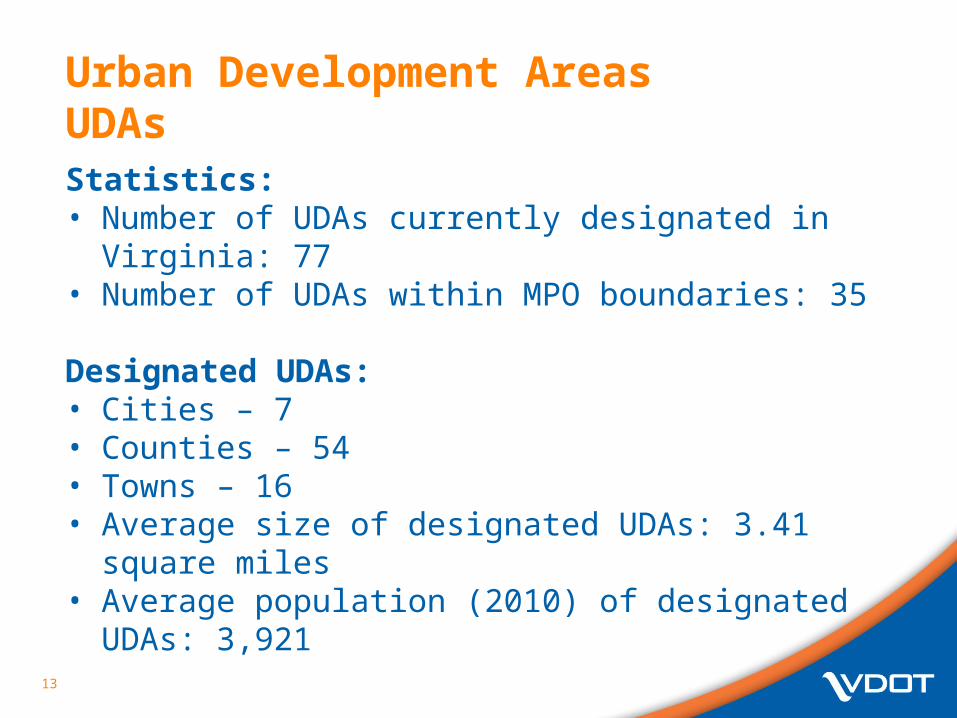
Urban Development AreasUDAs
• Areas voluntarily designated by local governments as prime areas for future economic growth pursuant to 15.2-2223.1
• Must reflect transportation- efficient land use principles including• Mixed-use land use• Interconnected streets• Moderately compact growth
13
Urban Development AreasUDAsStatistics: • Number of UDAs currently designated in Virginia: 77• Number of UDAs within MPO boundaries: 35
Designated UDAs: • Cities – 7• Counties – 54• Towns – 16• Average size of designated UDAs: 3.41 square miles• Average population (2010) of designated UDAs: 3,921
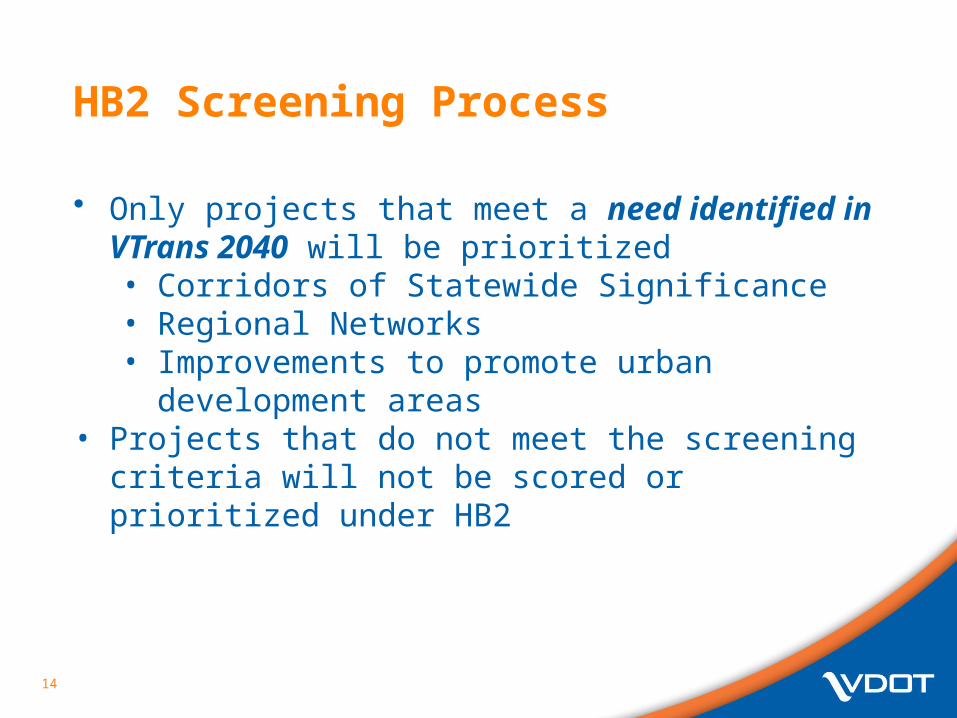
HB2 Screening Process
14
• Only projects that meet a need identified in VTrans 2040 will be prioritized• Corridors of Statewide Significance• Regional Networks• Improvements to promote urban development
areas• Projects that do not meet the screening criteria will not
be scored or prioritized under HB2
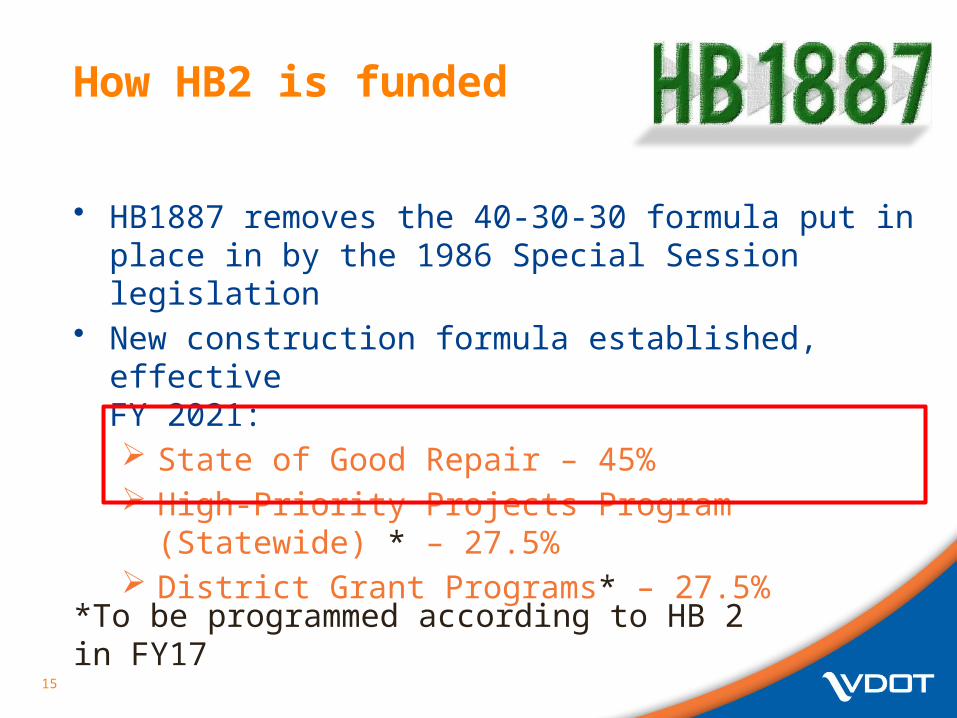
How HB2 is funded
• HB1887 removes the 40-30-30 formula put in place in by the 1986 Special Session legislation
• New construction formula established, effective FY 2021: State of Good Repair – 45% High-Priority Projects Program (Statewide) * – 27.5% District Grant Programs* – 27.5%
15
*To be programmed according to HB 2 in FY17
How HB2 is funded
• In the interim (FY17-20):• Funds not programmed to projects are to be
distributed 50/50 to:• High-Priority Projects Program (Statewide)• District Grant Programs
16
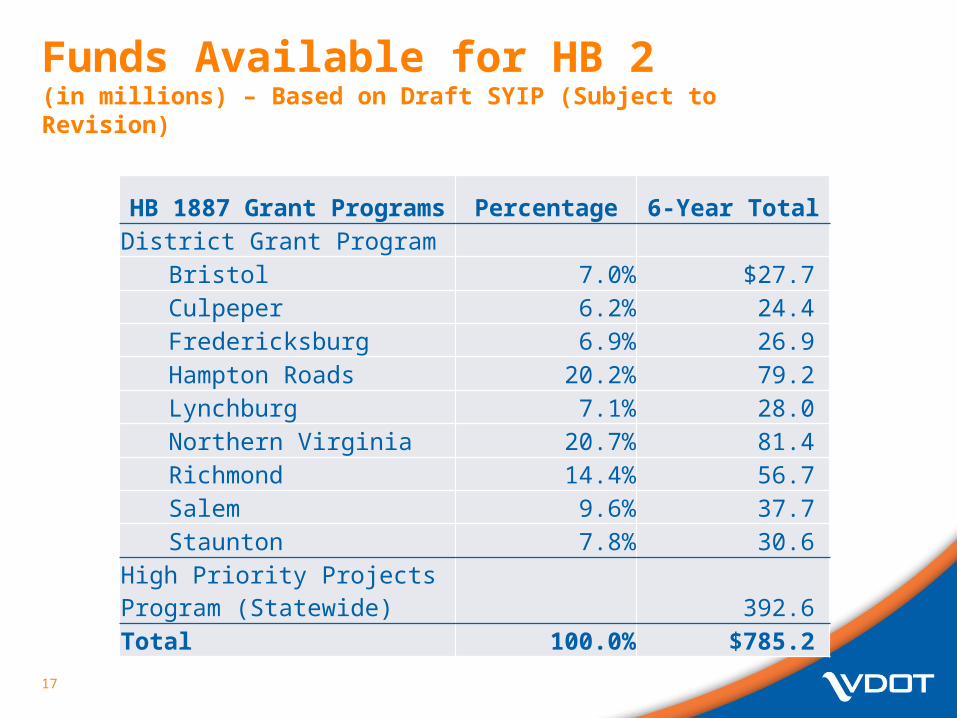
Funds Available for HB 2(in millions) – Based on Draft SYIP (Subject to Revision)
17
HB 1887 Grant Programs Percentage 6-Year TotalDistrict Grant Program
Bristol 7.0% $27.7 Culpeper 6.2% 24.4 Fredericksburg 6.9% 26.9 Hampton Roads 20.2% 79.2 Lynchburg 7.1% 28.0 Northern Virginia 20.7% 81.4 Richmond 14.4% 56.7 Salem 9.6% 37.7 Staunton 7.8% 30.6
High Priority Projects Program (Statewide) 392.6 Total 100.0% $785.2
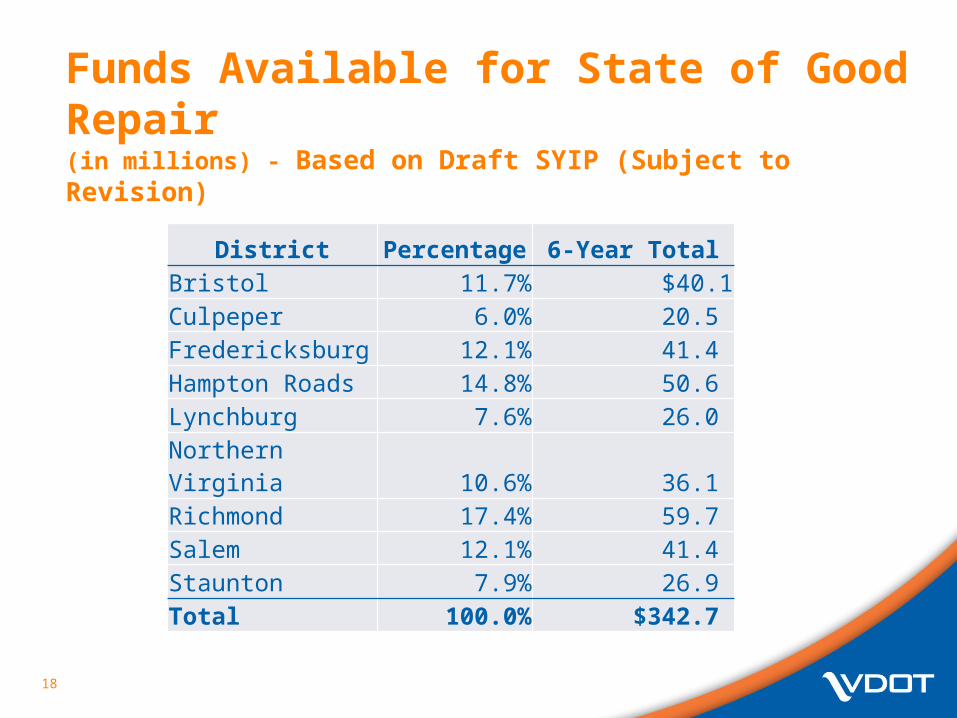
Funds Available for State of Good Repair(in millions) - Based on Draft SYIP (Subject to Revision)
18
District Percentage 6-Year TotalBristol 11.7% $40.1 Culpeper 6.0% 20.5 Fredericksburg 12.1% 41.4 Hampton Roads 14.8% 50.6 Lynchburg 7.6% 26.0 Northern Virginia 10.6% 36.1 Richmond 17.4% 59.7 Salem 12.1% 41.4 Staunton 7.9% 26.9 Total 100.0% $342.7
19
HB2 Overview
20
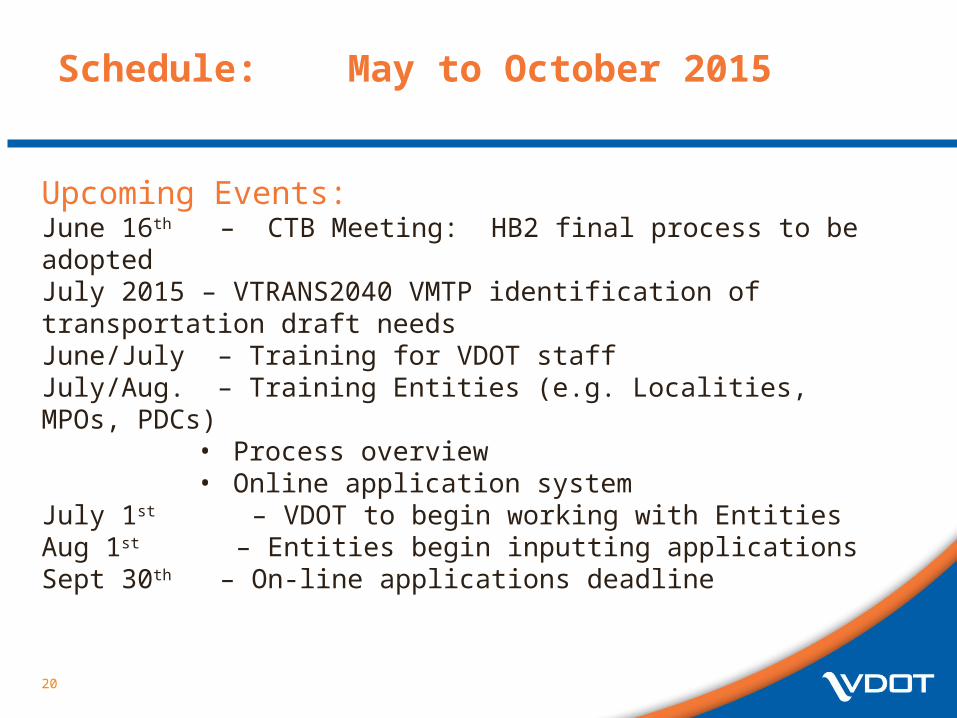
Schedule: May to October 2015
Upcoming Events:June 16th – CTB Meeting: HB2 final process to be adoptedJuly 2015 – VTRANS2040 VMTP identification of transportation draft needsJune/July – Training for VDOT staffJuly/Aug. – Training Entities (e.g. Localities, MPOs, PDCs)
• Process overview• Online application system
July 1st – VDOT to begin working with EntitiesAug 1st – Entities begin inputting applicationsSept 30th – On-line applications deadline
21
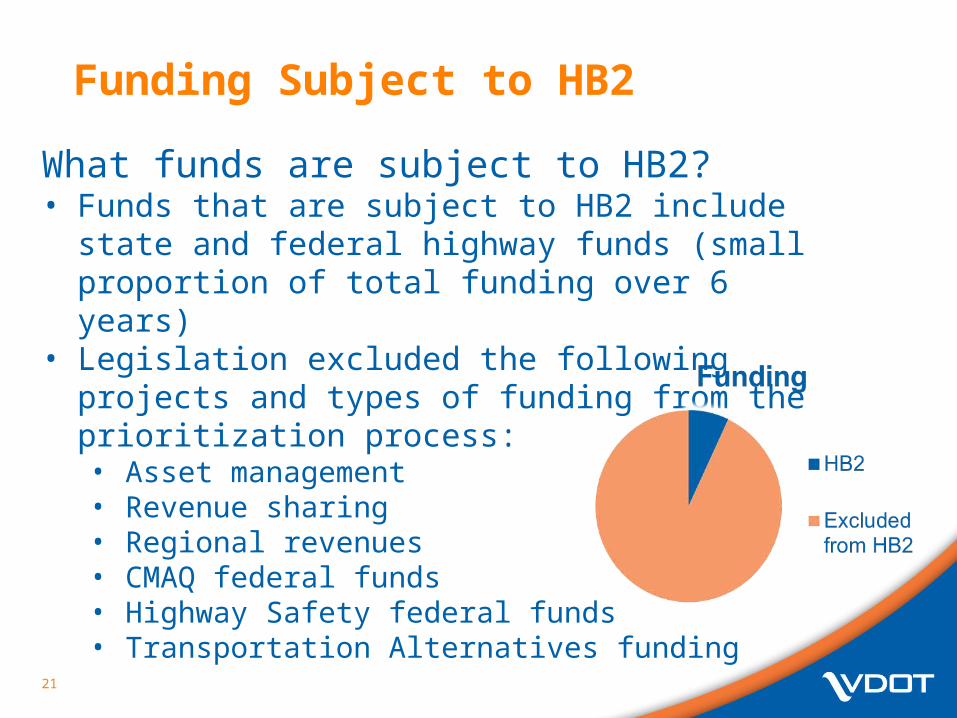
What funds are subject to HB2?• Funds that are subject to HB2 include state and
federal highway funds (small proportion of total funding over 6 years)
• Legislation excluded the following projects and types of funding from the prioritization process:• Asset management• Revenue sharing• Regional revenues• CMAQ federal funds• Highway Safety federal funds• Transportation Alternatives funding
Funding Subject to HB2
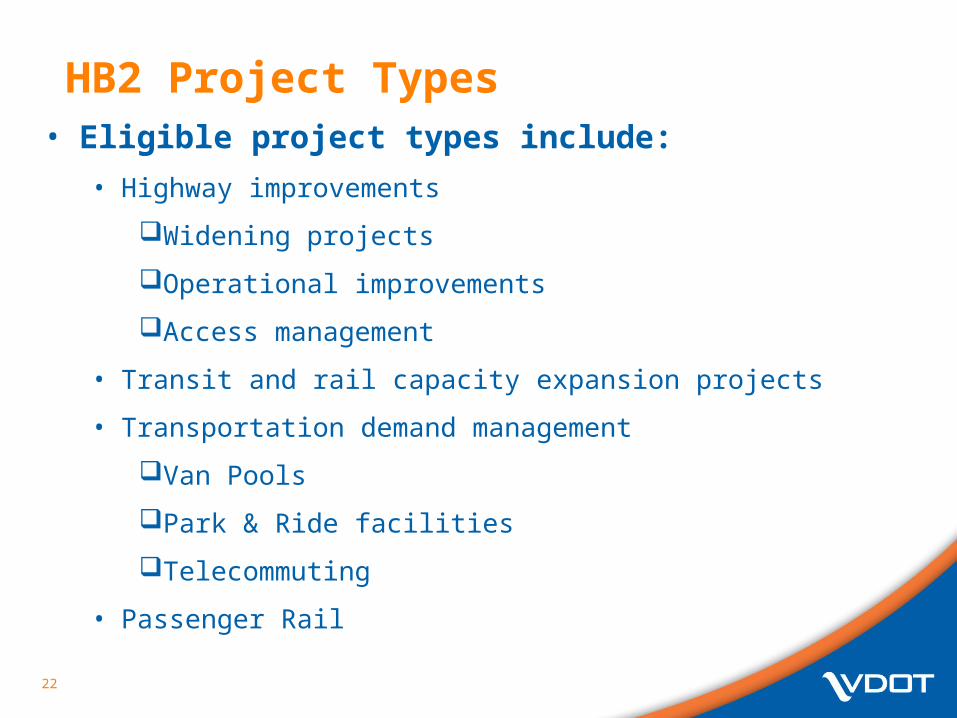
HB2 Project Types
22
• Eligible project types include:
• Highway improvements
Widening projects
Operational improvements
Access management
• Transit and rail capacity expansion projects
• Transportation demand management
Van Pools
Park & Ride facilities
Telecommuting
• Passenger Rail
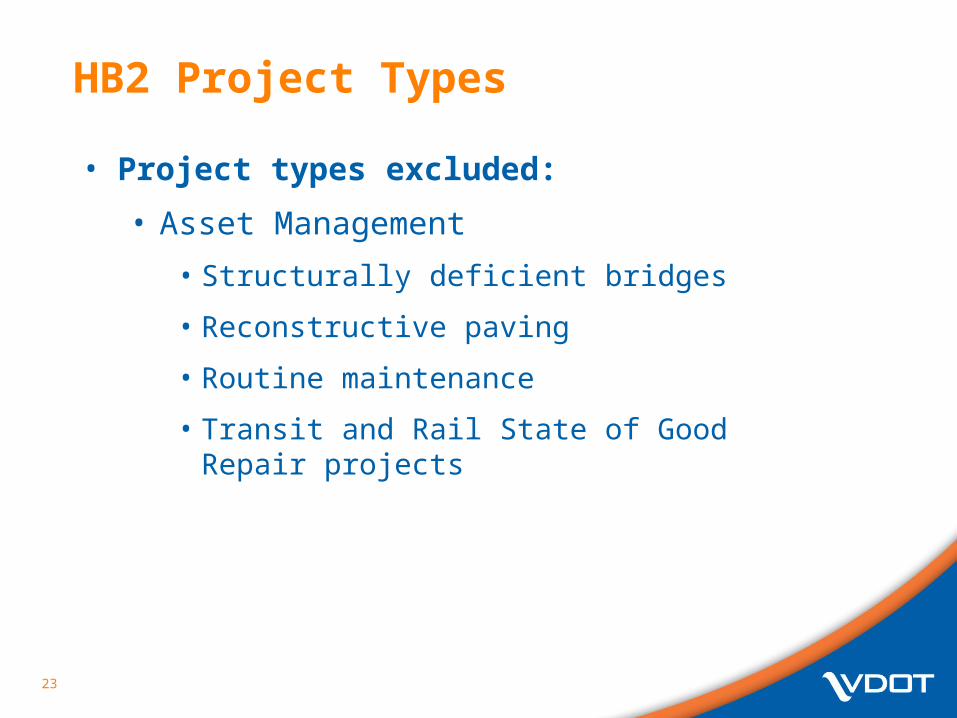
HB2 Project Types
23
• Project types excluded:
• Asset Management
• Structurally deficient bridges
• Reconstructive paving
• Routine maintenance
• Transit and Rail State of Good Repair projects
24
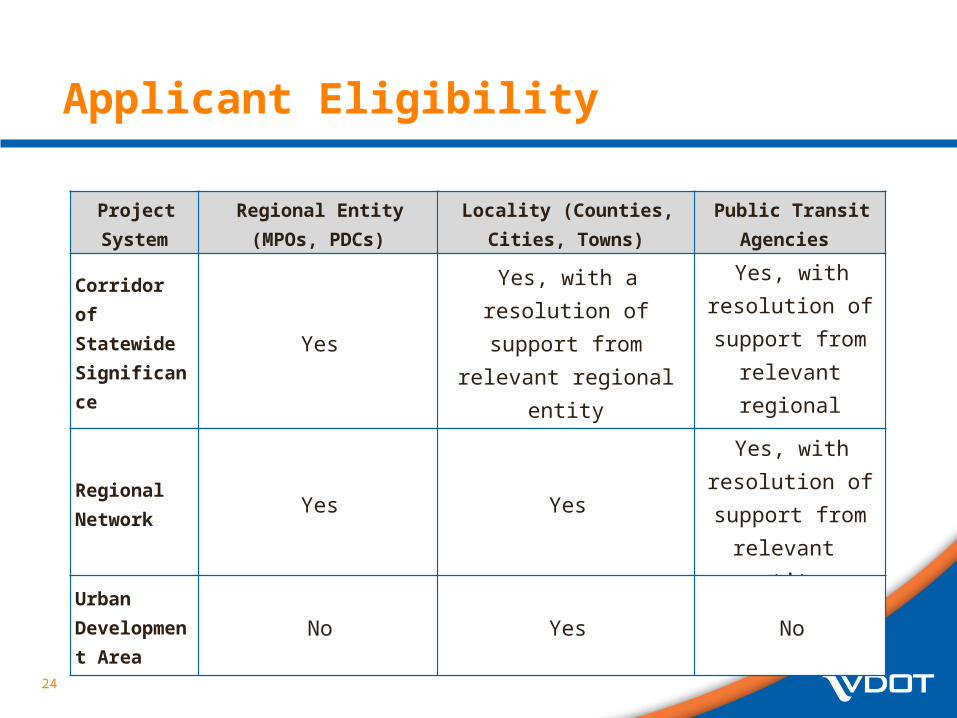
Applicant Eligibility
Project System
Regional Entity (MPOs, PDCs)
Locality (Counties, Cities, Towns)
Public Transit Agencies
Corridor of Statewide Significance
YesYes, with a resolution of support from relevant
regional entity
Yes, with resolution of support from
relevant regional entity
Regional Network
Yes Yes
Yes, with resolution of support from
relevant entity
Urban Development Area
No Yes No
25
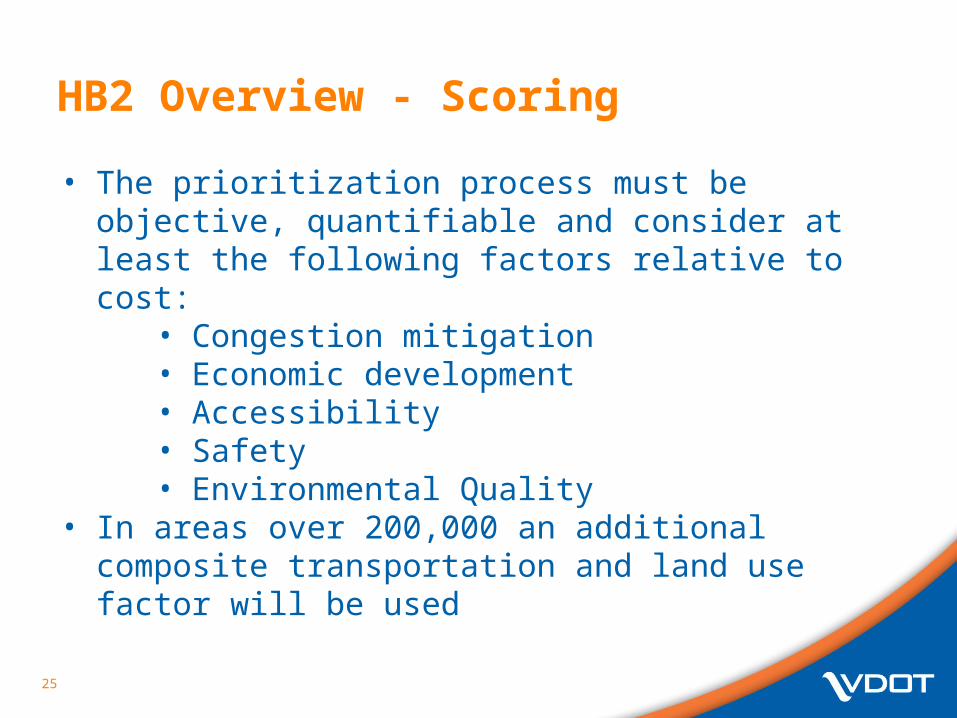
HB2 Overview - Scoring
• The prioritization process must be objective, quantifiable and consider at least the following factors relative to cost:
• Congestion mitigation • Economic development • Accessibility • Safety • Environmental Quality
• In areas over 200,000 an additional composite transportation and land use factor will be used
26
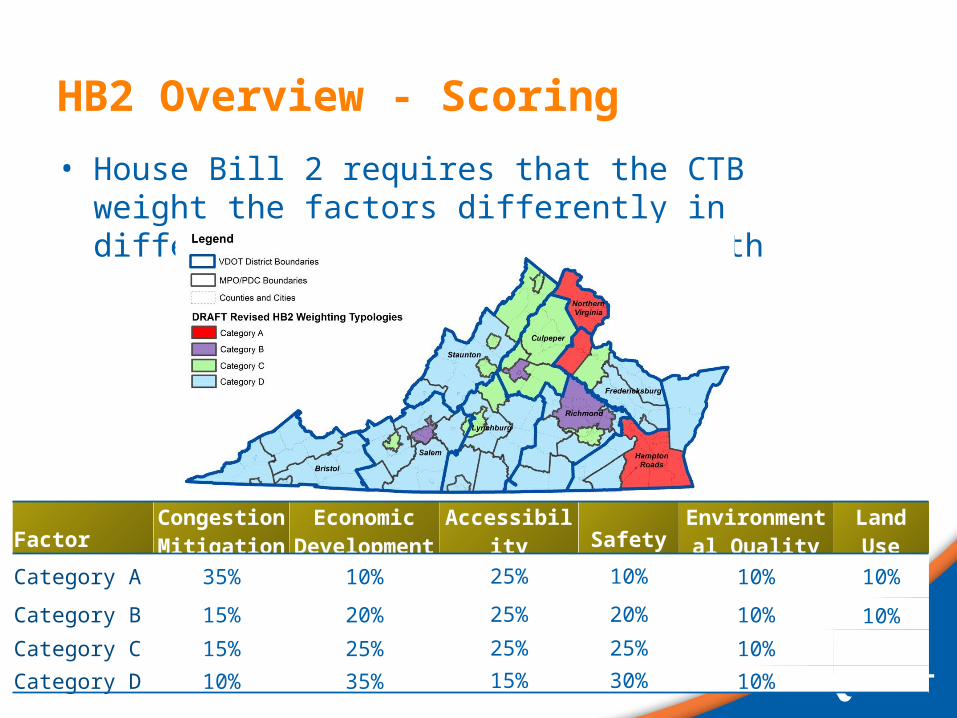
HB2 Overview - Scoring
• House Bill 2 requires that the CTB weight the factors differently in different parts of the Commonwealth
FactorCongestion Mitigation
Economic Development Accessibility Safety
Environmental Quality
Land Use
Category A 35% 10% 25% 10% 10% 10%
Category B 15% 20% 25% 20% 10% 10%
Category C 15% 25% 25% 25% 10%
Category D 10% 35% 15% 30% 10%
27
HB2 Overview – ScoringEvaluating Benefits Relative to Cost
• House Bill 2 requires that benefits produced by a project be analyzed on a basis of relative costs
• Results to be provided to CTB based on:
• Benefits relative to total costs
• Benefits relative to HB2 costs
28
HB2 Scoring
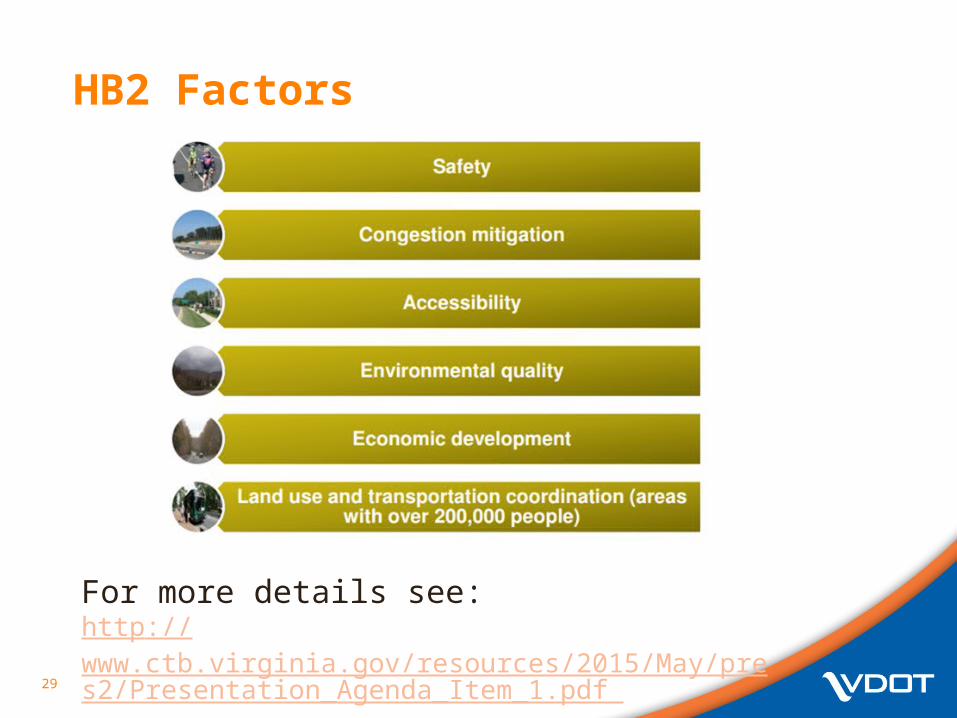
HB2 Factors
29
For more details see:http://www.ctb.virginia.gov/resources/2015/May/pres2/Presentation_Agenda_Item_1.pdf
30
Factor AreasGoals that guided measure development
• Safety – reduce the number and rate of fatalities and severe injuries
• Congestion – reduce person hours of delay and increase person throughput
• Accessibility – increase access to jobs and travel options• Economic Development – support economic development
and improve goods movement• Environmental Quality – improve air quality and avoid
impacts to the natural environment• Land Use – support transportation efficient land development
patterns
Measuring SAFETY
31
– 50% of score – Expected reduction in total fatalities and severe injuries (100% of score for transit projects)
– 50% of score – Expected reduction in the rate of fatalities and severe injuries per 100 million vehicle miles traveled
Measuring CONGESTION MITIGATION
32
– 50% of score – Change in peak period (multimodal) person throughput in the project corridor
– 50% of score - Change in the amount of peak period person hours of delay in the project corridor
Measuring ACCESSIBILITY
33
– 60% of score – Change in cumulative job accessibility (within 45 minutes) (within 60 minutes for transit projects)
– 20% of score - Change in cumulative job accessibility for disadvantaged populations (within 45 minutes by automobile and 60 minutes by transit)
– 20% of score – Assessment of the project support for connections between modes, and promotion of multiple transportation choices
Measuring ENVIRONMENTAL QUALITY
34
– 50% of score – Potential of project to reduce criteria air pollutant and greenhouse gas emissions
– 50% of Score – Potential impacts to natural and cultural resources
Measuring ECONOMIC DEVELOPMENT
35
– 70% of score – Assessment of progress made towards new economic development (new and expansion of existing)
– 30% of score - Rate projects based on the extent to which the project is deemed to enhance access to critical intermodal locations, interregional freight movement, and/or freight intensive industries
– Travel time reliability measure under development
Measuring LAND USE
36
– 100% of score – Degree to which project will support transportation efficient land use patterns and local policies
How Scoring Works
37
Scores will be graded on a curve.
10090
8070 60
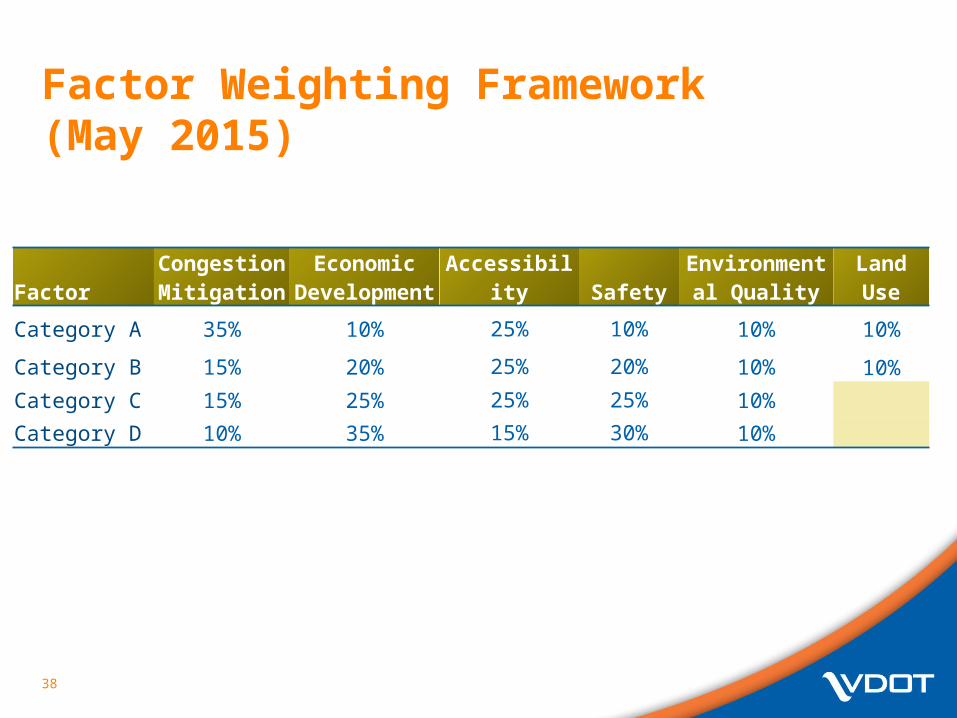
Factor Weighting Framework (May 2015)
38
FactorCongestion Mitigation
Economic Development Accessibility Safety
Environmental Quality
Land Use
Category A 35% 10% 25% 10% 10% 10%
Category B 15% 20% 25% 20% 10% 10%
Category C 15% 25% 25% 25% 10%
Category D 10% 35% 15% 30% 10%
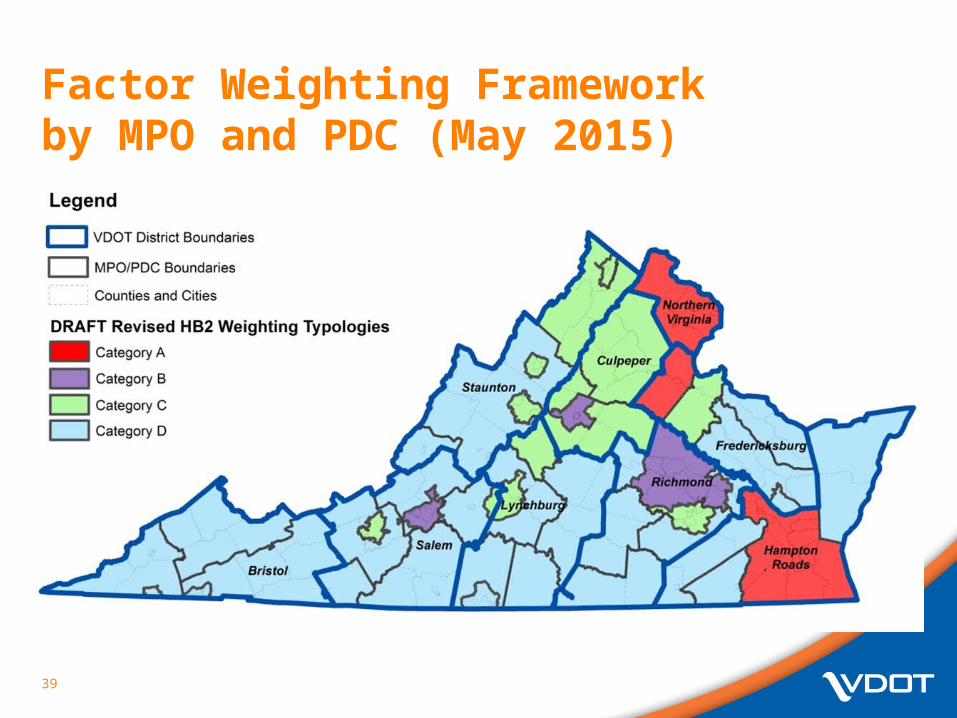
Factor Weighting Framework by MPO and PDC (May 2015)
39
40
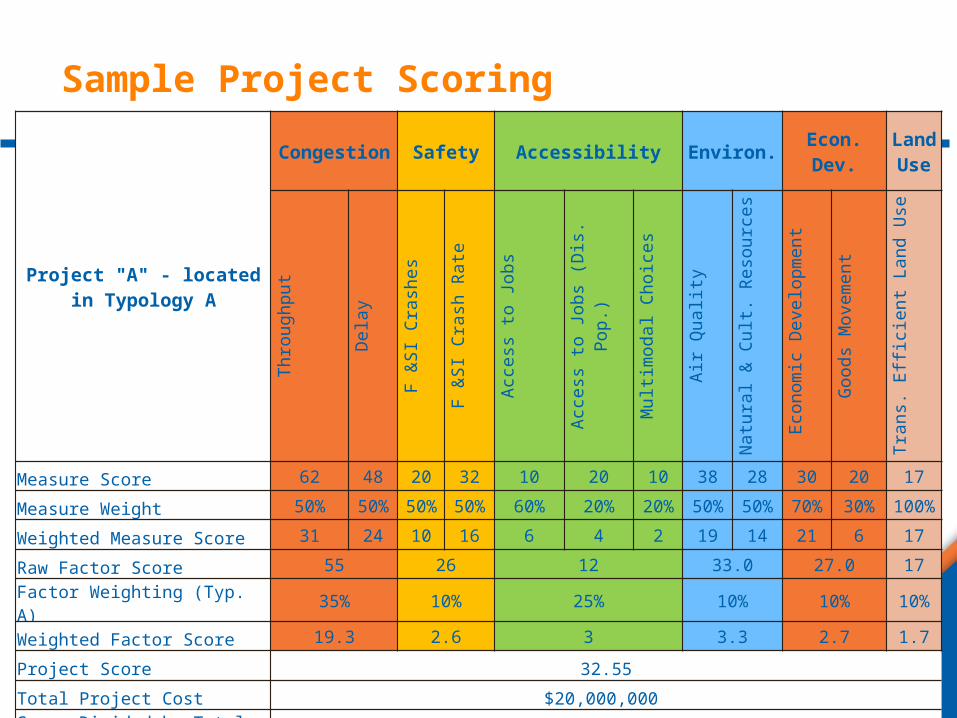
Sample Project Scoring
Project "A" - located in Typology A
Congestion Safety Accessibility Environ. Econ. Dev.Land Use
Throughput Delay
F &SI Crashes
F &SI Crash Rate
Access to Jobs
Access to Jobs
(Dis. Pop.)
Multimodal Choic
es
Air Qualit
y
Natural & Cult. Resources
Economic Developme
nt
Goods Movement
Trans. Efficie
nt Land Use
Measure Score 62 48 20 32 10 20 10 38 28 30 20 17
Measure Weight 50% 50% 50% 50% 60% 20% 20% 50% 50% 70% 30% 100%
Weighted Measure Score 31 24 10 16 6 4 2 19 14 21 6 17
Raw Factor Score 55 26 12 33.0 27.0 17
Factor Weighting (Typ. A) 35% 10% 25% 10% 10% 10%
Weighted Factor Score 19.3 2.6 3 3.3 2.7 1.7
Project Score 32.55
Total Project Cost $20,000,000
Score Divided by Total Cost 16.3
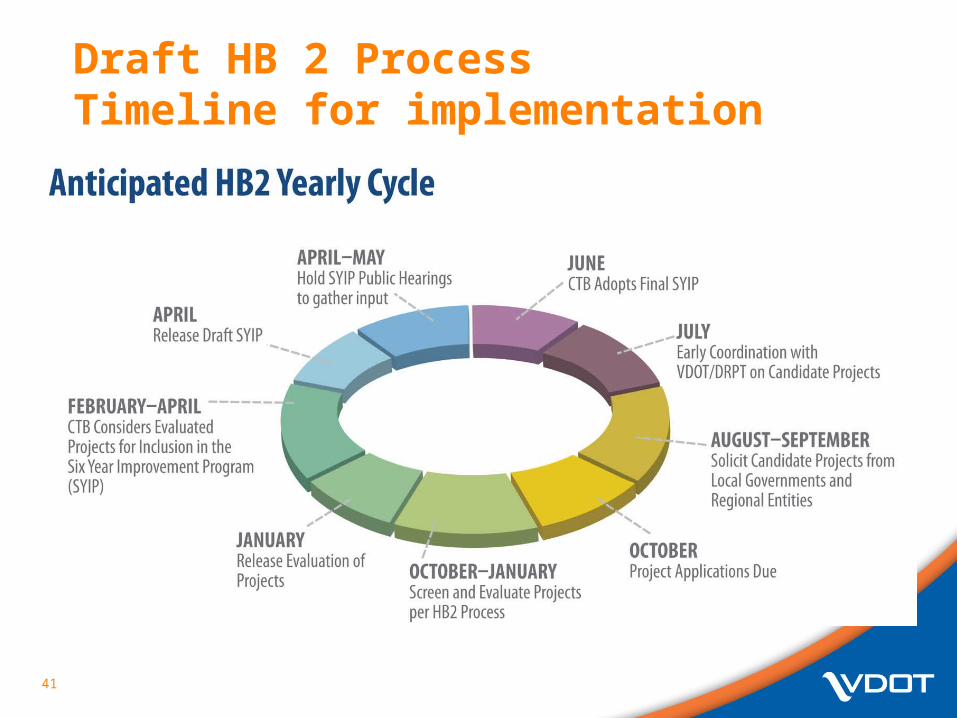
Draft HB 2 Process Timeline for implementation
41
42
Additional Resources
• Presentations to the CTB• www.ctb.virginia.gov
• HB2 Implementation Guide and Appendices• http://
virginiahb2.com/docs/HB2PolicyGuide_MeasuresAppendices_05182015.pdf
• HB2 Website• http://virginiahb2.com/
43