Embed Size (px)
Citation preview
HAZARD RANKING SYSTEM (HRS) DOCUMENTATION RECORD COVER SHEET Name of Site: Unity Auto Mart EPA ID No.: WIN000505544 Contact Persons Documentation Record: Nuria Muniz, National Priorities List Coordinator U.S. Environmental Protection Agency, Region 5 77 West Jackson Boulevard Chicago, Illinois 60606 (312) 886-4439 HRS Documentation Record: Quinn Kelley, Remedial Project Manager Restoration and Site Evaluation Section U.S. Environmental Protection Agency, Region 4 61 Forsyth Street, SW, 11th Floor Atlanta, Georgia 30303 (404) 562-8899 Pathways, Components, or Threats Not Scored The surface water migration, soil exposure and subsurface intrusion, and air migration pathways were not scored in this Hazard Ranking System documentation record because the ground water migration pathway is sufficient to qualify the site for the National Priorities List (NPL). These pathways are of concern to the U.S. Environmental Protection Agency (EPA) and may be considered during future evaluation. At the time of the listing, the site score is sufficient without the pathways mentioned above.

1
HAZARD RANKING SYSTEM (HRS) DOCUMENTATION RECORD
Name of Site:
EPA Region:
Date Prepared:
Street Address of Site*:
City, County, State, Zip:
Unity Auto Mart
5
September 2021
102 North Front Street
Unity, Marathon County, Wisconsin 54488
General Location in the State: Central portion of state
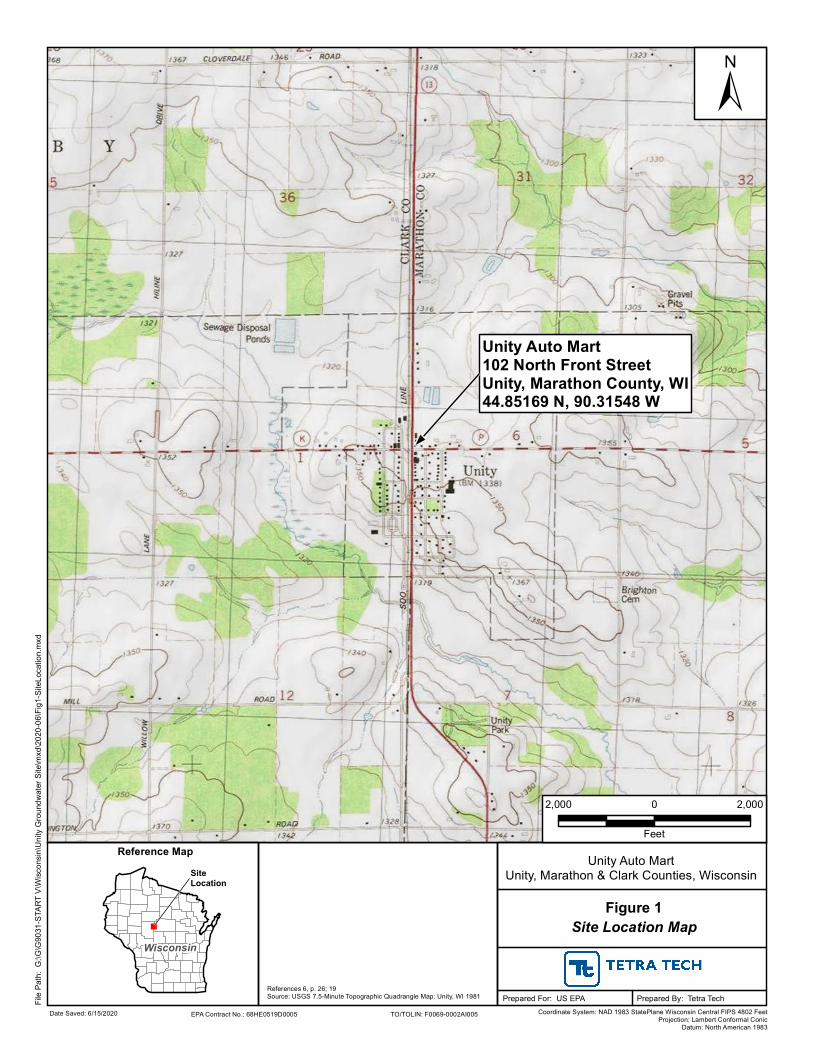
Topographic Map: Spencer North, WI 2018 (Ref. 19)
Latitude: 44.85169 North
Longitude: 90.31548 West
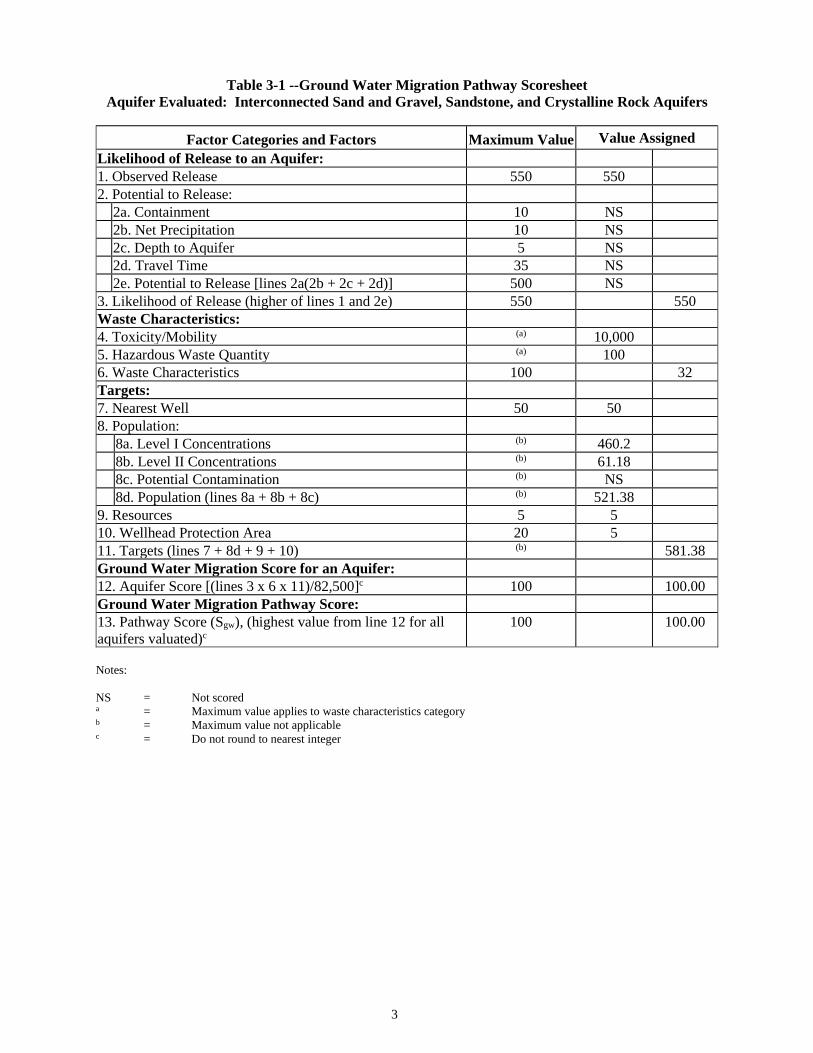
The coordinates above for Unity Auto Mart were measured from the location of permanent monitoring well EPA-8D (Refs. 6, p. 26; 19; 36) (see Figures 1 and 3 of this HRS documentation record).
* The street address, coordinates, and contaminant locations presented in this HRS documentationrecord identify the general area in which the site is located. They represent one or more locations EPAconsiders to be part of the site based on the screening information EPA used to evaluate the site for NPLlisting. EPA lists national priorities among the known “releases or threatened releases” of hazardoussubstances; thus, the focus is on the release, not precisely delineated boundaries. A site is defined aswhere a hazardous substance has been “deposited, stored, disposed, or placed, or has otherwise come tobe located.” Generally, HRS scoring and the subsequent listing of a release merely represent the initialdetermination that a certain area may need to be addressed under the Comprehensive EnvironmentalResponse, Compensation, and Liability Act (CERCLA). Accordingly, EPA contemplates that thepreliminary description of facility boundaries at the time of scoring will be refined as more information isdeveloped as to where the contamination has come to be located.
Pathway Pathway Score Ground Water1 Migration 100.00 Surface Water Migration NS Soil Exposure and Subsurface Intrusion NS Air Migration NS HRS SITE SCORE 50.00
Note:
NS Not scored
1 “Ground water” and “groundwater” are synonymous; the spelling is different due to “ground water” being codified as part of the HRS, while “groundwater” is the modern spelling.
2
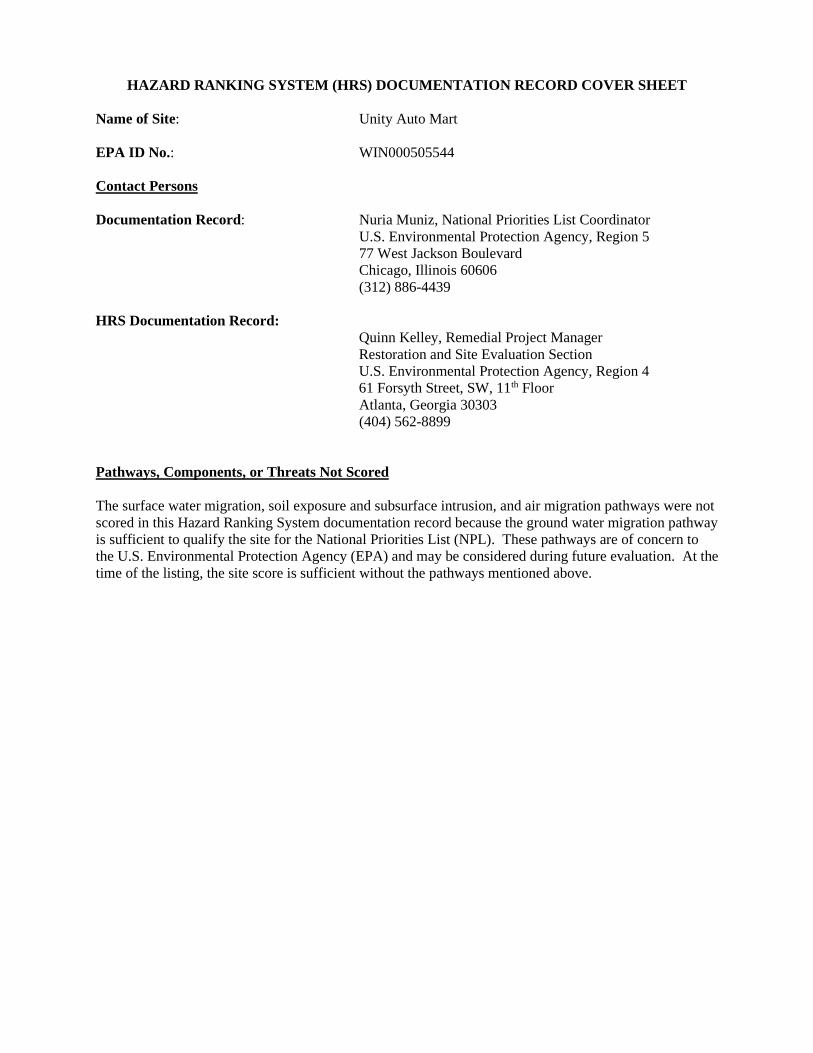
WORKSHEET FOR COMPUTING HRS SITE SCORE
S Pathway S2 Pathway Ground Water Migration Pathway Score (Sgw) 100 10,000 Surface Water Migration Pathway Score (Ssw) NS NS Soil Exposure and Subsurface Intrusion Pathway Score (Ssessi) NS NS Air Migration Pathway Score (Sa) NS NS S2
gw + S2sw + S2
sessi + S2a 10,000
(S2gw + S2
sw + S2sessi + S2
a) / 4 2,500 √ (S2
gw + S2sw + S2
sessi + S2a) / 4 50.00
Note: NS = Not scored
3
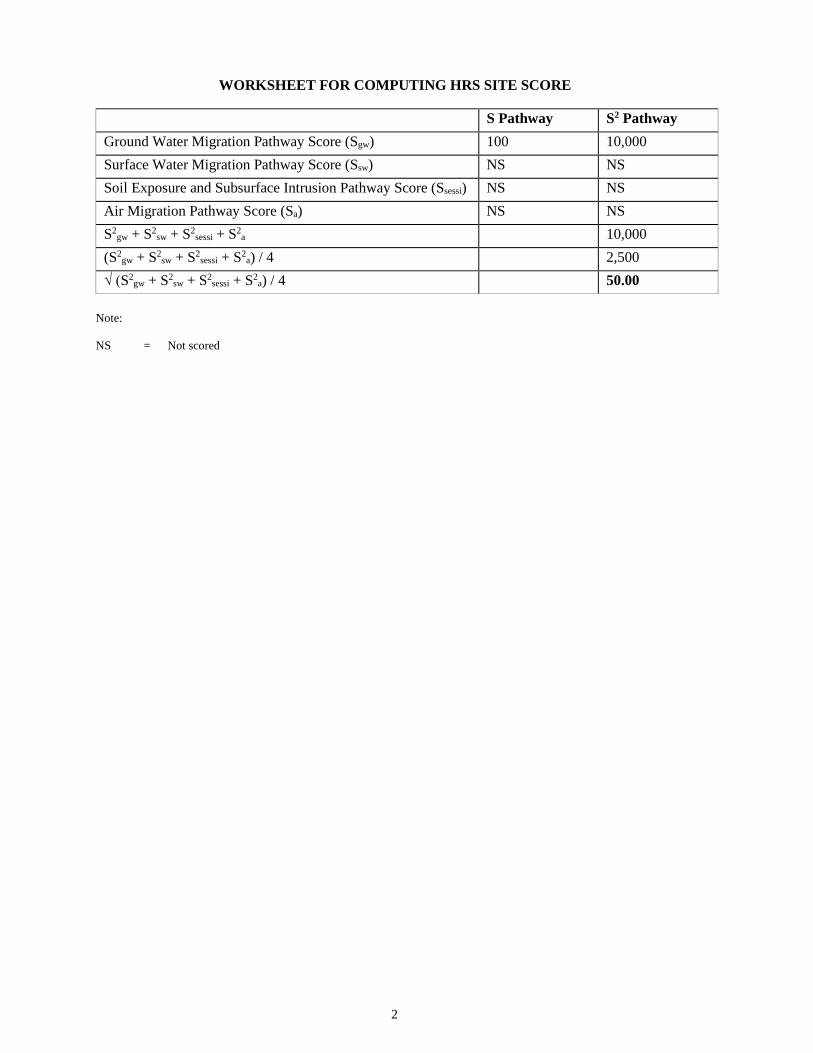
Table 3-1 --Ground Water Migration Pathway Scoresheet Aquifer Evaluated: Interconnected Sand and Gravel, Sandstone, and Crystalline Rock Aquifers
Factor Categories and Factors Maximum Value Value Assigned Likelihood of Release to an Aquifer: 1. Observed Release 550 550 2. Potential to Release: 2a. Containment 10 NS 2b. Net Precipitation 10 NS 2c. Depth to Aquifer 5 NS 2d. Travel Time 35 NS 2e. Potential to Release [lines 2a(2b + 2c + 2d)] 500 NS 3. Likelihood of Release (higher of lines 1 and 2e) 550 550 Waste Characteristics: 4. Toxicity/Mobility (a) 10,000 5. Hazardous Waste Quantity (a) 100 6. Waste Characteristics 100 32 Targets: 7. Nearest Well 50 50 8. Population: 8a. Level I Concentrations (b) 460.2 8b. Level II Concentrations (b) 61.18 8c. Potential Contamination (b) NS 8d. Population (lines 8a + 8b + 8c) (b) 521.38 9. Resources 5 5 10. Wellhead Protection Area 20 5 11. Targets (lines 7 + 8d + 9 + 10) (b) 581.38 Ground Water Migration Score for an Aquifer: 12. Aquifer Score [(lines 3 x 6 x 11)/82,500]c 100 100.00 Ground Water Migration Pathway Score: 13. Pathway Score (Sgw), (highest value from line 12 for all aquifers valuated)c
100 100.00
Notes: NS = Not scored a = Maximum value applies to waste characteristics category b = Maximum value not applicable c = Do not round to nearest integer
±Fil
e Path
: G:\G
\G90
31-S
TART
V\Wi
scon
sin\U
nity G
round
water
Site
\mxd
\2020
-06\Fi
g1-S
iteLo
catio
n.mxd
Date Saved: 6/15/2020
"
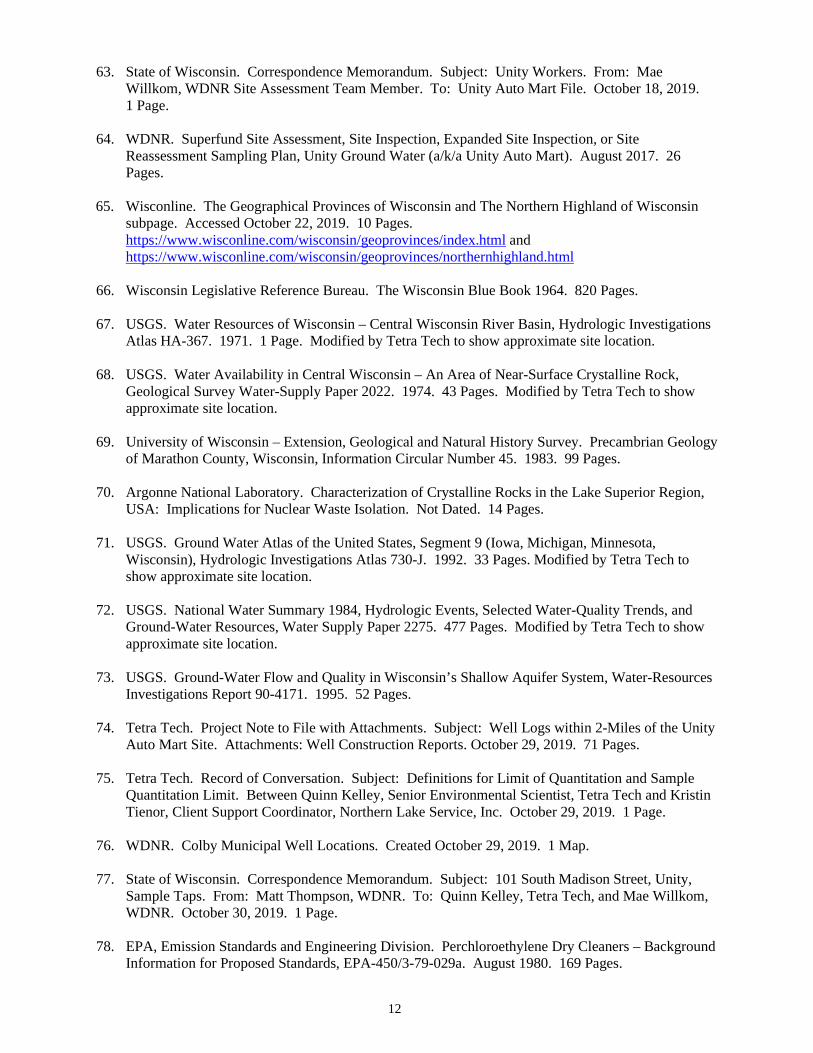
Wisconsin
Coordinate System: NAD 1983 StatePlane Wisconsin Central FIPS 4802 FeetProjection: Lambert Conformal Conic
Datum: North American 1983
Unity Auto MartUnity, Marathon & Clark Counties, Wisconsin
Figure 1Site Location Map
Prepared For: US EPA Prepared By: Tetra TechEPA Contract No.: 68HE0519D0005 TO/TOLIN: F0069-0002AI005
2,000 0 2,000
Feet
References 6, p. 26; 19Source: USGS 7.5-Minute Topographic Quadrangle Map: Unity, WI 1981
Reference MapSiteLocation
Unity Auto Mart102 North Front StreetUnity, Marathon County, WI44.85169 N, 90.31548 W
4
UnityAutoMart
N Fr
ont S
t
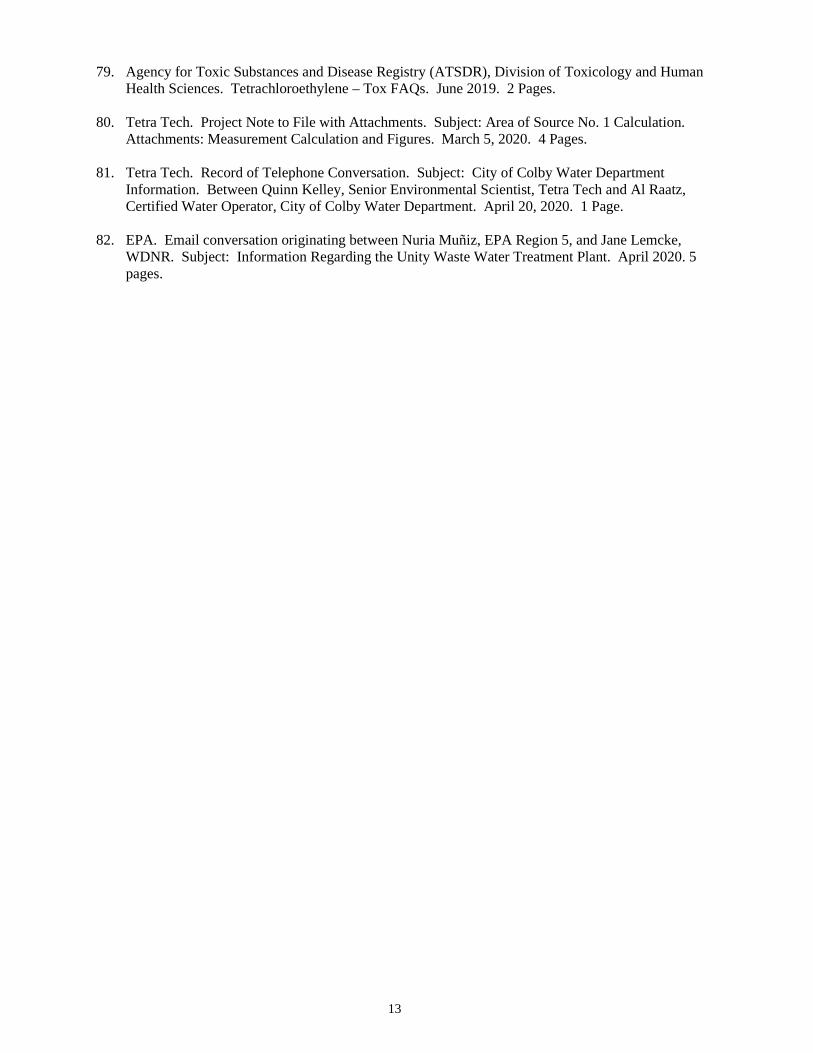
W Clark St
Cano
pyClar
k Cou
ntyMa
ratho
n Cou
nty
EB-04EB-02
EB-03
EB-01EB-06
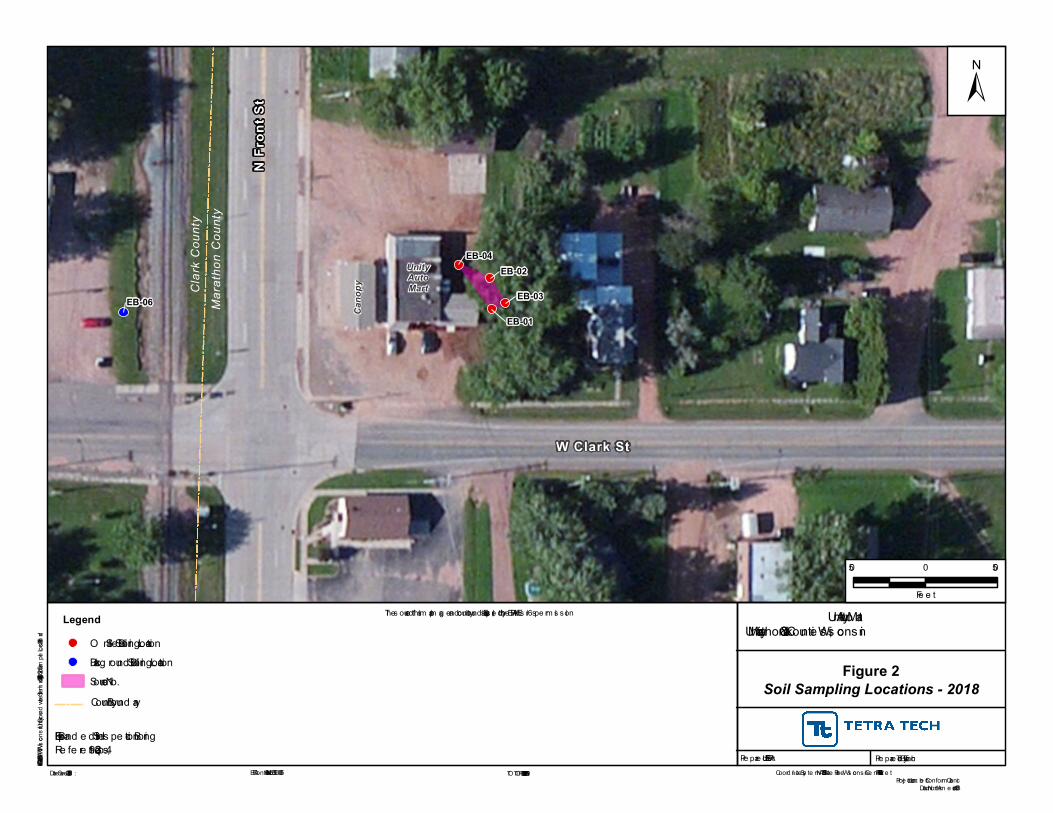
Unity Auto MartUnity, Marathon & Clark Countie s , Wis cons in
Figure 2Soil Sampling Locations - 2018
Coord inate Sys te m : NAD 1983 State Plane Wis cons in Ce ntral FIPS 4802 Fe e tProje ction: Lam be rt Conform al Conic
Datum : North Am e rican 1983
Pre pare d By: Te tra TechFile Path: G:\G\G9031-START V\Wisconsin\Unity Groundwater Site\mxd\2020-06\Fig2-SoilSampleLocs-2018.mxd
LegendO n-Site Soil Boring LocationBackg round Soil Boring LocationSource No. 1
Pre pare d For: US EPAEPA Contract No.: 68HE0519D0005 TO /TO LIN: F0072-0001AI069Date Save d : 6/15/2020
50 0 50
Fe e t
±
EB = Expand e d Site Ins pe ction BoringRe fe re nce s 4, p. 23; 19
County Bound ary
The s ource of this m ap im ag e and county bound ary is Es ri, us e d by the EPA with Es ri’s pe rm is s ion
5
&<
&<
&<
&<
&<
&<
&<
&<&<
UnityAutoMart
N Fr
ont S
t
W Clark St
Cano
py
Clar
k Cou
ntyMa
ratho
n Cou
nty
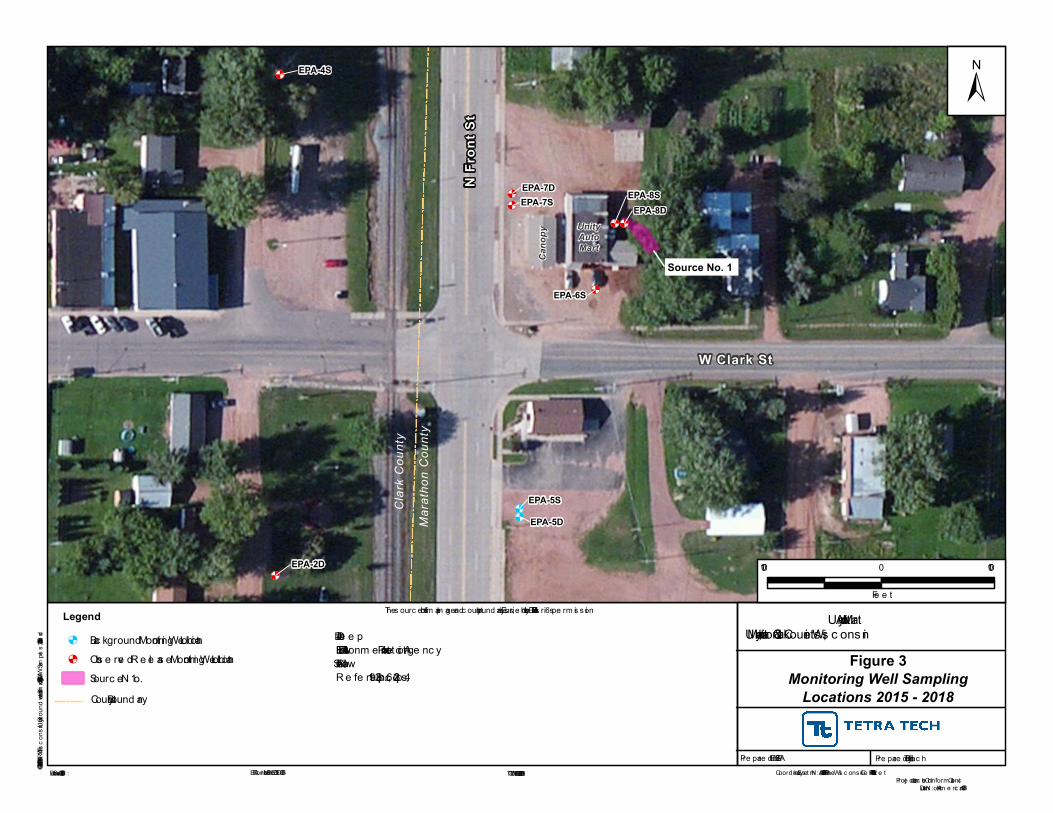
Source No. 1
EPA-4S
EPA-2D
EPA-5SEPA-5D
EPA-6S
EPA-7S EPA-8SEPA-7D
EPA-8D
Unity Auto MartUnity, Marathon & Clark Countie s , Wis c ons in
Figure 3Monitoring Well Sampling
Locations 2015 - 2018
Coord inate Sys te m : N AD 1983 State Plane Wis c ons in Ce ntral FIPS 4802 Fe e tProje c tion: Lam be rt Conform al Conic
Datum : N orth Am e ric an 1983
Pre pare d By: Te tra Te c hFile Path: G:\G\G9031-START V\Wisconsin\Unity Groundwater Site\mxd\2020-06\Fig3-MWSamples2015-2018.mxd
Legend&< Bac kground Monitoring We ll Loc ation&< Obs e rve d R e le as e Monitoring We ll Loc ation
Sourc e N o. 1
Pre pare d For: US EPAEPA Contrac t N o.: 68HE0519D0005 TO/TOLIN : F0072-0001AI069Date Save d : 6/16/2020
100 0 100
Fe e t
±
#D = De e pEPA = U.S. Environm e ntal Prote c tion Age nc y#S = ShallowR e fe re nc e s 4, p. 23; 6, p. 26; 19
County Bound ary
The s ourc e of this m ap im age and c ounty boundary is Es ri, us e d by the EPA with Es ri’s pe rm is s ion
6
Clar
k Cou
nty
Mara
thon C
ounty
Source No. 1
PW-1PW-2
PW-4
PW-5
RPW-1
RPW-3
RPW-4
RPW-5
RPW-7
RPW-8
RPW-10
RPW-14
RPW-29
RPW-38 RPW-40
NSW-6
PW-3
PW-6
RPW-15
RPW-16
RPW-20
RPW-24
RPW-30
RPW-32
RPW-33 RPW-34
RPW-11
RPW-23
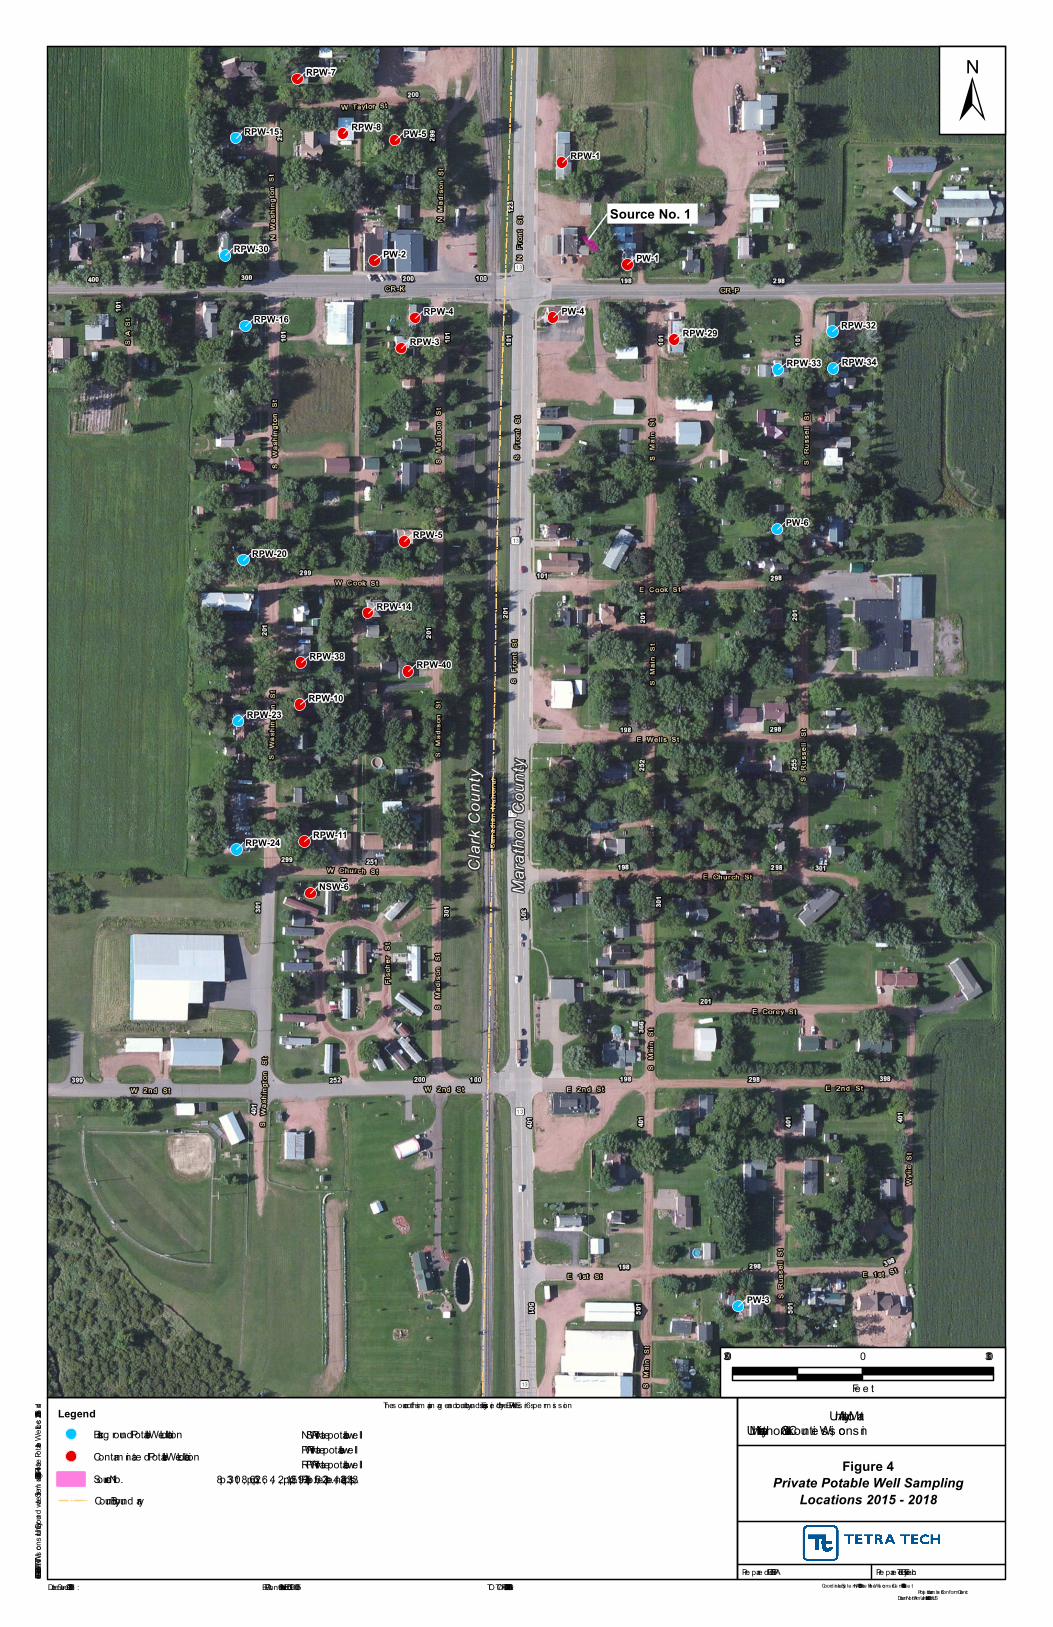
Figure 4Private Potable Well Sampling
Locations 2015 - 2018
Unity Auto MartUnity, Marathon & Clark Countie s , Wis cons in
Pre pare d For: US EPA Pre pare d By: Te tra TechEPA Contract No.: 68HE0519D0005 TO /TO LIN: F0072-0001AI069Date Save d : 6/15/2020
File Path: G:\G\G9031-START V\Wisconsin\Unity Groundwater Site\mxd\2020-06\Fig4-PrivatePotableWellLocs2015-2018.mxd
300 0 300
Fe e t
Coord inate Sys te m : NAD 1983 StatePlane Wiscons in Ce ntral FIPS 4802 Fe e tProjection: Lambe rt Conform al Conic
Datum :North Am e rican 1983 Units : Foot US
LegendBackg round Potable We ll LocationContam inate d Potable We ll LocationSource No. 1
±
NSW = Private potable we llPW = Private potable we llRPW = Private potable we llRe fe re nce s 3, pp. 31, 32; 4, p. 23; 6, p. 25; 19; 25, pp. 1, 2, 4, 6; 32, pp. 6, 8, 10; 33, p. 8
County Bound ary
The s ource of this m ap im ag e and county bound ary is Es ri, us e d by the EPA with Es ri’s pe rm is s ion
7
8
REFERENCES
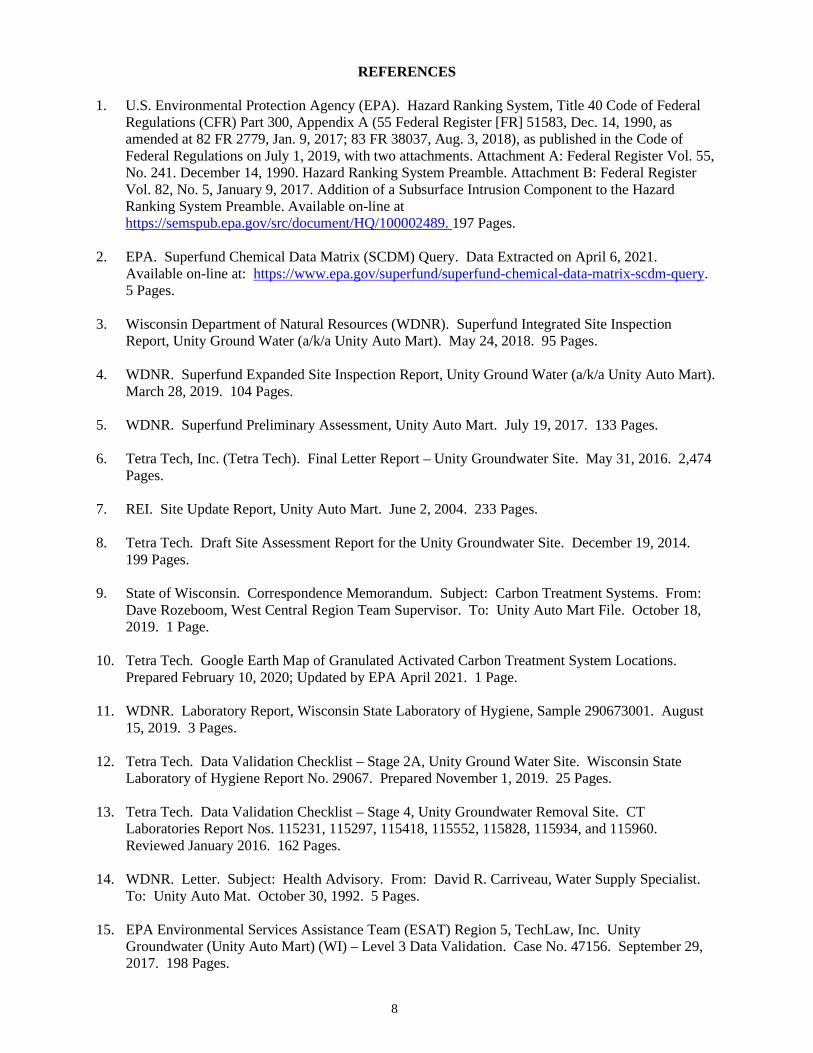
1. U.S. Environmental Protection Agency (EPA). Hazard Ranking System, Title 40 Code of Federal Regulations (CFR) Part 300, Appendix A (55 Federal Register [FR] 51583, Dec. 14, 1990, as amended at 82 FR 2779, Jan. 9, 2017; 83 FR 38037, Aug. 3, 2018), as published in the Code of Federal Regulations on July 1, 2019, with two attachments. Attachment A: Federal Register Vol. 55, No. 241. December 14, 1990. Hazard Ranking System Preamble. Attachment B: Federal Register Vol. 82, No. 5, January 9, 2017. Addition of a Subsurface Intrusion Component to the Hazard Ranking System Preamble. Available on-line at https://semspub.epa.gov/src/document/HQ/100002489. 197 Pages.
2. EPA. Superfund Chemical Data Matrix (SCDM) Query. Data Extracted on April 6, 2021.
Available on-line at: https://www.epa.gov/superfund/superfund-chemical-data-matrix-scdm-query. 5 Pages.
3. Wisconsin Department of Natural Resources (WDNR). Superfund Integrated Site Inspection Report, Unity Ground Water (a/k/a Unity Auto Mart). May 24, 2018. 95 Pages.
4. WDNR. Superfund Expanded Site Inspection Report, Unity Ground Water (a/k/a Unity Auto Mart).
March 28, 2019. 104 Pages.
5. WDNR. Superfund Preliminary Assessment, Unity Auto Mart. July 19, 2017. 133 Pages.
6. Tetra Tech, Inc. (Tetra Tech). Final Letter Report – Unity Groundwater Site. May 31, 2016. 2,474 Pages.
7. REI. Site Update Report, Unity Auto Mart. June 2, 2004. 233 Pages.
8. Tetra Tech. Draft Site Assessment Report for the Unity Groundwater Site. December 19, 2014.
199 Pages.
9. State of Wisconsin. Correspondence Memorandum. Subject: Carbon Treatment Systems. From: Dave Rozeboom, West Central Region Team Supervisor. To: Unity Auto Mart File. October 18, 2019. 1 Page.
10. Tetra Tech. Google Earth Map of Granulated Activated Carbon Treatment System Locations.
Prepared February 10, 2020; Updated by EPA April 2021. 1 Page.
11. WDNR. Laboratory Report, Wisconsin State Laboratory of Hygiene, Sample 290673001. August 15, 2019. 3 Pages.
12. Tetra Tech. Data Validation Checklist – Stage 2A, Unity Ground Water Site. Wisconsin State
Laboratory of Hygiene Report No. 29067. Prepared November 1, 2019. 25 Pages.
13. Tetra Tech. Data Validation Checklist – Stage 4, Unity Groundwater Removal Site. CT Laboratories Report Nos. 115231, 115297, 115418, 115552, 115828, 115934, and 115960. Reviewed January 2016. 162 Pages.
14. WDNR. Letter. Subject: Health Advisory. From: David R. Carriveau, Water Supply Specialist.
To: Unity Auto Mat. October 30, 1992. 5 Pages.
15. EPA Environmental Services Assistance Team (ESAT) Region 5, TechLaw, Inc. Unity Groundwater (Unity Auto Mart) (WI) – Level 3 Data Validation. Case No. 47156. September 29, 2017. 198 Pages.
9
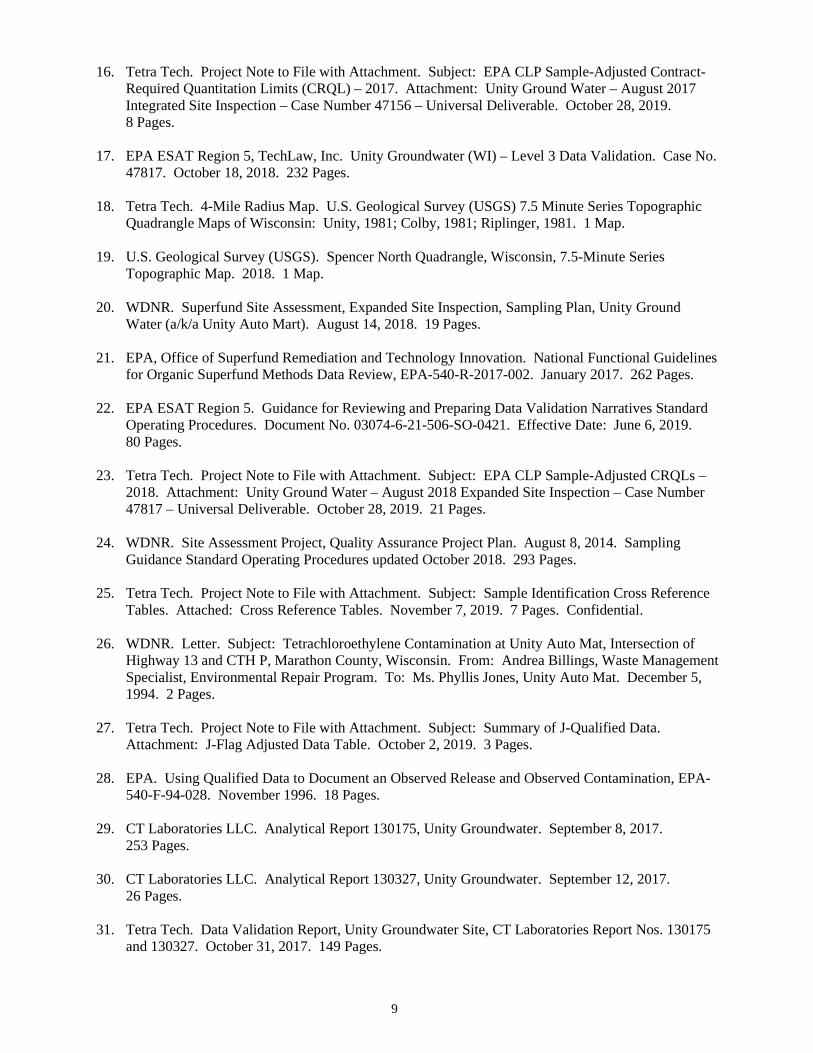
16. Tetra Tech. Project Note to File with Attachment. Subject: EPA CLP Sample-Adjusted Contract-Required Quantitation Limits (CRQL) – 2017. Attachment: Unity Ground Water – August 2017 Integrated Site Inspection – Case Number 47156 – Universal Deliverable. October 28, 2019. 8 Pages.
17. EPA ESAT Region 5, TechLaw, Inc. Unity Groundwater (WI) – Level 3 Data Validation. Case No.
47817. October 18, 2018. 232 Pages.
18. Tetra Tech. 4-Mile Radius Map. U.S. Geological Survey (USGS) 7.5 Minute Series Topographic Quadrangle Maps of Wisconsin: Unity, 1981; Colby, 1981; Riplinger, 1981. 1 Map.
19. U.S. Geological Survey (USGS). Spencer North Quadrangle, Wisconsin, 7.5-Minute Series
Topographic Map. 2018. 1 Map.
20. WDNR. Superfund Site Assessment, Expanded Site Inspection, Sampling Plan, Unity Ground Water (a/k/a Unity Auto Mart). August 14, 2018. 19 Pages.
21. EPA, Office of Superfund Remediation and Technology Innovation. National Functional Guidelines
for Organic Superfund Methods Data Review, EPA-540-R-2017-002. January 2017. 262 Pages.
22. EPA ESAT Region 5. Guidance for Reviewing and Preparing Data Validation Narratives Standard Operating Procedures. Document No. 03074-6-21-506-SO-0421. Effective Date: June 6, 2019. 80 Pages.
23. Tetra Tech. Project Note to File with Attachment. Subject: EPA CLP Sample-Adjusted CRQLs –
2018. Attachment: Unity Ground Water – August 2018 Expanded Site Inspection – Case Number 47817 – Universal Deliverable. October 28, 2019. 21 Pages.
24. WDNR. Site Assessment Project, Quality Assurance Project Plan. August 8, 2014. Sampling
Guidance Standard Operating Procedures updated October 2018. 293 Pages.
25. Tetra Tech. Project Note to File with Attachment. Subject: Sample Identification Cross Reference Tables. Attached: Cross Reference Tables. November 7, 2019. 7 Pages. Confidential.
26. WDNR. Letter. Subject: Tetrachloroethylene Contamination at Unity Auto Mat, Intersection of
Highway 13 and CTH P, Marathon County, Wisconsin. From: Andrea Billings, Waste Management Specialist, Environmental Repair Program. To: Ms. Phyllis Jones, Unity Auto Mat. December 5, 1994. 2 Pages.
27. Tetra Tech. Project Note to File with Attachment. Subject: Summary of J-Qualified Data.
Attachment: J-Flag Adjusted Data Table. October 2, 2019. 3 Pages.
28. EPA. Using Qualified Data to Document an Observed Release and Observed Contamination, EPA-540-F-94-028. November 1996. 18 Pages.
29. CT Laboratories LLC. Analytical Report 130175, Unity Groundwater. September 8, 2017.
253 Pages.
30. CT Laboratories LLC. Analytical Report 130327, Unity Groundwater. September 12, 2017. 26 Pages.
31. Tetra Tech. Data Validation Report, Unity Groundwater Site, CT Laboratories Report Nos. 130175
and 130327. October 31, 2017. 149 Pages.
10
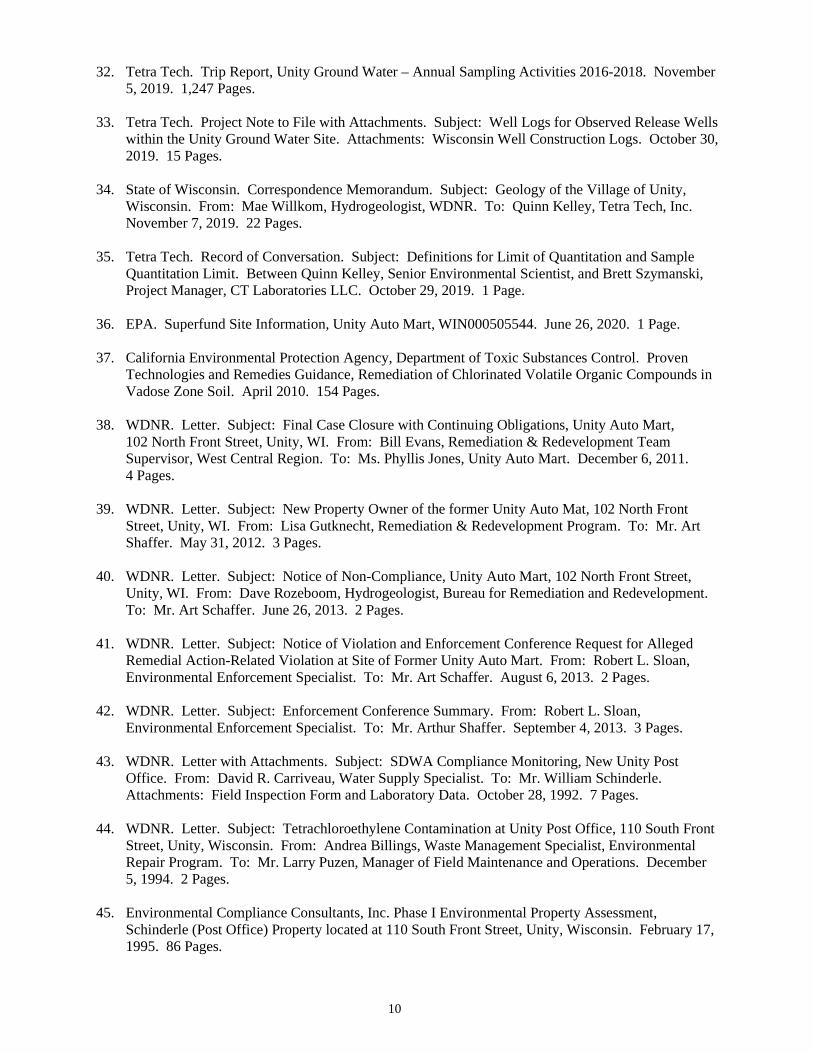
32. Tetra Tech. Trip Report, Unity Ground Water – Annual Sampling Activities 2016-2018. November 5, 2019. 1,247 Pages.
33. Tetra Tech. Project Note to File with Attachments. Subject: Well Logs for Observed Release Wells
within the Unity Ground Water Site. Attachments: Wisconsin Well Construction Logs. October 30, 2019. 15 Pages.
34. State of Wisconsin. Correspondence Memorandum. Subject: Geology of the Village of Unity, Wisconsin. From: Mae Willkom, Hydrogeologist, WDNR. To: Quinn Kelley, Tetra Tech, Inc. November 7, 2019. 22 Pages.
35. Tetra Tech. Record of Conversation. Subject: Definitions for Limit of Quantitation and Sample
Quantitation Limit. Between Quinn Kelley, Senior Environmental Scientist, and Brett Szymanski, Project Manager, CT Laboratories LLC. October 29, 2019. 1 Page.
36. EPA. Superfund Site Information, Unity Auto Mart, WIN000505544. June 26, 2020. 1 Page.
37. California Environmental Protection Agency, Department of Toxic Substances Control. Proven
Technologies and Remedies Guidance, Remediation of Chlorinated Volatile Organic Compounds in Vadose Zone Soil. April 2010. 154 Pages.
38. WDNR. Letter. Subject: Final Case Closure with Continuing Obligations, Unity Auto Mart,
102 North Front Street, Unity, WI. From: Bill Evans, Remediation & Redevelopment Team Supervisor, West Central Region. To: Ms. Phyllis Jones, Unity Auto Mart. December 6, 2011. 4 Pages.
39. WDNR. Letter. Subject: New Property Owner of the former Unity Auto Mat, 102 North Front
Street, Unity, WI. From: Lisa Gutknecht, Remediation & Redevelopment Program. To: Mr. Art Shaffer. May 31, 2012. 3 Pages.
40. WDNR. Letter. Subject: Notice of Non-Compliance, Unity Auto Mart, 102 North Front Street,
Unity, WI. From: Dave Rozeboom, Hydrogeologist, Bureau for Remediation and Redevelopment. To: Mr. Art Schaffer. June 26, 2013. 2 Pages.
41. WDNR. Letter. Subject: Notice of Violation and Enforcement Conference Request for Alleged
Remedial Action-Related Violation at Site of Former Unity Auto Mart. From: Robert L. Sloan, Environmental Enforcement Specialist. To: Mr. Art Schaffer. August 6, 2013. 2 Pages.
42. WDNR. Letter. Subject: Enforcement Conference Summary. From: Robert L. Sloan,
Environmental Enforcement Specialist. To: Mr. Arthur Shaffer. September 4, 2013. 3 Pages.
43. WDNR. Letter with Attachments. Subject: SDWA Compliance Monitoring, New Unity Post Office. From: David R. Carriveau, Water Supply Specialist. To: Mr. William Schinderle. Attachments: Field Inspection Form and Laboratory Data. October 28, 1992. 7 Pages.
44. WDNR. Letter. Subject: Tetrachloroethylene Contamination at Unity Post Office, 110 South Front
Street, Unity, Wisconsin. From: Andrea Billings, Waste Management Specialist, Environmental Repair Program. To: Mr. Larry Puzen, Manager of Field Maintenance and Operations. December 5, 1994. 2 Pages.
45. Environmental Compliance Consultants, Inc. Phase I Environmental Property Assessment,
Schinderle (Post Office) Property located at 110 South Front Street, Unity, Wisconsin. February 17, 1995. 86 Pages.
11
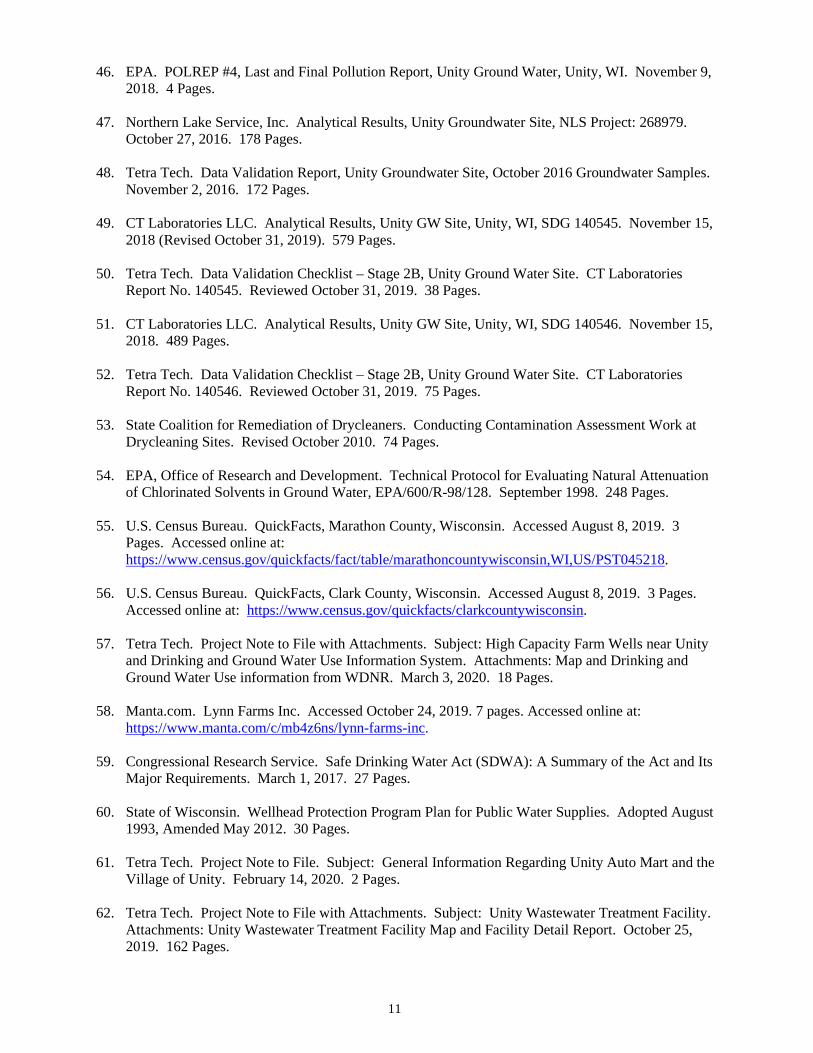
46. EPA. POLREP #4, Last and Final Pollution Report, Unity Ground Water, Unity, WI. November 9, 2018. 4 Pages.
47. Northern Lake Service, Inc. Analytical Results, Unity Groundwater Site, NLS Project: 268979. October 27, 2016. 178 Pages.
48. Tetra Tech. Data Validation Report, Unity Groundwater Site, October 2016 Groundwater Samples.
November 2, 2016. 172 Pages. 49. CT Laboratories LLC. Analytical Results, Unity GW Site, Unity, WI, SDG 140545. November 15,
2018 (Revised October 31, 2019). 579 Pages.
50. Tetra Tech. Data Validation Checklist – Stage 2B, Unity Ground Water Site. CT Laboratories Report No. 140545. Reviewed October 31, 2019. 38 Pages.
51. CT Laboratories LLC. Analytical Results, Unity GW Site, Unity, WI, SDG 140546. November 15,
2018. 489 Pages.
52. Tetra Tech. Data Validation Checklist – Stage 2B, Unity Ground Water Site. CT Laboratories Report No. 140546. Reviewed October 31, 2019. 75 Pages.
53. State Coalition for Remediation of Drycleaners. Conducting Contamination Assessment Work at
Drycleaning Sites. Revised October 2010. 74 Pages.
54. EPA, Office of Research and Development. Technical Protocol for Evaluating Natural Attenuation of Chlorinated Solvents in Ground Water, EPA/600/R-98/128. September 1998. 248 Pages.
55. U.S. Census Bureau. QuickFacts, Marathon County, Wisconsin. Accessed August 8, 2019. 3
Pages. Accessed online at: https://www.census.gov/quickfacts/fact/table/marathoncountywisconsin,WI,US/PST045218.
56. U.S. Census Bureau. QuickFacts, Clark County, Wisconsin. Accessed August 8, 2019. 3 Pages.
Accessed online at: https://www.census.gov/quickfacts/clarkcountywisconsin.
57. Tetra Tech. Project Note to File with Attachments. Subject: High Capacity Farm Wells near Unity and Drinking and Ground Water Use Information System. Attachments: Map and Drinking and Ground Water Use information from WDNR. March 3, 2020. 18 Pages.
58. Manta.com. Lynn Farms Inc. Accessed October 24, 2019. 7 pages. Accessed online at:
https://www.manta.com/c/mb4z6ns/lynn-farms-inc.
59. Congressional Research Service. Safe Drinking Water Act (SDWA): A Summary of the Act and Its Major Requirements. March 1, 2017. 27 Pages.
60. State of Wisconsin. Wellhead Protection Program Plan for Public Water Supplies. Adopted August
1993, Amended May 2012. 30 Pages.
61. Tetra Tech. Project Note to File. Subject: General Information Regarding Unity Auto Mart and the Village of Unity. February 14, 2020. 2 Pages.
62. Tetra Tech. Project Note to File with Attachments. Subject: Unity Wastewater Treatment Facility.
Attachments: Unity Wastewater Treatment Facility Map and Facility Detail Report. October 25, 2019. 162 Pages.
12
63. State of Wisconsin. Correspondence Memorandum. Subject: Unity Workers. From: Mae Willkom, WDNR Site Assessment Team Member. To: Unity Auto Mart File. October 18, 2019. 1 Page.
64. WDNR. Superfund Site Assessment, Site Inspection, Expanded Site Inspection, or Site
Reassessment Sampling Plan, Unity Ground Water (a/k/a Unity Auto Mart). August 2017. 26 Pages.
65. Wisconline. The Geographical Provinces of Wisconsin and The Northern Highland of Wisconsin
subpage. Accessed October 22, 2019. 10 Pages. https://www.wisconline.com/wisconsin/geoprovinces/index.html and https://www.wisconline.com/wisconsin/geoprovinces/northernhighland.html
66. Wisconsin Legislative Reference Bureau. The Wisconsin Blue Book 1964. 820 Pages.
67. USGS. Water Resources of Wisconsin – Central Wisconsin River Basin, Hydrologic Investigations
Atlas HA-367. 1971. 1 Page. Modified by Tetra Tech to show approximate site location.
68. USGS. Water Availability in Central Wisconsin – An Area of Near-Surface Crystalline Rock, Geological Survey Water-Supply Paper 2022. 1974. 43 Pages. Modified by Tetra Tech to show approximate site location.
69. University of Wisconsin – Extension, Geological and Natural History Survey. Precambrian Geology
of Marathon County, Wisconsin, Information Circular Number 45. 1983. 99 Pages.
70. Argonne National Laboratory. Characterization of Crystalline Rocks in the Lake Superior Region, USA: Implications for Nuclear Waste Isolation. Not Dated. 14 Pages.
71. USGS. Ground Water Atlas of the United States, Segment 9 (Iowa, Michigan, Minnesota,
Wisconsin), Hydrologic Investigations Atlas 730-J. 1992. 33 Pages. Modified by Tetra Tech to show approximate site location.
72. USGS. National Water Summary 1984, Hydrologic Events, Selected Water-Quality Trends, and
Ground-Water Resources, Water Supply Paper 2275. 477 Pages. Modified by Tetra Tech to show approximate site location.
73. USGS. Ground-Water Flow and Quality in Wisconsin’s Shallow Aquifer System, Water-Resources
Investigations Report 90-4171. 1995. 52 Pages.
74. Tetra Tech. Project Note to File with Attachments. Subject: Well Logs within 2-Miles of the Unity Auto Mart Site. Attachments: Well Construction Reports. October 29, 2019. 71 Pages.
75. Tetra Tech. Record of Conversation. Subject: Definitions for Limit of Quantitation and Sample
Quantitation Limit. Between Quinn Kelley, Senior Environmental Scientist, Tetra Tech and Kristin Tienor, Client Support Coordinator, Northern Lake Service, Inc. October 29, 2019. 1 Page.
76. WDNR. Colby Municipal Well Locations. Created October 29, 2019. 1 Map.
77. State of Wisconsin. Correspondence Memorandum. Subject: 101 South Madison Street, Unity,
Sample Taps. From: Matt Thompson, WDNR. To: Quinn Kelley, Tetra Tech, and Mae Willkom, WDNR. October 30, 2019. 1 Page.
78. EPA, Emission Standards and Engineering Division. Perchloroethylene Dry Cleaners – Background
Information for Proposed Standards, EPA-450/3-79-029a. August 1980. 169 Pages.
13
79. Agency for Toxic Substances and Disease Registry (ATSDR), Division of Toxicology and Human Health Sciences. Tetrachloroethylene – Tox FAQs. June 2019. 2 Pages.
80. Tetra Tech. Project Note to File with Attachments. Subject: Area of Source No. 1 Calculation.
Attachments: Measurement Calculation and Figures. March 5, 2020. 4 Pages.
81. Tetra Tech. Record of Telephone Conversation. Subject: City of Colby Water Department Information. Between Quinn Kelley, Senior Environmental Scientist, Tetra Tech and Al Raatz, Certified Water Operator, City of Colby Water Department. April 20, 2020. 1 Page.
82. EPA. Email conversation originating between Nuria Muñiz, EPA Region 5, and Jane Lemcke,
WDNR. Subject: Information Regarding the Unity Waste Water Treatment Plant. April 2020. 5 pages.
14 Site Description
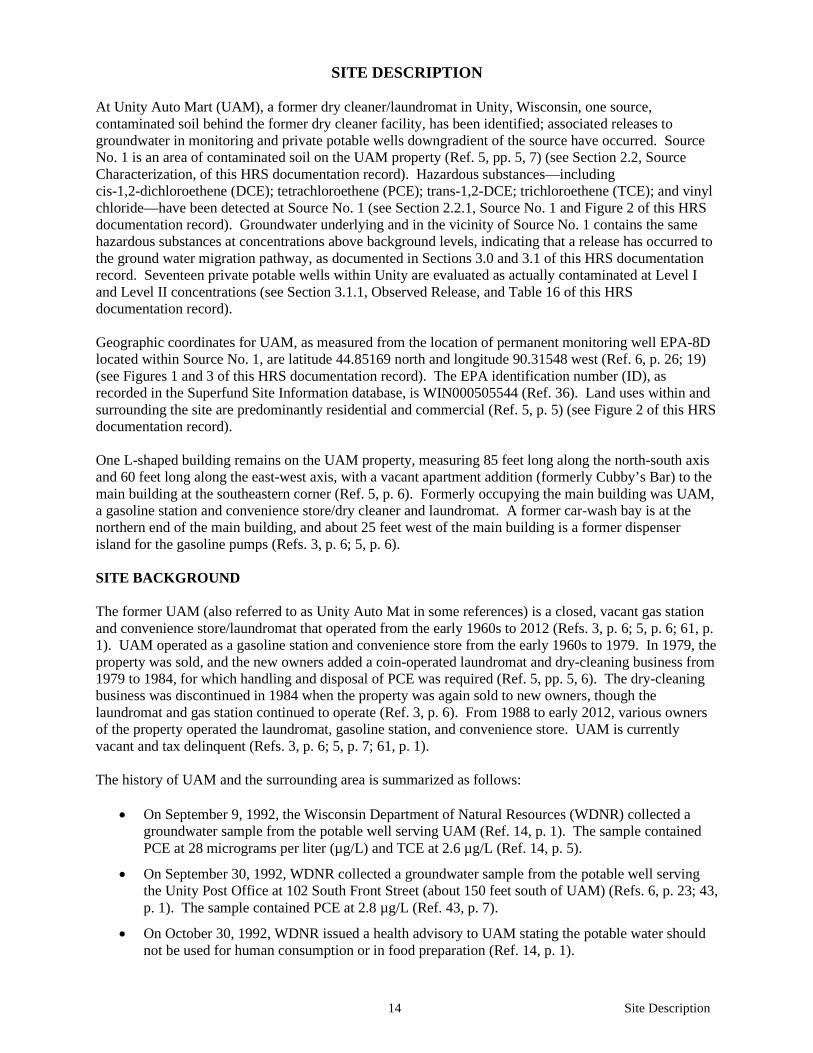
SITE DESCRIPTION At Unity Auto Mart (UAM), a former dry cleaner/laundromat in Unity, Wisconsin, one source, contaminated soil behind the former dry cleaner facility, has been identified; associated releases to groundwater in monitoring and private potable wells downgradient of the source have occurred. Source No. 1 is an area of contaminated soil on the UAM property (Ref. 5, pp. 5, 7) (see Section 2.2, Source Characterization, of this HRS documentation record). Hazardous substances—including cis-1,2-dichloroethene (DCE); tetrachloroethene (PCE); trans-1,2-DCE; trichloroethene (TCE); and vinyl chloride—have been detected at Source No. 1 (see Section 2.2.1, Source No. 1 and Figure 2 of this HRS documentation record). Groundwater underlying and in the vicinity of Source No. 1 contains the same hazardous substances at concentrations above background levels, indicating that a release has occurred to the ground water migration pathway, as documented in Sections 3.0 and 3.1 of this HRS documentation record. Seventeen private potable wells within Unity are evaluated as actually contaminated at Level I and Level II concentrations (see Section 3.1.1, Observed Release, and Table 16 of this HRS documentation record). Geographic coordinates for UAM, as measured from the location of permanent monitoring well EPA-8D located within Source No. 1, are latitude 44.85169 north and longitude 90.31548 west (Ref. 6, p. 26; 19) (see Figures 1 and 3 of this HRS documentation record). The EPA identification number (ID), as recorded in the Superfund Site Information database, is WIN000505544 (Ref. 36). Land uses within and surrounding the site are predominantly residential and commercial (Ref. 5, p. 5) (see Figure 2 of this HRS documentation record). One L-shaped building remains on the UAM property, measuring 85 feet long along the north-south axis and 60 feet long along the east-west axis, with a vacant apartment addition (formerly Cubby’s Bar) to the main building at the southeastern corner (Ref. 5, p. 6). Formerly occupying the main building was UAM, a gasoline station and convenience store/dry cleaner and laundromat. A former car-wash bay is at the northern end of the main building, and about 25 feet west of the main building is a former dispenser island for the gasoline pumps (Refs. 3, p. 6; 5, p. 6). SITE BACKGROUND The former UAM (also referred to as Unity Auto Mat in some references) is a closed, vacant gas station and convenience store/laundromat that operated from the early 1960s to 2012 (Refs. 3, p. 6; 5, p. 6; 61, p. 1). UAM operated as a gasoline station and convenience store from the early 1960s to 1979. In 1979, the property was sold, and the new owners added a coin-operated laundromat and dry-cleaning business from 1979 to 1984, for which handling and disposal of PCE was required (Ref. 5, pp. 5, 6). The dry-cleaning business was discontinued in 1984 when the property was again sold to new owners, though the laundromat and gas station continued to operate (Ref. 3, p. 6). From 1988 to early 2012, various owners of the property operated the laundromat, gasoline station, and convenience store. UAM is currently vacant and tax delinquent (Refs. 3, p. 6; 5, p. 7; 61, p. 1). The history of UAM and the surrounding area is summarized as follows:
• On September 9, 1992, the Wisconsin Department of Natural Resources (WDNR) collected a groundwater sample from the potable well serving UAM (Ref. 14, p. 1). The sample contained PCE at 28 micrograms per liter (µg/L) and TCE at 2.6 µg/L (Ref. 14, p. 5).
• On September 30, 1992, WDNR collected a groundwater sample from the potable well serving the Unity Post Office at 102 South Front Street (about 150 feet south of UAM) (Refs. 6, p. 23; 43, p. 1). The sample contained PCE at 2.8 µg/L (Ref. 43, p. 7).
• On October 30, 1992, WDNR issued a health advisory to UAM stating the potable water should not be used for human consumption or in food preparation (Ref. 14, p. 1).
15 Site Description
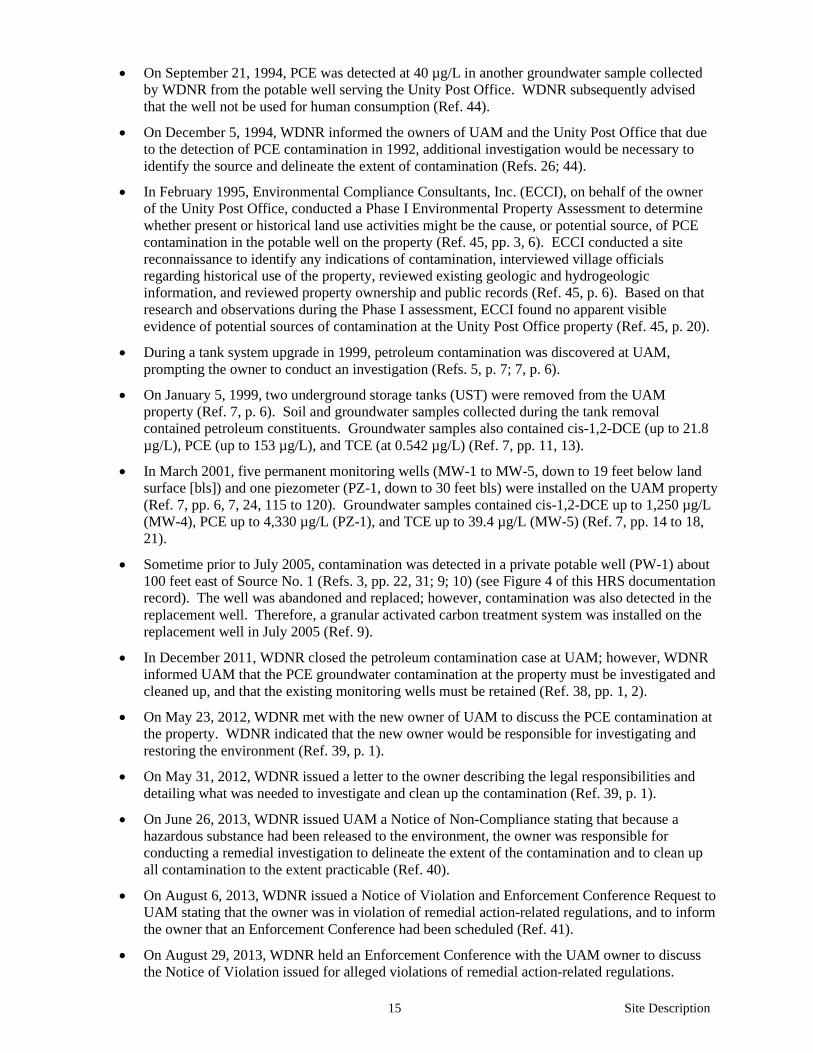
• On September 21, 1994, PCE was detected at 40 µg/L in another groundwater sample collected by WDNR from the potable well serving the Unity Post Office. WDNR subsequently advised that the well not be used for human consumption (Ref. 44).
• On December 5, 1994, WDNR informed the owners of UAM and the Unity Post Office that due to the detection of PCE contamination in 1992, additional investigation would be necessary to identify the source and delineate the extent of contamination (Refs. 26; 44).
• In February 1995, Environmental Compliance Consultants, Inc. (ECCI), on behalf of the owner of the Unity Post Office, conducted a Phase I Environmental Property Assessment to determine whether present or historical land use activities might be the cause, or potential source, of PCE contamination in the potable well on the property (Ref. 45, pp. 3, 6). ECCI conducted a site reconnaissance to identify any indications of contamination, interviewed village officials regarding historical use of the property, reviewed existing geologic and hydrogeologic information, and reviewed property ownership and public records (Ref. 45, p. 6). Based on that research and observations during the Phase I assessment, ECCI found no apparent visible evidence of potential sources of contamination at the Unity Post Office property (Ref. 45, p. 20).
• During a tank system upgrade in 1999, petroleum contamination was discovered at UAM, prompting the owner to conduct an investigation (Refs. 5, p. 7; 7, p. 6).
• On January 5, 1999, two underground storage tanks (UST) were removed from the UAM property (Ref. 7, p. 6). Soil and groundwater samples collected during the tank removal contained petroleum constituents. Groundwater samples also contained cis-1,2-DCE (up to 21.8 µg/L), PCE (up to 153 µg/L), and TCE (at 0.542 µg/L) (Ref. 7, pp. 11, 13).
• In March 2001, five permanent monitoring wells (MW-1 to MW-5, down to 19 feet below land surface [bls]) and one piezometer (PZ-1, down to 30 feet bls) were installed on the UAM property (Ref. 7, pp. 6, 7, 24, 115 to 120). Groundwater samples contained cis-1,2-DCE up to 1,250 µg/L (MW-4), PCE up to 4,330 µg/L (PZ-1), and TCE up to 39.4 µg/L (MW-5) (Ref. 7, pp. 14 to 18, 21).
• Sometime prior to July 2005, contamination was detected in a private potable well (PW-1) about 100 feet east of Source No. 1 (Refs. 3, pp. 22, 31; 9; 10) (see Figure 4 of this HRS documentation record). The well was abandoned and replaced; however, contamination was also detected in the replacement well. Therefore, a granular activated carbon treatment system was installed on the replacement well in July 2005 (Ref. 9).
• In December 2011, WDNR closed the petroleum contamination case at UAM; however, WDNR informed UAM that the PCE groundwater contamination at the property must be investigated and cleaned up, and that the existing monitoring wells must be retained (Ref. 38, pp. 1, 2).
• On May 23, 2012, WDNR met with the new owner of UAM to discuss the PCE contamination at the property. WDNR indicated that the new owner would be responsible for investigating and restoring the environment (Ref. 39, p. 1).
• On May 31, 2012, WDNR issued a letter to the owner describing the legal responsibilities and detailing what was needed to investigate and clean up the contamination (Ref. 39, p. 1).
• On June 26, 2013, WDNR issued UAM a Notice of Non-Compliance stating that because a hazardous substance had been released to the environment, the owner was responsible for conducting a remedial investigation to delineate the extent of the contamination and to clean up all contamination to the extent practicable (Ref. 40).
• On August 6, 2013, WDNR issued a Notice of Violation and Enforcement Conference Request to UAM stating that the owner was in violation of remedial action-related regulations, and to inform the owner that an Enforcement Conference had been scheduled (Ref. 41).
• On August 29, 2013, WDNR held an Enforcement Conference with the UAM owner to discuss the Notice of Violation issued for alleged violations of remedial action-related regulations.
16 Site Description
WDNR explained that the owner is responsible for taking actions necessary to restore the environment to the extent practicable and for minimizing the harmful effects from the PCE discharge (Ref. 42, p. 1).
• In August 2014, chlorinated VOCs (cis-1,2-DCE; PCE; trans-1,2-DCE; and TCE) were detected in multiple private potable wells in Unity (Refs. 9; 37, p. ix). As a result, in October 2014, granular activated carbon treatment systems were installed at eight private potable wells within 0.15-mile of Source No. 1 that had chlorinated VOCs at concentrations exceeding Wisconsin preventive action limits (Refs. 3, pp. 31, 32; 9; 32, p. 3; 78).
• In November 2014, Tetra Tech, Inc. (Tetra Tech), on behalf of EPA, conducted a site assessment at UAM to determine the environmental impacts and threats to human health caused by former operations (Ref. 8, pp. 4, 5). Tetra Tech collected soil samples at the property, as well as groundwater samples from temporary and existing monitoring wells and piezometers on and adjacent to the UAM property (Ref. 8, p. 5). A soil sample collected within the eastern portion of the UAM property (SS-1) contained cis-1,2-DCE at 1,200 micrograms per kilogram (µg/kg); PCE at 6,700 µg/kg; and TCE at 1,100 µg/kg (Ref. 8, pp. 8, 34, 35). Groundwater samples collected from existing monitoring wells and piezometers contained cis-1,2-DCE up to 810 µg/L; PCE up to 4,000 µg/L; TCE up to 230 µg/L; and vinyl chloride up to 4.1 µg/L (Ref. 8, pp. 15 to 24). Temporary monitoring wells (at depths less than 19 feet bls) contained cis-1,2-DCE up to 5,600 µg/L; PCE up to 530 µg/L; TCE up to 1,900 µg/L; and vinyl chloride up to 33J µg/L (Ref. 8, pp. 26, 189 to 199).
PREVIOUS INVESTIGATIONS 2015 In November 2015, EPA initiated a time-critical removal action in Unity, which included servicing the carbon treatment systems by replacing the carbon and sediment filters and resetting the water softener alarms, as well as conducting sampling of residential wells (Ref. 46, p. 1). In conjunction with this action, Tetra Tech, on behalf of EPA, installed monitoring wells on the UAM property and collected soil, groundwater, and potable well samples from November 2 to December 10, 2015 (Ref. 6, pp. 4, 12). Soil samples were collected at three locations at three depth intervals: at EPA-6S within 24 to 26 feet bls, at EPA-7S within 20 to 22 feet bls, and at EPA-8S within 16 to 18 feet bls (Ref. 6, pp. 14, 18, 26). Soil samples contained cis-1,2-DCE up to 880 µg/kg; PCE up to 7,230 µg/kg; and TCE up to 330 µg/kg (Ref. 6, p. 30). The highest concentrations of cis-1,2-DCE, PCE, and TCE were detected in soil sample EPA-8S collected within 16 to 18 feet bls (Ref. 6, pp. 18, 26, 30). Tetra Tech installed 12 permanent monitoring wells (as deep as 80 feet bls) on the UAM property and within the surrounding area. The permanent monitoring wells were developed then sampled (Ref. 6, pp. 14, 16, 26, 48 to 61). Permanent monitoring well samples contained cis-1,2-DCE up to 1,200J µg/L; PCE up to 6,000J µg/L; trans-1,2-DCE up to 44J µg/L; and TCE up to 530J µg/L (Ref. 6, pp. 38, 39). “J” denotes an estimated value. In addition, 38 potable wells were sampled in Unity (Ref. 6, pp. 25, 31 to 37). The samples contained cis-1,2-DCE up to 67 µg/L; PCE up to 230 µg/L; trans-1,2-DCE up to 1.2 µg/L; and TCE up to 18 µg/L (Ref. 6, pp. 31 to 37). 2016 In October 2016, annual sampling activities occurred at UAM and the surrounding area (Ref. 32, p. 2). Tetra Tech on behalf of EPA collected groundwater samples from 25 monitoring wells at the UAM property and in Unity. Monitoring well samples contained concentrations of cis-1,2-DCE up to 2,320 µg/L; of PCE up to 7,360 µg/L; of trans-1,2-DCE up to 2.8 µg/L; of TCE up to 11.4 µg/L; and of vinyl chloride up to 0.86 µg/L (Ref. 32, pp. 2, 7, 14). EPA and WDNR collected groundwater samples from 39 private potable wells in Unity. Potable well samples contained concentrations of cis-1,2-DCE up to 99.3 µg/L; of PCE up to 289 µg/L; of trans-1,2-DCE up to 2.19 µg/L; and of TCE up to 17.3 µg/L (Ref. 32, pp. 2, 6, 14).
17 Site Description
2017 In August 2017, WDNR conducted an Integrated Site Inspection (ISI) on behalf of EPA to acquire information at the UAM property sufficient to assess: (1) the threat posed to human health and the environment, and (2) need for additional action (Ref. 3, pp. 5, 8; 64, pp. 1, 3). Groundwater samples collected from monitoring wells contained cis-1,2-DCE up to 950 µg/L; PCE up to 3,400 µg/L; trans-1,2-DCE up to 26J µg/L; TCE up to 290 µg/L; and vinyl chloride at 3.1 µg/L (Ref. 3, p. 38). Private potable well samples contained cis-1,2-DCE up to 120 µg/L; PCE up to 490 µg/L; trans-1,2-DCE up to 0.72 µg/L; and TCE up to 31 µg/L (Ref. 3, p. 38). In conjunction with the WDNR ISI, Tetra Tech conducted annual sampling at the UAM property and the surrounding area in August 2017 (Ref. 32, p. 2). Tetra Tech collected groundwater samples from 26 monitoring wells at UAM property and in Unity. Monitoring well samples contained cis-1,2-DCE up to 590 µg/L; PCE up to 2,800 µg/L; trans-1,2-DCE up to 16 µg/L; and TCE up to 190 µg/L (Ref. 32, pp. 2, 9, 15). EPA and WDNR collected groundwater samples from 45 private potable wells in Unity. Potable well samples contained cis-1,2-DCE up to 130 µg/L; PCE up to 470 µg/L; and TCE up to 5.8 µg/L (Ref. 32, pp. 2, 8, 16). 2018 In August 2018, WDNR conducted an expanded site inspection (ESI) at the UAM property to assess: (1) the threat posed to human health and environment, and (2) need for additional action. WDNR collected subsurface soil samples (between 4 and 17 feet bls) within the eastern portion of the UAM property (Ref. 4, pp. 8, 23). The samples contained cis-1,2-DCE (up to 1,500 µg/kg, at 10 to 12 feet bls); PCE (up to 13,000 µg/kg, at 10 to 12 feet bls); trans-1,2-DCE (up to 14 µg/kg, at 10 to 12 feet bls); TCE (up to 570 µg/kg, at 10 to 12 feet bls); and vinyl chloride (at 20 µg/kg, at 10 to 12 feet bls) (Refs. 4, p. 8; 17, pp. 13, 14, 22, 24). In October 2018, Tetra Tech performed annual sampling activities, collecting groundwater samples from 18 monitoring wells at the UAM property and in Unity (Ref. 32, p. 2). Monitoring well samples contained cis-1,2-DCE up to 780 µg/L; PCE up to 5,500 µg/L; trans-1,2-DCE up to 18 µg/L; and TCE up to 270 µg/L (Ref. 32, pp. 2, 11, 17). EPA and WDNR collected groundwater samples from 32 private potable wells in Unity. Potable well samples contained cis-1,2-DCE up to 66 µg/L; PCE up to 220 µg/L; and TCE up to 21 µg/L (Ref. 32, pp. 2, 10, 18, 19).
Source No. 1
18 Source Characterization
2.2 SOURCE CHARACTERIZATION 2.2.1 SOURCE IDENTIFICATION Number of Source: 1 Name of Source: Contaminated soil Source Type: Contaminated soil Description and Location of Source (with reference to a map of site): Source No. 1 is an area of contaminated soil in the eastern portion of the UAM property where the back door of the dry-cleaning business is believed to have been located (Refs. 4, pp. 9, 23; 20, p. 4) (see Figure 2 of this HRS documentation record). A laundromat, including a coin-operated dry-cleaning machine, was located on the property from 1979 until about 1984 for which handling and disposal of PCE was required (Ref. 5, p. 5). The benefits of using PCE for dry cleaning are its nonflammability, high vapor density, and its aggressive solvent properties (Ref. 78, p. 3-6). Breakdown products of PCE include cis-1,2-DCE; trans-1,2-DCE; TCE; and vinyl chloride (Ref. 54, p. 24). Typically, coin-operated PCE dry cleaners are part of a “laundromat” facility that provides low-cost, self-service dry cleaning without pressing, spotting, or other associated services (Ref. 78, p. 3-1). In the late 1970s to early 1980s, when UAM operated a laundromat, about 97.5 percent of the coin-operated machines used PCE (Refs. 5, p. 5; 78, p. 3-1). Dry cleaning is essentially a waterless process wherein clothes are cleaned with an organic solvent rather than with soap and water (Ref. 78, p. 3-2). Prior to regulation of dry-cleaning facilities, discarding waste dry cleaning solvents outside the storage door of the facility was a common practice (Ref. 53, pp. 12, 28). During UAM’s operation as a laundromat, all coin-operated dry cleaners used dry-to-dry machines, where both washing and drying occurred in a single unit (Refs. 5, p. 5; 78, p. 3-5). Soil samples collected to delineate Source No. 1 in August 2018 contained cis-1,2-DCE (up to 1,500 µg/kg, at 10 to 12 feet bls); PCE (up to 13,000 µg/kg, at 10 to 12 feet bls); trans-1,2-DCE (up to 14 µg/kg, at 10 to 12 feet bls); TCE (up to 570 µg/kg, at 10 to 12 feet bls); and vinyl chloride (at 20 µg/kg, at 10 to 12 feet bls) (Refs. 4, p. 8; 17, pp. 13, 14, 22, 24). These samples were collected in the eastern portion of the UAM property at the suspected location of the back door of the dry-cleaning business (Refs. 4, pp. 8, 23; 20, p. 4) (see Figure 2 of this HRS documentation record). The August 2018 subsurface soil samples contained concentrations of cis-1,2-DCE; PCE; trans-1,2-DCE; TCE; and vinyl chloride above background levels (Ref. 4, pp. 8, 28). Table 2 of this HRS documentation record lists data used for evaluating Source No. 1.
Source No: 1
19 Source Characterization
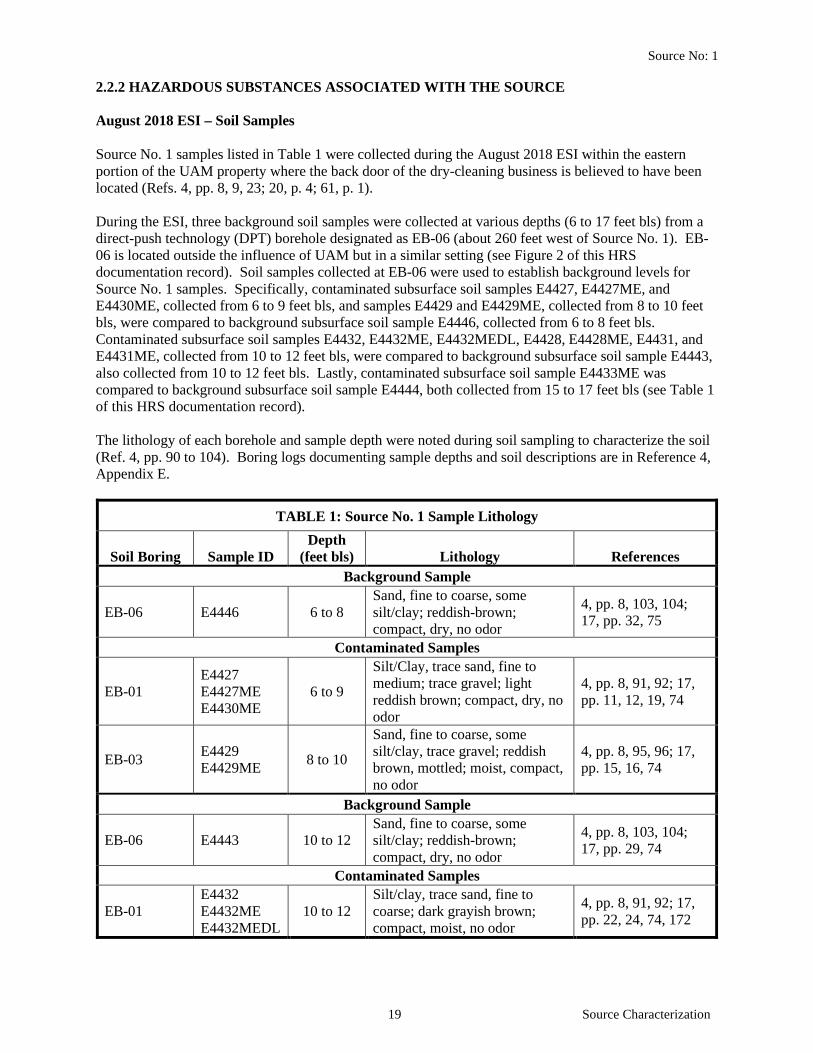
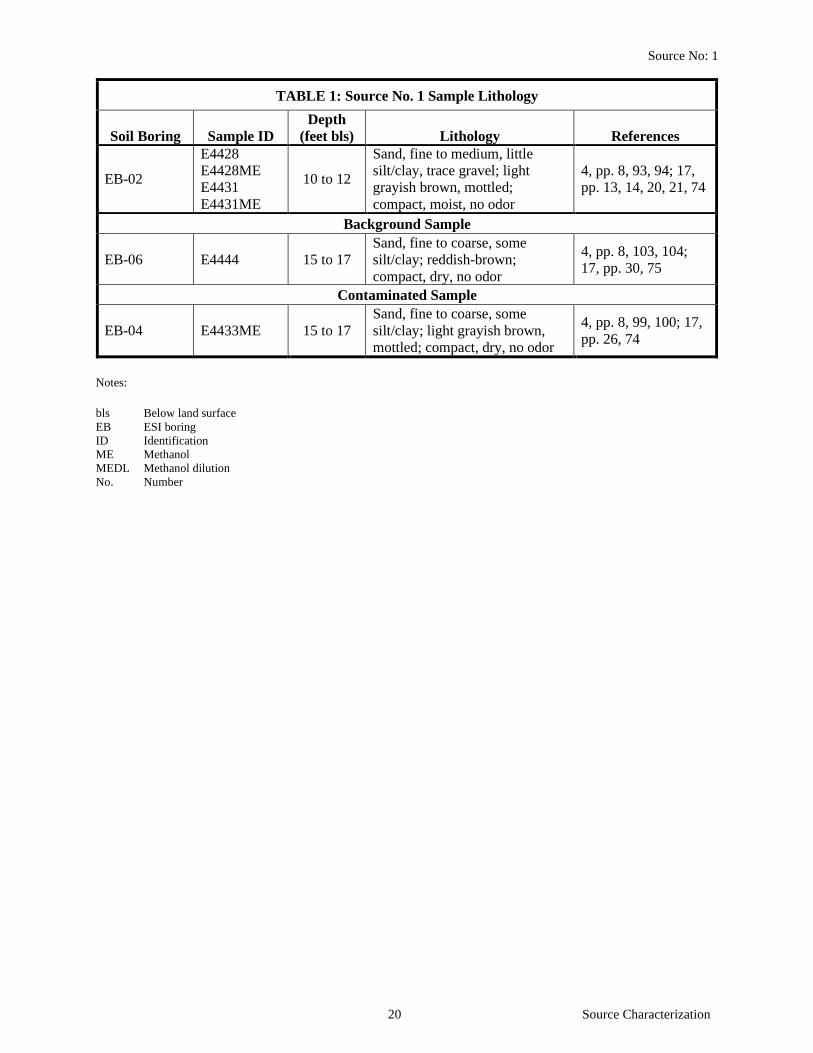
2.2.2 HAZARDOUS SUBSTANCES ASSOCIATED WITH THE SOURCE August 2018 ESI – Soil Samples Source No. 1 samples listed in Table 1 were collected during the August 2018 ESI within the eastern portion of the UAM property where the back door of the dry-cleaning business is believed to have been located (Refs. 4, pp. 8, 9, 23; 20, p. 4; 61, p. 1). During the ESI, three background soil samples were collected at various depths (6 to 17 feet bls) from a direct-push technology (DPT) borehole designated as EB-06 (about 260 feet west of Source No. 1). EB-06 is located outside the influence of UAM but in a similar setting (see Figure 2 of this HRS documentation record). Soil samples collected at EB-06 were used to establish background levels for Source No. 1 samples. Specifically, contaminated subsurface soil samples E4427, E4427ME, and E4430ME, collected from 6 to 9 feet bls, and samples E4429 and E4429ME, collected from 8 to 10 feet bls, were compared to background subsurface soil sample E4446, collected from 6 to 8 feet bls. Contaminated subsurface soil samples E4432, E4432ME, E4432MEDL, E4428, E4428ME, E4431, and E4431ME, collected from 10 to 12 feet bls, were compared to background subsurface soil sample E4443, also collected from 10 to 12 feet bls. Lastly, contaminated subsurface soil sample E4433ME was compared to background subsurface soil sample E4444, both collected from 15 to 17 feet bls (see Table 1 of this HRS documentation record). The lithology of each borehole and sample depth were noted during soil sampling to characterize the soil (Ref. 4, pp. 90 to 104). Boring logs documenting sample depths and soil descriptions are in Reference 4, Appendix E.
TABLE 1: Source No. 1 Sample Lithology
Soil Boring Sample ID Depth
(feet bls) Lithology References Background Sample
EB-06 E4446 6 to 8 Sand, fine to coarse, some silt/clay; reddish-brown; compact, dry, no odor
4, pp. 8, 103, 104; 17, pp. 32, 75
Contaminated Samples
EB-01 E4427 E4427ME E4430ME
6 to 9
Silt/Clay, trace sand, fine to medium; trace gravel; light reddish brown; compact, dry, no odor
4, pp. 8, 91, 92; 17, pp. 11, 12, 19, 74
EB-03 E4429 E4429ME 8 to 10
Sand, fine to coarse, some silt/clay, trace gravel; reddish brown, mottled; moist, compact, no odor
4, pp. 8, 95, 96; 17, pp. 15, 16, 74
Background Sample
EB-06 E4443 10 to 12 Sand, fine to coarse, some silt/clay; reddish-brown; compact, dry, no odor
4, pp. 8, 103, 104; 17, pp. 29, 74
Contaminated Samples
EB-01 E4432 E4432ME E4432MEDL
10 to 12 Silt/clay, trace sand, fine to coarse; dark grayish brown; compact, moist, no odor
4, pp. 8, 91, 92; 17, pp. 22, 24, 74, 172
Source No: 1
20 Source Characterization
TABLE 1: Source No. 1 Sample Lithology
Soil Boring Sample ID Depth
(feet bls) Lithology References
EB-02
E4428 E4428ME E4431 E4431ME
10 to 12
Sand, fine to medium, little silt/clay, trace gravel; light grayish brown, mottled; compact, moist, no odor
4, pp. 8, 93, 94; 17, pp. 13, 14, 20, 21, 74
Background Sample
EB-06 E4444 15 to 17 Sand, fine to coarse, some silt/clay; reddish-brown; compact, dry, no odor
4, pp. 8, 103, 104; 17, pp. 30, 75
Contaminated Sample
EB-04 E4433ME 15 to 17 Sand, fine to coarse, some silt/clay; light grayish brown, mottled; compact, dry, no odor
4, pp. 8, 99, 100; 17, pp. 26, 74
Notes: bls Below land surface EB ESI boring ID Identification ME Methanol MEDL Methanol dilution No. Number
Source No: 1
21 Source Characterization
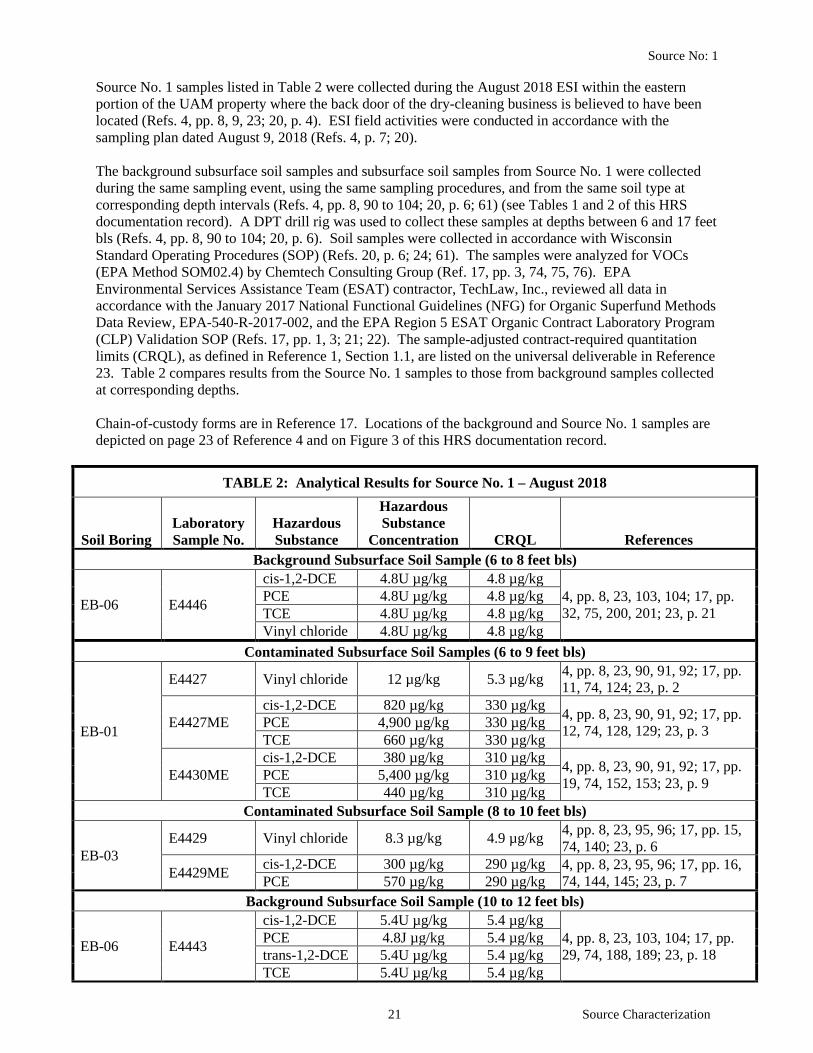
Source No. 1 samples listed in Table 2 were collected during the August 2018 ESI within the eastern portion of the UAM property where the back door of the dry-cleaning business is believed to have been located (Refs. 4, pp. 8, 9, 23; 20, p. 4). ESI field activities were conducted in accordance with the sampling plan dated August 9, 2018 (Refs. 4, p. 7; 20). The background subsurface soil samples and subsurface soil samples from Source No. 1 were collected during the same sampling event, using the same sampling procedures, and from the same soil type at corresponding depth intervals (Refs. 4, pp. 8, 90 to 104; 20, p. 6; 61) (see Tables 1 and 2 of this HRS documentation record). A DPT drill rig was used to collect these samples at depths between 6 and 17 feet bls (Refs. 4, pp. 8, 90 to 104; 20, p. 6). Soil samples were collected in accordance with Wisconsin Standard Operating Procedures (SOP) (Refs. 20, p. 6; 24; 61). The samples were analyzed for VOCs (EPA Method SOM02.4) by Chemtech Consulting Group (Ref. 17, pp. 3, 74, 75, 76). EPA Environmental Services Assistance Team (ESAT) contractor, TechLaw, Inc., reviewed all data in accordance with the January 2017 National Functional Guidelines (NFG) for Organic Superfund Methods Data Review, EPA-540-R-2017-002, and the EPA Region 5 ESAT Organic Contract Laboratory Program (CLP) Validation SOP (Refs. 17, pp. 1, 3; 21; 22). The sample-adjusted contract-required quantitation limits (CRQL), as defined in Reference 1, Section 1.1, are listed on the universal deliverable in Reference 23. Table 2 compares results from the Source No. 1 samples to those from background samples collected at corresponding depths. Chain-of-custody forms are in Reference 17. Locations of the background and Source No. 1 samples are depicted on page 23 of Reference 4 and on Figure 3 of this HRS documentation record.
TABLE 2: Analytical Results for Source No. 1 – August 2018
Soil Boring Laboratory Sample No.
Hazardous Substance
Hazardous Substance
Concentration CRQL References Background Subsurface Soil Sample (6 to 8 feet bls)
EB-06 E4446
cis-1,2-DCE 4.8U µg/kg 4.8 µg/kg 4, pp. 8, 23, 103, 104; 17, pp. 32, 75, 200, 201; 23, p. 21
PCE 4.8U µg/kg 4.8 µg/kg TCE 4.8U µg/kg 4.8 µg/kg Vinyl chloride 4.8U µg/kg 4.8 µg/kg
Contaminated Subsurface Soil Samples (6 to 9 feet bls)
EB-01
E4427 Vinyl chloride 12 µg/kg 5.3 µg/kg 4, pp. 8, 23, 90, 91, 92; 17, pp. 11, 74, 124; 23, p. 2
E4427ME cis-1,2-DCE 820 µg/kg 330 µg/kg 4, pp. 8, 23, 90, 91, 92; 17, pp.
12, 74, 128, 129; 23, p. 3 PCE 4,900 µg/kg 330 µg/kg TCE 660 µg/kg 330 µg/kg
E4430ME cis-1,2-DCE 380 µg/kg 310 µg/kg 4, pp. 8, 23, 90, 91, 92; 17, pp.
19, 74, 152, 153; 23, p. 9 PCE 5,400 µg/kg 310 µg/kg TCE 440 µg/kg 310 µg/kg
Contaminated Subsurface Soil Sample (8 to 10 feet bls)
EB-03 E4429 Vinyl chloride 8.3 µg/kg 4.9 µg/kg 4, pp. 8, 23, 95, 96; 17, pp. 15,
74, 140; 23, p. 6
E4429ME cis-1,2-DCE 300 µg/kg 290 µg/kg 4, pp. 8, 23, 95, 96; 17, pp. 16, 74, 144, 145; 23, p. 7 PCE 570 µg/kg 290 µg/kg
Background Subsurface Soil Sample (10 to 12 feet bls)
EB-06 E4443
cis-1,2-DCE 5.4U µg/kg 5.4 µg/kg 4, pp. 8, 23, 103, 104; 17, pp. 29, 74, 188, 189; 23, p. 18
PCE 4.8J µg/kg 5.4 µg/kg trans-1,2-DCE 5.4U µg/kg 5.4 µg/kg TCE 5.4U µg/kg 5.4 µg/kg

Source No: 1
22 Source Characterization
TABLE 2: Analytical Results for Source No. 1 – August 2018
Soil Boring Laboratory Sample No.
Hazardous Substance
Hazardous Substance
Concentration CRQL References Vinyl chloride 5.4U µg/kg 5.4 µg/kg
Contaminated Subsurface Soil Samples (10 to 12 feet bls)
EB-01
E4432 trans-1,2-DCE 13 µg/kg 5.9 µg/kg 4, pp. 8, 23, 90, 91; 17, pp. 22, 74, 164; 23, p. 12 Vinyl chloride 20 µg/kg 5.9 µg/kg
E4432ME cis-1,2-DCE 840 µg/kg 290 µg/kg 4, pp. 8, 23, 90, 91; 17, pp. 7, 24, 74, 168; 23, p. 13 TCE 550 µg/kg 290 µg/kg
E4432MEDL PCE 13,000 µg/kg 2,900 µg/kg 4, pp. 8, 23, 90, 91; 17, pp. 7, 24, 74, 172; 23, p. 13
EB-02
E4428 trans-1,2-DCE 14 µg/kg 4.6 µg/kg 4, pp. 8, 23, 93, 94; 17, pp. 13, 74, 132; 23, p. 4
E4428ME cis-1,2-DCE 1,500 µg/kg 270 µg/kg 4, pp. 8, 23, 93, 94; 17, pp. 14,
74, 136, 137; 23, p. 5 PCE 1,900 µg/kg 270 µg/kg TCE 570 µg/kg 270 µg/kg
E4431 trans-1,2-DCE 23 µg/kg 4.3 µg/kg 4, pp. 8, 23, 93, 94; 17, pp. 20, 74, 156; 23, p. 10
E4431ME cis-1,2-DCE 310 µg/kg 270 µg/kg 4, pp. 8, 23, 93, 94; 17, pp. 21, 74, 160, 161; 23, p. 11 PCE 680 µg/kg 270 µg/kg
Background Subsurface Soil Sample (15 to 17 feet bls)
EB-06 E4444 cis-1,2-DCE 4.8U µg/kg 4.8 µg/kg 4, pp. 8, 23, 103, 104; 17, pp.
30, 75, 192, 193; 23, p. 19 PCE 4.8U µg/kg 4.8 µg/kg TCE 4.8U µg/kg 4.8 µg/kg
Contaminated Subsurface Soil Samples (15 to 17 feet bls)
EB-04 E4433ME cis-1,2-DCE 550 µg/kg 260 µg/kg 4, pp. 8, 23, 99, 100; 17, pp. 26,
74, 180, 181; 23, p. 15 PCE 2,400 µg/kg 260 µg/kg TCE 260 µg/kg 260 µg/kg
Notes: bls Below land surface CRQL Contract-required quantitation limit DCE Dichloroethene EB ESI boring ID Identification J Analyte result greater than or equal to the detection limit (MDL) and below the CRQL (Ref. 17, pp. 7, 8). A bias is not
associated with this sample concentration; therefore, no adjustment is necessary per the EPA fact sheet Using Qualified Data to Document and Observed Release and Observed Contamination (November 1996) (Ref. 28, p. 8).
ME Methanol MEDL Methanol dilution µg/kg Micrograms per kilogram No. Number PCE Tetrachloroethene TCE Trichloroethene U The analyte was analyzed for, but was not detected above the reported sample quantitation limit (Ref. 17, p. 10).
23 Source Characterization
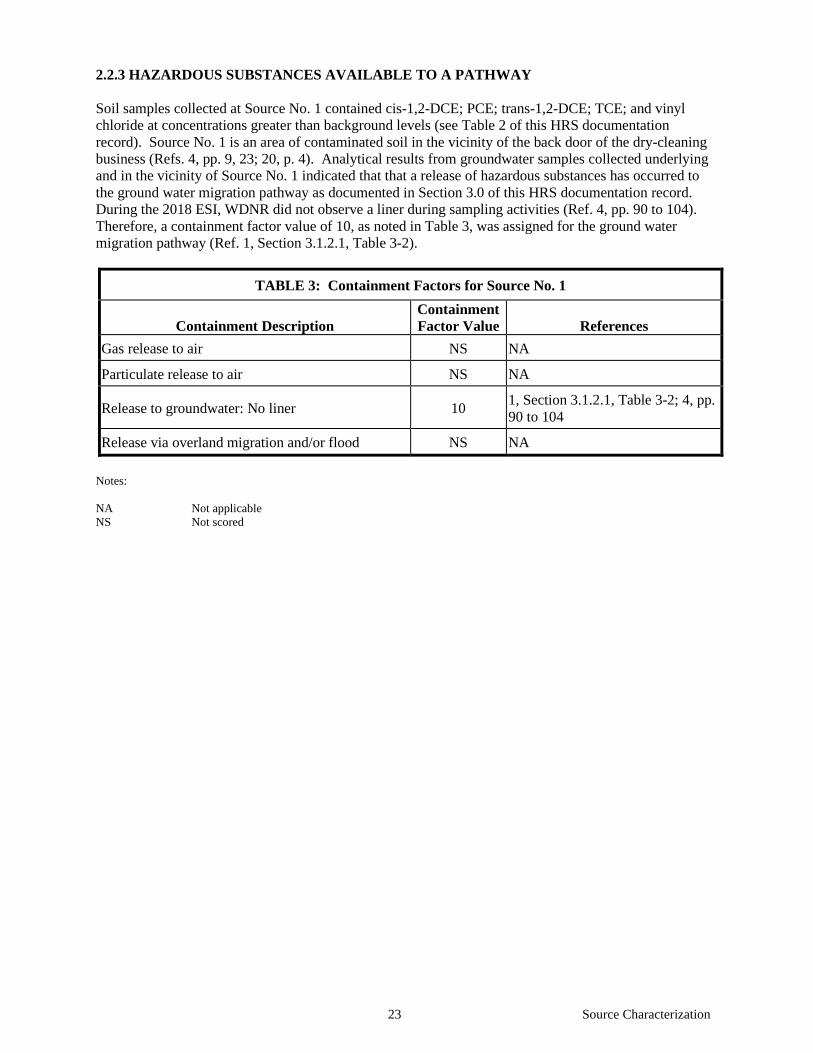
2.2.3 HAZARDOUS SUBSTANCES AVAILABLE TO A PATHWAY Soil samples collected at Source No. 1 contained cis-1,2-DCE; PCE; trans-1,2-DCE; TCE; and vinyl chloride at concentrations greater than background levels (see Table 2 of this HRS documentation record). Source No. 1 is an area of contaminated soil in the vicinity of the back door of the dry-cleaning business (Refs. 4, pp. 9, 23; 20, p. 4). Analytical results from groundwater samples collected underlying and in the vicinity of Source No. 1 indicated that that a release of hazardous substances has occurred to the ground water migration pathway as documented in Section 3.0 of this HRS documentation record. During the 2018 ESI, WDNR did not observe a liner during sampling activities (Ref. 4, pp. 90 to 104). Therefore, a containment factor value of 10, as noted in Table 3, was assigned for the ground water migration pathway (Ref. 1, Section 3.1.2.1, Table 3-2).
TABLE 3: Containment Factors for Source No. 1
Containment Description Containment Factor Value References
Gas release to air NS NA
Particulate release to air NS NA
Release to groundwater: No liner 10 1, Section 3.1.2.1, Table 3-2; 4, pp. 90 to 104
Release via overland migration and/or flood NS NA Notes: NA Not applicable NS Not scored
24 Source Characterization
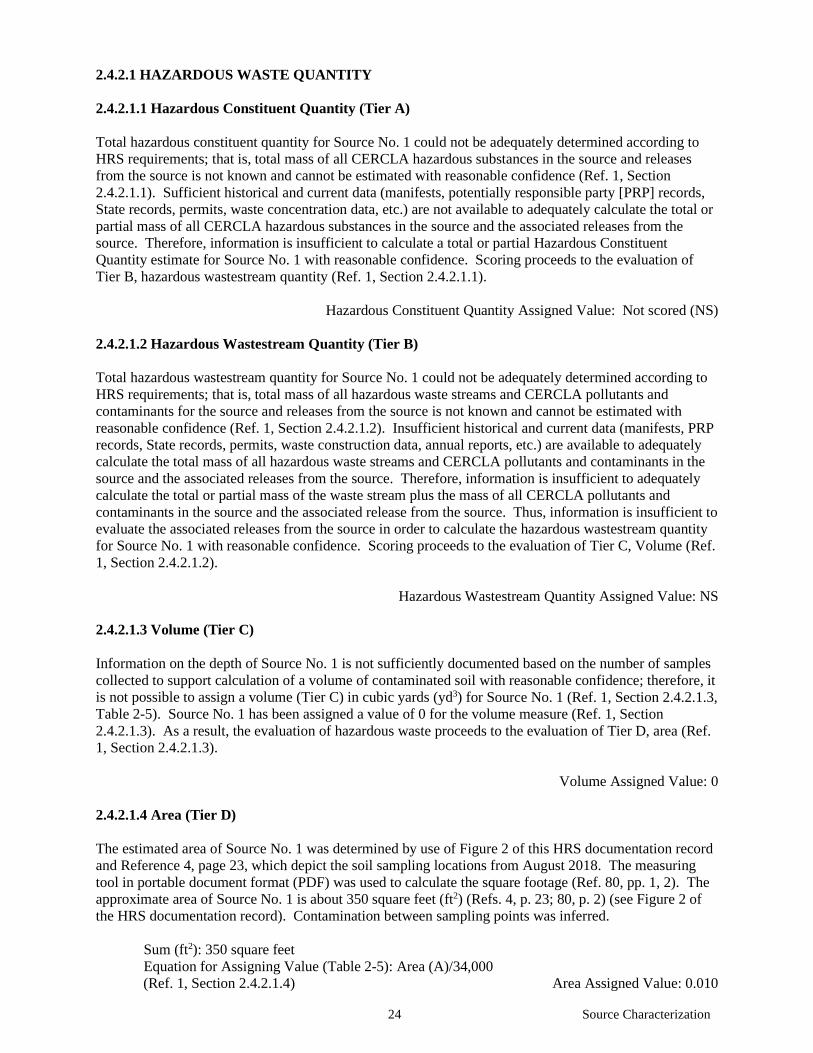
2.4.2.1 HAZARDOUS WASTE QUANTITY 2.4.2.1.1 Hazardous Constituent Quantity (Tier A) Total hazardous constituent quantity for Source No. 1 could not be adequately determined according to HRS requirements; that is, total mass of all CERCLA hazardous substances in the source and releases from the source is not known and cannot be estimated with reasonable confidence (Ref. 1, Section 2.4.2.1.1). Sufficient historical and current data (manifests, potentially responsible party [PRP] records, State records, permits, waste concentration data, etc.) are not available to adequately calculate the total or partial mass of all CERCLA hazardous substances in the source and the associated releases from the source. Therefore, information is insufficient to calculate a total or partial Hazardous Constituent Quantity estimate for Source No. 1 with reasonable confidence. Scoring proceeds to the evaluation of Tier B, hazardous wastestream quantity (Ref. 1, Section 2.4.2.1.1).
Hazardous Constituent Quantity Assigned Value: Not scored (NS) 2.4.2.1.2 Hazardous Wastestream Quantity (Tier B) Total hazardous wastestream quantity for Source No. 1 could not be adequately determined according to HRS requirements; that is, total mass of all hazardous waste streams and CERCLA pollutants and contaminants for the source and releases from the source is not known and cannot be estimated with reasonable confidence (Ref. 1, Section 2.4.2.1.2). Insufficient historical and current data (manifests, PRP records, State records, permits, waste construction data, annual reports, etc.) are available to adequately calculate the total mass of all hazardous waste streams and CERCLA pollutants and contaminants in the source and the associated releases from the source. Therefore, information is insufficient to adequately calculate the total or partial mass of the waste stream plus the mass of all CERCLA pollutants and contaminants in the source and the associated release from the source. Thus, information is insufficient to evaluate the associated releases from the source in order to calculate the hazardous wastestream quantity for Source No. 1 with reasonable confidence. Scoring proceeds to the evaluation of Tier C, Volume (Ref. 1, Section 2.4.2.1.2).
Hazardous Wastestream Quantity Assigned Value: NS 2.4.2.1.3 Volume (Tier C) Information on the depth of Source No. 1 is not sufficiently documented based on the number of samples collected to support calculation of a volume of contaminated soil with reasonable confidence; therefore, it is not possible to assign a volume (Tier C) in cubic yards (yd3) for Source No. 1 (Ref. 1, Section 2.4.2.1.3, Table 2-5). Source No. 1 has been assigned a value of 0 for the volume measure (Ref. 1, Section 2.4.2.1.3). As a result, the evaluation of hazardous waste proceeds to the evaluation of Tier D, area (Ref. 1, Section 2.4.2.1.3).
Volume Assigned Value: 0 2.4.2.1.4 Area (Tier D) The estimated area of Source No. 1 was determined by use of Figure 2 of this HRS documentation record and Reference 4, page 23, which depict the soil sampling locations from August 2018. The measuring tool in portable document format (PDF) was used to calculate the square footage (Ref. 80, pp. 1, 2). The approximate area of Source No. 1 is about 350 square feet (ft2) (Refs. 4, p. 23; 80, p. 2) (see Figure 2 of the HRS documentation record). Contamination between sampling points was inferred. Sum (ft2): 350 square feet
Equation for Assigning Value (Table 2-5): Area (A)/34,000 (Ref. 1, Section 2.4.2.1.4) Area Assigned Value: 0.010
25 Source Characterization
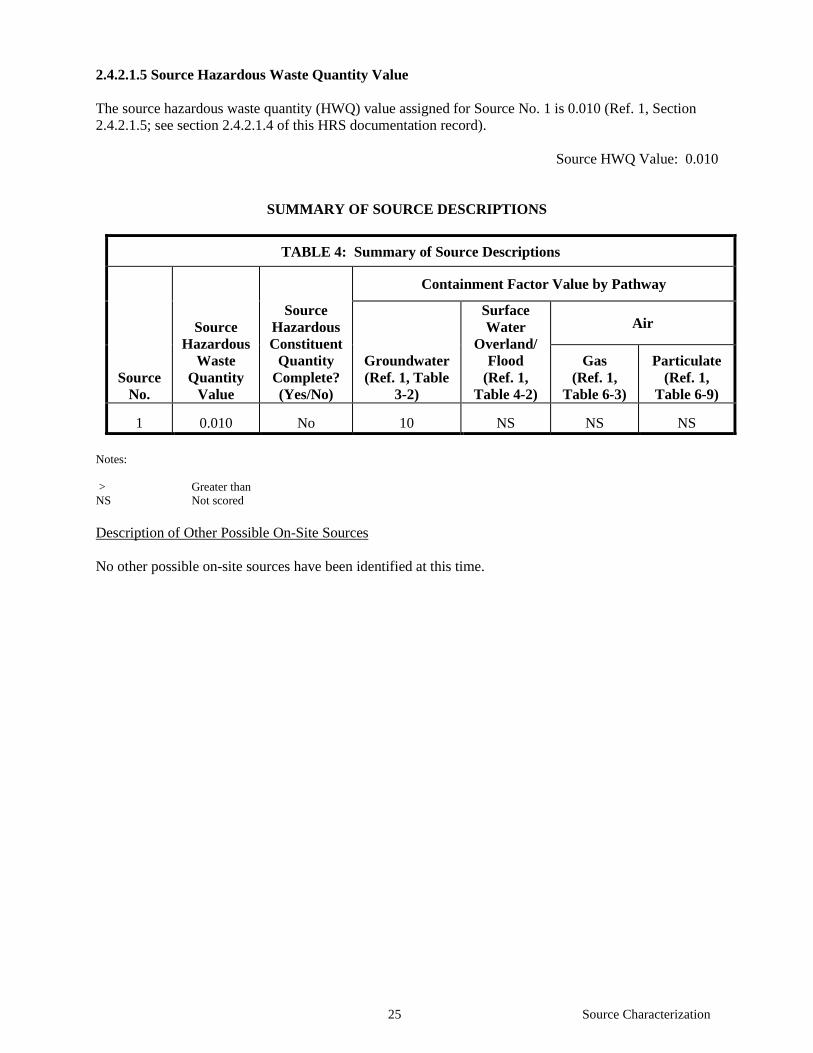
2.4.2.1.5 Source Hazardous Waste Quantity Value The source hazardous waste quantity (HWQ) value assigned for Source No. 1 is 0.010 (Ref. 1, Section 2.4.2.1.5; see section 2.4.2.1.4 of this HRS documentation record). Source HWQ Value: 0.010
SUMMARY OF SOURCE DESCRIPTIONS
TABLE 4: Summary of Source Descriptions
Source No.
Source Hazardous
Waste Quantity
Value
Source Hazardous Constituent
Quantity Complete? (Yes/No)
Containment Factor Value by Pathway
Groundwater (Ref. 1, Table
3-2)
Surface Water
Overland/ Flood
(Ref. 1, Table 4-2)
Air
Gas (Ref. 1,
Table 6-3)
Particulate (Ref. 1,
Table 6-9)
1 0.010 No 10 NS NS NS Notes: > Greater than NS Not scored Description of Other Possible On-Site Sources No other possible on-site sources have been identified at this time.
26 GW-General Considerations
3.0 GROUND WATER MIGRATION PATHWAY 3.0.1 GENERAL CONSIDERATIONS Ground Water Migration Pathway Description Regional Geology The site is in Unity, Marathon and Clark Counties, Wisconsin, and lies within the Northern Highland physiographic province (Refs. 65, p. 1; 66, p. 171). The Northern Highland province is part of the Laurentian Upland, or pre-Cambrian shield. This area contains igneous and metamorphic rocks that are more than 600 million years old. Rocks represented include various kinds of granite, granitic gneiss, rhyolite, basalt, and metasediments (Ref. 66, p. 171). Topography of the Northern Highland province is characterized by irregularities and low to moderate relief averaging about 200 feet (Ref. 66, p. 171). The Unity area is within the Central Wisconsin River Basin (Ref. 67). In the northern part of the basin, topography is a gently rolling till plain slightly modified by stream erosion. The area has many crystalline rock outcrops that project through the glacial deposits (Ref. 67). Western Marathon County and Eastern Clark County are underlain in descending stratigraphic order by all or some of the following units: Quaternary unconsolidated surficial deposits, Cambrian Sandstone, and Precambrian crystalline rocks (Refs. 67; 68, Plate 2). Unconsolidated deposits of glacial origin cover almost the entire central Wisconsin River basin. The deposits consist of unpitted outwash, pitted outwash, lake deposits, end moraines, and ground moraines (Ref. 67). In the Unity area, the deposits consist of unstratified clay, sand, silt, gravel, and cobbles that form a thin mantle (ground moraine) over bedrock with ridges (end moraines) of uneven, thicker deposits (Ref. 68, Plate 2). Ground moraine deposits consist of clayey and stony till and contain fragments of nearby bedrock. End moraine deposits include till and sorted sediments deposited near the glacial ice (Ref. 67). In the Unity area, thickness of the unconsolidated deposits is about 40 feet (Ref. 68, Plate 2). Cambrian sandstone underlies the unconsolidated deposits (Ref. 67). The sandstone consists chiefly of fine- to coarse-grained quartz sand; locally, it contains large amounts of micaceous shale. It ranges in character from a dense, clayey sandstone of low permeability to a clean, poorly cemented sandstone of high permeability (Ref. 68, p. 6). In the Unity area, thickness of the sandstone ranges from 20 to 50 feet (Ref. 68, pp. 3, 6). Pre-Cambrian crystalline rocks underlie the sandstone and consist of granite, gneiss, schist, slate, quartzite, and greenstone. Fractures, although fairly numerous and well developed at the surface, diminish in size and number with depth (Ref. 68, pp. 5, 6). The specific crystalline rocks that underlie the Unity area are labeled Penokean granites (Ref. 69, p. 7). These rocks contain diorite, tonalite, granodiorite, granite, and monzonite, and can be one of the following: (1) massive, relatively homogenous, and isotropic; (2) massive, with primary flow textures, or weak foliation; or (3) well foliated (Ref. 70, p. 8). Regional Aquifer Description Groundwater in Central Wisconsin moves through the saturated zones of alluvium, glacial deposits (sand and gravel), sandstone, and crystalline rock (Refs. 67; 68, p. 12; 72, p. 447). All or some of the following aquifers are present in the Unity area: unconsolidated sand and gravel deposits, sandstone, and crystalline rock (Refs. 71, p. J6; 72, pp. 447, 448, 449). The sand and gravel aquifer consists of the more permeable unconsolidated deposits in stream-valley alluvium and glacial deposits (Ref. 72, p. 447). In the Unity area, stream-valley alluvium is not present (Ref. 68, Plate 2). The aquifer consists primarily of sand and gravel lenses and beds within the glacial deposits; in practice, however, the aquifer includes any material that can provide sufficient water, including large proportions of clay and silt (Ref. 73, p. 5). The sand and gravel aquifer is not a
27 GW-General Considerations
continuous unit as are most bedrock aquifers. It is present as broad, surficial outwash deposits; isolated lenses of sand and gravel within less permeable deposits; and valley fill and basal sand and gravel deposits directly overlying bedrock (Ref. 73, p. 5). In the Unity area, the sand and gravel aquifer is first encountered between 38 and 56 feet bls (Ref. 74, pp. 50, 51, 52, 68 through 71). Some regional geology references refer to the sand and gravel aquifer as the unconsolidated sand and gravel aquifer (Ref. 72, p. 447). However, in this HRS documentation record, the term sand and gravel aquifer will be used. The sandstone aquifer consists of hydraulically connected sandstones and dolomites of Cambrian age (Refs. 67; 73, p. 7). The sandstone aquifer includes many rock formations – mostly sandstone and dolomite. The aquifer also includes beds of siltstone and dolomitic sandstone (Ref. 72, p. 448). The sandstone is not a continuous unit (Ref. 68, Plate 1). In the Unity area, the sandstone is first encountered at depths ranging from 36 to 65 feet bls, and thickness of the sandstone ranges from 3 to 15 feet (Ref. 74, pp. 24, 25, 28, 33, 35, 37, 39, 42, 55, 56, 61, 64, 65, 67, 69, 70, 71). The crystalline-rock aquifer consists primarily of crystalline rocks that yield small to moderate quantities of water from joints and fractures (Ref. 71, p. J5). Supplies from crystalline rocks are from water stored and moving in rock fractures or in overlying deposits (Ref. 68, p. 16). The crystalline rock aquifer is the least productive aquifer in Central Wisconsin, but the aquifer is the sole source of groundwater in much of the eastern part of the area (Ref. 68, pp. 3, 16). In the Unity area, the crystalline rock aquifer consists of granite and is first encountered at 18 to 107 feet bls (Ref. 74, pp. 11, 12, 14, 16, 20, 22, 38, 43, 45, 53, 54, 58, 59, 66). Site Geology/Hydrogeology The elevation of UAM, as determined by permanent monitoring well EPA-8D, is 1,334.8 feet above mean sea level (msl) (Ref. 6, pp. 26, 60). The elevation of permanent monitoring well EPA-8D is used throughout the general considerations geology section (section 3.0.1 of this HRS documentation record) in relation to at which depths aquifers are encountered. Boring logs advanced within Source No. 1, up to a depth of 20 feet bls, indicate that Source No. 1 is underlain by topsoil, sand, silt/clay, clay, and/or cobble (Ref. 4, pp. 23, 91 through 100) (see Figure 2 of this HRS documentation record). Monitoring well EPA-8D, 52 feet bls or 1,282.8 feet above msl, was installed within Source No. 1 (see Figures 3 of this HRS documentation record). The well log for EPA-8D indicates that Source No. 1 is underlain by sand and gravel, silty clay, and silty sand up to a depth of 21 feet bls (1,313.8 feet above mean sea level [msl]). Sandstone is encountered from 21 feet bls to 38 feet bls (1,313.8 to 1,296.8 feet above msl). Granite underlies the sandstone and is first encountered at 38 feet bls (1,296.8 feet above msl) and continues till the bottom of the borehole (52 feet bls or 1,282.8 feet above msl) (Ref. 6, p. 60). In 2015, 13 monitoring wells were installed within 575 feet of Source No. 1 (Ref. 6, pp. 26, 48 through 61). The wells were installed in the sandstone or crystalline rock (granite) aquifers at depths ranging from 31 to 80 feet bls (1,303.8 to 1,254.8 feet above msl) (Refs. 6, pp. 26, 48 through 61) (see Figure 2 of this HRS documentation record). The well logs indicate that unconsolidated deposits consisting of clay, sand, silty clay, silty sand, sandy clay, and sandy silt were encountered from land surface up to 32 feet bls (1,334.8 to 1,302.8 feet above msl) (Ref. 6, pp. 48 through 61). Underlying the unconsolidated deposits is sandstone. Sandstone was first encountered at depths ranging from 20 to 32 feet bls (1,314.8 to 1,302.8 feet above msl). Thickness of the sandstone underlying Source No. 1 ranges from 10 to 31.5 feet. Thickness of the sandstone was determined by use of well logs where granite was encountered underlying the sandstone (Ref. 6, pp. 48, 49, 52, 53, 54, 55, 56, 58, 60). Granite was first encountered at depths of 38 to 59.5 feet bls (1,296.8 to 1,275.3 feet above msl) (Ref. 6, pp. 48, 49, 52, 53, 54, 56, 58, 60). The nearest water body is the Little Eau Pleine River located west-southwest of Source No. 1. The Little Eau Pleine River is located about 2,800 feet west and 3,200 feet south of Source No. 1 (see Figure 1 of this HRS documentation record). Based on topographic maps and flow direction of local streams, regional ground water flow within the Unity area generally is expected to be to the southwest, from
28 GW-General Considerations
Source No. 1 towards Little Eau Pleine River (Ref. 6, p. 3) (see Figure 1 of this HRS documentation record). However, based on groundwater elevations measured from monitoring wells, local shallow groundwater flow direction was documented to be toward the northwest (Ref. 4, pp. 10, 11). Although measurements in deeper sandstone and granite (crystalline rock) piezometers also indicate flow to the west and northwest, the contaminant plume turns south just beyond the piezometer network, which may be caused by stress on the thin sandstone aquifer. In addition, the plume indicates that there is some migration to the east-southeast from the site (Ref. 4, p. 11) (see Figure 4 of this HRS documentation record). Aquifer Interconnection Groundwater in the Unity area moves through the saturated zones of glacial deposits (sand and gravel), sandstone, and crystalline rock (Refs. 68, p. 3, 12; 74, pp. 2 to 5, 7, 9, 11, 12, 14, 16, 20, 22, 24 to 28, 33, 35, 37 to 45, 47 to 51). These materials are generally connected hydraulically to form a single groundwater reservoir (Ref. 68, p. 12-13). A review of 47 well logs for private wells within a 2-mile radius of Source No. 1 indicate that wells are completed in sand and gravel, sandstone, and/or crystalline rock (granite) aquifers (Refs. 33, pp. 1 to 14; 74, pp. 1 to 71). The lithology of four wells is provided below. These wells represent the general geology within a 2-mile radius of Source No. 1. The well logs are contained in Reference 74 to this HRS documentation record. Sand and Gravel Aquifer (MR4108, Ref. 74, p. 51)
• Clay (0 to 40 feet bls) • Sand and gravel (40 to 43 feet bls)
Sandstone Aquifer (CK536, Ref. 74, p. 3) • Clay (0 to 31 feet bls) • Sandstone (31 to 38 feet bls)
Crystalline Rock (Granite) Aquifer (CK553, Ref. 74, p. 11) • Sandy clay (0 to 42 feet bls) • Blue clay (42 to 56 feet bls) • Granite (56 to 100 feet bls)
Sandstone and Crystalline Rock (Granite) Aquifers (MR4090, Ref. 74, p. 24) • Clay (0 to 45 feet bls) • Sandstone (45 to 60 feet bls) • Granite (60 to 68 feet bls)
The well logs presented above indicate that the sand and gravel and sandstone aquifers are not continuous within a 2-mile radius of Source No. 1. In 41 of 47 private well logs evaluated for this HRS documentation record (within a 2-mile radius of Source No. 1), the sand and gravel aquifer is absent; the sandstone aquifer is absent in 17 of 27 well logs for wells advanced into granite (Refs. 33, pp. 1 through 14; 74, pp. 11, 12, 14, 15, 16, 18, 20, 22, 24, 25, 27, 28, 30, 32, 33, 35, 37, 38, 42, 43, 44, 45, 48, 50, 51, 52, 53, 57, 54, 59, 61, 65, 66, 68). Hydrogeology of the aquifers is highly heterogeneous, with extreme lithologic variations over short distances and with depth (Refs. 74, pp. 1 to 71). A demonstration of this variability is evident in well numbers MR531 and MR532 both located about 0.30 mile north of Source No. 1 and adjacent to each other (Ref. 74, p. 71). During the installation of well MR531, the following materials were encountered: clay (0 to 40 feet bls or 1,334.8 to 1,294.8 feet above msl) and granite (40 to 100 feet bls or 1,294.8 to 1,234.8 feet above msl) (Ref. 74, p. 53). During the installation of well MR532, the following materials were encountered: clay (0 to 32 feet bls or 1,334.8 to 1,302.8 feet above msl) and sandstone and shale (32 to 41 feet bls or 1,302.8 to 1,293.8 feet above msl) (Ref. 74, p. 41). Sandstone was not encountered in well MR531 (Ref. 74, p. 53).
29 GW-General Considerations
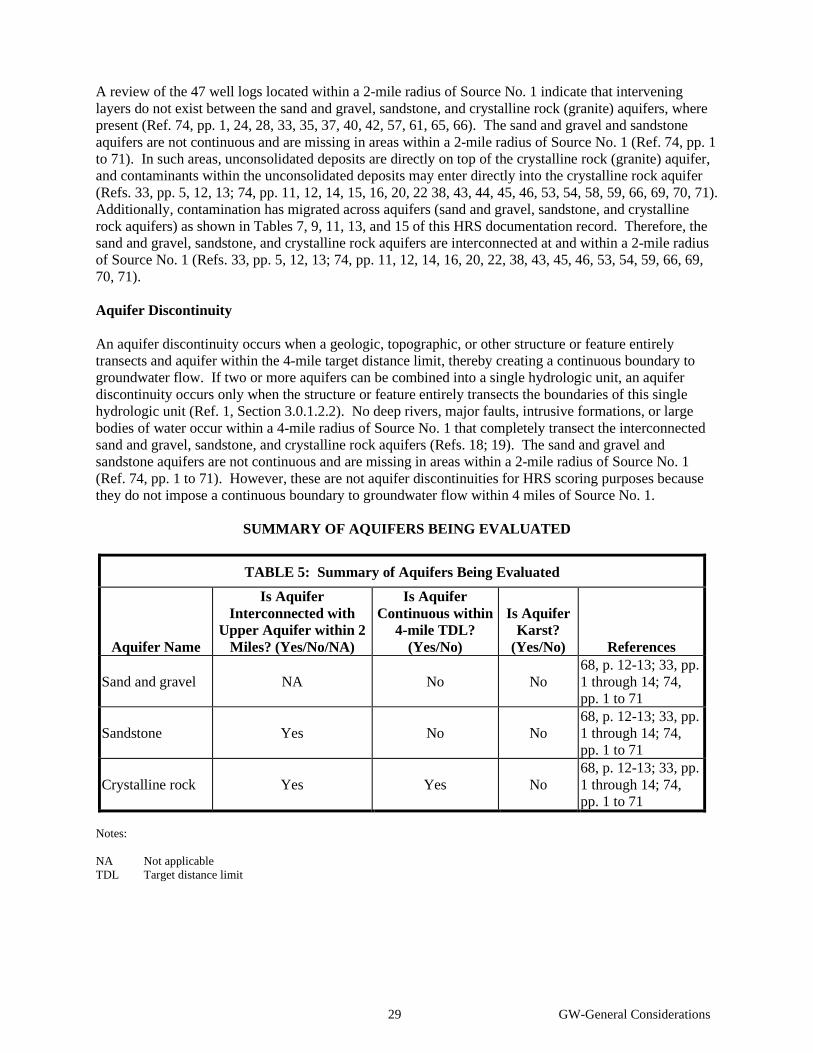
A review of the 47 well logs located within a 2-mile radius of Source No. 1 indicate that intervening layers do not exist between the sand and gravel, sandstone, and crystalline rock (granite) aquifers, where present (Ref. 74, pp. 1, 24, 28, 33, 35, 37, 40, 42, 57, 61, 65, 66). The sand and gravel and sandstone aquifers are not continuous and are missing in areas within a 2-mile radius of Source No. 1 (Ref. 74, pp. 1 to 71). In such areas, unconsolidated deposits are directly on top of the crystalline rock (granite) aquifer, and contaminants within the unconsolidated deposits may enter directly into the crystalline rock aquifer (Refs. 33, pp. 5, 12, 13; 74, pp. 11, 12, 14, 15, 16, 20, 22 38, 43, 44, 45, 46, 53, 54, 58, 59, 66, 69, 70, 71). Additionally, contamination has migrated across aquifers (sand and gravel, sandstone, and crystalline rock aquifers) as shown in Tables 7, 9, 11, 13, and 15 of this HRS documentation record. Therefore, the sand and gravel, sandstone, and crystalline rock aquifers are interconnected at and within a 2-mile radius of Source No. 1 (Refs. 33, pp. 5, 12, 13; 74, pp. 11, 12, 14, 16, 20, 22, 38, 43, 45, 46, 53, 54, 59, 66, 69, 70, 71). Aquifer Discontinuity An aquifer discontinuity occurs when a geologic, topographic, or other structure or feature entirely transects and aquifer within the 4-mile target distance limit, thereby creating a continuous boundary to groundwater flow. If two or more aquifers can be combined into a single hydrologic unit, an aquifer discontinuity occurs only when the structure or feature entirely transects the boundaries of this single hydrologic unit (Ref. 1, Section 3.0.1.2.2). No deep rivers, major faults, intrusive formations, or large bodies of water occur within a 4-mile radius of Source No. 1 that completely transect the interconnected sand and gravel, sandstone, and crystalline rock aquifers (Refs. 18; 19). The sand and gravel and sandstone aquifers are not continuous and are missing in areas within a 2-mile radius of Source No. 1 (Ref. 74, pp. 1 to 71). However, these are not aquifer discontinuities for HRS scoring purposes because they do not impose a continuous boundary to groundwater flow within 4 miles of Source No. 1.
SUMMARY OF AQUIFERS BEING EVALUATED
TABLE 5: Summary of Aquifers Being Evaluated
Aquifer Name
Is Aquifer Interconnected with
Upper Aquifer within 2 Miles? (Yes/No/NA)
Is Aquifer Continuous within
4-mile TDL? (Yes/No)
Is Aquifer Karst?
(Yes/No) References
Sand and gravel NA No No 68, p. 12-13; 33, pp. 1 through 14; 74, pp. 1 to 71
Sandstone Yes No No 68, p. 12-13; 33, pp. 1 through 14; 74, pp. 1 to 71
Crystalline rock Yes Yes No 68, p. 12-13; 33, pp. 1 through 14; 74, pp. 1 to 71
Notes: NA Not applicable TDL Target distance limit
30 GW-Likelihood of Release
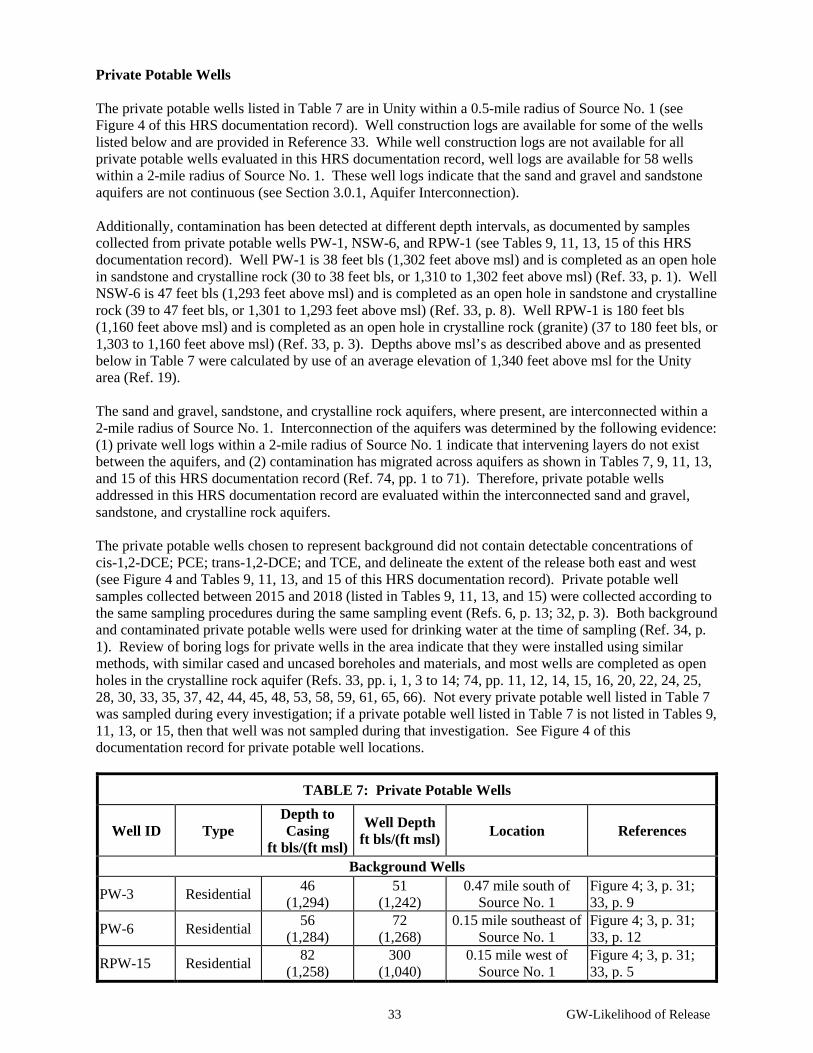
3.1 LIKELIHOOD OF RELEASE 3.1.1 OBSERVED RELEASE Aquifers Being Evaluated: Interconnected Sand and Gravel/Sandstone/Crystalline Rock Chemical Analysis An observed release by chemical analysis is established by showing that concentrations of a hazardous substance in release samples are significantly higher than the background level, and by documenting that at least part of that significant difference in concentration traces to a release at the site under evaluation. The significant difference can be documented in one of two ways for HRS purposes. If the background concentration of the hazardous substance is undetected, an observed release is established when the measured concentration in the sample equals or exceeds the appropriate quantitation limit. If the concentration of the hazardous substance in the background sample equals or exceeds the detection limit, an observed release is established when the concentration of that substance in the sample is found at three times or more the background concentration and above the appropriate quantitation limit (Ref. 1, Section 2.3, Table 2-3). An observed release of cis-1,2-DCE; PCE; trans-1,2-DCE; TCE; and/or vinyl chloride is documented in the following sections by comparing concentrations of these hazardous substances in similar background samples with concentrations in samples from monitoring and private potable wells (see Tables 8 through 15 of this HRS documentation record). Samples documenting an observed release were collected during numerous sampling events from 2015 to 2018. Thirteen private potable wells were found to contain cis-1,2-DCE, PCE, and/or TCE at Level I concentrations; four private potable wells contained PCE at Level II concentrations (see Table 16 of this HRS documentation record). Data from multiple sampling events are presented to more comprehensively characterize the release; the more recent data (2018) demonstrate that the contamination remains an issue. Samples were collected from the monitoring wells and private potable wells listed in Tables 6 and 7 of this HRS documentation record during multiple sampling events from 2015 to 2018. The same monitoring wells and private potable wells were sampled during multiple sampling events from which analytical results are listed in Tables 8 through 15 of this HRS documentation record. Therefore, lists of well identification numbers, well types (residential or commercial), well depths (if available), screened intervals (if available), and locations of monitoring and private potable wells appear only in Tables 6 and 7 below. Not every private potable well listed in Table 7 was sampled during every investigation; if a private potable well listed in Table 7 is not listed in Tables 9, 11, 13, or 15, then that well was not sampled during that investigation.
31 GW-Likelihood of Release
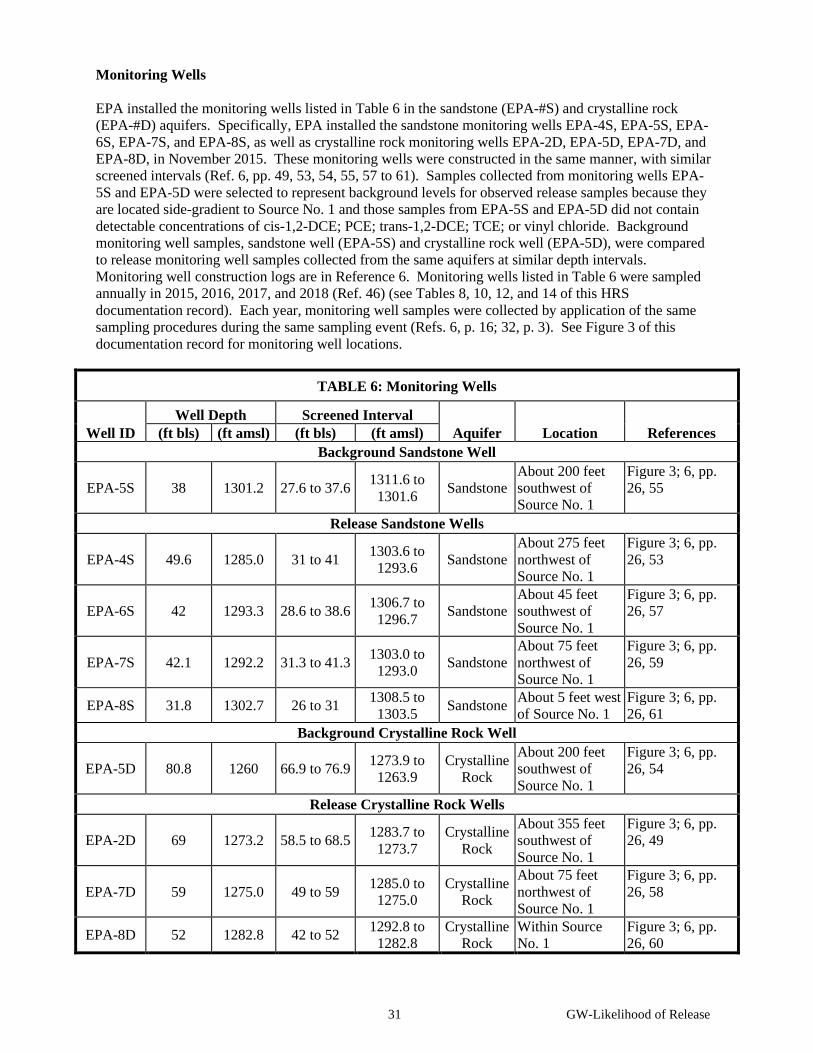
Monitoring Wells EPA installed the monitoring wells listed in Table 6 in the sandstone (EPA-#S) and crystalline rock (EPA-#D) aquifers. Specifically, EPA installed the sandstone monitoring wells EPA-4S, EPA-5S, EPA-6S, EPA-7S, and EPA-8S, as well as crystalline rock monitoring wells EPA-2D, EPA-5D, EPA-7D, and EPA-8D, in November 2015. These monitoring wells were constructed in the same manner, with similar screened intervals (Ref. 6, pp. 49, 53, 54, 55, 57 to 61). Samples collected from monitoring wells EPA-5S and EPA-5D were selected to represent background levels for observed release samples because they are located side-gradient to Source No. 1 and those samples from EPA-5S and EPA-5D did not contain detectable concentrations of cis-1,2-DCE; PCE; trans-1,2-DCE; TCE; or vinyl chloride. Background monitoring well samples, sandstone well (EPA-5S) and crystalline rock well (EPA-5D), were compared to release monitoring well samples collected from the same aquifers at similar depth intervals. Monitoring well construction logs are in Reference 6. Monitoring wells listed in Table 6 were sampled annually in 2015, 2016, 2017, and 2018 (Ref. 46) (see Tables 8, 10, 12, and 14 of this HRS documentation record). Each year, monitoring well samples were collected by application of the same sampling procedures during the same sampling event (Refs. 6, p. 16; 32, p. 3). See Figure 3 of this documentation record for monitoring well locations.
TABLE 6: Monitoring Wells
Well ID Well Depth Screened Interval
Aquifer Location References (ft bls) (ft amsl) (ft bls) (ft amsl) Background Sandstone Well
EPA-5S 38 1301.2 27.6 to 37.6 1311.6 to 1301.6 Sandstone
About 200 feet southwest of Source No. 1
Figure 3; 6, pp. 26, 55
Release Sandstone Wells
EPA-4S 49.6 1285.0 31 to 41 1303.6 to 1293.6 Sandstone
About 275 feet northwest of Source No. 1
Figure 3; 6, pp. 26, 53
EPA-6S 42 1293.3 28.6 to 38.6 1306.7 to 1296.7 Sandstone
About 45 feet southwest of Source No. 1
Figure 3; 6, pp. 26, 57
EPA-7S 42.1 1292.2 31.3 to 41.3 1303.0 to 1293.0 Sandstone
About 75 feet northwest of Source No. 1
Figure 3; 6, pp. 26, 59
EPA-8S 31.8 1302.7 26 to 31 1308.5 to 1303.5 Sandstone About 5 feet west
of Source No. 1 Figure 3; 6, pp. 26, 61
Background Crystalline Rock Well
EPA-5D 80.8 1260 66.9 to 76.9 1273.9 to 1263.9
Crystalline Rock
About 200 feet southwest of Source No. 1
Figure 3; 6, pp. 26, 54
Release Crystalline Rock Wells
EPA-2D 69 1273.2 58.5 to 68.5 1283.7 to 1273.7
Crystalline Rock
About 355 feet southwest of Source No. 1
Figure 3; 6, pp. 26, 49
EPA-7D 59 1275.0 49 to 59 1285.0 to 1275.0
Crystalline Rock
About 75 feet northwest of Source No. 1
Figure 3; 6, pp. 26, 58
EPA-8D 52 1282.8 42 to 52 1292.8 to 1282.8
Crystalline Rock
Within Source No. 1
Figure 3; 6, pp. 26, 60
32 GW-Likelihood of Release
Notes: amsl Above mean sea level bls Below land surface #D Deep EPA U.S. Environmental Protection Agency ft Feet ID Identification number No. Number #S Shallow
33 GW-Likelihood of Release
Private Potable Wells The private potable wells listed in Table 7 are in Unity within a 0.5-mile radius of Source No. 1 (see Figure 4 of this HRS documentation record). Well construction logs are available for some of the wells listed below and are provided in Reference 33. While well construction logs are not available for all private potable wells evaluated in this HRS documentation record, well logs are available for 58 wells within a 2-mile radius of Source No. 1. These well logs indicate that the sand and gravel and sandstone aquifers are not continuous (see Section 3.0.1, Aquifer Interconnection). Additionally, contamination has been detected at different depth intervals, as documented by samples collected from private potable wells PW-1, NSW-6, and RPW-1 (see Tables 9, 11, 13, 15 of this HRS documentation record). Well PW-1 is 38 feet bls (1,302 feet above msl) and is completed as an open hole in sandstone and crystalline rock (30 to 38 feet bls, or 1,310 to 1,302 feet above msl) (Ref. 33, p. 1). Well NSW-6 is 47 feet bls (1,293 feet above msl) and is completed as an open hole in sandstone and crystalline rock (39 to 47 feet bls, or 1,301 to 1,293 feet above msl) (Ref. 33, p. 8). Well RPW-1 is 180 feet bls (1,160 feet above msl) and is completed as an open hole in crystalline rock (granite) (37 to 180 feet bls, or 1,303 to 1,160 feet above msl) (Ref. 33, p. 3). Depths above msl’s as described above and as presented below in Table 7 were calculated by use of an average elevation of 1,340 feet above msl for the Unity area (Ref. 19). The sand and gravel, sandstone, and crystalline rock aquifers, where present, are interconnected within a 2-mile radius of Source No. 1. Interconnection of the aquifers was determined by the following evidence: (1) private well logs within a 2-mile radius of Source No. 1 indicate that intervening layers do not exist between the aquifers, and (2) contamination has migrated across aquifers as shown in Tables 7, 9, 11, 13, and 15 of this HRS documentation record (Ref. 74, pp. 1 to 71). Therefore, private potable wells addressed in this HRS documentation record are evaluated within the interconnected sand and gravel, sandstone, and crystalline rock aquifers. The private potable wells chosen to represent background did not contain detectable concentrations of cis-1,2-DCE; PCE; trans-1,2-DCE; and TCE, and delineate the extent of the release both east and west (see Figure 4 and Tables 9, 11, 13, and 15 of this HRS documentation record). Private potable well samples collected between 2015 and 2018 (listed in Tables 9, 11, 13, and 15) were collected according to the same sampling procedures during the same sampling event (Refs. 6, p. 13; 32, p. 3). Both background and contaminated private potable wells were used for drinking water at the time of sampling (Ref. 34, p. 1). Review of boring logs for private wells in the area indicate that they were installed using similar methods, with similar cased and uncased boreholes and materials, and most wells are completed as open holes in the crystalline rock aquifer (Refs. 33, pp. i, 1, 3 to 14; 74, pp. 11, 12, 14, 15, 16, 20, 22, 24, 25, 28, 30, 33, 35, 37, 42, 44, 45, 48, 53, 58, 59, 61, 65, 66). Not every private potable well listed in Table 7 was sampled during every investigation; if a private potable well listed in Table 7 is not listed in Tables 9, 11, 13, or 15, then that well was not sampled during that investigation. See Figure 4 of this documentation record for private potable well locations.
TABLE 7: Private Potable Wells
Well ID Type Depth to Casing
ft bls/(ft msl)
Well Depth ft bls/(ft msl) Location References
Background Wells
PW-3 Residential 46 (1,294)
51 (1,242)
0.47 mile south of Source No. 1
Figure 4; 3, p. 31; 33, p. 9
PW-6 Residential 56 (1,284)
72 (1,268)
0.15 mile southeast of Source No. 1
Figure 4; 3, p. 31; 33, p. 12
RPW-15 Residential 82 (1,258)
300 (1,040)
0.15 mile west of Source No. 1
Figure 4; 3, p. 31; 33, p. 5
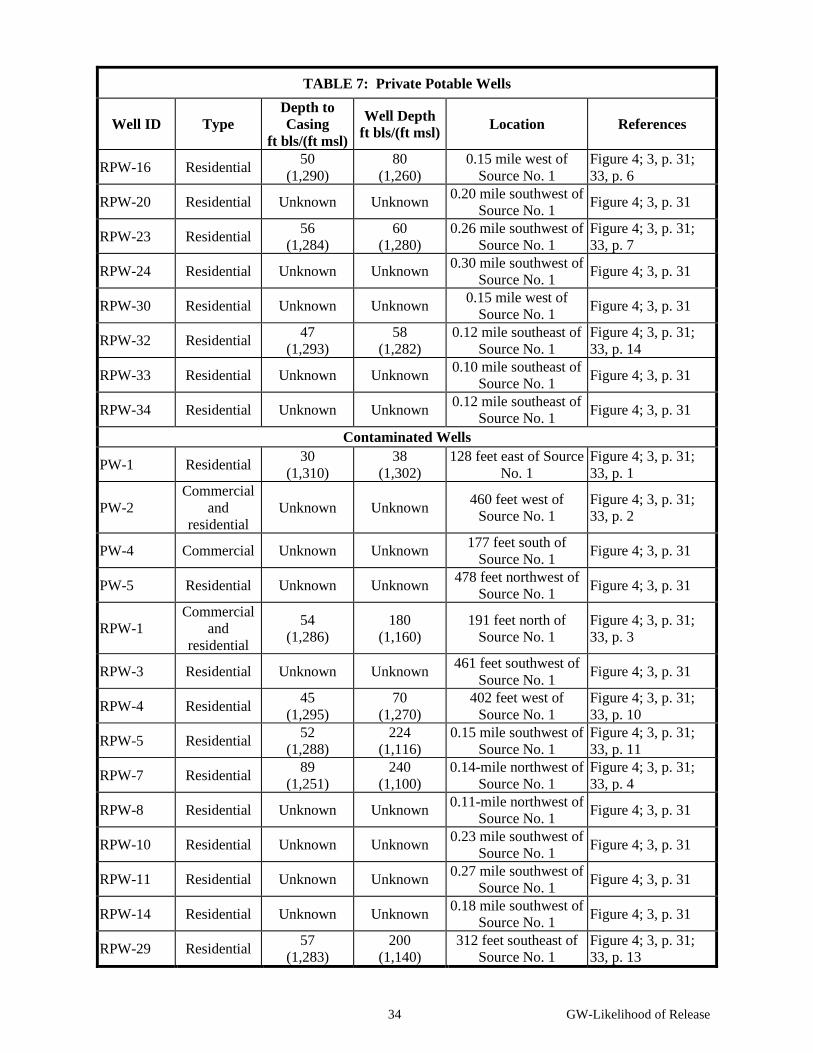
34 GW-Likelihood of Release
TABLE 7: Private Potable Wells
Well ID Type Depth to Casing
ft bls/(ft msl)
Well Depth ft bls/(ft msl) Location References
RPW-16 Residential 50 (1,290)
80 (1,260)
0.15 mile west of Source No. 1
Figure 4; 3, p. 31; 33, p. 6
RPW-20 Residential Unknown Unknown 0.20 mile southwest of Source No. 1 Figure 4; 3, p. 31
RPW-23 Residential 56 (1,284)
60 (1,280)
0.26 mile southwest of Source No. 1
Figure 4; 3, p. 31; 33, p. 7
RPW-24 Residential Unknown Unknown 0.30 mile southwest of Source No. 1 Figure 4; 3, p. 31
RPW-30 Residential Unknown Unknown 0.15 mile west of Source No. 1 Figure 4; 3, p. 31
RPW-32 Residential 47 (1,293)
58 (1,282)
0.12 mile southeast of Source No. 1
Figure 4; 3, p. 31; 33, p. 14
RPW-33 Residential Unknown Unknown 0.10 mile southeast of Source No. 1 Figure 4; 3, p. 31
RPW-34 Residential Unknown Unknown 0.12 mile southeast of Source No. 1 Figure 4; 3, p. 31
Contaminated Wells
PW-1 Residential 30 (1,310)
38 (1,302)
128 feet east of Source No. 1
Figure 4; 3, p. 31; 33, p. 1
PW-2 Commercial
and residential
Unknown Unknown 460 feet west of Source No. 1
Figure 4; 3, p. 31; 33, p. 2
PW-4 Commercial Unknown Unknown 177 feet south of Source No. 1 Figure 4; 3, p. 31
PW-5 Residential Unknown Unknown 478 feet northwest of Source No. 1 Figure 4; 3, p. 31
RPW-1 Commercial
and residential
54 (1,286)
180 (1,160)
191 feet north of Source No. 1
Figure 4; 3, p. 31; 33, p. 3
RPW-3 Residential Unknown Unknown 461 feet southwest of Source No. 1 Figure 4; 3, p. 31
RPW-4 Residential 45 (1,295)
70 (1,270)
402 feet west of Source No. 1
Figure 4; 3, p. 31; 33, p. 10
RPW-5 Residential 52 (1,288)
224 (1,116)
0.15 mile southwest of Source No. 1
Figure 4; 3, p. 31; 33, p. 11
RPW-7 Residential 89 (1,251)
240 (1,100)
0.14-mile northwest of Source No. 1
Figure 4; 3, p. 31; 33, p. 4
RPW-8 Residential Unknown Unknown 0.11-mile northwest of Source No. 1 Figure 4; 3, p. 31
RPW-10 Residential Unknown Unknown 0.23 mile southwest of Source No. 1 Figure 4; 3, p. 31
RPW-11 Residential Unknown Unknown 0.27 mile southwest of Source No. 1 Figure 4; 3, p. 31
RPW-14 Residential Unknown Unknown 0.18 mile southwest of Source No. 1 Figure 4; 3, p. 31
RPW-29 Residential 57 (1,283)
200 (1,140)
312 feet southeast of Source No. 1
Figure 4; 3, p. 31; 33, p. 13
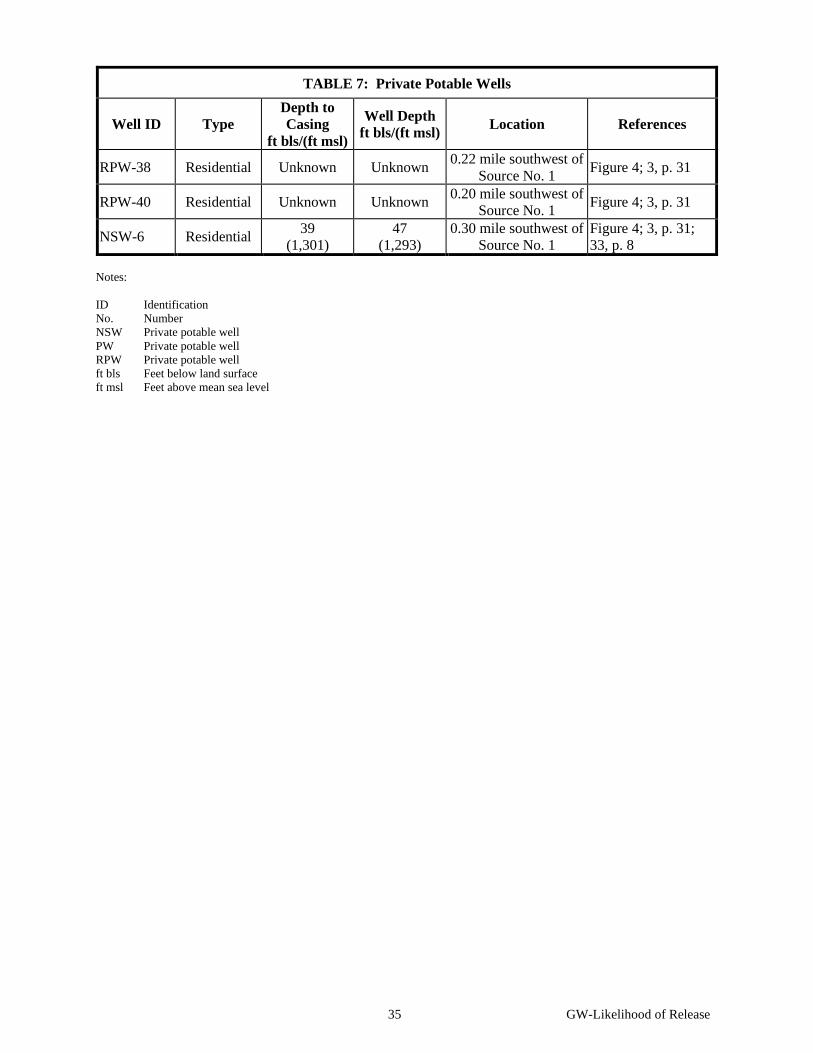
35 GW-Likelihood of Release
TABLE 7: Private Potable Wells
Well ID Type Depth to Casing
ft bls/(ft msl)
Well Depth ft bls/(ft msl) Location References
RPW-38 Residential Unknown Unknown 0.22 mile southwest of Source No. 1 Figure 4; 3, p. 31
RPW-40 Residential Unknown Unknown 0.20 mile southwest of Source No. 1 Figure 4; 3, p. 31
NSW-6 Residential 39 (1,301)
47 (1,293)
0.30 mile southwest of Source No. 1
Figure 4; 3, p. 31; 33, p. 8
Notes: ID Identification No. Number NSW Private potable well PW Private potable well RPW Private potable well ft bls Feet below land surface ft msl Feet above mean sea level
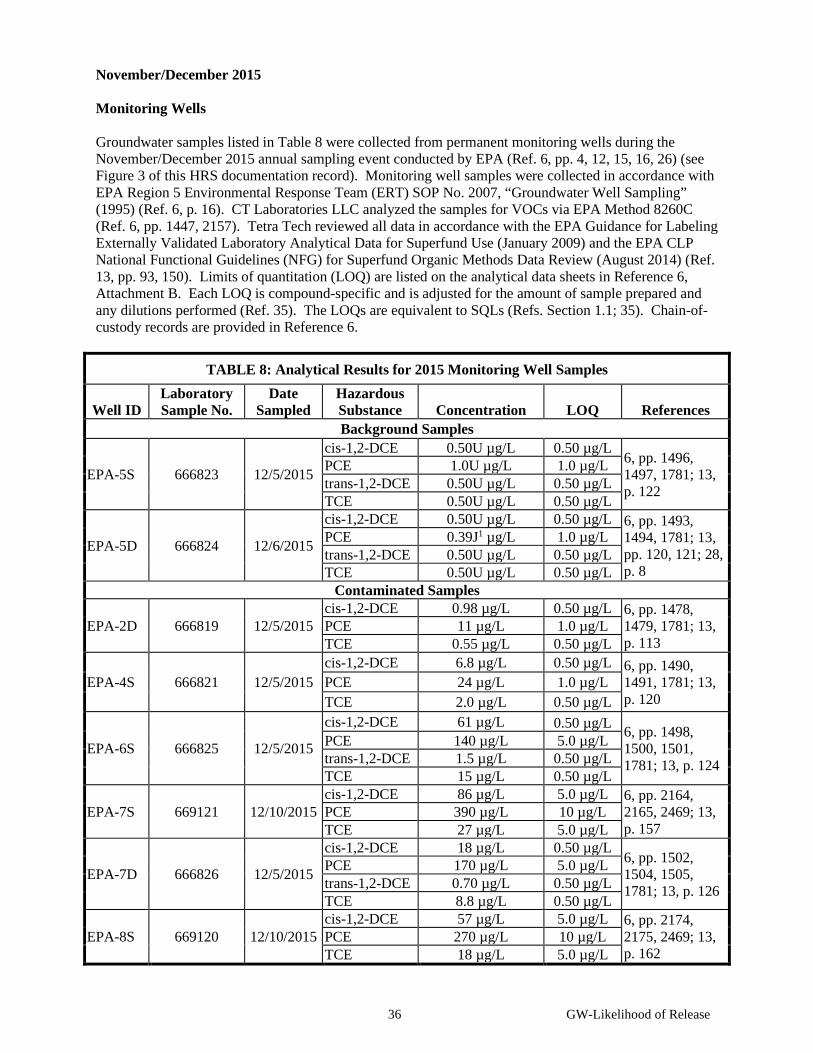
36 GW-Likelihood of Release
November/December 2015 Monitoring Wells Groundwater samples listed in Table 8 were collected from permanent monitoring wells during the November/December 2015 annual sampling event conducted by EPA (Ref. 6, pp. 4, 12, 15, 16, 26) (see Figure 3 of this HRS documentation record). Monitoring well samples were collected in accordance with EPA Region 5 Environmental Response Team (ERT) SOP No. 2007, “Groundwater Well Sampling” (1995) (Ref. 6, p. 16). CT Laboratories LLC analyzed the samples for VOCs via EPA Method 8260C (Ref. 6, pp. 1447, 2157). Tetra Tech reviewed all data in accordance with the EPA Guidance for Labeling Externally Validated Laboratory Analytical Data for Superfund Use (January 2009) and the EPA CLP National Functional Guidelines (NFG) for Superfund Organic Methods Data Review (August 2014) (Ref. 13, pp. 93, 150). Limits of quantitation (LOQ) are listed on the analytical data sheets in Reference 6, Attachment B. Each LOQ is compound-specific and is adjusted for the amount of sample prepared and any dilutions performed (Ref. 35). The LOQs are equivalent to SQLs (Refs. Section 1.1; 35). Chain-of-custody records are provided in Reference 6.
TABLE 8: Analytical Results for 2015 Monitoring Well Samples
Well ID Laboratory Sample No.
Date Sampled
Hazardous Substance Concentration LOQ References Background Samples
EPA-5S 666823 12/5/2015
cis-1,2-DCE 0.50U µg/L 0.50 µg/L 6, pp. 1496, 1497, 1781; 13, p. 122
PCE 1.0U µg/L 1.0 µg/L trans-1,2-DCE 0.50U µg/L 0.50 µg/L TCE 0.50U µg/L 0.50 µg/L
EPA-5D 666824 12/6/2015
cis-1,2-DCE 0.50U µg/L 0.50 µg/L 6, pp. 1493, 1494, 1781; 13, pp. 120, 121; 28, p. 8
PCE 0.39J1 µg/L 1.0 µg/L trans-1,2-DCE 0.50U µg/L 0.50 µg/L TCE 0.50U µg/L 0.50 µg/L
Contaminated Samples
EPA-2D 666819 12/5/2015 cis-1,2-DCE 0.98 µg/L 0.50 µg/L 6, pp. 1478,
1479, 1781; 13, p. 113
PCE 11 µg/L 1.0 µg/L TCE 0.55 µg/L 0.50 µg/L
EPA-4S 666821 12/5/2015 cis-1,2-DCE 6.8 µg/L 0.50 µg/L 6, pp. 1490,
1491, 1781; 13, p. 120
PCE 24 µg/L 1.0 µg/L TCE 2.0 µg/L 0.50 µg/L
EPA-6S 666825 12/5/2015
cis-1,2-DCE 61 µg/L 0.50 µg/L 6, pp. 1498, 1500, 1501, 1781; 13, p. 124
PCE 140 µg/L 5.0 µg/L trans-1,2-DCE 1.5 µg/L 0.50 µg/L TCE 15 µg/L 0.50 µg/L
EPA-7S 669121 12/10/2015 cis-1,2-DCE 86 µg/L 5.0 µg/L 6, pp. 2164,
2165, 2469; 13, p. 157
PCE 390 µg/L 10 µg/L TCE 27 µg/L 5.0 µg/L
EPA-7D 666826 12/5/2015
cis-1,2-DCE 18 µg/L 0.50 µg/L 6, pp. 1502, 1504, 1505, 1781; 13, p. 126
PCE 170 µg/L 5.0 µg/L trans-1,2-DCE 0.70 µg/L 0.50 µg/L TCE 8.8 µg/L 0.50 µg/L
EPA-8S 669120 12/10/2015 cis-1,2-DCE 57 µg/L 5.0 µg/L 6, pp. 2174,
2175, 2469; 13, p. 162
PCE 270 µg/L 10 µg/L TCE 18 µg/L 5.0 µg/L
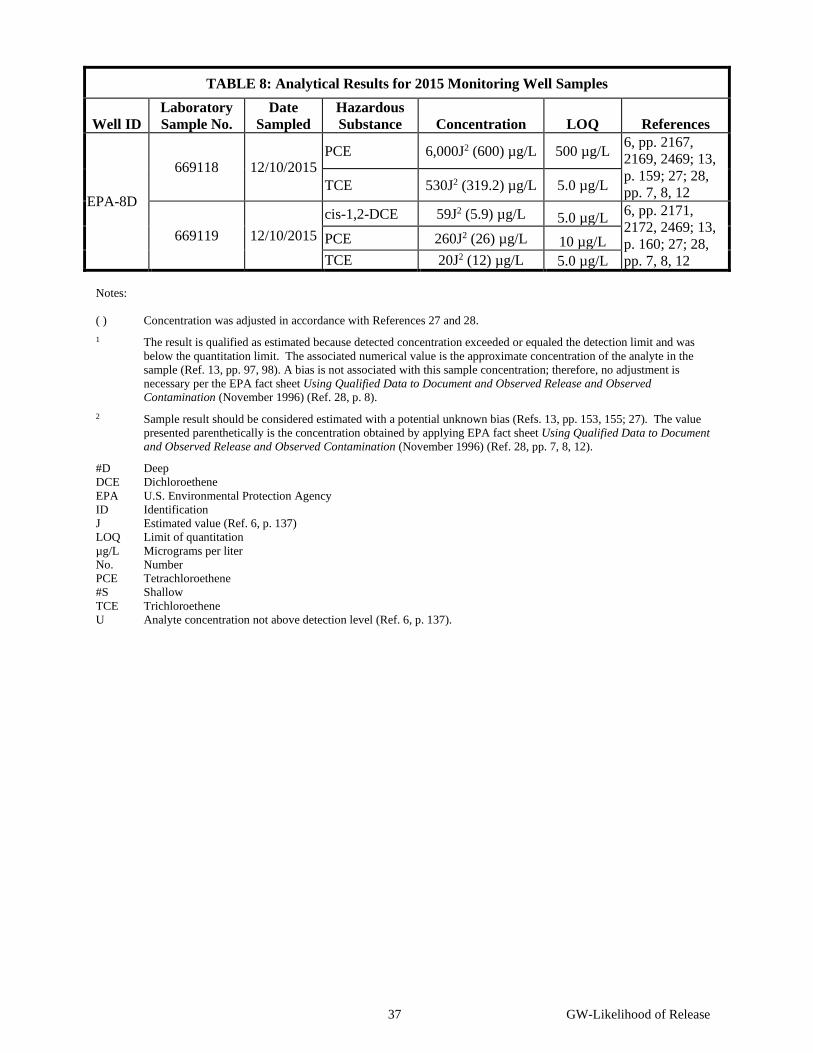
37 GW-Likelihood of Release
TABLE 8: Analytical Results for 2015 Monitoring Well Samples
Well ID Laboratory Sample No.
Date Sampled
Hazardous Substance Concentration LOQ References
EPA-8D
669118 12/10/2015 PCE 6,000J2 (600) µg/L 500 µg/L 6, pp. 2167,
2169, 2469; 13, p. 159; 27; 28, pp. 7, 8, 12 TCE 530J2 (319.2) µg/L 5.0 µg/L
669119 12/10/2015 cis-1,2-DCE 59J2 (5.9) µg/L 5.0 µg/L 6, pp. 2171,
2172, 2469; 13, p. 160; 27; 28, pp. 7, 8, 12
PCE 260J2 (26) µg/L 10 µg/L TCE 20J2 (12) µg/L 5.0 µg/L
Notes: ( ) Concentration was adjusted in accordance with References 27 and 28. 1 The result is qualified as estimated because detected concentration exceeded or equaled the detection limit and was
below the quantitation limit. The associated numerical value is the approximate concentration of the analyte in the sample (Ref. 13, pp. 97, 98). A bias is not associated with this sample concentration; therefore, no adjustment is necessary per the EPA fact sheet Using Qualified Data to Document and Observed Release and Observed Contamination (November 1996) (Ref. 28, p. 8).
2 Sample result should be considered estimated with a potential unknown bias (Refs. 13, pp. 153, 155; 27). The value presented parenthetically is the concentration obtained by applying EPA fact sheet Using Qualified Data to Document and Observed Release and Observed Contamination (November 1996) (Ref. 28, pp. 7, 8, 12).
#D Deep DCE Dichloroethene EPA U.S. Environmental Protection Agency ID Identification J Estimated value (Ref. 6, p. 137) LOQ Limit of quantitation µg/L Micrograms per liter No. Number PCE Tetrachloroethene #S Shallow TCE Trichloroethene U Analyte concentration not above detection level (Ref. 6, p. 137).
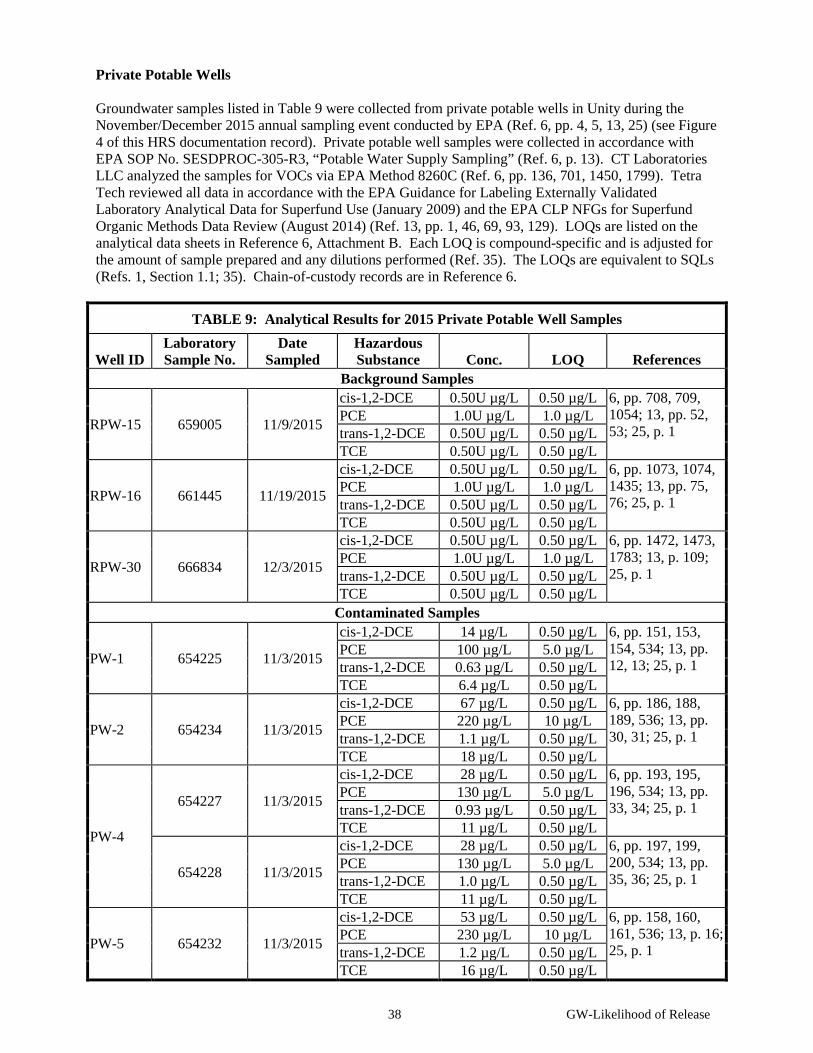
38 GW-Likelihood of Release
Private Potable Wells Groundwater samples listed in Table 9 were collected from private potable wells in Unity during the November/December 2015 annual sampling event conducted by EPA (Ref. 6, pp. 4, 5, 13, 25) (see Figure 4 of this HRS documentation record). Private potable well samples were collected in accordance with EPA SOP No. SESDPROC-305-R3, “Potable Water Supply Sampling” (Ref. 6, p. 13). CT Laboratories LLC analyzed the samples for VOCs via EPA Method 8260C (Ref. 6, pp. 136, 701, 1450, 1799). Tetra Tech reviewed all data in accordance with the EPA Guidance for Labeling Externally Validated Laboratory Analytical Data for Superfund Use (January 2009) and the EPA CLP NFGs for Superfund Organic Methods Data Review (August 2014) (Ref. 13, pp. 1, 46, 69, 93, 129). LOQs are listed on the analytical data sheets in Reference 6, Attachment B. Each LOQ is compound-specific and is adjusted for the amount of sample prepared and any dilutions performed (Ref. 35). The LOQs are equivalent to SQLs (Refs. 1, Section 1.1; 35). Chain-of-custody records are in Reference 6.
TABLE 9: Analytical Results for 2015 Private Potable Well Samples
Well ID Laboratory Sample No.
Date Sampled
Hazardous Substance Conc. LOQ References
Background Samples
RPW-15 659005 11/9/2015
cis-1,2-DCE 0.50U µg/L 0.50 µg/L 6, pp. 708, 709, 1054; 13, pp. 52, 53; 25, p. 1
PCE 1.0U µg/L 1.0 µg/L trans-1,2-DCE 0.50U µg/L 0.50 µg/L TCE 0.50U µg/L 0.50 µg/L
RPW-16 661445 11/19/2015
cis-1,2-DCE 0.50U µg/L 0.50 µg/L 6, pp. 1073, 1074, 1435; 13, pp. 75, 76; 25, p. 1
PCE 1.0U µg/L 1.0 µg/L trans-1,2-DCE 0.50U µg/L 0.50 µg/L TCE 0.50U µg/L 0.50 µg/L
RPW-30 666834 12/3/2015
cis-1,2-DCE 0.50U µg/L 0.50 µg/L 6, pp. 1472, 1473, 1783; 13, p. 109; 25, p. 1
PCE 1.0U µg/L 1.0 µg/L trans-1,2-DCE 0.50U µg/L 0.50 µg/L TCE 0.50U µg/L 0.50 µg/L
Contaminated Samples
PW-1 654225 11/3/2015
cis-1,2-DCE 14 µg/L 0.50 µg/L 6, pp. 151, 153, 154, 534; 13, pp. 12, 13; 25, p. 1
PCE 100 µg/L 5.0 µg/L trans-1,2-DCE 0.63 µg/L 0.50 µg/L TCE 6.4 µg/L 0.50 µg/L
PW-2 654234 11/3/2015
cis-1,2-DCE 67 µg/L 0.50 µg/L 6, pp. 186, 188, 189, 536; 13, pp. 30, 31; 25, p. 1
PCE 220 µg/L 10 µg/L trans-1,2-DCE 1.1 µg/L 0.50 µg/L TCE 18 µg/L 0.50 µg/L
PW-4
654227 11/3/2015
cis-1,2-DCE 28 µg/L 0.50 µg/L 6, pp. 193, 195, 196, 534; 13, pp. 33, 34; 25, p. 1
PCE 130 µg/L 5.0 µg/L trans-1,2-DCE 0.93 µg/L 0.50 µg/L TCE 11 µg/L 0.50 µg/L
654228 11/3/2015
cis-1,2-DCE 28 µg/L 0.50 µg/L 6, pp. 197, 199, 200, 534; 13, pp. 35, 36; 25, p. 1
PCE 130 µg/L 5.0 µg/L trans-1,2-DCE 1.0 µg/L 0.50 µg/L TCE 11 µg/L 0.50 µg/L
PW-5 654232 11/3/2015
cis-1,2-DCE 53 µg/L 0.50 µg/L 6, pp. 158, 160, 161, 536; 13, p. 16; 25, p. 1
PCE 230 µg/L 10 µg/L trans-1,2-DCE 1.2 µg/L 0.50 µg/L TCE 16 µg/L 0.50 µg/L
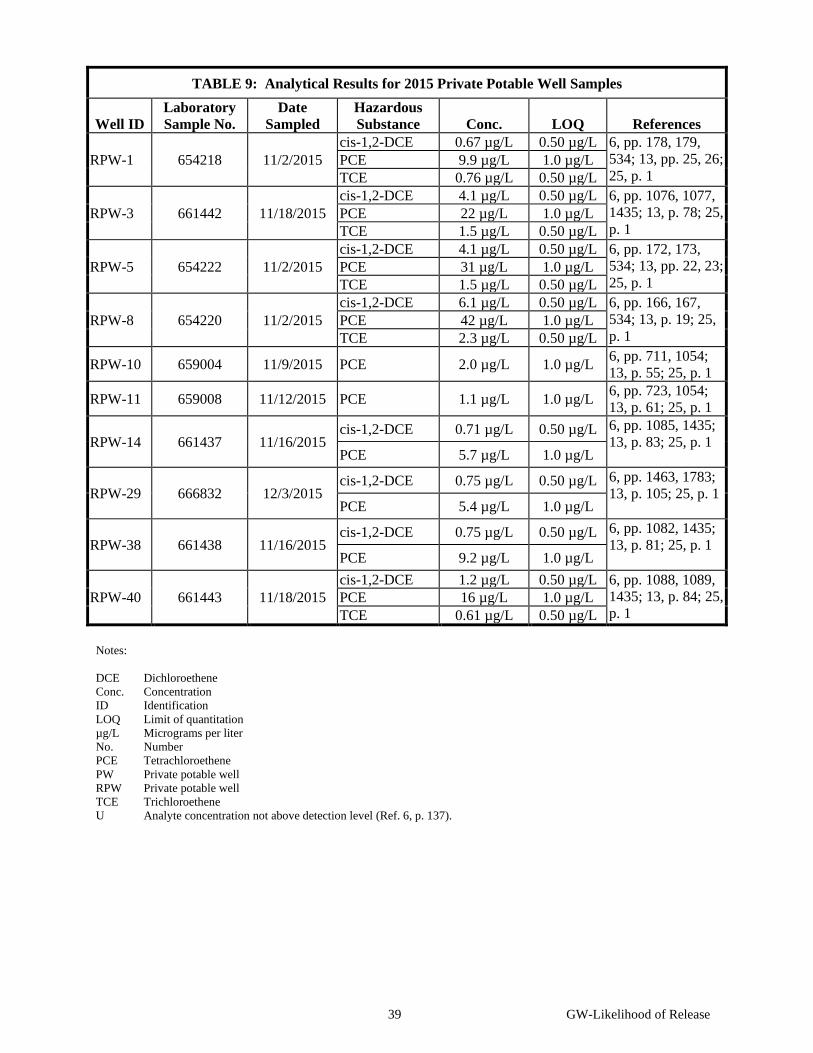
39 GW-Likelihood of Release
TABLE 9: Analytical Results for 2015 Private Potable Well Samples
Well ID Laboratory Sample No.
Date Sampled
Hazardous Substance Conc. LOQ References
RPW-1 654218 11/2/2015 cis-1,2-DCE 0.67 µg/L 0.50 µg/L 6, pp. 178, 179,
534; 13, pp. 25, 26; 25, p. 1
PCE 9.9 µg/L 1.0 µg/L TCE 0.76 µg/L 0.50 µg/L
RPW-3 661442 11/18/2015 cis-1,2-DCE 4.1 µg/L 0.50 µg/L 6, pp. 1076, 1077,
1435; 13, p. 78; 25, p. 1
PCE 22 µg/L 1.0 µg/L TCE 1.5 µg/L 0.50 µg/L
RPW-5 654222 11/2/2015 cis-1,2-DCE 4.1 µg/L 0.50 µg/L 6, pp. 172, 173,
534; 13, pp. 22, 23; 25, p. 1
PCE 31 µg/L 1.0 µg/L TCE 1.5 µg/L 0.50 µg/L
RPW-8 654220 11/2/2015 cis-1,2-DCE 6.1 µg/L 0.50 µg/L 6, pp. 166, 167,
534; 13, p. 19; 25, p. 1
PCE 42 µg/L 1.0 µg/L TCE 2.3 µg/L 0.50 µg/L
RPW-10 659004 11/9/2015 PCE 2.0 µg/L 1.0 µg/L 6, pp. 711, 1054; 13, p. 55; 25, p. 1
RPW-11 659008 11/12/2015 PCE 1.1 µg/L 1.0 µg/L 6, pp. 723, 1054; 13, p. 61; 25, p. 1
RPW-14 661437 11/16/2015 cis-1,2-DCE 0.71 µg/L 0.50 µg/L 6, pp. 1085, 1435;
13, p. 83; 25, p. 1 PCE 5.7 µg/L 1.0 µg/L
RPW-29 666832 12/3/2015 cis-1,2-DCE 0.75 µg/L 0.50 µg/L 6, pp. 1463, 1783;
13, p. 105; 25, p. 1 PCE 5.4 µg/L 1.0 µg/L
RPW-38 661438 11/16/2015 cis-1,2-DCE 0.75 µg/L 0.50 µg/L 6, pp. 1082, 1435;
13, p. 81; 25, p. 1 PCE 9.2 µg/L 1.0 µg/L
RPW-40 661443 11/18/2015 cis-1,2-DCE 1.2 µg/L 0.50 µg/L 6, pp. 1088, 1089,
1435; 13, p. 84; 25, p. 1
PCE 16 µg/L 1.0 µg/L TCE 0.61 µg/L 0.50 µg/L
Notes: DCE Dichloroethene Conc. Concentration ID Identification LOQ Limit of quantitation µg/L Micrograms per liter No. Number PCE Tetrachloroethene PW Private potable well RPW Private potable well TCE Trichloroethene U Analyte concentration not above detection level (Ref. 6, p. 137).
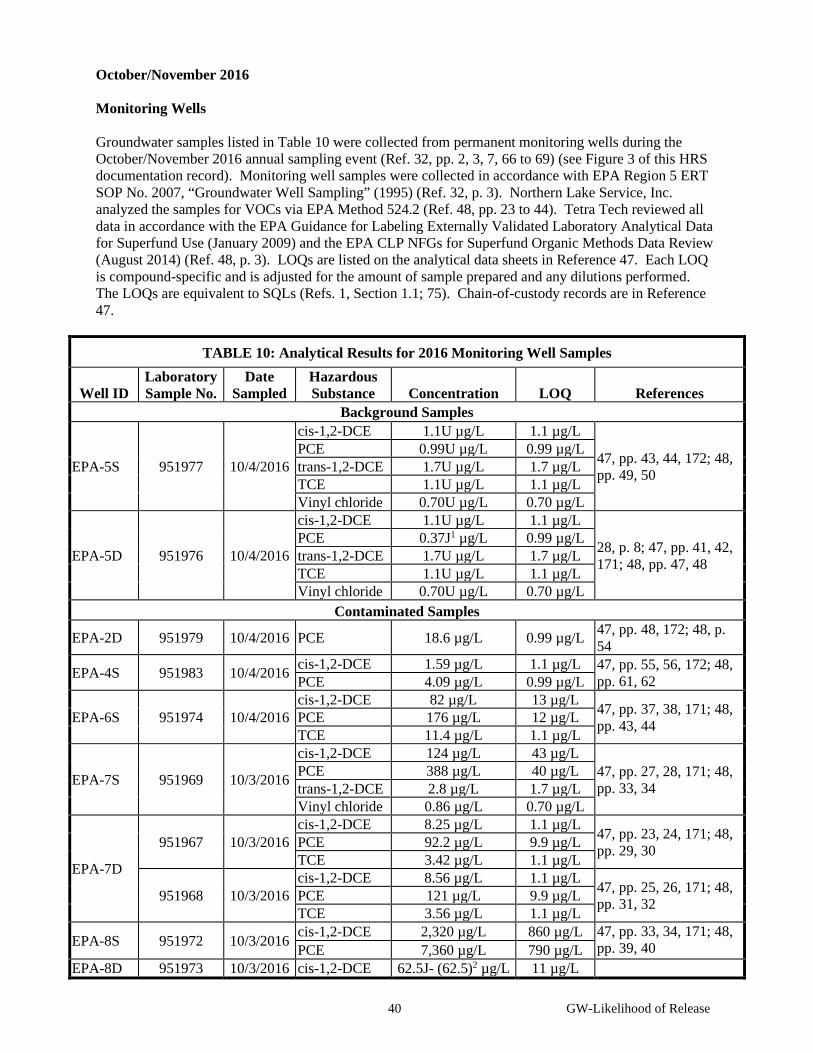
40 GW-Likelihood of Release
October/November 2016 Monitoring Wells Groundwater samples listed in Table 10 were collected from permanent monitoring wells during the October/November 2016 annual sampling event (Ref. 32, pp. 2, 3, 7, 66 to 69) (see Figure 3 of this HRS documentation record). Monitoring well samples were collected in accordance with EPA Region 5 ERT SOP No. 2007, “Groundwater Well Sampling” (1995) (Ref. 32, p. 3). Northern Lake Service, Inc. analyzed the samples for VOCs via EPA Method 524.2 (Ref. 48, pp. 23 to 44). Tetra Tech reviewed all data in accordance with the EPA Guidance for Labeling Externally Validated Laboratory Analytical Data for Superfund Use (January 2009) and the EPA CLP NFGs for Superfund Organic Methods Data Review (August 2014) (Ref. 48, p. 3). LOQs are listed on the analytical data sheets in Reference 47. Each LOQ is compound-specific and is adjusted for the amount of sample prepared and any dilutions performed. The LOQs are equivalent to SQLs (Refs. 1, Section 1.1; 75). Chain-of-custody records are in Reference 47.
TABLE 10: Analytical Results for 2016 Monitoring Well Samples
Well ID Laboratory Sample No.
Date Sampled
Hazardous Substance Concentration LOQ References
Background Samples
EPA-5S 951977 10/4/2016
cis-1,2-DCE 1.1U µg/L 1.1 µg/L
47, pp. 43, 44, 172; 48, pp. 49, 50
PCE 0.99U µg/L 0.99 µg/L trans-1,2-DCE 1.7U µg/L 1.7 µg/L TCE 1.1U µg/L 1.1 µg/L Vinyl chloride 0.70U µg/L 0.70 µg/L
EPA-5D 951976 10/4/2016
cis-1,2-DCE 1.1U µg/L 1.1 µg/L
28, p. 8; 47, pp. 41, 42, 171; 48, pp. 47, 48
PCE 0.37J1 µg/L 0.99 µg/L trans-1,2-DCE 1.7U µg/L 1.7 µg/L TCE 1.1U µg/L 1.1 µg/L Vinyl chloride 0.70U µg/L 0.70 µg/L
Contaminated Samples
EPA-2D 951979 10/4/2016 PCE 18.6 µg/L 0.99 µg/L 47, pp. 48, 172; 48, p. 54
EPA-4S 951983 10/4/2016 cis-1,2-DCE 1.59 µg/L 1.1 µg/L 47, pp. 55, 56, 172; 48, pp. 61, 62 PCE 4.09 µg/L 0.99 µg/L
EPA-6S 951974 10/4/2016 cis-1,2-DCE 82 µg/L 13 µg/L 47, pp. 37, 38, 171; 48,
pp. 43, 44 PCE 176 µg/L 12 µg/L TCE 11.4 µg/L 1.1 µg/L
EPA-7S 951969 10/3/2016
cis-1,2-DCE 124 µg/L 43 µg/L 47, pp. 27, 28, 171; 48, pp. 33, 34
PCE 388 µg/L 40 µg/L trans-1,2-DCE 2.8 µg/L 1.7 µg/L Vinyl chloride 0.86 µg/L 0.70 µg/L
EPA-7D
951967 10/3/2016 cis-1,2-DCE 8.25 µg/L 1.1 µg/L 47, pp. 23, 24, 171; 48,
pp. 29, 30 PCE 92.2 µg/L 9.9 µg/L TCE 3.42 µg/L 1.1 µg/L
951968 10/3/2016 cis-1,2-DCE 8.56 µg/L 1.1 µg/L 47, pp. 25, 26, 171; 48,
pp. 31, 32 PCE 121 µg/L 9.9 µg/L TCE 3.56 µg/L 1.1 µg/L
EPA-8S 951972 10/3/2016 cis-1,2-DCE 2,320 µg/L 860 µg/L 47, pp. 33, 34, 171; 48, pp. 39, 40 PCE 7,360 µg/L 790 µg/L
EPA-8D 951973 10/3/2016 cis-1,2-DCE 62.5J- (62.5)2 µg/L 11 µg/L
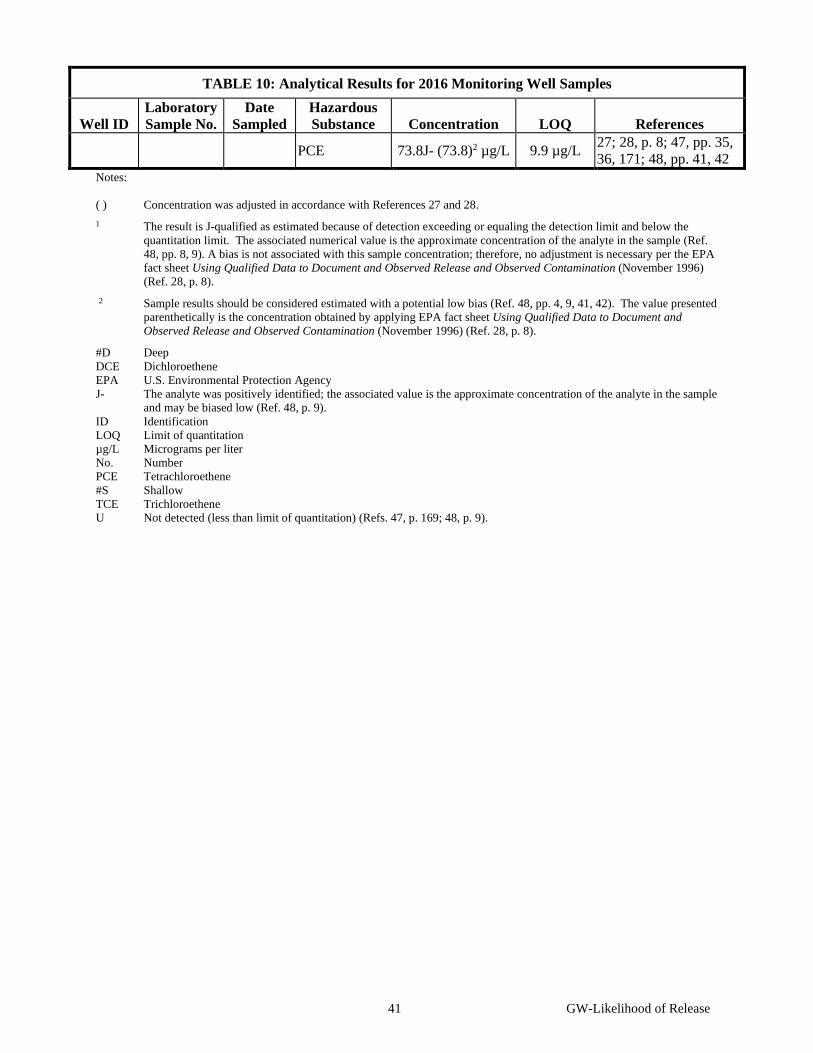
41 GW-Likelihood of Release
TABLE 10: Analytical Results for 2016 Monitoring Well Samples
Well ID Laboratory Sample No.
Date Sampled
Hazardous Substance Concentration LOQ References
PCE 73.8J- (73.8)2 µg/L 9.9 µg/L 27; 28, p. 8; 47, pp. 35, 36, 171; 48, pp. 41, 42
Notes: ( ) Concentration was adjusted in accordance with References 27 and 28.
1 The result is J-qualified as estimated because of detection exceeding or equaling the detection limit and below the quantitation limit. The associated numerical value is the approximate concentration of the analyte in the sample (Ref. 48, pp. 8, 9). A bias is not associated with this sample concentration; therefore, no adjustment is necessary per the EPA fact sheet Using Qualified Data to Document and Observed Release and Observed Contamination (November 1996) (Ref. 28, p. 8).
2 Sample results should be considered estimated with a potential low bias (Ref. 48, pp. 4, 9, 41, 42). The value presented parenthetically is the concentration obtained by applying EPA fact sheet Using Qualified Data to Document and Observed Release and Observed Contamination (November 1996) (Ref. 28, p. 8).
#D Deep DCE Dichloroethene EPA U.S. Environmental Protection Agency J- The analyte was positively identified; the associated value is the approximate concentration of the analyte in the sample
and may be biased low (Ref. 48, p. 9). ID Identification LOQ Limit of quantitation µg/L Micrograms per liter No. Number PCE Tetrachloroethene #S Shallow TCE Trichloroethene U Not detected (less than limit of quantitation) (Refs. 47, p. 169; 48, p. 9).
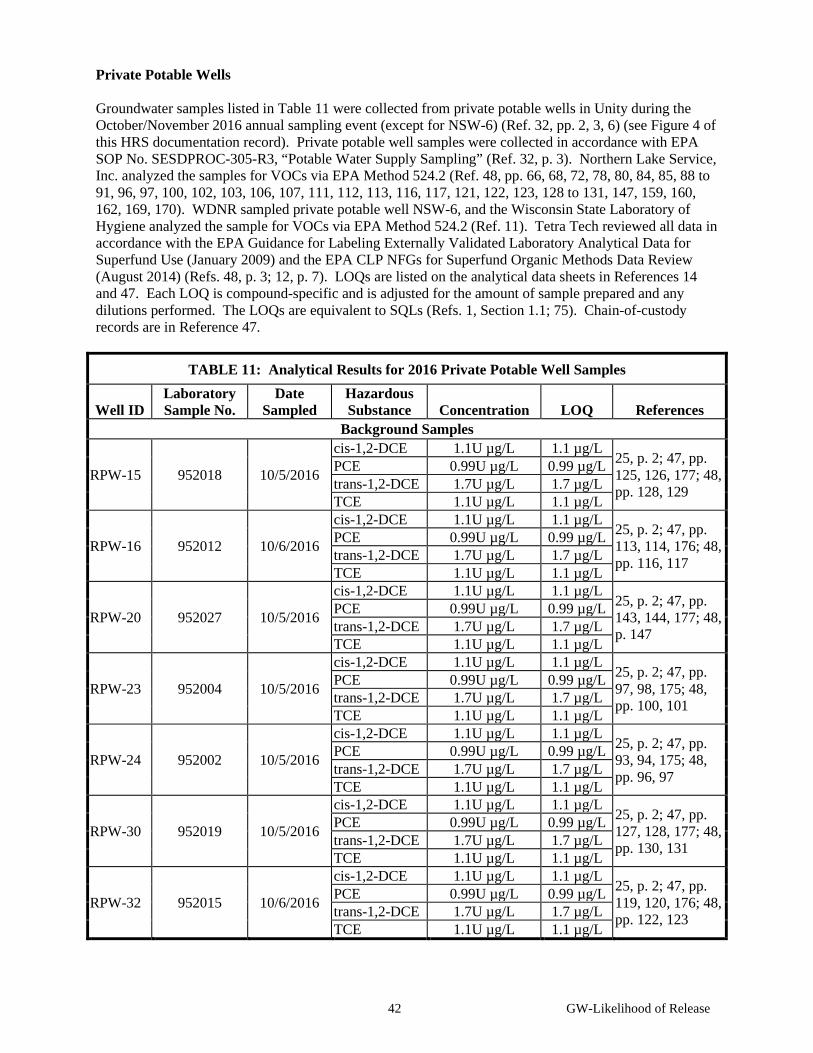
42 GW-Likelihood of Release
Private Potable Wells Groundwater samples listed in Table 11 were collected from private potable wells in Unity during the October/November 2016 annual sampling event (except for NSW-6) (Ref. 32, pp. 2, 3, 6) (see Figure 4 of this HRS documentation record). Private potable well samples were collected in accordance with EPA SOP No. SESDPROC-305-R3, “Potable Water Supply Sampling” (Ref. 32, p. 3). Northern Lake Service, Inc. analyzed the samples for VOCs via EPA Method 524.2 (Ref. 48, pp. 66, 68, 72, 78, 80, 84, 85, 88 to 91, 96, 97, 100, 102, 103, 106, 107, 111, 112, 113, 116, 117, 121, 122, 123, 128 to 131, 147, 159, 160, 162, 169, 170). WDNR sampled private potable well NSW-6, and the Wisconsin State Laboratory of Hygiene analyzed the sample for VOCs via EPA Method 524.2 (Ref. 11). Tetra Tech reviewed all data in accordance with the EPA Guidance for Labeling Externally Validated Laboratory Analytical Data for Superfund Use (January 2009) and the EPA CLP NFGs for Superfund Organic Methods Data Review (August 2014) (Refs. 48, p. 3; 12, p. 7). LOQs are listed on the analytical data sheets in References 14 and 47. Each LOQ is compound-specific and is adjusted for the amount of sample prepared and any dilutions performed. The LOQs are equivalent to SQLs (Refs. 1, Section 1.1; 75). Chain-of-custody records are in Reference 47.
TABLE 11: Analytical Results for 2016 Private Potable Well Samples
Well ID Laboratory Sample No.
Date Sampled
Hazardous Substance Concentration LOQ References
Background Samples
RPW-15 952018 10/5/2016
cis-1,2-DCE 1.1U µg/L 1.1 µg/L 25, p. 2; 47, pp. 125, 126, 177; 48, pp. 128, 129
PCE 0.99U µg/L 0.99 µg/L trans-1,2-DCE 1.7U µg/L 1.7 µg/L TCE 1.1U µg/L 1.1 µg/L
RPW-16 952012 10/6/2016
cis-1,2-DCE 1.1U µg/L 1.1 µg/L 25, p. 2; 47, pp. 113, 114, 176; 48, pp. 116, 117
PCE 0.99U µg/L 0.99 µg/L trans-1,2-DCE 1.7U µg/L 1.7 µg/L TCE 1.1U µg/L 1.1 µg/L
RPW-20 952027 10/5/2016
cis-1,2-DCE 1.1U µg/L 1.1 µg/L 25, p. 2; 47, pp. 143, 144, 177; 48, p. 147
PCE 0.99U µg/L 0.99 µg/L trans-1,2-DCE 1.7U µg/L 1.7 µg/L TCE 1.1U µg/L 1.1 µg/L
RPW-23 952004 10/5/2016
cis-1,2-DCE 1.1U µg/L 1.1 µg/L 25, p. 2; 47, pp. 97, 98, 175; 48, pp. 100, 101
PCE 0.99U µg/L 0.99 µg/L trans-1,2-DCE 1.7U µg/L 1.7 µg/L TCE 1.1U µg/L 1.1 µg/L
RPW-24 952002 10/5/2016
cis-1,2-DCE 1.1U µg/L 1.1 µg/L 25, p. 2; 47, pp. 93, 94, 175; 48, pp. 96, 97
PCE 0.99U µg/L 0.99 µg/L trans-1,2-DCE 1.7U µg/L 1.7 µg/L TCE 1.1U µg/L 1.1 µg/L
RPW-30 952019 10/5/2016
cis-1,2-DCE 1.1U µg/L 1.1 µg/L 25, p. 2; 47, pp. 127, 128, 177; 48, pp. 130, 131
PCE 0.99U µg/L 0.99 µg/L trans-1,2-DCE 1.7U µg/L 1.7 µg/L TCE 1.1U µg/L 1.1 µg/L
RPW-32 952015 10/6/2016
cis-1,2-DCE 1.1U µg/L 1.1 µg/L 25, p. 2; 47, pp. 119, 120, 176; 48, pp. 122, 123
PCE 0.99U µg/L 0.99 µg/L trans-1,2-DCE 1.7U µg/L 1.7 µg/L TCE 1.1U µg/L 1.1 µg/L
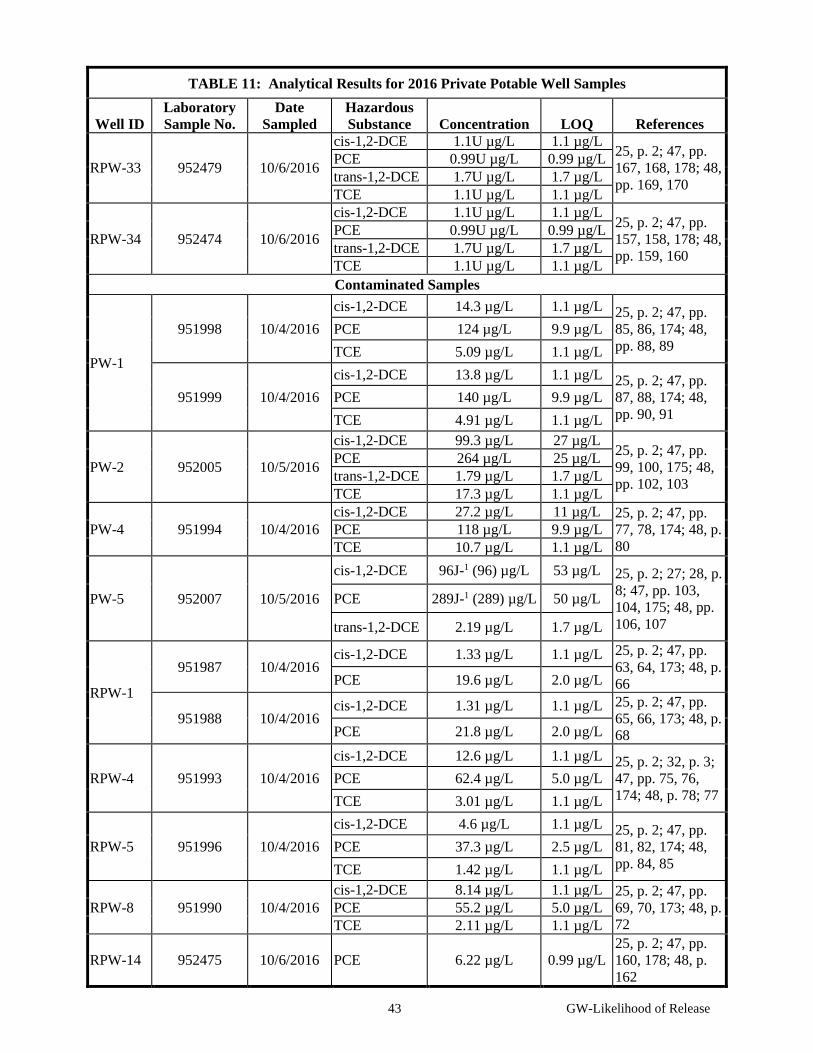
43 GW-Likelihood of Release
TABLE 11: Analytical Results for 2016 Private Potable Well Samples
Well ID Laboratory Sample No.
Date Sampled
Hazardous Substance Concentration LOQ References
RPW-33 952479 10/6/2016
cis-1,2-DCE 1.1U µg/L 1.1 µg/L 25, p. 2; 47, pp. 167, 168, 178; 48, pp. 169, 170
PCE 0.99U µg/L 0.99 µg/L trans-1,2-DCE 1.7U µg/L 1.7 µg/L TCE 1.1U µg/L 1.1 µg/L
RPW-34 952474 10/6/2016
cis-1,2-DCE 1.1U µg/L 1.1 µg/L 25, p. 2; 47, pp. 157, 158, 178; 48, pp. 159, 160
PCE 0.99U µg/L 0.99 µg/L trans-1,2-DCE 1.7U µg/L 1.7 µg/L TCE 1.1U µg/L 1.1 µg/L Contaminated Samples
PW-1
951998 10/4/2016 cis-1,2-DCE 14.3 µg/L 1.1 µg/L 25, p. 2; 47, pp.
85, 86, 174; 48, pp. 88, 89
PCE 124 µg/L 9.9 µg/L TCE 5.09 µg/L 1.1 µg/L
951999 10/4/2016 cis-1,2-DCE 13.8 µg/L 1.1 µg/L 25, p. 2; 47, pp.
87, 88, 174; 48, pp. 90, 91
PCE 140 µg/L 9.9 µg/L TCE 4.91 µg/L 1.1 µg/L
PW-2 952005 10/5/2016
cis-1,2-DCE 99.3 µg/L 27 µg/L 25, p. 2; 47, pp. 99, 100, 175; 48, pp. 102, 103
PCE 264 µg/L 25 µg/L trans-1,2-DCE 1.79 µg/L 1.7 µg/L TCE 17.3 µg/L 1.1 µg/L
PW-4 951994 10/4/2016 cis-1,2-DCE 27.2 µg/L 11 µg/L 25, p. 2; 47, pp.
77, 78, 174; 48, p. 80
PCE 118 µg/L 9.9 µg/L TCE 10.7 µg/L 1.1 µg/L
PW-5 952007 10/5/2016
cis-1,2-DCE 96J-1 (96) µg/L 53 µg/L 25, p. 2; 27; 28, p. 8; 47, pp. 103, 104, 175; 48, pp. 106, 107
PCE 289J-1 (289) µg/L 50 µg/L
trans-1,2-DCE 2.19 µg/L 1.7 µg/L
RPW-1
951987 10/4/2016 cis-1,2-DCE 1.33 µg/L 1.1 µg/L 25, p. 2; 47, pp.
63, 64, 173; 48, p. 66 PCE 19.6 µg/L 2.0 µg/L
951988 10/4/2016 cis-1,2-DCE 1.31 µg/L 1.1 µg/L 25, p. 2; 47, pp.
65, 66, 173; 48, p. 68 PCE 21.8 µg/L 2.0 µg/L
RPW-4 951993 10/4/2016 cis-1,2-DCE 12.6 µg/L 1.1 µg/L 25, p. 2; 32, p. 3;
47, pp. 75, 76, 174; 48, p. 78; 77
PCE 62.4 µg/L 5.0 µg/L TCE 3.01 µg/L 1.1 µg/L
RPW-5 951996 10/4/2016 cis-1,2-DCE 4.6 µg/L 1.1 µg/L 25, p. 2; 47, pp.
81, 82, 174; 48, pp. 84, 85
PCE 37.3 µg/L 2.5 µg/L TCE 1.42 µg/L 1.1 µg/L
RPW-8 951990 10/4/2016 cis-1,2-DCE 8.14 µg/L 1.1 µg/L 25, p. 2; 47, pp.
69, 70, 173; 48, p. 72
PCE 55.2 µg/L 5.0 µg/L TCE 2.11 µg/L 1.1 µg/L
RPW-14 952475 10/6/2016 PCE 6.22 µg/L 0.99 µg/L 25, p. 2; 47, pp. 160, 178; 48, p. 162
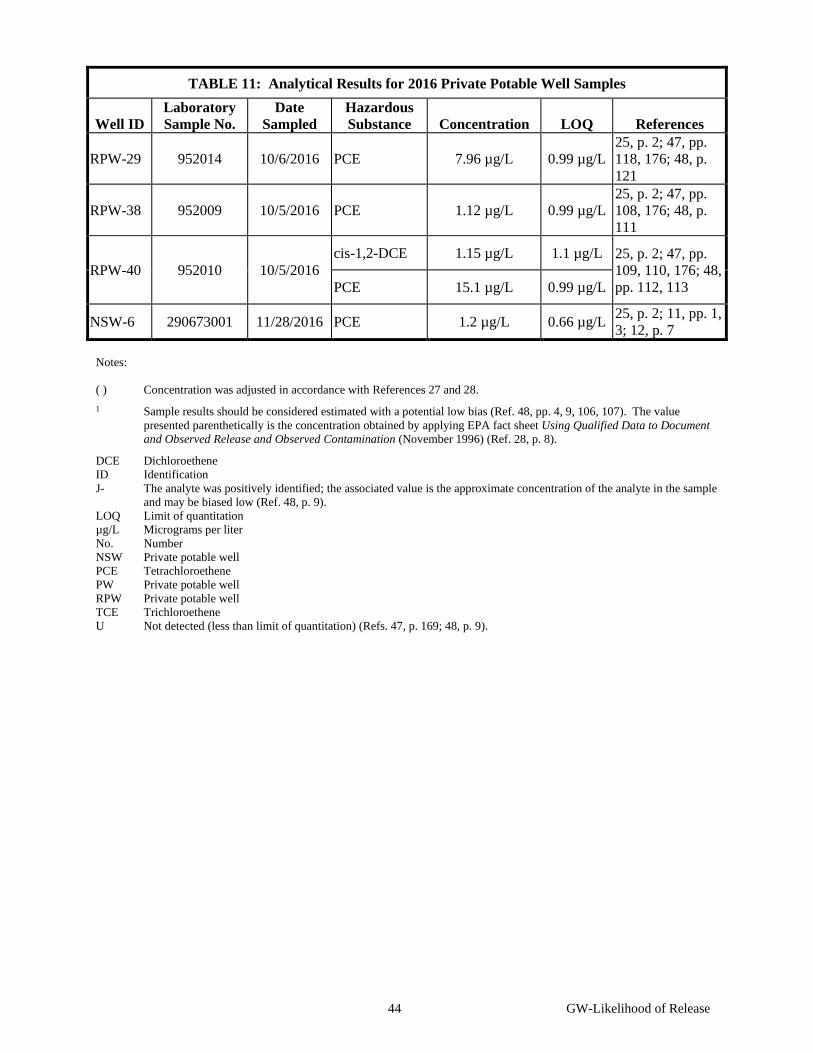
44 GW-Likelihood of Release
TABLE 11: Analytical Results for 2016 Private Potable Well Samples
Well ID Laboratory Sample No.
Date Sampled
Hazardous Substance Concentration LOQ References
RPW-29 952014 10/6/2016 PCE 7.96 µg/L 0.99 µg/L 25, p. 2; 47, pp. 118, 176; 48, p. 121
RPW-38 952009 10/5/2016 PCE 1.12 µg/L 0.99 µg/L 25, p. 2; 47, pp. 108, 176; 48, p. 111
RPW-40 952010 10/5/2016 cis-1,2-DCE 1.15 µg/L 1.1 µg/L 25, p. 2; 47, pp.
109, 110, 176; 48, pp. 112, 113 PCE 15.1 µg/L 0.99 µg/L
NSW-6 290673001 11/28/2016 PCE 1.2 µg/L 0.66 µg/L 25, p. 2; 11, pp. 1, 3; 12, p. 7
Notes: ( ) Concentration was adjusted in accordance with References 27 and 28. 1 Sample results should be considered estimated with a potential low bias (Ref. 48, pp. 4, 9, 106, 107). The value
presented parenthetically is the concentration obtained by applying EPA fact sheet Using Qualified Data to Document and Observed Release and Observed Contamination (November 1996) (Ref. 28, p. 8).
DCE Dichloroethene ID Identification J- The analyte was positively identified; the associated value is the approximate concentration of the analyte in the sample
and may be biased low (Ref. 48, p. 9). LOQ Limit of quantitation µg/L Micrograms per liter No. Number NSW Private potable well PCE Tetrachloroethene PW Private potable well RPW Private potable well TCE Trichloroethene U Not detected (less than limit of quantitation) (Refs. 47, p. 169; 48, p. 9).
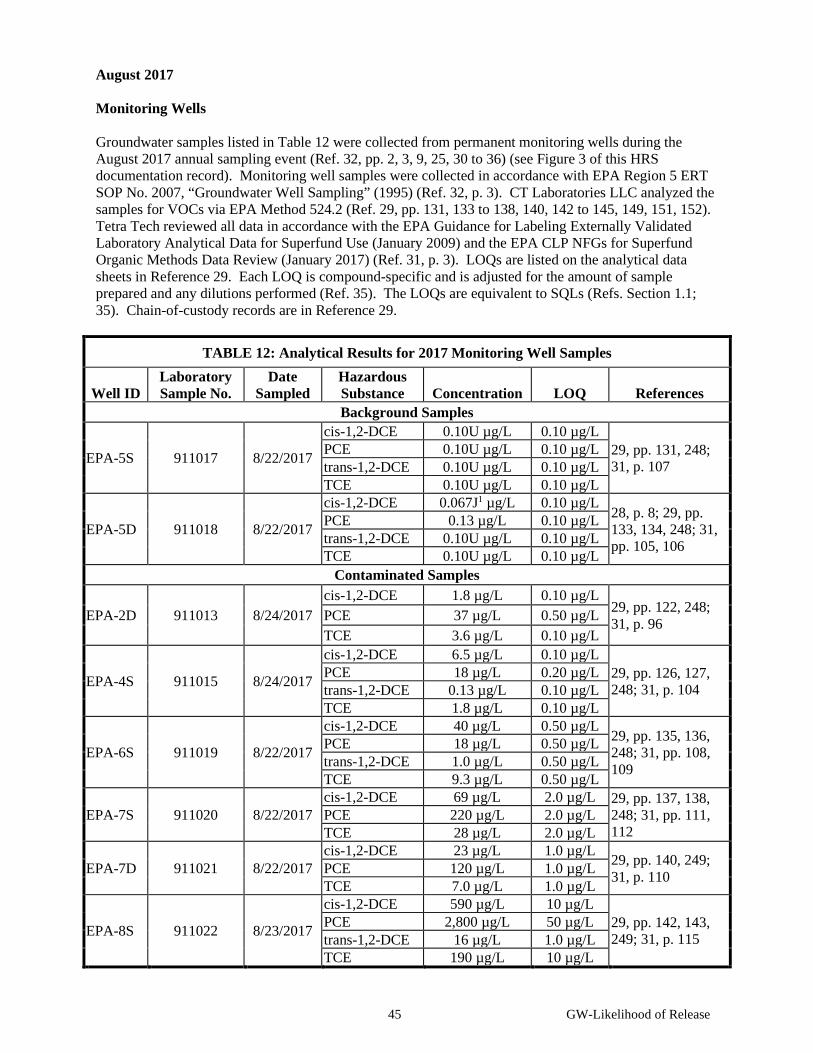
45 GW-Likelihood of Release
August 2017 Monitoring Wells Groundwater samples listed in Table 12 were collected from permanent monitoring wells during the August 2017 annual sampling event (Ref. 32, pp. 2, 3, 9, 25, 30 to 36) (see Figure 3 of this HRS documentation record). Monitoring well samples were collected in accordance with EPA Region 5 ERT SOP No. 2007, “Groundwater Well Sampling” (1995) (Ref. 32, p. 3). CT Laboratories LLC analyzed the samples for VOCs via EPA Method 524.2 (Ref. 29, pp. 131, 133 to 138, 140, 142 to 145, 149, 151, 152). Tetra Tech reviewed all data in accordance with the EPA Guidance for Labeling Externally Validated Laboratory Analytical Data for Superfund Use (January 2009) and the EPA CLP NFGs for Superfund Organic Methods Data Review (January 2017) (Ref. 31, p. 3). LOQs are listed on the analytical data sheets in Reference 29. Each LOQ is compound-specific and is adjusted for the amount of sample prepared and any dilutions performed (Ref. 35). The LOQs are equivalent to SQLs (Refs. Section 1.1; 35). Chain-of-custody records are in Reference 29.
TABLE 12: Analytical Results for 2017 Monitoring Well Samples
Well ID Laboratory Sample No.
Date Sampled
Hazardous Substance Concentration LOQ References Background Samples
EPA-5S 911017 8/22/2017
cis-1,2-DCE 0.10U µg/L 0.10 µg/L 29, pp. 131, 248; 31, p. 107
PCE 0.10U µg/L 0.10 µg/L trans-1,2-DCE 0.10U µg/L 0.10 µg/L TCE 0.10U µg/L 0.10 µg/L
EPA-5D 911018 8/22/2017
cis-1,2-DCE 0.067J1 µg/L 0.10 µg/L 28, p. 8; 29, pp. 133, 134, 248; 31, pp. 105, 106
PCE 0.13 µg/L 0.10 µg/L trans-1,2-DCE 0.10U µg/L 0.10 µg/L TCE 0.10U µg/L 0.10 µg/L
Contaminated Samples
EPA-2D 911013 8/24/2017 cis-1,2-DCE 1.8 µg/L 0.10 µg/L
29, pp. 122, 248; 31, p. 96 PCE 37 µg/L 0.50 µg/L
TCE 3.6 µg/L 0.10 µg/L
EPA-4S 911015 8/24/2017
cis-1,2-DCE 6.5 µg/L 0.10 µg/L 29, pp. 126, 127, 248; 31, p. 104
PCE 18 µg/L 0.20 µg/L trans-1,2-DCE 0.13 µg/L 0.10 µg/L TCE 1.8 µg/L 0.10 µg/L
EPA-6S 911019 8/22/2017
cis-1,2-DCE 40 µg/L 0.50 µg/L 29, pp. 135, 136, 248; 31, pp. 108, 109
PCE 18 µg/L 0.50 µg/L trans-1,2-DCE 1.0 µg/L 0.50 µg/L TCE 9.3 µg/L 0.50 µg/L
EPA-7S 911020 8/22/2017 cis-1,2-DCE 69 µg/L 2.0 µg/L 29, pp. 137, 138,
248; 31, pp. 111, 112
PCE 220 µg/L 2.0 µg/L TCE 28 µg/L 2.0 µg/L
EPA-7D 911021 8/22/2017 cis-1,2-DCE 23 µg/L 1.0 µg/L 29, pp. 140, 249;
31, p. 110 PCE 120 µg/L 1.0 µg/L TCE 7.0 µg/L 1.0 µg/L
EPA-8S 911022 8/23/2017
cis-1,2-DCE 590 µg/L 10 µg/L 29, pp. 142, 143, 249; 31, p. 115
PCE 2,800 µg/L 50 µg/L trans-1,2-DCE 16 µg/L 1.0 µg/L TCE 190 µg/L 10 µg/L
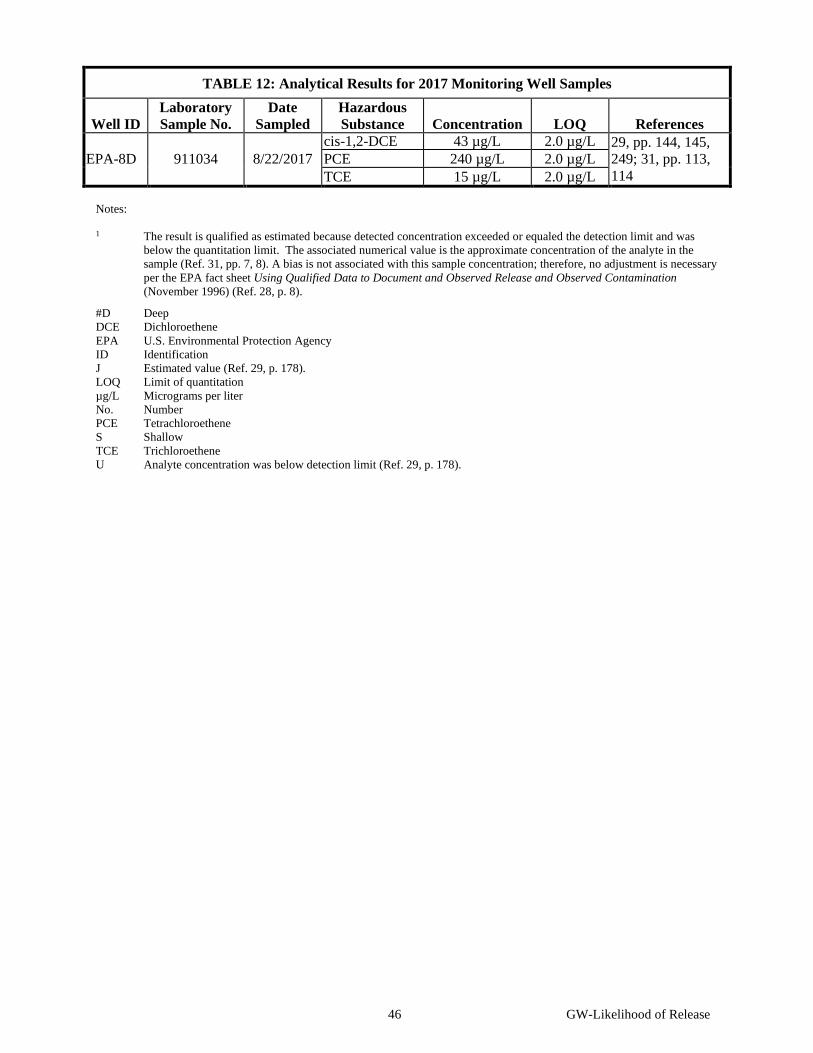
46 GW-Likelihood of Release
TABLE 12: Analytical Results for 2017 Monitoring Well Samples
Well ID Laboratory Sample No.
Date Sampled
Hazardous Substance Concentration LOQ References
EPA-8D 911034 8/22/2017 cis-1,2-DCE 43 µg/L 2.0 µg/L 29, pp. 144, 145,
249; 31, pp. 113, 114
PCE 240 µg/L 2.0 µg/L TCE 15 µg/L 2.0 µg/L
Notes: 1 The result is qualified as estimated because detected concentration exceeded or equaled the detection limit and was
below the quantitation limit. The associated numerical value is the approximate concentration of the analyte in the sample (Ref. 31, pp. 7, 8). A bias is not associated with this sample concentration; therefore, no adjustment is necessary per the EPA fact sheet Using Qualified Data to Document and Observed Release and Observed Contamination (November 1996) (Ref. 28, p. 8).
#D Deep DCE Dichloroethene EPA U.S. Environmental Protection Agency ID Identification J Estimated value (Ref. 29, p. 178). LOQ Limit of quantitation µg/L Micrograms per liter No. Number PCE Tetrachloroethene S Shallow TCE Trichloroethene U Analyte concentration was below detection limit (Ref. 29, p. 178).
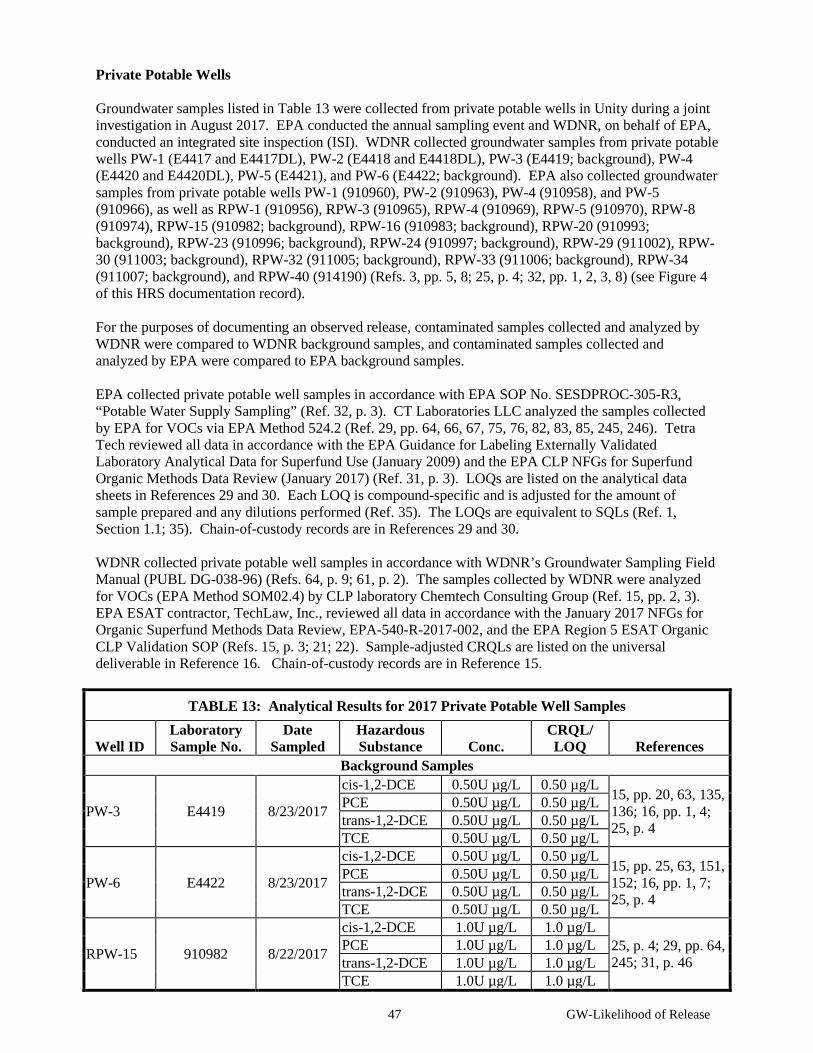
47 GW-Likelihood of Release
Private Potable Wells Groundwater samples listed in Table 13 were collected from private potable wells in Unity during a joint investigation in August 2017. EPA conducted the annual sampling event and WDNR, on behalf of EPA, conducted an integrated site inspection (ISI). WDNR collected groundwater samples from private potable wells PW-1 (E4417 and E4417DL), PW-2 (E4418 and E4418DL), PW-3 (E4419; background), PW-4 (E4420 and E4420DL), PW-5 (E4421), and PW-6 (E4422; background). EPA also collected groundwater samples from private potable wells PW-1 (910960), PW-2 (910963), PW-4 (910958), and PW-5 (910966), as well as RPW-1 (910956), RPW-3 (910965), RPW-4 (910969), RPW-5 (910970), RPW-8 (910974), RPW-15 (910982; background), RPW-16 (910983; background), RPW-20 (910993; background), RPW-23 (910996; background), RPW-24 (910997; background), RPW-29 (911002), RPW-30 (911003; background), RPW-32 (911005; background), RPW-33 (911006; background), RPW-34 (911007; background), and RPW-40 (914190) (Refs. 3, pp. 5, 8; 25, p. 4; 32, pp. 1, 2, 3, 8) (see Figure 4 of this HRS documentation record). For the purposes of documenting an observed release, contaminated samples collected and analyzed by WDNR were compared to WDNR background samples, and contaminated samples collected and analyzed by EPA were compared to EPA background samples. EPA collected private potable well samples in accordance with EPA SOP No. SESDPROC-305-R3, “Potable Water Supply Sampling” (Ref. 32, p. 3). CT Laboratories LLC analyzed the samples collected by EPA for VOCs via EPA Method 524.2 (Ref. 29, pp. 64, 66, 67, 75, 76, 82, 83, 85, 245, 246). Tetra Tech reviewed all data in accordance with the EPA Guidance for Labeling Externally Validated Laboratory Analytical Data for Superfund Use (January 2009) and the EPA CLP NFGs for Superfund Organic Methods Data Review (January 2017) (Ref. 31, p. 3). LOQs are listed on the analytical data sheets in References 29 and 30. Each LOQ is compound-specific and is adjusted for the amount of sample prepared and any dilutions performed (Ref. 35). The LOQs are equivalent to SQLs (Ref. 1, Section 1.1; 35). Chain-of-custody records are in References 29 and 30. WDNR collected private potable well samples in accordance with WDNR’s Groundwater Sampling Field Manual (PUBL DG-038-96) (Refs. 64, p. 9; 61, p. 2). The samples collected by WDNR were analyzed for VOCs (EPA Method SOM02.4) by CLP laboratory Chemtech Consulting Group (Ref. 15, pp. 2, 3). EPA ESAT contractor, TechLaw, Inc., reviewed all data in accordance with the January 2017 NFGs for Organic Superfund Methods Data Review, EPA-540-R-2017-002, and the EPA Region 5 ESAT Organic CLP Validation SOP (Refs. 15, p. 3; 21; 22). Sample-adjusted CRQLs are listed on the universal deliverable in Reference 16. Chain-of-custody records are in Reference 15.
TABLE 13: Analytical Results for 2017 Private Potable Well Samples
Well ID Laboratory Sample No.
Date Sampled
Hazardous Substance Conc.
CRQL/ LOQ References
Background Samples
PW-3 E4419 8/23/2017
cis-1,2-DCE 0.50U µg/L 0.50 µg/L 15, pp. 20, 63, 135, 136; 16, pp. 1, 4; 25, p. 4
PCE 0.50U µg/L 0.50 µg/L trans-1,2-DCE 0.50U µg/L 0.50 µg/L TCE 0.50U µg/L 0.50 µg/L
PW-6 E4422 8/23/2017
cis-1,2-DCE 0.50U µg/L 0.50 µg/L 15, pp. 25, 63, 151, 152; 16, pp. 1, 7; 25, p. 4
PCE 0.50U µg/L 0.50 µg/L trans-1,2-DCE 0.50U µg/L 0.50 µg/L TCE 0.50U µg/L 0.50 µg/L
RPW-15 910982 8/22/2017
cis-1,2-DCE 1.0U µg/L 1.0 µg/L 25, p. 4; 29, pp. 64, 245; 31, p. 46
PCE 1.0U µg/L 1.0 µg/L trans-1,2-DCE 1.0U µg/L 1.0 µg/L TCE 1.0U µg/L 1.0 µg/L
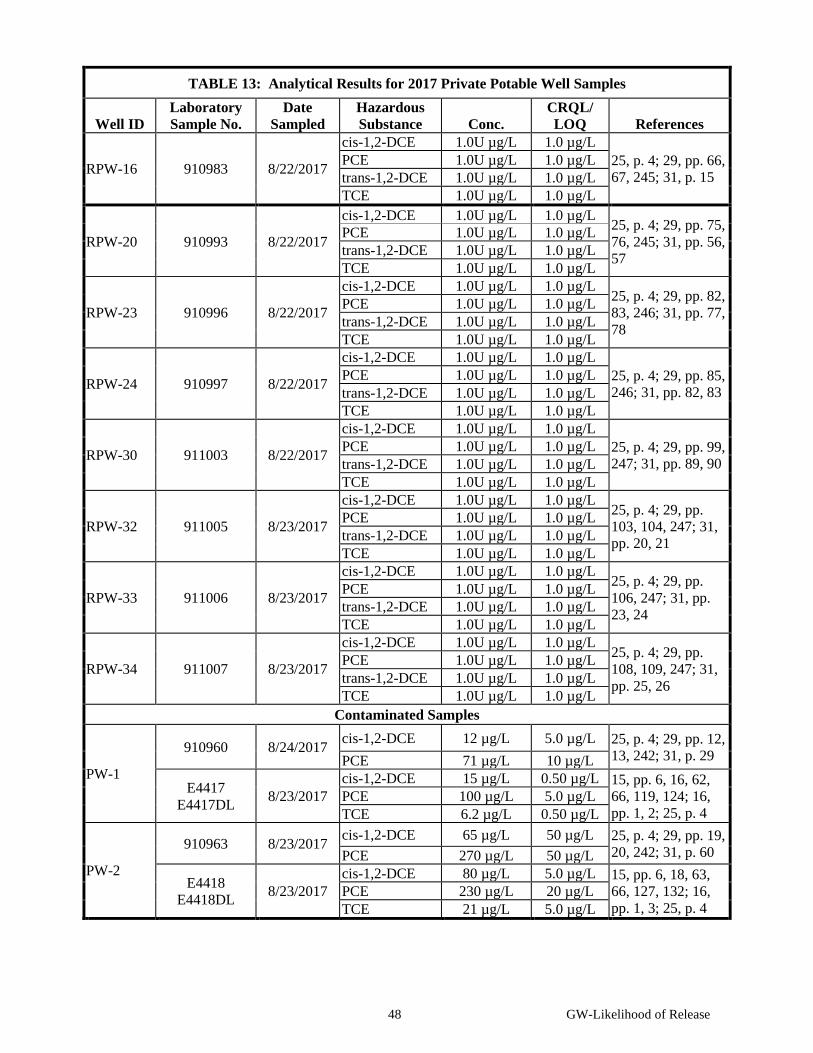
48 GW-Likelihood of Release
TABLE 13: Analytical Results for 2017 Private Potable Well Samples
Well ID Laboratory Sample No.
Date Sampled
Hazardous Substance Conc.
CRQL/ LOQ References
RPW-16 910983 8/22/2017
cis-1,2-DCE 1.0U µg/L 1.0 µg/L 25, p. 4; 29, pp. 66, 67, 245; 31, p. 15
PCE 1.0U µg/L 1.0 µg/L trans-1,2-DCE 1.0U µg/L 1.0 µg/L TCE 1.0U µg/L 1.0 µg/L
RPW-20 910993 8/22/2017
cis-1,2-DCE 1.0U µg/L 1.0 µg/L 25, p. 4; 29, pp. 75, 76, 245; 31, pp. 56, 57
PCE 1.0U µg/L 1.0 µg/L trans-1,2-DCE 1.0U µg/L 1.0 µg/L TCE 1.0U µg/L 1.0 µg/L
RPW-23 910996 8/22/2017
cis-1,2-DCE 1.0U µg/L 1.0 µg/L 25, p. 4; 29, pp. 82, 83, 246; 31, pp. 77, 78
PCE 1.0U µg/L 1.0 µg/L trans-1,2-DCE 1.0U µg/L 1.0 µg/L TCE 1.0U µg/L 1.0 µg/L
RPW-24 910997 8/22/2017
cis-1,2-DCE 1.0U µg/L 1.0 µg/L 25, p. 4; 29, pp. 85, 246; 31, pp. 82, 83
PCE 1.0U µg/L 1.0 µg/L trans-1,2-DCE 1.0U µg/L 1.0 µg/L TCE 1.0U µg/L 1.0 µg/L
RPW-30 911003 8/22/2017
cis-1,2-DCE 1.0U µg/L 1.0 µg/L 25, p. 4; 29, pp. 99, 247; 31, pp. 89, 90
PCE 1.0U µg/L 1.0 µg/L trans-1,2-DCE 1.0U µg/L 1.0 µg/L TCE 1.0U µg/L 1.0 µg/L
RPW-32 911005 8/23/2017
cis-1,2-DCE 1.0U µg/L 1.0 µg/L 25, p. 4; 29, pp. 103, 104, 247; 31, pp. 20, 21
PCE 1.0U µg/L 1.0 µg/L trans-1,2-DCE 1.0U µg/L 1.0 µg/L TCE 1.0U µg/L 1.0 µg/L
RPW-33 911006 8/23/2017
cis-1,2-DCE 1.0U µg/L 1.0 µg/L 25, p. 4; 29, pp. 106, 247; 31, pp. 23, 24
PCE 1.0U µg/L 1.0 µg/L trans-1,2-DCE 1.0U µg/L 1.0 µg/L TCE 1.0U µg/L 1.0 µg/L
RPW-34 911007 8/23/2017
cis-1,2-DCE 1.0U µg/L 1.0 µg/L 25, p. 4; 29, pp. 108, 109, 247; 31, pp. 25, 26
PCE 1.0U µg/L 1.0 µg/L trans-1,2-DCE 1.0U µg/L 1.0 µg/L TCE 1.0U µg/L 1.0 µg/L
Contaminated Samples
PW-1
910960 8/24/2017 cis-1,2-DCE 12 µg/L 5.0 µg/L 25, p. 4; 29, pp. 12, 13, 242; 31, p. 29 PCE 71 µg/L 10 µg/L
E4417 E4417DL 8/23/2017
cis-1,2-DCE 15 µg/L 0.50 µg/L 15, pp. 6, 16, 62, 66, 119, 124; 16, pp. 1, 2; 25, p. 4
PCE 100 µg/L 5.0 µg/L TCE 6.2 µg/L 0.50 µg/L
PW-2
910963 8/23/2017 cis-1,2-DCE 65 µg/L 50 µg/L 25, p. 4; 29, pp. 19, 20, 242; 31, p. 60 PCE 270 µg/L 50 µg/L
E4418 E4418DL 8/23/2017
cis-1,2-DCE 80 µg/L 5.0 µg/L 15, pp. 6, 18, 63, 66, 127, 132; 16, pp. 1, 3; 25, p. 4
PCE 230 µg/L 20 µg/L TCE 21 µg/L 5.0 µg/L
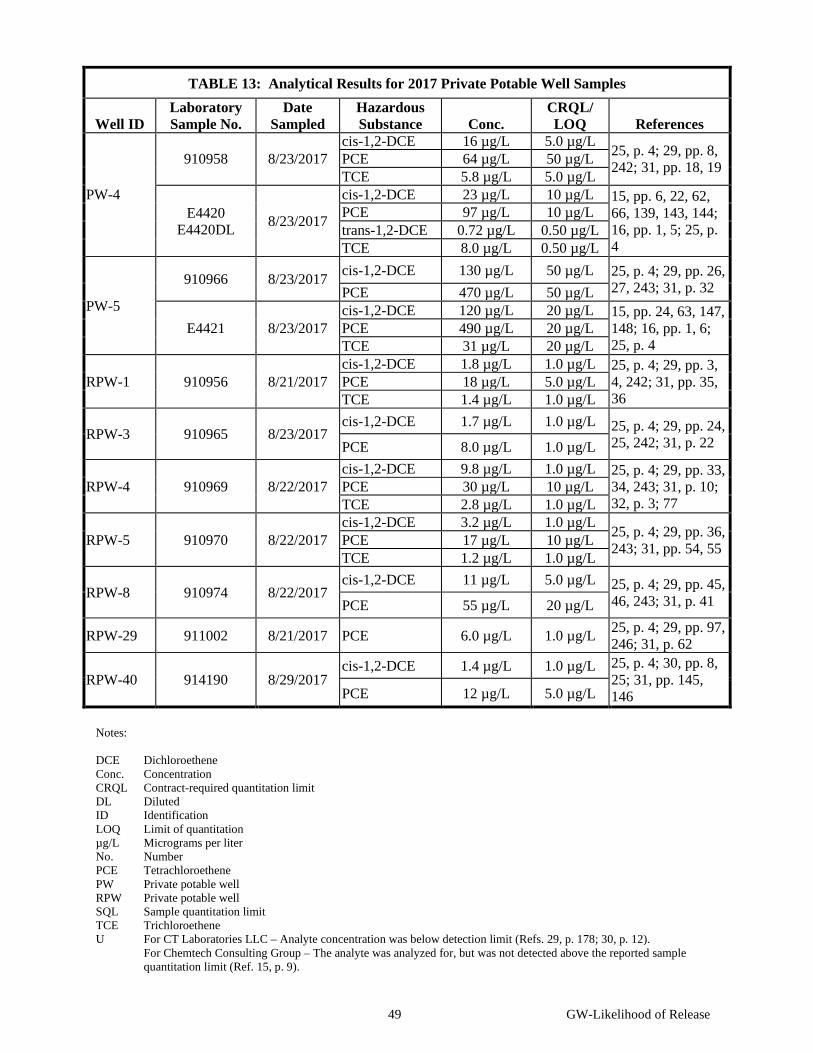
49 GW-Likelihood of Release
TABLE 13: Analytical Results for 2017 Private Potable Well Samples
Well ID Laboratory Sample No.
Date Sampled
Hazardous Substance Conc.
CRQL/ LOQ References
PW-4
910958 8/23/2017 cis-1,2-DCE 16 µg/L 5.0 µg/L 25, p. 4; 29, pp. 8,
242; 31, pp. 18, 19 PCE 64 µg/L 50 µg/L TCE 5.8 µg/L 5.0 µg/L
E4420 E4420DL 8/23/2017
cis-1,2-DCE 23 µg/L 10 µg/L 15, pp. 6, 22, 62, 66, 139, 143, 144; 16, pp. 1, 5; 25, p. 4
PCE 97 µg/L 10 µg/L trans-1,2-DCE 0.72 µg/L 0.50 µg/L TCE 8.0 µg/L 0.50 µg/L
PW-5
910966 8/23/2017 cis-1,2-DCE 130 µg/L 50 µg/L 25, p. 4; 29, pp. 26, 27, 243; 31, p. 32 PCE 470 µg/L 50 µg/L
E4421 8/23/2017 cis-1,2-DCE 120 µg/L 20 µg/L 15, pp. 24, 63, 147,
148; 16, pp. 1, 6; 25, p. 4
PCE 490 µg/L 20 µg/L TCE 31 µg/L 20 µg/L
RPW-1 910956 8/21/2017 cis-1,2-DCE 1.8 µg/L 1.0 µg/L 25, p. 4; 29, pp. 3,
4, 242; 31, pp. 35, 36
PCE 18 µg/L 5.0 µg/L TCE 1.4 µg/L 1.0 µg/L
RPW-3 910965 8/23/2017 cis-1,2-DCE 1.7 µg/L 1.0 µg/L 25, p. 4; 29, pp. 24,
25, 242; 31, p. 22 PCE 8.0 µg/L 1.0 µg/L
RPW-4 910969 8/22/2017 cis-1,2-DCE 9.8 µg/L 1.0 µg/L 25, p. 4; 29, pp. 33,
34, 243; 31, p. 10; 32, p. 3; 77
PCE 30 µg/L 10 µg/L TCE 2.8 µg/L 1.0 µg/L
RPW-5 910970 8/22/2017 cis-1,2-DCE 3.2 µg/L 1.0 µg/L 25, p. 4; 29, pp. 36,
243; 31, pp. 54, 55 PCE 17 µg/L 10 µg/L TCE 1.2 µg/L 1.0 µg/L
RPW-8 910974 8/22/2017 cis-1,2-DCE 11 µg/L 5.0 µg/L 25, p. 4; 29, pp. 45,
46, 243; 31, p. 41 PCE 55 µg/L 20 µg/L
RPW-29 911002 8/21/2017 PCE 6.0 µg/L 1.0 µg/L 25, p. 4; 29, pp. 97, 246; 31, p. 62
RPW-40 914190 8/29/2017 cis-1,2-DCE 1.4 µg/L 1.0 µg/L 25, p. 4; 30, pp. 8,
25; 31, pp. 145, 146 PCE 12 µg/L 5.0 µg/L
Notes: DCE Dichloroethene Conc. Concentration CRQL Contract-required quantitation limit DL Diluted ID Identification LOQ Limit of quantitation µg/L Micrograms per liter No. Number PCE Tetrachloroethene PW Private potable well RPW Private potable well SQL Sample quantitation limit TCE Trichloroethene U For CT Laboratories LLC – Analyte concentration was below detection limit (Refs. 29, p. 178; 30, p. 12).
For Chemtech Consulting Group – The analyte was analyzed for, but was not detected above the reported sample quantitation limit (Ref. 15, p. 9).
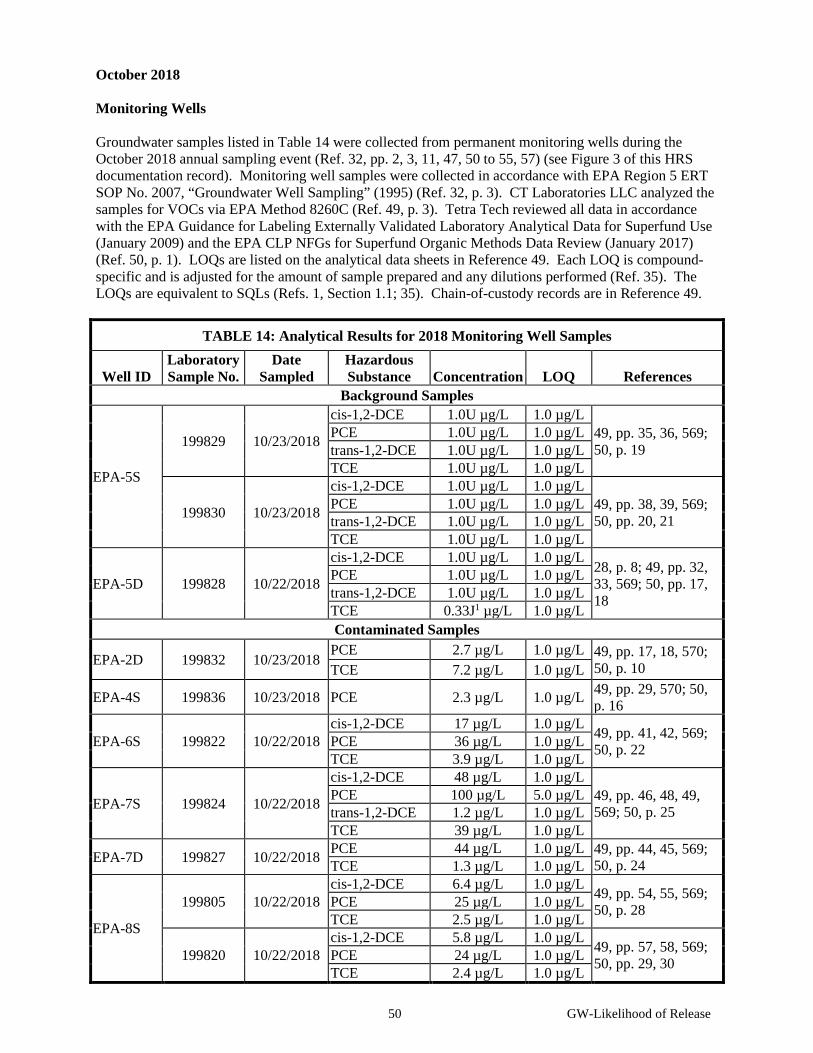
50 GW-Likelihood of Release
October 2018 Monitoring Wells Groundwater samples listed in Table 14 were collected from permanent monitoring wells during the October 2018 annual sampling event (Ref. 32, pp. 2, 3, 11, 47, 50 to 55, 57) (see Figure 3 of this HRS documentation record). Monitoring well samples were collected in accordance with EPA Region 5 ERT SOP No. 2007, “Groundwater Well Sampling” (1995) (Ref. 32, p. 3). CT Laboratories LLC analyzed the samples for VOCs via EPA Method 8260C (Ref. 49, p. 3). Tetra Tech reviewed all data in accordance with the EPA Guidance for Labeling Externally Validated Laboratory Analytical Data for Superfund Use (January 2009) and the EPA CLP NFGs for Superfund Organic Methods Data Review (January 2017) (Ref. 50, p. 1). LOQs are listed on the analytical data sheets in Reference 49. Each LOQ is compound-specific and is adjusted for the amount of sample prepared and any dilutions performed (Ref. 35). The LOQs are equivalent to SQLs (Refs. 1, Section 1.1; 35). Chain-of-custody records are in Reference 49.
TABLE 14: Analytical Results for 2018 Monitoring Well Samples
Well ID Laboratory Sample No.
Date Sampled
Hazardous Substance Concentration LOQ References
Background Samples
EPA-5S
199829 10/23/2018
cis-1,2-DCE 1.0U µg/L 1.0 µg/L 49, pp. 35, 36, 569; 50, p. 19
PCE 1.0U µg/L 1.0 µg/L trans-1,2-DCE 1.0U µg/L 1.0 µg/L TCE 1.0U µg/L 1.0 µg/L
199830 10/23/2018
cis-1,2-DCE 1.0U µg/L 1.0 µg/L 49, pp. 38, 39, 569; 50, pp. 20, 21
PCE 1.0U µg/L 1.0 µg/L trans-1,2-DCE 1.0U µg/L 1.0 µg/L TCE 1.0U µg/L 1.0 µg/L
EPA-5D 199828 10/22/2018
cis-1,2-DCE 1.0U µg/L 1.0 µg/L 28, p. 8; 49, pp. 32, 33, 569; 50, pp. 17, 18
PCE 1.0U µg/L 1.0 µg/L trans-1,2-DCE 1.0U µg/L 1.0 µg/L TCE 0.33J1 µg/L 1.0 µg/L Contaminated Samples
EPA-2D 199832 10/23/2018 PCE 2.7 µg/L 1.0 µg/L 49, pp. 17, 18, 570;
50, p. 10 TCE 7.2 µg/L 1.0 µg/L
EPA-4S 199836 10/23/2018 PCE 2.3 µg/L 1.0 µg/L 49, pp. 29, 570; 50, p. 16
EPA-6S 199822 10/22/2018 cis-1,2-DCE 17 µg/L 1.0 µg/L 49, pp. 41, 42, 569;
50, p. 22 PCE 36 µg/L 1.0 µg/L TCE 3.9 µg/L 1.0 µg/L
EPA-7S 199824 10/22/2018
cis-1,2-DCE 48 µg/L 1.0 µg/L 49, pp. 46, 48, 49, 569; 50, p. 25
PCE 100 µg/L 5.0 µg/L trans-1,2-DCE 1.2 µg/L 1.0 µg/L TCE 39 µg/L 1.0 µg/L
EPA-7D 199827 10/22/2018 PCE 44 µg/L 1.0 µg/L 49, pp. 44, 45, 569; 50, p. 24 TCE 1.3 µg/L 1.0 µg/L
EPA-8S
199805 10/22/2018 cis-1,2-DCE 6.4 µg/L 1.0 µg/L 49, pp. 54, 55, 569;
50, p. 28 PCE 25 µg/L 1.0 µg/L TCE 2.5 µg/L 1.0 µg/L
199820 10/22/2018 cis-1,2-DCE 5.8 µg/L 1.0 µg/L 49, pp. 57, 58, 569;
50, pp. 29, 30 PCE 24 µg/L 1.0 µg/L TCE 2.4 µg/L 1.0 µg/L
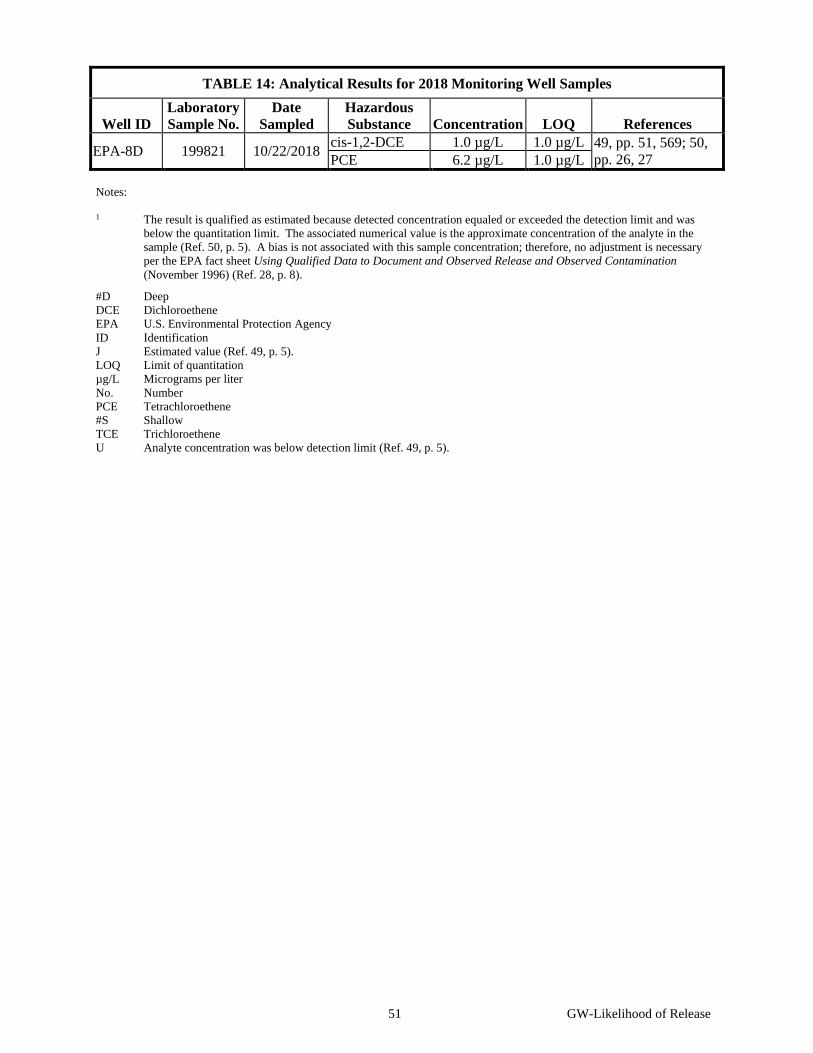
51 GW-Likelihood of Release
TABLE 14: Analytical Results for 2018 Monitoring Well Samples
Well ID Laboratory Sample No.
Date Sampled
Hazardous Substance Concentration LOQ References
EPA-8D 199821 10/22/2018 cis-1,2-DCE 1.0 µg/L 1.0 µg/L 49, pp. 51, 569; 50, pp. 26, 27 PCE 6.2 µg/L 1.0 µg/L
Notes: 1 The result is qualified as estimated because detected concentration equaled or exceeded the detection limit and was
below the quantitation limit. The associated numerical value is the approximate concentration of the analyte in the sample (Ref. 50, p. 5). A bias is not associated with this sample concentration; therefore, no adjustment is necessary per the EPA fact sheet Using Qualified Data to Document and Observed Release and Observed Contamination (November 1996) (Ref. 28, p. 8).
#D Deep DCE Dichloroethene EPA U.S. Environmental Protection Agency ID Identification J Estimated value (Ref. 49, p. 5). LOQ Limit of quantitation µg/L Micrograms per liter No. Number PCE Tetrachloroethene #S Shallow TCE Trichloroethene U Analyte concentration was below detection limit (Ref. 49, p. 5).
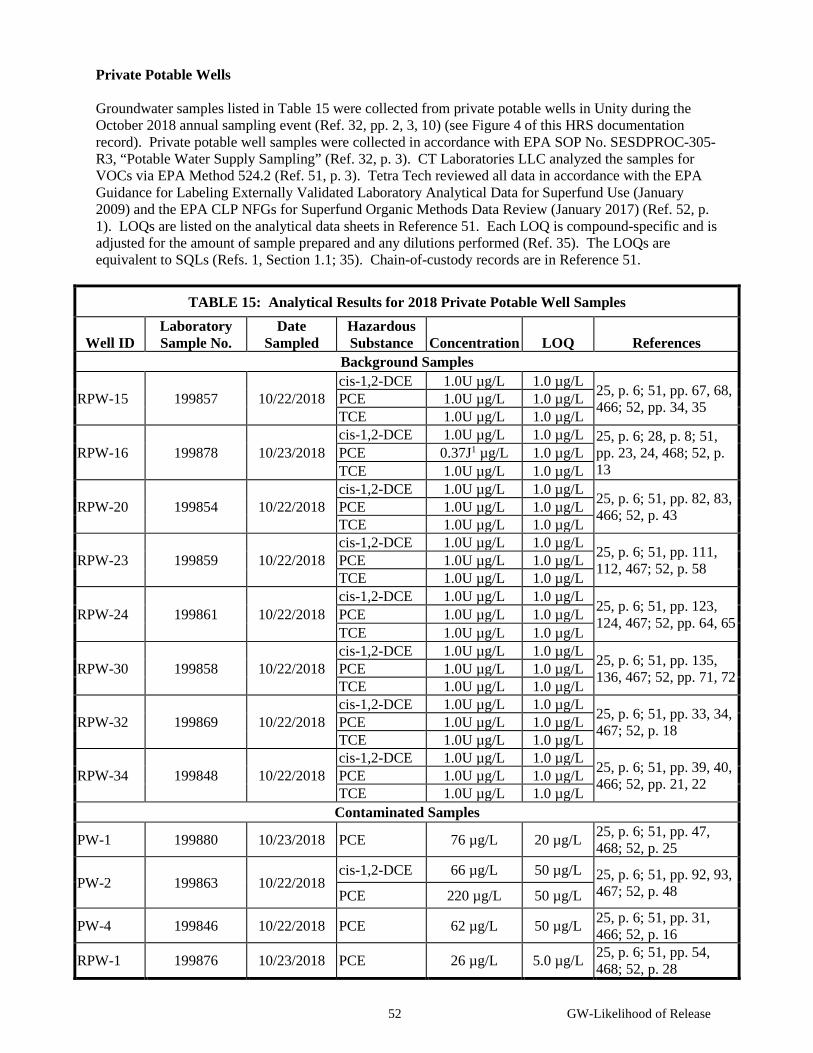
52 GW-Likelihood of Release
Private Potable Wells Groundwater samples listed in Table 15 were collected from private potable wells in Unity during the October 2018 annual sampling event (Ref. 32, pp. 2, 3, 10) (see Figure 4 of this HRS documentation record). Private potable well samples were collected in accordance with EPA SOP No. SESDPROC-305-R3, “Potable Water Supply Sampling” (Ref. 32, p. 3). CT Laboratories LLC analyzed the samples for VOCs via EPA Method 524.2 (Ref. 51, p. 3). Tetra Tech reviewed all data in accordance with the EPA Guidance for Labeling Externally Validated Laboratory Analytical Data for Superfund Use (January 2009) and the EPA CLP NFGs for Superfund Organic Methods Data Review (January 2017) (Ref. 52, p. 1). LOQs are listed on the analytical data sheets in Reference 51. Each LOQ is compound-specific and is adjusted for the amount of sample prepared and any dilutions performed (Ref. 35). The LOQs are equivalent to SQLs (Refs. 1, Section 1.1; 35). Chain-of-custody records are in Reference 51.
TABLE 15: Analytical Results for 2018 Private Potable Well Samples
Well ID Laboratory Sample No.
Date Sampled
Hazardous Substance Concentration LOQ References
Background Samples
RPW-15 199857 10/22/2018 cis-1,2-DCE 1.0U µg/L 1.0 µg/L 25, p. 6; 51, pp. 67, 68,
466; 52, pp. 34, 35 PCE 1.0U µg/L 1.0 µg/L TCE 1.0U µg/L 1.0 µg/L
RPW-16 199878 10/23/2018 cis-1,2-DCE 1.0U µg/L 1.0 µg/L 25, p. 6; 28, p. 8; 51,
pp. 23, 24, 468; 52, p. 13
PCE 0.37J1 µg/L 1.0 µg/L TCE 1.0U µg/L 1.0 µg/L
RPW-20 199854 10/22/2018 cis-1,2-DCE 1.0U µg/L 1.0 µg/L 25, p. 6; 51, pp. 82, 83,
466; 52, p. 43 PCE 1.0U µg/L 1.0 µg/L TCE 1.0U µg/L 1.0 µg/L
RPW-23 199859 10/22/2018 cis-1,2-DCE 1.0U µg/L 1.0 µg/L 25, p. 6; 51, pp. 111,
112, 467; 52, p. 58 PCE 1.0U µg/L 1.0 µg/L TCE 1.0U µg/L 1.0 µg/L
RPW-24 199861 10/22/2018 cis-1,2-DCE 1.0U µg/L 1.0 µg/L
25, p. 6; 51, pp. 123, 124, 467; 52, pp. 64, 65 PCE 1.0U µg/L 1.0 µg/L
TCE 1.0U µg/L 1.0 µg/L
RPW-30 199858 10/22/2018 cis-1,2-DCE 1.0U µg/L 1.0 µg/L 25, p. 6; 51, pp. 135,
136, 467; 52, pp. 71, 72 PCE 1.0U µg/L 1.0 µg/L TCE 1.0U µg/L 1.0 µg/L
RPW-32 199869 10/22/2018 cis-1,2-DCE 1.0U µg/L 1.0 µg/L 25, p. 6; 51, pp. 33, 34,
467; 52, p. 18 PCE 1.0U µg/L 1.0 µg/L TCE 1.0U µg/L 1.0 µg/L
RPW-34 199848 10/22/2018 cis-1,2-DCE 1.0U µg/L 1.0 µg/L 25, p. 6; 51, pp. 39, 40,
466; 52, pp. 21, 22 PCE 1.0U µg/L 1.0 µg/L TCE 1.0U µg/L 1.0 µg/L
Contaminated Samples
PW-1 199880 10/23/2018 PCE 76 µg/L 20 µg/L 25, p. 6; 51, pp. 47, 468; 52, p. 25
PW-2 199863 10/22/2018 cis-1,2-DCE 66 µg/L 50 µg/L 25, p. 6; 51, pp. 92, 93,
467; 52, p. 48 PCE 220 µg/L 50 µg/L
PW-4 199846 10/22/2018 PCE 62 µg/L 50 µg/L 25, p. 6; 51, pp. 31, 466; 52, p. 16
RPW-1 199876 10/23/2018 PCE 26 µg/L 5.0 µg/L 25, p. 6; 51, pp. 54, 468; 52, p. 28
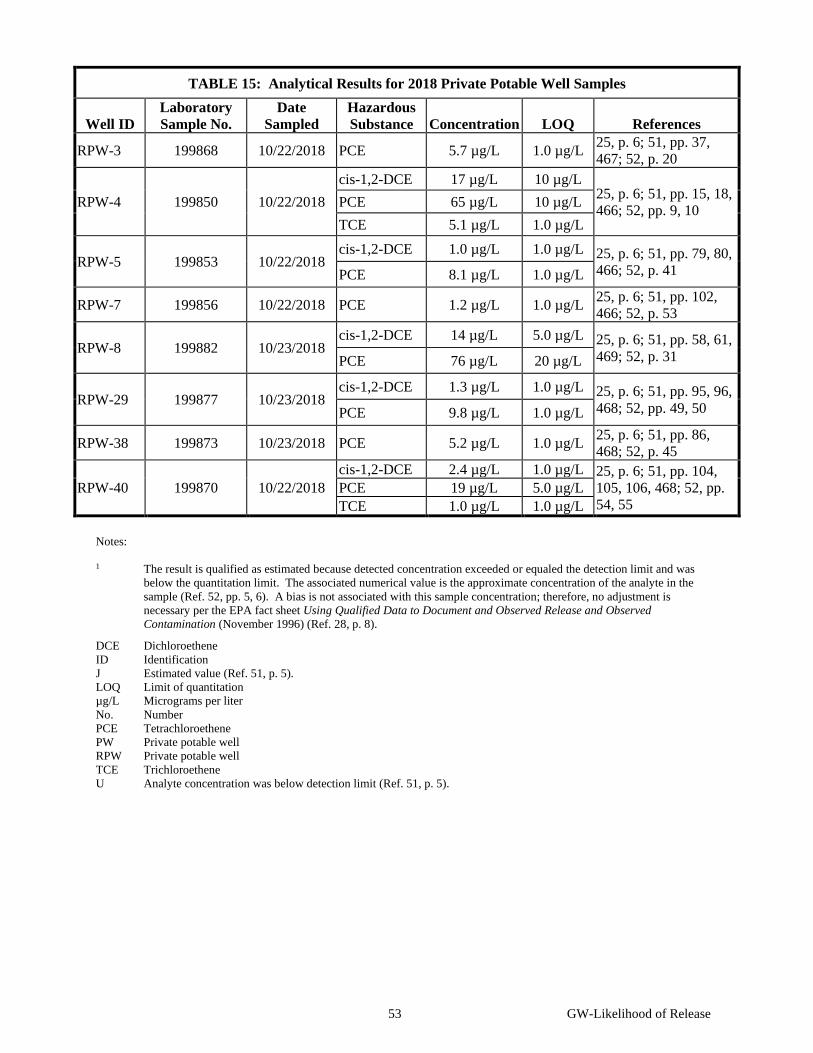
53 GW-Likelihood of Release
TABLE 15: Analytical Results for 2018 Private Potable Well Samples
Well ID Laboratory Sample No.
Date Sampled
Hazardous Substance Concentration LOQ References
RPW-3 199868 10/22/2018 PCE 5.7 µg/L 1.0 µg/L 25, p. 6; 51, pp. 37, 467; 52, p. 20
RPW-4 199850 10/22/2018 cis-1,2-DCE 17 µg/L 10 µg/L
25, p. 6; 51, pp. 15, 18, 466; 52, pp. 9, 10 PCE 65 µg/L 10 µg/L
TCE 5.1 µg/L 1.0 µg/L
RPW-5 199853 10/22/2018 cis-1,2-DCE 1.0 µg/L 1.0 µg/L 25, p. 6; 51, pp. 79, 80,
466; 52, p. 41 PCE 8.1 µg/L 1.0 µg/L
RPW-7 199856 10/22/2018 PCE 1.2 µg/L 1.0 µg/L 25, p. 6; 51, pp. 102, 466; 52, p. 53
RPW-8 199882 10/23/2018 cis-1,2-DCE 14 µg/L 5.0 µg/L 25, p. 6; 51, pp. 58, 61,
469; 52, p. 31 PCE 76 µg/L 20 µg/L
RPW-29 199877 10/23/2018 cis-1,2-DCE 1.3 µg/L 1.0 µg/L 25, p. 6; 51, pp. 95, 96,
468; 52, pp. 49, 50 PCE 9.8 µg/L 1.0 µg/L
RPW-38 199873 10/23/2018 PCE 5.2 µg/L 1.0 µg/L 25, p. 6; 51, pp. 86, 468; 52, p. 45
RPW-40 199870 10/22/2018 cis-1,2-DCE 2.4 µg/L 1.0 µg/L 25, p. 6; 51, pp. 104,
105, 106, 468; 52, pp. 54, 55
PCE 19 µg/L 5.0 µg/L TCE 1.0 µg/L 1.0 µg/L
Notes: 1 The result is qualified as estimated because detected concentration exceeded or equaled the detection limit and was
below the quantitation limit. The associated numerical value is the approximate concentration of the analyte in the sample (Ref. 52, pp. 5, 6). A bias is not associated with this sample concentration; therefore, no adjustment is necessary per the EPA fact sheet Using Qualified Data to Document and Observed Release and Observed Contamination (November 1996) (Ref. 28, p. 8).
DCE Dichloroethene ID Identification J Estimated value (Ref. 51, p. 5). LOQ Limit of quantitation µg/L Micrograms per liter No. Number PCE Tetrachloroethene PW Private potable well RPW Private potable well TCE Trichloroethene U Analyte concentration was below detection limit (Ref. 51, p. 5).
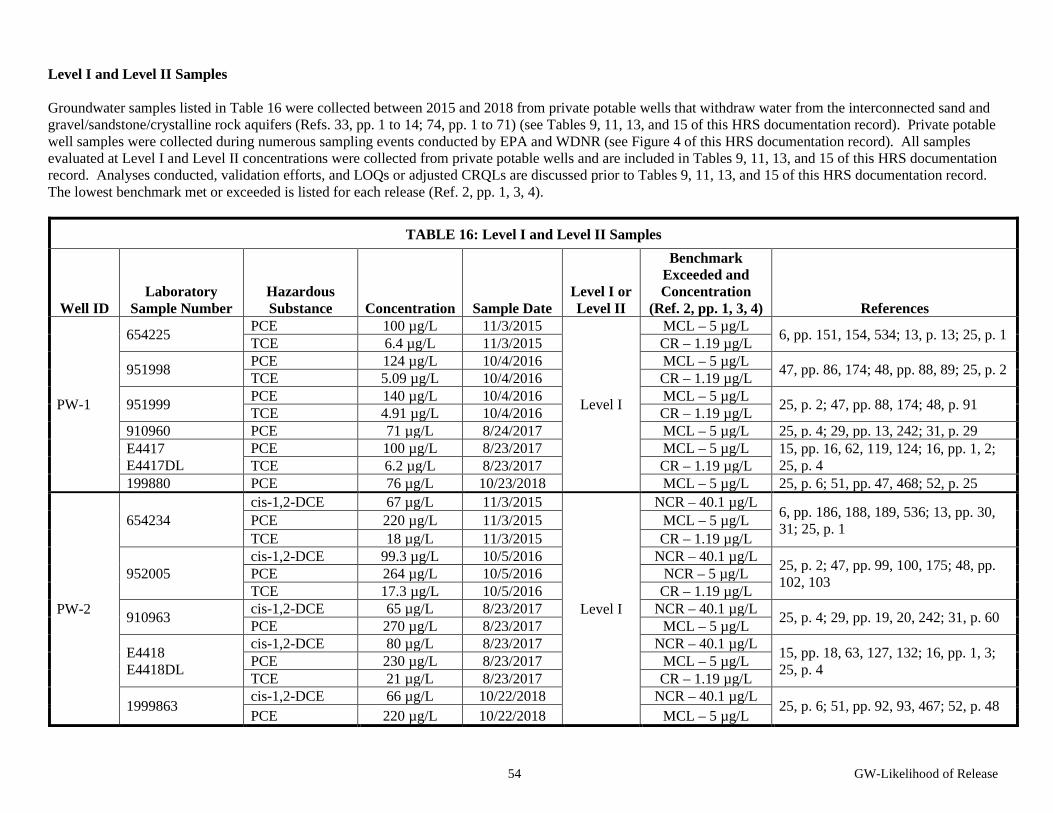
54 GW-Likelihood of Release
Level I and Level II Samples Groundwater samples listed in Table 16 were collected between 2015 and 2018 from private potable wells that withdraw water from the interconnected sand and gravel/sandstone/crystalline rock aquifers (Refs. 33, pp. 1 to 14; 74, pp. 1 to 71) (see Tables 9, 11, 13, and 15 of this HRS documentation record). Private potable well samples were collected during numerous sampling events conducted by EPA and WDNR (see Figure 4 of this HRS documentation record). All samples evaluated at Level I and Level II concentrations were collected from private potable wells and are included in Tables 9, 11, 13, and 15 of this HRS documentation record. Analyses conducted, validation efforts, and LOQs or adjusted CRQLs are discussed prior to Tables 9, 11, 13, and 15 of this HRS documentation record. The lowest benchmark met or exceeded is listed for each release (Ref. 2, pp. 1, 3, 4).
TABLE 16: Level I and Level II Samples
Well ID Laboratory
Sample Number Hazardous Substance Concentration Sample Date
Level I or Level II
Benchmark Exceeded and Concentration
(Ref. 2, pp. 1, 3, 4) References
PW-1
654225 PCE 100 µg/L 11/3/2015
Level I
MCL – 5 µg/L 6, pp. 151, 154, 534; 13, p. 13; 25, p. 1 TCE 6.4 µg/L 11/3/2015 CR – 1.19 µg/L
951998 PCE 124 µg/L 10/4/2016 MCL – 5 µg/L 47, pp. 86, 174; 48, pp. 88, 89; 25, p. 2 TCE 5.09 µg/L 10/4/2016 CR – 1.19 µg/L
951999 PCE 140 µg/L 10/4/2016 MCL – 5 µg/L 25, p. 2; 47, pp. 88, 174; 48, p. 91 TCE 4.91 µg/L 10/4/2016 CR – 1.19 µg/L 910960 PCE 71 µg/L 8/24/2017 MCL – 5 µg/L 25, p. 4; 29, pp. 13, 242; 31, p. 29 E4417 E4417DL
PCE 100 µg/L 8/23/2017 MCL – 5 µg/L 15, pp. 16, 62, 119, 124; 16, pp. 1, 2; 25, p. 4 TCE 6.2 µg/L 8/23/2017 CR – 1.19 µg/L
199880 PCE 76 µg/L 10/23/2018 MCL – 5 µg/L 25, p. 6; 51, pp. 47, 468; 52, p. 25
PW-2
654234 cis-1,2-DCE 67 µg/L 11/3/2015
Level I
NCR – 40.1 µg/L 6, pp. 186, 188, 189, 536; 13, pp. 30, 31; 25, p. 1 PCE 220 µg/L 11/3/2015 MCL – 5 µg/L
TCE 18 µg/L 11/3/2015 CR – 1.19 µg/L
952005 cis-1,2-DCE 99.3 µg/L 10/5/2016 NCR – 40.1 µg/L 25, p. 2; 47, pp. 99, 100, 175; 48, pp.
102, 103 PCE 264 µg/L 10/5/2016 NCR – 5 µg/L TCE 17.3 µg/L 10/5/2016 CR – 1.19 µg/L
910963 cis-1,2-DCE 65 µg/L 8/23/2017 NCR – 40.1 µg/L 25, p. 4; 29, pp. 19, 20, 242; 31, p. 60 PCE 270 µg/L 8/23/2017 MCL – 5 µg/L
E4418 E4418DL
cis-1,2-DCE 80 µg/L 8/23/2017 NCR – 40.1 µg/L 15, pp. 18, 63, 127, 132; 16, pp. 1, 3; 25, p. 4 PCE 230 µg/L 8/23/2017 MCL – 5 µg/L
TCE 21 µg/L 8/23/2017 CR – 1.19 µg/L
1999863 cis-1,2-DCE 66 µg/L 10/22/2018 NCR – 40.1 µg/L
25, p. 6; 51, pp. 92, 93, 467; 52, p. 48 PCE 220 µg/L 10/22/2018 MCL – 5 µg/L
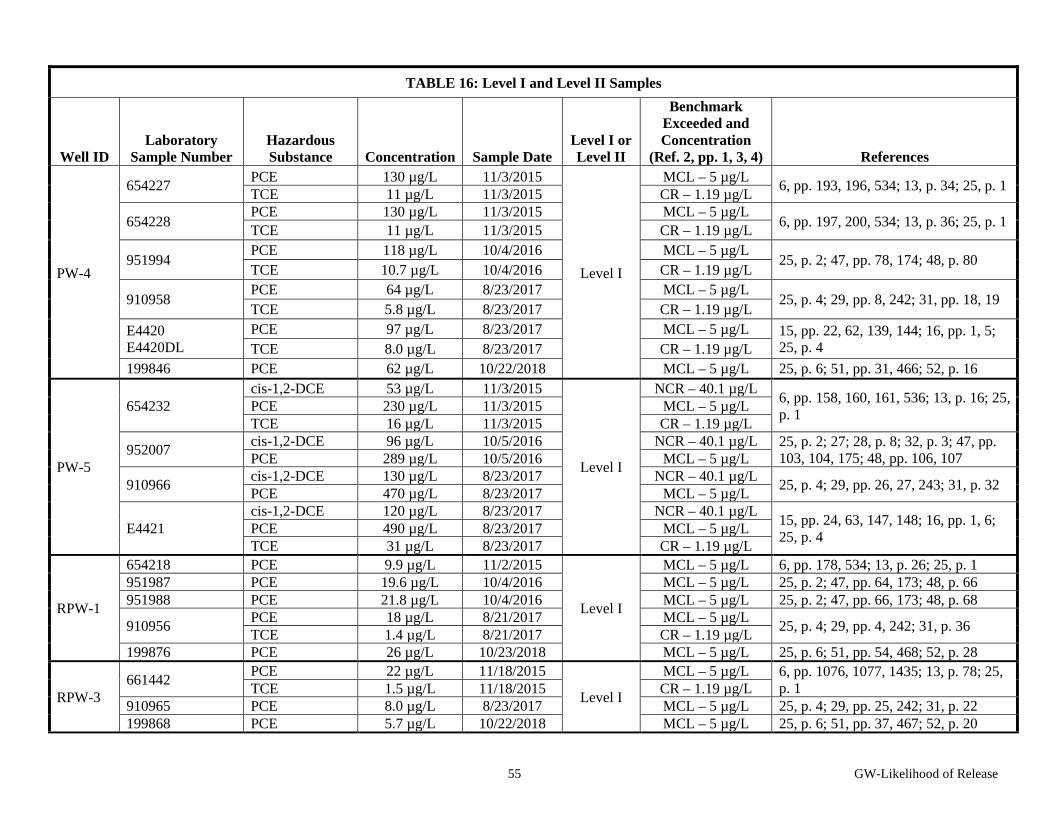
55 GW-Likelihood of Release
TABLE 16: Level I and Level II Samples
Well ID Laboratory
Sample Number Hazardous Substance Concentration Sample Date
Level I or Level II
Benchmark Exceeded and Concentration
(Ref. 2, pp. 1, 3, 4) References
PW-4
654227 PCE 130 µg/L 11/3/2015
Level I
MCL – 5 µg/L 6, pp. 193, 196, 534; 13, p. 34; 25, p. 1 TCE 11 µg/L 11/3/2015 CR – 1.19 µg/L
654228 PCE 130 µg/L 11/3/2015 MCL – 5 µg/L
6, pp. 197, 200, 534; 13, p. 36; 25, p. 1 TCE 11 µg/L 11/3/2015 CR – 1.19 µg/L
951994 PCE 118 µg/L 10/4/2016 MCL – 5 µg/L
25, p. 2; 47, pp. 78, 174; 48, p. 80 TCE 10.7 µg/L 10/4/2016 CR – 1.19 µg/L
910958 PCE 64 µg/L 8/23/2017 MCL – 5 µg/L
25, p. 4; 29, pp. 8, 242; 31, pp. 18, 19 TCE 5.8 µg/L 8/23/2017 CR – 1.19 µg/L
E4420 E4420DL
PCE 97 µg/L 8/23/2017 MCL – 5 µg/L 15, pp. 22, 62, 139, 144; 16, pp. 1, 5; 25, p. 4 TCE 8.0 µg/L 8/23/2017 CR – 1.19 µg/L
199846 PCE 62 µg/L 10/22/2018 MCL – 5 µg/L 25, p. 6; 51, pp. 31, 466; 52, p. 16
PW-5
654232 cis-1,2-DCE 53 µg/L 11/3/2015
Level I
NCR – 40.1 µg/L 6, pp. 158, 160, 161, 536; 13, p. 16; 25, p. 1 PCE 230 µg/L 11/3/2015 MCL – 5 µg/L
TCE 16 µg/L 11/3/2015 CR – 1.19 µg/L
952007 cis-1,2-DCE 96 µg/L 10/5/2016 NCR – 40.1 µg/L 25, p. 2; 27; 28, p. 8; 32, p. 3; 47, pp. 103, 104, 175; 48, pp. 106, 107 PCE 289 µg/L 10/5/2016 MCL – 5 µg/L
910966 cis-1,2-DCE 130 µg/L 8/23/2017 NCR – 40.1 µg/L 25, p. 4; 29, pp. 26, 27, 243; 31, p. 32 PCE 470 µg/L 8/23/2017 MCL – 5 µg/L
E4421 cis-1,2-DCE 120 µg/L 8/23/2017 NCR – 40.1 µg/L 15, pp. 24, 63, 147, 148; 16, pp. 1, 6;
25, p. 4 PCE 490 µg/L 8/23/2017 MCL – 5 µg/L TCE 31 µg/L 8/23/2017 CR – 1.19 µg/L
RPW-1
654218 PCE 9.9 µg/L 11/2/2015
Level I
MCL – 5 µg/L 6, pp. 178, 534; 13, p. 26; 25, p. 1 951987 PCE 19.6 µg/L 10/4/2016 MCL – 5 µg/L 25, p. 2; 47, pp. 64, 173; 48, p. 66 951988 PCE 21.8 µg/L 10/4/2016 MCL – 5 µg/L 25, p. 2; 47, pp. 66, 173; 48, p. 68
910956 PCE 18 µg/L 8/21/2017 MCL – 5 µg/L 25, p. 4; 29, pp. 4, 242; 31, p. 36 TCE 1.4 µg/L 8/21/2017 CR – 1.19 µg/L 199876 PCE 26 µg/L 10/23/2018 MCL – 5 µg/L 25, p. 6; 51, pp. 54, 468; 52, p. 28
RPW-3 661442 PCE 22 µg/L 11/18/2015
Level I
MCL – 5 µg/L 6, pp. 1076, 1077, 1435; 13, p. 78; 25, p. 1 TCE 1.5 µg/L 11/18/2015 CR – 1.19 µg/L
910965 PCE 8.0 µg/L 8/23/2017 MCL – 5 µg/L 25, p. 4; 29, pp. 25, 242; 31, p. 22 199868 PCE 5.7 µg/L 10/22/2018 MCL – 5 µg/L 25, p. 6; 51, pp. 37, 467; 52, p. 20
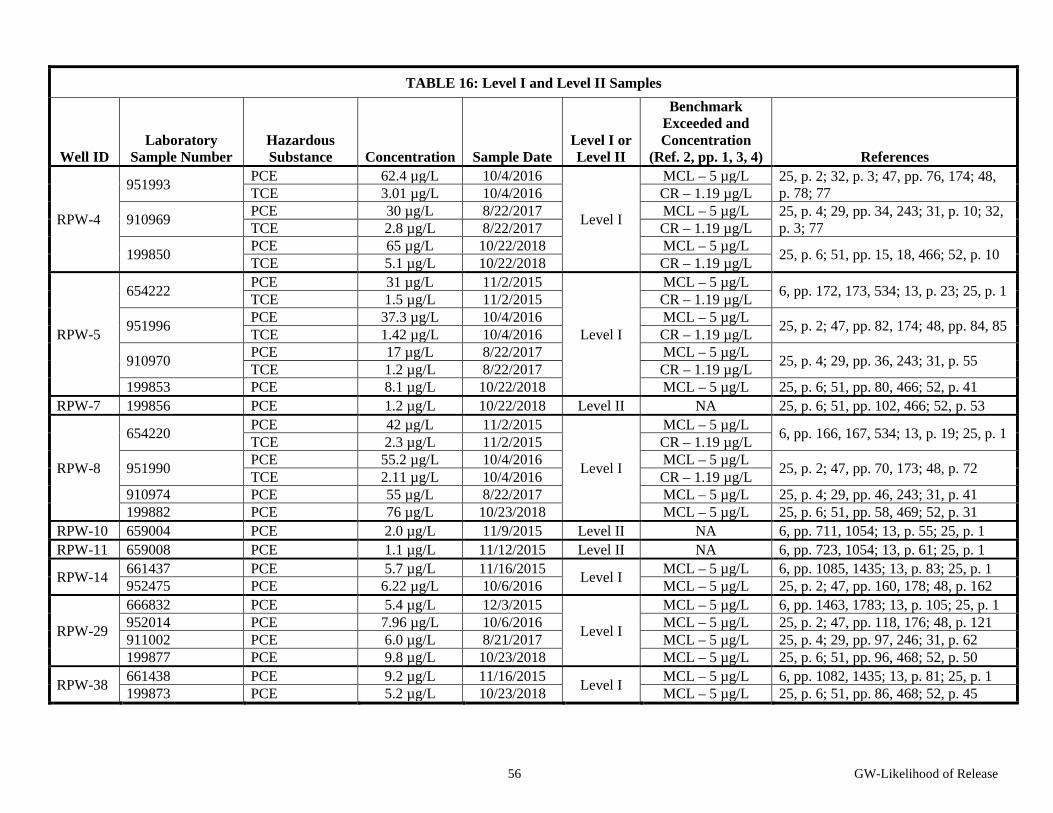
56 GW-Likelihood of Release
TABLE 16: Level I and Level II Samples
Well ID Laboratory
Sample Number Hazardous Substance Concentration Sample Date
Level I or Level II
Benchmark Exceeded and Concentration
(Ref. 2, pp. 1, 3, 4) References
RPW-4
951993 PCE 62.4 µg/L 10/4/2016
Level I
MCL – 5 µg/L 25, p. 2; 32, p. 3; 47, pp. 76, 174; 48, p. 78; 77 TCE 3.01 µg/L 10/4/2016 CR – 1.19 µg/L
910969 PCE 30 µg/L 8/22/2017 MCL – 5 µg/L 25, p. 4; 29, pp. 34, 243; 31, p. 10; 32, p. 3; 77 TCE 2.8 µg/L 8/22/2017 CR – 1.19 µg/L
199850 PCE 65 µg/L 10/22/2018 MCL – 5 µg/L 25, p. 6; 51, pp. 15, 18, 466; 52, p. 10 TCE 5.1 µg/L 10/22/2018 CR – 1.19 µg/L
RPW-5
654222 PCE 31 µg/L 11/2/2015
Level I
MCL – 5 µg/L 6, pp. 172, 173, 534; 13, p. 23; 25, p. 1 TCE 1.5 µg/L 11/2/2015 CR – 1.19 µg/L
951996 PCE 37.3 µg/L 10/4/2016 MCL – 5 µg/L 25, p. 2; 47, pp. 82, 174; 48, pp. 84, 85 TCE 1.42 µg/L 10/4/2016 CR – 1.19 µg/L
910970 PCE 17 µg/L 8/22/2017 MCL – 5 µg/L 25, p. 4; 29, pp. 36, 243; 31, p. 55 TCE 1.2 µg/L 8/22/2017 CR – 1.19 µg/L 199853 PCE 8.1 µg/L 10/22/2018 MCL – 5 µg/L 25, p. 6; 51, pp. 80, 466; 52, p. 41
RPW-7 199856 PCE 1.2 µg/L 10/22/2018 Level II NA 25, p. 6; 51, pp. 102, 466; 52, p. 53
RPW-8
654220 PCE 42 µg/L 11/2/2015
Level I
MCL – 5 µg/L 6, pp. 166, 167, 534; 13, p. 19; 25, p. 1 TCE 2.3 µg/L 11/2/2015 CR – 1.19 µg/L
951990 PCE 55.2 µg/L 10/4/2016 MCL – 5 µg/L 25, p. 2; 47, pp. 70, 173; 48, p. 72 TCE 2.11 µg/L 10/4/2016 CR – 1.19 µg/L 910974 PCE 55 µg/L 8/22/2017 MCL – 5 µg/L 25, p. 4; 29, pp. 46, 243; 31, p. 41 199882 PCE 76 µg/L 10/23/2018 MCL – 5 µg/L 25, p. 6; 51, pp. 58, 469; 52, p. 31
RPW-10 659004 PCE 2.0 µg/L 11/9/2015 Level II NA 6, pp. 711, 1054; 13, p. 55; 25, p. 1 RPW-11 659008 PCE 1.1 µg/L 11/12/2015 Level II NA 6, pp. 723, 1054; 13, p. 61; 25, p. 1
RPW-14 661437 PCE 5.7 µg/L 11/16/2015 Level I MCL – 5 µg/L 6, pp. 1085, 1435; 13, p. 83; 25, p. 1 952475 PCE 6.22 µg/L 10/6/2016 MCL – 5 µg/L 25, p. 2; 47, pp. 160, 178; 48, p. 162
RPW-29
666832 PCE 5.4 µg/L 12/3/2015
Level I
MCL – 5 µg/L 6, pp. 1463, 1783; 13, p. 105; 25, p. 1 952014 PCE 7.96 µg/L 10/6/2016 MCL – 5 µg/L 25, p. 2; 47, pp. 118, 176; 48, p. 121 911002 PCE 6.0 µg/L 8/21/2017 MCL – 5 µg/L 25, p. 4; 29, pp. 97, 246; 31, p. 62 199877 PCE 9.8 µg/L 10/23/2018 MCL – 5 µg/L 25, p. 6; 51, pp. 96, 468; 52, p. 50
RPW-38 661438 PCE 9.2 µg/L 11/16/2015 Level I MCL – 5 µg/L 6, pp. 1082, 1435; 13, p. 81; 25, p. 1 199873 PCE 5.2 µg/L 10/23/2018 MCL – 5 µg/L 25, p. 6; 51, pp. 86, 468; 52, p. 45
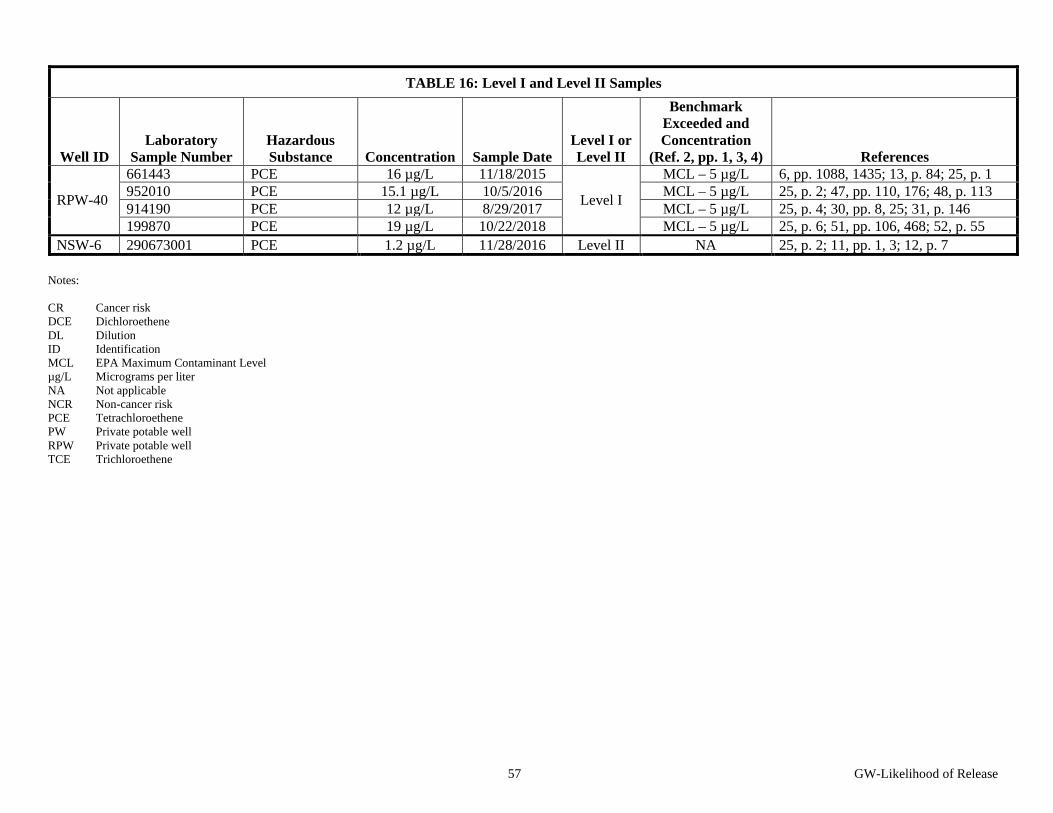
57 GW-Likelihood of Release
TABLE 16: Level I and Level II Samples
Well ID Laboratory
Sample Number Hazardous Substance Concentration Sample Date
Level I or Level II
Benchmark Exceeded and Concentration
(Ref. 2, pp. 1, 3, 4) References
RPW-40
661443 PCE 16 µg/L 11/18/2015
Level I
MCL – 5 µg/L 6, pp. 1088, 1435; 13, p. 84; 25, p. 1 952010 PCE 15.1 µg/L 10/5/2016 MCL – 5 µg/L 25, p. 2; 47, pp. 110, 176; 48, p. 113 914190 PCE 12 µg/L 8/29/2017 MCL – 5 µg/L 25, p. 4; 30, pp. 8, 25; 31, p. 146 199870 PCE 19 µg/L 10/22/2018 MCL – 5 µg/L 25, p. 6; 51, pp. 106, 468; 52, p. 55
NSW-6 290673001 PCE 1.2 µg/L 11/28/2016 Level II NA 25, p. 2; 11, pp. 1, 3; 12, p. 7 Notes: CR Cancer risk DCE Dichloroethene DL Dilution ID Identification MCL EPA Maximum Contaminant Level µg/L Micrograms per liter NA Not applicable NCR Non-cancer risk PCE Tetrachloroethene PW Private potable well RPW Private potable well TCE Trichloroethene
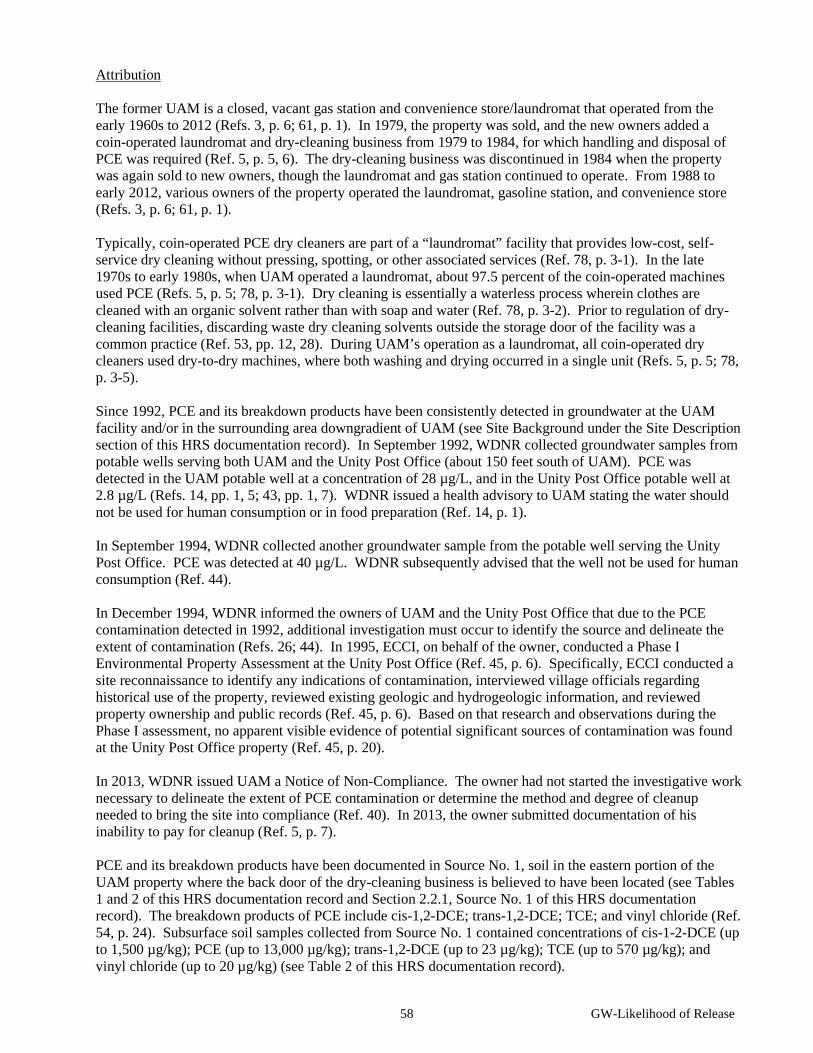
58 GW-Likelihood of Release
Attribution The former UAM is a closed, vacant gas station and convenience store/laundromat that operated from the early 1960s to 2012 (Refs. 3, p. 6; 61, p. 1). In 1979, the property was sold, and the new owners added a coin-operated laundromat and dry-cleaning business from 1979 to 1984, for which handling and disposal of PCE was required (Ref. 5, p. 5, 6). The dry-cleaning business was discontinued in 1984 when the property was again sold to new owners, though the laundromat and gas station continued to operate. From 1988 to early 2012, various owners of the property operated the laundromat, gasoline station, and convenience store (Refs. 3, p. 6; 61, p. 1). Typically, coin-operated PCE dry cleaners are part of a “laundromat” facility that provides low-cost, self-service dry cleaning without pressing, spotting, or other associated services (Ref. 78, p. 3-1). In the late 1970s to early 1980s, when UAM operated a laundromat, about 97.5 percent of the coin-operated machines used PCE (Refs. 5, p. 5; 78, p. 3-1). Dry cleaning is essentially a waterless process wherein clothes are cleaned with an organic solvent rather than with soap and water (Ref. 78, p. 3-2). Prior to regulation of dry-cleaning facilities, discarding waste dry cleaning solvents outside the storage door of the facility was a common practice (Ref. 53, pp. 12, 28). During UAM’s operation as a laundromat, all coin-operated dry cleaners used dry-to-dry machines, where both washing and drying occurred in a single unit (Refs. 5, p. 5; 78, p. 3-5). Since 1992, PCE and its breakdown products have been consistently detected in groundwater at the UAM facility and/or in the surrounding area downgradient of UAM (see Site Background under the Site Description section of this HRS documentation record). In September 1992, WDNR collected groundwater samples from potable wells serving both UAM and the Unity Post Office (about 150 feet south of UAM). PCE was detected in the UAM potable well at a concentration of 28 µg/L, and in the Unity Post Office potable well at 2.8 µg/L (Refs. 14, pp. 1, 5; 43, pp. 1, 7). WDNR issued a health advisory to UAM stating the water should not be used for human consumption or in food preparation (Ref. 14, p. 1). In September 1994, WDNR collected another groundwater sample from the potable well serving the Unity Post Office. PCE was detected at 40 µg/L. WDNR subsequently advised that the well not be used for human consumption (Ref. 44). In December 1994, WDNR informed the owners of UAM and the Unity Post Office that due to the PCE contamination detected in 1992, additional investigation must occur to identify the source and delineate the extent of contamination (Refs. 26; 44). In 1995, ECCI, on behalf of the owner, conducted a Phase I Environmental Property Assessment at the Unity Post Office (Ref. 45, p. 6). Specifically, ECCI conducted a site reconnaissance to identify any indications of contamination, interviewed village officials regarding historical use of the property, reviewed existing geologic and hydrogeologic information, and reviewed property ownership and public records (Ref. 45, p. 6). Based on that research and observations during the Phase I assessment, no apparent visible evidence of potential significant sources of contamination was found at the Unity Post Office property (Ref. 45, p. 20). In 2013, WDNR issued UAM a Notice of Non-Compliance. The owner had not started the investigative work necessary to delineate the extent of PCE contamination or determine the method and degree of cleanup needed to bring the site into compliance (Ref. 40). In 2013, the owner submitted documentation of his inability to pay for cleanup (Ref. 5, p. 7). PCE and its breakdown products have been documented in Source No. 1, soil in the eastern portion of the UAM property where the back door of the dry-cleaning business is believed to have been located (see Tables 1 and 2 of this HRS documentation record and Section 2.2.1, Source No. 1 of this HRS documentation record). The breakdown products of PCE include cis-1,2-DCE; trans-1,2-DCE; TCE; and vinyl chloride (Ref. 54, p. 24). Subsurface soil samples collected from Source No. 1 contained concentrations of cis-1-2-DCE (up to 1,500 µg/kg); PCE (up to 13,000 µg/kg); trans-1,2-DCE (up to 23 µg/kg); TCE (up to 570 µg/kg); and vinyl chloride (up to 20 µg/kg) (see Table 2 of this HRS documentation record).
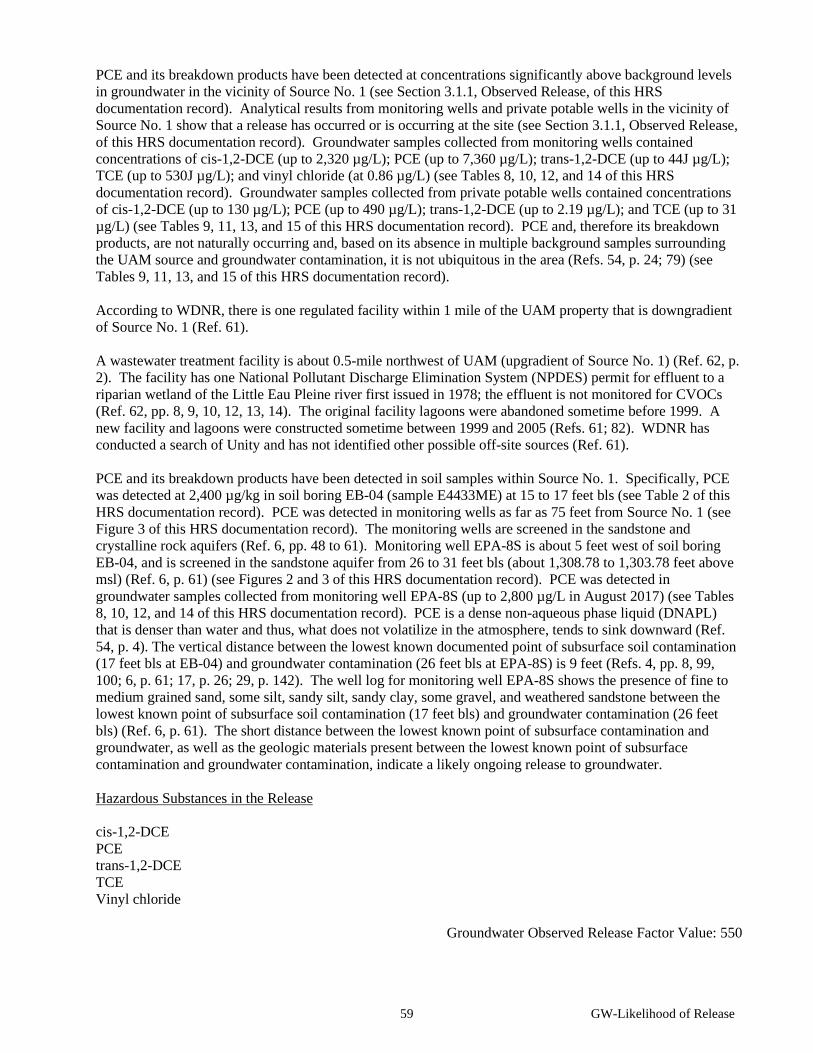
59 GW-Likelihood of Release
PCE and its breakdown products have been detected at concentrations significantly above background levels in groundwater in the vicinity of Source No. 1 (see Section 3.1.1, Observed Release, of this HRS documentation record). Analytical results from monitoring wells and private potable wells in the vicinity of Source No. 1 show that a release has occurred or is occurring at the site (see Section 3.1.1, Observed Release, of this HRS documentation record). Groundwater samples collected from monitoring wells contained concentrations of cis-1,2-DCE (up to 2,320 µg/L); PCE (up to 7,360 µg/L); trans-1,2-DCE (up to 44J µg/L); TCE (up to 530J µg/L); and vinyl chloride (at 0.86 µg/L) (see Tables 8, 10, 12, and 14 of this HRS documentation record). Groundwater samples collected from private potable wells contained concentrations of cis-1,2-DCE (up to 130 µg/L); PCE (up to 490 µg/L); trans-1,2-DCE (up to 2.19 µg/L); and TCE (up to 31 µg/L) (see Tables 9, 11, 13, and 15 of this HRS documentation record). PCE and, therefore its breakdown products, are not naturally occurring and, based on its absence in multiple background samples surrounding the UAM source and groundwater contamination, it is not ubiquitous in the area (Refs. 54, p. 24; 79) (see Tables 9, 11, 13, and 15 of this HRS documentation record). According to WDNR, there is one regulated facility within 1 mile of the UAM property that is downgradient of Source No. 1 (Ref. 61). A wastewater treatment facility is about 0.5-mile northwest of UAM (upgradient of Source No. 1) (Ref. 62, p. 2). The facility has one National Pollutant Discharge Elimination System (NPDES) permit for effluent to a riparian wetland of the Little Eau Pleine river first issued in 1978; the effluent is not monitored for CVOCs (Ref. 62, pp. 8, 9, 10, 12, 13, 14). The original facility lagoons were abandoned sometime before 1999. A new facility and lagoons were constructed sometime between 1999 and 2005 (Refs. 61; 82). WDNR has conducted a search of Unity and has not identified other possible off-site sources (Ref. 61). PCE and its breakdown products have been detected in soil samples within Source No. 1. Specifically, PCE was detected at 2,400 µg/kg in soil boring EB-04 (sample E4433ME) at 15 to 17 feet bls (see Table 2 of this HRS documentation record). PCE was detected in monitoring wells as far as 75 feet from Source No. 1 (see Figure 3 of this HRS documentation record). The monitoring wells are screened in the sandstone and crystalline rock aquifers (Ref. 6, pp. 48 to 61). Monitoring well EPA-8S is about 5 feet west of soil boring EB-04, and is screened in the sandstone aquifer from 26 to 31 feet bls (about 1,308.78 to 1,303.78 feet above msl) (Ref. 6, p. 61) (see Figures 2 and 3 of this HRS documentation record). PCE was detected in groundwater samples collected from monitoring well EPA-8S (up to 2,800 µg/L in August 2017) (see Tables 8, 10, 12, and 14 of this HRS documentation record). PCE is a dense non-aqueous phase liquid (DNAPL) that is denser than water and thus, what does not volatilize in the atmosphere, tends to sink downward (Ref. 54, p. 4). The vertical distance between the lowest known documented point of subsurface soil contamination (17 feet bls at EB-04) and groundwater contamination (26 feet bls at EPA-8S) is 9 feet (Refs. 4, pp. 8, 99, 100; 6, p. 61; 17, p. 26; 29, p. 142). The well log for monitoring well EPA-8S shows the presence of fine to medium grained sand, some silt, sandy silt, sandy clay, some gravel, and weathered sandstone between the lowest known point of subsurface soil contamination (17 feet bls) and groundwater contamination (26 feet bls) (Ref. 6, p. 61). The short distance between the lowest known point of subsurface contamination and groundwater, as well as the geologic materials present between the lowest known point of subsurface contamination and groundwater contamination, indicate a likely ongoing release to groundwater. Hazardous Substances in the Release cis-1,2-DCE PCE trans-1,2-DCE TCE Vinyl chloride
Groundwater Observed Release Factor Value: 550
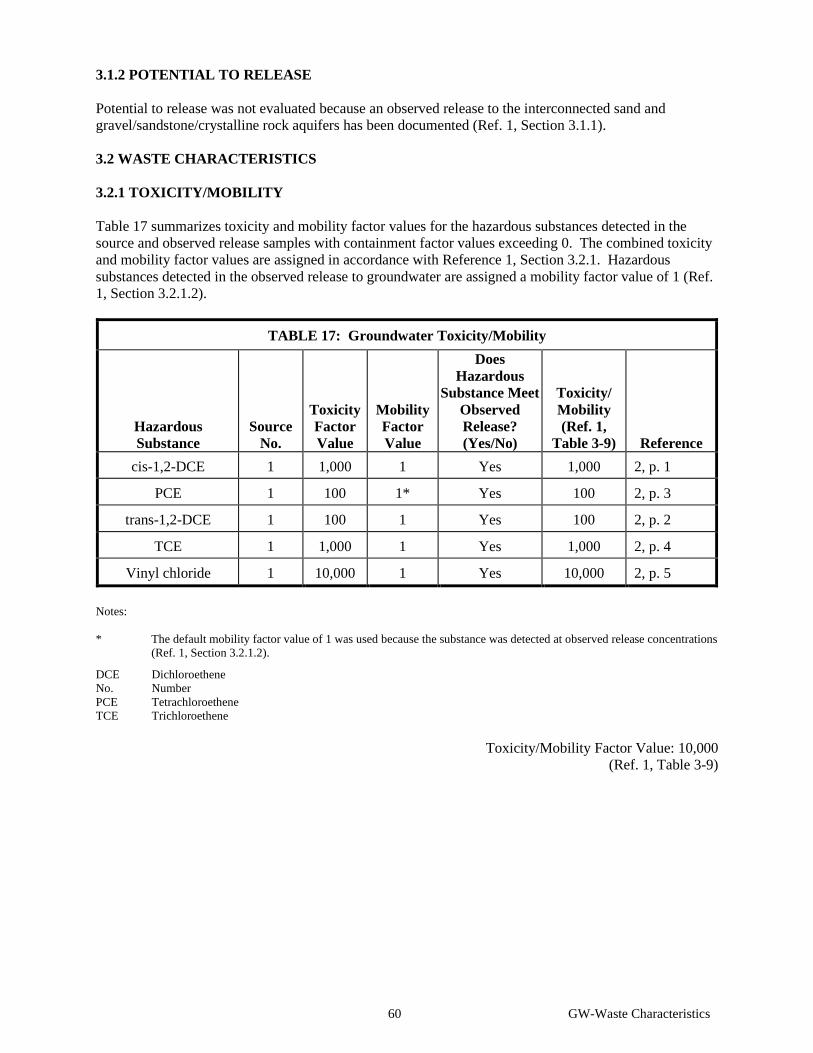
60 GW-Waste Characteristics
3.1.2 POTENTIAL TO RELEASE Potential to release was not evaluated because an observed release to the interconnected sand and gravel/sandstone/crystalline rock aquifers has been documented (Ref. 1, Section 3.1.1). 3.2 WASTE CHARACTERISTICS 3.2.1 TOXICITY/MOBILITY Table 17 summarizes toxicity and mobility factor values for the hazardous substances detected in the source and observed release samples with containment factor values exceeding 0. The combined toxicity and mobility factor values are assigned in accordance with Reference 1, Section 3.2.1. Hazardous substances detected in the observed release to groundwater are assigned a mobility factor value of 1 (Ref. 1, Section 3.2.1.2).
TABLE 17: Groundwater Toxicity/Mobility
Hazardous Substance
Source No.
Toxicity Factor Value
Mobility
Factor Value
Does Hazardous
Substance Meet Observed Release? (Yes/No)
Toxicity/ Mobility (Ref. 1,
Table 3-9) Reference cis-1,2-DCE 1 1,000 1 Yes 1,000 2, p. 1
PCE 1 100 1* Yes 100 2, p. 3
trans-1,2-DCE 1 100 1 Yes 100 2, p. 2
TCE 1 1,000 1 Yes 1,000 2, p. 4
Vinyl chloride 1 10,000 1 Yes 10,000 2, p. 5 Notes: * The default mobility factor value of 1 was used because the substance was detected at observed release concentrations
(Ref. 1, Section 3.2.1.2).
DCE Dichloroethene No. Number PCE Tetrachloroethene TCE Trichloroethene
Toxicity/Mobility Factor Value: 10,000 (Ref. 1, Table 3-9)
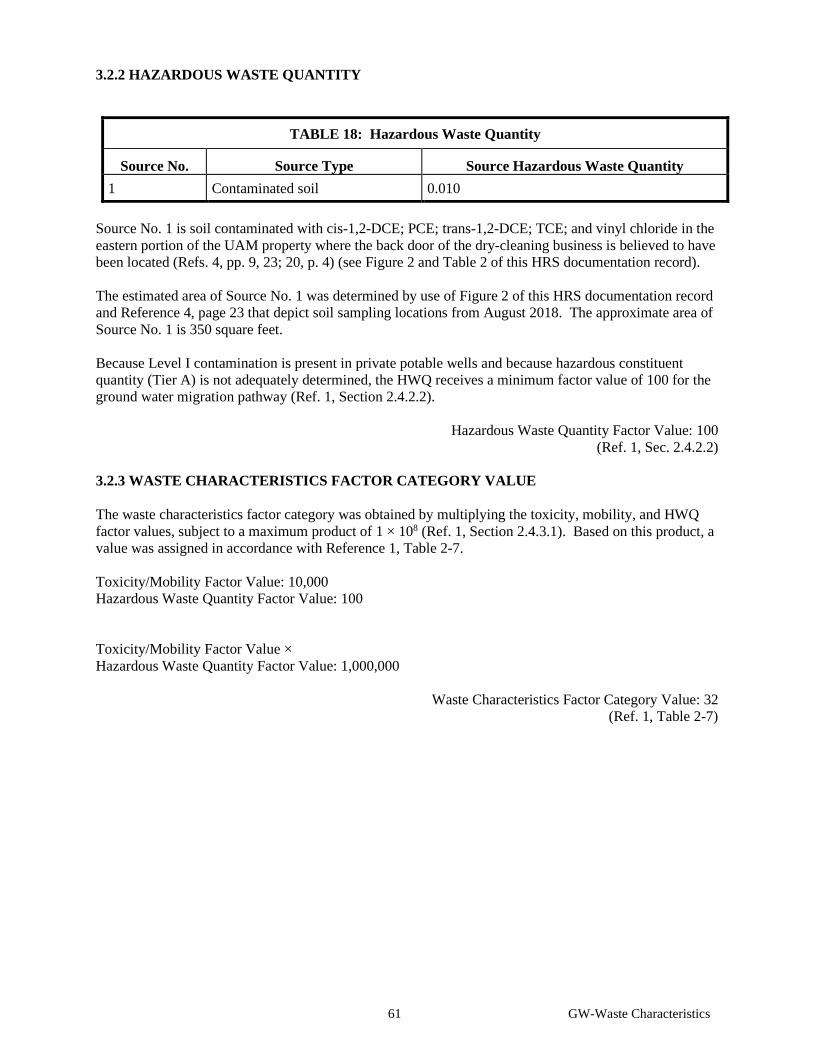
61 GW-Waste Characteristics
3.2.2 HAZARDOUS WASTE QUANTITY
TABLE 18: Hazardous Waste Quantity
Source No. Source Type Source Hazardous Waste Quantity 1 Contaminated soil 0.010
Source No. 1 is soil contaminated with cis-1,2-DCE; PCE; trans-1,2-DCE; TCE; and vinyl chloride in the eastern portion of the UAM property where the back door of the dry-cleaning business is believed to have been located (Refs. 4, pp. 9, 23; 20, p. 4) (see Figure 2 and Table 2 of this HRS documentation record). The estimated area of Source No. 1 was determined by use of Figure 2 of this HRS documentation record and Reference 4, page 23 that depict soil sampling locations from August 2018. The approximate area of Source No. 1 is 350 square feet. Because Level I contamination is present in private potable wells and because hazardous constituent quantity (Tier A) is not adequately determined, the HWQ receives a minimum factor value of 100 for the ground water migration pathway (Ref. 1, Section 2.4.2.2).
Hazardous Waste Quantity Factor Value: 100 (Ref. 1, Sec. 2.4.2.2)
3.2.3 WASTE CHARACTERISTICS FACTOR CATEGORY VALUE The waste characteristics factor category was obtained by multiplying the toxicity, mobility, and HWQ factor values, subject to a maximum product of 1 × 10⁸ (Ref. 1, Section 2.4.3.1). Based on this product, a value was assigned in accordance with Reference 1, Table 2-7. Toxicity/Mobility Factor Value: 10,000 Hazardous Waste Quantity Factor Value: 100 Toxicity/Mobility Factor Value × Hazardous Waste Quantity Factor Value: 1,000,000
Waste Characteristics Factor Category Value: 32 (Ref. 1, Table 2-7)
62 GW-Targets
3.3 TARGETS Municipal water is not available for Unity. The nearest municipal water supply system is the City of Colby about 4 miles north of Unity (Refs. 3, pp. 10, 11; 18; 34, p. 1; 76). Section 3.3.2 conveys Level I and Level II population values for private potable wells within Unity. Between 2015 and 2018, some private potable wells in Unity were sampled annually. Private potable wells contained concentrations of cis-1,2-DCE ranging from 0.67 to 130 µg/L; PCE ranging from 1.1 to 490 µg/L; and TCE ranging from 0.61 to 31 µg/L (see Tables 9, 11, 13, and 15 of this HRS documentation record). In October 2014, granular activated carbon treatment systems were installed at eight private potable wells in Unity (Ref. 9). 3.3.1 NEAREST WELL Because actual contamination at Level I concentrations has been documented, a nearest well factor value of 50 is assigned (Ref. 1, Section 3.3.1, Table 3-11). Level of Contamination (I, II, or potential): I
Nearest Well Factor Value: 50.0 (Ref. 1, Section 3.3.1, Table 3-11)
3.3.2 POPULATION 3.3.2.1 Level of Contamination 3.3.2.2 Level I Concentrations A total of 47.46 people are subject to actual contamination at Level I concentrations (Refs. 3, pp. 31, 32; 6, pp. 151, 154, 158, 160, 161, 166, 167, 172, 173, 178, 186, 188, 189, 193, 196, 197, 200, 534, 536, 1076, 1077, 1082, 1085, 1088, 1435, 1463, 1783; 13, pp. 13, 16, 19, 23, 26, 30, 31, 34, 36, 78, 81, 83, 84, 105; 15, pp. 16, 18, 22, 24, 62, 63, 119, 124, 127, 132, 139, 144, 147, 148; 16, pp. 1, 2, 3, 5, 6; 25; 27; 28, p. 8; 29, pp. 4, 8, 13, 19, 20, 25, 26, 27, 34, 36, 46, 63, 97, 147, 148, 242, 243, 246; 30 pp. 8, 25; 31, pp. 10, 18, 19, 22, 29, 32, 36, 41, 54, 55, 60, 62, 146; 47, pp. 64, 66, 70, 76, 78, 82, 86, 88, 99, 100, 103, 104, 110, 118, 160, 173, 174, 175, 176, 178; 48, pp. 66, 68, 72, 78, 80, 84, 85, 88, 89, 91, 102, 103, 106, 107, 113, 121, 162; 51, pp. 15, 18, 31, 37, 47, 54, 58, 86, 92, 93, 96, 102, 106, 466, 467, 468; 52, pp. 10, 16, 20, 25, 28, 31, 41, 45, 48, 50, 53, 55; 63) (see Section 3.1.1, Observed Release, and Table 19, Level I Population, of this HRS documentation record). Level I concentrations are documented in Table 16 of this HRS documentation record. Private potable wells that contain cis-1,2-DCE, PCE, and TCE at concentrations above an HRS health-based benchmark are listed in Table 19. The population served by each well at the time of sampling was not obtained from residents. Therefore, the population data were obtained from the U.S. Census Bureau. The county line bisects Unity along Front Street; therefore, all private potable wells west of Front Street are in Clark County, Wisconsin, and all private potable wells east of Front Street are in Marathon County, Wisconsin. The number of people per household in Clark County, Wisconsin (2013 to 2017) is 2.66, and the number of people per household in Marathon County, Wisconsin (2013 to 2017) is 2.44 (Refs. 55, p. 1; 56, p. 1).
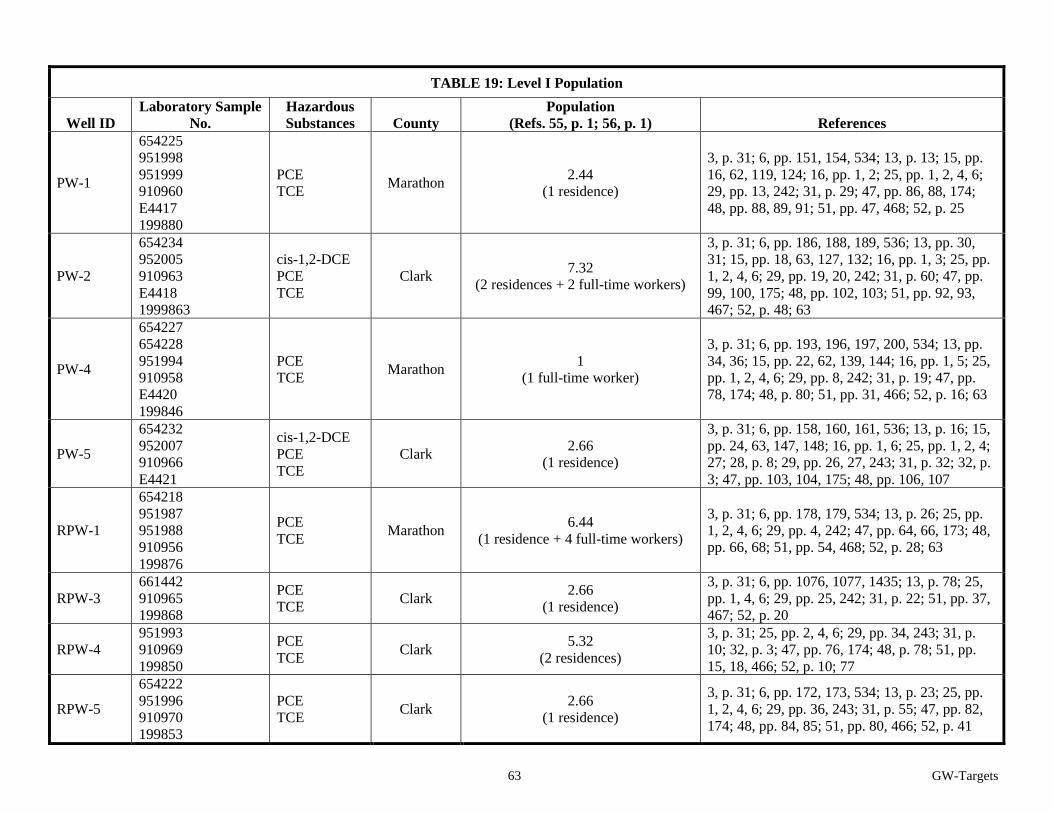
63 GW-Targets
TABLE 19: Level I Population
Well ID Laboratory Sample
No. Hazardous Substances County
Population (Refs. 55, p. 1; 56, p. 1) References
PW-1
654225 951998 951999 910960 E4417 199880
PCE TCE Marathon 2.44
(1 residence)
3, p. 31; 6, pp. 151, 154, 534; 13, p. 13; 15, pp. 16, 62, 119, 124; 16, pp. 1, 2; 25, pp. 1, 2, 4, 6; 29, pp. 13, 242; 31, p. 29; 47, pp. 86, 88, 174; 48, pp. 88, 89, 91; 51, pp. 47, 468; 52, p. 25
PW-2
654234 952005 910963 E4418 1999863
cis-1,2-DCE PCE TCE
Clark 7.32 (2 residences + 2 full-time workers)
3, p. 31; 6, pp. 186, 188, 189, 536; 13, pp. 30, 31; 15, pp. 18, 63, 127, 132; 16, pp. 1, 3; 25, pp. 1, 2, 4, 6; 29, pp. 19, 20, 242; 31, p. 60; 47, pp. 99, 100, 175; 48, pp. 102, 103; 51, pp. 92, 93, 467; 52, p. 48; 63
PW-4
654227 654228 951994 910958 E4420 199846
PCE TCE Marathon 1
(1 full-time worker)
3, p. 31; 6, pp. 193, 196, 197, 200, 534; 13, pp. 34, 36; 15, pp. 22, 62, 139, 144; 16, pp. 1, 5; 25, pp. 1, 2, 4, 6; 29, pp. 8, 242; 31, p. 19; 47, pp. 78, 174; 48, p. 80; 51, pp. 31, 466; 52, p. 16; 63
PW-5
654232 952007 910966 E4421
cis-1,2-DCE PCE TCE
Clark 2.66 (1 residence)
3, p. 31; 6, pp. 158, 160, 161, 536; 13, p. 16; 15, pp. 24, 63, 147, 148; 16, pp. 1, 6; 25, pp. 1, 2, 4; 27; 28, p. 8; 29, pp. 26, 27, 243; 31, p. 32; 32, p. 3; 47, pp. 103, 104, 175; 48, pp. 106, 107
RPW-1
654218 951987 951988 910956 199876
PCE TCE Marathon 6.44
(1 residence + 4 full-time workers)
3, p. 31; 6, pp. 178, 179, 534; 13, p. 26; 25, pp. 1, 2, 4, 6; 29, pp. 4, 242; 47, pp. 64, 66, 173; 48, pp. 66, 68; 51, pp. 54, 468; 52, p. 28; 63
RPW-3 661442 910965 199868
PCE TCE Clark 2.66
(1 residence)
3, p. 31; 6, pp. 1076, 1077, 1435; 13, p. 78; 25, pp. 1, 4, 6; 29, pp. 25, 242; 31, p. 22; 51, pp. 37, 467; 52, p. 20
RPW-4 951993 910969 199850
PCE TCE Clark 5.32
(2 residences)
3, p. 31; 25, pp. 2, 4, 6; 29, pp. 34, 243; 31, p. 10; 32, p. 3; 47, pp. 76, 174; 48, p. 78; 51, pp. 15, 18, 466; 52, p. 10; 77
RPW-5
654222 951996 910970 199853
PCE TCE Clark 2.66
(1 residence)
3, p. 31; 6, pp. 172, 173, 534; 13, p. 23; 25, pp. 1, 2, 4, 6; 29, pp. 36, 243; 31, p. 55; 47, pp. 82, 174; 48, pp. 84, 85; 51, pp. 80, 466; 52, p. 41
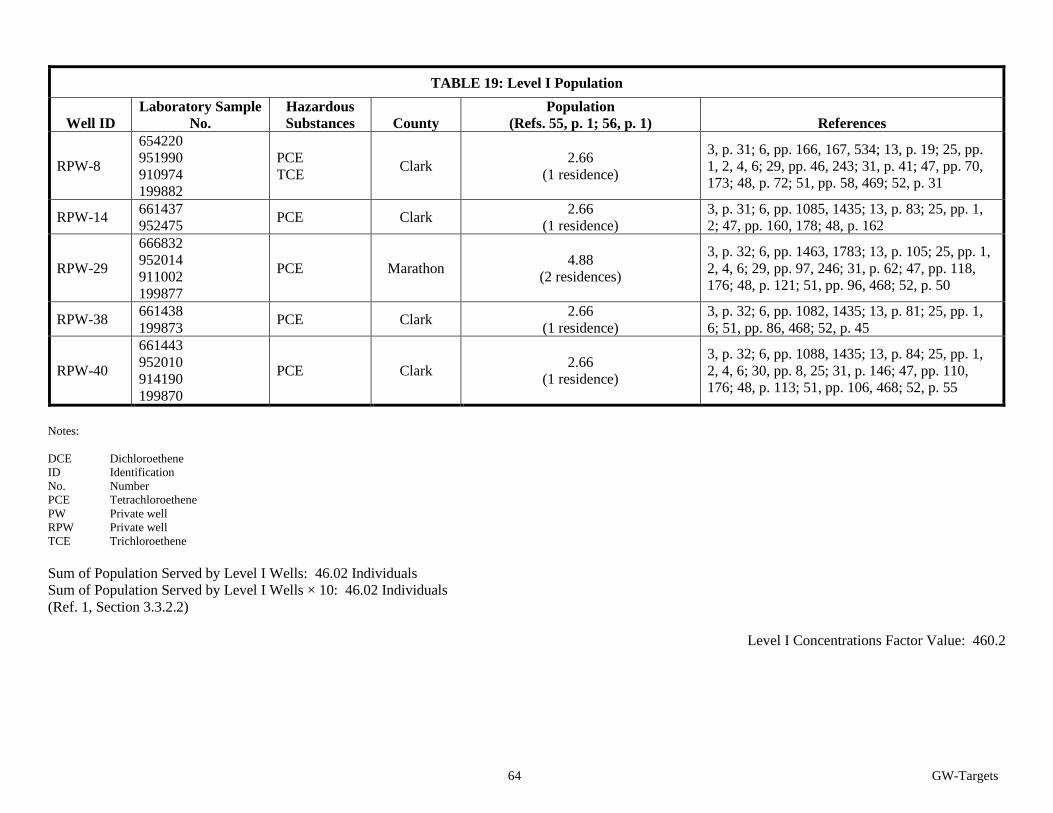
64 GW-Targets
TABLE 19: Level I Population
Well ID Laboratory Sample
No. Hazardous Substances County
Population (Refs. 55, p. 1; 56, p. 1) References
RPW-8
654220 951990 910974 199882
PCE TCE Clark 2.66
(1 residence)
3, p. 31; 6, pp. 166, 167, 534; 13, p. 19; 25, pp. 1, 2, 4, 6; 29, pp. 46, 243; 31, p. 41; 47, pp. 70, 173; 48, p. 72; 51, pp. 58, 469; 52, p. 31
RPW-14 661437 952475 PCE Clark 2.66
(1 residence) 3, p. 31; 6, pp. 1085, 1435; 13, p. 83; 25, pp. 1, 2; 47, pp. 160, 178; 48, p. 162
RPW-29
666832 952014 911002 199877
PCE Marathon 4.88 (2 residences)
3, p. 32; 6, pp. 1463, 1783; 13, p. 105; 25, pp. 1, 2, 4, 6; 29, pp. 97, 246; 31, p. 62; 47, pp. 118, 176; 48, p. 121; 51, pp. 96, 468; 52, p. 50
RPW-38 661438 199873 PCE Clark 2.66
(1 residence) 3, p. 32; 6, pp. 1082, 1435; 13, p. 81; 25, pp. 1, 6; 51, pp. 86, 468; 52, p. 45
RPW-40
661443 952010 914190 199870
PCE Clark 2.66 (1 residence)
3, p. 32; 6, pp. 1088, 1435; 13, p. 84; 25, pp. 1, 2, 4, 6; 30, pp. 8, 25; 31, p. 146; 47, pp. 110, 176; 48, p. 113; 51, pp. 106, 468; 52, p. 55
Notes: DCE Dichloroethene ID Identification No. Number PCE Tetrachloroethene PW Private well RPW Private well TCE Trichloroethene Sum of Population Served by Level I Wells: 46.02 Individuals Sum of Population Served by Level I Wells × 10: 46.02 Individuals (Ref. 1, Section 3.3.2.2)
Level I Concentrations Factor Value: 460.2
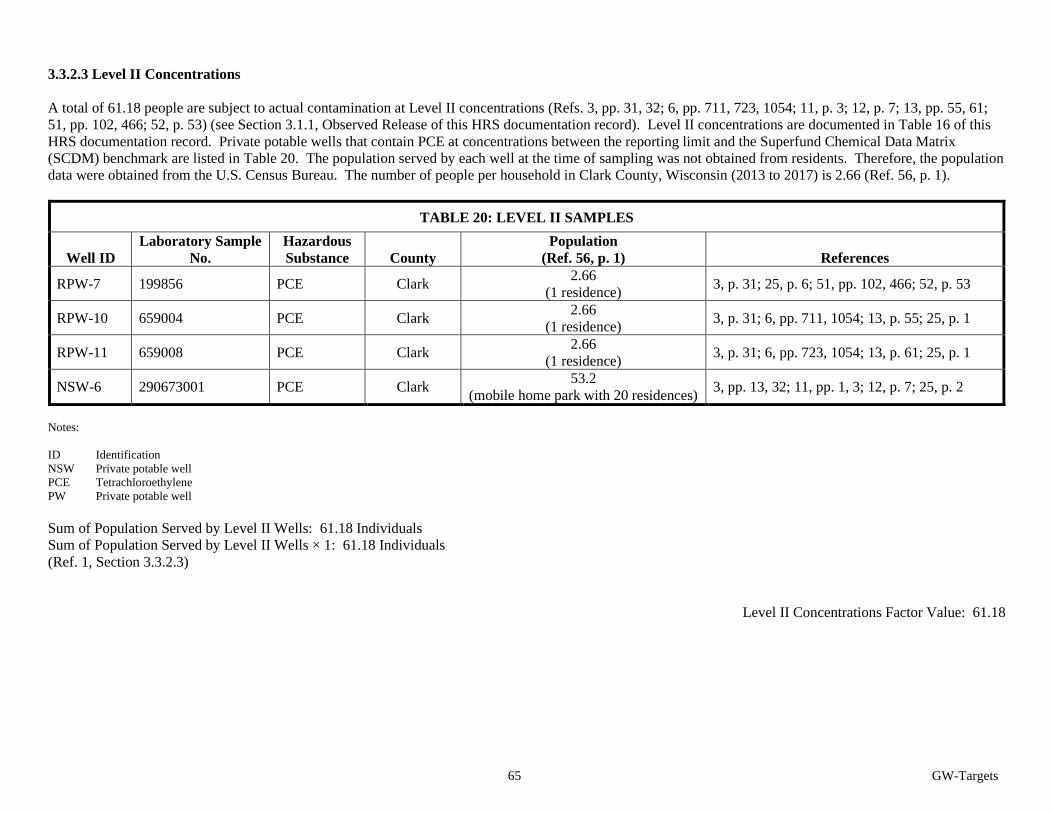
65 GW-Targets
3.3.2.3 Level II Concentrations A total of 61.18 people are subject to actual contamination at Level II concentrations (Refs. 3, pp. 31, 32; 6, pp. 711, 723, 1054; 11, p. 3; 12, p. 7; 13, pp. 55, 61; 51, pp. 102, 466; 52, p. 53) (see Section 3.1.1, Observed Release of this HRS documentation record). Level II concentrations are documented in Table 16 of this HRS documentation record. Private potable wells that contain PCE at concentrations between the reporting limit and the Superfund Chemical Data Matrix (SCDM) benchmark are listed in Table 20. The population served by each well at the time of sampling was not obtained from residents. Therefore, the population data were obtained from the U.S. Census Bureau. The number of people per household in Clark County, Wisconsin (2013 to 2017) is 2.66 (Ref. 56, p. 1).
TABLE 20: LEVEL II SAMPLES
Well ID Laboratory Sample
No. Hazardous Substance County
Population (Ref. 56, p. 1) References
RPW-7 199856 PCE Clark 2.66 (1 residence) 3, p. 31; 25, p. 6; 51, pp. 102, 466; 52, p. 53
RPW-10 659004 PCE Clark 2.66 (1 residence) 3, p. 31; 6, pp. 711, 1054; 13, p. 55; 25, p. 1
RPW-11 659008 PCE Clark 2.66 (1 residence) 3, p. 31; 6, pp. 723, 1054; 13, p. 61; 25, p. 1
NSW-6 290673001 PCE Clark 53.2 (mobile home park with 20 residences) 3, pp. 13, 32; 11, pp. 1, 3; 12, p. 7; 25, p. 2
Notes: ID Identification NSW Private potable well PCE Tetrachloroethylene PW Private potable well Sum of Population Served by Level II Wells: 61.18 Individuals Sum of Population Served by Level II Wells × 1: 61.18 Individuals (Ref. 1, Section 3.3.2.3)
Level II Concentrations Factor Value: 61.18
66 GW-Targets
3.3.2.4 Potential Contamination Potential contamination targets are not scored.
Potential Contamination Factor Value: NS 3.3.2.5 CALCULATION OF POPULATION FACTOR VALUE A value of 521.38 (Level I and Level II) is assigned for the population factor value (Ref. 1, Section 3.3.2.5).
Total Population Factor Value: 521.38 3.3.3 RESOURCES Lynn Farms, Inc. (Lynn Farms) is a commercial dairy farm about 2.5 miles southeast of Source No. 1. Lynn Farms maintains seven high-capacity groundwater wells (Refs. 57; 58; 61, p. 2). The wells are completed as open holes within the crystalline rock aquifer. Crystalline rock is first encountered in the Lynn Farm wells at depths ranging from 10 to 39 feet bls (Ref. 57, pp. 4 through 17). Resources Factor Value: 5 (Ref. 1, Section 3.3.3) 3.3.4 WELLHEAD PROTECTION AREA The Wellhead Protection Program is a pollution prevention and management program designed to protect underground sources of drinking water from contamination (Refs. 59, pp. 2, 14; 60, p. 1). The federal Safe Drinking Water Act, as amended in 1986, required every state to develop a wellhead protection program. A wellhead protection area is defined as the surface and subsurface area surrounding a public water supply well, through which contaminants are reasonably likely to move toward and reach the well. The goal of the federal Wellhead Protection Program is to protect public water supply wellhead areas from contaminants that may exert any adverse effects on the health of people. The Wisconsin Wellhead Protection Program was adopted in August 1993 in accordance with Section 1428 of the Safe Drinking Water Act (Ref. 60, pp. 1, 2). The City of Colby municipal wells and their wellhead protection areas are within the 4-mile radius of Source No. 1 (Refs. 4, pp. 11, 24; 81).
Wellhead Protection Area Factor Value: 5 (Ref. 1, Section 3.3.4)