Embed Size (px)
Citation preview
10/2/95 rev
EXECUTIVE SUMMARY
This report, entitled "Hazard Analysis of Commercial SpaceTransportation," is devoted to the review and discussion ofgeneric hazards associated with the ground, launch, orbital andre-entry phases of space operations. Since the DOT Office ofCommercial Space Transportation (OCST) has been charged withprotecting the public health and safety by the Commercial SpaceAct of 1984 (P.L. 98-575), it must promulgate and enforceappropriate safety criteria and regulatory requirements forlicensing the emerging commercial space launch industry. Thisreport was sponsored by OCST to identify and assess prospectivesafety hazards associated with commercial launch activities, theinvolved equipment, facilities, personnel, public property,people and environment. The report presents, organizes andevaluates the technical information available in the publicdomain, pertaining to the nature, severity and control ofprospective hazards and public risk exposure levels arising fromcommercial space launch activities. The US Government space-operational experience and risk control practices established atits National Ranges serve as the basis for this review andanalysis.
The report consists of three self-contained, but complementary,volumes focusing on Space Transportation: I. Operations; II.Hazards; and III. Risk Analysis. This Executive Summary isattached to all 3 volumes, with the text describing that volumehighlighted.
Volume I: Space Transportation Operations provides the technicalbackground and terminology, as well as the issues and regulatorycontext, for understanding commercial space launch activities andthe associated hazards. Chapter 1, The Context for a HazardAnalysis of Commercial Space Activities, discusses the purpose,scope and organization of the report in light of current nationalspace policy and the DOT/OCST regulatory mission. It alsointroduces some basic definitions and outlines the approach to ageneric Hazard Analysis for future commercial space operations.Chapter 2, Range Operations, Controls and Safety, discusses thetracking and flight control systems, as well as the missionplanning and approval process. The chapter describes theprelaunch ground safety and launch flight safety proceduresdeveloped and enforced at the National Ranges to ensure launchand mission success, personnel safety and to protect the publicfrom the potential impacts of a launch accident. Chapter 3,Expendable Launch Vehicles (ELV) Characteristics, introduces thebasic propulsion technology, configuration and capability foroperational US launch vehicles (Titan, Delta, Atlas/Centaur,Scout) likely to be commercialized in the near term. ELVhistorical launch performance, operational reliability data and
the bearing this record has on public safety issues are alsodiscussed. Chapter 4, Launch and Orbital Operations, describesthe phases of space operations, from ground preparation tolaunch, through orbital transfer, operation and re- entry. Italso provides the reader with sufficient background to understandpossible ELV and mission failures during launch, orbitalmaneuvers and orbit insertion and operation.
Volume II : Space Transportation Hazards identifies and discussesthe major and generic classes of hazards associated with eachphase of space operations. Chapter 5, Pre-launch and LaunchHazards, identifies the types of hazards, such as explosions,fires, toxic vapors and debris, as a function of accidentscenario and time after launch and defines their nature andseverity indices. Further, a comparative perspective onpotential ELV space launch accidents is provided by analogy tomore common and socially accepted transportation and industrialaccidents involving chemicals and fuels. Chapter 6 is devoted toOrbital Collision Hazards, shedding light on the Low Earth Orbit(LEO) and Geosynchronous Earth Orbit (GEO) space environment andthe increasing threat of on orbit collisions to spacecraft. Thesources and density of orbital debris are discussed and theirimplications for the probabilities of collisions involvingoperational satellites are quantified. Chapter 7 defines andreviews Re-Entry Hazards and their quantification by addressingthe orbital lifetime and decay of space objects depending ontheir orbital characteristics, the behavior and survivability ofspace objects upon re-entering Earth's atmosphere and theuncertainties associated with predicting points of entry andground impacts.
Volume III: Space Transportation Risk Analysis introduces themethods and uses of Risk Analysis as they apply to thequalitative evaluation and quantitative assessment of public riskexposure from commercial space operations. Chapter 8 introducesthe concepts of risk acceptability and relative risk and thetools of Risk Analysis Methodology developed for a broad range ofindustrial and regulatory purposes. These include: failureanalysis methods (which focus on failure modes and failurechains); consequence analysis methods (which focus on theseverity of possible consequences of failures); hazard analysismethods (focused on the identification and ranking of hazards);and integrated probabilistic risk analysis methods, such as FaultTree Analysis, which quantify risk as the mathematical product ofan event probability and its consequence magnitude. Chapter 9discusses the Applications of Risk Analysis to Space LaunchOperations as used to date by the Government Agencies (NASA, DOD,DOE) concerned with assuring and maintaining high operability andsafety standards for space launch operations. The chapterreviews the objectives, concepts, tools and uses of risk analyses
conducted at the National Ranges by sponsoring agencies, in lightof de-facto risk/safety goals, criteria and priorities. Finally,Chapter 10 provides an integrated Generic Risk Assessment ofRepresentative Launch Scenarios background by reviewing the riskassociated with typical ELV missions from current Rangelocations. Then the benefits of established Range SafetyControls are quantified, relative to their hypothetical absence,employing the framework of a simplified Community Damage (COMDAM)model in a typical Risk Matrix evaluation procedure.
10/2/95 revACKNOWLEDGMENTS
This report was initiated and sponsored by Norman Bowles,Associate Director of Licensing Programs in the Office ofCommercial Space Transportation (OCST) at the US Department ofTransportation (DOT), to gather and organize a wide range ofmaterials relevant to the hazards of the emerging commercialspace ventures, in order to assist OCST in its rulemaking andlicensing decisions. The analysis focuses on the potentialhazards of space launch activities of interest to the commercialspace transportation industry, based on the US Government launchexperience to date, the methods of analysis and operatingprocedures sucessfully used in managing launch risks. Thisresearch project was directed by Richard Robichaud of the DOTTransportation Systems Center (TSC).
This text includes contributions and review comments from manypeople, who authored sections, contributed information, andrendered constructive criticism. Dr. Aviva Brecher, TSC, aspecialist in space systems and hazard analysis, authored severalchapters, contributed to others, edited and produced the report.Dr. Brecher built on initial efforts of Kevin Kolodzy ofDynatrend, along with Dr. John Stickler and William Hathaway ofTSC, who reported on the topics of expendable launch vehicles,collisions in space and space launch hazards. As the scope ofthe report expanded, Dr. Jon Collins of ACTA Inc., a consultingfirm known for its unique capabilities in rocket hazard andoverflight analysis, contributed chapters on launch and orbitaloperations, Range Safety Controls and operation and hazardanalysis of representative launch scenarios. Also, Dr. AlbertMoussa of BlazeTech Inc., a company specializing in the analysisof fires and explosive hazards, authored the chapter onpropellant hazards and Douglas Furciniti of UNISYS wrote thechapter on re-entry hazards. These individuals also contributedto the overall organization and general critique of thisdocument. Robert A. Rudich of TSC and Douglas J. Furciniti ofDynatrend played a major role in compiling, editing and producingthe present report.
We are grateful to Loyd Parker of the Research TriangleInstitute, who specializes in launch and Range Safety operationsand analysis, for constructive comments and helping TSC obtaincurrent information for this report. Norman Bowles is thankedfor his vision, support, guidance and the review conducted by himand OCST staff members Ronald Gress, Giora Hadar and Dr. RichardWill.
No acknowledgment would be complete without thanking those whosupplied the data and information that provided substance to thisreport. Our thanks are extended to Lou Ullian, Chief Engineerfor Safety of Eastern Space and Missile Center; Col.Niederhauser, Director of Safety, and his staff from the WesternSpace and Missile Center; Weston Wolff, Chief of Operations
Control, and his staff at the White Sands Missile Range. Wethank the management and technical staff of the General DynamicsSpace Systems, Martin Marietta Denver Aerospace, McDonnellDouglas Astronautics Co., LTV Missiles and Electronics Group,AMROC, and Space Services Inc. for cooperation in supplyingindustrial information.
We also wish to express our gratitude to Lana Agnew of Dynatrendfor researching and obtaining reference materials, and to UNISYSstaff for working long and hard in compiling text and assemblingearlier drafts of the report. Of particular note is theeditorial work, patience and skill exhibited by Robert A. Rudich,and by Jim Kelley during the many text revisions and integration.Our gratitude is also extended to A.L. Lavery and the rest ofTSC's Safety and Security Systems staff for their support andassistance.
10/2/95 rev 1. THE CONTEXT FOR A HAZARD ANALYSIS OF COMMERCIAL SPACE
ACTIVITIES
1.1 POLICY AND MARKET CONTEXTA new set of realities, shaping space activities worldwide, must beconsidered in order to provide the context for the nature, scopeand thrust of commercial space efforts in the US. An extensive setof recent Congressional legislation, studies and reports(1-8) hasdocumented the rapidly changing climate for internationalcooperation and competition in space activities and the need forgreater political and economic flexibility in providing access toand services for space exploration and exploitation, if the US isto maintain its leadership in space. The arena of spacetechnology, infrastructure development and new space applicationshas expanded in recent years to include more developed and thirdworld nations.(2,8) In 1986 alone, the USSR had 91 successful spacelaunches vs. the US with 6 and 2 each for China, Japan and ESA(European Space Agency). The US is revising and reshaping itsspace policy and priorities. These changes are needed if it is toprovide the national and international leadership and foster thestability to ensure that, following the initial space explorationand utilization phase, the promise of commercial space developmentbecomes a reality.(3-7) This will enable the US aerospace industryto capitalize on its technical superiority for the benefit ofmankind and economic pay-back.
Both Congress and the Administration have proposed, enacted andpromoted new space commercialization initiatives, most notably inprivatizing remote sensing satellites and promoting the use ofcommercial expendable launch vehicles (ELV's) and launch servicesto place both government and commercial satellites into orbit.(6,7,9)
In May 1983, the President issued a new policy forcommercialization of ELV's and in February 1984, by Executive Order12465 ("Expendable Launch Vehicles in Space"), he designated theDepartment of Transportation (DOT) as the lead agency to facilitateand encourage commercial ELV activities and to license commercialspace operations.
The STS-Challenger disaster and ensuing ELV accidents have severelylimited the US access to space and indirectly provided newopportunities and incentives to ELV manufacturers and to commercialpayloads and launch services providers.(7,10) As a result, allgovernment agencies involved in space activities have beeninstructed to enable, foster and implement the new commercial spacepolicies and laws and to develop the supporting regulatoryframework and technology infrastructure for greater private sectorparticipation in space transportation and development efforts.
1-1
1.2 REGULATORY CONTEXT FOR COMMERCIAL SPACE OPERATIONS
The Commercial Space Launch Act of October 30, 1984 (Public Law 98-575) (the Act), assigned to the Secretary of Transportation theresponsibility for carrying out the Act.(6) The purpose of this Actis:
(1) to promote economic growth and entrepreneurial activitythrough utilization of the space environment for peaceful purposes;(2) to encourage the United States private sector to providelaunch vehicles and associated launch services by simplifying andexpediting the issue of commercial launch licenses, facilitatingand encouraging the use of excess Government-developed space launchcapabilities and transferring technology to the private sector ;(3) to designate an executive department to oversee and coordinatethe conduct of commercial launch operations; to issue and transfercommercial launch licenses authorizing such activities; and toprotect the public health and safety, safety of property, nationalsecurity and foreign policy interests of the United States.
In 1984, the Secretary of Transportation created the Office ofCommercial Space Transportation (OCST) and delegated to it theSecretary's responsibilities. As stated in Section 8(a)(2) of theAct, the Secretary is charged with prescribing "requirements as arenecessary to protect the public health and safety, safety ofproperty, and national security and foreign policy interests of theUnited States."
To carry out this responsibility, OCST established a program todevelop safety and regulatory requirements for commercial spacelaunch license applicants.(12) The Transportation Systems Center(TSC) is providing technical support to OCST to this end and hasbeen assisting in the development of launch safety requirementsbased on the Preliminary Hazards Analysis embodied in this report.
However, it must be made clear that the focus of OCST licensing andregulatory activities is primarily on public safety and not onmission success.(6,12) This unique perspective and mandate for DOTis and will be reflected in the OCST safety research, rule makingand licensing activities. DOT will have to regulate not justcommercial launch sites and commercial launches, but payloadslaunched aboard these vehicles. These include retrievablematerials processing, re-entry systems, non-government researchactivities and many other, as yet unforeseen, commercial spacesystems.
DOT/OCST will also license the construction and operation of newprivate launch Ranges, as well as any commercial Range Safetyservices.(12) OCST will also specify the certification requirements
1-2
for Range Safety personnel and launch services providers, thatmight impact the public safety. Under the Act, DOT must also issuelicenses for any launch vehicle or operation on foreign territoryby a US citizen or company.
1.3 PURPOSE AND SCOPE OF REPORT: HAZARD ANALYSIS OR RISKASSESSMENT
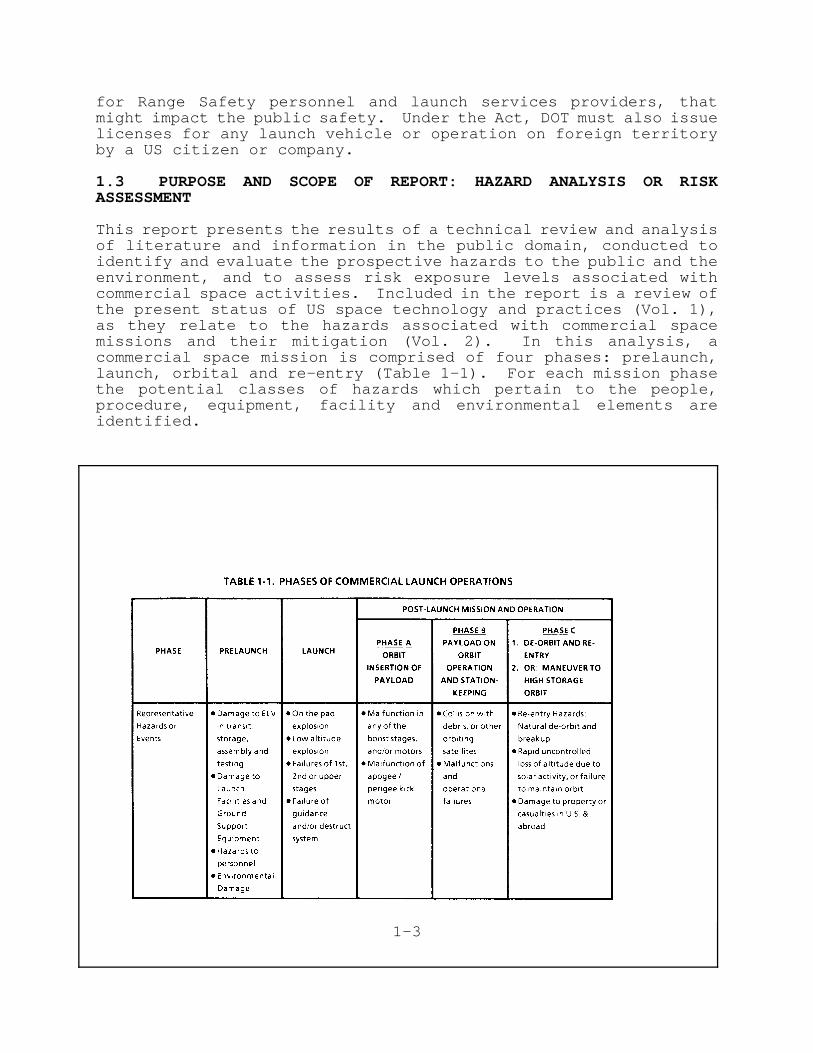
This report presents the results of a technical review and analysisof literature and information in the public domain, conducted toidentify and evaluate the prospective hazards to the public and theenvironment, and to assess risk exposure levels associated withcommercial space activities. Included in the report is a review ofthe present status of US space technology and practices (Vol. 1),as they relate to the hazards associated with commercial spacemissions and their mitigation (Vol. 2). In this analysis, acommercial space mission is comprised of four phases: prelaunch,launch, orbital and re-entry (Table 1-1). For each mission phasethe potential classes of hazards which pertain to the people,procedure, equipment, facility and environmental elements areidentified.
1-3
These hazards have been identified and evaluated in light ofDOT/OCST's mission, based on the review of existing literature andpractice of space related risk analyses (Vol.3).
The following definitions will aid the reader with the assimilationof information in this report. An extensive Glossary of terms hasbeen provided (Appendix A) and a discussion of terminology andprocedures is given in Chapter 8 (Vol. 3).
An accident is defined as an undesirable event resulting from anyphase of commercial ELV launch operations and space activities withthe potential to cause injury or death to people, or damage toproperty.
Risk assessment is the systematic examination of an actual orproposed system or operation, to identify and evaluate potentiallyhazardous events and their consequences. The principal purpose ofsuch an analysis is to assist policy makers, regulators andmanagers in deciding on risk avoidance, risk reduction ormitigation strategies. It can lead to either confirming thecontinued acceptability of a system or operation from the safetypoint of view, or setting new risk acceptability and regulatorythresholds for the protection of public safety (see Ch. 8, Vol. 3).Although the terms Risk Assessment and Hazard Analysis are bothused in this report in nearly synonymous fashion, the latter ispart of the former. There are other closely related terms used inthe literature in similar contexts: "Hazard" is often interchangedwith "Risk", and "Analysis" for "Assessment", thus giving fourcommon usage expressions, namely: risk assessment, risk analysis,hazard assessment and hazard analysis.
i) An Analysis is typically a technical procedure following anestablished pattern;
ii) An Assessment is the consideration of the results of analysisin a wider context to determine the significance of the analyticalfindings;
iii) A Hazard is considered to be an existing property, condition,or situation, which has the potential to cause harm. For example,liquid hydrogen used as a rocket propellant is a hazard because ofits chemical nature, and intrinsic flammability and explosiveness.
iv) Risk is related to both the consequences of an accident (i.e.,hazard potential being realized and causing harm) and itslikelihood of occurrence (Ch. 8, Vol.3). Risk is mathematicallyexpressed as the product of the probability of an accident and themagnitude of its consequence. Thus, the risk from a liquidhydrogen tank is the product of the probability that itscontainment will fail and the magnitude of the resulting explosion
1-4
and/or fire damage. Hence, people and property may be considered"at risk" from a nearby hazard.
v) An Accident occurs when the hazard potential for damage isactivated by a stimulus and results in damage to a given system,component or operation, or in injury to people. Other operationaland technical definitions for terms used throughout the report aregiven in the Glossary (Appendix A).
It must be kept in mind that a system or operation is considered tobe "safe" when its risks are deemed economically, socially andpolitically acceptable, based on prevailing standards. These issueswill be discussed and illustrated in detail in Vol. 3.
1.4 APPROACH TO HAZARD ANALYSIS FOR COMMERCIAL SPACE OPERATIONS
For over two decades, the US Government has been one of the worldleaders in the development and exploration of outer space. In thisrole, the Government mission agencies (NASA and DOD) have developedand successfully implemented launch safety requirements in supportof a wide variety of space missions (see Chs. 2 and 4 of Vol.1).Launch safety requirements have been established for both unmannedand manned space systems and operations, as well as for integrationof specific payloads. As such, the standards presently in use atGovernment Ranges have evolved not only out of the need to protectthe public safety and property, but also from the need to protectlaunch site personnel, facilities and on board astronauts; toensure mission success; to evaluate launch vehicle performance; andto provide research results that would assist in expanding thenational space exploration effort.
Since the only currently available launch sites are National Rangesowned and operated by US Government agencies (DOD and NASA as firstparties), the basic launch and system safety regulations now inplace at these facilities will probably continue to be observed inthe near future by any commercial launch vehicle provider oroperator that requires access to and use of Government launchfacilities (second party). Cost, access and time constraints mayinfluence the viability of commercial launch operations on theseRanges, while vehicle reliability and safety will remain majorconcerns. Recognizing this situation, OCST has undertaken aneffort to examine ELV safety standards, launch hazards and riskanalysis methods to ensure the protection of public safety andproperty(12) (third party), as opposed to Government launch facility(first party) and ELV or satellite manufacturers and operators(second party) who enter User Agreements.
As the initial effort in the development of a program to addressthe safety issues, this report focuses on the identification andevaluation of the safety hazards associated with ELV's and their
1-5
launch operations from established and available Government Rangesas well as new launch sites that may be developed and operated inthe future by commercial entities, or in partnership with statesand federal entities.
Protecting the public health and safety as stated in the Act,requires that safety regulations be directed at preventing theoccurrence of potentially hazardous accidents and at minimizing ormitigating the consequences of hazardous events. This will beaccomplished by employing system safety concepts and riskassessment methodology to identify and resolve prospective safetyhazards. The first step in applying system safety concepts is todefine the commercial space launch hazards (preliminary hazardanalysis, PHA). With the hazards defined, it is then possible toidentify and rank those associated with each specific commercialspace launch. Only after the hazards have been identified andsatisfactorily assessed, will the goal of providing the public withthe highest degree of safety practical have been accomplished. Forthe preliminary hazard analysis (PHA) presented in this report(Vol. 2), the operational commercial space launch phases have beendefined as follows:
1. Prelaunch; 2. Launch; 3. Orbit; 4. Re-entry
For each of these life and operability phases of the commercialspace launch process, it is possible to identify the genericclasses of hazards that are associated with each phase (see Table1-1)and to define appropriate regulatory oversight. To identifythese hazards, a clear understanding of the system and itsoperation is necessary, as well as an analysis of the relevantaccident history for specific launch systems and subsystemsduring each phase of launch operation. An analysis of previousaccidents is necessary, but not sufficient, for the identificationof prospective hazards, since both vehicle configurations (see Ch.3, Vol. 1) and launch and Range Safety procedures (see Ch. 2,Vol.1) have improved with time. In 30 years of Government spacelaunch activities and ELV operations to date, both the military andcivilian sectors have had an excellent safety record and there havebeen no major accidents with reported public injuries. Therefore,the data base from which the hazards can be identified is limited,and known to be incomplete, with rare identical failures (seeCh.3). Furthermore, an examination of historical launch data canprovide only a tentative list of probable causes and likelyaccident scenarios and may be incorrect for the purpose ofprojecting future performance. Special statistical methods mayhave to be used to account for "learning" from past failures inorder to avoid repeating them (see Ch. 9, Vol.3).(7) Previousgovernment ELV and space missions will, however, have to be used togenerate a set of representative, expected, and projectedcommercial space launch missions (see Ch. 10, Vol.3). This
1-6
approach will allow us to examine and evaluate generic hazardsassociated with commercial space ELV missions (see Chs. 5-7,Vol.2).
1.5 OVERVIEW OF THE REPORT ORGANIZATION
This report is intended to inform and educate a broad readership onthe generic sources and nature of hazards associated with spacelaunch activities. Therefore, it is intended to provide both thenecessary technical background and the specific hazard analysismethodology, in order to enable a non-technical reader tounderstand and appreciate the variety of technical issues involved.
Volume 1: Space Transportation Operations provides the backgroundon Range Operations (Ch. 2), current Expendable Launch Vehicles(Ch. 3), and Space Launch and Orbital Missions (Ch. 4). Chapter 2describes the Range Safety Control systems in place and establishedpractices at the National Ranges. Chapter 3 introduces the basictechnology, and typical proven and proposed configurations of ELV'slikely to be used for commercial space missions in the near future.
The historical reliability based on launch success/failurestatistics for the major classes of operational ELV's in the US arealso presented in Chapter 3. Chapter 4 describes the space launchand orbital operational phases.
Volume 2: Space Transportation Hazards introduces the genericclasses of hazards associated with the use of these ELV's in spacelaunch operations. Chapter 5 discusses fires, explosions, toxicvapor clouds and debris impacts.
A relative risk context is provided in Chapter 5 to enable thereader to judge launch hazards by comparison with other common industrial and transportation hazards. Chapter 6 discusses orbitalcollision hazards to satellites in low and geosynchronous Earthorbits. Chapter 7 reviews and evaluates those hazards to peopleand property associated with both controlled, and uncontrolled re-entry of space objects.
Volume 3: Space Transportation Risk Analysis deals with theanalytical tools available to assess public risks (Ch.8), themodeling and application of such tools to space operations (Ch.9)and illustrates the specific risks associated with commercial ELVlaunches in the near future (Ch.10).
Since DOT/OCST will sponsor and perform risk assessment/riskmanagement research to support commercial space launch licensingreviews and awards, Chapter 8 defines and introduces the standardmethods of Risk Assessment. Chapter 9 reviews the publishedtechnical risk assessments conducted for selected spaceapplications, focusing specifically on when, how and why such risk
1-7
studies were conducted and on the software tools available for thispurpose.
Finally, in Chapter 10, an illustration of risk analysis isprovided for representative ELV launch/mission scenarios whichindicates how the public risk exposure from commercial spaceactivities may be estimated, both with and without Range Safetycontrols in place. Also, a conceptual risk assessment andacceptability matrix is provided for comparing public risk levelsassociated with each phase of space launch operations. Thebenefits of Range Safety control systems and practices now enforcedat Government Ranges as the key safeguards to manage and minimizethe public risk exposure from future space activities to"acceptable" levels are made clear in Chapter 10.
1-8
REFERENCES TO CHAPTER 1
1. "Civilian Space Policy and Applications," US Congress, Officeof Technology Assessment, OTA-STI-178, June 1982.
2. "International Cooperation and Competition in Civilian SpaceActivities," US Congress, OTA-ISC-240, July 1984.
3. "Civilian Space Stations and the US Future in Space," OTA-STI-241, Nov. 1984.
4. "Commercialization of Land and Weather Satellites," USCongress, House Committee on Science and Technology, 1983.
5. "Pioneering the Space Frontier," Report of the NationalCommission on Space, May 1986.
6. (a) "Commercial Space Launch Act," (Report to accompany HR3942), US Congress, House Committee on Science and Technology,1984.(b) "The Expendable Launch Vehicle Commercialization Act," ibid.,1986.(c) "The Land Remote - Sensing Commercialization Act of 1986,"(Report to accompany HR 5155), ibid, 1984.
7. "Space Issues", (Info Pack IP 371) and attached Issue Briefs:IB86121 "Space Launch Options after the Shuttle Accident," and IB87018 "Space Policy," prepared by the Congressional ResearchService (CRS).
8. "Space Activities of the United States, Soviet Union and OtherLaunching Countries: 1957-1986," by Marcia Smith, US Congress, CRS87-229 SPR (Feb. 1988).
9. "Encouraging Business Ventures in Space Technologies,"National Academy. of Public Administration Report for NASA, 1985.
10. Report of the Presidential Commission on the Space ShuttleChallenger Accident, June 1986.
11. "Space Stations and the Law: Selected Legal Issues,"Background Paper, US Congress, OTA-BP-ISC-41, August 1986.
12. (a) "Commercial Space Transportation; Licensing Process forCommercial Space Launch Activities; Notice of Policy and Requestfor Comments," 14 CFR Ch. III, Feb. 25, 1985 (FR 50, No. 37, p.7714 et seq.)(b) "Commercial Space Transportation; Licensing Regulations;Interim Final Rule and Request for Comments," 14 CFR Ch. iii, Feb.26, 1986 (FR 51, No. 38, p. 6871 et seq.)(c) "Commercial Space Transportation; Licensing Regulations; FinalRule," April 4, 1988 (FR 53, No. 64, p. 11004 et seq.)
1-9
10/2/95 rev2. RANGE OPERATIONS, CONTROLS AND SAFETY
2.1 RANGE CHARACTERISTICS FOR SAFE OPERATION
2.1.1 US Government Launch Sites
The US Government has traditionally operated separate civilianand military space programs. NASA is the lead agency forcivilian space activities, and assists as necessary, theDepartments of Energy, Interior, Commerce, Transportation andAgriculture which also maintain space research and utilizationprograms.
The US Space Command (US SPACECOM) coordinates all military spaceactivities, but the three services also have operational SpaceCommands. DOD recently established a Consolidated Space TestCenter (CSTC) under the Space and Missile Test Organization(SAMTO). A very recent DOD regulation governing military Rangeactivities designated the Air Force as the lead agency for thetri-service conceptual Space Test Range at Onizuka AFB, inCalifornia, with a special focus on safety issues.
The Eastern Test Range (ETR) is under the direction of the USAFEastern Space and Missile Center (ESMC) at Patrick Air ForceBase, Florida, and the Western Test Range (WTR) is under thedirection of the USAF Western Space and Missile Center (WSMC) atVandenberg Air Force Base, California. WTR launches are fromVandenberg Air Force Base; ETR launches are from the CapeCanaveral Air Force Station (CCAFS). NASA space missions arelaunched from the Florida Kennedy Space Center (KSC), also onCape Canaveral and occasionally from WFF.
The United States has a major launch site in Florida at CapeKennedy (NASA) and CCAFS (DOD) for manned, lunar and planetarylaunches, and for launching satellites to geostationary orbit(primarily for weather and communications). It has another majorWest Coast launch site at Vandenberg Air Force Base (VAFB),California, for satellites (including weather, Earth resources,navigation and reconnaissance) which must go into polar orbits.A smaller launch site for small space payloads and for sub-orbital research rockets is the NASA/Goddard Space Flight Center(GSFC) Wallops Flight Facility (WFF) site at Wallops Island,Virginia. Sub-orbital launches and short-range vertical testingare accomplished at White Sands, New Mexico, from the White SandsMissile Range (WSMR). In addition, the US Government hasconducted launches from a number of other CONUS and off-shoresites.
Each of the National Ranges has unique capabilities related toits mission, siting and facilities, as well as specificrequirements for the Range Users (see Vol. 3, Chs. 9, 10). The
2-1
safety philosophy of ground and Range operations is generallythat of dealing with controlled, managed and acceptable risks.Procedures have been established to handle and store allmaterials (propellants, etc.) which may be a hazard, control andmonitor electromagnetic emissions and govern transportation ofmaterials to and from the facility.(4) The storage of propellantsand explosives used in Expendable Launch Vehicles (ELV's) iscontrolled by quantity-distance criteria, as specified.(3)
Failure modes and effects analyses (FMEA) are prepared, whennecessary, for all potentially hazardous activities and devices(see Ch. 8). Quantitative risk analysis has rarely been used toestablish launch and space operational risk because of theconservative philosophy of vehicle design, ground and launchprocedures and the difficulty in developing realistic estimatesof hazardous event probabilities and accident scenarios (seediscussion in Vol 3, Chs. 9 and 10).
Since there are currently no private commercial space launchrange facilities in the US, we will describe the past and currentpractices at US Government Range facilities. It is assumedthroughout this report that the level of operational safety atlicensed commercial space facilities will be comparable orequivalent to the level of safety maintained at US GovernmentRanges.
2.1.2 Ground Operations and Safety
One of the principal responsibilities of the launch Range is toperform all of those tasks which eliminate, or at leastacceptably minimize, the hazards from an expendable launchvehicle (ELV), both prior to and during the launch.(1-3) This isaccomplished by establishing:
(1) requirements and procedures for storage and handling ofpropellants, explosives, radioactive materials and toxics;
(2) performance and reliability requirements for flighttermination systems (FTS) on the vehicle;
(3) a real-time tracking and control system at the Range; and(4) mission abort, vehicle destruct or flight termination
criteria which are sufficient to provide the necessaryprotection to people both within (on- Range) and outside(down-Range) the boundaries of the launch facility.
At each Range there is a hierarchy of regulations andrequirements for Ground and Launch safety implementation (seealso Chs. 6, 7, Vol. 2). Generally, the National Ranges takeresponsibility for the vehicle handling and safe operation fromreceipt until the time of orbital insertion. Safety issuesassociated with on-orbit impacts and re-entry from orbit are notnormally the responsibility of the Range (see Chs. 6, 7, Vol. 2).
2-2
Control of public risks from jettisoned stages and hardware priorto orbital insertion are a Range responsibility.
The following sections provide a general introduction to thevarious aspects of planning, ground operations and flightcontrol, all with a specific emphasis on safety. Chapter 10 inVol. 3 provides a more detailed discussion of launch hazards andtheir minimization by Range Safety controls.
2.1.3 Range Safety Control System
The NASA "Range Safety Handbook" states: "The flight safetygoals are to contain the flight of all vehicles and preclude animpact which might endanger human life, cause damage to propertyor result in embarrassment to NASA or the US Government.Although the risk of such an impact can never be completelyeliminated, the flight should be carefully planned to minimizethe risks involved while enhancing the probability for attainingthe mission objectives."(7)
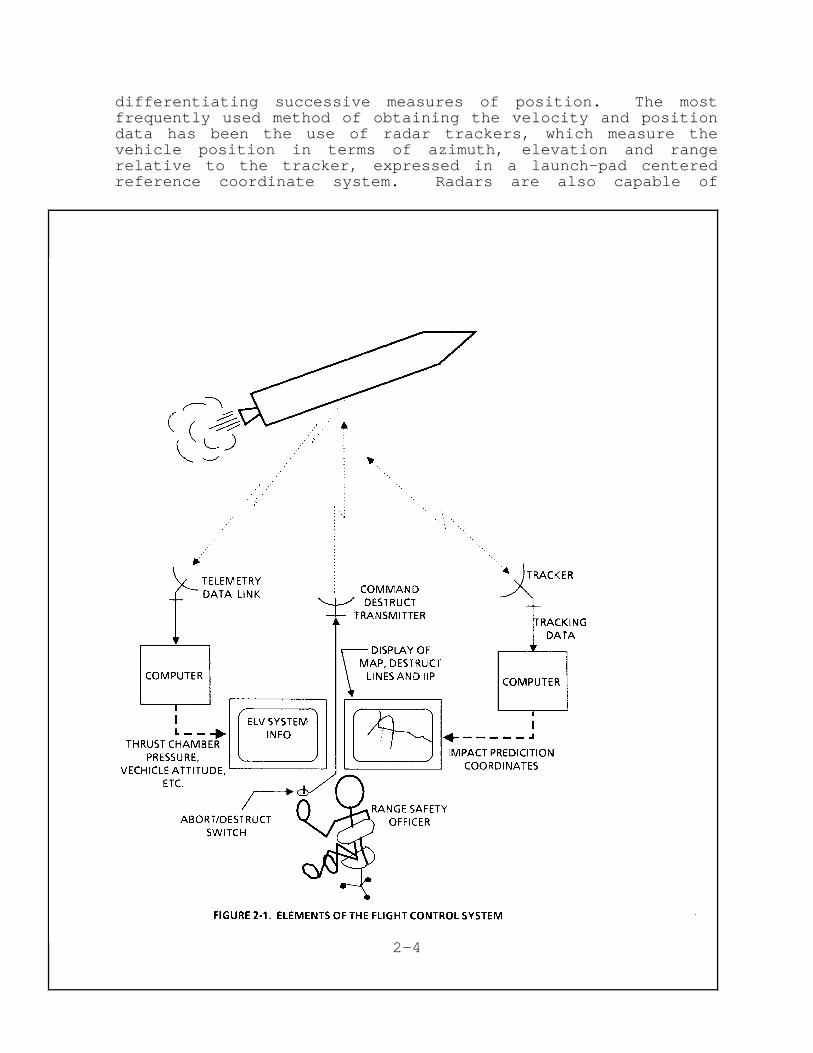
The real-time Range Safety (or Flight) Control System mustaccurately and reliably perform the following functions:(1) Continually monitor the launch vehicle performance and
determine whether the vehicle is behaving normally orfailing;
(2) Track the vehicle and predict (in real-time) where thevehicle or pieces of the vehicle will impact in case offailure and if flight termination action is taken;
(3) Determine if there is a need to delay or abort the launch ordestruct the vehicle, based on a comparison of predeterminedcriteria with the current vehicle status; and
(4) If necessary to protect the public, send a command to abortthe mission either by vehicle destruct or engine shutdown(thrust termination). Note that the term "destruct" is usedgenerically in this report to denote flight terminationactions for Range Safety purposes. In reality, thrust (andthe flight) can be terminated on command for some ELV'swithout vehicle destruction.
Figure 2-1 describes pictorially the activities of the variouselements of the Range Safety Control System.
Vehicle performance is determined at all Ranges by visualobservation (early in flight) and by real-time telemetrymeasurements of vehicle status as a back-up to the computed(wind-corrected) behavior of the instantaneous impact point(IIP), discussed below in more detail. The actual location ofthe vehicle is less important than where the vehicle and itsdebris will land in case of both normal operation, accidentalfailure, abort or destruct. Therefore, in tracking a vehicle,velocity data must be obtained either directly or by
2-3
differentiating successive measures of position. The mostfrequently used method of obtaining the velocity and positiondata has been the use of radar trackers, which measure thevehicle position in terms of azimuth, elevation and rangerelative to the tracker, expressed in a launch-pad centeredreference coordinate system. Radars are also capable of
2-4
determining range rate, i.e., the rate at which a vehicle ismoving toward or away from the radar. A single tracker near thelaunch pad can provide satisfactory information for two or moreminutes of flight depending on the rate at which the launchvehicle is traveling away from the tracker. The quality/accuracyof the tracking data is often affected by several factors, two ofwhich are: (1) multi-path of returned signals which occurs atlow antenna elevation angles; and (2) the plume signalattenuation due to high temperature ionization caused by thesolid rocket motor exhaust. Multiple radar trackers are used tominimize these problems and to provide redundant measurements, sothat failure of a single tracker will not jeopardize the mission.Early in flight, when the launch vehicle is still close to theground, the radar may not be able to track the vehicle. In thiscase, visual observation and telemetry may be the only means ofdetermining whether there is a malfunction and whether thevehicle maintains the correct attitude. Position and velocitydata, along with the predicted instantaneous impact point (IIP)are typically displayed in real-time in the Launch Control Center(LCC).
Although not yet applied at the National Ranges, it is possibleto use satellite information for determination of vehicleposition and velocity. An electronics package on board thelaunch vehicle could collect information for calculating therange relative to several separately located navigationsatellites and could be telemetered to a ground station,processed and converted into vehicle position and velocity. Thiswill become practical when the Global Positioning System (GPS)satellites become operational. Some Ranges have used three ormore geographically spaced telemetry antennas and associatedcomputer equipment to infer the vehicle position and velocityfrom the Doppler phase shift of the received telemetry signals.
The launch vehicle velocity and position information aregenerally used to compute an instantaneous impact point (IIP).The IIP is displayed on a screen or chart indicating where thevehicle will impact on the surface if flight were to be abortedat that instant. This impact point is usually computed, assumingno atmosphere, as a vacuum IIP (VIIP) which allows simpler andmore rapid trajectory computation. Inclusion of atmospheric dragis generally not necessary to satisfy the objectives of the real-time Range Safety. However, a drag and wind correction isapplied in some cases.
Early in the flight the IIP advances slowly, but as the vehiclealtitude, velocity and acceleration increase, the IIP change ratealso increases. Very early in flight, the IIP change rateincreases from zero to several miles per second. Later, itincreases to tens of miles and then hundreds of miles per second.As the vehicle reaches orbital velocity, the IIP rate essentiallygoes to infinity because the vehicle will no longer come down.
2-5
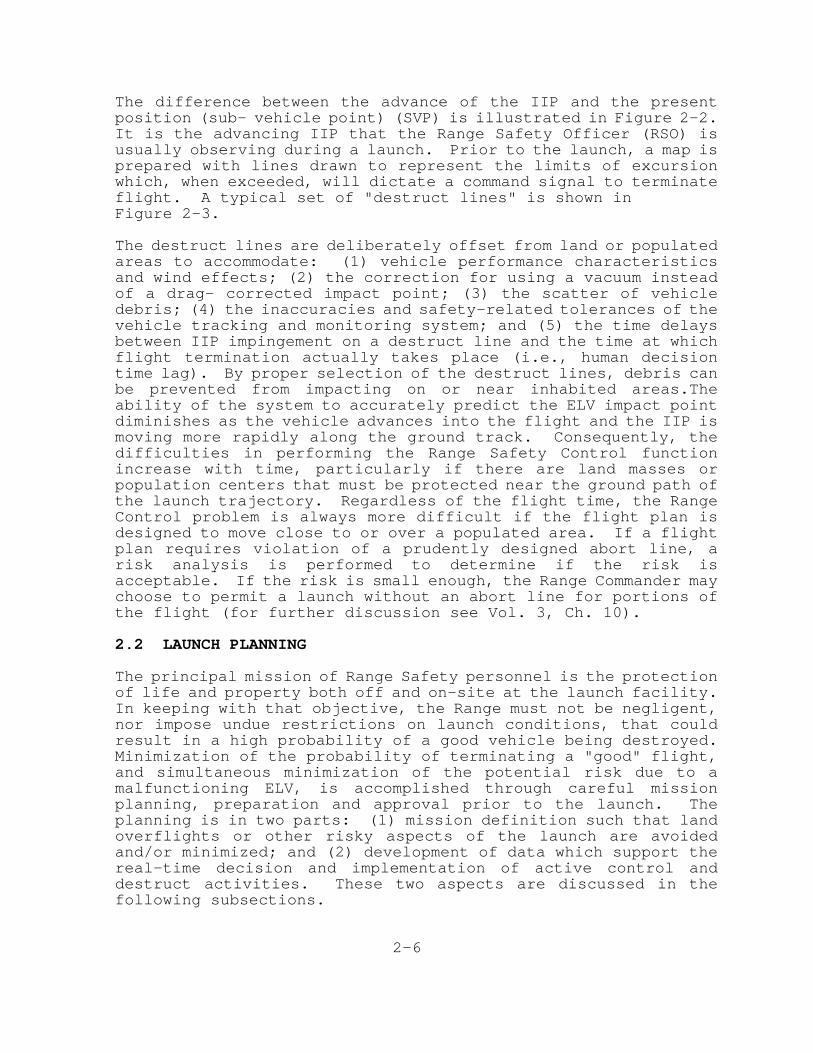
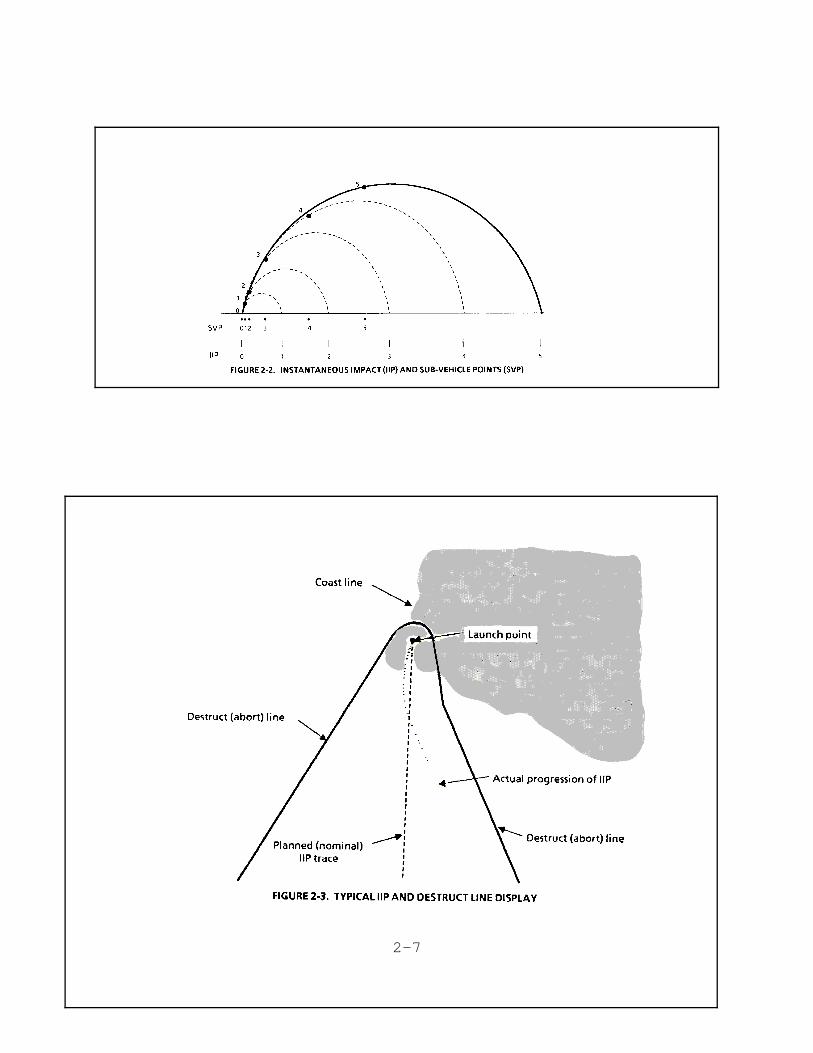
The difference between the advance of the IIP and the presentposition (sub- vehicle point) (SVP) is illustrated in Figure 2-2.It is the advancing IIP that the Range Safety Officer (RSO) isusually observing during a launch. Prior to the launch, a map isprepared with lines drawn to represent the limits of excursionwhich, when exceeded, will dictate a command signal to terminateflight. A typical set of "destruct lines" is shown in Figure 2-3.
The destruct lines are deliberately offset from land or populatedareas to accommodate: (1) vehicle performance characteristicsand wind effects; (2) the correction for using a vacuum insteadof a drag- corrected impact point; (3) the scatter of vehicledebris; (4) the inaccuracies and safety-related tolerances of thevehicle tracking and monitoring system; and (5) the time delaysbetween IIP impingement on a destruct line and the time at whichflight termination actually takes place (i.e., human decisiontime lag). By proper selection of the destruct lines, debris canbe prevented from impacting on or near inhabited areas.Theability of the system to accurately predict the ELV impact pointdiminishes as the vehicle advances into the flight and the IIP ismoving more rapidly along the ground track. Consequently, thedifficulties in performing the Range Safety Control functionincrease with time, particularly if there are land masses orpopulation centers that must be protected near the ground path ofthe launch trajectory. Regardless of the flight time, the RangeControl problem is always more difficult if the flight plan isdesigned to move close to or over a populated area. If a flightplan requires violation of a prudently designed abort line, arisk analysis is performed to determine if the risk isacceptable. If the risk is small enough, the Range Commander maychoose to permit a launch without an abort line for portions ofthe flight (for further discussion see Vol. 3, Ch. 10).
2.2 LAUNCH PLANNING
The principal mission of Range Safety personnel is the protectionof life and property both off and on-site at the launch facility.In keeping with that objective, the Range must not be negligent,nor impose undue restrictions on launch conditions, that couldresult in a high probability of a good vehicle being destroyed.Minimization of the probability of terminating a "good" flight,and simultaneous minimization of the potential risk due to amalfunctioning ELV, is accomplished through careful missionplanning, preparation and approval prior to the launch. Theplanning is in two parts: (1) mission definition such that landoverflights or other risky aspects of the launch are avoidedand/or minimized; and (2) development of data which support thereal-time decision and implementation of active control anddestruct activities. These two aspects are discussed in thefollowing subsections.
2-6
2-7
2.2.1 Mission Planning
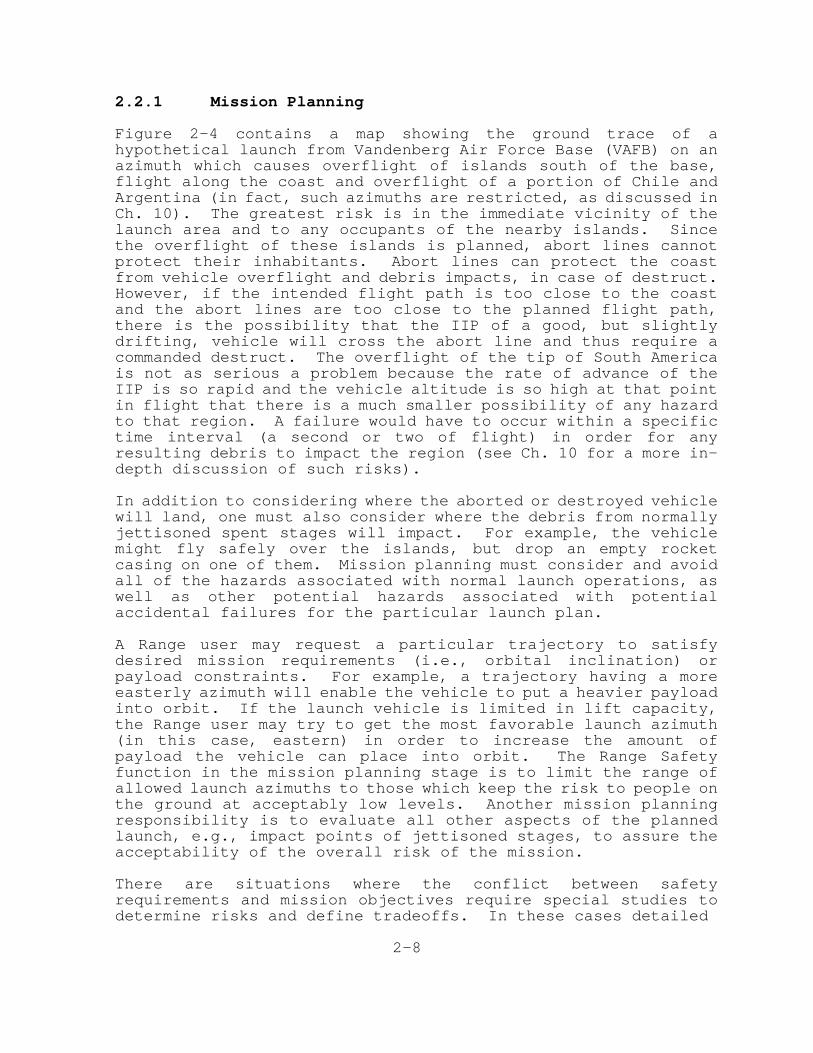
Figure 2-4 contains a map showing the ground trace of ahypothetical launch from Vandenberg Air Force Base (VAFB) on anazimuth which causes overflight of islands south of the base,flight along the coast and overflight of a portion of Chile andArgentina (in fact, such azimuths are restricted, as discussed inCh. 10). The greatest risk is in the immediate vicinity of thelaunch area and to any occupants of the nearby islands. Sincethe overflight of these islands is planned, abort lines cannotprotect their inhabitants. Abort lines can protect the coastfrom vehicle overflight and debris impacts, in case of destruct.However, if the intended flight path is too close to the coastand the abort lines are too close to the planned flight path,there is the possibility that the IIP of a good, but slightlydrifting, vehicle will cross the abort line and thus require acommanded destruct. The overflight of the tip of South Americais not as serious a problem because the rate of advance of theIIP is so rapid and the vehicle altitude is so high at that pointin flight that there is a much smaller possibility of any hazardto that region. A failure would have to occur within a specifictime interval (a second or two of flight) in order for anyresulting debris to impact the region (see Ch. 10 for a more in-depth discussion of such risks).
In addition to considering where the aborted or destroyed vehiclewill land, one must also consider where the debris from normallyjettisoned spent stages will impact. For example, the vehiclemight fly safely over the islands, but drop an empty rocketcasing on one of them. Mission planning must consider and avoidall of the hazards associated with normal launch operations, aswell as other potential hazards associated with potentialaccidental failures for the particular launch plan.
A Range user may request a particular trajectory to satisfydesired mission requirements (i.e., orbital inclination) orpayload constraints. For example, a trajectory having a moreeasterly azimuth will enable the vehicle to put a heavier payloadinto orbit. If the launch vehicle is limited in lift capacity,the Range user may try to get the most favorable launch azimuth(in this case, eastern) in order to increase the amount ofpayload the vehicle can place into orbit. The Range Safetyfunction in the mission planning stage is to limit the range ofallowed launch azimuths to those which keep the risk to people onthe ground at acceptably low levels. Another mission planningresponsibility is to evaluate all other aspects of the plannedlaunch, e.g., impact points of jettisoned stages, to assure theacceptability of the overall risk of the mission.
There are situations where the conflict between safetyrequirements and mission objectives require special studies todetermine risks and define tradeoffs. In these cases detailed
2-8
risk analyses are performed using models that consider theprobability of the vehicle failing in a variety of modes andsimulate the behavior of the missile during and aftermalfunction,including the effect of activating the flighttermination system.
Such risk analyses usually compute the land impact probabilityand associated casualty expectation (the average number ofcasualties expected per launch). Typically, missions withcasualty expectations of less than one in a million areconsidered reasonably safe. If the risks are higher, the missionordinarily comes under more scrutiny (see Chs. 9, 10 for moredetailed discussion).
One of the options for maintaining a low risk for a launch is tomove the abort lines away from the populated areas and closer tothe trace of the IIP for the nominal trajectory. While thisdecreases the overall launch risk, it increases the probabilityof aborting a good vehicle. Considering the very high value ofmany of the launch vehicles and their payloads, these tight abortlines put additional pressure on the Range Safety Officer (RSO)who must decide on an active destruct command.
2-9
Another option to minimize the risk of a normal, or failed,launch to the population surrounding the Range is to place muchtighter constraints on the tolerable wind and othermeteorological conditions at the time of the launch.
2.2.2 Standard Procedures to Prepare for a Launch
The National Ranges have provided standards and requirements fororganizations desiring to launch vehicles from their facilities.For example, the United States Air Force has specific safetyrequirements issued for each of the Ranges under USAF control.These documents describe the safety policy and procedures andalso define the data submittal and launch preparationrequirements for the Range user.(1,2) The categories covered bythese requirements include ground safety (handling ofpropellants, ordnance, noise, hazardous operations, toxics,etc.), flight analysis (vehicle trajectory, mission, etc.),flight termination systems (FTS), ground operations and flightoperations. Included in the flight analysis portion arerequirements for trajectory modeling and descriptions along withthe dynamic characteristics of the vehicle during a malfunctionturn.This information is used by Range personnel to construct theabort lines. Ref. 5 is an example of the equipment requirementsto support typical missions from a National Range.
2-10
REFERENCES TO CHAPTER 2
1. "Range Safety Requirements, Range Safety Regulation," ESMCRegulation 127-1, Dept. of the Air Force, Headquarters EasternSpace and Missile Center (AFSC), Patrick Air Force Base, Florida,July 30, 1984.
2. "Range Safety Requirements, Range Safety Regulation," WSMCRegulation 127-1, Dept. of the Air Force, Headquarters WesternSpace and Missile Center (AFSC), Vandenberg Air Force Base,California, May 15 1985.
3. Air Force Regulation (AFR) 127-100, Safety-Explosives SafetyStandards (May, 1983; 2nd revision Jan., 1985).
4. Hazards of Chemical Rockets and Propellants Handbook: Vol.I, General Safety Engineering Design Criteria; Vol. II, SolidRocket Propellant Processing, Handling, Storage, andTransportation; Vol. III, Liquid Propellant Handling, Storage,and Transportation. CPIA 394, Vol. I, II, and III. ChemicalPropulsion Information Agency, 8621 Georgia Ave, Silver Spring MD20910, September, 1984.
5. "Missile Flight Control Operations Requirements," WSMCMFCOR, Dept. of the Air Force, Headquarters Western Space andMissile Center (AFSC), Vandenberg Air Force Base, California, 3January 1984.
6. "Space Activities of the US, Soviet Union and otherLaunching Countries: 1957-1986", M.S. Smith, C.R.S. US CongressReport 87-229 SPR, Feb. 1987.
7. "Range Safety Handbook", NASA GHB 1771.1, Sept. 1984.
2-11

6/20/95 rev3. EXPENDABLE LAUNCH VEHICLE (ELV) CHARACTERISTICS
Currently under revision.
10/2/95 rev4. LAUNCH AND ORBITAL OPERATIONS 1
4.1 PHASES OF LAUNCH THROUGH ORBITAL OPERATION
Launch and orbital operations can be divided into two or threephases:(1) the initial launch and boost phase which terminates when thevehicle obtains the velocity and altitude necessary to achieveEarth orbit;(2) the orbital transfer phase, during which properly timedfirings of rocket motors move the satellite into the desiredfinal orbit; and(3) depending upon the mission, return from orbit. Re-entry isfurther discussed in Vol. 2, Ch. 7.
4.1.1 Launch Phase
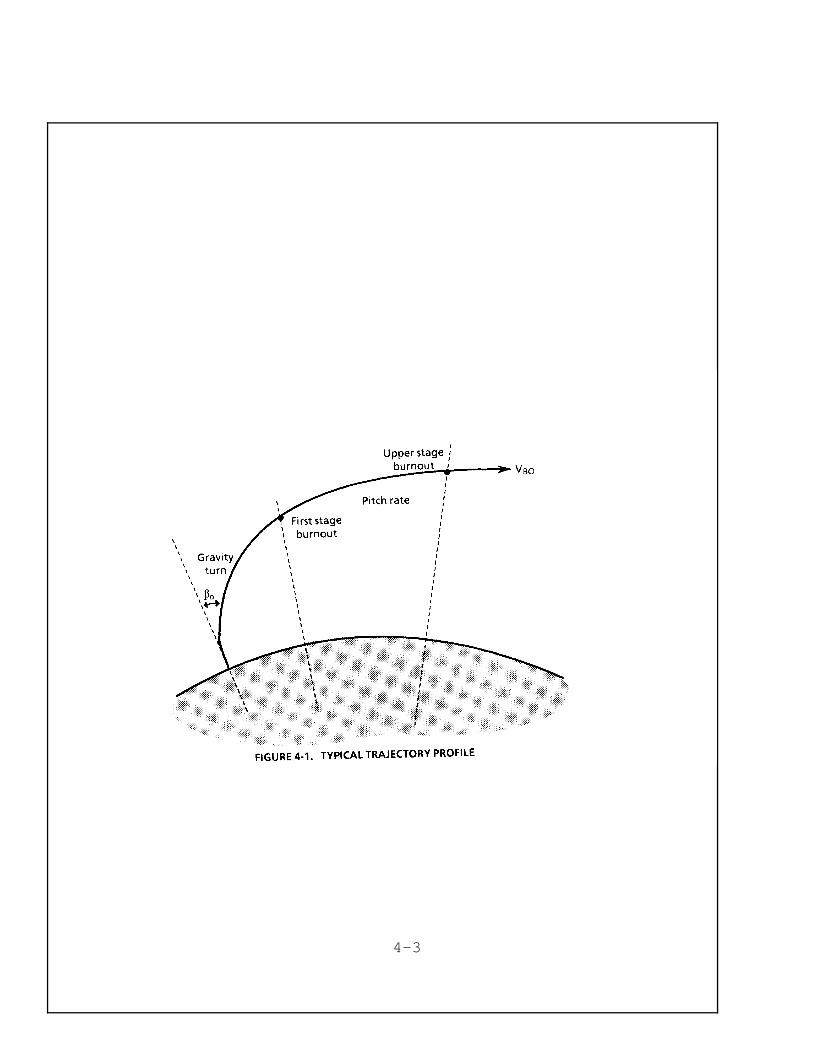
The prime objective during the launch phase is for the boostvehicle to overcome Earth's gravitational pull, rise through theatmosphere and overcome frictional heating. It must provide asatellite with an initial vertical and final orbital velocity(almost parallel to the surface of the Earth) using sustainer andupper rocket stages which will keep it in orbit. Depending onthe latitude of the launch point, the desired orbital inclinationand altitude, the initial orbit may not be the final orbit forthe satellite. To change inclination the boost and higher stagesof the ELV must rotate the attitude of the vehicle, so that itwill be moving in the proper direction, and then pitch over tothe orbital plane gradually as it gains velocity and altitude.
The gradual programmed pitchover (called a gravity turn) iscarefully designed so that the angle of attack (the angle betweenthe axis of the vehicle and the vector of the aerodynamic forces)is kept as close to zero as possible. The gravity turn ispreceded by a small pitchover maneuver called the "kick angle."If this is not accomplished, the aerodynamic loads on the vehiclewill build up and overcome the guidance and control system,thereby producing a deviation from the planned flight path. Ifthe angle of attack becomes too large, the airloads may over-stress the vehicle and cause its structural failure. Theaerodynamic force effects are proportional to one half of theproduct of the local atmospheric density and the vehicle velocitysquared (called dynamic pressure or "q"). In some vehicles,failure can begin at less than 10 degrees angle of attack during
1 The information in this chapter was developed using the references listedat the end of the chapter. This material is intended for readers with little or nobackground in either orbital mechanics or rocketry. Others can proceed directly toChapter 5.
4-1
the "high q" portion of flight. A typical trajectory profile isshown in Figure 4-1.
When the vehicle reaches a very high altitude, the atmosphericdensity becomes so low that the dynamic pressure is essentiallyzero regardless of the velocity. After this, the zero angle ofattack is no longer required and different pitch attitudes andpitchover rates can be used.
Control of all launch vehicles is maintained by gimballing(tilting) the engine nozzles or some equivalent way for changingthe direction of the engine thrust. Launch vehicles must becontrolled continuously because they are, without exception,aerodynamically unstable, i.e., a slight increase in angle ofattack will cause the aerodynamic forces to attempt to increasethe angle of attack even further. Severe wind shears during theearly post-launch period of flight create difficulty for mostvehicles, as the guidance and control systems must act tominimize the pitching or yawing due to abrupt angle-of-attackchanges which they create.
Most launch vehicles contain several stages. Thrust is initiallyprovided by the lowest (and largest) boost stage. When the fuelfor this first stage is consumed, the spent fuel casing isjettisoned to Earth, the remainder of the vehicle separates fromit and the next stage is fired to continue the flight.
Part of the preparation for any mission is the planning for theimpact location of the spent stages (and other jettisonedequipment) in order to minimize the risk to people and propertyon the ground (see Ch. 2).
Most of the current launch vehicles use solid rockets fastened toa central core vehicle which is usually a liquid propellantstage. These "strap-on" solid rocket motors (SRM's) augment thefirst stage thrust and are jettisoned when their propellant isconsumed.
4.1.2 Orbital Insertion and Orbital Operations
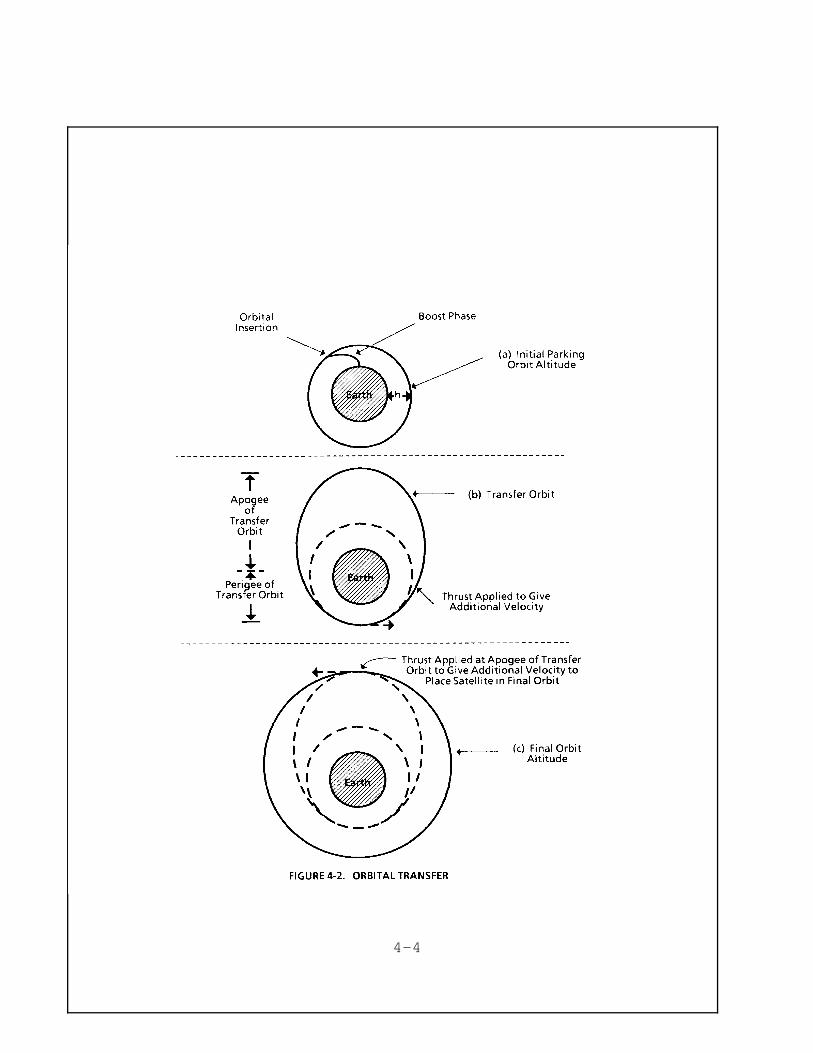
It is not possible to describe the myriad of possible orbitalparameters which may be desired or designed for different missionobjectives. This discussion will only briefly cover the verysimplest example. Consider the sequence of events illustrated inFigure 4-2. In the first illustration (a), a satellite (with abooster stage) is placed in a low "parking" orbit around theEarth. The rockets are fired in orbit and then shut off. Theresult of this orbital correction firing is the creation of a newelliptical "transfer" orbit which has an apogee (greatestdistance from the Earth) which is at a higher altitude above theEarth than the original orbit (Figure 4-2(b)). If the satellitehas no further propulsion, it will continue to follow this
4-2
4-3
4-4
elliptical orbit indefinitely, passing (ideally) through itsinitial perigee point once very revolution. If the objective isto reach a higher circular orbit, the built-in rockets (apogeekick motors, AKM) can be fired again (for a specified period oftime) when the satellite reaches the apogee of the ellipticalorbit, and the new orbit will be as shown in Figure 4-2(c).
4.1.3 Orbital Decay and Re-entry
Once out of the densest portion of the atmosphere, the ELV andits payload (satellite) has only very small drag forces actingupon it to reduce the satellite velocity. Consequently, thesatellite will continue to orbit until reverse thrust (retro-propulsion) is applied for a planned re-entry or decay forceseventually cause an uncontrolled re-entry. Controlled descentfrom an orbit reverses the firing sequence for orbit transfer.Rocket engines fire for a determined interval and angle and thevehicle/satellite now follows an elliptical orbit with apogee atthe original orbital altitude and perigee at an altitude muchcloser to the Earth. If the perigee is within denser portions ofthe atmosphere, the vehicle/satellite will start to slow downgradually because of aerodynamic drag and descend to the Earthsooner due to orbital decay (see Vol. 2, Ch. 7). Aerodynamicheating is intense because of the very high vehicle velocity asit is coming out of orbit and the slow initial braking during re-entry. Objects not designed to withstand this heat by protectionfrom a heat and ablation shield generally break up and, often,vaporize altogether. Re-entry vehicles (RV's) similar to thoseprovided for ICBM's have been proposed for recoverable payloads.
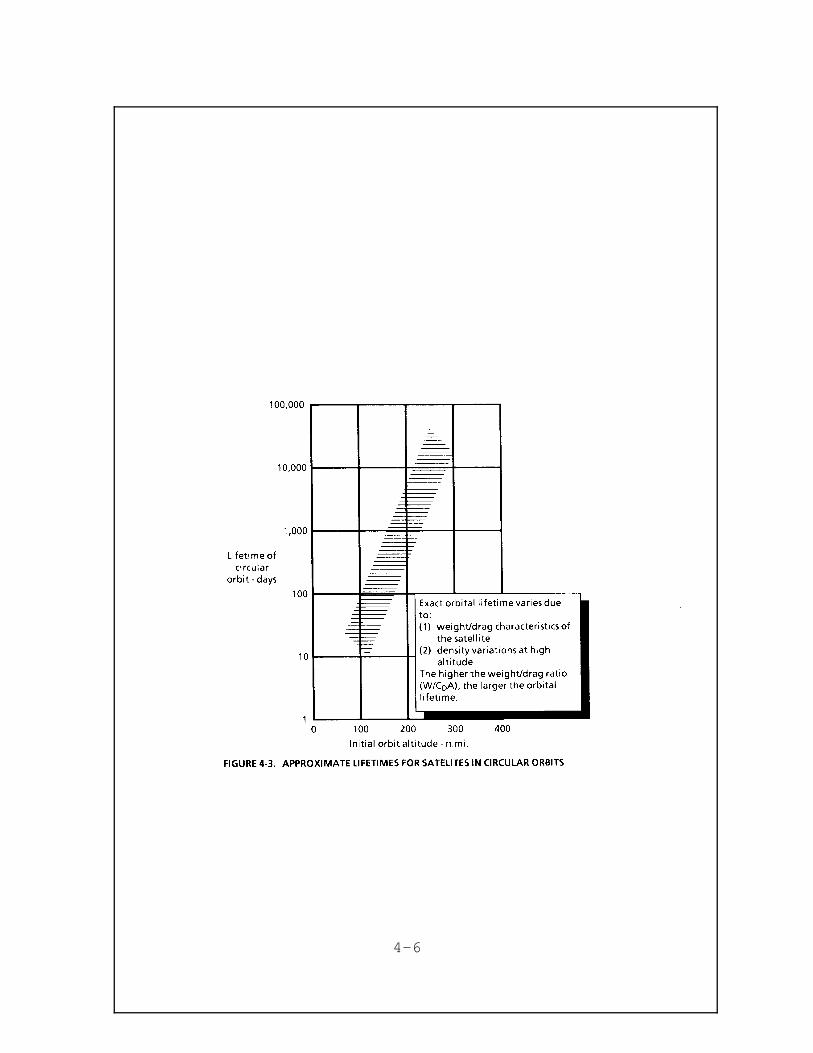
Satellites which are placed in very low Earth orbit may not needany propulsion to return from orbit. Even at an altitude of 200miles, the very low density of air molecules still applies asmall, but continuous drag force. These satellites will veryslowly lose both velocity and orbital altitude and the decay willgradually increase until the object is traveling slow enough tore-enter the Earth's atmosphere. This unplanned re-entry isdiscussed further in Ch. 7. Figure 4-3 shows approximate orbitallifetimes for satellites in circular orbits. Orbital lifetime isa direct function of the mass to drag ratio of the satellite.This ratio is represented by the ballistic coefficient β which isequal to W/CDA; where W is the weight, CD is the drag coefficientof the body, and A is the cross-section area. The shaded area inthe figure shows the range of lifetime in orbit for objects whoseballistic coefficients range from 10 to 300 lb/ft2. The largervalues of ballistic coefficient correspond to the longerlifetimes in the shaded region shown in Figure 4-3.
If rocket engines are used to de-orbit, as proposed forrecoverable payloads that use re-entry vehicles (RV's), the
4-5
4-6
potential hazard from the re-entering spacecraft is controllable.However, the hazard from a decayed satellite re-entry isuncontrolled and usually cannot be predicted with any accuracy(see Ch. 7).
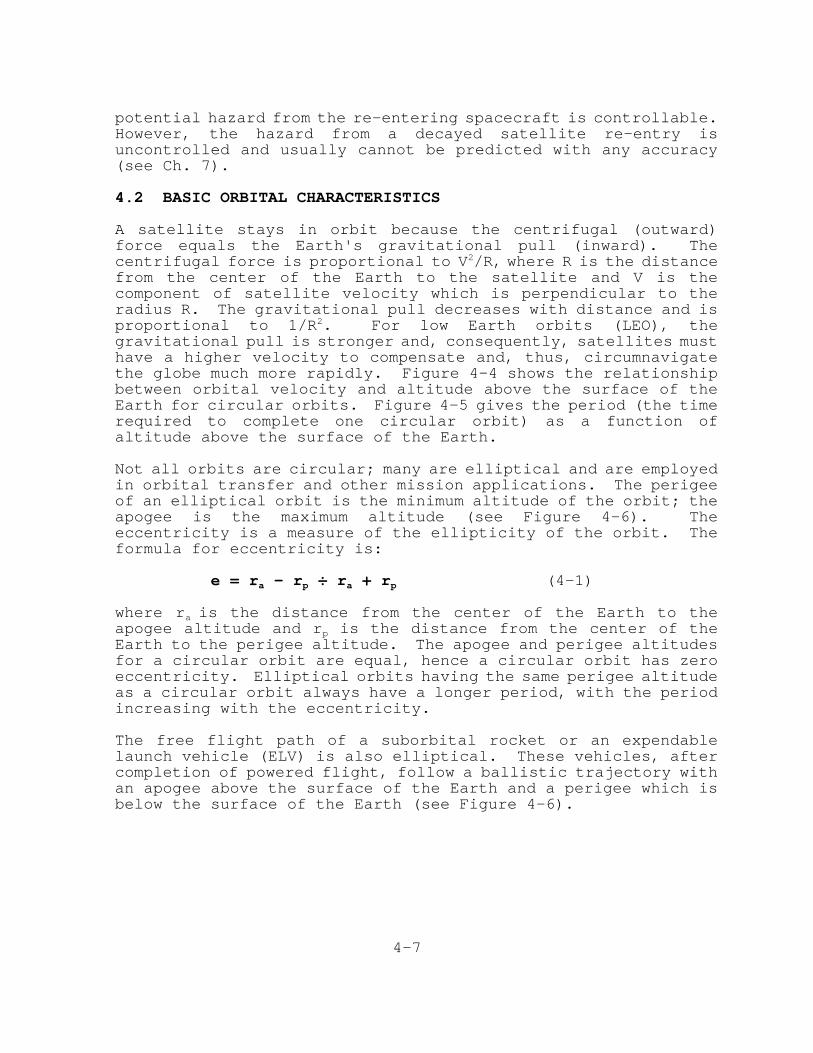
4.2 BASIC ORBITAL CHARACTERISTICS
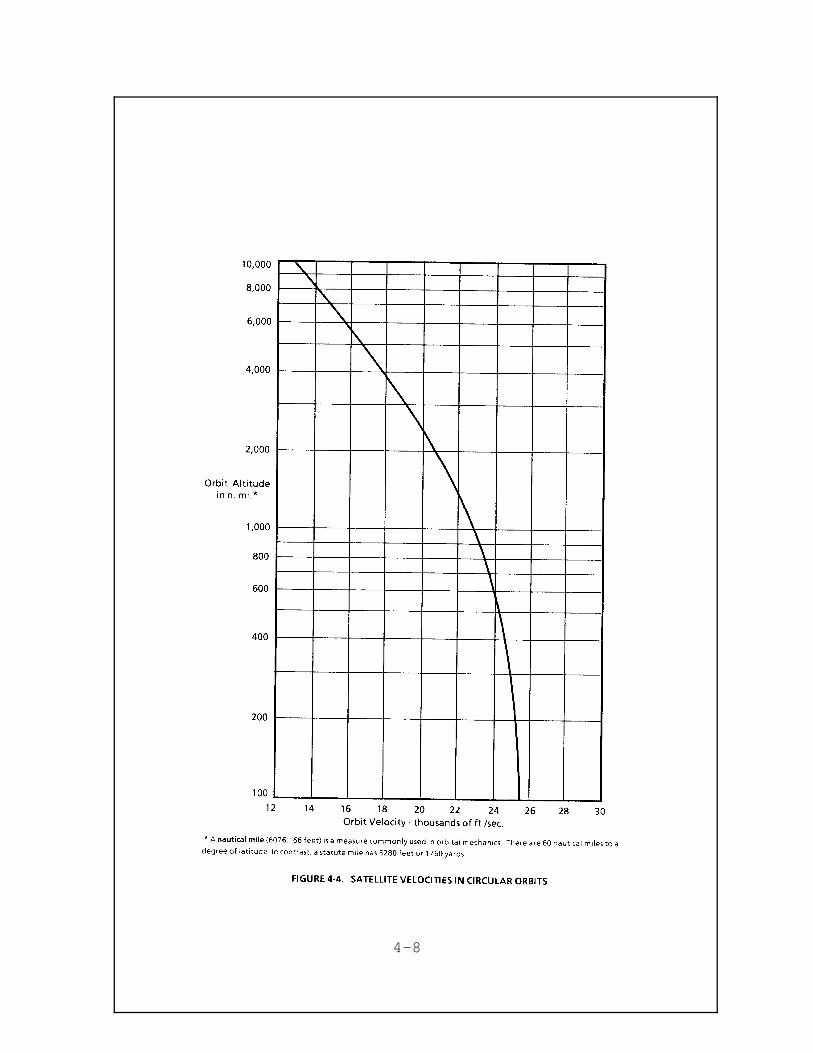
A satellite stays in orbit because the centrifugal (outward)force equals the Earth's gravitational pull (inward). Thecentrifugal force is proportional to V2/R, where R is the distancefrom the center of the Earth to the satellite and V is thecomponent of satellite velocity which is perpendicular to theradius R. The gravitational pull decreases with distance and isproportional to 1/R2. For low Earth orbits (LEO), thegravitational pull is stronger and, consequently, satellites musthave a higher velocity to compensate and, thus, circumnavigatethe globe much more rapidly. Figure 4-4 shows the relationshipbetween orbital velocity and altitude above the surface of theEarth for circular orbits. Figure 4-5 gives the period (the timerequired to complete one circular orbit) as a function ofaltitude above the surface of the Earth.
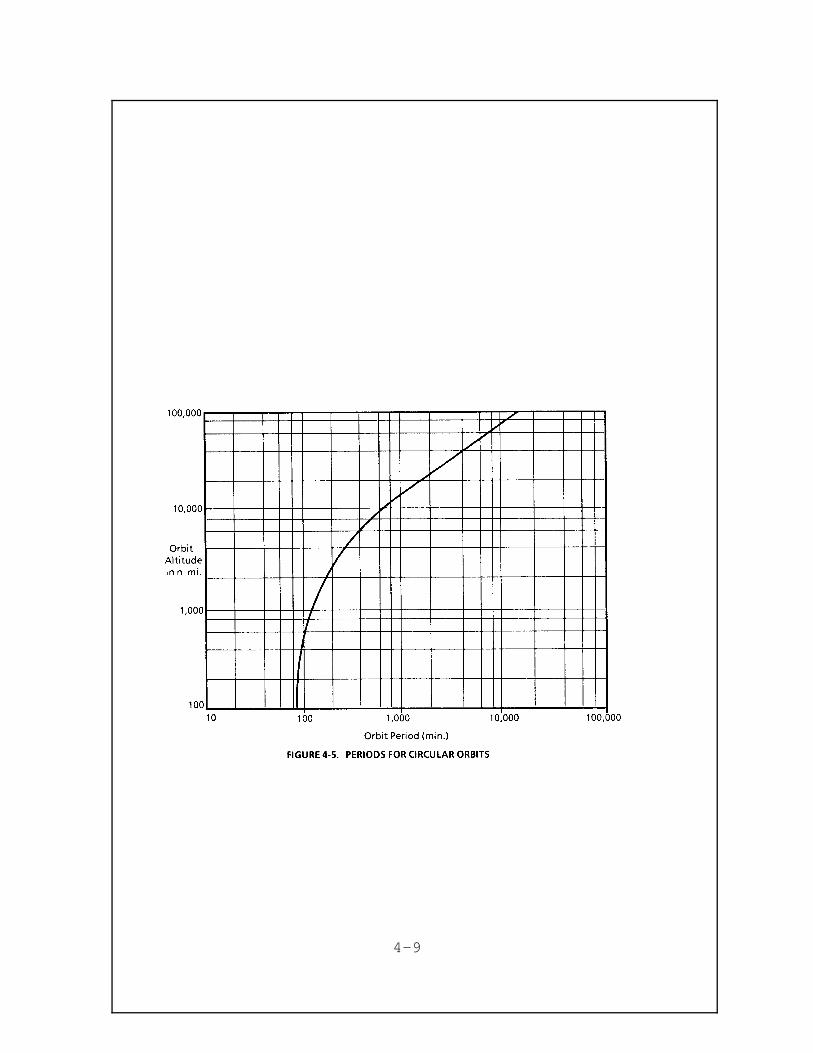
Not all orbits are circular; many are elliptical and are employedin orbital transfer and other mission applications. The perigeeof an elliptical orbit is the minimum altitude of the orbit; theapogee is the maximum altitude (see Figure 4-6). Theeccentricity is a measure of the ellipticity of the orbit. Theformula for eccentricity is:
e = ra - rp ÷ ra + rp (4-1)
where ra is the distance from the center of the Earth to theapogee altitude and rp is the distance from the center of theEarth to the perigee altitude. The apogee and perigee altitudesfor a circular orbit are equal, hence a circular orbit has zeroeccentricity. Elliptical orbits having the same perigee altitudeas a circular orbit always have a longer period, with the periodincreasing with the eccentricity.
The free flight path of a suborbital rocket or an expendablelaunch vehicle (ELV) is also elliptical. These vehicles, aftercompletion of powered flight, follow a ballistic trajectory withan apogee above the surface of the Earth and a perigee which isbelow the surface of the Earth (see Figure 4-6).
4-7
4-8
4-9
4-10
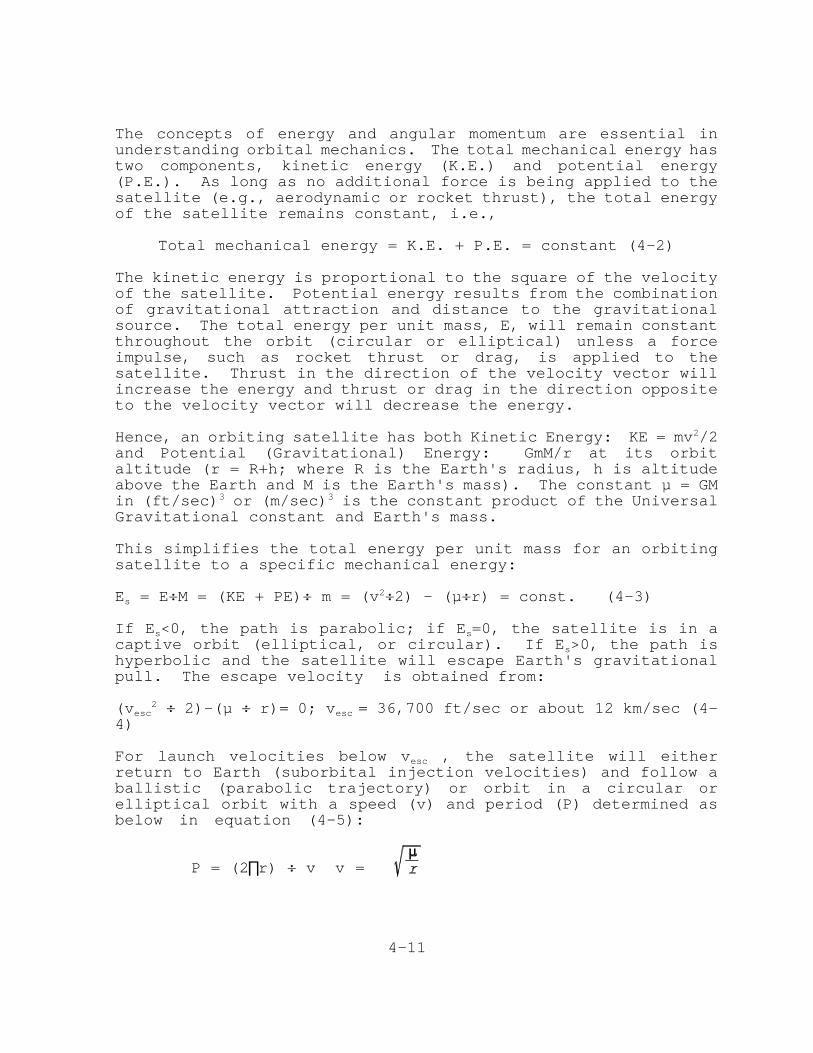
The concepts of energy and angular momentum are essential inunderstanding orbital mechanics. The total mechanical energy hastwo components, kinetic energy (K.E.) and potential energy(P.E.). As long as no additional force is being applied to thesatellite (e.g., aerodynamic or rocket thrust), the total energyof the satellite remains constant, i.e.,
Total mechanical energy = K.E. + P.E. = constant (4-2)
The kinetic energy is proportional to the square of the velocityof the satellite. Potential energy results from the combinationof gravitational attraction and distance to the gravitationalsource. The total energy per unit mass, E, will remain constantthroughout the orbit (circular or elliptical) unless a forceimpulse, such as rocket thrust or drag, is applied to thesatellite. Thrust in the direction of the velocity vector willincrease the energy and thrust or drag in the direction oppositeto the velocity vector will decrease the energy.
Hence, an orbiting satellite has both Kinetic Energy: KE = mv2/2and Potential (Gravitational) Energy: GmM/r at its orbitaltitude (r = R+h; where R is the Earth's radius, h is altitudeabove the Earth and M is the Earth's mass). The constant µ = GMin (ft/sec)3 or (m/sec)3 is the constant product of the UniversalGravitational constant and Earth's mass.
This simplifies the total energy per unit mass for an orbitingsatellite to a specific mechanical energy:
Es = E÷M = (KE + PE)÷ m = (v2÷2) - (µ÷r) = const. (4-3)
If Es<0, the path is parabolic; if Es=0, the satellite is in acaptive orbit (elliptical, or circular). If Es>0, the path ishyperbolic and the satellite will escape Earth's gravitationalpull. The escape velocity is obtained from:
(vesc2 ÷ 2)-(µ ÷ r)= 0; vesc = 36,700 ft/sec or about 12 km/sec (4-
4)
For launch velocities below vesc , the satellite will eitherreturn to Earth (suborbital injection velocities) and follow aballistic (parabolic trajectory) or orbit in a circular orelliptical orbit with a speed (v) and period (P) determined asbelow in equation (4-5):
P = (2∏r) ÷ v v =
4-11

4-12
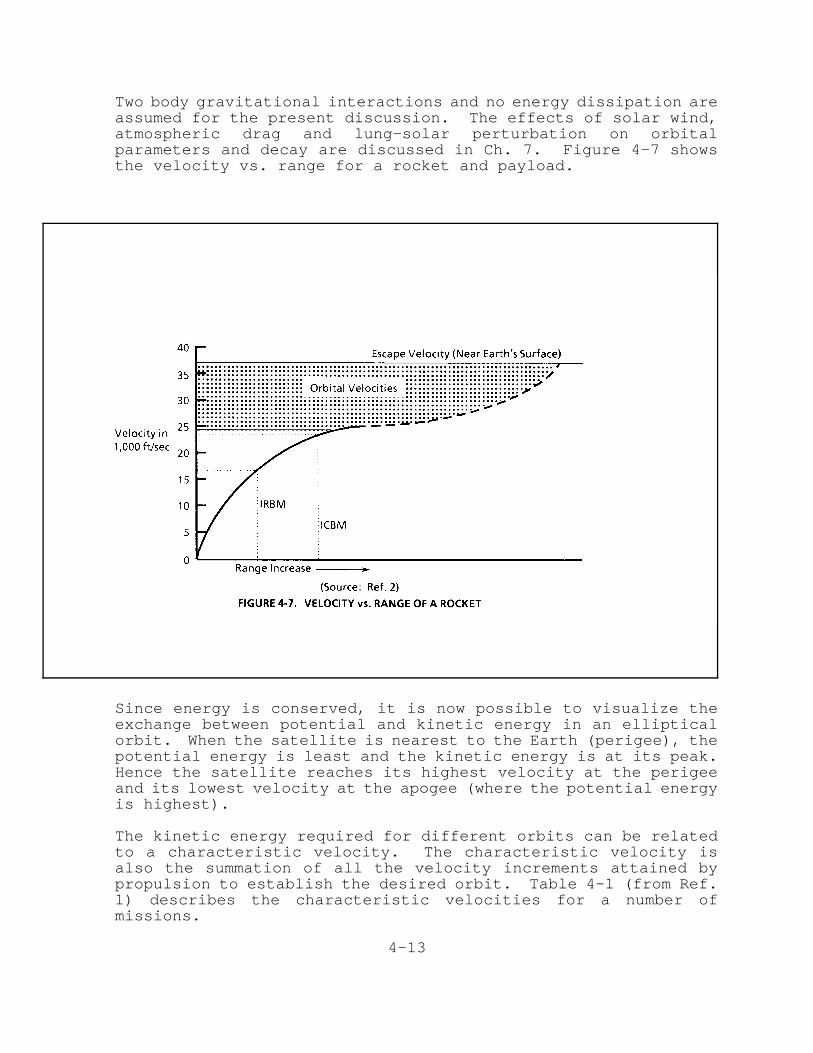
Two body gravitational interactions and no energy dissipation areassumed for the present discussion. The effects of solar wind,atmospheric drag and lung-solar perturbation on orbitalparameters and decay are discussed in Ch. 7. Figure 4-7 showsthe velocity vs. range for a rocket and payload.
Since energy is conserved, it is now possible to visualize theexchange between potential and kinetic energy in an ellipticalorbit. When the satellite is nearest to the Earth (perigee), thepotential energy is least and the kinetic energy is at its peak.Hence the satellite reaches its highest velocity at the perigeeand its lowest velocity at the apogee (where the potential energyis highest).
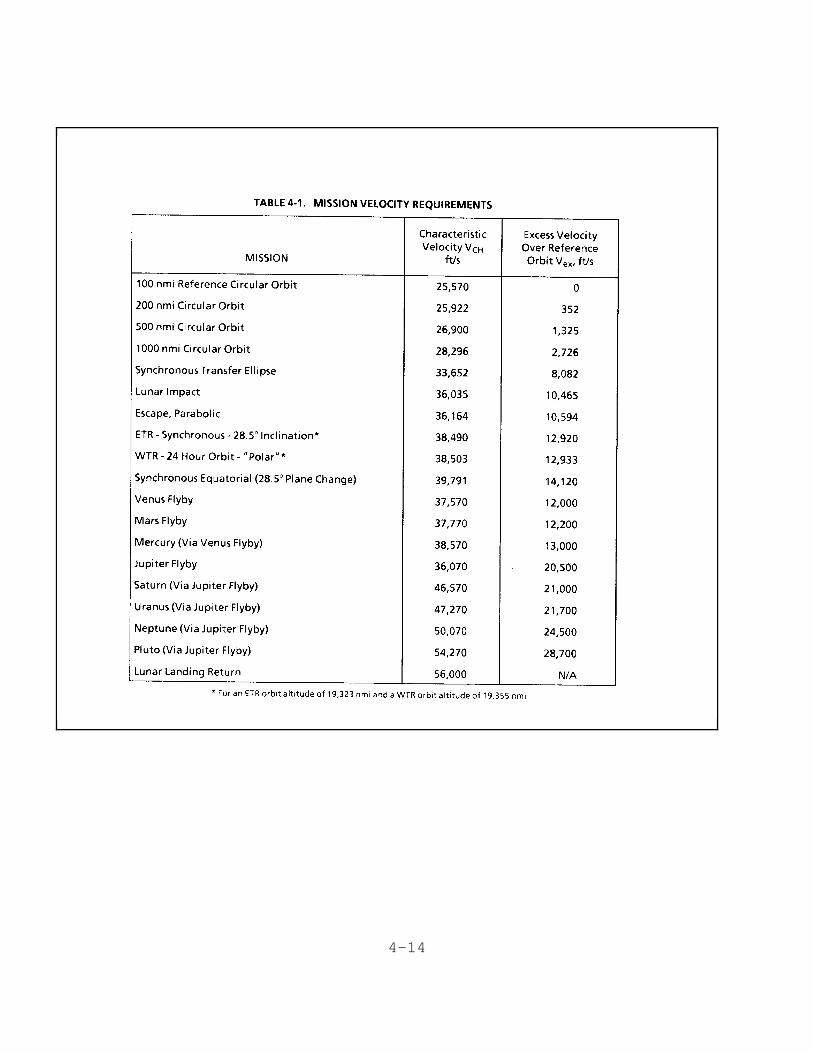
The kinetic energy required for different orbits can be relatedto a characteristic velocity. The characteristic velocity isalso the summation of all the velocity increments attained bypropulsion to establish the desired orbit. Table 4-1 (from Ref.1) describes the characteristic velocities for a number ofmissions.
4-13
4-14
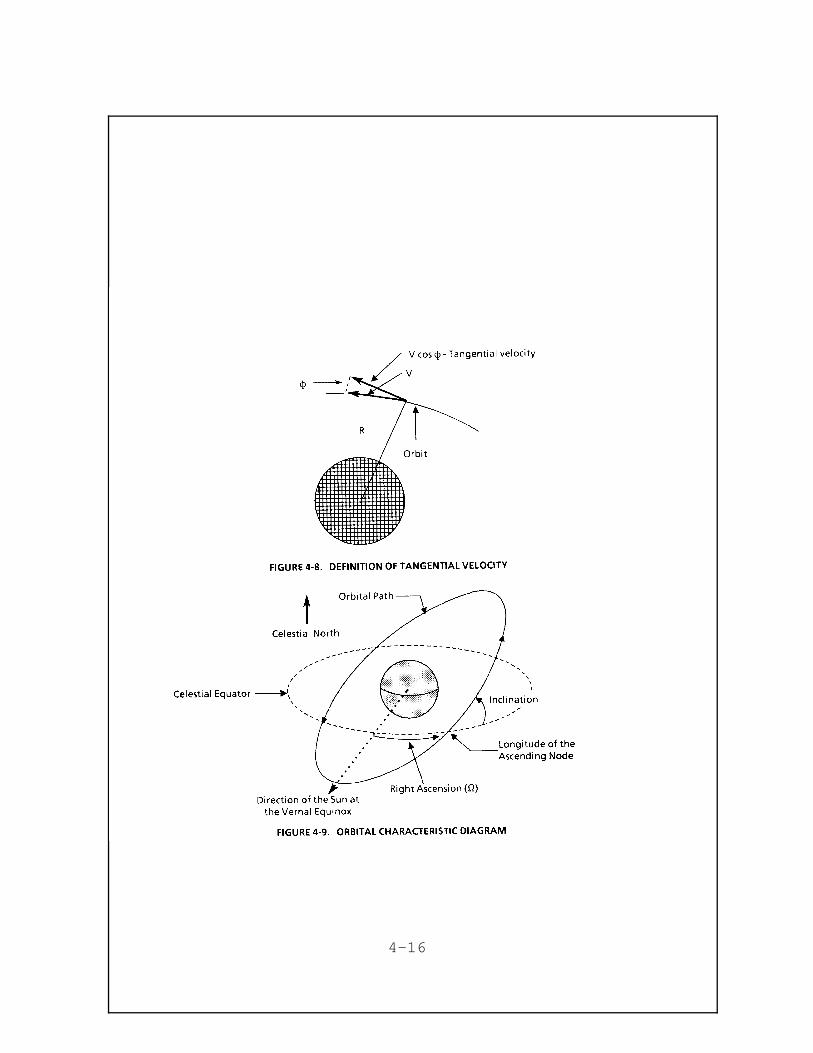
Angular momentum is also a conserved quantity, so that without anexternal application of torque for a period of time, a spinningbody will neither increase nor decrease its rate of spin.Satellite orbits have an angular momentum, which is about an axisthrough the center of the Earth. The orbital angular momentum,H, is given by:
H = (R)x(v)x(cos θ) (4-6)
where H is the angular momentum, R is the distance from thesatellite to the center of the Earth and θ is the angle betweenthe velocity vector and a line in the orbital plane which isperpendicular to the position vector (see Figure 4-8). Theproduct "v x cos θ" can also be referred to as the tangentialvelocity. H is constant except when the satellite is acceleratedor decelerated by thrust or drag.
The equations for conservation of energy and angular momentum arenecessary to analyze the dynamics of satellite orbits. Theoblateness of the Earth requires some additional terms over thoseshown in Equation 4-3 for the potential energy expression, toobtain more accuracy in the orbital predictions; and thegravitational fields of the Moon and the Sun, in particular,should also be considered in increasing prediction accuracy.
The plane of the orbit is defined by the longitude of theascending node and its inclination. These are shown in Figure 4-9. The ascending node is the point where the projectionof the satellite path crosses the celestial equator from south tonorth. The inclination is the angle formed by the plane of theorbit and the equator. It is measured counterclockwise from theeastern portion of the equator to the ascending node. Thus,satellites which orbit west to east (normal or prograde) have aninclination <90o; orbits going east to west (retrograde) have aninclination >90o. An alternate method sometimes used todesignate retrograde inclination is to measure the angleclockwise from the western portion of the equator and state it asan Xo retrograde inclination (see Fig. 10-8). A third term oftenused to describe orbits is the right ascension (ê). This is thearc of the celestial equator measured eastward from the directionof the vernal equinox to the ascending node.
The choice of orbit depends upon the mission of the satellite.ow Earth orbits (LEO) serve a variety of purposes and do notnecessarily operate close to the plane of the equator. In fact, orbits with higher inclinations (near polar) provide thesatellite the opportunity to cover a larger portion of theEarth's surface(see Figure 4-10).
4-15
4-16
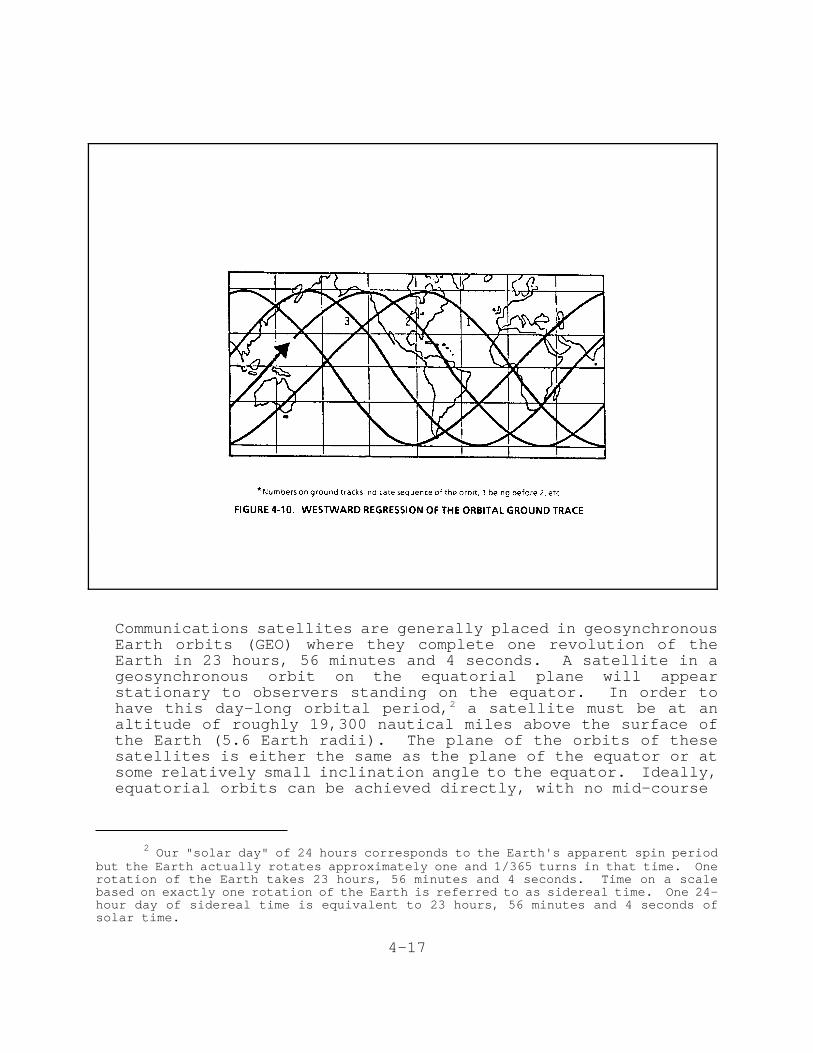
Communications satellites are generally placed in geosynchronousEarth orbits (GEO) where they complete one revolution of theEarth in 23 hours, 56 minutes and 4 seconds. A satellite in ageosynchronous orbit on the equatorial plane will appearstationary to observers standing on the equator. In order tohave this day-long orbital period,2 a satellite must be at analtitude of roughly 19,300 nautical miles above the surface ofthe Earth (5.6 Earth radii). The plane of the orbits of thesesatellites is either the same as the plane of the equator or atsome relatively small inclination angle to the equator. Ideally,equatorial orbits can be achieved directly, with no mid-course
2 Our "solar day" of 24 hours corresponds to the Earth's apparent spin periodbut the Earth actually rotates approximately one and 1/365 turns in that time. Onerotation of the Earth takes 23 hours, 56 minutes and 4 seconds. Time on a scalebased on exactly one rotation of the Earth is referred to as sidereal time. One 24-hour day of sidereal time is equivalent to 23 hours, 56 minutes and 4 seconds ofsolar time.
4-17
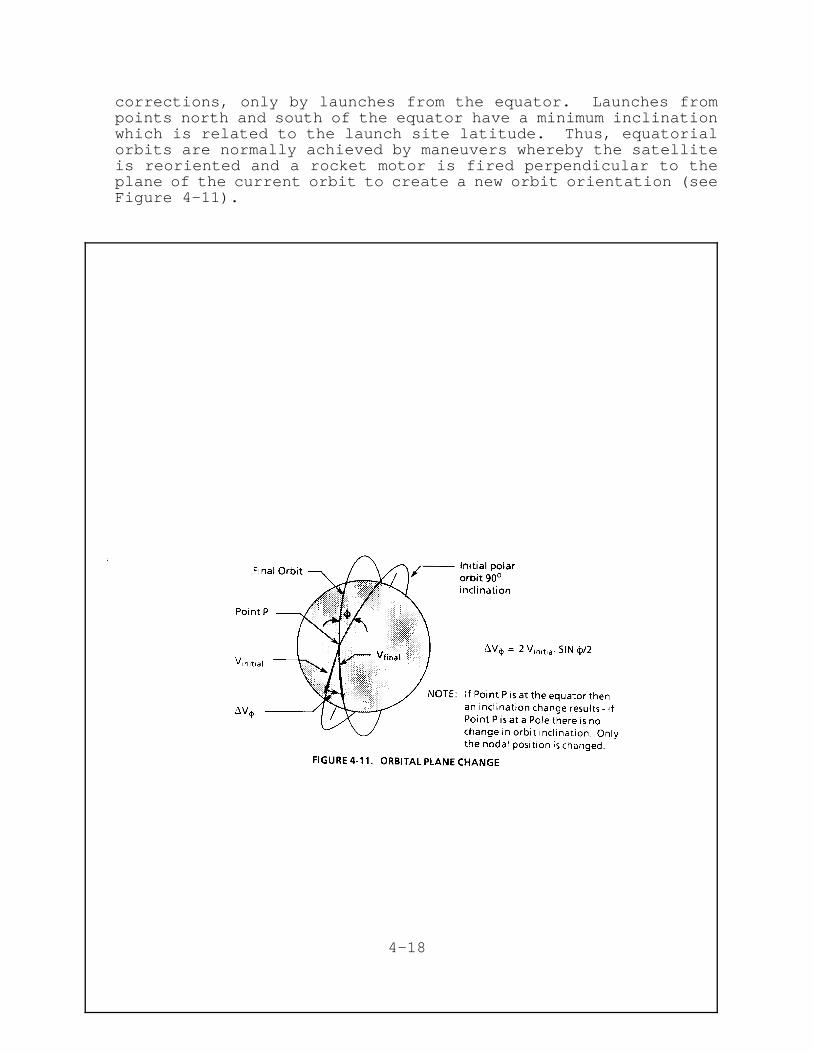
corrections, only by launches from the equator. Launches frompoints north and south of the equator have a minimum inclinationwhich is related to the launch site latitude. Thus, equatorialorbits are normally achieved by maneuvers whereby the satelliteis reoriented and a rocket motor is fired perpendicular to theplane of the current orbit to create a new orbit orientation (seeFigure 4-11).
4-18
Since the orientation of the orbit is relatively motionless inspace while the Earth turns inside it, the ground track of theorbit will recess (fall behind). The rate of recession is basedon the number of degrees the Earth rotates while the satellite iscompleting one orbit. The northern-most and southern-most rangeof the ground track are equal to the inclination of the orbit.A typical ground track is shown in Figure 4-10. The width of theground track, as seen by the satellite from orbit, is also calleda "swath" or "footprint" of the satellite.
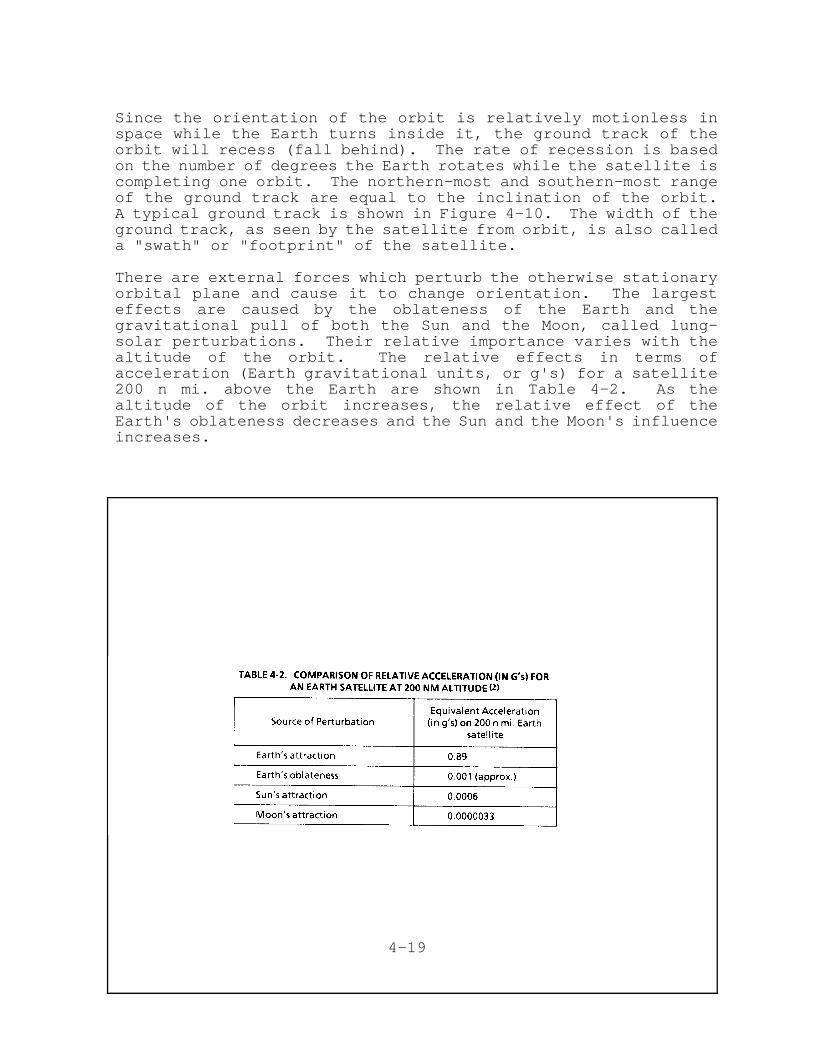
There are external forces which perturb the otherwise stationaryorbital plane and cause it to change orientation. The largesteffects are caused by the oblateness of the Earth and thegravitational pull of both the Sun and the Moon, called lung-solar perturbations. Their relative importance varies with thealtitude of the orbit. The relative effects in terms ofacceleration (Earth gravitational units, or g's) for a satellite200 n mi. above the Earth are shown in Table 4-2. As thealtitude of the orbit increases, the relative effect of theEarth's oblateness decreases and the Sun and the Moon's influenceincreases.
4-19
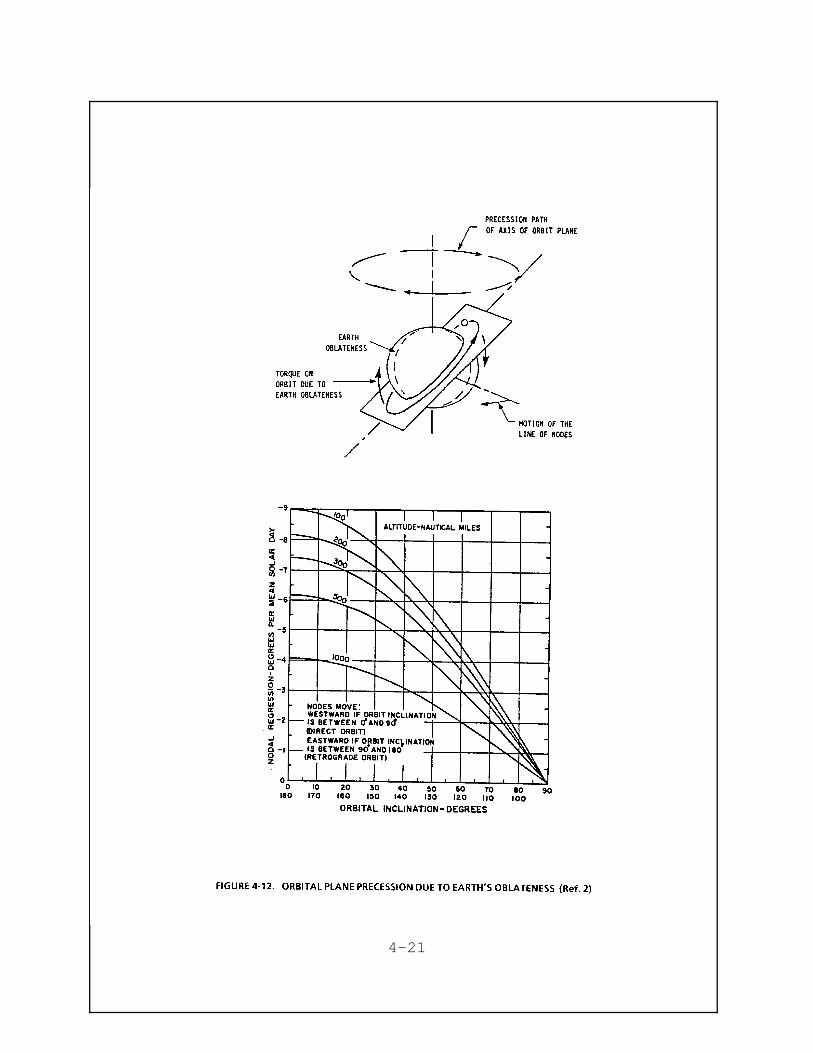
While the attraction of bodies other than the Earth can distortthe orbit, the oblateness of the Earth will cause the plane ofthe orbit to precess around an axis through the pole of theEarth. The additional girth of the Earth around the equator(oblateness) produces a torque on the orbit and the result is aprecessional motion not unlike that of a gyro or top. Theprecession rate can be defined as the number of degrees the lineof nodes moves in one solar day. The nodal precession rate forcircular orbits is shown in Figure 4-12. Note that the effect ofthe Earth's oblateness lessens with the altitude of the orbit andalso with the inclination of the orbit. A polar orbit will notprecess.
The rotation of the Earth has an influence on the ability tolaunch satellites into desired final orbits. Looking down uponthe North Pole, the Earth rotates counterclockwise. At the timeof launch, the rocket already has a horizontal component ofvelocity which equals in magnitude the product of the Earth'srate of rotation and the distance to the axis through the polesof the Earth. If the ELV is launched in the direction of thisvelocity vector (eastward), it reaches orbital velocity easierthan if it is launched in a westerly direction, in which casethis surface velocity must be first overcome. (This effectvaries with the latitude of the launch point. It is greatest atthe equator and absent at the North or South Poles.) This factoris one influence on selection of a site for conducting launches.Therefore, in the United States, eastward launches of satellitesinto equatorial orbits from ETR, Florida augment the ELV thrust.More payload can be placed into orbit than from an identicallaunch made from, for example, Maine. The satellite launchesfrom the West coast are almost always to the south to achievepolar (high inclination angle) orbits. Polar orbits areperpendicular to the velocity provided by the Earth's rotation,thus the rotation neither helps nor hinders the polar launch.However, the launch corridors used at both ETR and the West coastare chosen primarily for safety considerations. Launcheseastward from ETR and southward from the West coast fly overwater rather than inhabited territory and do not pose hazards topopulated areas due to jettisoned stages or other debris.
4-20
4-21
REFERENCES TO CHAPTER 4
1. Hazard, Hap (edited by Heizz F. Gehlhaar and LT. Ronald G.Higden), U.S. Space Launch Systems (Rev. 2), Navy Space SystemsActivity, Los Angeles, California, 1 July 1977.
2. Bate, Roger R., Donald D. Mueller and Jerry E. White,Fundamentals of Astrodynamics, Dove Publications, New York, NewYork 1971.
3. Cochran, Curtis D., Dennis M. Gorman and Joseph D. Dumoulin(Editors), Space Handbook, (2nd Rev.) Air University Press,Maxwell Air Force Base, Alabama, 1985. (AU-18)
4. Thomson, William T., Introduction to Space Dynamics, JohnWiley & Sons, New York, New York, 1961.
5. White, J. Frederick (Editor), Flight Performance Handbook forPowered Flight Operations, Space Technology Laboratories (nowTRW), Redondo Beach, California, 1962.
4-22
10/2/95 rev5. PRE-LAUNCH AND LAUNCH HAZARDS
5.1 INTRODUCTION
5.1.1 Background and Objectives
A hazard is the existence of any property or condition which,when activated, can cause injury, death, or result in damage toproperty. Of interest to this study are launch-related hazardswhich could affect third parties, namely people or property notconnected with ELV operations. Thus, hazards which have effectscontained within the boundaries of the Range are not discussedexplicitly in this context.
A hazard potential exists because large quantities of liquidand/or solid propellants are part of the ELV and they could beunintentionally released in case of a launch accident. Thishazard decreases with time into the flight because the quantitiesof on-board propellants decrease as they are consumed and thevehicle moves away from both the launch site and nearby populatedareas. The exposure to launch accident hazards is greatestduring the first few minutes after launch.
The major generic hazards in the event of an accident involvingpropellants during pre-launch and launch operations are:
1. Explosions: uncontrolled combustion of thesepropellants at a very fast rate per unit volume such thatpart of the chemical energy is converted to mechanicalenergy and part to heat. The mechanical energy is producedin the form of a blast wave with the potential of causingdamage by crushing forces and winds (Sec. 5.2).2. Debris: vehicle fragments that may land uponstructures or populated areas. Fragments may includeburning propellants which could explode or burn upon landingthus posing additional hazards of types 1 and 3 (Sec. 5.3).3. Fires: uncontrolled combustion of the propellants ata slower rate than occurs in explosions, thus convertingtheir chemical energy into heat only. The correspondinghazard is thermal radiation to people and property in theproximity of the fire (Sec. 5.4).4. Toxic Vapor Clouds: some hypergolic propellants (suchas monomethylhydrazine, nitrogen tetroxide and Aerozine-50)are toxic and corrosive. If released in an accident,unreacted vapors and aerosols may be transported byprevailing winds in the form of clouds. Hydrazine vaporsare colorless and become white when combined withatmospheric moisture; nitrogen tetroxide vapors are reddishbrown. Such clouds may pose a health hazard to people andare potentially harmful to animals and vegetation (Sec.5.5).Other toxic propellants include fuming nitric acids, liquid
5-1
fluorine, anhydrous ammonia, nitromethane, ethylene oxide,chlorine trifluoride, chlorine, nitrogen trifluoride,hydrogen peroxide, hydrogen chloride and hydrogen cyanide.
Hazards associated with noise, sonic boom and small quantityreleases of toxic materials are not considered in the sameseverity category as the hazards listed above and are notaddressed in this report.
In a given accident, one or more of these hazards may occur andprevail in importance over the others, depending on the specificcircumstances of the event such as: vehicle design, accidentlocation, failure mode, propellant type, amount of propellantreleased, mode of release, environmental conditions and proximityof people and property. Sometimes, the occurrence of one hazardmay preclude another because they compete for the samepropellant. For example, when most of the propellant is consumedin a fire, a vapor cloud will not form. Other times, the hazardsmay be sequential -- such as the formation of toxic vapors in afire or an explosion which may later pose a toxic vapor cloudhazard. The possible off-range impacts of launch accidents areillustrated in Sec.5.6.
This chapter presents a generic discussion of the major types ofhazards associated with the ground preparation and launch ofELV's namely: explosions, debris, fires and vapor clouds. Theobjective is to provide an overview of the mechanisms involved inthese hazards, the types of analyses used and the damagecriteria. The hazards are considered to be of very lowlikelihood. Their applicability to, and magnitude in, any launchoperation should be established by detailed analyses of thespecific circumstances in each case. Such analyses for typicallaunch operations are discussed in Ch. 10, Vol. 3. A secondobjective is to provide a perspective on launch hazards bycomparison with industrial and transportation accidents.
5.1.2 Major Information Resources on Rocket Propellant Hazards
In order to assess public risk exposure derived from launchhazards, information must be drawn from reports of majorexperimental and theoretical studies of the behavior ofaccidentally released propellants and fuels.(1,3) These studiesinclude test programs carried out by government agencies (NASAand DOD) where realistic accident scenarios were simulated on alarge scale. Two notable test programs were projects PYRO(2) andSOPHY.(3) Both are summarized briefly below to illustrate theexperimental basis for the information that follows in thischapter:
1. Project PYRO tested the explosive yield and flammability ofliquid propellants namely:
5-2
• hypergolics (Aerozine-50 & Nitrogen Tetroxide used asfuel and oxidizer in both the Titan and Delta vehicles)in mass ratio of 2.25/1, in several configurations andwith total weights of up to 200 to 1000 lb (90 to 450kg);
• Liquid Oxygen/RP-1 (used in the Atlas vehicle) in massratio of 2.25/1 and with a total weight of up to 25,000lb (11,000kg);
• Liquid Oxygen - Liquid Hydrogen (used in the Centaurvehicle) in mass ratio of 5/1 and in total weights ofup to 100,000lb(45,000kg);
• Full-scale Saturn S-IV and a modified Titan I firststage.
Also, three accident conditions were simulated to producedifferent types of mixing effects:
• failure of an interior bulkhead separating fuel andoxidizer;
• fall back of a space vehicle on the launch pad withcomplete tank rupture and subsequent ignition;
• high velocity impact of a space vehicle after launch.
2. Project SOPHY addressed the hazards associated withhandling, transporting, testing and launching of solidpropellants. Solid propellants were tested in variousgeometries, sizes and weights (the latter varied from a fewhundred to half a million pounds). Shock initiation was producedwith a TNT charge centered on the end face of the propellant.Air blast and fire ball data were collected and analyzedstatistically to develop scaling relationships. The criticalcharge diameter required to sustain a detonation in a typicalcomposite propellant was determined to be between 60 and 72inches.
These two test programs and their results were discussedextensively in a Chemical Propulsion Information Agency (CPIA)publication entitled "Hazards of Chemical Rockets andPropellants".(1) The results were analyzed to identify andquantify the resulting hazards and to develop methodologies foruse in hazard analysis. Their findings are drawn uponextensively without having reviewed in detail the originalreports of project PYRO and SOPHY.(2,3) Other references ofinterest to such analyses are safety standards AFR 127-100(4) andDOD 6055.9-STD.(5)
Against this background, we will present a generic discussion ofthe explosion, debris, fire and vapor cloud hazards associatedwith the accidental release of propellants. Hazard analyses ofspecific launch operations will also be discussed in Vol. 3,Chapters 9 and 10.
5-3
5.2 EXPLOSION HAZARDS
Explosion of an ELV can occur accidentally, as with the Titan 34Devent in April, 1986, or as a result of a destruct command usingthe flight termination system. In some cases, flight terminationis accomplished simply by shutting off the fuel supply to liquidfuel engines. In this case, an explosion may not occur unlessthe intact vehicle and its remaining fuel impact the groundsharply.
An explosion is a very rapid expansion of matter into a volumegreater than its original volume. The cause of the expansionmight be combustion, electrical discharge (such as lightning) ora purely mechanical process such as the bursting of a cylinder ofcompressed gas. The faster the energy is released, the moreviolent the explosion.
Rocket motors are designed to burn their fuels and release theirenergy in a controlled combustion process called a deflagration,or simply, a flame. In a deflagration the reaction front isdriven by diffusion mechanisms. At steady state, it proceeds inthe material at a rate lower than the speed of sound.
Under some conditions, the rate of energy release can increasesignificantly, leading to an explosion. The combustion processis then called a detonation.
In a detonation the reaction front consists of a shock wavefollowed by a flame. The reaction front is driven by a shockcompression mechanism. At steady state, it proceeds in thematerial at a rate faster than the speed of sound.
There is a spectrum of reaction possibilities between steadystate deflagrations and detonations, such as a fast deflagrationand a weak detonation, with the potential of a transition fromone reaction to another. The deflagration-to-detonationtransition is referred to as DDT. A shock-to- detonationtransition is also possible and is referred to as SDT.(6,7)
For solid propellants (see Table 3-3, Vol. 1, Ch. 3), cross-linked double base hybrid materials (DOD Class/Division 1.1--oldClass 7) were always considered in the past to represent adetonation hazard; most composite propellants (Class/Division1.3--old Class 2) were considered to represent a fire(deflagration) hazard. However, recent trends in rocket motordesign include: more energetic composite propellants, highersolid loading densities, larger grain diameters and greater mass.The net effect is that composite propellants may also detonateinadvertently under the dynamic conditions of accidents.Although, they may require a larger initiation energy than
5-4
Class/Division 1.1 propellants and their detonation may not beself-sustaining, resulting in lower yields(7).
A number of conditions influence the likelihood of solidpropellant detonation:(6,7)
• propellant toughness;• motor geometry, core configuration, diameter, length to
diameter ratio, chamber pressure, case bondingtechnique and propellant residual strain;
• propellant critical diameter and geometry;• propellant granular bed characteristics (pyrolysis and
ignition) both thermally and mechanically induced,leading to faster combustion terminating in adetonation (DDT);
• propellant response to shock (SDT);• propellant response to delayed reduced shock (referred
to as XDT)• impact velocity and surface impacted (water, sand or
concrete).
A question of particular interest is whether activation of thedestruct system is likely to detonate solid rocket boosters.This subject was studied recently by the Naval Surface WeaponsCenter (NSWC) for a filament wound graphite case material.(8)
They tested:
• linear shaped charge (LSC)/propellant caseinteractions;
• detonability and shock sensitivity;• material response (breakage of propellant).
They concluded that activation of LSC would not detonate theSolid Rocket Booster propellant. At most, a rapid burn isexpected.
For liquid propellants, the likelihood of detonation isinfluenced by chemical composition and conditions such as:
• degree of fuel and oxidizer mixing and size of themixture prior to initiation;
• confinement of the products of combustion;• presence of obstructions or flow instability that
generate turbulence and result in increased reactionareas.
Such conditions are encountered in accidents to various degrees.Thus, it is usually very difficult to predict with certaintywhether or not a detonation will occur.
Still, overpressure can result if the reaction is fast enough,even though it is not an ideal, steady state detonation. The
5-5
main difference is in the near-field where a detonation generatesa much higher overpressure. This difference decreases furtheraway from the center of the explosion. The far-field is ofparticular importance to this study which focuses on potentialdamage to the public (third parties) off-range. Overpressureestimation methods are presented in the next section.
5.2.1 Blast Waves
Scaling laws are used to calculate characteristic properties ofblast waves from explosions. With the aid of such laws, it ispossible to present characteristics of the blast wave, for anyyield, in a simple form. This is presented below for the case ofair at constant temperature and pressure.
Full-scale tests have shown that these relationships hold over awide range of explosive weights (up to and including megatons).According to the scaling laws, if d1 is the distance from areference explosion of W1 lb at which a specified hydrostaticoverpressure or dynamic pressure is found, (Dynamic pressure q =1/2 pv2, where p is air density and v is particle velocity), thenfor any explosion of W lb, these same pressures will occur at adistance, d, given by:
d/d1 = (W/W1)1/3 (5-1)
In other words, the pressures are functions of a unique variable(d/W1/3) called the scaled-distance or k-factor.
Cube-root scaling can also be applied to the arrival time of theshock front, positive-phase duration and impulse; the distancesconcerned are also scaled according to the cube-root law (seeFigure 5-1 for a definition of these terms). The relationshipsmay be expressed in the form: t/t1 = i/i1 = d/d1 = (W/W1)
1/3, wheret represents arrival time or positive-phase duration, i is theimpulse and the subscript 1 denotes the reference explosion W1.
These relationships are well established and accepted in theliterature. They form the basis of most explosion models,including that used in Chapter 10 of this report.
It should be noted that the above relationships are for blastwaves in free field, under ideal conditions. In a real,stratified atmosphere, shock focusing may occur producing higheroverpressures than in free field. Such effects have been takeninto account in a computer model named BLAST based on acousticwave propagation. The model was developed by WSMC and has beenverified experimentally.(9)
5-6
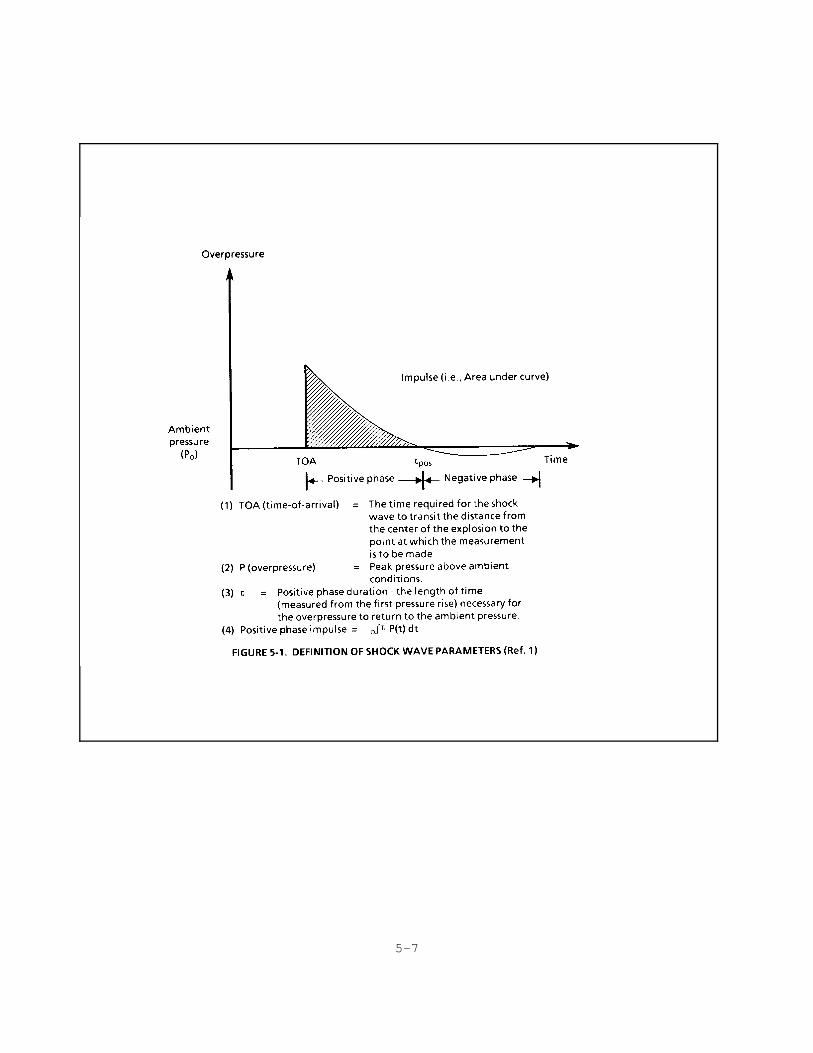
5-7
5.2.2 TNT Equivalency Analysis
It is conventional to express the magnitude of an explosion of agiven material (e.g., solid or liquid propellant) in terms of anequivalent weight of TNT (symmetrical tri-nitrotoluene, aconventional ordnance explosive) required to produce essentiallythe same blast wave parameters. The TNT equivalent weight wasselected because of the large amount of experimental dataavailable on blast waves and damage produced by TNT explosions.A given material may have several TNT equivalent weightsdepending on the selected blast wave parameter, i.e., it may havean equivalent weight based on peak overpressure, another based onpositive impulse, (see Glossary, App. A, or Figure 5-1), etc.Peak overpressure is more commonly used, however, to define TNTequivalence. TNT yield refers to the TNT equivalent weightexpressed as a percent of the weight of the propellant.
The TNT-equivalent analysis has a number of limitations thatshould be borne in mind to obtain valid comparisons. They are:
• Not all the accidentally-released material is involvedin the explosion: part of it may disperse withoutreacting and part may react at a different time orlocation from the explosion. Accordingly, measured TNTyields of liquid propellants were found to depend onthe degree of fuel/oxidizer mixing prior to explosioninitiation. This degree of mixing depends, in turn, onthe rate of mixing (a function of vehicle design,failure mode and accident conditions) and its duration(a function of when ignition occurs).
• Of the portion of released material that reacts in theexplosion, part of it may detonate and part maydeflagrate, with the latter contributing little energyto the blast. Predicting whether a detonation ordeflagration (or any combination of them) will occur isa very complex subject, as discussed earlier. Theoutcome depends on the propellant properties and on theconditions of the accident. For example, with solidpropellant fragments, an impact speed greater than 300ft/sec is likely to have sufficient energy to initiatethe detonation of that fragment upon impact.(7)
• Even for the portion of the released material thatcontributes directly to the blast energy, the blastcharacteristics are different from those of a TNTcharge with an equivalent energy. Measuredoverpressure amplitudes are generally lower anddurations are longer because of a slower reaction ratefor propellants than for TNT. This rate depends on
5-8
accident-specific conditions such as: strength ofinitiating source, degree of confinement and shape ofpropellant.
Thus, the TNT yield of a material is not an absolute propertysuch as density or molecular weight. Instead, it depends on thetest conditions in which it is measured. Fortunately, thedependence of blast parameters on yield is low because of thecube-root exponent in the scaling law (Eq. 5-1). Hence, theprediction of a hazard distance (d) is not very sensitive to theemployed yield (W). For example, if the yield is off by 50percent, the distance (at which a particular overpressure isreached) is off by only 15 percent. Thus, the TNT method ofanalysis has been used effectively over many years despite thelimitations mentioned above.
In 1978, NASA established an Explosive Equivalency Working Groupto define potential failure scenarios which could lead to anexplosion and to estimate the maximum credible explosive TNTequivalency for these explosions. The most completedocumentation of the findings of this group is reportedly in acollection of briefing charts by W.A. Riehl et al.(10) The workperformed by this group provided a basis for many subsequentstudies,(11) many of which have quoted verbatim TNT equivalentvalues from Ref. 10. This is illustrated in Table 5-1, which isextracted from a study on shuttle safety.(11) A variety of failuremodes and accident scenarios are identified for the external tankand the solid rocket motors; a maximum credible explosiveequivalent (or TNT yield) is estimated for each case. Also, therange for these maximum credible TNT yields varies from:
• 5 to 50% for LH2/LOX• 18 to 100 % for the solid rocket motors
The lower bound for these yields is zero, since the propellantsmay react or burn without producing mechanical damage.
Although the STS is not being considered for commercial spacetransportation, Table 5-1 is very useful to illustrate that theyield of a propellant system can vary depending on the failuremode.
Recommended values for TNT equivalency of liquid propellantsunder selected worst case accident conditions are given in AFR127-100.(4) Since AFR 127- 100 addresses the circumstances inhandling and storing propellants, it may not apply to launchoperations.
5-9
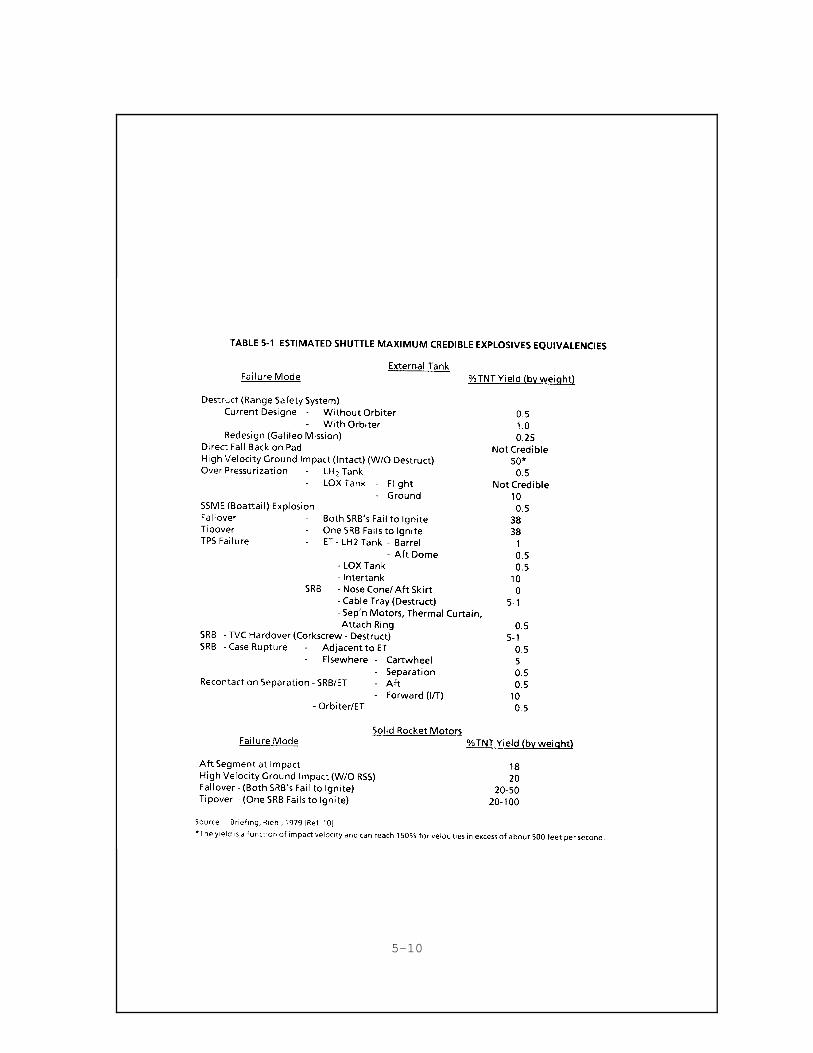
5-10
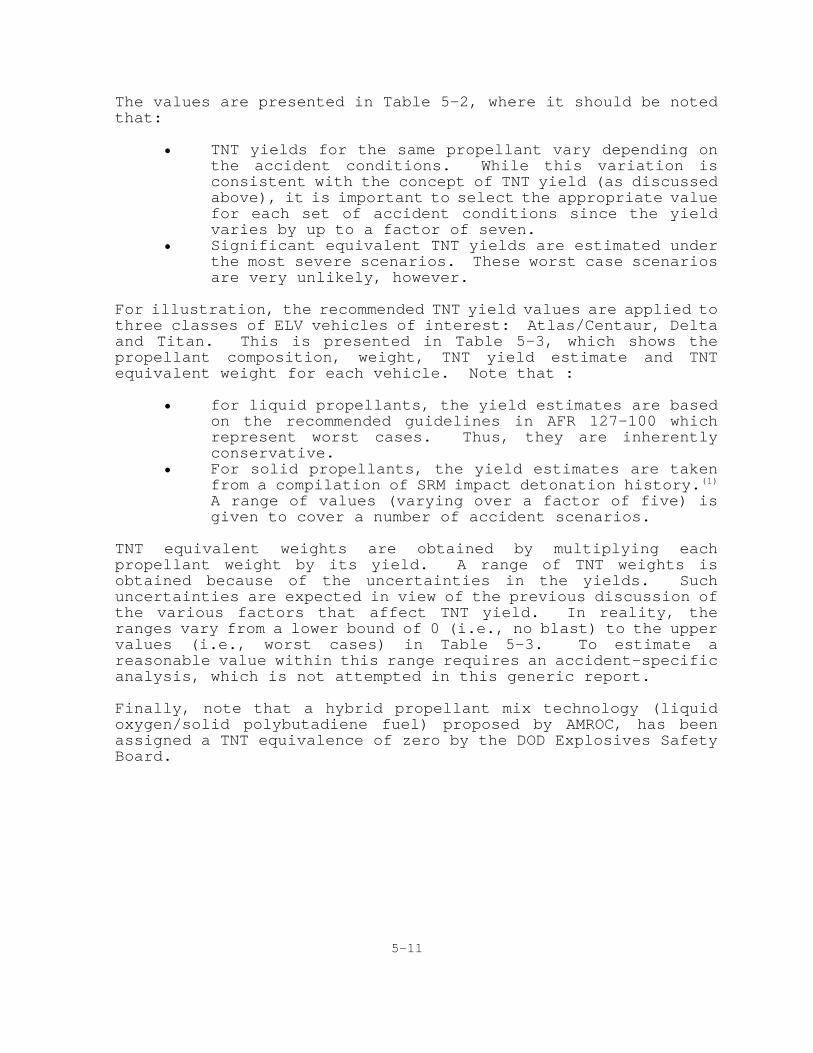
The values are presented in Table 5-2, where it should be notedthat:
• TNT yields for the same propellant vary depending onthe accident conditions. While this variation isconsistent with the concept of TNT yield (as discussedabove), it is important to select the appropriate valuefor each set of accident conditions since the yieldvaries by up to a factor of seven.
• Significant equivalent TNT yields are estimated underthe most severe scenarios. These worst case scenariosare very unlikely, however.
For illustration, the recommended TNT yield values are applied tothree classes of ELV vehicles of interest: Atlas/Centaur, Deltaand Titan. This is presented in Table 5-3, which shows thepropellant composition, weight, TNT yield estimate and TNTequivalent weight for each vehicle. Note that :
• for liquid propellants, the yield estimates are basedon the recommended guidelines in AFR 127-100 whichrepresent worst cases. Thus, they are inherentlyconservative.
• For solid propellants, the yield estimates are takenfrom a compilation of SRM impact detonation history.(1)
A range of values (varying over a factor of five) isgiven to cover a number of accident scenarios.
TNT equivalent weights are obtained by multiplying eachpropellant weight by its yield. A range of TNT weights isobtained because of the uncertainties in the yields. Suchuncertainties are expected in view of the previous discussion ofthe various factors that affect TNT yield. In reality, theranges vary from a lower bound of 0 (i.e., no blast) to the uppervalues (i.e., worst cases) in Table 5-3. To estimate areasonable value within this range requires an accident-specificanalysis, which is not attempted in this generic report.
Finally, note that a hybrid propellant mix technology (liquidoxygen/solid polybutadiene fuel) proposed by AMROC, has beenassigned a TNT equivalence of zero by the DOD Explosives SafetyBoard.
5-11
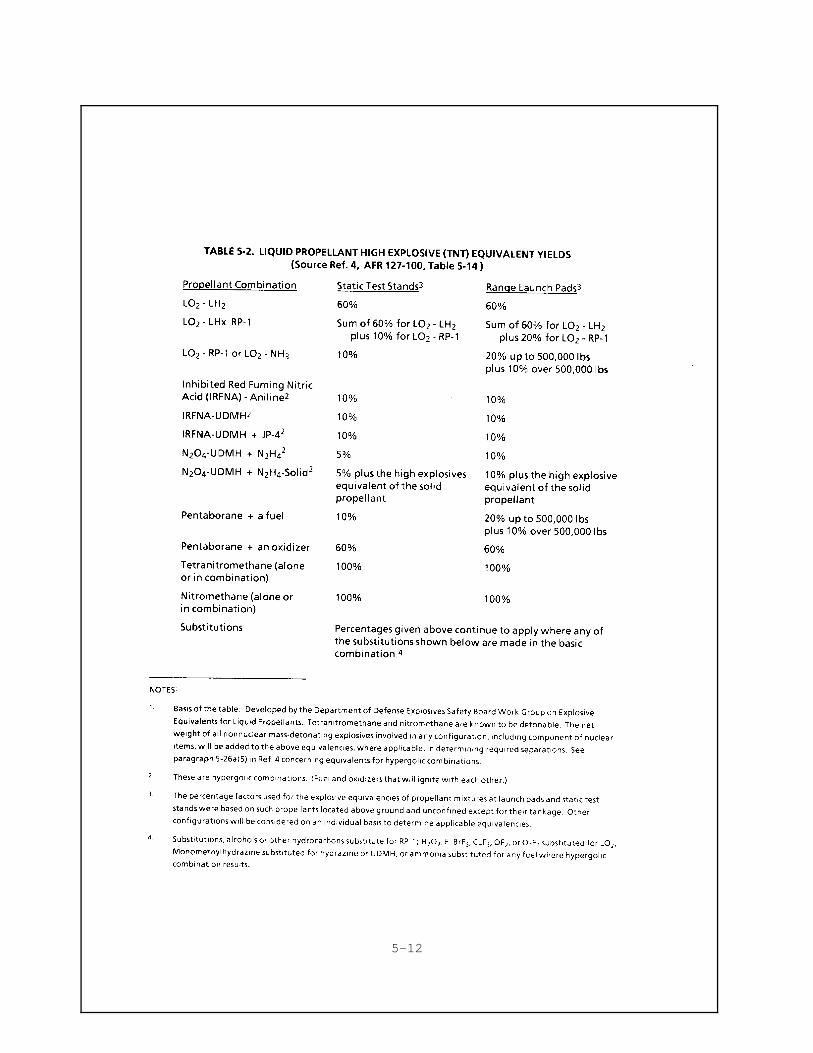
5-12
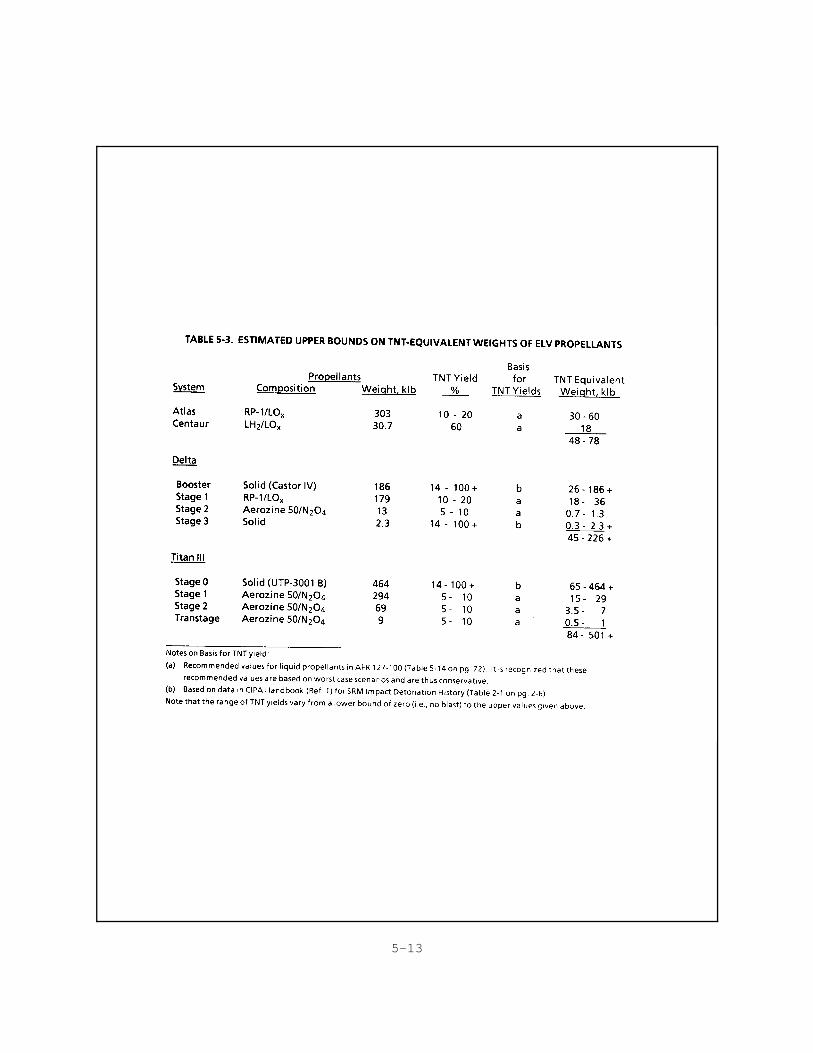
5-13
5.2.3 Damage Criteria
Blast waves from accidental explosions can cause damage to peopleand property (structures) by subjecting them to transientcrushing pressures and winds (which cause drag pressures due tothe sheer force of the wind). Even though the interactions ofthe waves with the objects involve very complex phenomena,relatively simple concepts have been used quite effectively tocorrelate blast wave properties with damage to a variety oftargets. The concept states that damage is primarily a functionof either the peak overpressure, the impulse or some combinationof these two factors.
Guidelines for peak overpressures required to produce failures tostructures such as shattering of glass windows and collapse ofconcrete walls are presented in Table 5-4.(1) Note that a verylow pressure (force per unit area) is sufficient to cause damage,mainly due to the large area of such surfaces. Similar criteriaare used in the hazard assessment model used in Vol. 3, Ch. 10 ofthis report.
Criteria for injury of personnel standing in the open are givenin Table 5-5.(1) They cover ear drum rupture and lung hemorrhagecaused by overpressure and personnel blowdown caused by theimpulse imparted by the blast wave, with the concomitantpotential of injury due to bruises, lacerations and bonefractures. These data are presented in graphic form in Figure 5-2 and Figure 5-3.(12) Note that:
• The overpressure required to cause damage decreases (asexpected) with the increase in the duration of thepositive phase of the blast wave.
• There is a significant variability in thesusceptibility of people to such overpressure. Suchvariability can be accounted for statistically byraising overpressure thresholds to ensure higher levelsof lethality. This should be done carefully tomaintain a realistic approach to analysis.
Finally, blast wave characteristics (Section 5.2.1) can becombined with the present damage criteria in order to estimatethe extent of the damage (in feet) as a function of variousequivalent weights of TNT. Typical results are shown in Figure5-4 for eardrum rupture, lung damage, etc. Similar data areused in the next section and in Ch. 10, Vol.3 to illustrate theassessment of both property damage and personnel injury over arange of accident conditions.
5-14
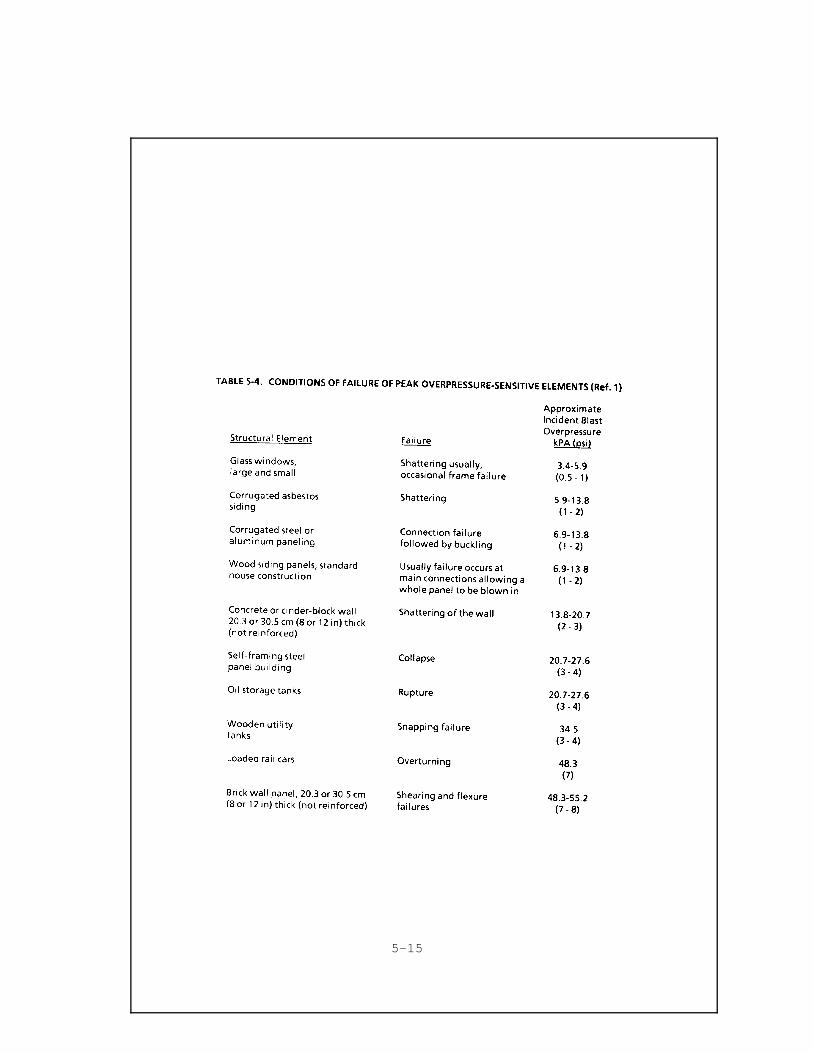
5-15
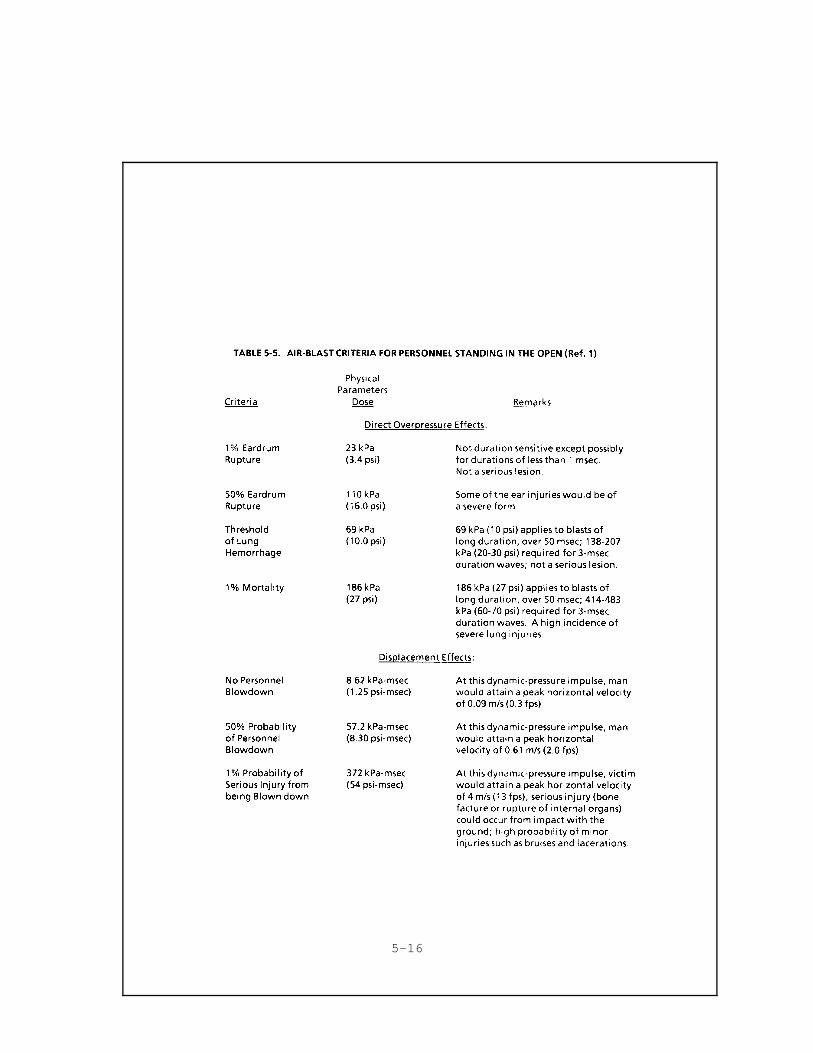
5-16
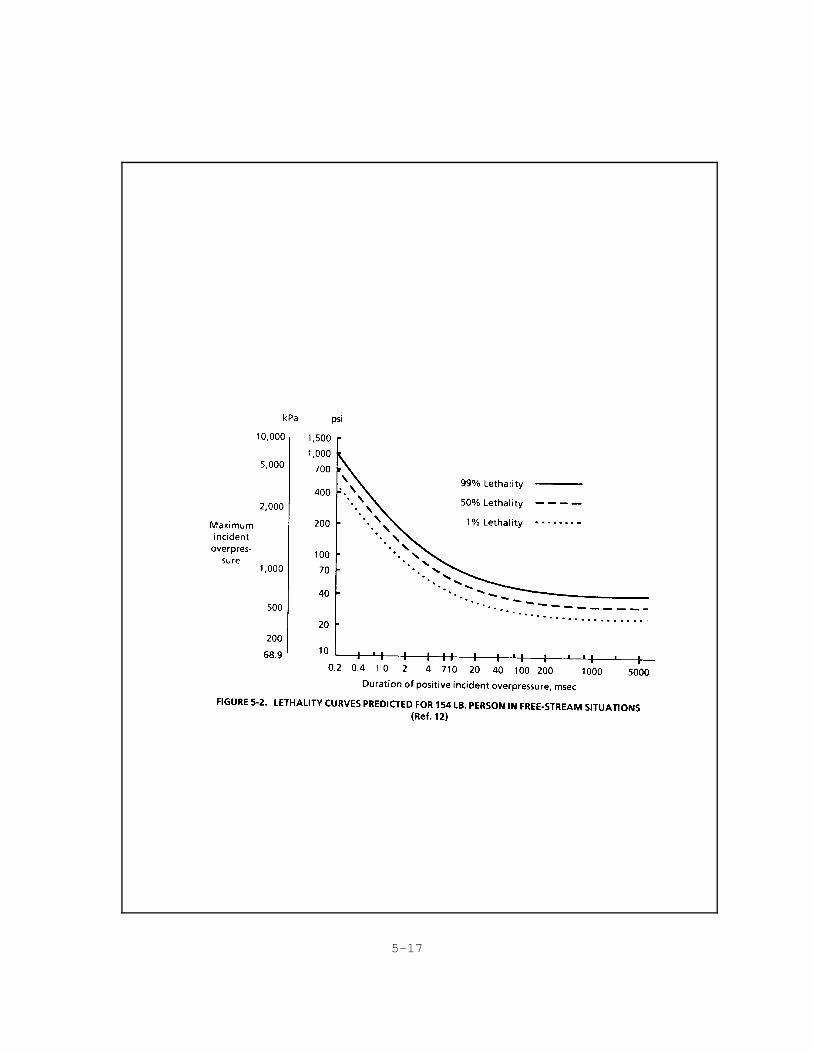
5-17
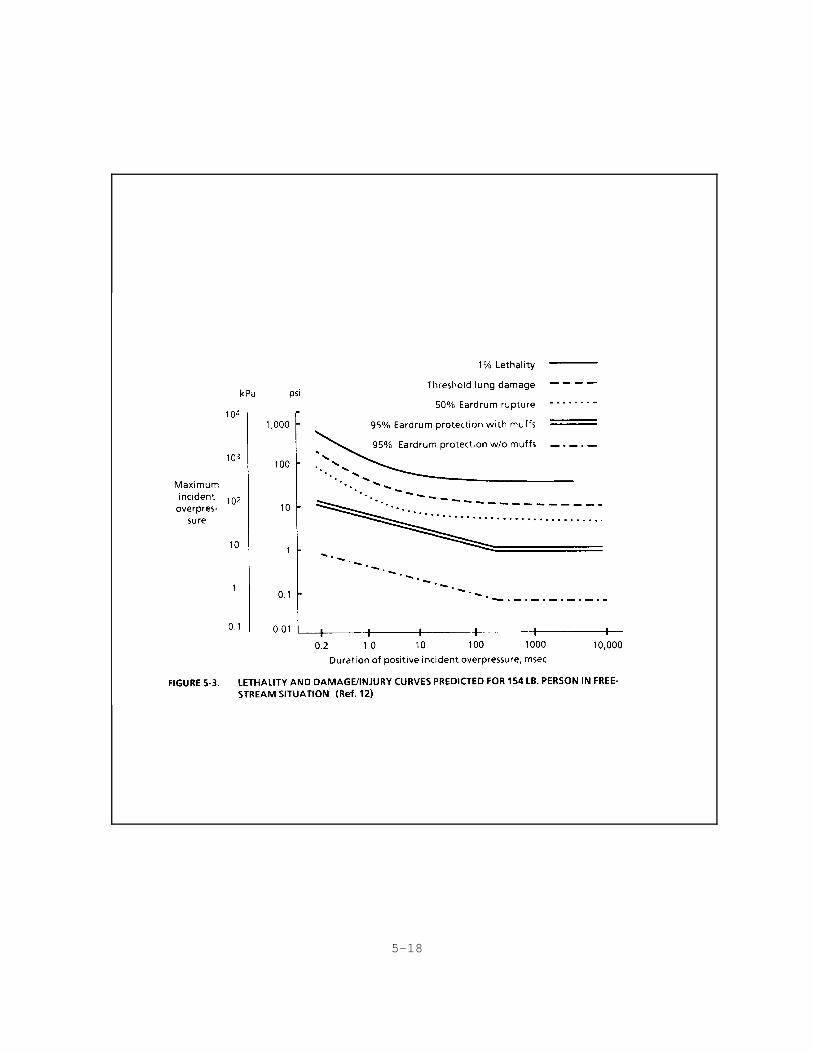
5-18
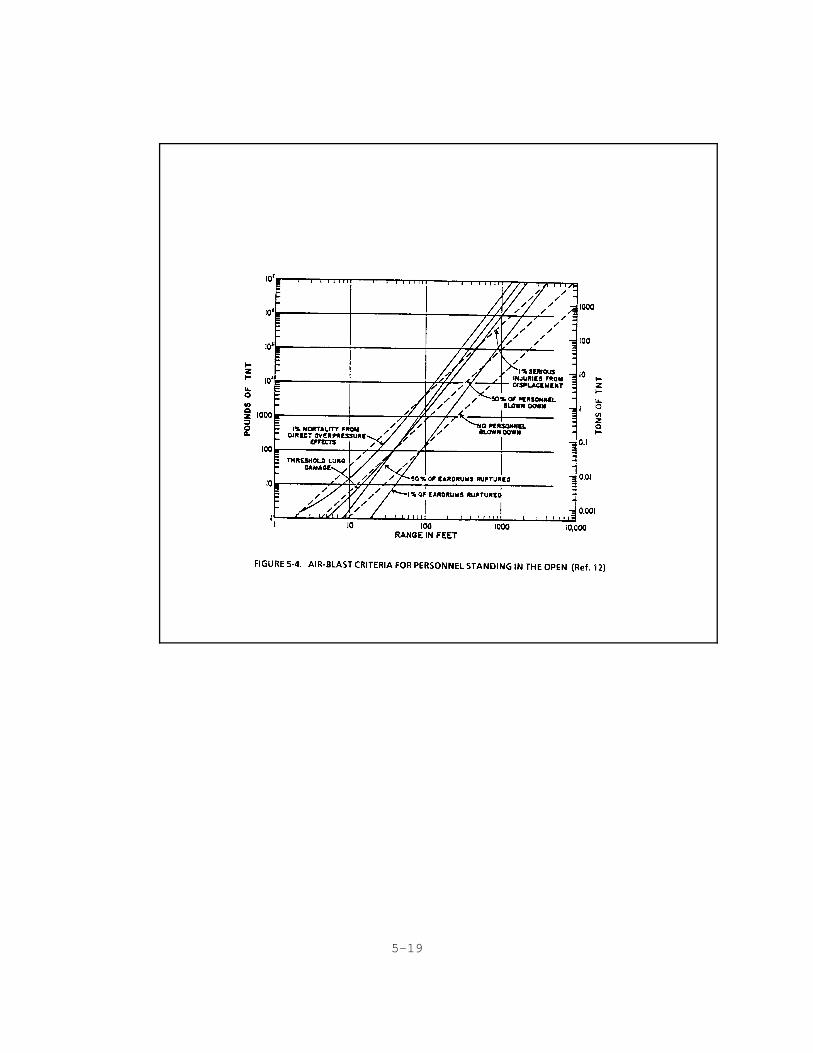
5-19
5.2.4 Variation of Explosion Hazards with Time fromLiftoff
As noted, launch hazards decrease with time into the flight.This point is illustrated in this section for potential thirdparty damage due to an accidental explosion of an ELV. Thevariations of other hazards with time are not discussed.
Data are used for a typical Delta ELV system flight profile andpropellant consumption rate as a function of time elapsed afterliftoff.(13) However, qualitatively, the discussion appliesequally well to other ELV systems.
The outcome of an accident is usually determined by the specificcircumstances present at the time and location of the accident.Usually, there are a number of variations for these circumstanceswhich can lead to a number of outcomes. In this illustration,the analysis is simplified to focus on the effects of "time intoflight."
The calculations presented below are also based on a number ofassumptions selected to make the analysis workable. For example,for the sake of simplicity, it is assumed that all of thepropellants remaining on board will explode instantly (thiscorresponds to a worst case calculable explosion scenario). Inreality, the situation is more complicated:
• some of the propellant may explode initially, producingfragments that may explode later upon impact with theground (secondary explosions);
• some of the propellant may burn in a fireball; and
• some of the hypergolic propellant may disperse in theenvironment without reacting, posing toxic risks ordispersing harmlessly.
Another example of a simplifying assumption is to representdifferent circumstances occurring at various times into flight bysimply changing the TNT yield. The yield is increased when thecircumstances (such as failure mode, mixing rate or impact speed)favor a stronger explosion (as described in more detail below).
Note that each scenario can be associated with a vehicle failuremode and is likely to occur with a particular probability value(Section 5.6). Thus, although the discussion below makes noexplicit mention of probabilities, the predicted results are tiedto a particular probability value.
5-20
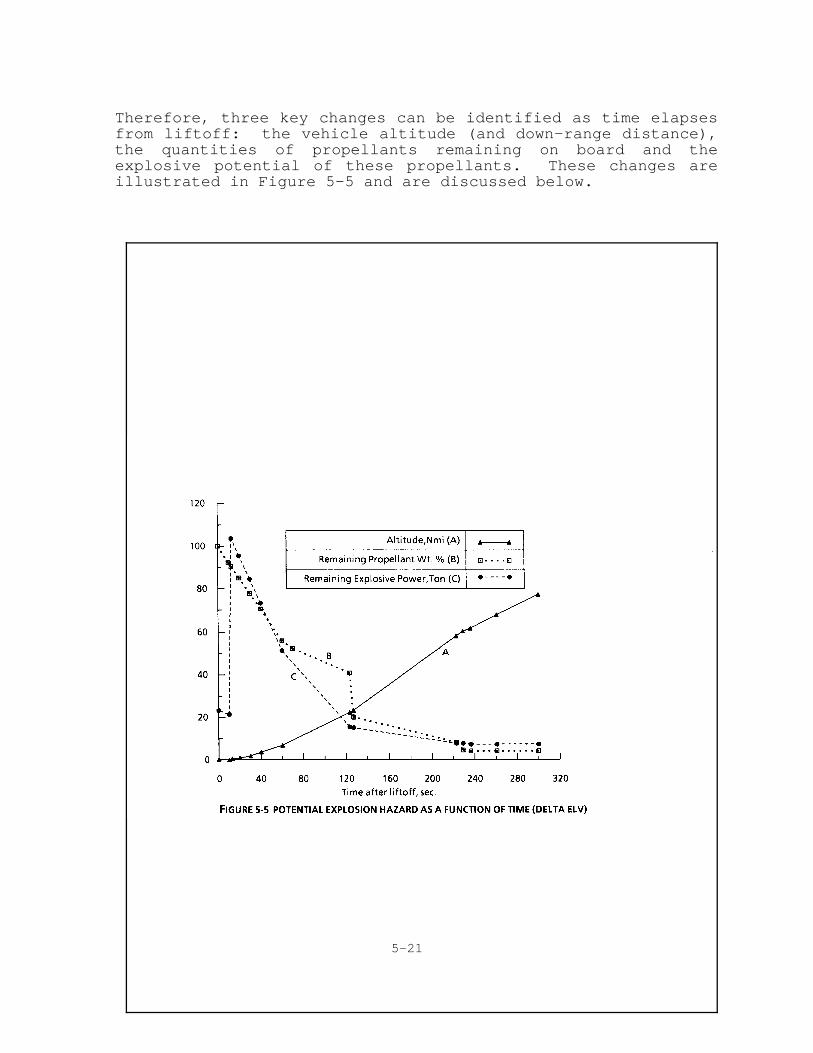
Therefore, three key changes can be identified as time elapsesfrom liftoff: the vehicle altitude (and down-range distance),the quantities of propellants remaining on board and theexplosive potential of these propellants. These changes areillustrated in Figure 5-5 and are discussed below.
5-21
First, the vehicle altitude increases very rapidly with time intoflight -- reaching roughly 20 nm. in the first 2 minutes, asillustrated by curve A in Figure 5-5, which shows a typicalflight profile for a Delta mission.(13) Furthermore, the locationof launch sites and the direction of launch are usually selectedso the vehicle moves away from population centers. Thus, the"separation" distance between the vehicle and the communitiespotentially vulnerable, in case of a vehicle accident, increaseswith time.
Second, as time elapses from liftoff, the quantity of propellantsremaining on board decreases very rapidly due to their rapidconsumption by the rocket booster and other engines. The totalweight of all propellants remaining on board is illustrated byCurve B in Figure 5-5. Note that the total remaining propellantweight decreases by about 50% within 2 minutes from liftoff.
Third, the explosive potential (or TNT yield) of a given quantityof propellant may change as time elapses from liftoff. Asdiscussed earlier (Sec. 5.2.2), the TNT yield of a propellant inan accidental explosion depends on its properties, as well as ona variety of other factors, determined by the details of theaccident scenario. Example of such factors include: the sizesof solid propellant fragments their impact speed, the rate andextent of mixing of liquid propellants, the degree ofconfinement, etc. In fact, the significance of TNT yields, howthey are estimated and the pertinent ranges of values given inthe published literature were discussed in Section 5.2.2.
Determination of TNT yield at various times after liftoffrequires an extensive analysis. First, identify the type offailures and accident scenarios that are likely to occur andsecond, estimate the yield for each scenario and each propellantsystem based on historical accident data, test data, experienceand engineering judgment. Such an analysis was done for theSpace Shuttle system by the Explosive Equivalency Working Groupestablished by NASA in 1978, as discussed in Section 5.2.2.Ideally, the same type of analysis for each ELV type is needed toestablish pertinent explosive yields were the accident to occurat various times from liftoff. However, for simplicity, anotherapproach which is not as rigorous, but may suffice, is used toillustrate the explosive yield dependence on time from liftoff.
Table 5-2 in Section 5.2.2 lists upper limits for TNT yields forELV propellants reported in the literature. The lower bound forthese yields is zero (%), since the propellants may react or burnwithout producing mechanical damage. The range of upper valuesfor the Delta vehicle propellants are:
5-22
• 10 to 20% for RP-1/LOX (Stage I)• 5 to 10% for Aerozine-50/N2O4 (Stage II)• 14 to 100% for the solid rocket motors (Booster and
Stage III)
Note that each point within these ranges can be associated witha particular accident scenario which, in turn, may be associatedwith a specific time from liftoff. For example, when a vehicle(or its fragments) falls back on the pad soon after liftoff, thespeed at ground impact is a key factor in determining thelikelihood of detonating the solid propellants. It is known thatan impact speed of 300 ft/sec is required to detonate solidpropellants and produce significant yields. In order to reachsuch terminal speeds in free-fall, a vehicle would have to startat an altitude of approximately 1400 ft (assuming no drag). Thisaltitude would be reached in about 12 seconds after liftoff.Thus, if the vehicle falls back onto the pad in the first 12seconds (or so), a low yield is anticipated, while if it fallsback at a later time, a higher yield is anticipated. Followingthis reasoning, the yields corresponding to these two situationsare assumed (for simplicity) to be the upper and lower values ofthe ranges listed above for the three propellant types in theDelta vehicle. Thus, the yields would be:
• 10, 5 and 14% (respectively for the 3 types ofpropellants) in the first 0 to 12 sec after launch;
• 20, 10 and 100%, respectively, at later times intoflight.
By multiplying these yields with the amount of propellantsremaining on board, the potential explosive energy (in terms ofequivalent pounds of TNT) is estimated as a function of time fromliftoff as illustrated by Curve C in Figure 5-5. Note that theexplosive potential starts at a low value (because of the lowyield); then increases because of the increase in yieldcorresponding to higher impact speed; finally it decreasesbecause of the decrease in the quantity of propellant remainingon board.
Using the potential explosive energy determined above, theoverpressure field around the explosion point was estimatedfollowing the analysis outlined in Section 5.2.1. It was assumedthat the entire vehicle will explode at altitude and as one mass(a more realistic assumption is a smaller explosion in flight,breaking up the vehicle in fragments that will explode uponground impact). It was also assumed that any reflection orfocusing of the shock wave would have a negligible effect on theoverpressure field.
5-23
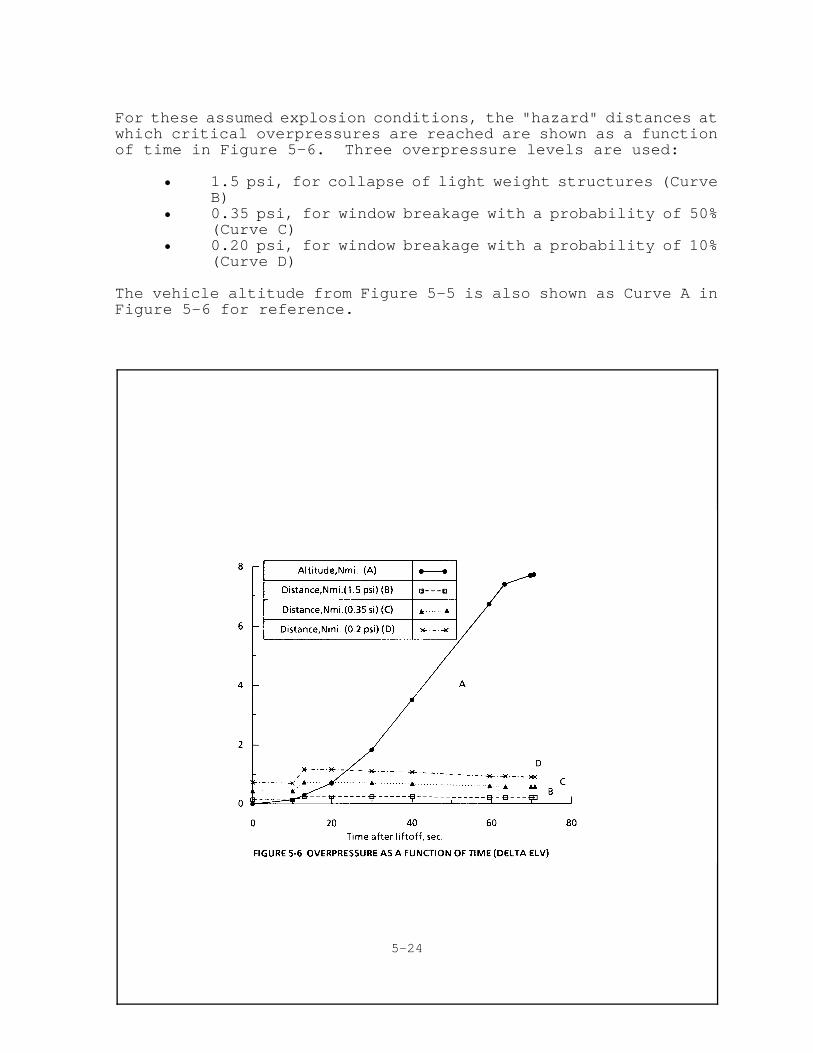
For these assumed explosion conditions, the "hazard" distances atwhich critical overpressures are reached are shown as a functionof time in Figure 5-6. Three overpressure levels are used:
• 1.5 psi, for collapse of light weight structures (CurveB)
• 0.35 psi, for window breakage with a probability of 50%(Curve C)
• 0.20 psi, for window breakage with a probability of 10%(Curve D)
The vehicle altitude from Figure 5-5 is also shown as Curve A inFigure 5-6 for reference.
5-24
In Fig. 5-6, the hazard distances first increase with time, andthen decrease -- following the behavior of the potentialexplosive energy profile which is shown in Fig. 5-5.Furthermore, Fig. 5-6 can be interpreted as follows:
• in approximately the first 25 seconds, damage such aswindow breakage is possible in a distance ofapproximately 1 nm. from the launch pad (or thelocation of vehicle impact with ground).
• at later times, key scenarios are:
a- all the propellant explodes at the vehiclealtitude. The potential mechanical damage at groundlevel is negligible (even if maximum yield is assumed)because of the high altitude of the vehicle and its thelarge separation from ground.
b- the vehicle falls back to Earth as one piece andexplodes. This is a very unlikely scenario since thevehicle will breakup under the aerodynamic forcesproduced by the fall. Even in such a worst casescenario, Figure 5-6 suggests that the maximumoverpressure distance will be less than 1 nm. in thefirst 25 to 60 sec time frame; much smaller yet atlater times because of the rapid consumption ofpropellants with time of flight. The location of theimpact point will be governed by vehicle trajectoryduring the fall, which in turn depends on a number offactors as discussed in Section 5.3.
c- the vehicle breaks up at altitude, producingfragments, some of which may detonate as they impactground. The hazard of item b above is now distributedover a broader region determined by the impact pointsof the fragments. The overpressure hazard distancesaround each impact point will be smaller than in babove. They will depend on additional factor such asnumber and size of fragments and their rates ofconsumption during their fall. This is furtherdiscussed in Section 5.3.
Off-range damage in any of the above cases will depend on thepresence of population centers within a radius (of the explosioncenter) equal to the above distances (see Sec. 5.6).
Generally, the hazard from propellant explosion decreasesrapidly with time into flight, except for the first 10 to 25seconds. Activation of the Flight Termination System is likelyto further reduce such explosion hazards by dispersing the
5-25
propellant. Typically, the FTS is not activated during the first8-12 seconds (depending on ELV, mission and site) in order toavoid damage to the pad facilities. This subject is discussed inmore detail in Ch. 3, Vol. 1 and Ch. 10, Vol. 3.).
5.3 DEBRIS HAZARDS
A debris hazard exists even for a normal successful launch,primarily from jettisoned stages, shrouds and other components.These can be expected to impact within the impact limitboundaries of the flight corridor. The flight corridor isspecified by applying safety considerations to the mission flightrequirements, as discussed in Ch. 2, Vol. 1. Thus, hazards whichcannot be eliminated are controlled. Since the launch facilitiesare located so that the vehicles will fly over largelyuninhabited areas and oceans, the risks to third parties innormal operational situations are very low .
A debris hazard also exists due to failure modes such asmalfunction turns (from gradual to tumbling turns) and prematurethrust termination (from an accidental subsystem failure,commanded thrust termination or commanded vehicle destruction).Debris may be created either from breakup of the vehicle due toexcessive aerodynamic pressure or explosion (accidental orcommanded destruct). Major issues in assessing debris hazardsinclude: what is the number, weight and shape of fragments?Where will they land? What is their impact force upon landing?What is their impact in terms of structure penetration andlethality?
Illustrative examples of debris data from selected space vehicleexplosions and test data (occurring at or near ground level) areshown in Figure 5-7 and Figure 5-8. These figures show the totalnumber and weight distributions of fragments (respectively) as afunction of range (i.e., distance). These distances weredetermined by the forces of the explosions.
Clearly, when a vehicle is in flight at significant altitude, thedebris will land over a much larger area than in Figures 5-7 and5-8. The distribution of debris impacts is dependent upon theforces acting on the fragments. Initially, the velocity vectorof the vehicle is of primary importance and this contribution isaffected by the velocity vectors resulting from the turns,tumbling and/or explosions. Thereafter, the effects of theatmosphere on the fragments during free fall (which depend onwind and the fragment size, shape and mass) become important.These issues lead to uncertainties in the fragment impactdistribution which can be attributed to four basic sources:
(1) uncertainty in the vehicle state vector at vehiclebreakup or destruct;
5-26
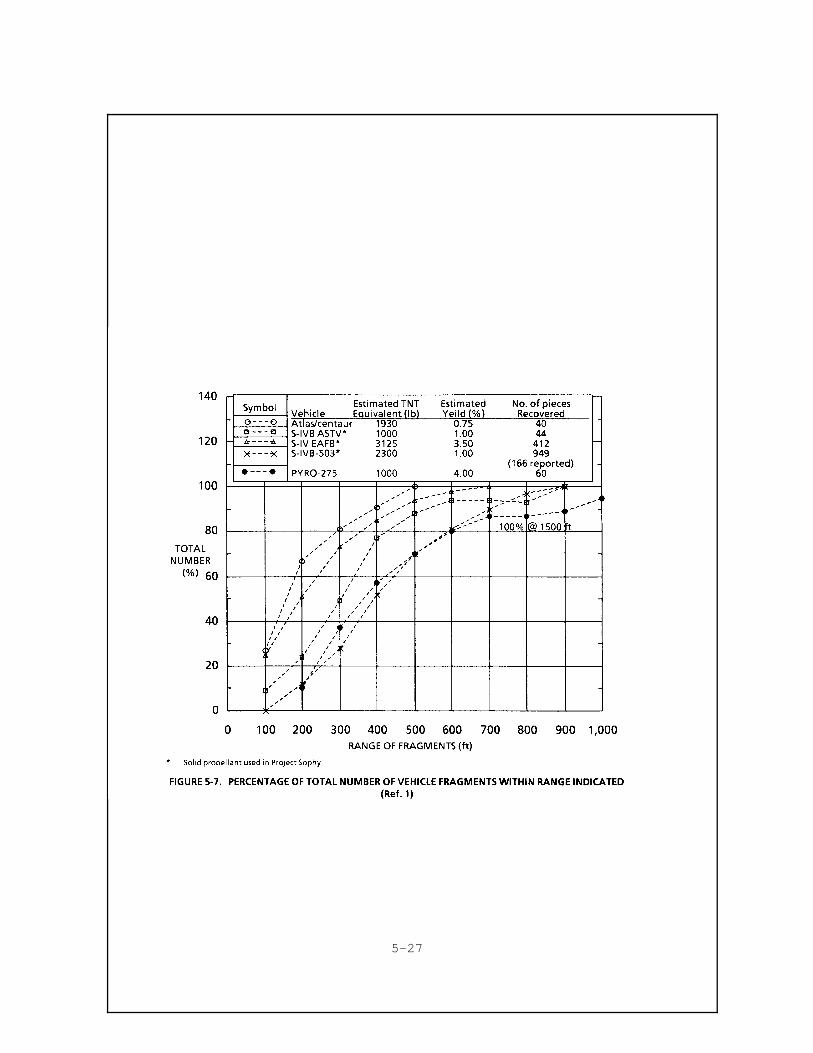
5-27
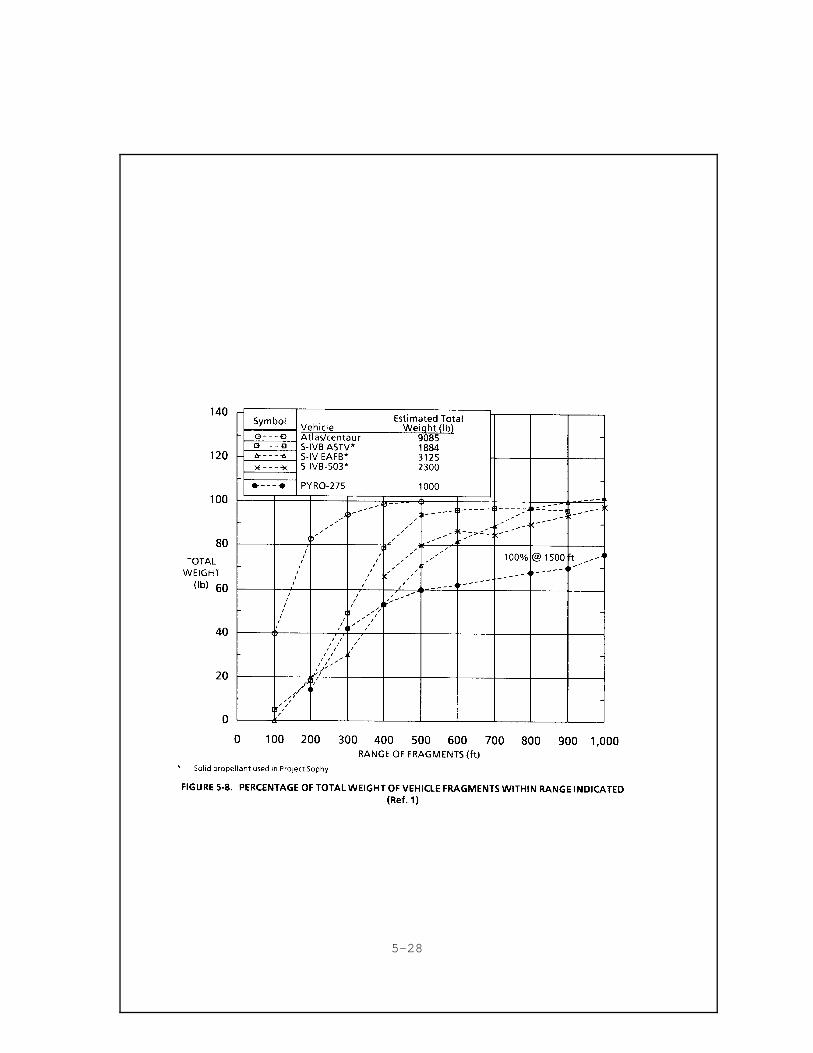
5-28
(2) uncertainty in any destruct velocity imparted to thefragment by a destruct system (or explosive failure); (3) uncertainty in the atmospheric environment during freefall; and (4) uncertainty in the fragment size, aerodynamic lift anddrag.
Furthermore, impacting launch vehicle fragments can be dividedinto four categories:
(1) inert pieces of vehicle structure; (2) pieces of solid propellant (some of which may burn upduring free fall);(3) vehicle structures which contain propellant (solid orliquid) that may continue to burn after landing (but arenon-explosive). They pose the risk of starting secondaryfires at the impact points; and (4) fragments which contain propellant and which canexplode upon impact (if their impact velocity is greaterthan roughly 300 ft/s).
The casualty area of an impacting fragment is the area about thefragment impact point within which a person would become acasualty. Casualties may result from a direct hit, from abouncing fragment, from a collapsing structure resulting from animpact on a building or other shelter, from the overpressurepulse created by an explosive fragment, from a fire or toxiccloud produced by the fragment or some combination thereof. Thehazard area is increased if a fragment has any significanthorizontal velocity component at impact which could result inbouncing or other horizontal motion near ground level.
Casualty area is also affected by the sheltering of people bystructures. Structures may be divided into classes (forcomputational purposes) depending on the degree of protectionthey can afford.
Clearly, estimating a casualty expectation is a complexcomputational problem. Different Ranges approach the problem indifferent ways depending on the needs of the Range. Computermodels may be used, but the sophistication varies greatly fromRange to Range. A computer model called LARA (Ref. 9) treatscasualty areas analytically and is presented in other chapters(Vol. 2, Ch. 4, and Vol. 3, Ch. 10).
5.4 FIRE HAZARDS
The fire hazards of accidentally released solid and liquidpropellants depend on the details of the accident scenarioincluding: the thermodynamic state of the propellant, the amount
5-29
of the release, vehicle location and speed (on launch pad versusin flight), the presence of confining surfaces and ignitionsources, etc. The major types of fires that can develop are:
• Fireball: where burning occurs in a ball of fire thatexpands and rises in the air (due to buoyancy forces)until the propellant is consumed.
• Pool fire: where a film of propellant is formed on theground and burns with a flame attached to the film.
• Vapor cloud fire: where ignition is delayed and vaporsare carried away by prevailing winds, thus forming aflammable cloud that may ignite at a later time.
• Various combinations of the above fires.
These fires are discussed below.
5.4.1 Fireballs
Fireballs are produced when the propellant is quickly vaporizedor atomized. These conditions include flash vaporization ofpressurized liquids and releases during flight at high speed.The vapors or fine droplets can then rise under the effects ofbuoyancy as they burn in the fireball.
The main damage mechanism is thermal radiation to people andproperty. Another damage mechanism is firebrands from burningsolid propellants and hot debris which might start secondaryfires where they land. A third damage mechanism is impact damageby vessel fragments which have been reported to travel largedistances. Overpressure may also develop due to the initial highrate of energy release associated with vessel failure, but it isusually insignificant.
The damage potential depends on key fireball parameters such asdiameter, rise rate, duration and temperature or emissive power.These parameters have been quantified in several experimental andanalytical studies.(1) In fact, the ball diameter was found toscale roughly with the 1/3 power of the weight of releasedpropellant.
The chemical composition of the products of combustion depend onthe chemical composition of the propellants. The combustionproducts contain mainly water vapors and oxides of carbon andnitrogen. Thermal radiation emitted in the form of water vaporwill be (partly) reduced by moisture absorption in theatmosphere. The transmitted radiation can impact people andstructures. Table 5-6 shows critical radiation fluxes requiredto cause burn injury and start secondary fires (such as byigniting fuels placed inside and outside buildings). Note thatas the exposure time increases, the required radiant fluxdecreases, as expected.
5-30
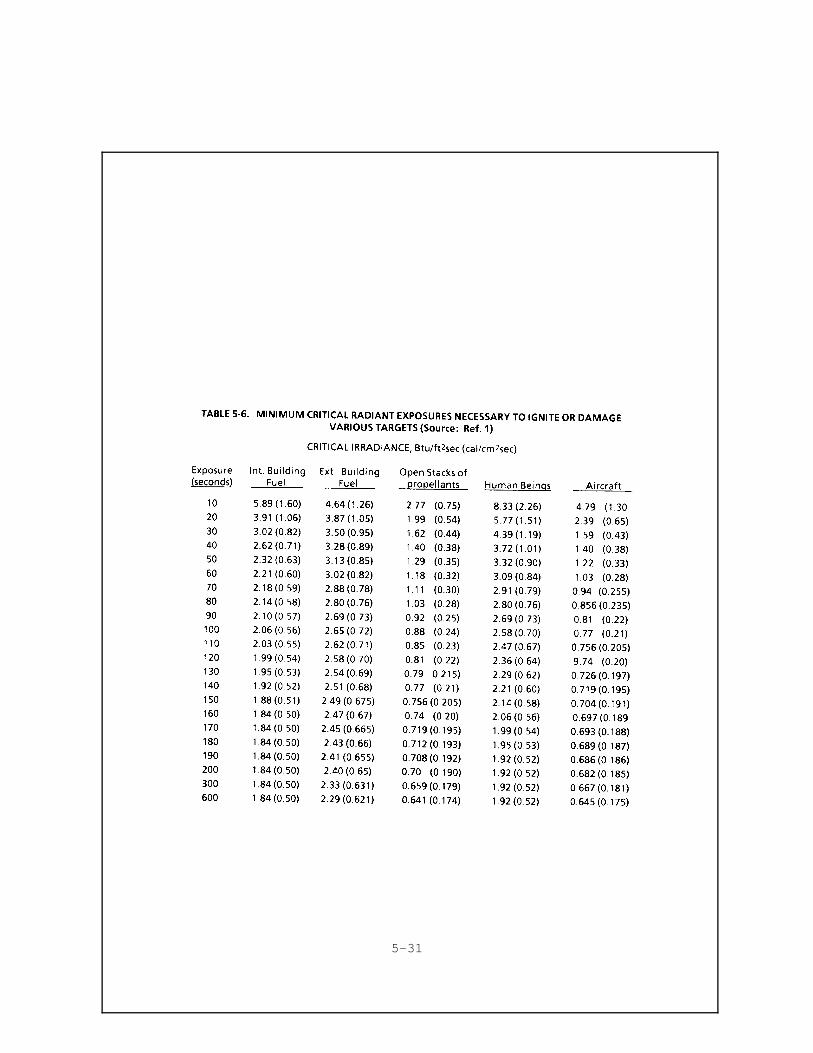
5-31
5.4.2 Pool Fires
Pool fires are produced when liquid propellants are accidentallyspilled on the ground such as:
• from a vehicle in pre-launch phase: this scenario isoutside the scope of this study since its impact is notlikely to extend outside the Range boundaries.
• from ground operations such as propellant transport tothe Range and storage, handling and transfer within theRange. In this case, the impact may occur outside theRange boundary.
A spilled liquid will spread on the ground under the effect ofgravity, filling small-scale crevices in a ground with surfaceroughness or large-scale depressions in an undulating terrain.While spreading, cryogenic propellants (such as liquid hydrogenand oxygen) will boil violently due to heat transfer from therelatively warm ground. A propellant at ambient temperature(such as RP-1) will evaporate more slowly. Some flashvaporization of cryogenic liquids will also occur because theirvessels are usually maintained at slightly above atmosphericpressure.
Ignition produces a pool fire with a flame base which spreadsalong with the liquid film and a flame height determined by therate of evaporation and the rate of mixing of fuel and oxidizer.The overall character of such a pool fire is essentially aturbulent diffusion flame which may continue to expand on flatground (or remains stationary if the liquid has accumulated in adepression area) until it runs out of fuel.
The danger of pool fires consist of thermal radiation to peopleand property (as in the case of fireballs) and direct flameimpingement on structures near the fire.
5.4.3 Vapor Cloud Fires
In the pool fire scenario described above, if:
• the liquid pool does not ignite immediately after therelease, because of lack of an ignition source; and
• the released propellant has a high vapor pressure suchas liquid hydrogen, oxygen, nitrogen, air or methanewhich boil due to heat transfer from the environmentand not from a fire;
5-32
then, a large amount of vapor will be produced and transported byprevailing winds to form a vapor cloud. In this scenario, theresulting cloud is elongated in shape and is called a "plume".Its leading edge advances with the wind and its trailing edge isformed at the evaporating pool (the source of the vapors). Asthe leading edge moves further downwind, ambient air is entrainedin the cloud, thus increasing its volume and decreasing the vaporconcentration. This process is called atmospheric dispersion andis discussed further in the next section.
If a flammable cloud encounters an ignition source, a fire willspread through the cloud, engulfing in flames whatever iscontained in the cloud. This is referred to as a vapor cloudfire. Under some conditions (particularly the presence ofobstructions or confinement in the cloud) overpressure can beproduced, posing the added risk of mechanical damage.
Alternatively, as the cloud disperses, the vapor concentrationmay drop below the flammable limit prior to encountering anignition source. Thus, the hazard is dissipated without anyadverse impact.
5.5 TOXIC VAPOR CLOUDS
The evaluation of the toxicity of any material is a very complexsubject. Toxicity data are very sparse and questionable exceptfor the common toxins. When available, they are usually forcontinuous exposures as one would find in a factory environmentand not for the short exposures characteristic of launchoperations.
Still, the issue is of great interest because toxic materials maybe released during ELV launches as combustion products, or in theevent of an accident, as uncombusted propellants. The mostnotorious ones are hypergolic liquid propellants such asmonomethyl hydrazine, Aerozine-50 and nitrogen tetroxide.
Their chemical properties and toxic Threshold Limit Values (TLV)are listed in Appendix B along with other characteristics ofinterest. If such materials are released in the environment,they may be carried by the wind and travel windward as theydisperse. This atmospheric dispersion is described below.
5.5.1 Atmospheric Dispersion
Over the years, the subject of atmospheric dispersion has beenstudied extensively in connection with air pollution studies frompower plants and automotive vehicles. These studies addressedthe case of continuous releases from normal operations wherepollutant concentrations were monitored over long periods oftime.
5-33
In this study, the interest is mainly in larger uncontrolled"instantaneous" releases (as would occur in an accident). Then,a large amount of potentially noxious vapor may be produced andtransported by prevailing winds to form a vapor cloud. There aretwo main types of vapor clouds:
• a "plume": an elongated cloud whose the leading edgetravels with the wind, while the trailing edge remainsstationary at the source of the vapors. Conditionswhich produce a plume are described in the precedingsection;
• a "puff": a more or less spherical cloud where bothleading and trailing edges move together downwind.
In reality, a combination of these two cloud geometries mayoccur, depending on accident conditions.
As the cloud travels downwind, ambient air is entrained in thecloud; this increases its volume and decreases the vaporconcentration. The process can be further complicated bychemical interactions among hypergolic vapors and between vaporsand entrained air.
Such cases of large "instantaneous" releases have also beenstudied experimentally. Large scale tests involving the spillageof large quantities of chemicals were carried out andconcentrations were measured downwind. The most notable tests,carried out as part of national and international programsinclude:(21)
(1) the liquefied natural gas (LNG) dispersion tests at theNaval Weapons Center, China Lake, California, for theUS Department of Energy;
(2) the ammonia spill tests at the above location for theFertilizer Institute and the US Coast Guard;
(3) the Porton Down tests in England involving theinstantaneous release of Freon;
(4) the heavy gas dispersion trials on behalf of the Healthand Safety Executive of the British Government andother participants; and
(5) the LNG spill tests conducted by Shell UK Ltd. atMaplin Sands, England.
Based on such tests, it is recognized that cloud dispersiondepends mainly on:
5-34
• ambient conditions such as wind, atmospheric stabilityand local terrain.
• the buoyancy of the vapor cloud. It is important todetermine whether the cloud is lighter or heavier thanair because the former will disperse much faster thanthe latter. The presence of aerosols (fine dropletssprayed from the spilled liquid) increases theeffective density of the cloud and modifies itsdispersion characteristics. Also, cloud density mayvary in space and time so that some portions may belighter than air and others heavier.
• the size and location of the release, i.e., whether itis on ground level (from an accident on the launch pad)or from an elevated altitude (from an accident inflight).
There are several models in the literature describing thedispersion behavior of heavier-than-air gases under a wide rangeof conditions.(14 a, b, c) Models which discuss the dispersion ofvapors released passively (as from a boiling pool of liquid)include Van Ulden,(15) Britter,(16) and Colenbrander.(17) There arealso models in the air pollution literature dealing with releaseof neutral and positively buoyant vapors from stacks.
In general, the dispersion of vapors in the far-field (aftersufficient dilution) can be predicted with reasonable accuracy bythe standard Gaussian models of Pasquill(18) and Gifford.(19)
However, in the near-field, these models have to be modified totake into account the effects of initial gravitational spreading,jet mixing or the effects of aerosol evaporation.(20)
5.5.2 Rocket Exhaust Products
Most of the combustion products from rocket engines are harmlessor unlikely to exist in concentrations which would affect thehealth and safety of third parties. These combustion productsmay include:
• water and water vapors• nitrogen• hydrogen• carbon monoxide and dioxide• hydrogen chloride • aluminum oxide
Of these combustion products, carbon monoxide and hydrogenchloride may be considered hazardous. Aluminum oxide is nottoxic, but may contribute to certain lung diseases if exposurepersists over time. The remaining combustion products are not
5-35
dangerous unless present in sufficient concentration to causeasphyxiation, which is not the case. Threshold Limit Values(TLV) for major combustion products are given in Table 5-7 forvarious exposure durations for both controlled (Range personnel)and uncontrolled (third party) populations.
For illustration, Figure 5-9 shows results from a model using theNASA/MSFC (buoyant-rise, multilayer dispersion model of exhaustproducts) to compute peak instantaneous concentrations ofhydrogen chloride as a function of downwind distances from thelaunch pad for sea breeze meteorological conditions and certainvehicle configurations. Also, Figure 5-9 shows the exposurecriteria limit (as given in Table 5-7) for 10 minute-exposure ofuncontrolled populations (third parties). Note that this limitis not exceeded at downwind distances of interest. In 1985, theCommittee on Toxicology, Board on Toxicology and EnvironmentalHealth Hazards, Commission on Life Sciences, National ResearchCouncil published a document entitled "Emergency and ContinuousExposure Levels for Selected Airborne Contaminants," Volume V.(20a)
This document updates recommendations for public exposure to thehydrazines and creates a new category, Short-term PublicEmergency Guidance Levels (SPEGL's) for up to 24 hours forhydrazine propellants. The data in this document affects valuesfor the uncontrolled population exposure to hydrazine shown inTable 5-7.
5.5.3 Releases During Accident Conditions
In the case of a near-pad explosion, all of the propellant isunlikely to be combusted. Thus, a vapor cloud containing vaporsand aerosols of hydrazine, nitrogen tetroxide and hydrocarbonfuels might result. Other chemicals such as fuel additives andcontaminants may also be present. These materials are toxic (seeTLV values listed in Appendix B) and in high concentrations maycause adverse health effects, particularly if meteorologicalconditions at the time of the accident do not favor rapiddispersion to below toxic levels.
The Titan 34 D explosion at WSMC of April 18, 1986, produced avapor cloud containing toxic Aerozine-50 (Unsymmetricdimethylhydrazine and hydrazine blend) and nitrogen dioxide.There was no verified exposure of third parties to toxicconcentrations exceeding established limits. However, reportsindicate that doctors examined 74 people for possible exposure tothe clouds and two were kept in the hospital for observation (seealso Ch. 10).
5-36
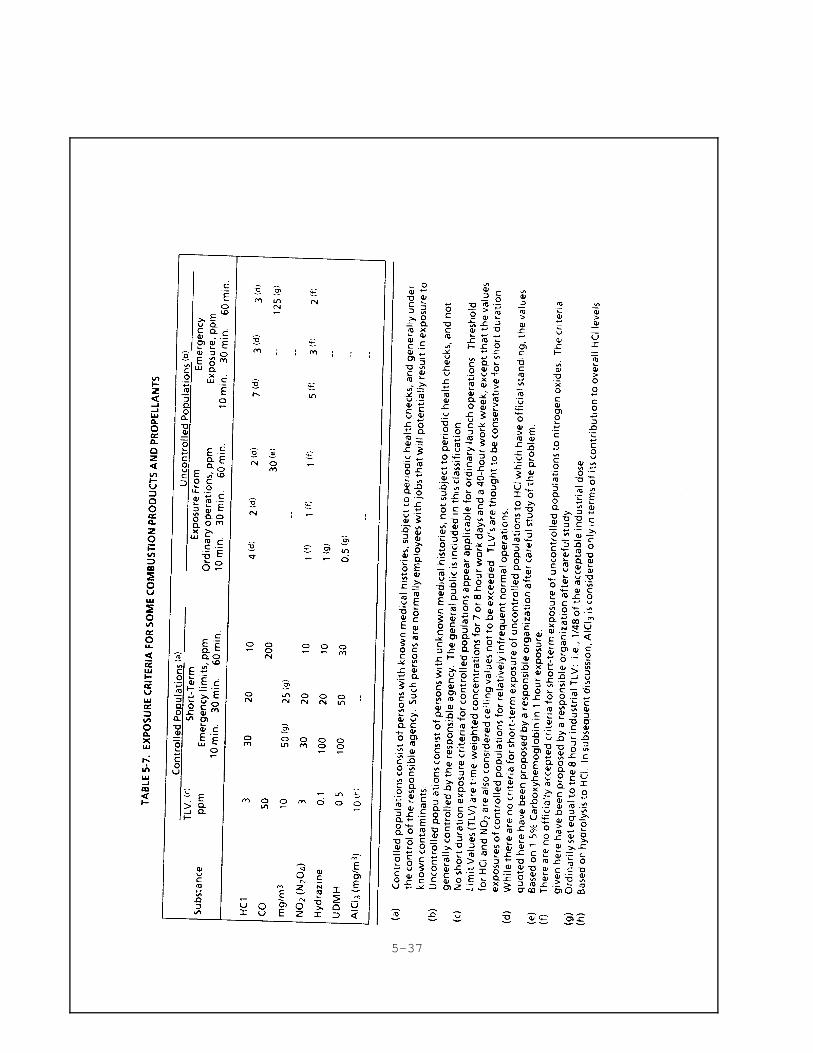
5-37
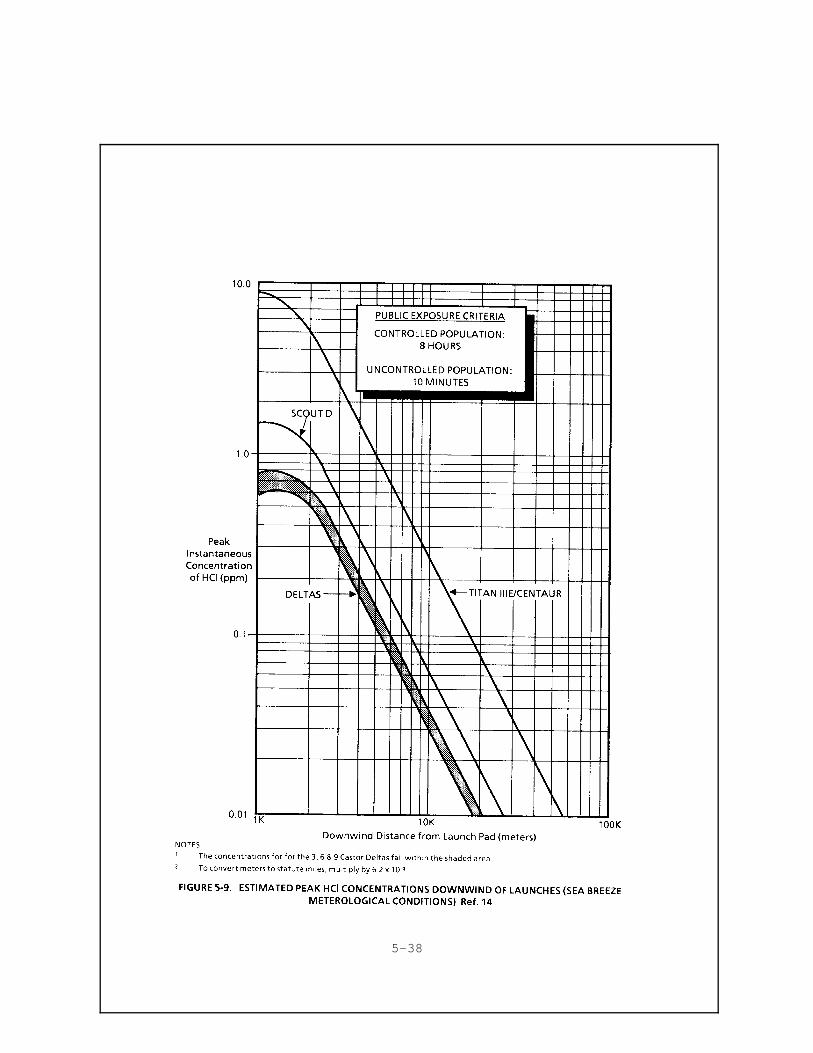
5-38
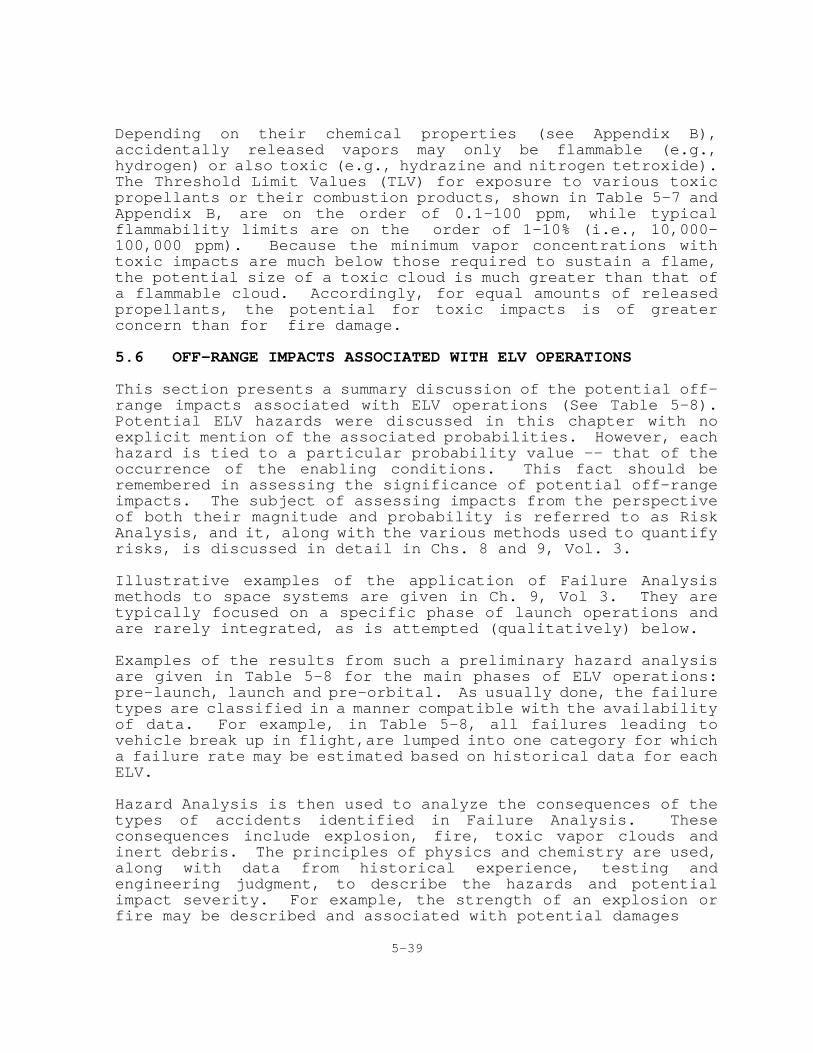
Depending on their chemical properties (see Appendix B),accidentally released vapors may only be flammable (e.g.,hydrogen) or also toxic (e.g., hydrazine and nitrogen tetroxide).The Threshold Limit Values (TLV) for exposure to various toxicpropellants or their combustion products, shown in Table 5-7 andAppendix B, are on the order of 0.1-100 ppm, while typicalflammability limits are on the order of 1-10% (i.e., 10,000-100,000 ppm). Because the minimum vapor concentrations withtoxic impacts are much below those required to sustain a flame,the potential size of a toxic cloud is much greater than that ofa flammable cloud. Accordingly, for equal amounts of releasedpropellants, the potential for toxic impacts is of greaterconcern than for fire damage.
5.6 OFF-RANGE IMPACTS ASSOCIATED WITH ELV OPERATIONS
This section presents a summary discussion of the potential off-range impacts associated with ELV operations (See Table 5-8).Potential ELV hazards were discussed in this chapter with noexplicit mention of the associated probabilities. However, eachhazard is tied to a particular probability value -- that of theoccurrence of the enabling conditions. This fact should beremembered in assessing the significance of potential off-rangeimpacts. The subject of assessing impacts from the perspectiveof both their magnitude and probability is referred to as RiskAnalysis, and it, along with the various methods used to quantifyrisks, is discussed in detail in Chs. 8 and 9, Vol. 3.
Illustrative examples of the application of Failure Analysismethods to space systems are given in Ch. 9, Vol 3. They aretypically focused on a specific phase of launch operations andare rarely integrated, as is attempted (qualitatively) below.
Examples of the results from such a preliminary hazard analysisare given in Table 5-8 for the main phases of ELV operations:pre-launch, launch and pre-orbital. As usually done, the failuretypes are classified in a manner compatible with the availabilityof data. For example, in Table 5-8, all failures leading tovehicle break up in flight,are lumped into one category for whicha failure rate may be estimated based on historical data for eachELV.
Hazard Analysis is then used to analyze the consequences of thetypes of accidents identified in Failure Analysis. Theseconsequences include explosion, fire, toxic vapor clouds andinert debris. The principles of physics and chemistry are used,along with data from historical experience, testing andengineering judgment, to describe the hazards and potentialimpact severity. For example, the strength of an explosion orfire may be described and associated with potential damages
5-39
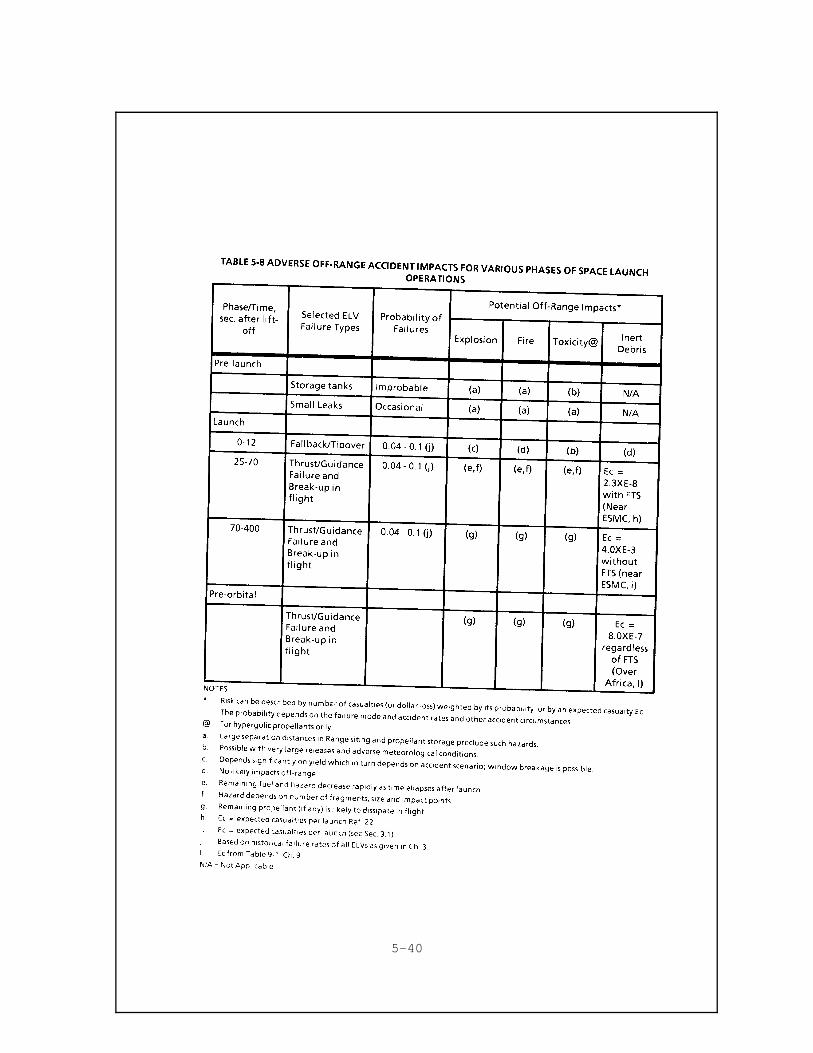
5-40
(by overpressure or heat) to people and/or property. Estimatesof the magnitude of the potential damage may be expressed interms of an impact area (or footprint) surrounding the locationof the accident.
To do so, a range of possible accident circumstances have to bespecified to allow a quantitative estimation. A further breakdown of the hazards in various ways may be needed to make theanalysis tractable. For example, in Table 5-8, the hazards aredivided into those (explosion, fireball and toxic releases) thatmay occur while the vehicle is in flight, versus those occurringwhen the vehicle or its fragments impact the ground. The break-down of consequences in Table 5-8 varies with time during thelaunch phase. As time elapses after liftoff, the quantities ofpropellants on-board will decrease, thereby affecting theirpotential hazards. This was discussed in detail in Section 5.2.4for explosion hazards.
Risk Analysis is finally used to describe (for a particularactivity) both the probabilities of accidents and the possibledamages or losses associated with them, accounting foruncertainties in the occurrence of the accidents and in thecircumstances surrounding them. For example, there areuncertainties as to what accident is likely to occur at aparticular location and how many people would be present at thatlocation at the time of the accident. A set of circumstances isdefined (scenario) and their probability is estimated. For eachset, the results of the Failure Analysis (frequency of anaccident) and Hazard Analysis (area of damage) are combined toestimate an expected damage (e.g., a number of people affectedwith a particular frequency per year or per event). The overalloutcome of the analysis is a probability distribution function(PDF) for the potential damages that can be associated with aparticular hazardous activity. An expected value for potentialdamage (e.g., casualty expectation, Ec) is often calculated fromthat probability distribution.
Such expected casualty values have been estimated in anapproximate manner for ELV-type vehicles, but only for a fewspecific scenarios involving inert debris hazards as shown inTable 5-8, namely:
• inert debris risks during the first 10-70 sec oflaunch, with and without a Flight TerminationSystem.(22)
• inert debris risks during pre-orbital operation,with and without a Flight Termination System.
5-41
In Table 5-7, note that for the scenarios involving explosion,fire and toxic hazards, only a qualitative description of thepotential off-range impacts is given because either theirprobabilities or magnitudes have not been quantified. Thesedescriptions are given as footnotes in Table 5-8, to summarizekey considerations in understanding these impacts and of theirdetermining factors.
5.7 PERSPECTIVES ON THE MAGNITUDE OF THE HAZARDS ASSOCIATEDWITH ELV PROPELLANTS
In the previous sections, the major hazards associated with ELVpropellants were discussed. There are a number of hazards(explosions, debris, fires, toxic vapor clouds) each of whichdepend on a number of parameters such as propellant properties,quantity, mode of release, etc. Clearly, these hazards are verycomplex and multi-dimensional. In this section, a few referencepoints are provided to place these hazards in perspectivecompared to more familiar hazards. Only a partial perspective isprovided because:
(a) the focus here is on the magnitudes of thesehazards and not on their probabilities orlikelihood of occurrence. This is addressed inChs. 9, 10, Vol. 3, where a more completediscussion of public risk perspectives is provided.
(b) the comparison with other hazards is presented in avery simplified fashion, focusing only on selecteddimensions of the hazards.
In simple terms, concern with ELV propellant hazards can beattributed to the following factors:
(1) rocket propellants are highly energetic fuels andmost are inherently hazardous;
(2) large quantities of propellants are involved inspace launch operations; and
(3) launch operations are inherently complex and havemany potential failure modes.
The following discussion places these concerns in their properperspective.
First, propellants such as liquid hydrogen, liquid oxygen and RP-1 have been used extensively in the chemical industry. They havebeen processed, transported and stored for several decades witha remarkable safety record. Also, the chemical industry uses (ona daily basis) chemicals which are even more hazardous than ELVpropellants, such as acetylene and ethylene oxide (which are
5-42
extremely explosive) and hydrogen chloride and hydrogen cyanide(which are extremely toxic).
Selected key properties which affect the hazard potential of suchchemicals are listed in Appendix B and in Table 5-9. Note thatthe range of propellant properties are sometimes exceeded byother chemicals. For example, the flammability limits ofacetylene and ethylene oxide are wider than those of hydrogen.In addition, these two chemicals can react autocatalyticallywithout the need for an oxidizer, if initiated by heat, pressureor shock. On the other hand, hydrogen requires oxygen to react.Generally, the broader the flammability range, the easier it isto create a fire or an explosion. Thus, these two chemicals aremore likely to ignite than hydrogen.
Second, the quantities of chemicals used in industry are oftengreater than those of propellants in ELV operations. This isillustrated in Table 5-10 which provides data for various spacevehicles and for the storage and transportation of fairly commonfuels such as LNG, LPG and gasoline. For each case, the tablegives the total weight, heat of combustion per unit mass, and thetotal chemical energy. It also would have been desirable toprovide the explosive (TNT) yield for each case. However, thiswould require the definition of a pertinent accident scenario foreach (as was done in Sec. 5.2.4) and the estimation of areasonable yield.
In view of the lack of such data, instead the total chemicalenergy is used as a rough indication of the magnitude of thepotential hazard which is reasonable for propellants and fuels.In terms of total chemical energy alone, three typical launchvehicles are approximately:
• equivalent in order of magnitude to a gasoline truck or arail tank car of LPG.
• one order of magnitude smaller than a pressurized LPGsphere.
• two orders of magnitude smaller than standard cryogenictanks of LNG and LPG.
• three orders of magnitude smaller than an LNG ship.
Third, although ELV launch operations are inherently moreintricate and complex than conventional chemical and transportoperations, the safety precautions for ELV operations are fargreater than those for other more common activities. Forexample, launch sites are separated significantly from populationcenters while chemical plants and fuel tank farms are locatedwithin cities.
5-43
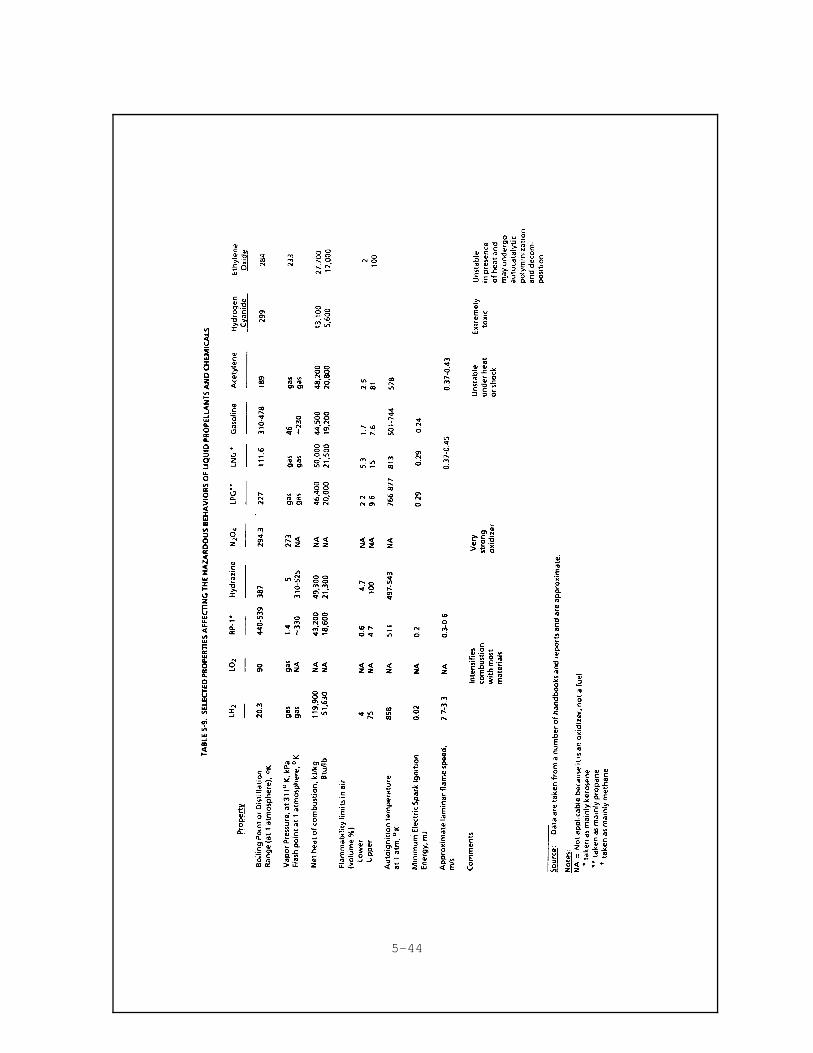
5-44
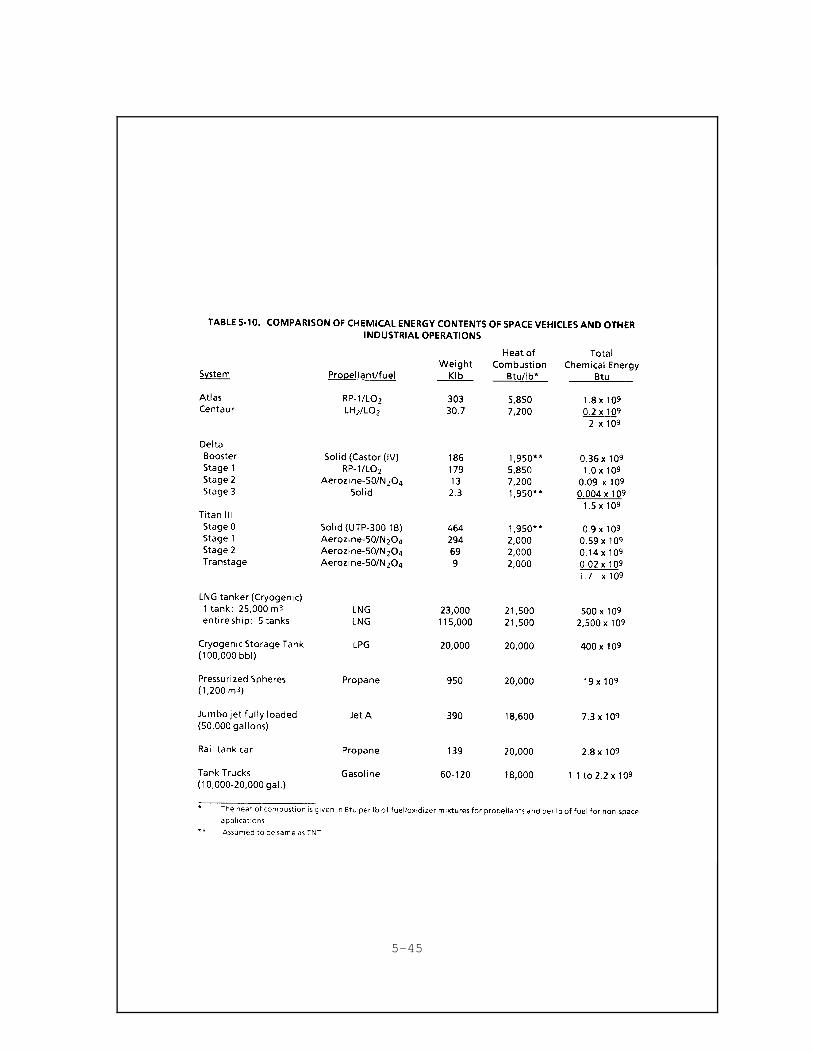
5-45
An additional perspective on the magnitude of the hazards of ELVpropellants relative to other fuels and chemicals can be obtainedby comparing their respective past accident data. This ispresented below for explosion accidents.
Data summarized in Table 5-11 involve major chemical process andtransportation activities where the explosive yield was 40,000pounds of TNT or greater. The table provides a brief descriptionof each accident, identifies the chemical involved, theapproximate quantity released (pounds) and the TNT equivalentweight (reported by the accident investigators based on theobserved damage at the location of the accident). The TNTequivalent weights ranged from 40,000 to 125,000 pounds, which isroughly the same order of magnitude as that estimatedconservatively for worst case propellant accidents in Table 5-3.
Unfortunately, similar historical data on space vehicle accidentsmay be restricted or classified and are not readily available inthe open literature. The data found in the open literature areshown in Table 5-12 for large SRM explosions. No comparable datawere found for liquid propellants. The reported TNT equivalentweights range from 9 to 42,000 pounds, a range lower than yieldsfrom industrial/transportation accidents and lower than theestimates for worst case propellant accidents in Table 5-3.
Although the historical data and comparisons presented above arelimited in scope and depth, they still suggest that the hazardsanticipated from ELV propellants can be considered to bequalitatively similar in type and magnitude to those associatedwith comparable chemicals and fuels commonly used in chemicalprocessing and transportation activities.
5-46
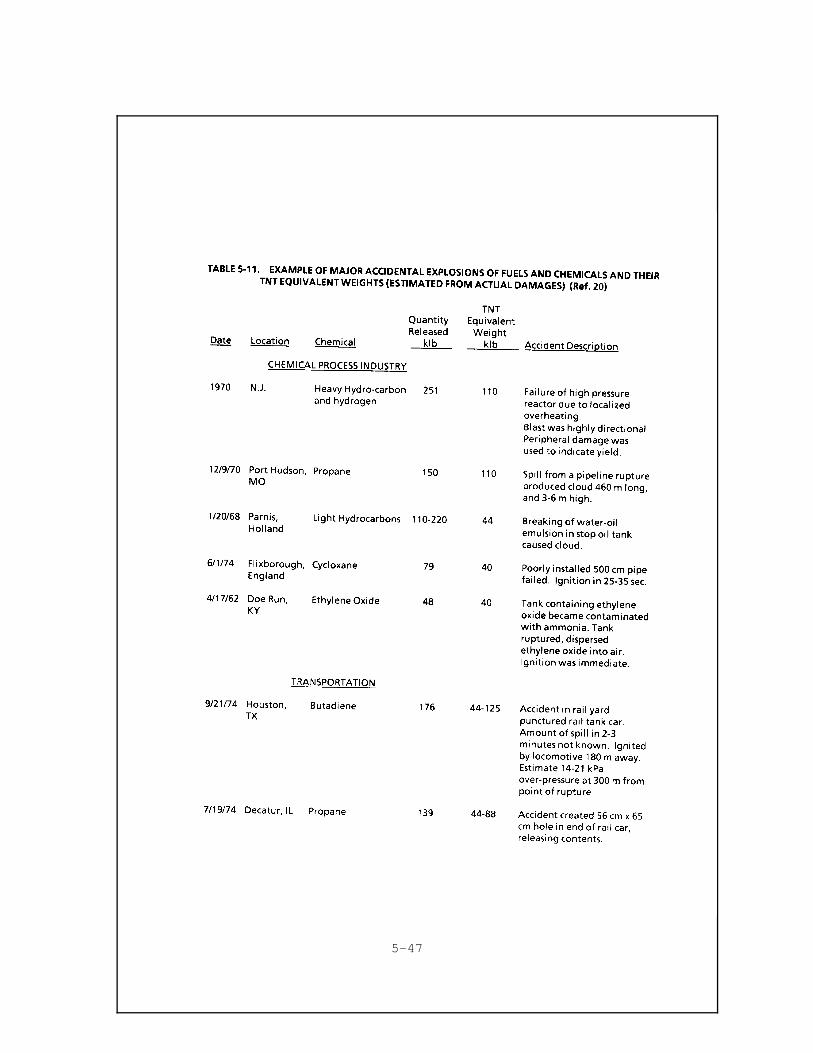
5-47
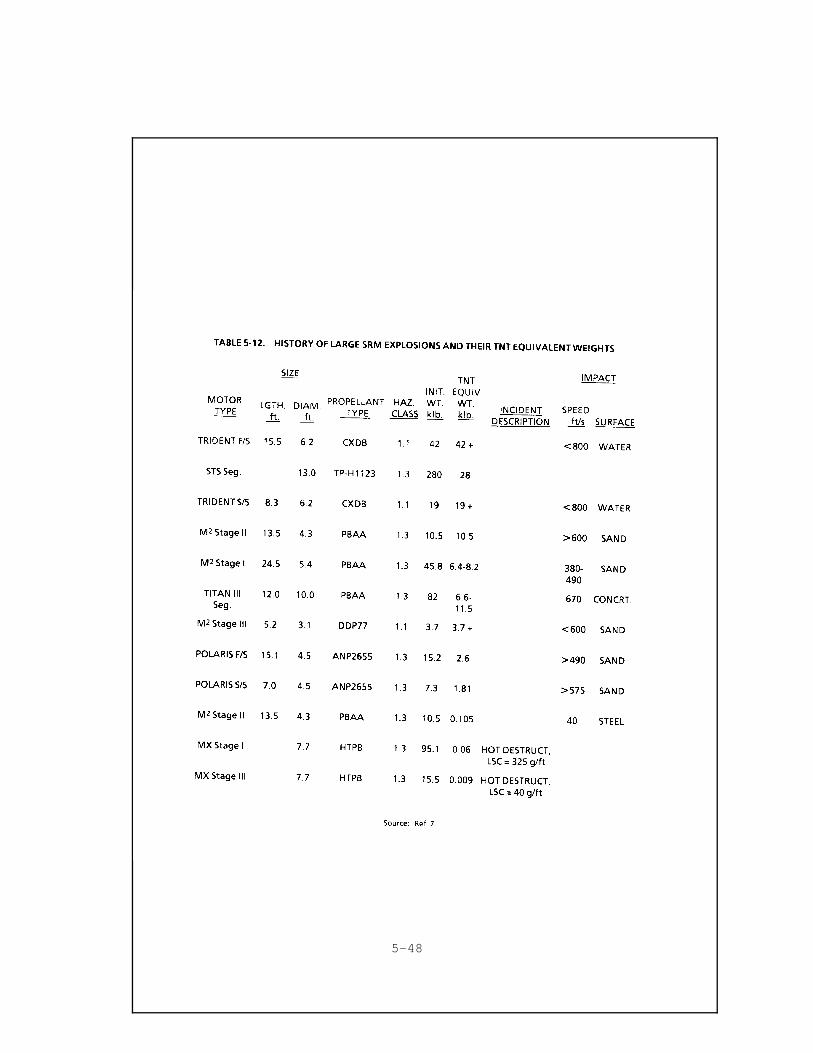
5-48
REFERENCES TO CHAPTER 5
1. "Hazards of Chemical Rockets and Propellants," publishedby the Chemical Propulsion Information Agency, JohnHopkins University, APL, Laurel, MD, September 1984.
2. Willoughby, A.B. et al. "Liquid Propellant ExplosiveHazards -Project PYRO," Vol. I, TR-68-92 and Vol. II, TR-69-80, December 1968.
3. Elwell, R.B., et al. "Project SOPHY - Solid PropellantHazards Program," Technical Report AFRPL-TR-67-211, Vol.I and II, August 1967.
4. "Explosives Safety Standards," AFR 127-100, Change 2,January 1985.
5. "Ammunition and Explosives Safety Standards," DOD 6055.9 - STD, July 1984.
5a. "Space Propulsion Hazard Analysis Manual" (SPHAM) preparedfor the Air Force Astronautics Laboratory.
6. Kincaid, J.F. "The Determination of the Propensity forDetonation of High-Performance Propellants," A84-12984.
7. Ullian, Louis J. "Detonability of Large Solid RocketMotors," ESM/SEM Report #84-1, 10 August 1984.
8. Swisdak, M.M. et al. "Solid Rocket Booster CommandDestruct System Hazard Study," NSWC-TR-85-344; TR-85-346;TR-85-348; TR-85-350; TR-85-352, October 1985.
9. Overbeck, K.B., R. D. Daniels and J. R. Westlake, "ModelConcept and Development for VBLAST, the WSMC BlastPrediction Model," Report No. 83-3119- 1, J. H. WigginsCo., Redondo Beach, CA, Oct. 1983.
10. Riehl, W.A. "STS Blast Hazards Analysis." PreliminaryBriefing (AA/OSTS) MSFC, Alabama. April 1979.
11. Baeker, J.B., "Space Shuttle Range Safety HazardAnalysis," TR No. 81-1329 to NASA/KSC, July, 1981.
12. Kokinakis, W. and R. Rudolph. "An Assessment of theCurrent State-of-the- Art of Incapacitation by Air Blast,"Minutes of the Twentieth Explosives Safety Seminar, August1982.
5-49
13. Delta 392X Range Safety Flight Mechanics DestructAnalysis," MDC-H3398, May 1987, (see Table A-2, Delta3924).
14. "Programmatic Environmental Assessment of CommercialExpendable Launch Vehicle Programs," US DOT, February 1986(updated from FEIS for NASA, Office of Space ScienceLaunch Vehicle and Propulsion Programs, 1973).
14a. "Atmospheric Transport and Diffusion Modelling," CPIAPublication 433, published by the Chemical PropulsionInformation Agency, Johns Hopkins University, APL, laurel,MD. This Document contains the proceedings of a Safetyand Environmental Workshop held 11-13 June 1985.
15. Van Ulden, A.P. (1974), "On Spreading of a Heavy GasReleased Near the Ground," First Intl. Loss PreventionSymposium, The Haue/Delft, Elsevier, Amsterdam, p. 221-226.
16. Britter, R. (1979), "The Spread of Negatively BuoyantPlume in a Calm Environment," Atmospheric Environment, 13,9, p. 1241-1247.
17. Colenbrander, G.W., "A Mathematical Model for theTransient Behavior of Dense Vapor Clouds," Loss Preventionand Safety Promotion in the Process Industries, 3rd Intl.Symposium, Basel, Switzerland 1980, p. 15/1104.
18. Pasquill, F. (1974), Atmospheric Diffusion, Ellis HorwoodLimited.
19. Gifford, F.A. (1975), "Relative Atmospheric Diffusion ofSmoke Puffs," Journal of Meteorology, 14, p. 410.
20. Gugan, G. "Unconfined Vapor Cloud Explosions" Publisher:Institute of Chemical Engs., Rugby, Warks, England, 1979.
20a. "Emergency and Continuous Exposure Levels for SelectedAirborne Contaiminants," Volume V, the Committee onToxicology, Board on Toxicology and Environmental HealthHazards, Commission on Life Sciences, National ResearchCouncil, National Academy Press, Wash. DC, 1985.
21. Drake, E. M. and N.A. Moussa, "The Assessment of CrashFire Hazard of Liquid Hydrogen Fueled Aircraft," ArthurD. Little Report for NASA/Lewis Research Center, NASA CR-165526, February 1982.
22. "Commercial Space Launch Determination -ESMC," RTI DraftReport for DOT/OCST, Dec. 1987.
5-50
10/2/95 rev6. ORBITAL COLLISION HAZARDS
6.1 ORBITING SPACE OBJECTS
It is important to estimate the hazards of on-orbit collisionsbetween space objects because the US may be liable for any damageto a foreign country, or satellite caused by a US spacecraft.The latest NASA Satellite Situation Report lists 1,702 spacecraftin orbit and 5,130 large debris such as spent rocket stages andpayload shrouds.(4) Expanding the count to include trackabledebris, the tally was 18,145 cataloged space objects as of June30, 1987. Of these, 5,763 are from the US and 11,603 from theUSSR. Of the total, approximately 7,000 are still in orbit (therest have decayed and re-entered). Radar-trackable objects inspace (i.e., larger than about 10 cm across) are monitored andcataloged by both the US Space Command (USSPACECOM).Considerably more objects and debris too small to be trackableare in orbit, as indicated in Figure 6-1.(1) Measurements usingthe USSPACECOM's Perimeter Acquisition Radar AttackCharacterization System (PARCS), which is sensitive to objects ofabout 1 cm in size, yields the debris population shown in Figures6-2 and 6-3. The tracked population has increased steadily sincethe early 1970's, as shown by a comparison of the number ofcataloged space objects between 1976 and 1986.
During this period the tracked population has increased from 4100to 4700 objects, compared with an increase of 25 percent inlaunch activity over the same period. This reflects the dynamicnature existing between new and decaying objects in space. (seeCh.7)
The 1986 Satellite Catalog (SATCAT) listed 16,660 entries,including all satellites launched in the last 30 years, theirstages and trackable debris. However, only about 6000 of theseobjects are still in orbit, and about 44 percent of themoriginated from major on-orbit break ups (see Sec. 6.3.2).(4b, c)
Satellites are currently being launched into space at a rate ofapproximately 150-200 per year.(5) Eight countries presentlypossess space launch capability and over 100 nation-statesparticipate in international satellite communication programs.(5-6)
The rate of new objects cataloged is higher than the number ofpayloads because it includes debris. There were 983, 843 and 458new objects cataloged during 1985, 1986 and 1987, respectively.
More than 3,600 payloads have been launched into space since1957, but only 342 satellites were operational as of Sept., 1987,of which US operates 133, the USSR 148 and 13 other countries andinternational organizations, 61. Nearly half of this total are
6-1
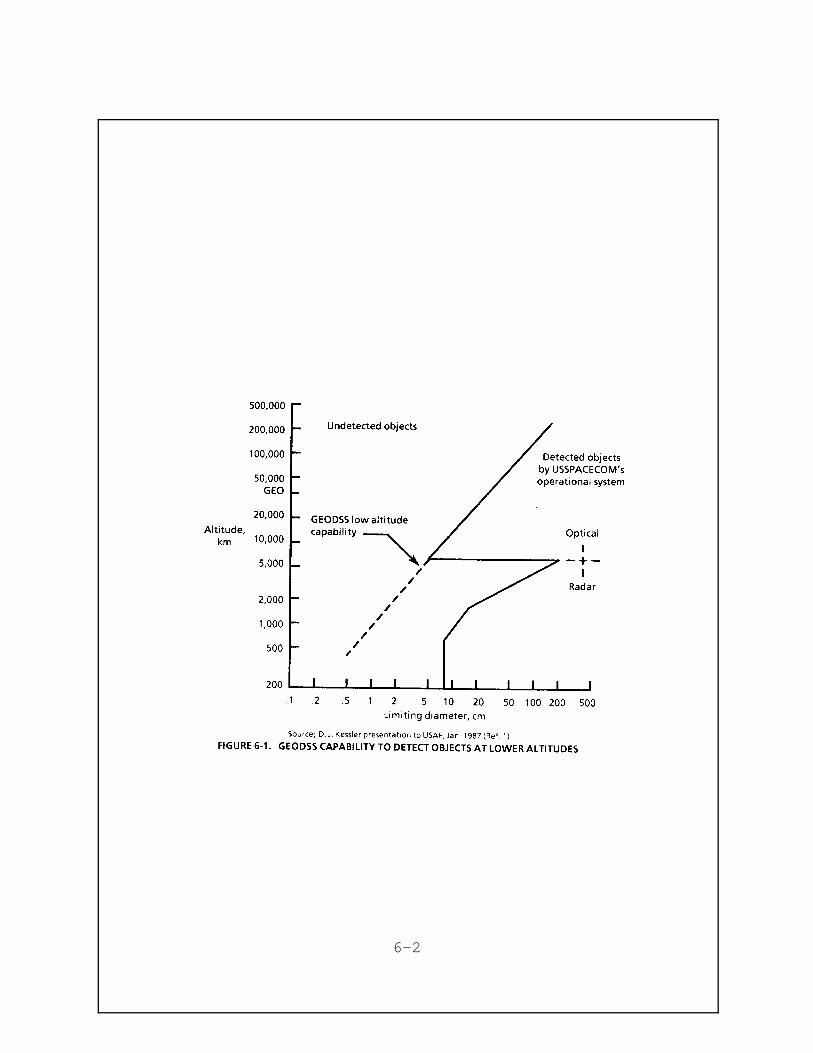
6-2
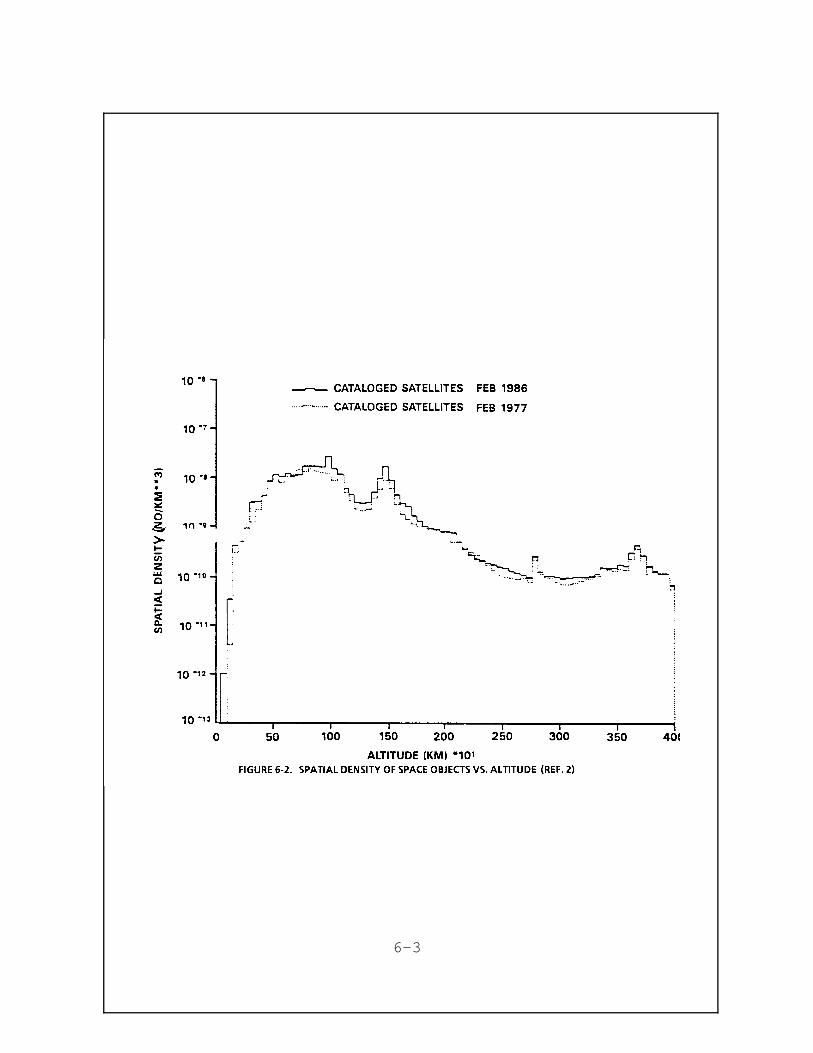
6-3
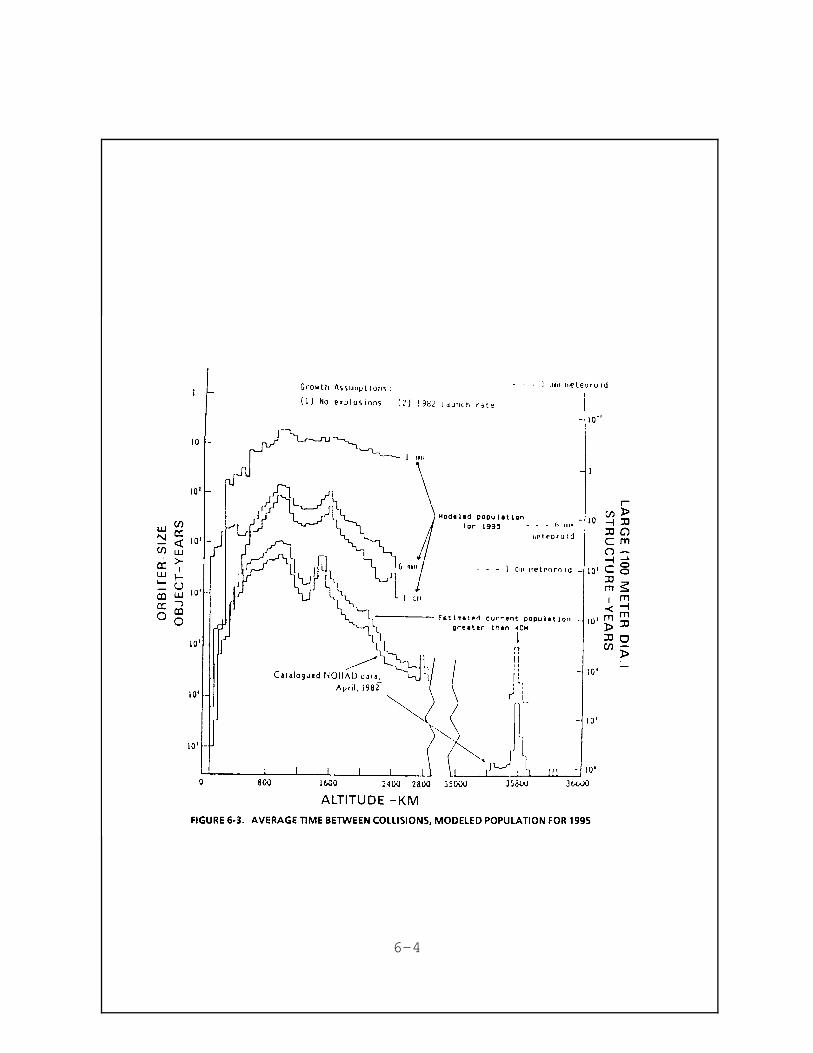
6-4
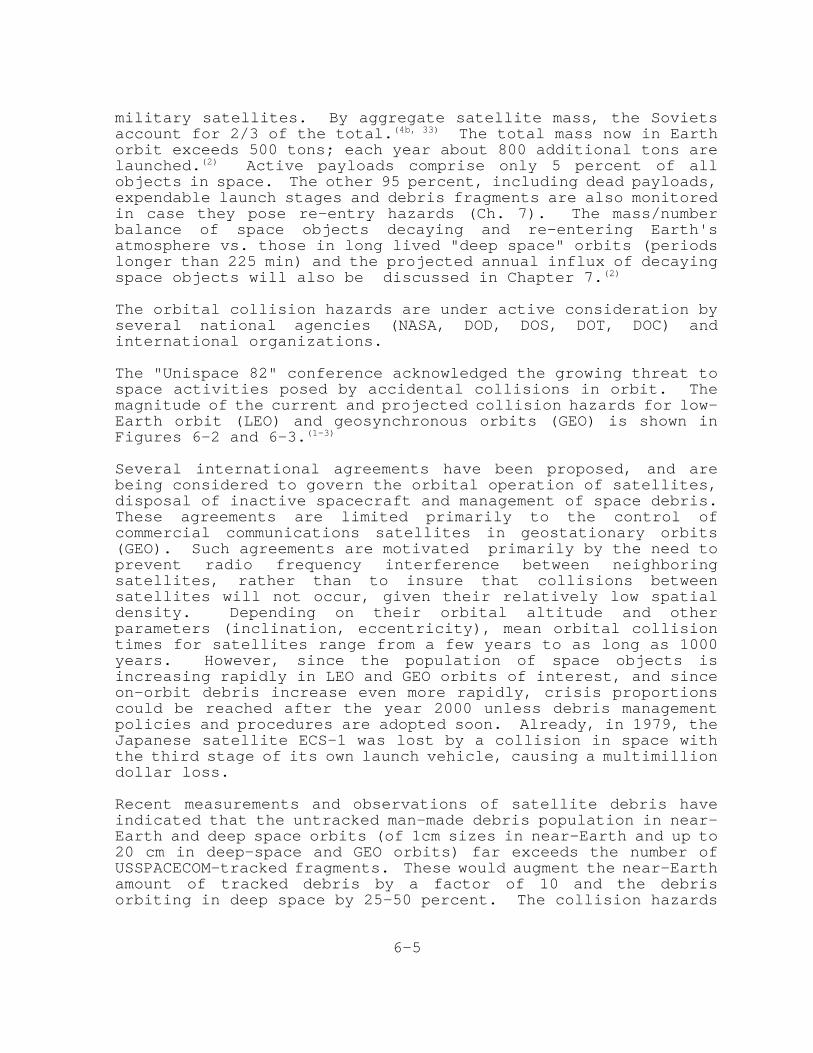
military satellites. By aggregate satellite mass, the Sovietsaccount for 2/3 of the total.(4b, 33) The total mass now in Earthorbit exceeds 500 tons; each year about 800 additional tons arelaunched.(2) Active payloads comprise only 5 percent of allobjects in space. The other 95 percent, including dead payloads,expendable launch stages and debris fragments are also monitoredin case they pose re-entry hazards (Ch. 7). The mass/numberbalance of space objects decaying and re-entering Earth'satmosphere vs. those in long lived "deep space" orbits (periodslonger than 225 min) and the projected annual influx of decayingspace objects will also be discussed in Chapter 7.(2)
The orbital collision hazards are under active consideration byseveral national agencies (NASA, DOD, DOS, DOT, DOC) andinternational organizations.
The "Unispace 82" conference acknowledged the growing threat tospace activities posed by accidental collisions in orbit. Themagnitude of the current and projected collision hazards for low-Earth orbit (LEO) and geosynchronous orbits (GEO) is shown inFigures 6-2 and 6-3.(1-3)
Several international agreements have been proposed, and arebeing considered to govern the orbital operation of satellites,disposal of inactive spacecraft and management of space debris.These agreements are limited primarily to the control ofcommercial communications satellites in geostationary orbits(GEO). Such agreements are motivated primarily by the need toprevent radio frequency interference between neighboringsatellites, rather than to insure that collisions betweensatellites will not occur, given their relatively low spatialdensity. Depending on their orbital altitude and otherparameters (inclination, eccentricity), mean orbital collisiontimes for satellites range from a few years to as long as 1000years. However, since the population of space objects isincreasing rapidly in LEO and GEO orbits of interest, and sinceon-orbit debris increase even more rapidly, crisis proportionscould be reached after the year 2000 unless debris managementpolicies and procedures are adopted soon. Already, in 1979, theJapanese satellite ECS-1 was lost by a collision in space withthe third stage of its own launch vehicle, causing a multimilliondollar loss.
Recent measurements and observations of satellite debris haveindicated that the untracked man-made debris population in near-Earth and deep space orbits (of 1cm sizes in near-Earth and up to20 cm in deep-space and GEO orbits) far exceeds the number ofUSSPACECOM-tracked fragments. These would augment the near-Earthamount of tracked debris by a factor of 10 and the debrisorbiting in deep space by 25-50 percent. The collision hazards
6-5
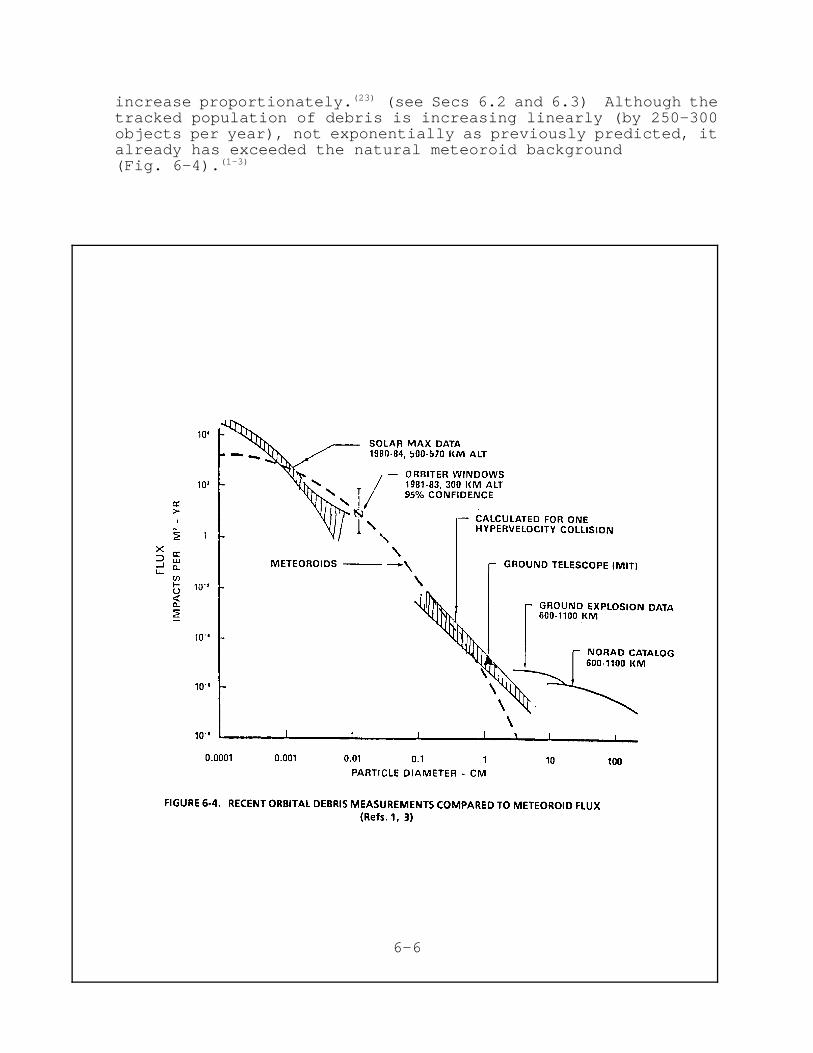
increase proportionately.(23) (see Secs 6.2 and 6.3) Although thetracked population of debris is increasing linearly (by 250-300objects per year), not exponentially as previously predicted, italready has exceeded the natural meteoroid background (Fig. 6-4).(1-3)
6-6
Untracked smaller debris appear to dominate collision encounters.Little data on the man-made debris flux are available on debrisless than 4 centimeters in size (Fig.6-1). Objects below thissize cannot be detected by Space Command's deep space trackingdetection systems. GEODDS (The Ground-Based Electro-Optical DeepSpace Surveillance System) however, is an expanding globalnetwork of tracking sensors which is continually being upgradedto aid in monitoring space assets.(13)
Space hazards of interest to this analysis include:
- Low Earth Orbit (LEO) Collisions (Secs. 6.4.1 and 6.4.2):
• Collisions between two active spacecraft in LEO between200 km and 4000 km (120 miles and 2400 miles).
• Collisions with both man-made and natural (meteoroids)objects in the near-Earth orbits. The hazard from man-made debris increases with time while the debris of thenatural environment remains at a near constant level(Figures 6-2, 6-4).
- Geosynchronous Earth Orbit (GEO) Collisions (Secs. 6.4.3 to6.4.5):
• Collisions between active spacecraft and inactivespacecraft remaining in a geosynchronous orbit. ThisGEO "ring" is narrow in latitude and altitude bands,but spread over 360° in longitude (Fig.6-5).
6-7
The collisions may result from the accumulation ofinactive spacecraft in the most desirable GEO orbitsfor communication satellites.
• Collisions between two active spacecraft ingeostationary orbit. These collisions can be preventedif collision avoidance procedures are invoked by groundcontrol or by judicious orbital slot allocation.
• Collisions between active spacecraft and spent orbitaltransfer stages in GTO or other debris in GTO and GEO.The probability of collision with objects in geo-transfer orbit (GTO) is relatively small due to theshort dwell and transit time of geo-transfer objects inthe geosynchronous band (about 3% of their period).
When considering objects large enough to damage most spacecraft,artificial debris, whose sources are discussed in Sec. 6.3,constitute the dominant threat.(2,3) Collisions involvingartificial and meteoritic debris possess these differingcharacteristics:
1) Collision hazards are proportional to the debrispopulation densities, relative orbital velocities betweencolliding objects and the cross sectional area of theorbiting spacecraft.
2) Large debris consist primarily of artificial objects,while small debris are dominated by natural meteoroids.3) Meteoritic debris remain at a relatively constantlevel, while the spatial density of man-made debris isincreasing with time.
4) Artificial debris populate circular orbits with ratherlow relative velocities, while meteoritic debris orbits areelliptical with larger relative velocities at collision.The average velocity of meteorites relative to spacecraft isroughly twice as large as that of man-made objects, namely14 km/s vs. 7 km/sec. However, cometary debris move inelliptical and sometimes retrograde orbits and can thereforereach 40-70 km/sec. relative impact velocities.
6.2 SPACE LAW AND SPACE DEBRIS ISSUES
6.2.1 The Regulatory Framework for Orbit Allocation and SpaceDebris
Major international agencies that establish and implement spacelaw, as it applies to communication and remote sensingsatellites, include:
• United Nations Committee on the Peaceful Uses of Outer
6-8
Space (COPUOS)• International Telecommunication Union (ITU)• International Telecommunications Satellite Organization
(INTELSAT)• International Maritime Satellite Organization
(INMARSAT)
COPUOS is the foremost entity of these agencies since the majorspace treaties in effect today have been negotiated under itsauspices. The ITU is the principal agency that deals withregulatory matters pertaining to satellite communications. Itreceives support from several other organizations, namely:
• The International Radio Consultative Committee (IRCC)• The International Frequency Registration Board (FRB)• The International Telecommunications Satellite
Organization (INTELSAT)
Of these organizations, the IRCC is the most likely to beinvolved with the problem of satellite collisions. Specificgroups have been established within the IRCC to study specialsubjects, primarily in the areas of space communications andinterference problems. INTELSAT is dedicated to theconstruction, deployment and operation of commercialtelecommunication satellites.
A majority of nation-states must first endorse internationaltreaties and regulations, in order for them to become effective.The implementation of such treaties requires all member states toabide by the dictates of the majority. Therefore, any proposalpertaining to on-orbit collision risk reduction and orbitaldebris management would require several years for discussion,consideration and ratification in an international forum.
Presently, only communication satellites are assigned orbital andfrequency windows through international agreements. Othercommercial, research and military missions go through a processof orbital parameter optimization prior to mission approval toavoid collisions during their useful life. These are simplyregistered with the UN by the launching state. USSPACECOM canidentify space object fragmentation events and infer theirprobable cause: for example, if orbiting satellites cross inspace and time disappear and the crossover point becomes strewnwith debris, a mutual collision can be inferred. It is difficultto assign liability and to determine whether a collisionencounter on-orbit was accidental or intentional. The NationalRanges, as well as NASA and the Satellite Surveillance Center(SSC) within USSPACECOM, usually perform COLA (COLlisionAvoidance at launch) to determine safe launch windows and COMBO(COmputation of Miss Between Orbits) screening runs for proposedmissions to check the proposed orbits against cataloged orbits.A "point of closest approach" (PCA) is computed. If a risk
6-9
exists, orbital maneuvering capability or orbital parameterchanges are provided. Hence, preplanning of missions avoidscollisions with known and tracked space objects. While COLA isrun routinely prior to launch, COMBO runs are complex and costly,so that orbital safety screening has been done only for select USGovernment missions. Smaller debris which cannot be radartracked pose unpredictable hazards. "Rules of the road" forsatellite close approaches are currently being considered toavoid international conflicts in space.(28-30)
6.2.2 Orbital Debris Issues
An assessment of collision hazards in space requires a study ofcollision probabilities between all objects in space includingthose of natural origin (i.e., meteoroids) as well as man-madeobjects (satellite and space debris). Orbital debris consist of:spent spacecraft, used rocket stages, separation devices, shroudsand fragments from accidental or deliberate explosions andcollisions.(1-3) A major concern for future space activities isthe possibility of generating a debris belt as a result ofcumulative collisions between orbiting objects.(1-14) Severalmodels, discussed below, have been developed to estimatequantitative collision hazards for spacecraft in both low earthorbit (LEO) and geostationary orbit (GEO) regimes.(15-20) Each ofthese models relates the collision hazard to the orbitalpopulation density and to the relative object velocity.Estimates of collision probabilities between spacecraft anddebris in LEO and GEO show that, at present, this hazard is stillsmall (1 in 1000 and 1 in 100,000 per year in orbit,respectively), but increasing rapidly (Figs. 6-2, 6-3). Thethreat of losing on-orbit satellites through collisions withother inactive satellites or orbiting debris is not yet critical,but is becoming increasingly serious. The more crowded regionsof space which are optimal for man-rated systems (like the SpaceStation), larger satellites or those used for communications,remote sensing, navigation and surveillance missions are of mostconcern.
Proposed space debris management options under considerationinclude the following:(4,13,24,31)
• provide impact hardened shielding to new satellites, aswell as added orbital maneuvering capability to avoidcollisions;
• require that extra fuel be provided to satellitesinserted into more crowded space orbits to enable theirtransfer into either higher and longer lived "parking"orbits, or into lower decaying "disposal" orbits atthe end of their life. International cooperation andagreement is needed to define such parking and disposalorbits;
• undertake "space salvaging" operations to retrieve and
6-10
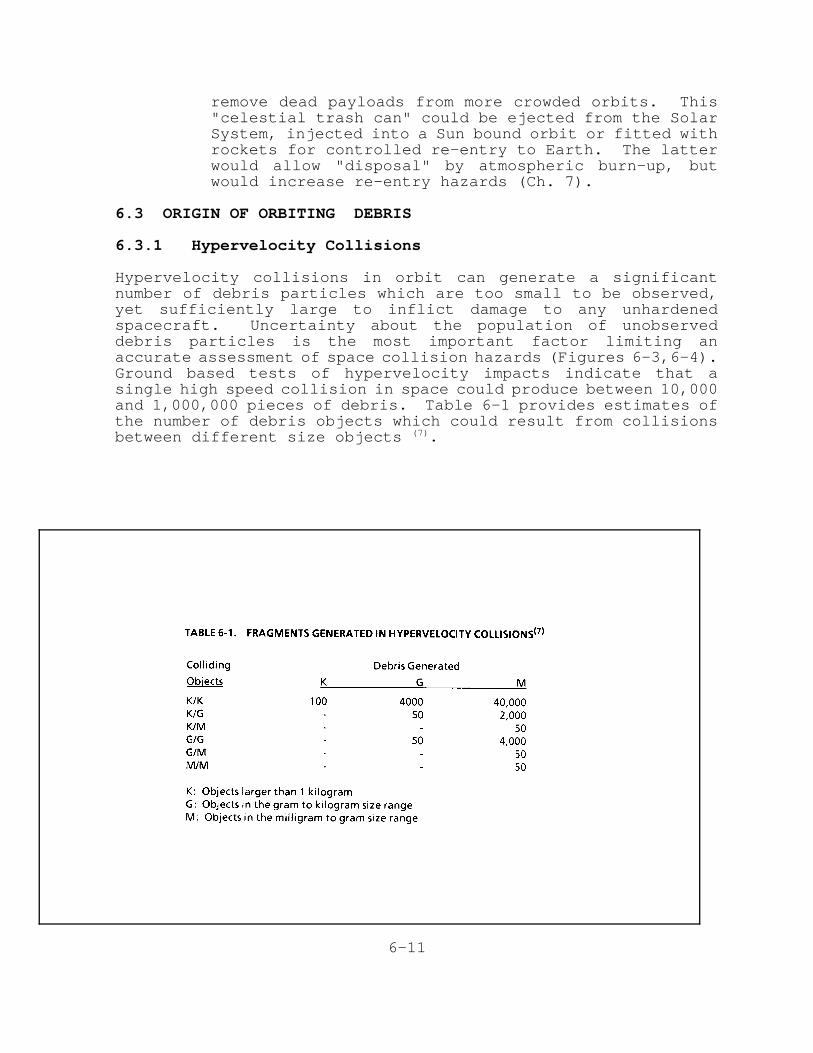
remove dead payloads from more crowded orbits. This"celestial trash can" could be ejected from the SolarSystem, injected into a Sun bound orbit or fitted withrockets for controlled re-entry to Earth. The latterwould allow "disposal" by atmospheric burn-up, butwould increase re-entry hazards (Ch. 7).
6.3 ORIGIN OF ORBITING DEBRIS
6.3.1 Hypervelocity Collisions
Hypervelocity collisions in orbit can generate a significantnumber of debris particles which are too small to be observed,yet sufficiently large to inflict damage to any unhardenedspacecraft. Uncertainty about the population of unobserveddebris particles is the most important factor limiting anaccurate assessment of space collision hazards (Figures 6-3,6-4).Ground based tests of hypervelocity impacts indicate that asingle high speed collision in space could produce between 10,000and 1,000,000 pieces of debris. Table 6-1 provides estimates ofthe number of debris objects which could result from collisionsbetween different size objects (7).
6-11
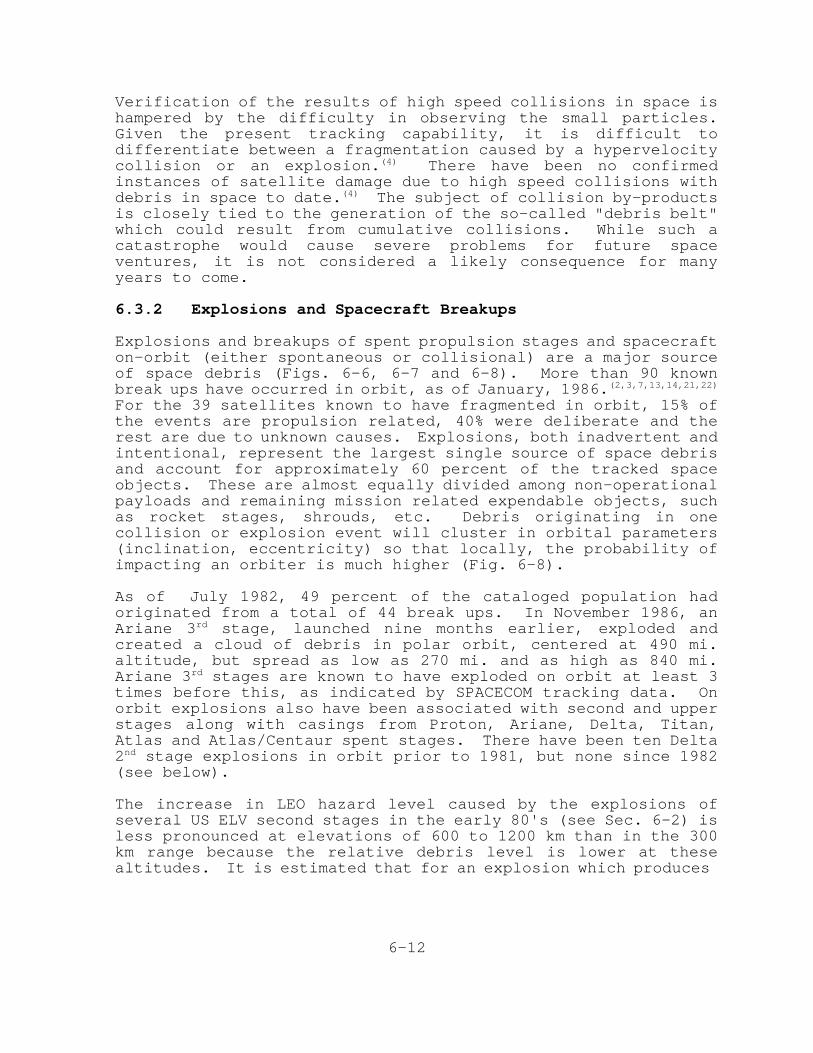
Verification of the results of high speed collisions in space ishampered by the difficulty in observing the small particles.Given the present tracking capability, it is difficult todifferentiate between a fragmentation caused by a hypervelocitycollision or an explosion.(4) There have been no confirmedinstances of satellite damage due to high speed collisions withdebris in space to date.(4) The subject of collision by-productsis closely tied to the generation of the so-called "debris belt"which could result from cumulative collisions. While such acatastrophe would cause severe problems for future spaceventures, it is not considered a likely consequence for manyyears to come.
6.3.2 Explosions and Spacecraft Breakups
Explosions and breakups of spent propulsion stages and spacecrafton-orbit (either spontaneous or collisional) are a major sourceof space debris (Figs. 6-6, 6-7 and 6-8). More than 90 knownbreak ups have occurred in orbit, as of January, 1986.(2,3,7,13,14,21,22)
For the 39 satellites known to have fragmented in orbit, 15% ofthe events are propulsion related, 40% were deliberate and therest are due to unknown causes. Explosions, both inadvertent andintentional, represent the largest single source of space debrisand account for approximately 60 percent of the tracked spaceobjects. These are almost equally divided among non-operationalpayloads and remaining mission related expendable objects, suchas rocket stages, shrouds, etc. Debris originating in onecollision or explosion event will cluster in orbital parameters(inclination, eccentricity) so that locally, the probability ofimpacting an orbiter is much higher (Fig. 6-8).
As of July 1982, 49 percent of the cataloged population hadoriginated from a total of 44 break ups. In November 1986, anAriane 3rd stage, launched nine months earlier, exploded andcreated a cloud of debris in polar orbit, centered at 490 mi.altitude, but spread as low as 270 mi. and as high as 840 mi.Ariane 3rd stages are known to have exploded on orbit at least 3times before this, as indicated by SPACECOM tracking data. Onorbit explosions also have been associated with second and upperstages along with casings from Proton, Ariane, Delta, Titan,Atlas and Atlas/Centaur spent stages. There have been ten Delta2nd stage explosions in orbit prior to 1981, but none since 1982(see below).
The increase in LEO hazard level caused by the explosions ofseveral US ELV second stages in the early 80's (see Sec. 6-2) isless pronounced at elevations of 600 to 1200 km than in the 300km range because the relative debris level is lower at thesealtitudes. It is estimated that for an explosion which produces
6-12
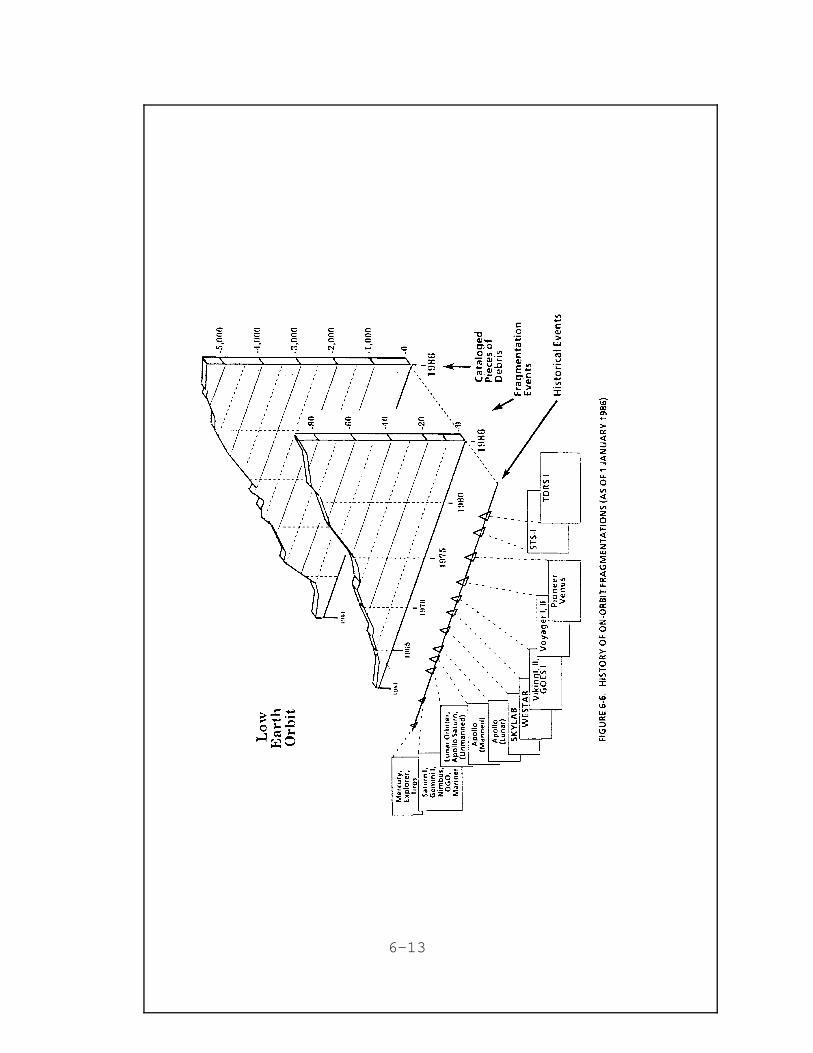
6-13
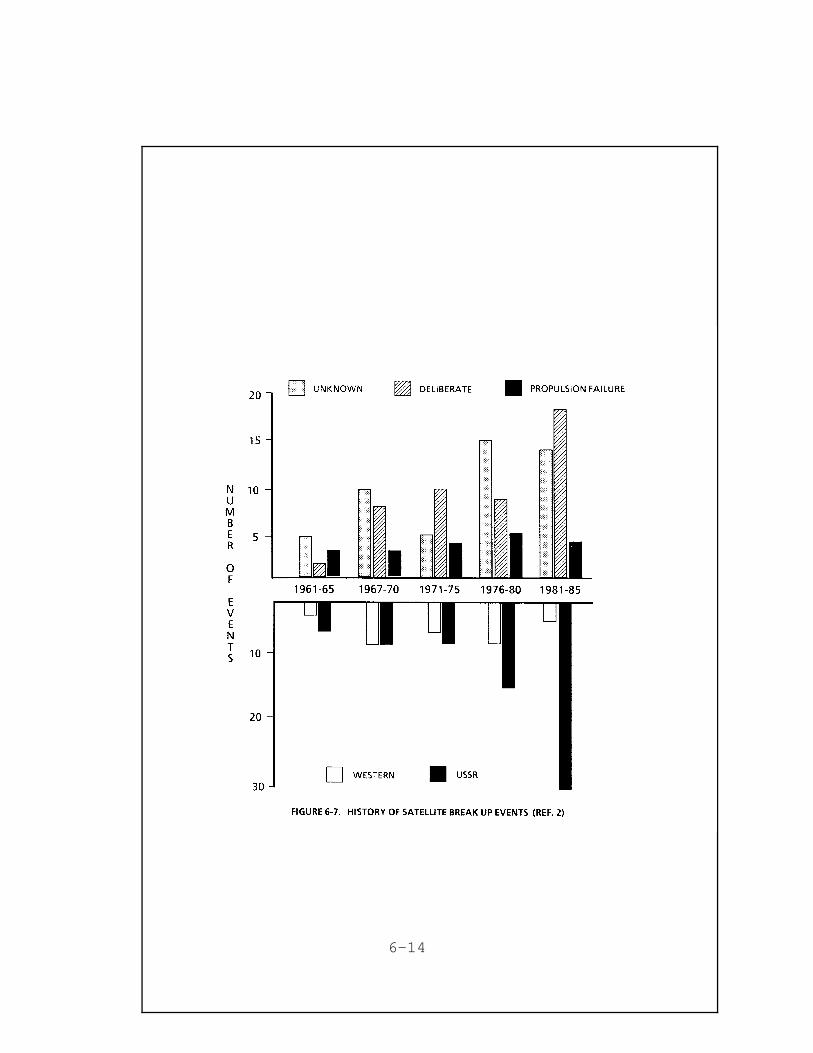
6-14
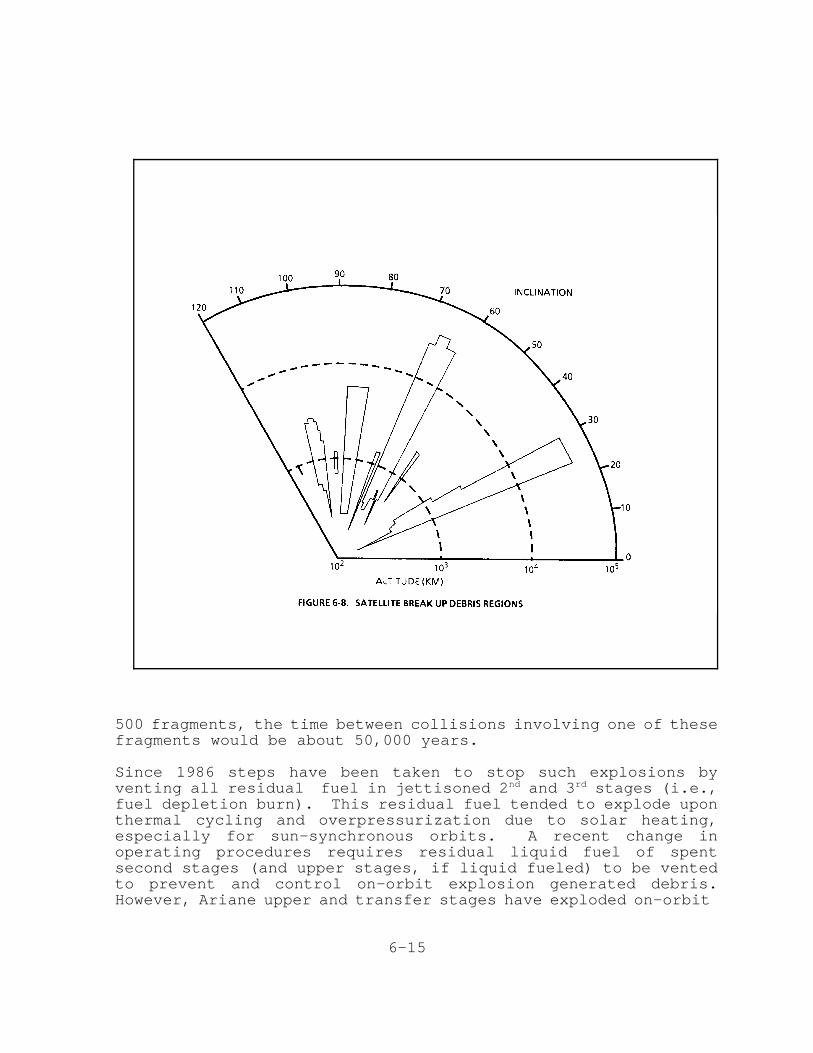
500 fragments, the time between collisions involving one of thesefragments would be about 50,000 years.
Since 1986 steps have been taken to stop such explosions byventing all residual fuel in jettisoned 2nd and 3rd stages (i.e.,fuel depletion burn). This residual fuel tended to explode uponthermal cycling and overpressurization due to solar heating,especially for sun-synchronous orbits. A recent change inoperating procedures requires residual liquid fuel of spentsecond stages (and upper stages, if liquid fueled) to be ventedto prevent and control on-orbit explosion generated debris.However, Ariane upper and transfer stages have exploded on-orbit
6-15
as recently as 1986 and 1987 since ESA has yet to adopt a ventingpolicy.
Ground simulated Atlas explosions, used as calibrations tests forfragmentation, produced about 1300 fragments. On September 20,1987, the Soviet satellite Cosmos 1769 (suspected to be nuclearpowered) was intentionally destroyed on-orbit producing a cloudof debris at about 210 mi. altitude and 65o orbital inclination.Reference 25 lists past satellite breakups and the number ofcataloged objects generated by the breakups. Extrapolating thenumber of on-orbit explosions and break ups, the SPACECOM catalogcould expand by up to a factor of 10 in the next 20 years.
6.3.3 Orbiting Nuclear Payloads
Special on-orbit hazards are posed by the increasing number ofnuclear power sources, both active reactors and passive fuelcells.(13,24) Therefore, approval of nuclear missions is subjectto more rigorous risk assessments, planning and review by anInteragency Nuclear Safety Review Panel (INSRP). There are about50 potentially hazardous satellites in orbit today, carrying over1.3 tons of nuclear fuel, much in the form of long life toxicisotopes. These pose both on-orbit collision and re-entryhazards (see Ch. 7). The 48 radio-thermal generators (RTG) andfuel cores orbiting today are in the most crowded LEO region atabout 1000 km altitude. Both US and Soviet satellites haveexploded or spawned debris in this belt. However, since 90% ofthe Soviet nuclear material in RORSAT satellites has beenintentionally ejected into higher orbits at 900-1000 km at 65o
inclination, the hazards to population due to re-entry orpossible ground impact have been removed. This procedure isintended to increase the orbital lifetime to more than 1,000years to allow sufficient time for the radioactivity to decay.The eventual retrieval and elimination of these materials ispossible by sending them, for example, into escape orbits or intothe Sun. Hypervelocity collisions with nuclear satellites andtheir fragments could endanger, contaminate and disable bothmanned and unmanned spacecraft with perigees well below 1000 km.
6.4 ASSESSMENT OF COLLISION HAZARDS IN ORBIT
6.4.1 Collision Hazard in LEO
Low Earth Orbits generally include the altitude range of 200 kmto 4000 km. This region has the largest spatial density(Number/km3 -see Fig.6-1) of space objects, with a maximum of1.7 x 10-8 objects/km3 between 800 and 850 km and 2.5 x 10⁻⁸
objects/km3 between 950-1000 km altitude. This corresponds to amean time between collisions of 1/1800 years for a satellite witha cross section of 100 m2, the size of the Soviet Mir Space
6-16
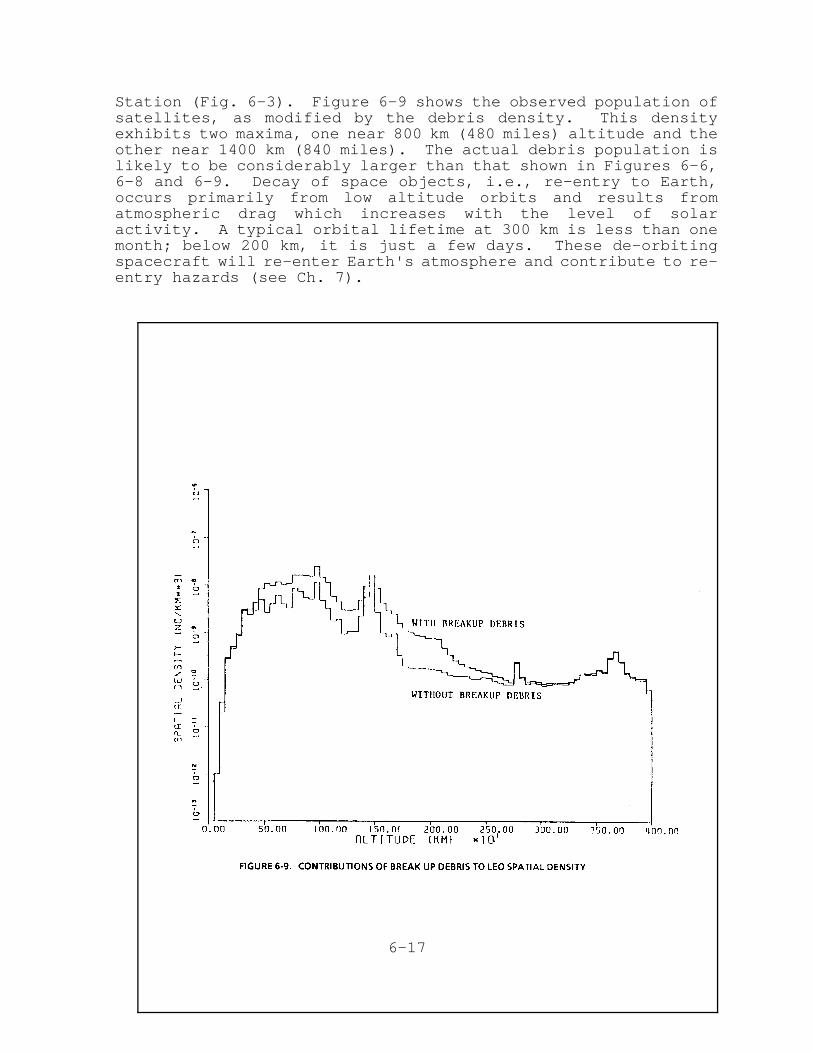
Station (Fig. 6-3). Figure 6-9 shows the observed population ofsatellites, as modified by the debris density. This densityexhibits two maxima, one near 800 km (480 miles) altitude and theother near 1400 km (840 miles). The actual debris population islikely to be considerably larger than that shown in Figures 6-6,6-8 and 6-9. Decay of space objects, i.e., re-entry to Earth,occurs primarily from low altitude orbits and results fromatmospheric drag which increases with the level of solaractivity. A typical orbital lifetime at 300 km is less than onemonth; below 200 km, it is just a few days. These de-orbitingspacecraft will re-enter Earth's atmosphere and contribute to re-entry hazards (see Ch. 7).
6-17
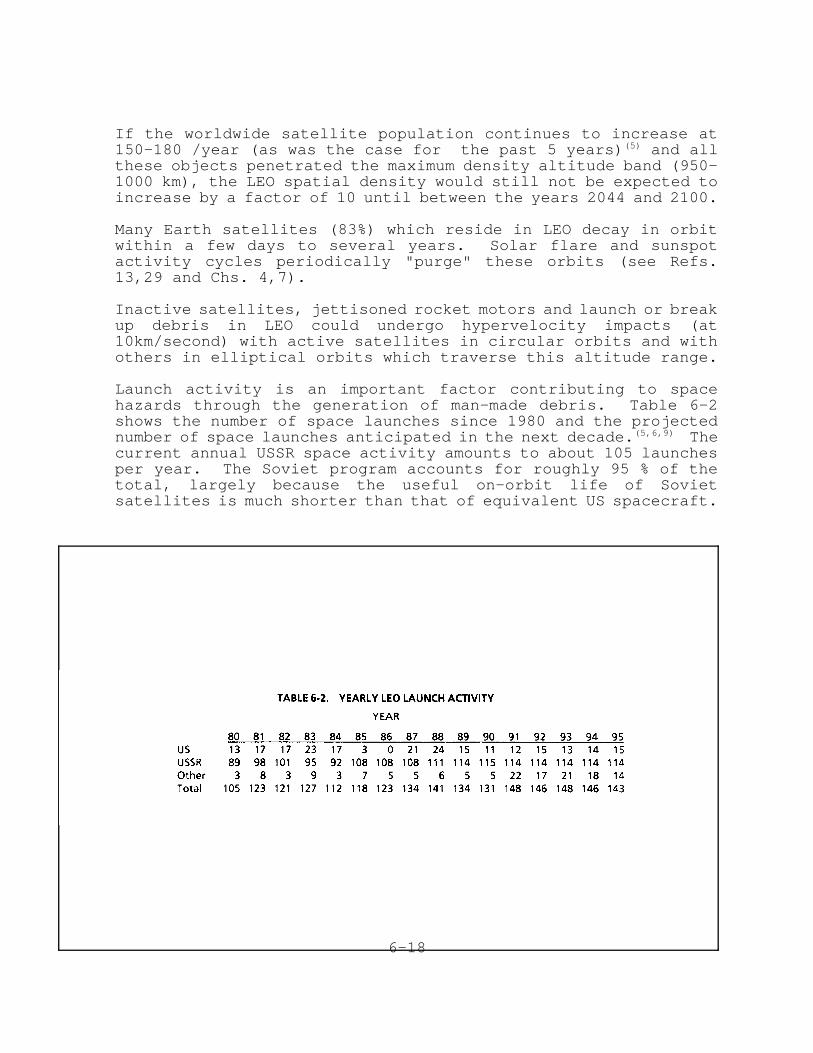
If the worldwide satellite population continues to increase at150-180 /year (as was the case for the past 5 years)(5) and allthese objects penetrated the maximum density altitude band (950-1000 km), the LEO spatial density would still not be expected toincrease by a factor of 10 until between the years 2044 and 2100.
Many Earth satellites (83%) which reside in LEO decay in orbitwithin a few days to several years. Solar flare and sunspotactivity cycles periodically "purge" these orbits (see Refs.13,29 and Chs. 4,7).
Inactive satellites, jettisoned rocket motors and launch or breakup debris in LEO could undergo hypervelocity impacts (at10km/second) with active satellites in circular orbits and withothers in elliptical orbits which traverse this altitude range.
Launch activity is an important factor contributing to spacehazards through the generation of man-made debris. Table 6-2shows the number of space launches since 1980 and the projectednumber of space launches anticipated in the next decade.(5,6,9) Thecurrent annual USSR space activity amounts to about 105 launchesper year. The Soviet program accounts for roughly 95 % of thetotal, largely because the useful on-orbit life of Sovietsatellites is much shorter than that of equivalent US spacecraft.
6-18
Figure 6-2 shows the relative flux distribution of meteorites andman-made objects in LEO. The meteorite flux data were based onindirect ground based measurements, including observation ofmeteors burning up in the atmosphere. The man-made flux datawere taken from the 1986 Satellite Catalog of tracked spacedebris.
6.4.2 Collision Probabilities in LEO
Collision probabilities are useful in assessing space hazards,estimating collision hazards between operational spacecraft andorbiting objects quantitatively and determining the likelihood ofsatellite debris collisions.
Models developed for deriving probability estimates usually usethe following assumptions:
• Objects in orbit are randomly distributed and eachobject is assigned an effective cross section.
• The collision cross section is usually the geometriccross section of the satellite.
• Orbital planes within the debris population have randomdistributions in the azimuthal coordinate.
Several models based on kinetic theory and celestial mechanicsprovide estimates of collision hazards to operational spacecraftin LEO.(11,16,20) The impact probability, per orbit or per crossinga certain orbital torus, must be multiplied by the on-orbitsatellite lifetime (or the mission duration) and the crosssection of the object to estimate its overall collision risk.
Probability derivations are simplified if the object density isassumed to have only an altitude dependence and all otherdependencies are replaced by averages. While the latter removesthe possibility of including angular orbital dependencies in thesolution, it nevertheless provides a reasonably accurate estimateof the collision hazard.
One procedure used to determine the altitude dependent objectdistribution is to define an Earth centered spherical grid,consisting of surfaces of constant radius spaced every 50 km from150 to 4000 km in altitude, and surfaces of constant polar angle(latitude) spaced every 5 degrees.(8) The object density withinthe above defined space cells is computed based on the percentageof time an object spends in the 'spherical cell.' Figure 6-2 istypical of the type of density distribution which results fromthis model. The mean rate of collision probability, P, isdefined as,
6-19
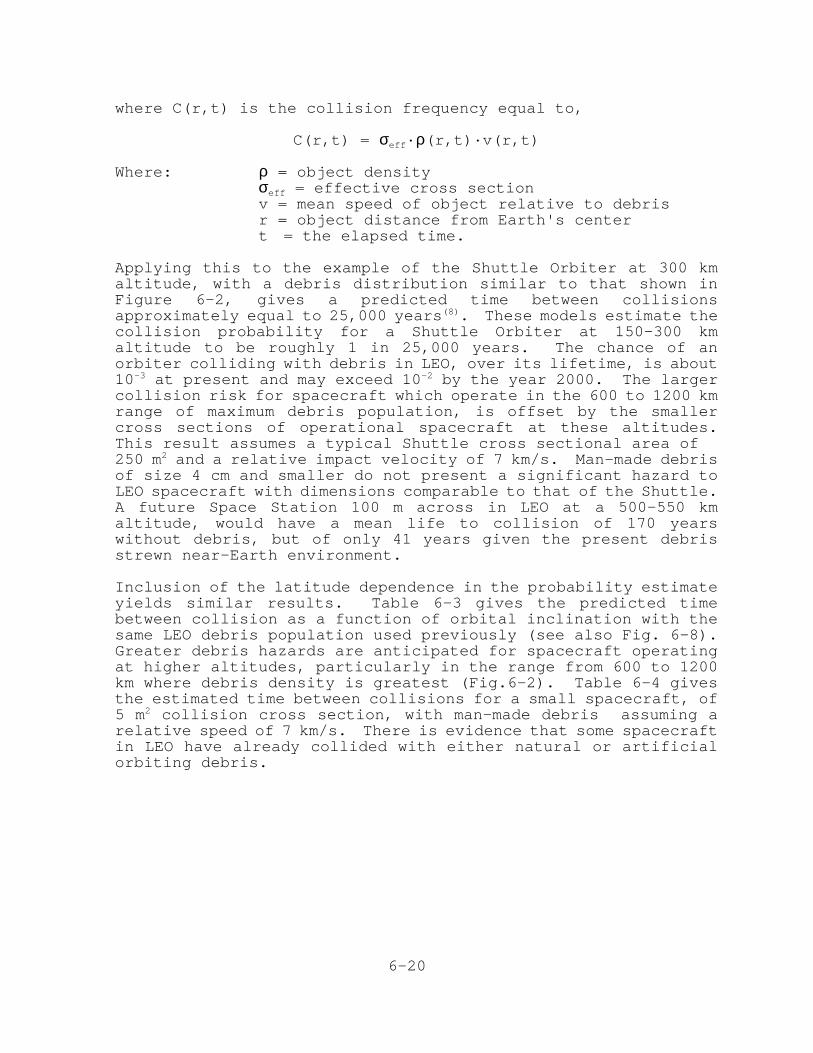
where C(r,t) is the collision frequency equal to,
C(r,t) = σeff·ρ(r,t)·v(r,t)
Where: ρ = object densityσeff = effective cross sectionv = mean speed of object relative to debrisr = object distance from Earth's centert = the elapsed time.
Applying this to the example of the Shuttle Orbiter at 300 kmaltitude, with a debris distribution similar to that shown inFigure 6-2, gives a predicted time between collisionsapproximately equal to 25,000 years(8). These models estimate thecollision probability for a Shuttle Orbiter at 150-300 kmaltitude to be roughly 1 in 25,000 years. The chance of anorbiter colliding with debris in LEO, over its lifetime, is about10-3 at present and may exceed 10-2 by the year 2000. The largercollision risk for spacecraft which operate in the 600 to 1200 kmrange of maximum debris population, is offset by the smallercross sections of operational spacecraft at these altitudes.This result assumes a typical Shuttle cross sectional area of 250 m2 and a relative impact velocity of 7 km/s. Man-made debrisof size 4 cm and smaller do not present a significant hazard toLEO spacecraft with dimensions comparable to that of the Shuttle.A future Space Station 100 m across in LEO at a 500-550 kmaltitude, would have a mean life to collision of 170 yearswithout debris, but of only 41 years given the present debrisstrewn near-Earth environment.
Inclusion of the latitude dependence in the probability estimateyields similar results. Table 6-3 gives the predicted timebetween collision as a function of orbital inclination with thesame LEO debris population used previously (see also Fig. 6-8).Greater debris hazards are anticipated for spacecraft operatingat higher altitudes, particularly in the range from 600 to 1200km where debris density is greatest (Fig.6-2). Table 6-4 givesthe estimated time between collisions for a small spacecraft, of5 m2 collision cross section, with man-made debris assuming arelative speed of 7 km/s. There is evidence that some spacecraftin LEO have already collided with either natural or artificialorbiting debris.
6-20
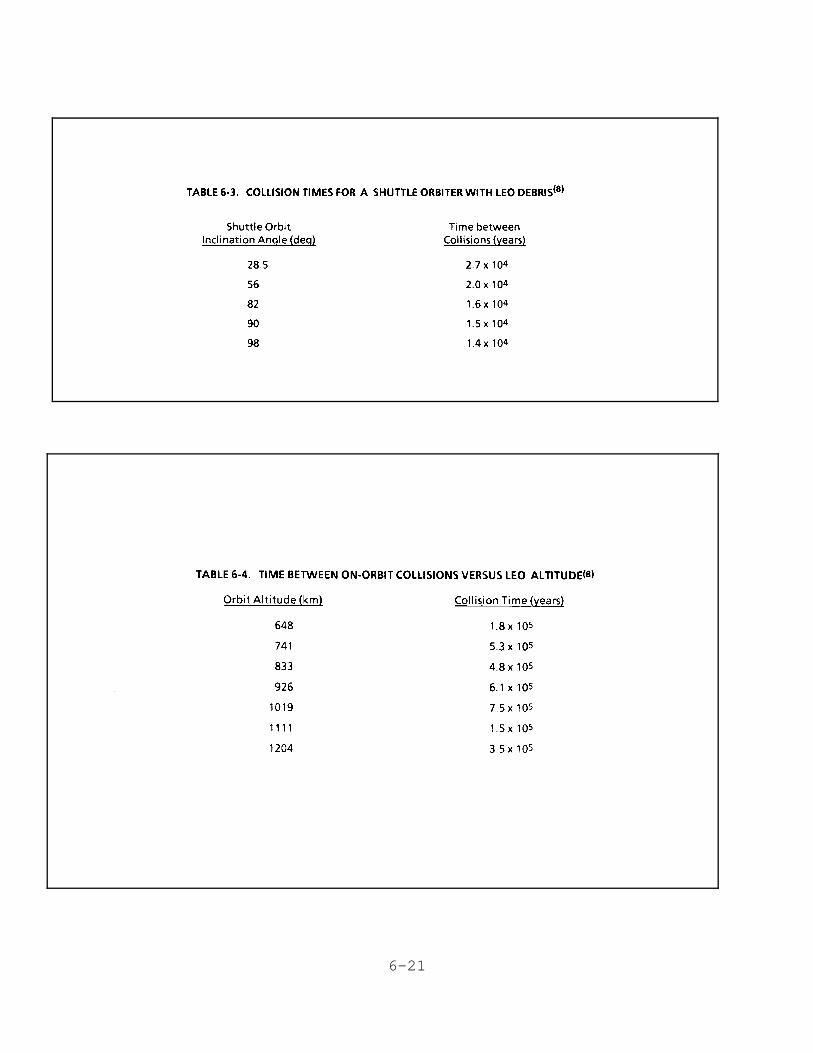
6-21
6.4.3 Collision Hazard in Geosynchronous Orbit (GEO)
Conceptually, the geosynchronous orbits can be visualized as aspherical shell several kilometers thick located at an altitudeapproximately 36,000 km above the Earth. Spacecraft ingeosynchronous orbit move with the rotating Earth at arbitraryangles of inclination with respect to the equator. Thegeostationary orbit represents a particular subclass of thegeosynchronous orbits in which objects move synchronously withthe rotating Earth, but with positions fixed relative to itsrotating coordinate system. The geostationary ring denotes aparticular region in geosynchronous space, of approximatelyseveral hundred kilometers in width, encompassing these orbits.
The main characteristics of geosynchronous orbits are:
• Orbital period is equal to one sidereal day (1436.2minutes or 24 hours).
• An infinite variety of orbits exist each with the sameaverage altitude as a geostationary orbit.
• Objects in orbit cross the equator twice each day withaverage velocity of 3075 m/s.
• The equatorial crossing point of the object driftscyclically along the equator due to unbalanced Earthgravity.
• Objects remain permanently in orbit (as in thegeostationary ring).
The main characteristics of geostationary orbits are:
• Altitude above Earth is 35,787 km (19323 nauticalmiles) ± 50 km.
• Orbit is exactly circular over the Earth's equator (± 10 latitude).
• Orbital period is 1436.2 minutes or roughly 24 hours.• Objects in orbit have an orbital velocity of 3075 m/s.• Objects remain permanently in orbit, i.e., the decay
rate is very slow and secular, about 1 kilometer perthousand years.
• Objects in orbit are subject to weak luni-solar andEarth gravitational perturbations which result in slowdrift in east-west and north- south directions aboutthe two geo-stable points at 75.3°E and 104.7°Wlongitude. This results in eventual clustering ofinactive satellites in these regions.
Semi-geosynchronous orbits (i.e., at half the GEO altitude with12 hour periods) are also used for communication satellites.Such highly elliptical "molnyia" (lightning) orbits are favoredby the Soviets because the satellite spends most of its timeabove the Soviet Union moving slowly near apogee, but crosses
6-22
rapidly over antipodal regions near perigee. Such orbits degrademore rapidly due to atmospheric friction near perigee.
The largest concentration of operational spacecraft lies in thegeostationary belt and currently numbers over a hundredspacecraft. Extinct satellites also continue to orbit in thecrowded GEO orbits, presenting a mounting collision damage hazardto new communication satellites (Fig. 6-3). Some nations andorganizations have begun to move inactive satellites out of GEOto prevent cluttering of the GEO ring. However, according toRef. 3 (Ch. 4), the removal of inactive satellites from GEOstations at the end of their useful life is not yet a generalpractice. The policy of using disposal orbits for defunctsatellites has recognized shortcomings which may introduce newhazards to active payloads (e.g., the potential for misfire orexplosion, eventual migration of "removed" payloads to GEO due toluni-solar perturbations and solar wind pressure, added cost forstationkeeping and orbital maneuvering propellants and decreasingreliability with life on- orbit.)
The peak spatial density (number per km3) of satellites at GEOaltitudes (35,750 to 35,800 km) is due to about 543 satellites,of which only about 150 are geostationary. The others are ineither geosynchronous, or semi-geosynchronous highly elliptical"molnyia" orbits. The corresponding spatial density value is7.55 x 10-10 objects, still 2-3 orders of magnitude below that inLEO.
The current geosynchronous population, as tracked by USSPACECOM,consists of about 116 active communication satellites plus atleast as many uncontrolled objects drifting through thegeosynchronous corridor. The latter includes inactive satellitesand debris which drift around the Earth or oscillate about thetwo geo-potential stable points. USSPACECOM can track an objectof the size of a soccer ball in GEO and of about ò 10 cm. in LEO(Figs. 6-1, 6-4). Figure 6-10 shows the relative positions ofthe commercial communication satellites in GEO. The number ofactive GEO satellites over the past few years and the estimatednumber of GEO launches in the coming decade is shown in Fig. 6-10and Table 6-5.( 5,6)
Thus, collisions in GEO are restricted to object encounters at afixed altitude of approximately 36,000 km, actually an equatorialtorus of 10 in latitude and 35, 785 ±50 km altitude above theEarth's equator. Such collisions can involve both man-madeobjects and natural objects (meteoroids).
6-23
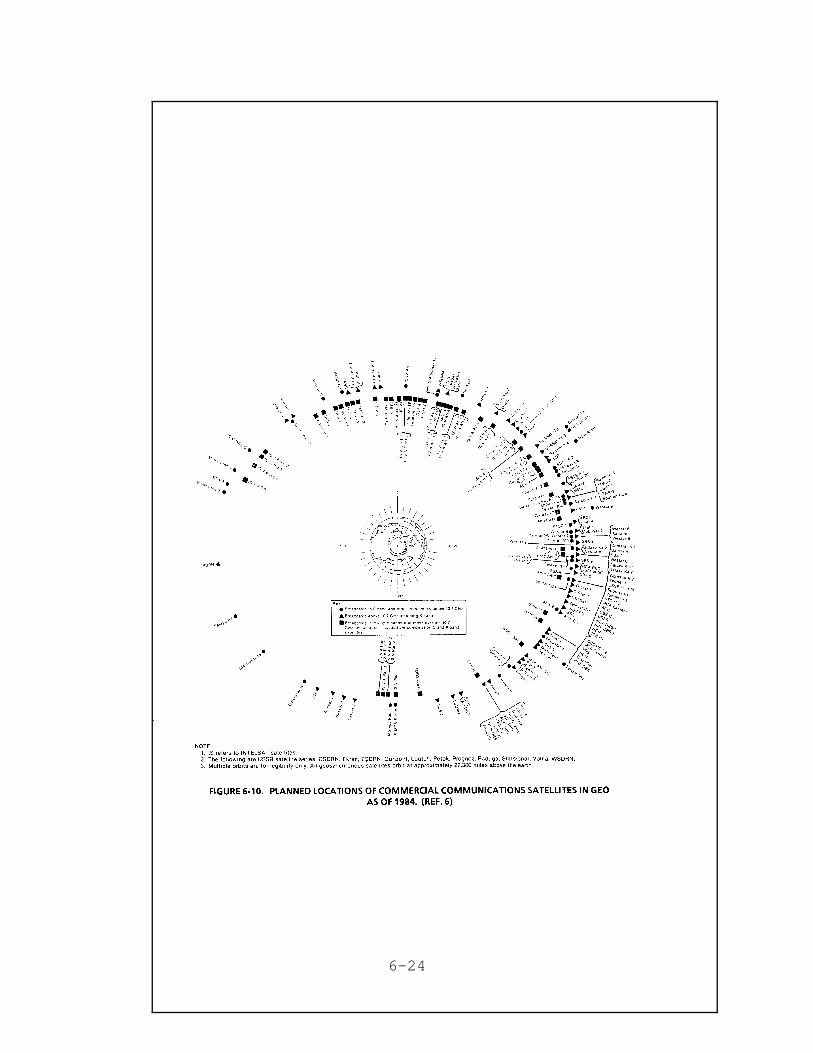
6-24
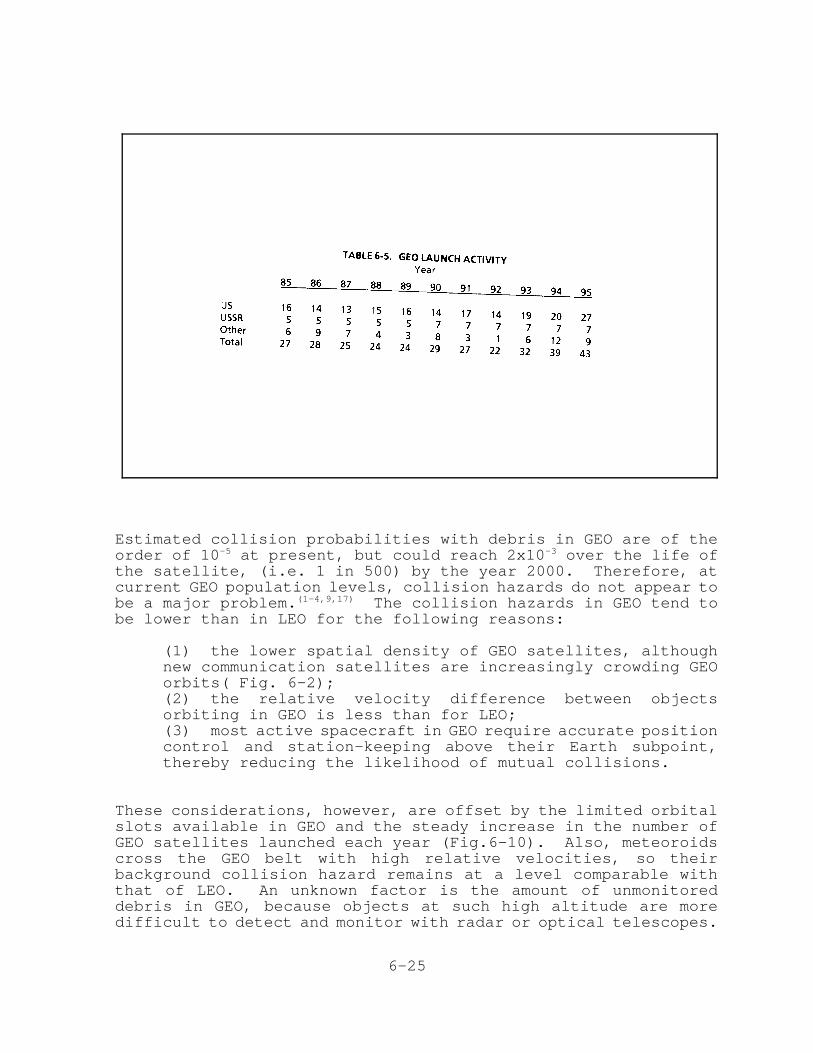
Estimated collision probabilities with debris in GEO are of theorder of 10-5 at present, but could reach 2x10⁻³ over the life ofthe satellite, (i.e. 1 in 500) by the year 2000. Therefore, atcurrent GEO population levels, collision hazards do not appear tobe a major problem.(1-4,9,17) The collision hazards in GEO tend tobe lower than in LEO for the following reasons:
(1) the lower spatial density of GEO satellites, althoughnew communication satellites are increasingly crowding GEOorbits( Fig. 6-2);(2) the relative velocity difference between objectsorbiting in GEO is less than for LEO;(3) most active spacecraft in GEO require accurate positioncontrol and station-keeping above their Earth subpoint,thereby reducing the likelihood of mutual collisions.
These considerations, however, are offset by the limited orbitalslots available in GEO and the steady increase in the number ofGEO satellites launched each year (Fig.6-10). Also, meteoroidscross the GEO belt with high relative velocities, so theirbackground collision hazard remains at a level comparable withthat of LEO. An unknown factor is the amount of unmonitoreddebris in GEO, because objects at such high altitude are moredifficult to detect and monitor with radar or optical telescopes.
6-25
A number of articles discuss the collision probabilities ofsatellites in GEO.(10-20) In general, the collision probability isa complicated function of orbital parameters, relative position,velocity, projected areas of the spacecraft and time. Thecollision probability, P, of satellite collisions assuming auniform distribution of space objects is,
P = A·ρ·v·t
where: ρ= object densityA= projected area of the satellitev= relative velocity of the target satellitet= time interval associated with the (periodic)
satellite motion
Takahashi(15) and Chobotov(11,16) have developed models forestimating collision probabilities for GEO satellites. Bothmodels use the above relation as the basis for derivation ofcollision probabilities. Takahashi assumes the target satellitestays within fixed longitude/latitude bounds by appropriatestation keeping. The satellite motion includes a small diurnaloscillations superimposed on a steady longitudinal drift.Maneuver corrections are applied every 15 days to maintain thesatellite within the fixed longitudinal bound.
The right hand side of Figure 6-5 illustrates the diurnaloscillation/drift motions assumed by Takahashi. The satelliteorbital bounds were assumed to be 0.01o, 0.05o, and 2 km for thelongitude, latitude and altitude respectively.
If the orbital bounds for the diurnal motion are expressed interms of increments in longitude ∆ LON, latitude ∆ LAT andaltitude ∆ ALT, the collision probability in three dimensions perorbit takes the form:
P = N·(2∏R)·L2·(∆LON·∆LAT·∆ALT)·(∆LON+(2/∏)·∆LAT+ ∆ALT/R)
where L is the satellite diameter. The incremental bounds ∆ LON,∆ LAT and ∆ ALT are set by the magnitude of the diurnal motionsalong the longitude, latitude, and radial coordinates which areassumed to be equal to 0.01o, 0.05o and 2000 meters respectively.If an additional factor of 1/10 is introduced to account for thefact that collisions are only possible one out of every tendiurnal periods due to the longitudinal drift, then with thesesubstitutions the above equation takes the form:
P = 9.51 x 10⁻⁹ x L2 per half day
This yields a satellite collision probability of 7 x 10⁻⁶ x L2 peryear. For satellites having dimensions typical for those used inspace communications, i.e., L=2 meters, the probability ofcollisions in the geostationary orbit is extremely small. Thischanges when large space structures are considered, such as
6-26
proposed satellite "farms," solar power satellites or orbitingspace platforms. For an orbiting satellite of dimensionsapproaching 125 meters, the annual likelihood of a collision isabout one in ten. For a hypothetical satellite "farm" ofdimensions of 1000 meters, the expected frequency of collisionincreases to approximately once every 52 days.
The Chobotov approach considers the collision probability betweengeostationary satellites in circular orbits (in the equatorialplane) and geosynchronous satellites moving in an orbital planewith small inclination angle i and orbit eccentricity e. Thesatellite density, ρ, is proportional to the relative dwell timethe satellite spends within a spatial volume defined by thefollowing "bounds":
Longitude bound = 2 ∏ R, Latitude bound = 2 R sin i,Altitude bound = 2 R e,
where: R is the distance of satellite from Earth's center.
For a geostationary satellite of radius Rs, the probability ofcollision, P, with another satellite in one revolution or a 24hour period is on the order of P = 2.83 x 10⁻¹³ Rs2 per day.
For a population of over 200 satellites, assuming one satelliteevery 2o longitude, each with radius of 50 meters, theprobability is 2.2 x 10⁻⁹ per day. Hence, the probability of acollision between a satellite in a circular geostationary orbitwith other satellites in low inclination orbits is extremelysmall.
This probability of a collision between a spacecraft and spentGEO transfer stages is approximately two orders of magnitude lessthan that between two active GEO spacecraft, because of to therelatively small percent of the time (approximately 3%) that anobject in an elliptical GEO transfer orbit spends atgeosynchronous altitudes. The semi-geosynchronous ("molnyia")orbits favored for Soviet communication satellites are highlyelliptical with low perigees and high relative near-Earthvelocities.
To summarize, the low typical spatial densities in GEO of 2.5 -7.5x10⁻¹⁰ objects/km3, due to the roughly 550 objects which orbitin the 35, 750 + 50 km bin, combined with lower relativevelocities in GEO and with typical station keeping capabilities,the probability of on-orbit collision is negligible at present(24).
6.4.4 Gravitational Drift Forces in GEO
Secular gravitational forces play an important role in alteringthe orbital characteristics of geosynchronous satellites.Depending on the point of origin of these forces, their effect onthe orbit can be markedly different. These forces include the
6-27
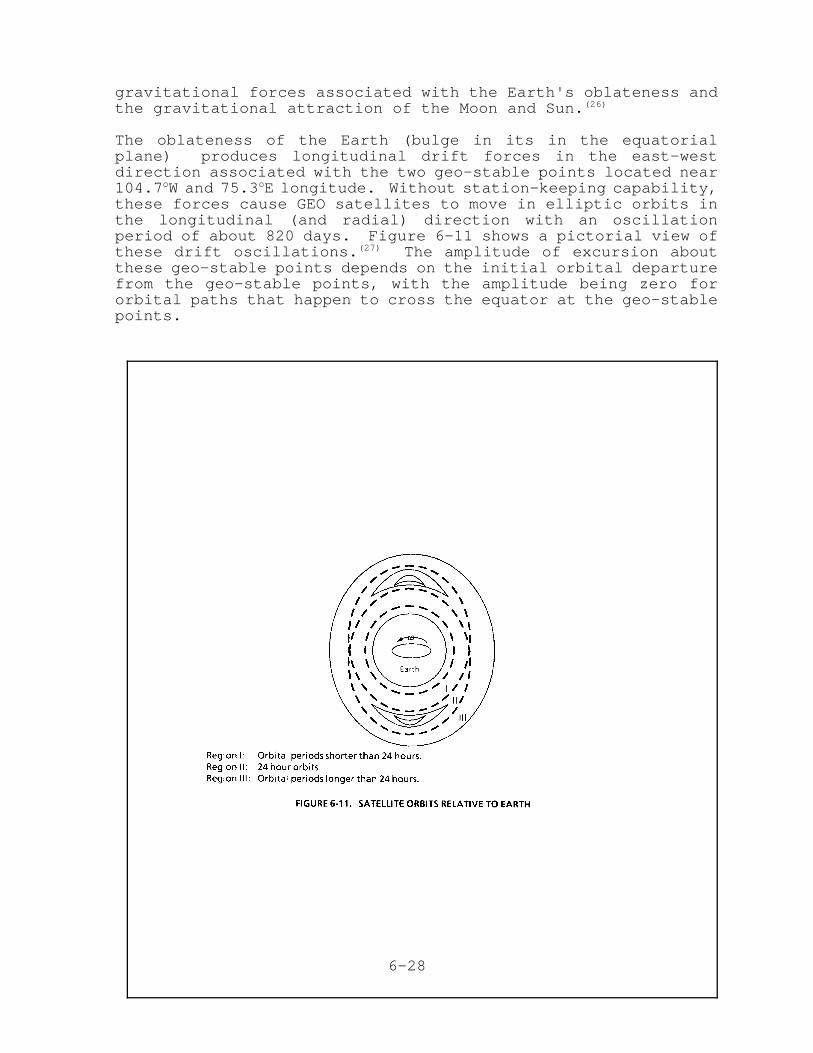
gravitational forces associated with the Earth's oblateness andthe gravitational attraction of the Moon and Sun.(26)
The oblateness of the Earth (bulge in its in the equatorialplane) produces longitudinal drift forces in the east-westdirection associated with the two geo-stable points located near104.7oW and 75.3oE longitude. Without station-keeping capability,these forces cause GEO satellites to move in elliptic orbits inthe longitudinal (and radial) direction with an oscillationperiod of about 820 days. Figure 6-11 shows a pictorial view ofthese drift oscillations.(27) The amplitude of excursion aboutthese geo-stable points depends on the initial orbital departurefrom the geo-stable points, with the amplitude being zero fororbital paths that happen to cross the equator at the geo-stablepoints.
6-28
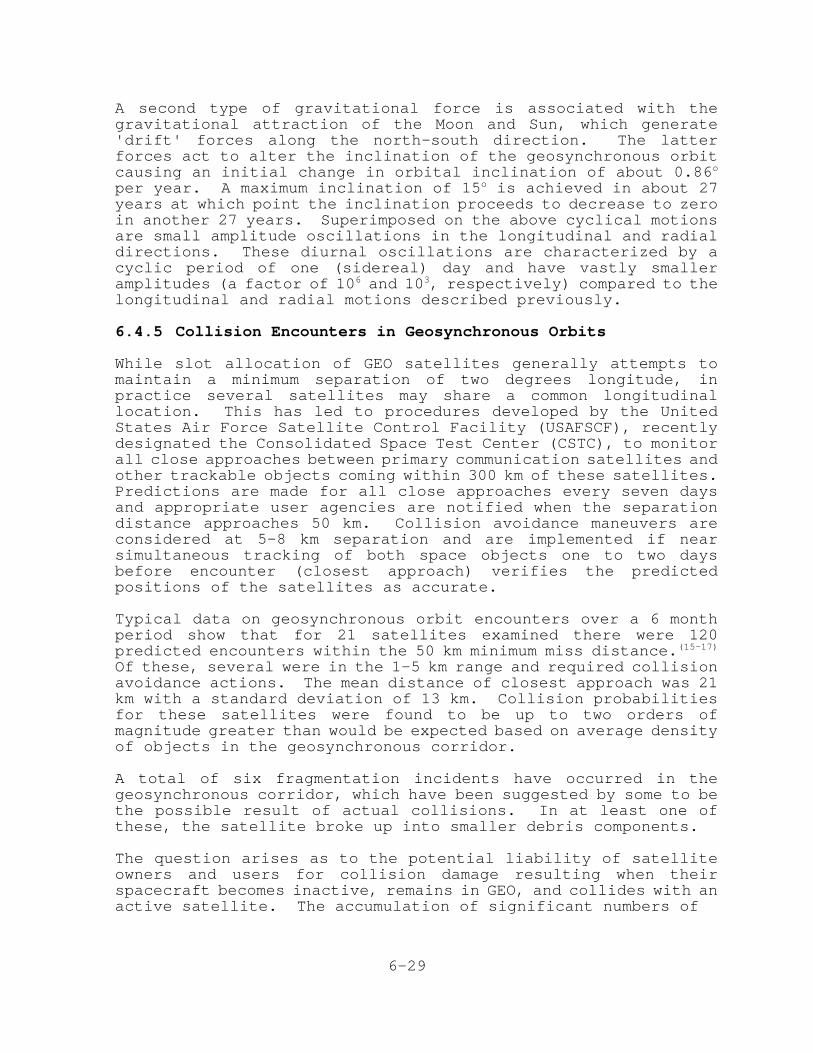
A second type of gravitational force is associated with thegravitational attraction of the Moon and Sun, which generate'drift' forces along the north-south direction. The latterforces act to alter the inclination of the geosynchronous orbitcausing an initial change in orbital inclination of about 0.86o
per year. A maximum inclination of 15o is achieved in about 27years at which point the inclination proceeds to decrease to zeroin another 27 years. Superimposed on the above cyclical motionsare small amplitude oscillations in the longitudinal and radialdirections. These diurnal oscillations are characterized by acyclic period of one (sidereal) day and have vastly smalleramplitudes (a factor of 106 and 103, respectively) compared to thelongitudinal and radial motions described previously.
6.4.5 Collision Encounters in Geosynchronous Orbits
While slot allocation of GEO satellites generally attempts tomaintain a minimum separation of two degrees longitude, inpractice several satellites may share a common longitudinallocation. This has led to procedures developed by the UnitedStates Air Force Satellite Control Facility (USAFSCF), recentlydesignated the Consolidated Space Test Center (CSTC), to monitorall close approaches between primary communication satellites andother trackable objects coming within 300 km of these satellites.Predictions are made for all close approaches every seven daysand appropriate user agencies are notified when the separationdistance approaches 50 km. Collision avoidance maneuvers areconsidered at 5-8 km separation and are implemented if nearsimultaneous tracking of both space objects one to two daysbefore encounter (closest approach) verifies the predictedpositions of the satellites as accurate.
Typical data on geosynchronous orbit encounters over a 6 monthperiod show that for 21 satellites examined there were 120predicted encounters within the 50 km minimum miss distance.(15-17)
Of these, several were in the 1-5 km range and required collisionavoidance actions. The mean distance of closest approach was 21km with a standard deviation of 13 km. Collision probabilitiesfor these satellites were found to be up to two orders ofmagnitude greater than would be expected based on average densityof objects in the geosynchronous corridor.
A total of six fragmentation incidents have occurred in thegeosynchronous corridor, which have been suggested by some to bethe possible result of actual collisions. In at least one ofthese, the satellite broke up into smaller debris components.
The question arises as to the potential liability of satelliteowners and users for collision damage resulting when theirspacecraft becomes inactive, remains in GEO, and collides with anactive satellite. The accumulation of significant numbers of
6-29
inactive satellites in GEO poses increasing collision hazards foractive satellites. Takahashi estimated this collisionprobability using the same method previously applied (see Sec.6.4.3) in the case of collisions between active satellites.Inactive satellites are assumed to have motion perturbationsdictated by the Earth and by luni-solar gravitational/driftforces. Diurnal oscillations caused by the Earth's gravitationalperturbations are superimposed on long-term (2-3 years) orbitevolution about one of two geo-stable points located at 75oE and105oW longitude. Figure 6-12 shows a sketch of the long-termorbital evolution relative to Earth fixed coordinates. Anadditional secular motion excursion occurs in the north-southdirection, causing a latitude variation of ±14.7o in a 54-yearperiod.
6-30
The collision probability is estimated by determining thelikelihood of collision in one sidereal day of a satelliteconfined within geosynchronous bounds of 0.1o longitude, 7.35o
latitude and a 30 km altitude range. The effect of the secularorbital oscillations is to reduce the collision probability by afactor of 1/900. The estimated collision probability between anactive and 'N' abandoned satellites of dimension 'L' thenbecomes:
P = 5.185 x 10⁻¹³ x N x L2 per half day.
This gives a probability of 6.0 x 10⁻⁶ per year for a collisionbetween an active satellite and an assumed total of 1000abandoned satellites, each 4 meters diameter.
If the active satellite is assumed to be a large space platformof 125 meters across, the probability of collision with anestimated 1000 inactive satellites in one year increases to:
P = 730 x 5.185 x 10-13 x 1252 x 1000 = 0.00591 per year
Similarly, if a large solar power satellite with hypotheticaldimensions of 1000 meters will be stationed in GEO, the collisionprobability in 1 year will become a sizeable 0.38 per year.
Hence, large GEO satellite clusters or platforms will have a highprobability for collisions, if the number of abandonedcommunication satellites is allowed to approach 1000.
6-31
REFERENCES TO CHAPTER 6
1. Kessler, D.J. "Orbital Debris-Technical Issues",presentation to the USAF Scientific Advisory Board onSpace Debris, Jan. 1987.
2. a)Johnson, N.L. "Space Background Environment Assessment",Teledyne Brown Eng. Report for US Army Strategic DefenseCommand, Sept. 1986, CS86- USASDC-0022. b)"Special Report of the USAF Scientific Advisory Board AdHoc Committee on Current & Potential Technology to ProtectAF Space Missions from Current and Future Debris-Draft,1987. (Appendix: "History and Projections of ForeignSatellite Mass to Earth Orbit".)
3. Johnson, N. L. and D.S. McKnight, "Artificial SpaceDebris," (Orbit Book Co., Malabar, FL, 1987).
4. a)NORAD, "Satellite Catalog", December 1986; b)USSPACECOM, Space Surveillance Center, "SatelliteCatalog," Dec. 31, 1987. c)"What's Up in Space- Operational Satellites on theAnniversary of Sputnik 1", F.A.S. report, September, 1987.
5. "Space Activities of the US, Soviet Union and OtherLaunching Countries:1957-1986," M.S. Smith, CongressionalResearch Service, Report 87-229 SPR, Feb. 1987.
6. "International Cooperation and Competition in CivilianSpace Activities," OTA-ISC-239, July 1985, OTA/USCongress.
7. Fischer, N.H. and Reynolds, R.C., "Threat of SpaceDebris", 1984 IEEE Trans. on Aerospace & El. Systs., pp.397-406.
8. Reynolds, R.C., Fischer, N.H., and Rice, E.E., "Man-MadeDebris in Low Earth Orbit-A Threat to Future SpaceOperations", Journal of Spacecraft and Rockets, Vol. 20,No. 3, May/June 1983, pp. 279-285.
9. Suddeth, D.H., "Debris in the Geostationary Orbit Ring -The Endless Shooting Gallery - The Necessity for aDisposal Policy", Conference, 1986.
10. Kessler, D.J., "Orbital Debris Issues," Advances in SpaceResearch, Vol. 5, No. 2, 1985.
11. Chobotov, V.A., "Collision Hazard in Space," Astronauticsand Aeronautics, Vol. 17, No. 9, September 1980, pp. 38-39.
6-32
12. Kessler, D.J., P.M. Landry, B.G. Cour-Palais and R.E.Taylor, "Collision Avoidance in Space," IEEE Spectrum,Vol. 17, No. 6, June 1980, pp. 37-41.
13. W.B. Wirin, "The Sky is Falling: Managing Space Objects,"Proceedings, IAF 35th Congress, Coll. on. Cooperation inSpace, Intl. Inst. on Space Law, Oct. 1984, Lausanne,Switzerland (NY, AIAA, 1984), p. 152.
14. J.A. Lovece, "The Impending Crisis of Space Debris,"Astronomy, Aug. 1987, pp. 8-13.
15. Takahashi, K., "Collision Between Satellites in StationaryOrbits," IEEE Transactions on Aerospace and ElectronicSystems, AES-17, No. 4, July 1981.
16. Chobotov, V.A., "On the Probability of SatelliteCollisions in Earth Orbit," The Aerospace Corporation,TOR-0079(4071-07),.June 21, 1979.
17. a)Hechler, M. and Vander Ha, J., "Probability ofCollisions in the Geostationary Ring," Journal ofSpacecraft, Vol. l8, No. 4, July/August 1981.b)Hechler,M., "Collision Probabilities at GeosynchronousAltitudes," Adv. Space Res. Vol. 5, pp. 47-57, 1985.
18. Takahashi, K., "Applications of Space Development," XXXIInternational Astronautical Congress, Tokyo, 1980.
19. Brooks, D.R., G.G. Gibson and T.D. Bess, "Predicting theProbability that Earth-Orbiting Spacecraft will Collidewith Man-Made Objects in Space," Space Rescue & Safety,Vol. 37, 1974, pp. 79-139 (AAS74-185).
20. Reynolds, R.C., Fischer, N.H., and Miller, L.A.,"Collision Hazard Presented by Man-Made Debris UndergoingCorrelated Motion," Space Rescue & Safety, Vol. 58, 1982(published in 1986, Univelt, San Diego, CA., pp. 11-30).
21. Howell, I.A., "The Challenge of Space Surveillance" in Skyand Telescope, June 1987, pp. 584-588.
22. Su, S-Y and D.J. Kessler, "Contribution of Explosion andFuture Collision Fragments to the Orbital Debris Fragmentsto the Orbital Debris Environment," Adv. Space Res. 5, pp.25-34, 1985.
23. Taff, L.G., "Satellite Debris: Recent Measurements," J.Spacecraft, Vol. 23, pp. 342-346, 1986.
24. Johnson, N.L., "Nuclear Power Supplies in Orbit," SpacePolicy, Aug. 1987, pp. 223-233.
6-33
25. Gabbard, J., "History of Satellite Breakups in Space,"Orbital Debris Workshop, Lyndon B. Johnson Space Center,Houston, Texas, pp. 30-38, July 82.
26. Nacozy, P., "Inclined and Eccentric GeosynchronousSatellite Orbits," AIAA Paper 82-1412, 1982.
27. Blitzer, L., "Effect of Ellipticity of the Equator on 24-Hour Nearly Circular Satellite Orbits," Journal ofGeophysical Research, Vol. 67, January 1962.
28. "Space Station and the Law: Selected Legal Issues," OTABackground Paper, Aug. 1986.
29. "Policy and Legal Issues Involved in the Commercializationof Space," S. Prt. 98-102 US Congress, 1983.
30. Hosenball, S.N., "The Law Applicable to the Use of Spacefor Commercial Activities," AIAA Paper 83-0253, 1983.
31. Schwetje , F.K. (USAF Chief of Space Law), "Space Law:The Legal Aspects of Space Debris Control and SpaceSalvage Operations"presented at Inter-American Bar Assoc.Mtg, Buenos Aires, Argentina, May 1987.
32. "Satellite Situation Report," NASA/GSFC, Vol. 27, #3,Sept.30, 1987; #2, June 30, 1987; and Vol.26, #4, Dec.31, 1986.
6-34
10/2/95 rev 7. RE-ENTRY HAZARDS
7.1 DEFINITION AND NATURE OF RE-ENTRY
Re-entry occurs when an orbiting spacecraft comes back into theEarth's atmosphere.(1) Any object placed in Earth orbit willeventually de-orbit and re-enter the atmosphere; this includeslaunch and breakup debris of satellites and spent rocket stages.Above 200 miles altitude, space is considered a perfect vacuum.(2)
In reality, space is never a perfect vacuum and regardless of theorbital altitude of an object, it creates drag which eventuallydegrades the satellite's orbit. The solar wind and solar flaresimpinge on orbiting spacecraft and gravitational perturbations(both terrestrial and luni-solar) modify the spacecraft orbit andshorten its lifetime in space. The result is that spacecrafttend to spiral slowly towards the Earth's surface. When objectsre-enter the atmosphere, their orbits decay rapidly and many ofthem burn up prior to impacting the Earth's surface.
There are two different sets of conditions associated with eithercontrolled or uncontrolled de-orbit to consider when evaluatingrisk from re-entering satellites and other space debris.(15,16)
Controlled de-orbit usually applies to manned and reusablespacecraft which are designed to survive re-entry and berecovered. In this situation, retrorockets are fired at ascheduled time in order to place the vehicle into a transferorbit which intersects the surface of the Earth. If the Earthhad no atmosphere, the intercept point would be the intendedimpact point. With the atmosphere, however, the vehicledecelerates further and falls short of the predicted vacuumimpact point. The impact point still can be predicted reasonablyaccurately under these conditions. Thus, the controlled de-orbitcan be planned so the spacecraft will impact near a predeterminedrecovery point, minimizing the risk of inadvertent impacts onships or ground and sea structures.
There are three major sources of uncertainty associated withpredicting uncontrolled re-entry characteristics, namely: theatmospheric conditions at the time an object begins to re-enter,the time of actual impact with the Earth's surface and the areain which the re-entering object will impact. These uncertaintiesassociated with uncontrolled re-entry increase proportionatelywith the object's orbital altitude and on orbit lifetime.
When an object has been orbiting for a period of time, a numberof changes could have taken place over its lifetime. If thespacecraft failed in some way before it reached final orbit, itsorbital parameters (inclination and eccentricity) could havechanged. It may have strayed from its planned orbital path,failed to achieve final orbit or broken up in an explosion
7-1
causing pieces to disperse in different directions. All of thesefailure modes have a direct impact on the variables (surfacearea, mass, shape of fragments and orbital characteristics) usedin the prediction of re-entry hazards.
Small changes in orbital characteristics can drastically affectthe manner of an object's passage through the atmosphere. Thefrictional heating and drag (deceleration) experienced in theatmosphere have large effects on the object. Small deviationsfrom the predicted conditions of re-entry may result in largedifferences in re-entry hazards and the associated casualtyexpectation (see Section 7.6). These differences could be due tofurther break up caused by the shock of entering the atmosphereat high velocity, the burning and ablation (vaporization)experienced during re-entry or changes in direction or velocitydue to the weather and wind conditions that slow re- enteringfragments differentially at lower altitudes.
7.2 ORBITAL DECAY
The basic concepts of energy and angular momentum (see Ch. 4) canbe used to answer most questions dealing with orbital and re-entry trajectories. They are used to predict the initial re-entry point and probable ground impact points. Orbitingsatellites control their positions in space by using small rocketthrusters, thereby changing their velocity and direction. Thisprocess is called "station-keeping" and requires rocket fuel andspecial on board communications and control equipment.Therefore, it is possible, to some extent, to choose the initialatmospheric re-entry point when dealing with controlled re-entry.(3) However, few satellites have the ability, capacity orlife expectancy to provide the station-keeping capability towardsthe end of their life.
All space objects that orbit the Earth do so because of thevarious forces acting on them. These forces change the positionand velocity of the object relative to Earth in such a way thattheir orbital characteristics become very predictable. TheSatellite Surveillance Center (SSC),US Space Command(USSPACECOM), within the Cheyenne Mountain Complex in Colorado,monitors each satellite's past and present positions and predictsits future using these various orbital characteristics anddynamic processes. To determine a satellite's position at anygiven time, the computer uses an algorithm based on the laws ofSpace Mechanics.(2,3,12) The computer can predict the orbital pathof the object with the object's historical position and velocityinformation. The Space Surveillance Center (SSC) of the US SpaceCommand processes tracking and monitoring data obtained by theSpace Surveillance Network (SSN) to predict re-entries. Spacedebris of the more than 90 satellite collisions or spontaneous
7-2
break ups and 20 payload explosions in space have been documentedto date (see also Chapter 6).(4,5,8)
External perturbations due to the Earth's oblateness, thegravitational tugs of the Sun and Moon, the solar plasma stormsand atmospheric friction cause long-term changes in the orbitalparameters of satellites. These forces also affect the on orbitlifetime and re-entry. Theoretically, all forces acting on near-Earth satellites can affect a satellite's on orbit lifetime. Theeffects of solar storms on the atmosphere and the oblateness ofthe Earth have a much more significant effect than thegravitational attractions of the Sun, Moon and the other planets.NASA/Marshall scientists have taken these factors into account indesigning an orbital lifetime prediction program. This program,called LIFTIM, uses a direct numerical integration of the timerates of change due to atmospheric drag using a Gauss-Legendreprocedure in conjunction with the Jacchia atmosphere model.(6)
An orbiting object loses energy through friction with spaceplasmas above the atmosphere so that it falls into a slightlylower orbit and eventually spirals towards the Earth's surface.As the object's potential energy, represented by its altitude, isconverted to kinetic energy, its orbital velocity increases. Asan object's orbital trajectory is brought closer to Earth, itspeeds up and outpaces others in higher orbits. Thus, asatellite's orbital altitude decreases gradually while itsorbital speed increases. Once it enters the upper reaches of theatmosphere, atmospheric drag will slow it down more rapidly andeventually cause it to fall to Earth.(4)
Atmospheric drag, particularly near perigee, leads to the gradualde-orbit and re-entry of satellites. Satellites in LEO with lessthan 90 minute periods, corresponding to orbital altitudes of100-200 nmi (or 185-370 km), re-enter within a couple of months.Above about 245 nmi (455 km) orbital altitudes, orbital lifetimesexceed several years. Above about 500 nmi (900 km) altitudesorbital lifetimes can be as long as 500 years.(5) Figure 7-1(a &b) illustrate Earth orbit lifetimes of satellites as a functionof drag and ballistic coefficients (see Section 7-3) for circular(e=0) and elliptical orbits with a range of altitudes. Forelliptical orbits, the lower the perigee altitude, the higher isthe apogee decay rate (P) and the shorter the on-orbit lifetime.
7-3
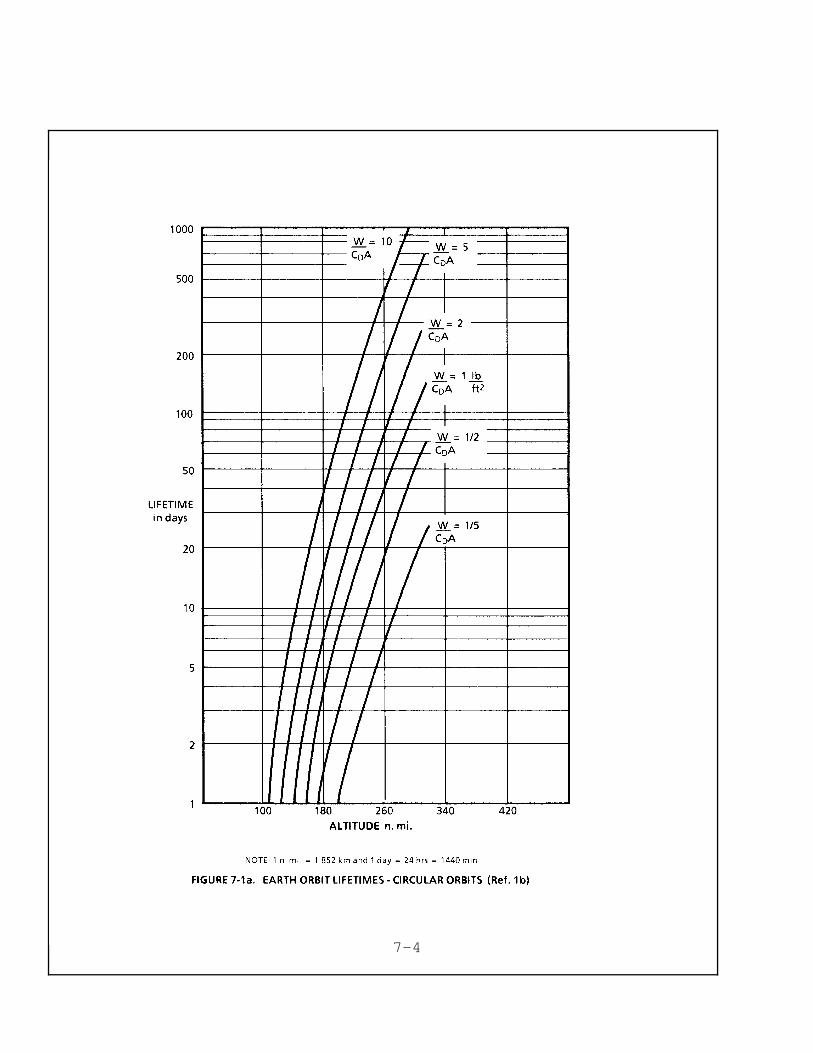
7-4
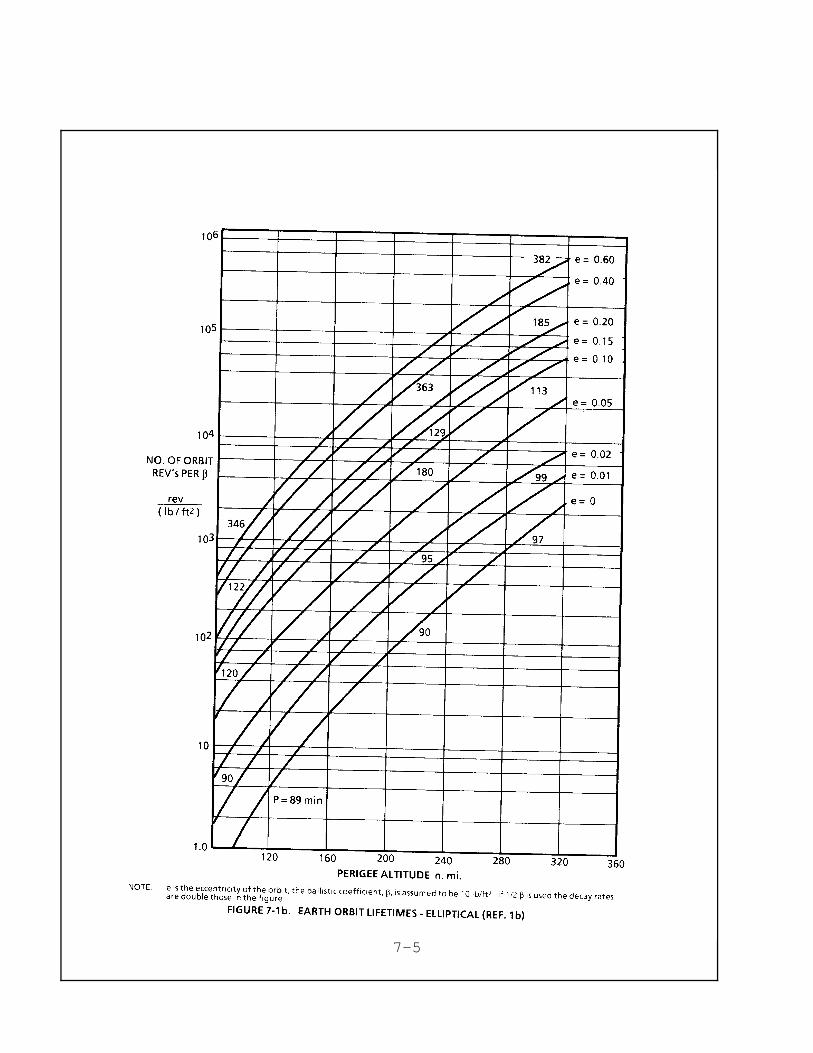
7-5
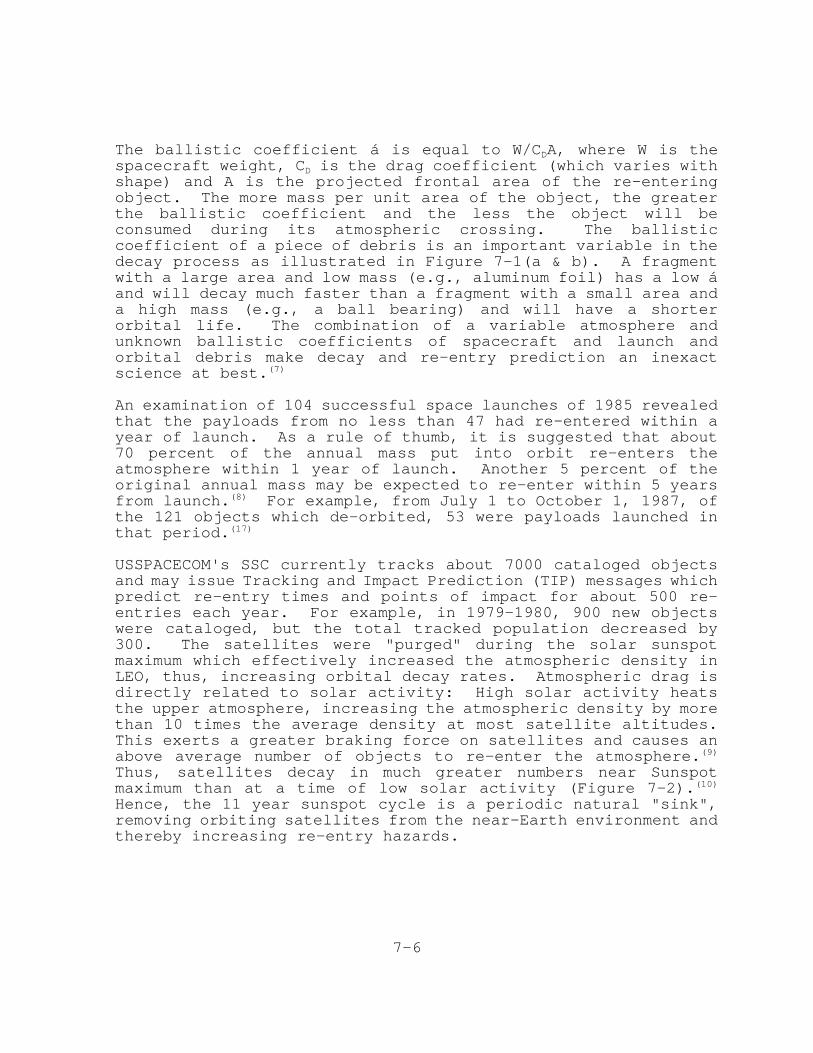
The ballistic coefficient á is equal to W/CDA, where W is thespacecraft weight, CD is the drag coefficient (which varies withshape) and A is the projected frontal area of the re-enteringobject. The more mass per unit area of the object, the greaterthe ballistic coefficient and the less the object will beconsumed during its atmospheric crossing. The ballisticcoefficient of a piece of debris is an important variable in thedecay process as illustrated in Figure 7-1(a & b). A fragmentwith a large area and low mass (e.g., aluminum foil) has a low áand will decay much faster than a fragment with a small area anda high mass (e.g., a ball bearing) and will have a shorterorbital life. The combination of a variable atmosphere andunknown ballistic coefficients of spacecraft and launch andorbital debris make decay and re-entry prediction an inexactscience at best.(7)
An examination of 104 successful space launches of 1985 revealedthat the payloads from no less than 47 had re-entered within ayear of launch. As a rule of thumb, it is suggested that about70 percent of the annual mass put into orbit re-enters theatmosphere within 1 year of launch. Another 5 percent of theoriginal annual mass may be expected to re-enter within 5 yearsfrom launch.(8) For example, from July 1 to October 1, 1987, ofthe 121 objects which de-orbited, 53 were payloads launched inthat period.(17)
USSPACECOM's SSC currently tracks about 7000 cataloged objectsand may issue Tracking and Impact Prediction (TIP) messages whichpredict re-entry times and points of impact for about 500 re-entries each year. For example, in 1979-1980, 900 new objectswere cataloged, but the total tracked population decreased by300. The satellites were "purged" during the solar sunspotmaximum which effectively increased the atmospheric density inLEO, thus, increasing orbital decay rates. Atmospheric drag isdirectly related to solar activity: High solar activity heatsthe upper atmosphere, increasing the atmospheric density by morethan 10 times the average density at most satellite altitudes.This exerts a greater braking force on satellites and causes anabove average number of objects to re-enter the atmosphere.(9)
Thus, satellites decay in much greater numbers near Sunspotmaximum than at a time of low solar activity (Figure 7-2).(10)
Hence, the 11 year sunspot cycle is a periodic natural "sink",removing orbiting satellites from the near-Earth environment andthereby increasing re-entry hazards.
7-6
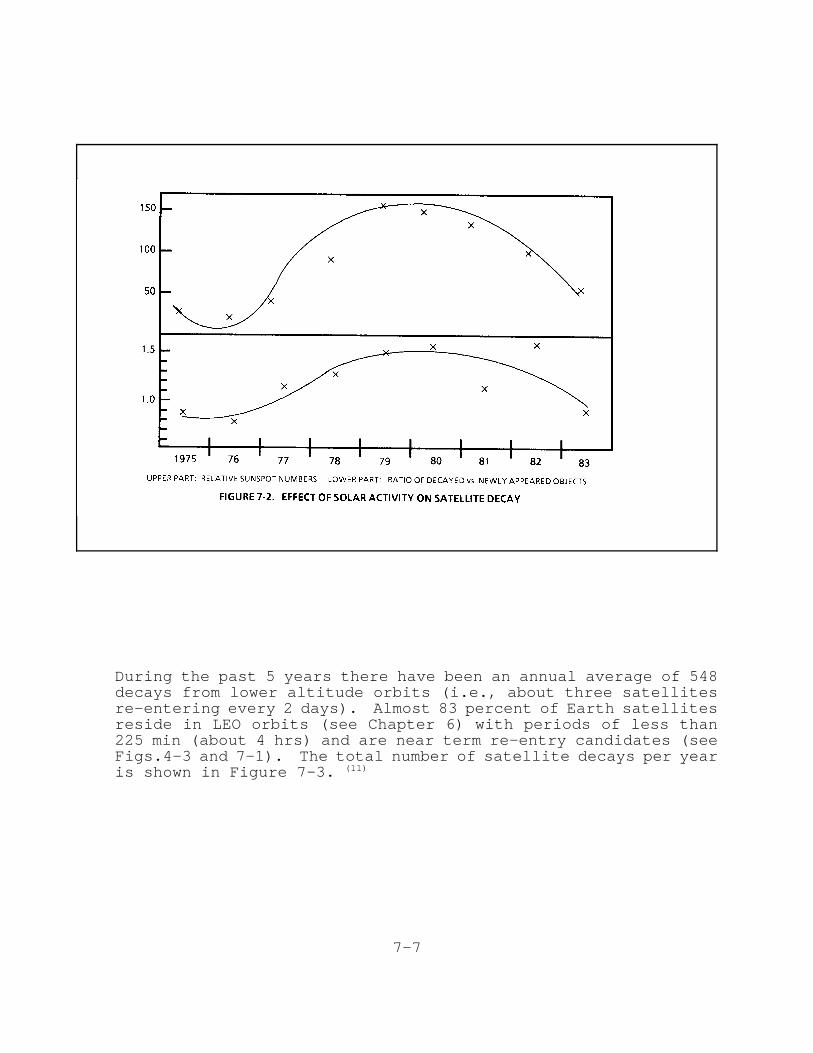
During the past 5 years there have been an annual average of 548decays from lower altitude orbits (i.e., about three satellitesre-entering every 2 days). Almost 83 percent of Earth satellitesreside in LEO orbits (see Chapter 6) with periods of less than225 min (about 4 hrs) and are near term re-entry candidates (seeFigs.4-3 and 7-1). The total number of satellite decays per yearis shown in Figure 7-3. (11)
7-7
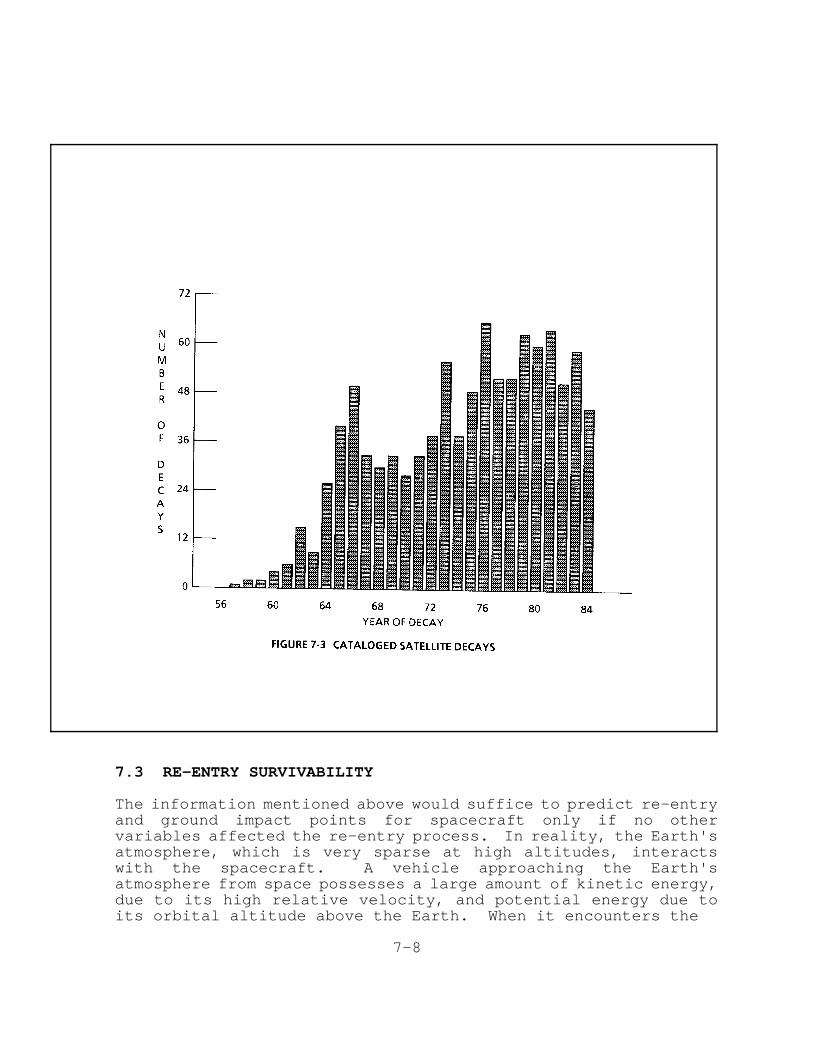
7.3 RE-ENTRY SURVIVABILITY
The information mentioned above would suffice to predict re-entryand ground impact points for spacecraft only if no othervariables affected the re-entry process. In reality, the Earth'satmosphere, which is very sparse at high altitudes, interactswith the spacecraft. A vehicle approaching the Earth'satmosphere from space possesses a large amount of kinetic energy,due to its high relative velocity, and potential energy due toits orbital altitude above the Earth. When it encounters the
7-8
atmosphere, a shock wave forms ahead of the vehicle, heating theatmosphere in this region to very high temperatures. The hightemperatures due to friction with atmosphere reduce the vehicle'svelocity and convert the vehicle's potential energy into heatabsorbed by the object and its wake. If the vehicle slows downquickly, the total amount of heat to be absorbed by the vehicleis reduced. This explains the blunt (high drag) shape of re-entering spacecraft in the pre-shuttle manned space program.However, the total heat generated in the shock wave is still toogreat to be absorbed by metals which heat up and melt.Therefore, since it takes significantly more heat to vaporizematerial than to heat or melt it, materials used in heat shieldswere designed to ablate (vaporize) in the presence of the extremetemperatures. The net effect is that ablative protection allowsobjects to survive re-entry.
If the total energy of the spacecraft were converted to heat, itwould vaporize the vehicle. The survival of meteorites to groundimpact is proof that not all of the energy is converted intoheat, but enough is converted to cause surface ablation.Actually, a large portion of the total energy is diverted awayfrom the vehicle. If the object conducted the heat away from theforward surface and the total body could absorb the heat of re-entry without breaking up, then the object would re-enter theEarth's atmosphere and descend to Earth in a predictable way.(12)
Heat shields and special shaping of forward surfaces are used tominimize frictional heating effects on the rockets and payloadsduring space launches, to protect them from heat and controlablation.
Surface heating effects depend on the vehicle's shape,composition, altitude and velocity. For re-entry at small anglesof inclination when the vehicle deceleration rate is small, thesurface heating rate is correspondingly small. For re-entry atlarge angles of inclination where the vehicle decelerates rapidlyin the atmosphere, the surface heating rate will be greater butthe time spent in the atmosphere will be shorter.(3)
Spacecraft which are not designed to survive re-entry generallydo not have ablative surfaces nor are they very stableaerodynamically. The usual sequence of events in the re-entryprocess is as follows:
1. As the vehicle starts to re-enter, heat is generated by theshock wave and a portion is absorbed by the surface of thestructure. As the structure heats up thermal energy isradiated out at a significantly lower rate than it is beingabsorbed.
2. The heated structure weakens and when the aerodynamic forcesexceed its structural strength, it starts to come apart.
7-9
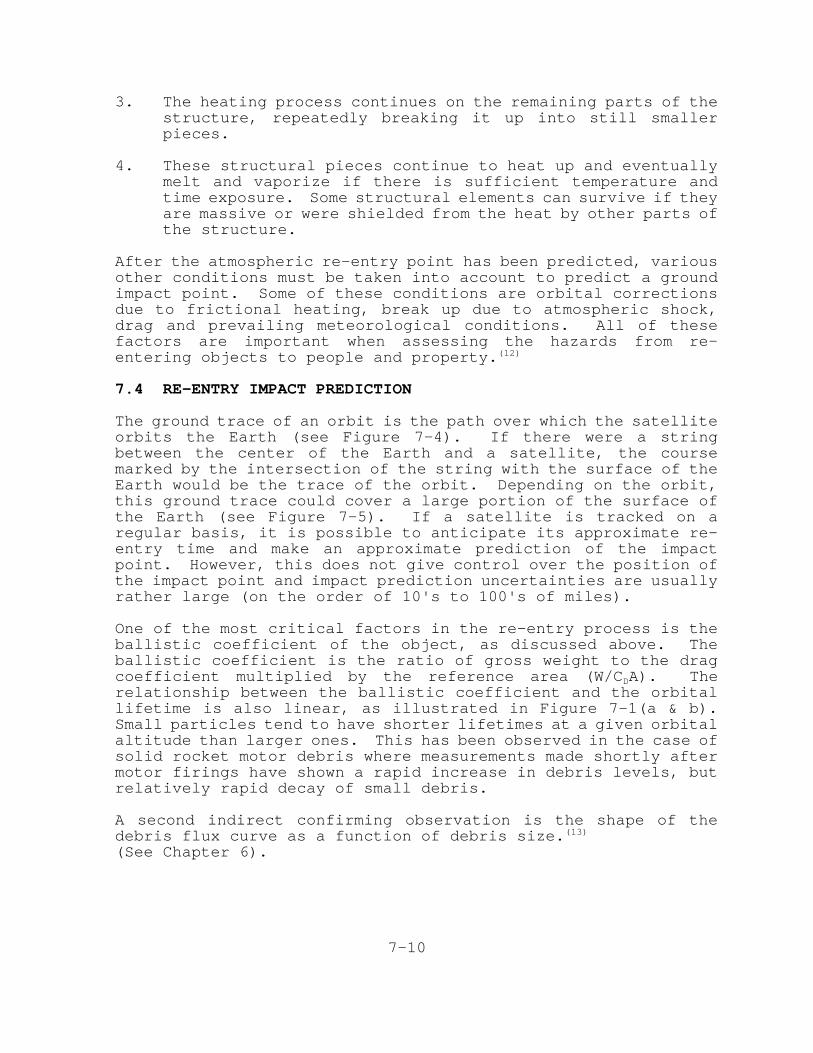
3. The heating process continues on the remaining parts of thestructure, repeatedly breaking it up into still smallerpieces.
4. These structural pieces continue to heat up and eventuallymelt and vaporize if there is sufficient temperature andtime exposure. Some structural elements can survive if theyare massive or were shielded from the heat by other parts ofthe structure.
After the atmospheric re-entry point has been predicted, variousother conditions must be taken into account to predict a groundimpact point. Some of these conditions are orbital correctionsdue to frictional heating, break up due to atmospheric shock,drag and prevailing meteorological conditions. All of thesefactors are important when assessing the hazards from re-entering objects to people and property.(12)
7.4 RE-ENTRY IMPACT PREDICTION
The ground trace of an orbit is the path over which the satelliteorbits the Earth (see Figure 7-4). If there were a stringbetween the center of the Earth and a satellite, the coursemarked by the intersection of the string with the surface of theEarth would be the trace of the orbit. Depending on the orbit,this ground trace could cover a large portion of the surface ofthe Earth (see Figure 7-5). If a satellite is tracked on aregular basis, it is possible to anticipate its approximate re-entry time and make an approximate prediction of the impactpoint. However, this does not give control over the position ofthe impact point and impact prediction uncertainties are usuallyrather large (on the order of 10's to 100's of miles).
One of the most critical factors in the re-entry process is theballistic coefficient of the object, as discussed above. Theballistic coefficient is the ratio of gross weight to the dragcoefficient multiplied by the reference area (W/CDA). Therelationship between the ballistic coefficient and the orbitallifetime is also linear, as illustrated in Figure 7-1(a & b).Small particles tend to have shorter lifetimes at a given orbitalaltitude than larger ones. This has been observed in the case ofsolid rocket motor debris where measurements made shortly aftermotor firings have shown a rapid increase in debris levels, butrelatively rapid decay of small debris.
A second indirect confirming observation is the shape of thedebris flux curve as a function of debris size.(13)
(See Chapter 6).
7-10
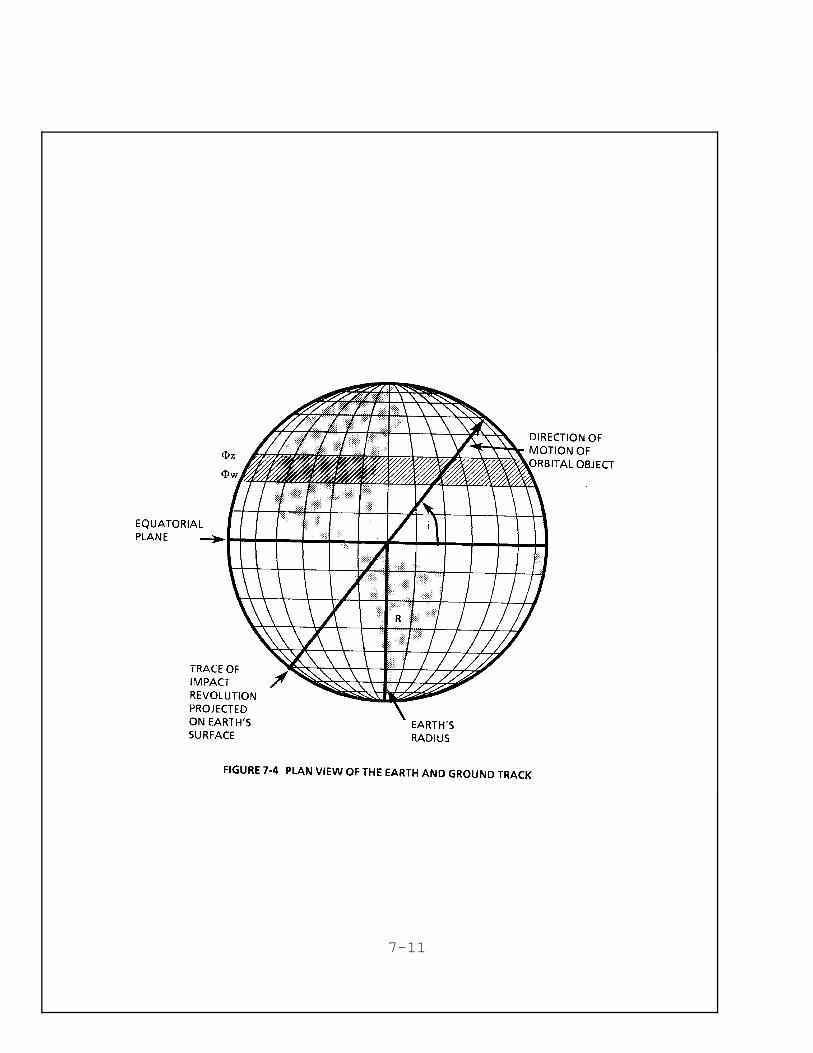
7-11
As a satellite re-enters the atmosphere it decelerates. Asdiscussed above, the deceleration rate is a function of manyvariables: entry angle, lift to drag ratio (L/D), the ballisticcoefficient, the orbital parameters, the Earth's rotation andoblateness, atmospheric density aberrations and winds. The entryangle and ballistic coefficient affect the chance that asatellite or debris object will survive re-entry and landing.The satellite may skip due to the lift caused by the object'sangle of attack upon entering the atmosphere, each skip
7-12
associated with a change in velocity, speed and entry angle. Asdiscussed in Chapter 4, every orbit has an angle of inclination,which along with the apogee and perigee, defines the trace of anorbit.
During re-entry the original orbital inclination of the satelliteremains relatively constant. This holds for the inclinationangle of pieces of the satellite that return separately as wellas pieces of a satellite which break up during re-entry. Thisnear consistency holds because the magnitude of the orbitalvelocity in the inclination plane is very large. A vertical(radial) change in velocity does not change the orbital angle ofinclination, but it changes the atmospheric entry angle (calledradiant). A change in the velocity component perpendicular tothe plane of the orbit may affect the angle of inclination, butthe magnitude of this change is minor compared to the magnitudeof the velocity in the orbital plane.
7.5 IMPACT DISPERSIONS
Most satellites to date have been inserted into orbit with littleor no consideration given to their eventual re-entry. Theprimary reason for this is that re-entering satellites are notlikely to result in hazardous impacts given that 2/3 of theEarth's surface area is covered by oceans. Most of the objectswhich re-enter are likely to fragment and burn up in the upperatmosphere and make only negligible changes in its chemicalcomposition. Even if an object does survive, only one third ofthe Earth is land area and only a small portion of this land areais densely populated, so the chance of hitting a populated landarea upon re-entry is relatively small.
There is no standard way of computing impact dispersionscurrently. The calculations are two-fold. Estimates must bemade for the number of pieces which will survive re-entry and thearea over which each piece could cause damage, the "casualtyarea." For each piece of debris that will survive re- entry, aman-border area is added to the representative area of eachincoming piece (see Volume 3, Chapter 10). The representativearea is the maximum cross section area of the re-entering pieceof debris. The man-border allowance is usually a ten inchaddition in the radius to allow for the center of a personstanding outside the actual impact radius but close enough to behurt.(16) The splatter and rebound of fragments from hard groundimpact must also be considered in these calculations.
7.6 RE-ENTRY HAZARD ANALYSIS
Most re-entering satellites and space debris are not controlledand the uncertainties of orbital decay are such that impact areascannot be determined. Re-entry risk estimation generally assumes
7-13
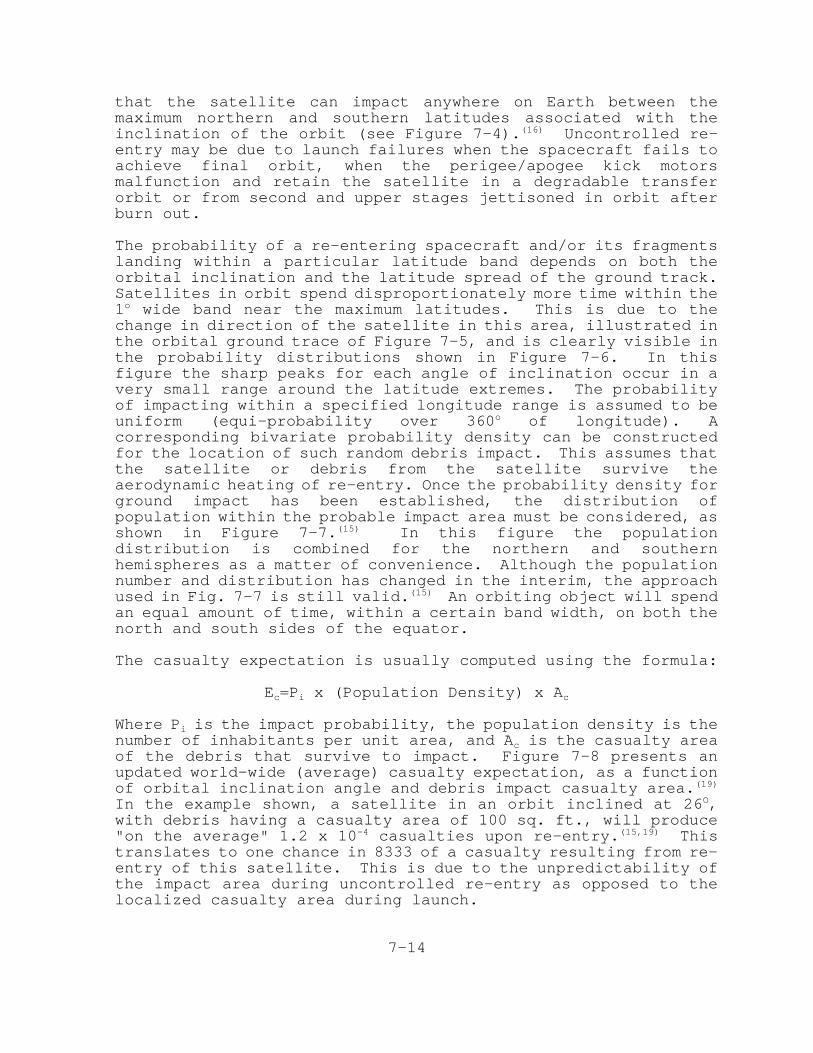
that the satellite can impact anywhere on Earth between themaximum northern and southern latitudes associated with theinclination of the orbit (see Figure 7-4).(16) Uncontrolled re-entry may be due to launch failures when the spacecraft fails toachieve final orbit, when the perigee/apogee kick motorsmalfunction and retain the satellite in a degradable transferorbit or from second and upper stages jettisoned in orbit afterburn out.
The probability of a re-entering spacecraft and/or its fragmentslanding within a particular latitude band depends on both theorbital inclination and the latitude spread of the ground track.Satellites in orbit spend disproportionately more time within the1o wide band near the maximum latitudes. This is due to thechange in direction of the satellite in this area, illustrated inthe orbital ground trace of Figure 7-5, and is clearly visible inthe probability distributions shown in Figure 7-6. In thisfigure the sharp peaks for each angle of inclination occur in avery small range around the latitude extremes. The probabilityof impacting within a specified longitude range is assumed to beuniform (equi-probability over 360o of longitude). Acorresponding bivariate probability density can be constructedfor the location of such random debris impact. This assumes thatthe satellite or debris from the satellite survive theaerodynamic heating of re-entry. Once the probability density forground impact has been established, the distribution ofpopulation within the probable impact area must be considered, asshown in Figure 7-7.(15) In this figure the populationdistribution is combined for the northern and southernhemispheres as a matter of convenience. Although the populationnumber and distribution has changed in the interim, the approachused in Fig. 7-7 is still valid.(15) An orbiting object will spendan equal amount of time, within a certain band width, on both thenorth and south sides of the equator.
The casualty expectation is usually computed using the formula:
Ec=Pi x (Population Density) x Ac
Where Pi is the impact probability, the population density is thenumber of inhabitants per unit area, and Ac is the casualty areaof the debris that survive to impact. Figure 7-8 presents anupdated world-wide (average) casualty expectation, as a functionof orbital inclination angle and debris impact casualty area.(19)
In the example shown, a satellite in an orbit inclined at 26O,with debris having a casualty area of 100 sq. ft., will produce"on the average" 1.2 x 10⁻⁴ casualties upon re-entry.(15,19) Thistranslates to one chance in 8333 of a casualty resulting from re-entry of this satellite. This is due to the unpredictability ofthe impact area during uncontrolled re-entry as opposed to thelocalized casualty area during launch.
7-14
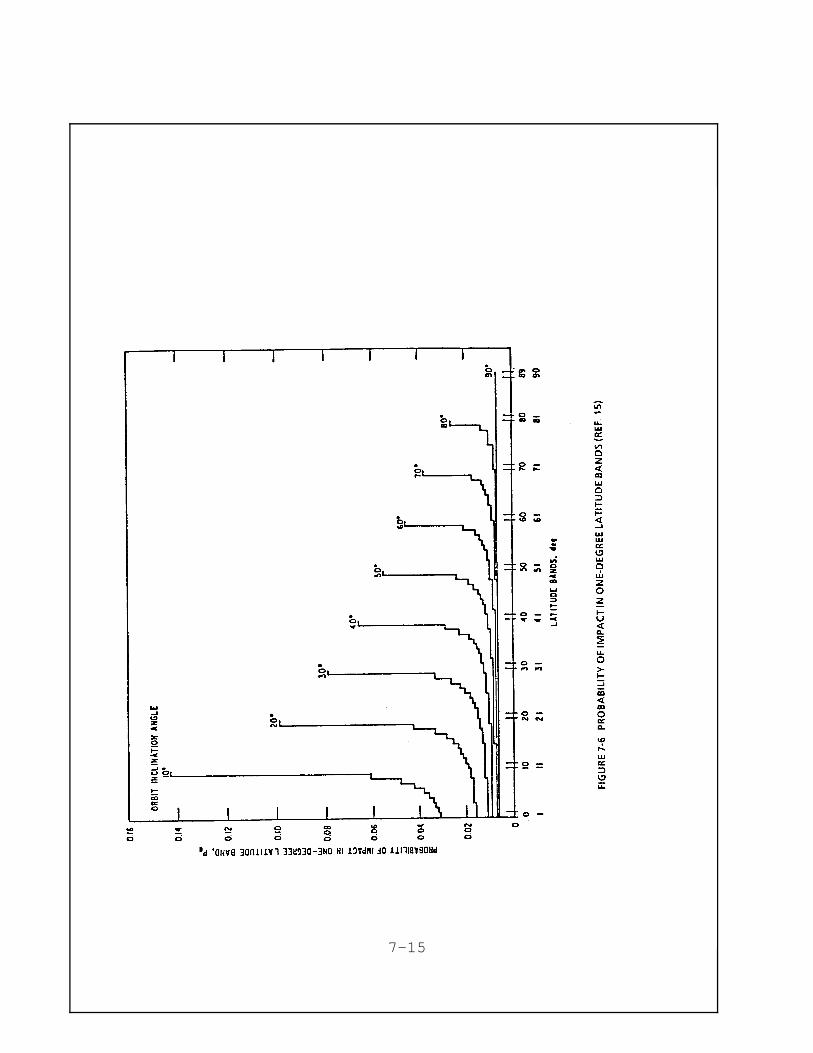
7-15
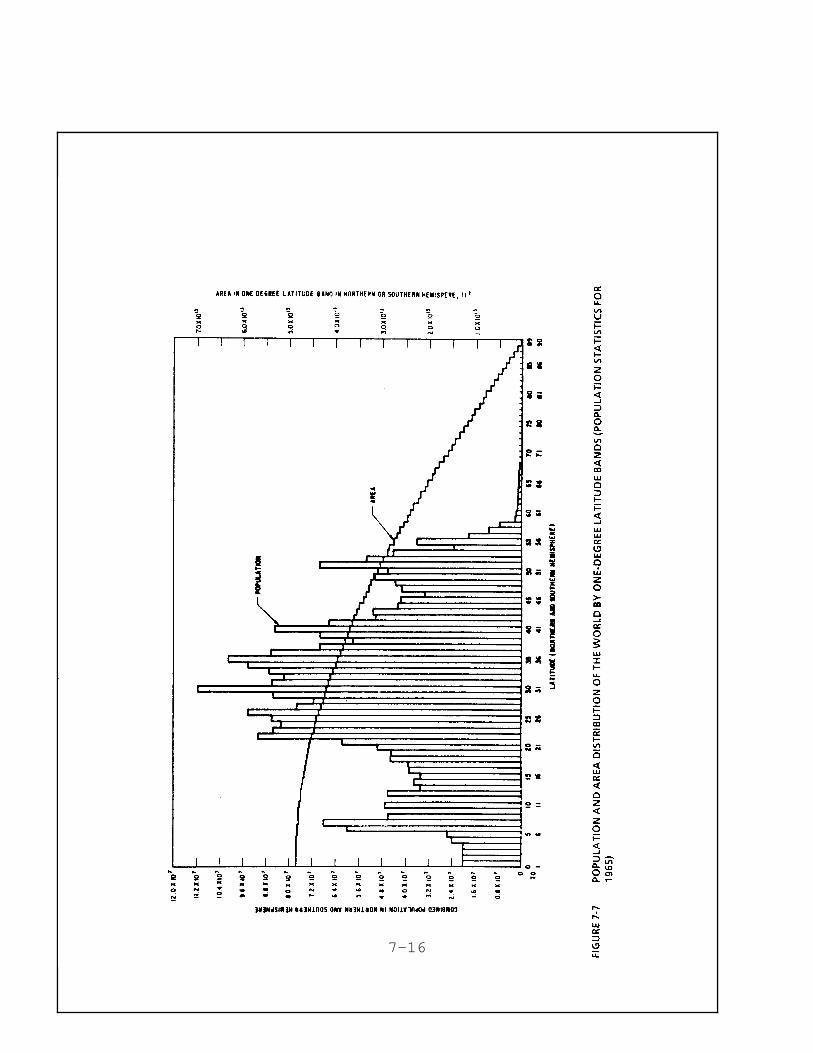
7-16
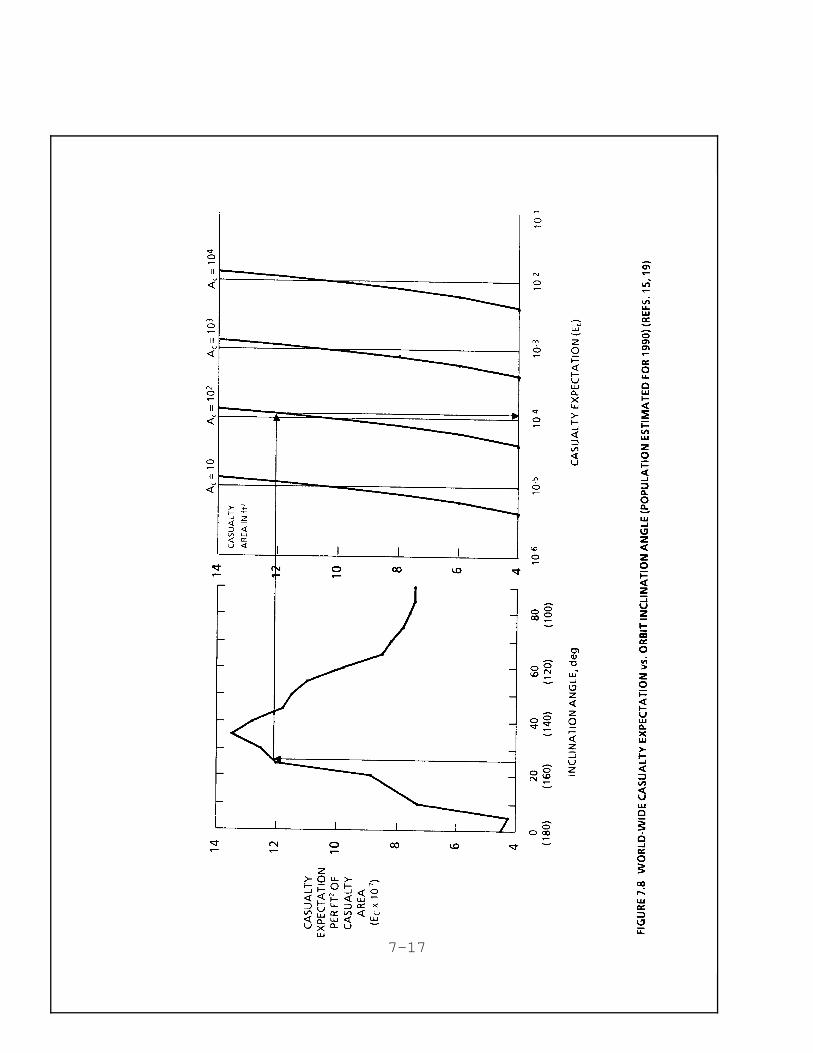
7-17
With no control over the time and location of re-entry, impactcould occur in any country between the latitudes of ± 26O.(16,18)
Up to now, there have been no reported land impacts, damageand/or casualties by re-entry debris.(20) Roughly 100 of theapproximately 3,100 objects resulting from 44 launches between1956-1972 have survived re-entry and were recovered.(20)
Identified re-entry debris include such diverse items as: tankpieces, nozzle pieces, small spherical gas tanks, plastic shroudsand other fragments.(20)
Particular re-entry hazards to the public are posed by orbitingnuclear payloads. Since 1961, both the US and the Soviet Unionhave launched nuclear power cells into space (See Table 7-1).While there have been no commercial payloads with nuclearmaterials, it is important to discuss generic re-entry hazards ofthis type. To date , such missions have required detailed riskanalysis and interagency review. However, the US has launchedpassive, naturally decaying nuclear fuel cells, while the USSRhas orbited RORSAT satellites with active nuclear reactors atrelatively low altitudes in orbits which decay in a matter ofdays to weeks. Twenty eight such Soviet nuclear satellites werelaunched between 1967 and 1985, each carrying roughly 50 kg ofU235. Of these, 26 have been transferred successfully into higheraltitude parking orbits (over 900 km) at their end of duty topermit decay of radionuclides before re-entry. However, at leastsix have failed and undergone uncontrolled re-entry andatmospheric break up, one showering debris over N. Canada in 1978and two others over the Indian Ocean in 1983 and 1987. Incontrast, the US nuclear fuel cells are designed to surviveatmospheric re-entry and impacts. Three radio-isotope thermalgenerator (RTG) power supplies accidentally re-entered as aresult of launch and/or orbital insertion failures (in 1964,1968and 1970); no undue public exposure to radioactivity resultedfrom any of these.(14)
Although the possibility of a satellite landing in a populatedarea is small, the hazards are real and in certain instances,potentially very serious. Cosmos 954, the Soviet nuclearsatellite that scattered nuclear debris over Canada upon re-entryand caused over $12 million in damages and cleanup costs is oneexample of a potentially serious re-entry hazard.(21) Fortunately,several other failed or deactivated Soviet RORSAT and US nuclearsatellites have returned over oceans (Table 7-1). Issues relatedto re-entry hazards are currently under active re-examination andare undergoing research.
7-18
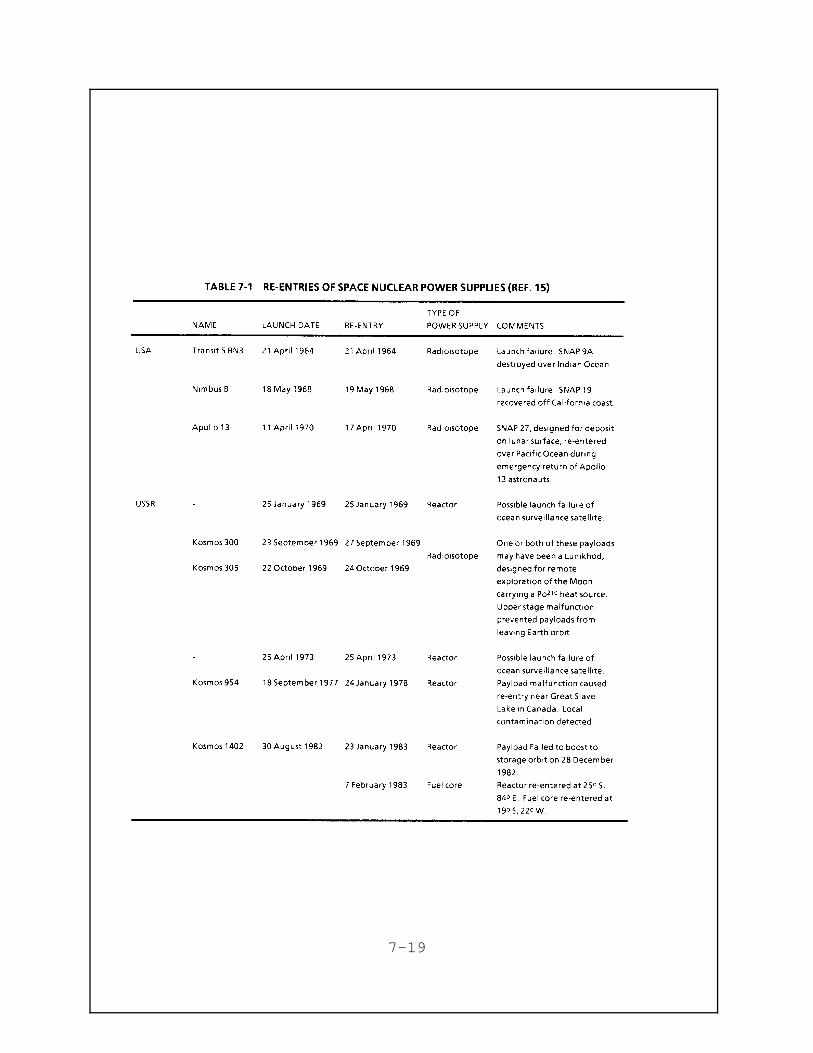
7-19
REFERENCES TO CHAPTER 7
1. a)Dictionary of Technical Terms for Aerospace Use, 1965b)Hazard, Hap, "US Space Launch Systems," Navy Space Systems(Report NSSA-R-20-72-2), 2nd Rev., 1977.
2. "Space Flight and Re-entry Trajectories," Proc.International Symposium of International Academies ofAstronautics and IAF, Louveciennes, June 1961 (Springer -Verlag, 1962).
3. Loh, W. H. T., Dynamics and Thermodynamics of PlanetaryEntry, Prentice Hall, Inc., Englewood Cliffs, NJ, 1963.
4. a)Oberg, James E., "Eyes on the Sky," Air & Space, ,April/May 1987.b)Howell, J. A., "The Challenge of Space Surveillance," Skyand Telescope, pp.584-588, June 1987.
5. Johnson, N. L. and D.S. McKnight, "Artificial Space Debris,"(Orbit Book Co., Malabar, FL, 1987).
6. Alford, R.L., and J.J. Lin, "The Orbital Decay and Lifetime(LIFTIM) Prediction Program," Northrop Services, Inc. forNASA/Marshall, May 1974.
7. Kling, R., "Evolution of an On-Orbit Debris Cloud," Adv. inSpace Research, Vol.6, No.7, pp.99-108, 1986.
8. Appendix on "History and Projections of Foreign SatelliteMass to Orbit," to Special Report of the USAF ScientificAdvisory Board, Ad Hoc Committee on Current and PotentialTechnology to Protect AF Space Missions from Current andFuture Debris, 1987.
9. Kessler, D. J., "Orbital Debris Issues," NASA/Johnson SpaceCenter, Houston, TX 77058, Adv. in Space Research Vol.5, No.2, pp.3-10, 1985.
10. Schnel, L., "Probability of Collisions of Artificial Bodiesin the Earth Environment," Adv in Space Research, Vol.5,No.2, pp.21-24, 1985.
11. Johnson, N. L.,"Space Background Environment Assessment,"Teledyne Brown Report CS86-USASDC-0022 for NASA/JohnsonSpace Center and US Army Strategic Defense Command, Sept.1986.
7-20
12. a)Loh, W. H. T., Re-entry and Planetary Entry Physics andTechnology / 1, Springer-Verlag New York Inc., NY, 1968.b)De Lafontaine, J., "Orbital Decay in a DynamicAtmosphere,"UTIAS- 244, Toronto University, Canada, 1979.c)Longuski, J.M., "Analytic Theory of Orbit Contraction andBallistic Entry into Planetary Atmospheres," for NASALangley Research Center, N 80-33448, by Jet Propulsion Lab,(JPL 80-58), Sept. 1980.
13. Fischer, N. H. and Reynolds R. C., "Threat of Space Debris,"Battelle Columbus Laboratories, 1984.
14. Johnson, N.L., "Nuclear Power Supplies in Orbit," SpacePolicy, Aug 1986, pp.223-233.
15. Burruss, J.M., and O.A. Refling, "Implementation of a SafetyPolicy Related to Random Re-entry Hazards," AerospaceCorporation (Report No. TOR-0158(3301)-1), Nov. 1967.
16. a)Klapman, G., and J. Burruss, "Hazards Associated withRandom Re-entry of Satellites Decaying from Orbit,"Aerospace Corporation (Report No. TOR-1001(2301)-1), March 1967.b)Klapman, G., "Random Re-entry Hazard Calculations forTitan IIIC (STC) Flight Plans VIID and VIIE," AerospaceCorporation, Report No. TOR- 0059(6112-50)-5, June 1971.c)Burrus, J.M., "Generalized Random Re-entry HazardEquations," Aerospace Corporation, Report No. TOR-0066(5301-02)-1, Oct. 1971.
17. "NASA Satellite Situation Report," the July 1 to Sept. 30,1987 Reporting Period, September 30, 1987.
18. "Titan CELV/IUS Range Safety Flight Plan Approval Request,"Martin Marietta, CTI-88-1035, June 1986.
19. "Report of the Delta 181 Orbital Safety Review Committee,"Dec. 1987.
20. "Convention on International Liability for Damage Caused bySpace Objects - Analysis and Background Data," May, 1972,Staff Report 75-871, Senate Comm. Aeronautical and SpaceSciences, US Congress.
7-21
10/2/95 rev 8. RISK ANALYSIS METHODOLOGY
8.1 WHAT IS RISK ANALYSIS?
Risk Analysis is the technical process and procedures foridentifying, characterizing, quantifying and evaluating hazards.It is widely used in industry and by federal agencies to supportregulatory and resource allocation decisions. The analysis ofrisk, also called Risk Assessment (see definitions of terms inCh.1 and in the Glossary, App. A), consists of two distinctphases: a qualitative step of hazard identification,characterization and ranking; and a quantitative risk evaluationentailing estimation of the occurrence probabilities and theconsequences of hazardous events, including catastrophic ones.Following the quantification of risk, appropriate Risk Managementoptions can be devised and considered, risk/benefit or costanalysis may be undertaken and Risk Management policies may beformulated and implemented. The main goals of Risk Managementare to prevent the occurrence of accidents by reducing theprobability of their occurrence (e.g., practice risk avoidance),to reduce the impacts of uncontrollable accidents (e.g., prepareand adopt emergency responses) and to transfer risk (e.g., viainsurance coverage). Most personnel safety andoperational/handling precautions and requirements at hazardousfacilities (and hardware design reviews and approval for plantsand critical equipment) are intended to prevent, reduce thefrequency or probability of occurrence of hazardous events and tominimize their potential impacts.
Both normal operations and unforeseen conditions can lead toaccidents which cannot be prevented or controlled. In suchcases, the residual risk must be accepted and managed bypreparing emergency response procedures (e.g., evacuation andmedical response plans) to lessen the consequences of suchaccidents. Deterministic and worst case scenario analyses areoften used to assess the scope and exposure impacts of improbablehazardous events with high consequences.
Several recent reports have discussed the role of technical riskassessment inputs to regulatory analysis and policy decisionmaking.(1-3) Since Risk Assessment is a field where safety andloss prevention are the chief concerns, conservatism at varioussteps in the analysis has often been adopted as a prudentapproach. Thus, conservative assumptions have been compoundedsometimes in setting unnecessarily stringent regulatory standardsand requirements. In practice, excessive conservatism and use of"worst case" analysis has served as a basis for over-design ofcritical facilities, and over-regulation of industry by settingunnecessarily strict license and permit requirements.(4,5) Severalmission Agencies (such as DOD, NASA, DOE, EPA, USBM, OSHA, NIH,
8-1
NRC) have developed their own risk analysis tools to carry outstudies either in support of regulatory standards, criteria andpolicies or to enable safe operations. For the past few years,an Interagency Task Force for Risk Assessment, led by the NSF,has been working on uniform standards, to the extent possible andpractical, for risk analysis methods and their use by federalAgencies charged with protecting the safety and health of theworkers and the public. Some of these tools and approaches,whether developed specifically for space applications (Ch.9) orfor licensing decisions (e.g., NRC regulations and studies),(8,15,16)
are transferable to DOT/OCST for regulation and oversight ofcommercial launch activities.
Risk Assessment provides the information necessary for RiskManagement decisions. Risk Management, in a regulatory context,requires the evaluation of the impact and effectiveness of safetystandards and regulations to impose additional controls or relaxexisting ones.
8.2 RISK PERCEPTION AND RISK ACCEPTABILITY
Subjective judgment and documented societal bias against lowprobability/high consequence events may influence the outcome ofa risk analysis. Perceptions of risk often differ from objectivemeasures and may distort or politicize Risk Management decisionsand their implementation. Public polls indicate that societalperception of risk for certain unfamiliar or incorrectlypublicized activities is far out of proportion to the actualdamage or risk measure (by factors of 10-100 greater than realityfor motor, rail and aviation accidents, but by factors of >10,000 for nuclear power and food coloring).(14) Risk conversion andcompensating factors must often be applied to determine risktolerance thresholds accurately to account for public biasagainst unfamiliar (x 10), catastrophic (x 30), involuntary (x 100), immediate vs. delayed consequence (x 30) and theuncontrollable (x 5-10) risk exposure.(17)
Different risk standards often apply in the workplace, in view ofvoluntary risk exposure and indemnification for risk to exposedworkers; as opposed to public risk exposure where stricterstandards apply to involuntary exposure. The general guide towork place risk standards is that occupational risk should besmall compared to natural sources of risk. Some industrial andvoluntary risks may be further decreased by strict enforcement oradequate implementation of known risk management and riskavoidance measures (e.g., wear seat belts, stop drinking alcoholor smoking). Therefore, some of these risks are controllable bythe individual (e.g., do not fly, take the car to work or smoke),while others are not (e.g., severe floods, earthquakes andtsunamis).
8-2
Relative Risk Assessment is a common method of ranking riskexposure levels which enables decision makers to defineacceptable risk thresholds and the range for unacceptably highexposure that would require Risk Management resources forreduction and prevention. As Figure 8-1 and Table 8-1illustrate, there are de facto levels of socially tolerated(acceptable) levels of risk for either voluntary or involuntaryexposure to a variety of hazardous factors and activities.Although regulators often strive to assess absolute levels ofrisk, the relative ranking of risks is an appropriate RiskManagement strategy for resource allocation towards regulatorycontrols. Cost benefit analysis is often required to bring theburdens of risk control strategies to socially acceptable levels.Figure 8-1 and Tables 8-1 and 8-2 show estimated risk levelsassociated with natural and other (occupational, transportation,etc.) hazards that may lead to undesirable health effects andcasualties. They show that risk levels vary greatly by causes ofharm (chemical, mechanical, natural or man made), probability,degree of control, duration of exposure to the consequence(immediate, delayed, short or long-term), distribution(geographical, localized) in time and space, benefit to societyvs. costs of risk reduction and consequence mitigation.
Table 8-1 shows the relative risk exposure to individuals as acasualty probability from various natural and regulated causes.(19)
This table and its precursors in the literature(6,17) illustratethat the public voluntarily assumes risk levels which are 100 to1,000 times larger than involuntary exposures to natural hazardsand normal activities. These levels may be used as indicators ofsocially acceptable risk thresholds to compare when newregulatory standards are set. Note that risk exposure isnormalized both to the population exposed and to the duration ofthe exposure. To compare the risk associated with each cause,consistent units must be used, such as fatalities or dollar lossper year, per 100,000 population, per event, per man year ofexposure, etc.
Issues related to acceptable risk thresholds for regulatorypurposes and for the public at large are often complex andcontroversial.(1- 5,17,19) The typical approach to establish riskacceptance criteria for involuntary risks to the public has beenthat fatality rates from the activity of interest should neverexceed average death rates from natural causes (about 0.07 per100,000 population, from all natural causes) and should befurther lessened by risk control measures to the extent feasibleand practical.(13)
The societal benefit and the cost trade-offs for risk reductionare widely used guides to set and justify risk acceptabilitylimits. By comparing the risks and benefits associated withcertain regulated activities, fair, balanced and consistent
8-3
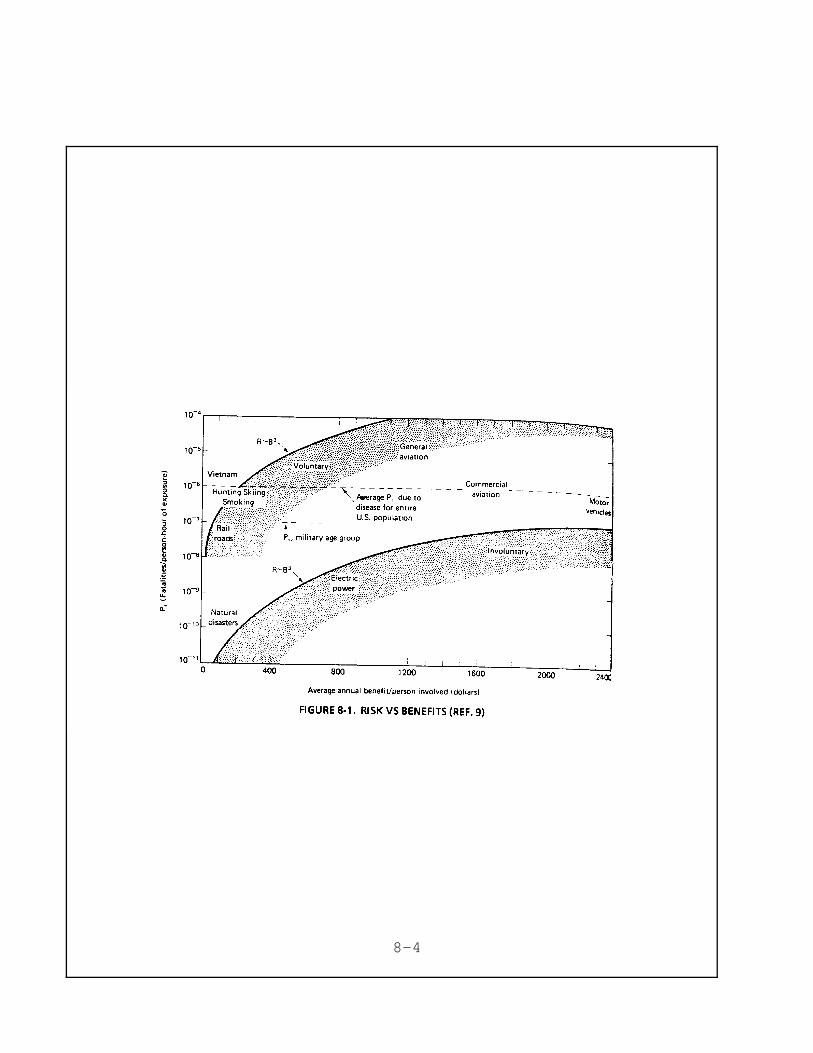
8-4
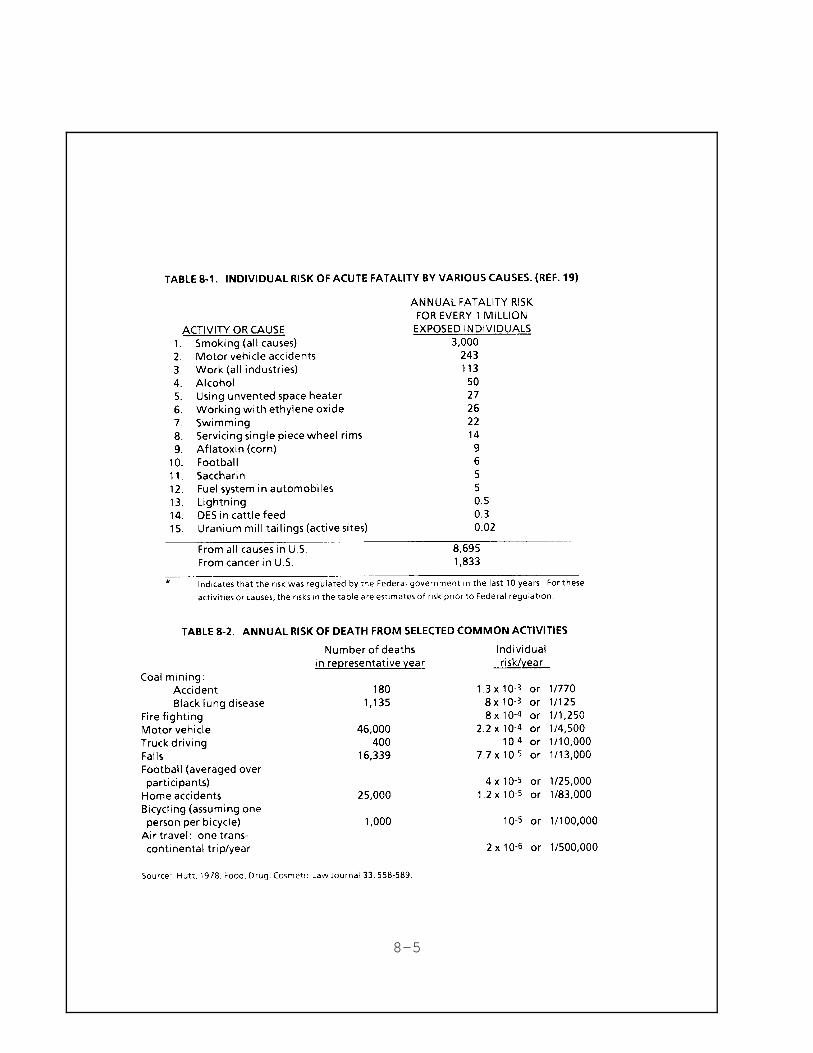
8-5
limits for risk acceptability may be set and institutionalcontrols on risk may be established. Figure 8-1 is based onRef.9: Starr's 1969 risk benefit analysis, which, although laterchallenged in the literature, illustrates several general trendsderived from an analysis of fatalities per person hour ofexposure to natural hazards and to hazardous human activities, interms of dollar-equivalent benefit to society. It appears thatvoluntarily assumed risk levels are a factor of about 1,000higher than involuntary risk exposure levels over the entirerange of benefits. Also, the acceptable risk curve appears tovary as the cube power of the benefit, on this log-normal scale.
A typical regulatory risk threshold used to institute controls isthe one-in-a-million casualty probability.(17) Situations at thisthreshold include: traveling 60 miles by car or 400 miles by air,two weeks of skiing, 1.5 weeks of factory work, 3 hours of workin a coal mine, smoking one cigarette, 1.5 minutes of rockclimbing and 20 minutes of being a man aged 60.
By analogy with other industries, in the case of spaceoperations, Range personnel and commercial launch service firmsmay be considered voluntary risk takers, while the public atlarge is involuntarily exposed to launch and overflight risks.While Range Safety and on-site Range personnel are highly trainedin risk avoidance and management, the public must be exposed toonly minimal risk from commercial launch activities.
There are clear but indirect public, economic and other societalbenefits derived from commercial space operations, includingefficient telephone and video communications, weatherforecasting, remote environmental sensing and crop data, betterdrugs, advanced material fabrication, superior navigationcapability and other technology spin-offs. Based on the riskcomparability approach illustrated in Ch. 5 (Vol. 2) and theRange Safety controls and practices (Chs. 2, Vol. 1 and 9, 10),commercial launch activities appear to be well within thesocially acceptable risk limits at this time.
8.3 EXPECTED RISK VALUES AND RISK PROFILES
There are two fundamental components of Risk Analysis:
• Determination of the probability, Pi (or frequency ofoccurrence, fi), of an undesirable event, Ei. Theprobability of an event is its likelihood of occurrenceor recurrence. Sometimes the probability estimates aregenerated from a detailed analysis of past experienceand historical data available; sometimes they arejudgmental estimates on the basis of an expert's view
8-6
of the situation or simply a best guess. Thisquantification of event probabilities can be useful,but the confidence in such estimates depends on thequality of the data base on actual failures and themethods used to determine event probabilities.Probabilities have long been used in the analysis ofsystem reliability for complex equipment and facilitiesand to anticipate and control various failurescenarios.
• Evaluation of the consequence, Ci, of this hazardousevent: The choice of the type of consequence ofinterest may affect the acceptability threshold and thetolerance level for risk.
The analytical phase of a Risk Analysis generally consists ofthree steps:(10) The triad: event (scenario), probability andconsequence is sometimes called the "Risk Triplet."
1. The qualitative step involves the selection of specifichazardous reference events Ei (hazard identification)or scenarios (chains of events) for quantitativeanalysis.
2. The quantitative analysis requires the estimation ofthe probability of these events, Pi.
3. The next quantification step is to estimate of theconsequences of these events, Ci.
The results of the analytical phase are used in the interpretivephase in which the various contributors to risk are compared,ranked and placed in perspective. This interpretive phaseconsists of:
4. The calculation and graphic display of a Risk Profilebased on individual failure event risks. The processis presented in Figure 8-2.
5. The calculation of a total expected risk value (R) bysumming individual event contributions to risk (Ri).
Naturally, all the calculations undertaken involve someuncertainties, approximations and assumptions. Therefore,uncertainties must be considered explicitly. Using expectedlosses and the risk profile to evaluate the amount of investmentthat is reasonable to control risks, alternative Risk Managementdecisions involving avoidance (i.e. probability decrease) orconsequence mitigation can be evaluated in terms that are usefulto the decision maker.
8-7
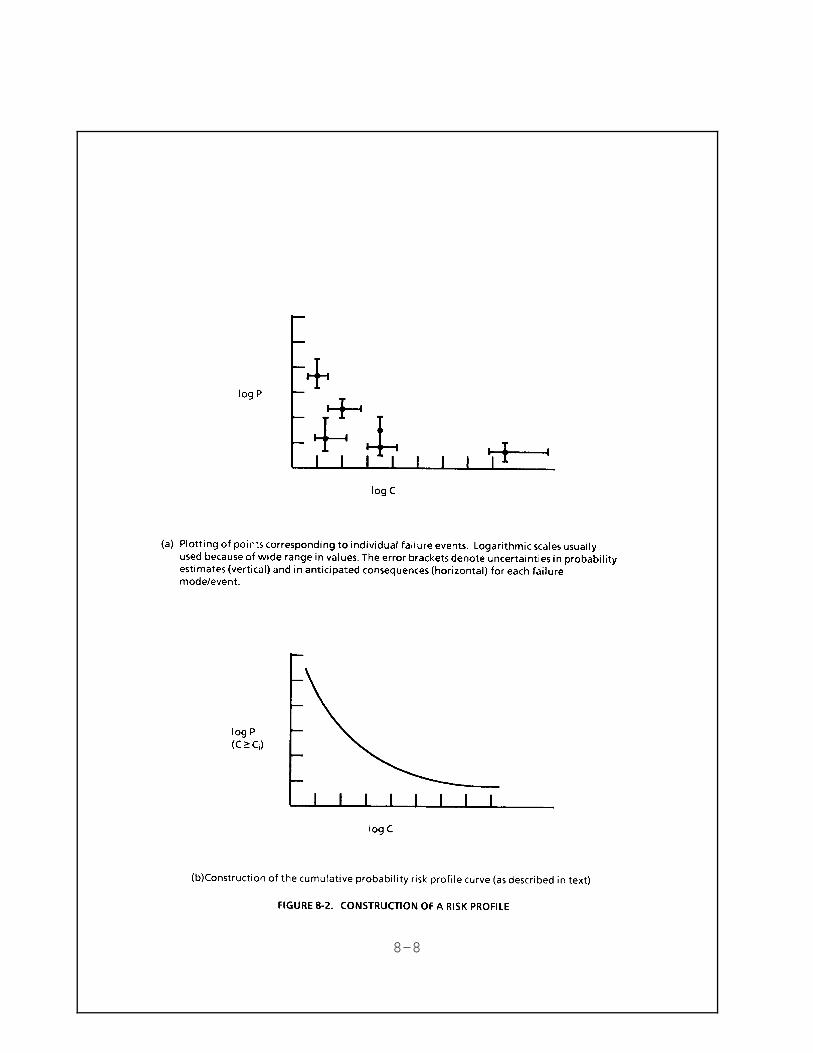
8-8
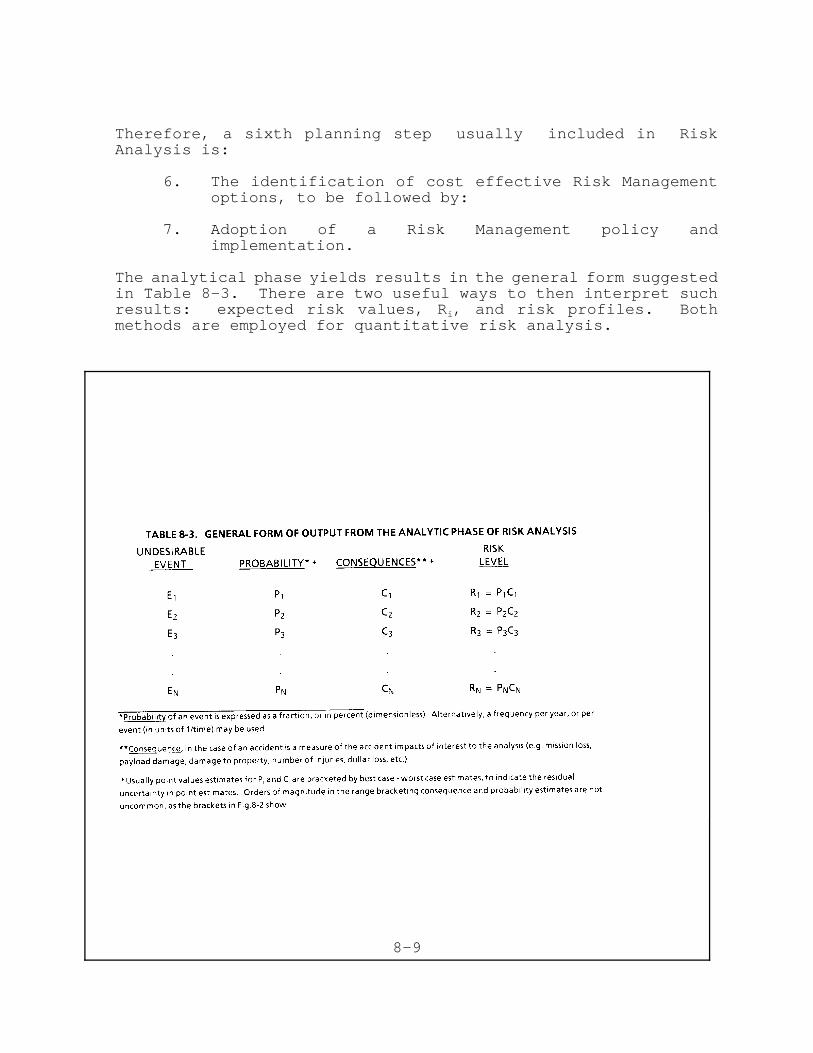
Therefore, a sixth planning step usually included in RiskAnalysis is:
6. The identification of cost effective Risk Managementoptions, to be followed by:
7. Adoption of a Risk Management policy andimplementation.
The analytical phase yields results in the general form suggestedin Table 8-3. There are two useful ways to then interpret suchresults: expected risk values, Ri, and risk profiles. Bothmethods are employed for quantitative risk analysis.
8-9
Expected values are most useful when the consequences Ci aremeasured in financial terms or other directly measurable units.The expected risk value Ri (or expected loss) associated withevent Ei is the product of its probability Pi and consequencevalues:
R i= PixCi
Thus, if the event occurs with probability 0.01 in a given year,and if the associated loss is one million dollars, then theexpected loss is:
Ri= 0.01 x $1,000,000 = $10,000
Since this is the expected annual loss, the total expected lossover 20 years (assuming constant $) would be roughly $200,000.This assumes that the parameters do not vary significantly withtime and ignores the low probability of multiple losses over theperiod. To obtain the total expected loss per year for a wholeset of possible events, simply sum the individual expectedlosses:
Total Risk, RT = PiCi+P2C2+ . . +PNCN =
This expected risk value assumes that all events (Ei)contributing to risk exposure have equal weight. Occasionally,for risk decisions, value factors (weighting factors) areassigned to each event contributing to risk. The relative valuesof the terms associated with the different hazardous events givea useful measure of their relative importance and the total riskvalue can be interpreted as the average or "expected" level ofloss to be experienced over a period of time. One particular wayin which it is used is to compare it to the cost of eliminatingor reducing risk (i.e., as part of the Risk Management strategy)in the context of cost/benefit analysis. Expected values of risk(R) are of prime importance in both business and in regulatorydecision making under complex and uncertain situations.
Based on the definition of expected values, if event E2 has tentimes the consequences of event E1 but only one tenth thelikelihood, then the products R1 = P1C1 and R2 = P2C2 are equal.That is, the events have the same expected level of risk. Thus,expected risk levels provide a balance of probabilities andconsequences. In mathematical terms, the expected values may be
8-10
similar, but the low probability, high consequence event may beof greater concern.(11,12) For example, a company may be preparedto sustain a steady level of relatively small losses oraccidents, but is concerned with guarding against trulycatastrophic events. This is the motivation behind RiskManagement, although, in all cases a range of consequences may beof interest. Determining the point estimates for best and worstcase Ri will produce limiting values for the risk estimates andyield a band of uncertainty in risk level.
A common way to interpret the values of probabilities andconsequences of different hazardous events is by means of a RiskProfile. This displays the probability distribution foraccidents and the range of their severity as a function oflikelihood. If sufficient accident data exist, the cumulativeprobability distribution function is used as a Risk Profile toshow the probability of damages at a given level or greater.Figure 8-3 shows an example of a hypothetical Risk Profile forcommercial launch operations. A point (Pi, Ci) on the curve canbe interpreted to mean there is a probability, Pi, of an accidentwith a consequence at least as large as Ci. Given a set ofordered pairs (Pi, Ci) obtained during the analytic phase of arisk study, the actual Risk Profile is computed using the laws ofprobabilities and combinatorial analysis. For actual cases, therisk profile is usually constructed by drawing the lowestdecreasing curve so that all the points with C ≤ Ci are on orbelow it. The separate hazardous events with consequences Ci ≤ Care combined into a single event with a probability equal to thesum of their individual probability values (i.e., theircumulative probability). Then, the ordinate value Pi in Figures8-2 and 8-3 indicates the probability of an event, Ei, with aconsequence as large as or exceeding Ci (C ≥ Ci). Theacceptability ranges for risk must be determined and regulatoryrisk targets must be set consistent with these acceptable riskthresholds. These goals are often set according to ALAP (as lowas practical), BAT (best available technology), BPT (bestpractical technology) or the cost of risk reduction.(17) Therelative risk reduction achieved by various controls is alsodisplayed on the Risk Profile to indicate the merit andeffectiveness of potential regulatory risk reduction measures.
8-11
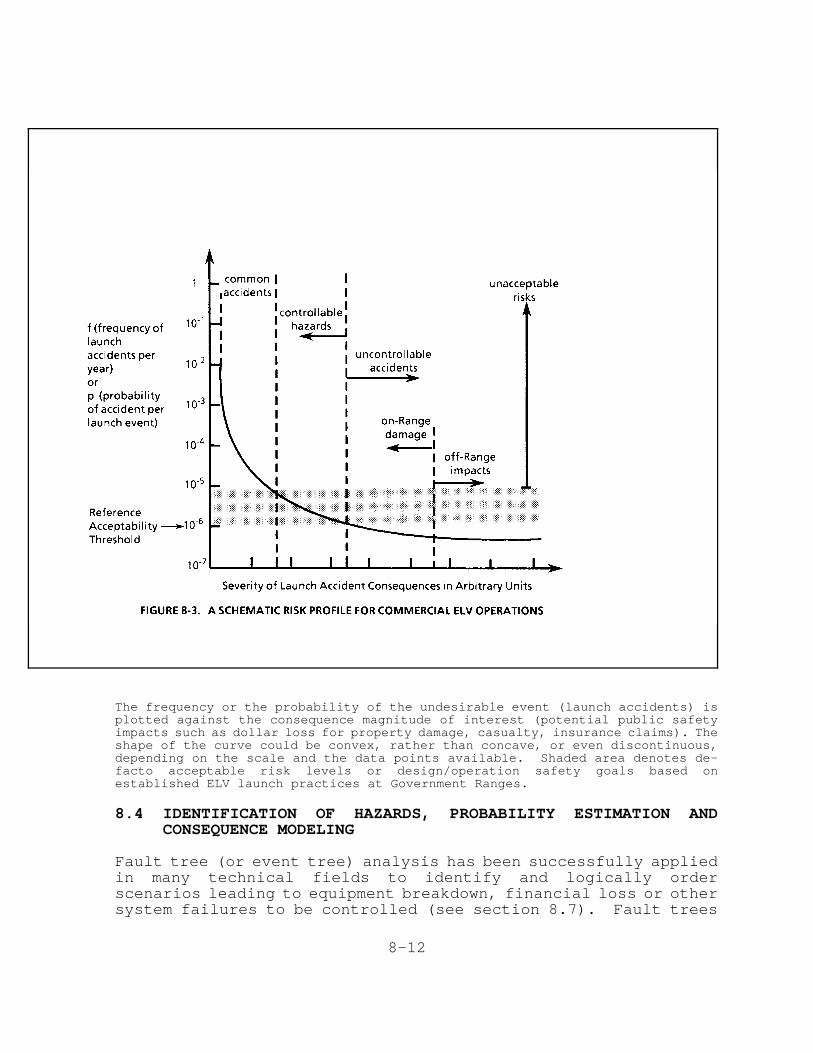
The frequency or the probability of the undesirable event (launch accidents) isplotted against the consequence magnitude of interest (potential public safetyimpacts such as dollar loss for property damage, casualty, insurance claims). Theshape of the curve could be convex, rather than concave, or even discontinuous,depending on the scale and the data points available. Shaded area denotes de-facto acceptable risk levels or design/operation safety goals based onestablished ELV launch practices at Government Ranges.
8.4 IDENTIFICATION OF HAZARDS, PROBABILITY ESTIMATION ANDCONSEQUENCE MODELING
Fault tree (or event tree) analysis has been successfully appliedin many technical fields to identify and logically orderscenarios leading to equipment breakdown, financial loss or othersystem failures to be controlled (see section 8.7). Fault trees
8-12
have been applied occasionally to problems associated with spacelaunches, mission planning and approval (Chapters 9 and 10).This results in an extensive set of analyses of the potentiallaunch failure events and consequences.
Consequences of observed or anticipated accidents are oftenmodeled by extrapolation from small scale tests, limitedobservations, simulations and scoping calculations. The goal ofquantitative risk assessment is not only to identify and rankhazards, but to analyze the low probability events of highconsequence. This can focus corrective action, improvemanagement of risk factors and optimize resource allocation.These extreme events are feared most by both public andregulators. They are often used as "worst case scenarios" orextreme "catastrophic" failures that serve as the basis forconservative design and regulatory requirements.(11,12)
However, catastrophic failures are seldom observed. Therefore,their probability of occurrence and consequences are uncertainand difficult to quantify. The Three Mile Island nuclear reactoraccident was this type of rare event. It occurred after 500reactor years without a significant accident, yet wasqualitatively anticipated and approximated. A severe earthquakealong the San Andreas Fault, with catastrophic impacts on the SanFrancisco Bay area, is another example of an anticipated hazardof low probability and high consequence that is difficult topredict and control. Future levels of risk are usually predictedby statistical analyses of relevant experience, although, acomplete time series and representative sampling of hazardousevents seldom exists. Predictions are often based on inference,event reconstruction, interpretation and extrapolation, ratherthan on observed events.(11) Because industry and regulators learnto improve safety and reduce risk based on prior experience,Bayesian statistics are sometimes used to reflect the decrease inthe probability/frequency of hazardous events when "learning"improves the odds.(11,13) Alternative computational methods toinfer a risk profile envelope have been developed (e.g., trendanalysis) that include low probability, high consequence events,when the high consequence results from a number of intermediateevents and the structure of such a composite event can beanalyzed and quantified.(12) However, such predicted or compositerisk profiles are often controversial, as is discussed in Chapter9, which reviews the application of Risk Assessment methods tospace launch and orbiter systems and missions.
8.5 UNCERTAINTIES AND RELIABILITY
Risk Analysis is not an exact science. Despite this, it iswidely used to support regulatory and industrial decision makingand to allot resources. Risk analyses performed by differentanalysts on the same issue may lead to different results. The
8-13
reason is that there are substantial uncertainties intrinsic torisk assessments deriving from incomplete knowledge andidentification of potential failures, from incorrect modelingassumptions used in the quantification of hazardous events or,more likely, from the variability in the possible type, time,place and circumstances of an accident. Different (and possiblyincomplete) data bases and assumed failure rates of componentsmay be used and thus lead to discrepancies in results. Differentstatistical analyses of the same data base may be justified bystated assumptions and lead to further discrepancies in results.Furthermore, the choice of a certain risk analysis methodologymay influence, and even determine, the conclusions of theanalyses. Judgments by experts evaluating and ranking thehazards, i.e. the Delphi approach, are often subjective. Hence,the risk analysis process has inherent limitations anduncertainties which must be taken into consideration in decisionmaking.
Tests to establish reliability of complex components or systemsare usually expensive, making a minimum of tests desirable. Onthe other hand, true probabilities are based ideally on resultsfrom very large samples. When only a few items are tested, theresults may not be truly representative. Tossing a normal cointwo or three times may result in heads each time. This may leadto the erroneous assumption that the result will always be heads.The next three tosses may all be heads again, all tails orcombinations of heads or tails. With more and more tests theaverage probability of a head (or tail) will be found to approach0.5. The problem then arises as to how much confidence can beplaced on past results to predict future performance. The termconfidence level is used for this purpose. Tables have beenprepared to indicate the relationships between test results,reliability and confidence. One such table is shown below inabbreviated form (Table 8-4).
Since there are residual uncertainties associated with thequantification of risk, confidence limits must be placed both onfailure probabilities (usually 60%-90% brackets) to reflect thisuncertainty. A 60 percent confidence interval means that thereis a 60 percent chance that the actual failure rate falls withinthe range of given estimates. A 90 percent confidence limitmeans that there is a 90 percent chance that real events willfall within an estimated range. Confidence limits are based onobservations: if no failures occurred in 1,000 trials, there arestill three failures possible in the next 1,000. If 10,000 testswere successfully completed, that would statistically correspondto a probability of three failures in 10,000 events with 95percent confidence (i.e., a reliability of .9997). In addition,there may be large uncertainties in the consequence estimate, sothat for any "best guess" point estimate, "worst case" and "bestcase" limits are needed.
8-14
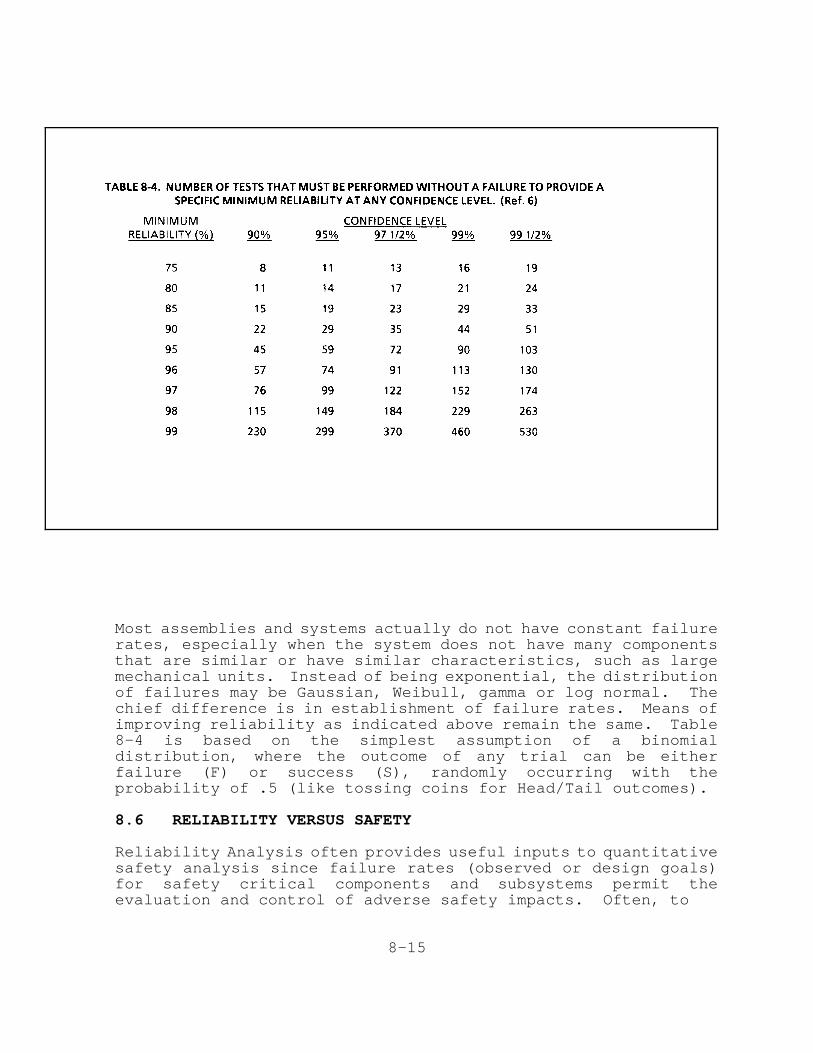
Most assemblies and systems actually do not have constant failurerates, especially when the system does not have many componentsthat are similar or have similar characteristics, such as largemechanical units. Instead of being exponential, the distributionof failures may be Gaussian, Weibull, gamma or log normal. Thechief difference is in establishment of failure rates. Means ofimproving reliability as indicated above remain the same. Table8-4 is based on the simplest assumption of a binomialdistribution, where the outcome of any trial can be eitherfailure (F) or success (S), randomly occurring with theprobability of .5 (like tossing coins for Head/Tail outcomes).
8.6 RELIABILITY VERSUS SAFETY
Reliability Analysis often provides useful inputs to quantitativesafety analysis since failure rates (observed or design goals)for safety critical components and subsystems permit theevaluation and control of adverse safety impacts. Often, to
8-15
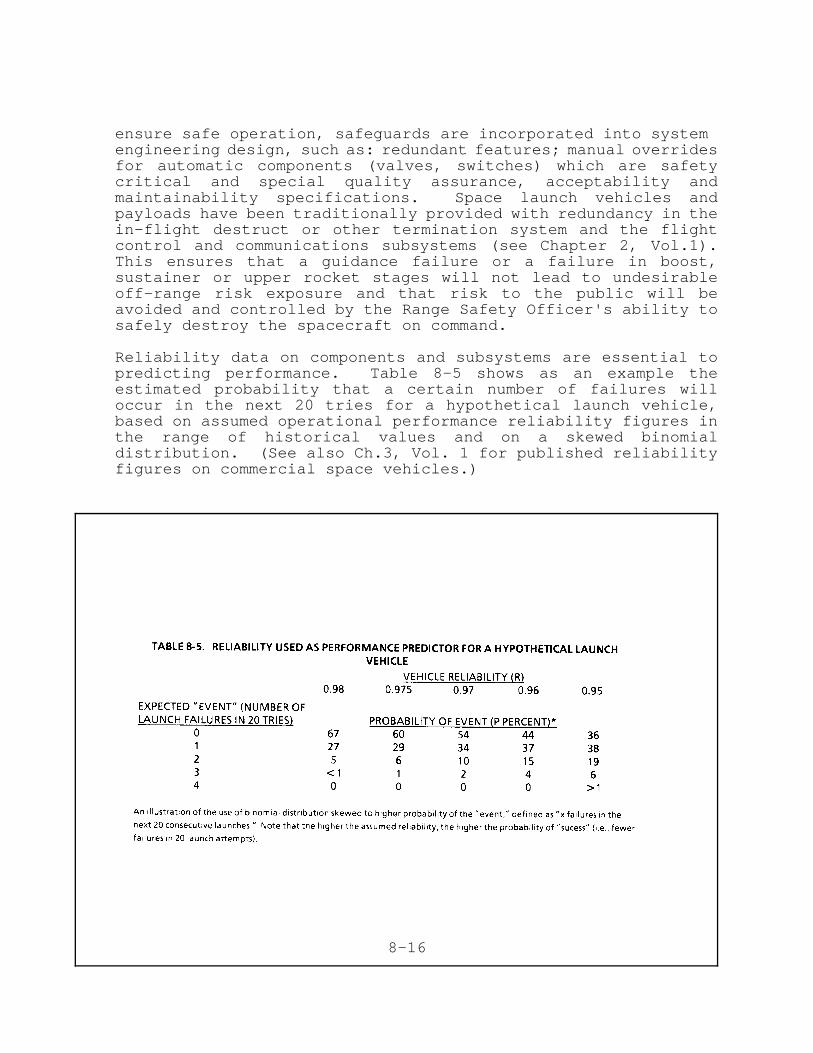
ensure safe operation, safeguards are incorporated into system engineering design, such as: redundant features; manual overridesfor automatic components (valves, switches) which are safetycritical and special quality assurance, acceptability andmaintainability specifications. Space launch vehicles andpayloads have been traditionally provided with redundancy in thein-flight destruct or other termination system and the flightcontrol and communications subsystems (see Chapter 2, Vol.1).This ensures that a guidance failure or a failure in boost,sustainer or upper rocket stages will not lead to undesirableoff-range risk exposure and that risk to the public will beavoided and controlled by the Range Safety Officer's ability tosafely destroy the spacecraft on command.
Reliability data on components and subsystems are essential topredicting performance. Table 8-5 shows as an example theestimated probability that a certain number of failures willoccur in the next 20 tries for a hypothetical launch vehicle,based on assumed operational performance reliability figures inthe range of historical values and on a skewed binomialdistribution. (See also Ch.3, Vol. 1 for published reliabilityfigures on commercial space vehicles.)
8-16
However, it must be noted that although reliability figures feedsafety analyses directly, a highly reliable system is notnecessarily safer. A key issue is the trade off betweenreliability and safety: adding sensors and control systems todetect malfunctions in a critical subsystem may enhance safety,but decrease the overall reliability. A stick of dynamite is anexample of a highly reliable, but clearly unsafe object: whentriggered intentionally or unintentionally, it will explodereliably. It is unsafe because of its high energy content, itsexplosive potential and its low trigger threshold. Safeguardsmay enhance handling safety, but decrease functional reliability.In favor of the reliability of simplicity, some engineers wouldtrade the sophisticated injection pumps in modern rockets forsimple gravity fed ("big dumb") rockets.
Both human error and infrequent operational or accidentalfailures, can lead to catastrophic accidents with a lowprobability of occurrence and potentially high risk exposure.Indeed, in the case of space launch systems and operations, it isthe low probability and high consequence event that woulddominate the public risk exposure. The likelihood of occurrenceand the public safety impacts of any accidental failure in suchhighly reliable subsystems and systems must be quantitativelyassessed in order to appropriately define acceptable and expectedlevels of risk, and to regulate commercial space activities viathe licensing process (see Chapters 9 and 10).
Table 8-6 shows the kind of basic component failure rates whichare used in probabilistic system failure computations. Theseapply to all mechanical and electrical systems across industries.Similarly, human error must often be factored into estimatingprobabilities of systems breakdown, since operator error orjudgment errors in responding to minor failures can have majorconsequences. Table 8-7 shows that high stress work conditionslead to more frequent human error than routine functions andoperations. Human failure rates are typically higher thanequipment failure rates and may compound them because of improperor incomplete operator training in recognizing criticalsituations or because of panic/stress response to an accident.Considerable attention has been paid to human/ machine interfacesand to crisis training of personnel. The same considerationsshould apply in analyzing a launch "go/no go" decision, or acommand destruct decision for a space system, as for a reactoroperator or a flight controller in a busy airport tower.
8-17
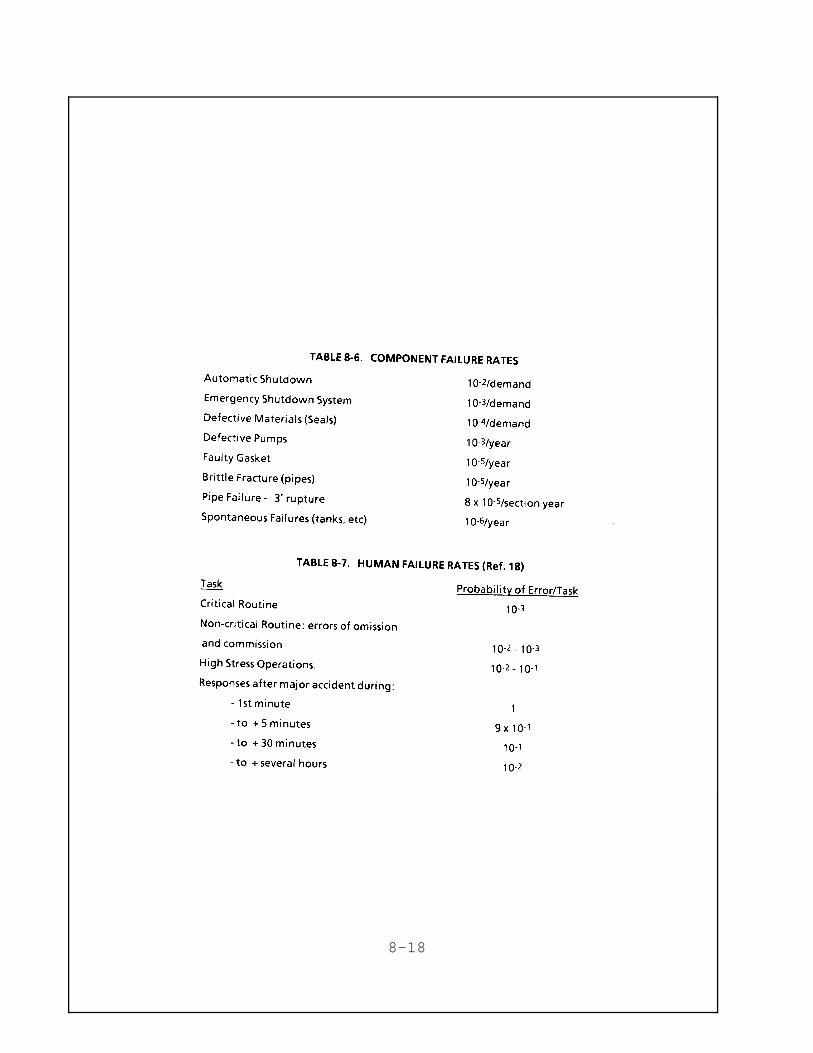
8-18
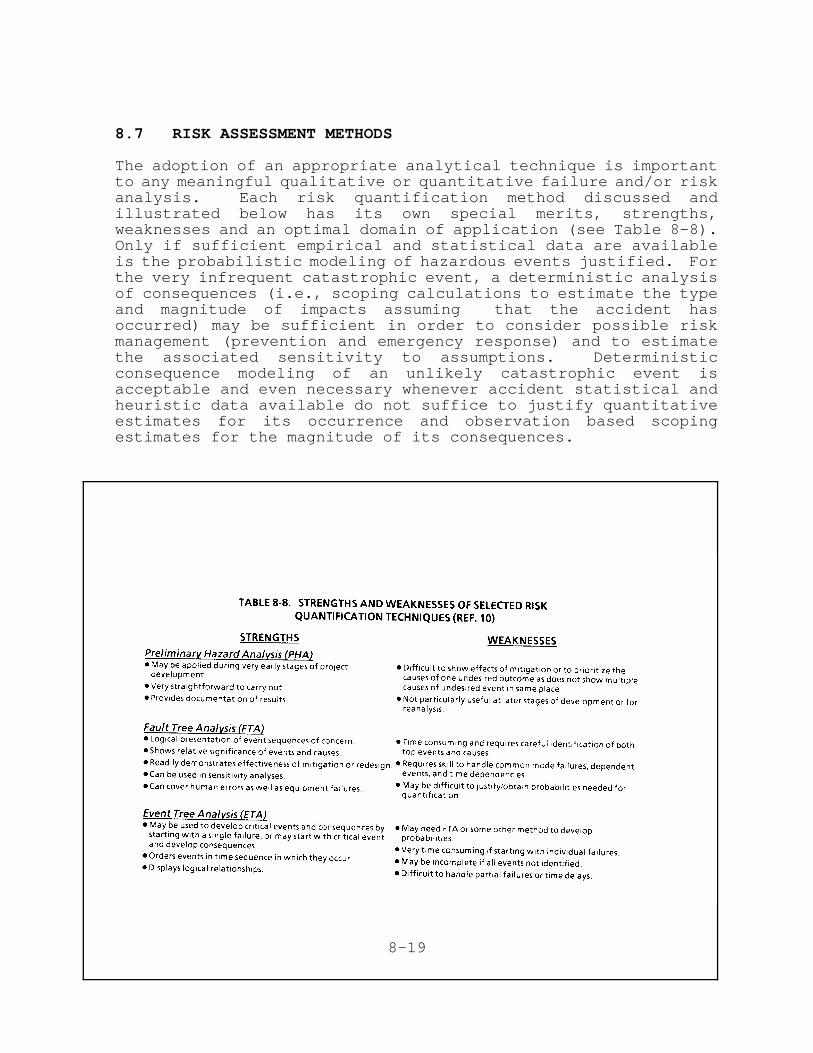
8.7 RISK ASSESSMENT METHODS
The adoption of an appropriate analytical technique is importantto any meaningful qualitative or quantitative failure and/or riskanalysis. Each risk quantification method discussed andillustrated below has its own special merits, strengths,weaknesses and an optimal domain of application (see Table 8-8).Only if sufficient empirical and statistical data are availableis the probabilistic modeling of hazardous events justified. Forthe very infrequent catastrophic event, a deterministic analysisof consequences (i.e., scoping calculations to estimate the typeand magnitude of impacts assuming that the accident hasoccurred) may be sufficient in order to consider possible riskmanagement (prevention and emergency response) and to estimatethe associated sensitivity to assumptions. Deterministicconsequence modeling of an unlikely catastrophic event isacceptable and even necessary whenever accident statistical andheuristic data available do not suffice to justify quantitativeestimates for its occurrence and observation based scopingestimates for the magnitude of its consequences.
8-19
There are several inductive methods of risk analysis which assumea particular failure mode or failure initiating event. Theeffects on the system performance are then analyzed in order toinfer the propagation of failures (failure chains) and to assessthe sensitivity of the system operation to the postulated initialfailures (bottom to top). The methods listed below focusprimarily on hazard identification and on the probabilities ofoccurrence of hazardous events:
Inductive risk analyses methods used in industry to determinewhat failed states are possible include:
• The Preliminary Hazards Analysis (PHA) - This is the mostgeneral and qualitative identification and listing ofpotentially hazardous conditions, which is used to guidedesign, or the definition of procedural safeguards forcontrolling these. Often, PHA suffices to identify causalfailure chains, possible safeguards and risk preventionoptions.
The list of hazardous events to be prevented or controlledcan be developed into subevents. PHA is usually carried outat an early stage of design and operations planning in orderto allow both design and operational controls to beimplemented in a cost-effective manner. Table 8-9 is anexample of a Preliminary Hazard Analysis list offailures/malfunctions, used to identify safety criticalfailures and hazardous conditions and consequences, used tosuggest risk control (prevention, reduction and avoidance)strategies. The PHA technique has been used primarily inthe chemical and petroleum industries and in the design ofcritical facilities.
The PHA, although chiefly an inductive method, can also be usedin deductive analysis since it is primarily a systematic andhierarchical listing of failures, accidental events andcircumstances leading to potentially catastrophic or majorundesirable consequences. Such listing of failure events andtheir enabling conditions simulates closely and is complementaryto a FTA (see below) since it permits the definition of hazardouschains of events and affords insight in the initiating (i.e.,causal) factors enabling failure. The unlikely adverse end eventcan also be analyzed in terms of more probable subevents, down tothe common minor failures in the domain of daily occurrences.
8-20
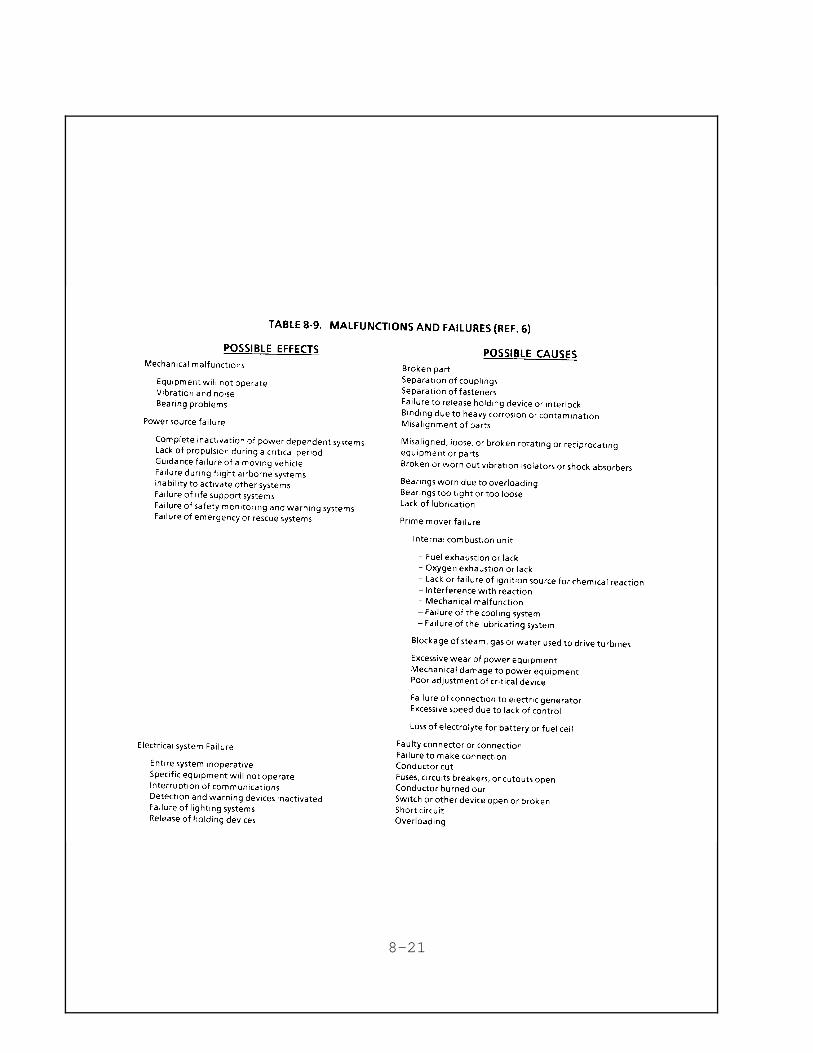
8-21
• The Failure Mode and Effect Analysis (FMEA) - This is a moredetailed analytical procedure, which is used to identifycritical and non-critical failure modes. Single point(component) failures which can lead to system break down arethus identified and fixes, such as redundancies oroperational bypass, are designed into the systems to preventthem. FMEA can be quantified if failure probabilities forcomponents can be used to derive the percentage of failuresby mode. Critical and non-critical effects are used formanaging risk and preparing emergency response plans.
• Failure Mode Effect and Criticality Analysis (FMECA) - Thistype of analysis is a more detailed variant of FMEA. It isused for system safety analysis, to enable detailedassessment and ranking of critical malfunctions andequipment failures and to devise assurances and controls tolimit the impacts of such failures (i.e. risk managementstrategies). FMECA is usually a tabular listing of:identified faults, their potential effects, existing orrequired compensation and control procedures, and a summaryof findings.
• Fault Hazard Analysis (FHA) - This method is particularlyuseful for inter-organizational projects that requireintegration, tracking and accountability. It is typicallyused for space systems when numerous contractors design,test and certify various subsystems which must be integratedinto a payload or a final launch system. FHA forms displayin column format: the component identification bysubsystem; a failure probability; all possible failuremodes; the percent failures by mode; the effect of failures,up to subsystem interfaces; the identification of upstreamcomponents that initiate, command or control the failure andany secondary failure factors or environmental conditions towhich the component is sensitive.
• Event Tree Analysis (ETA) - This approach is equivalent tothe qualitative part of Fault Tree Analysis (FTA, see below)and is used to display the likely propagation of failures ina system. Figure 8-4 is an example of an Event Tree whichis used to isolate a failure propagation sequence andidentify enabling conditions which can be controlled. Eventtrees are used in FMEA, FMECA and FTA and requireidentification of all failure initiating events. Figure 8-5is an example of an event tree for commercial spaceoperational failures.
8-22
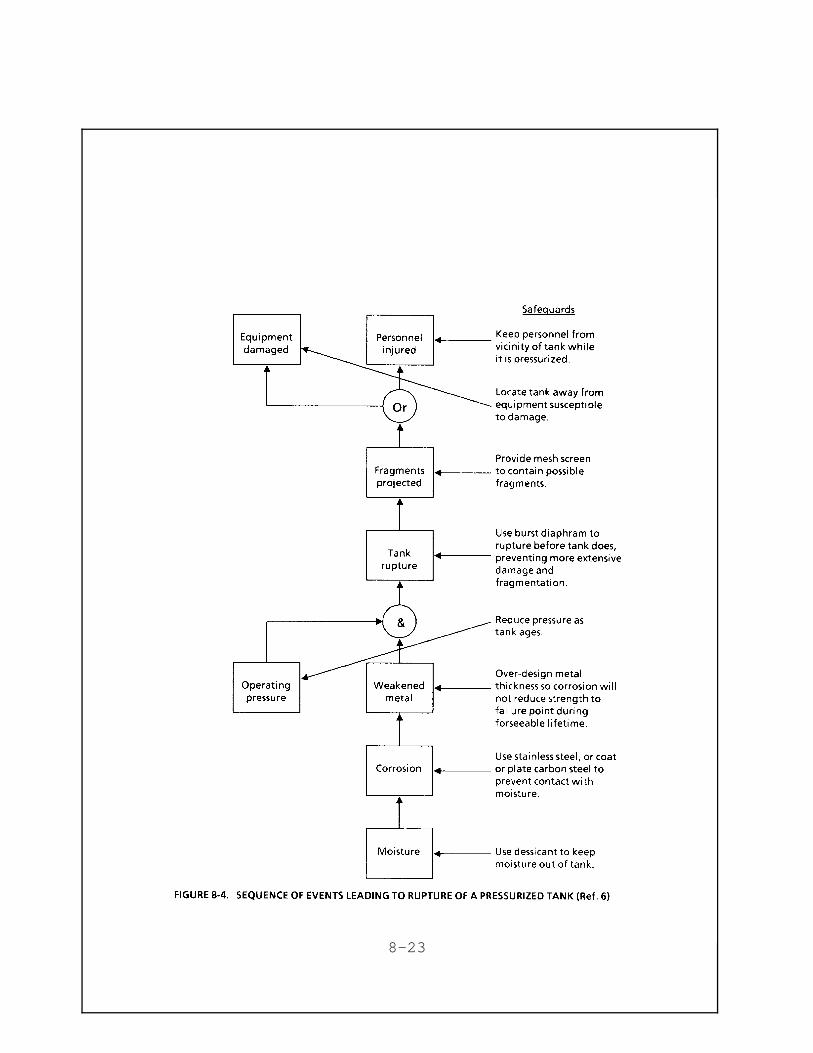
8-23
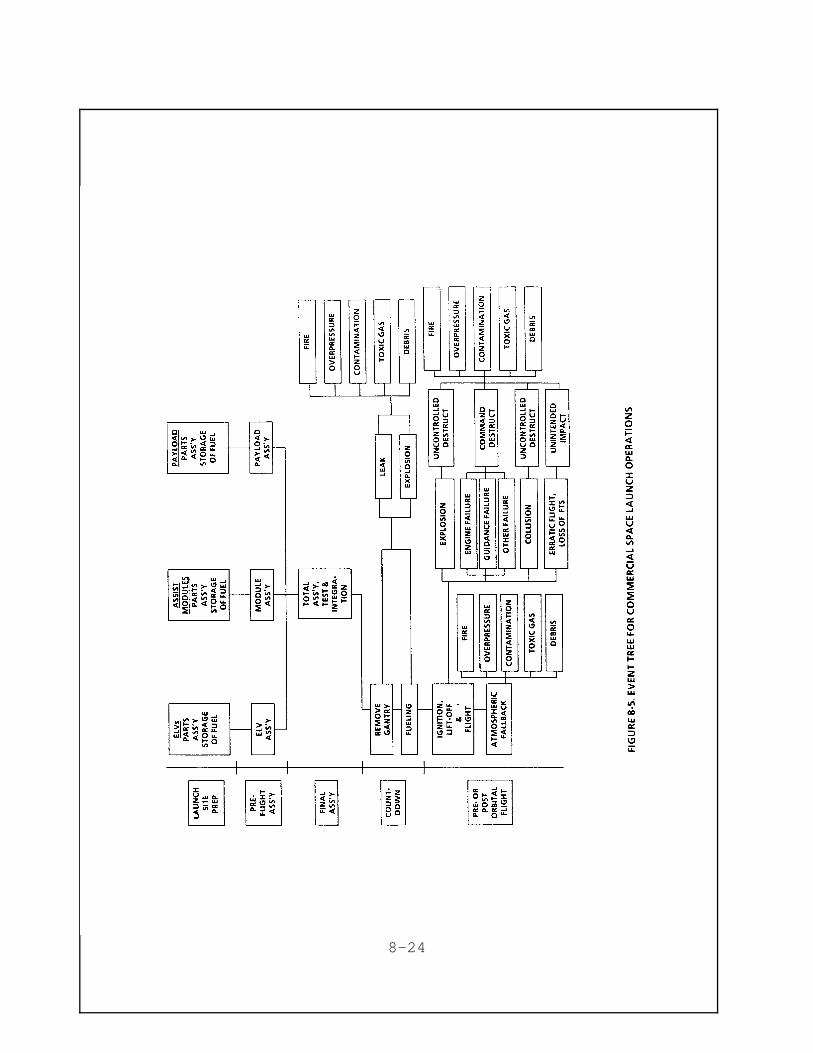
8-24
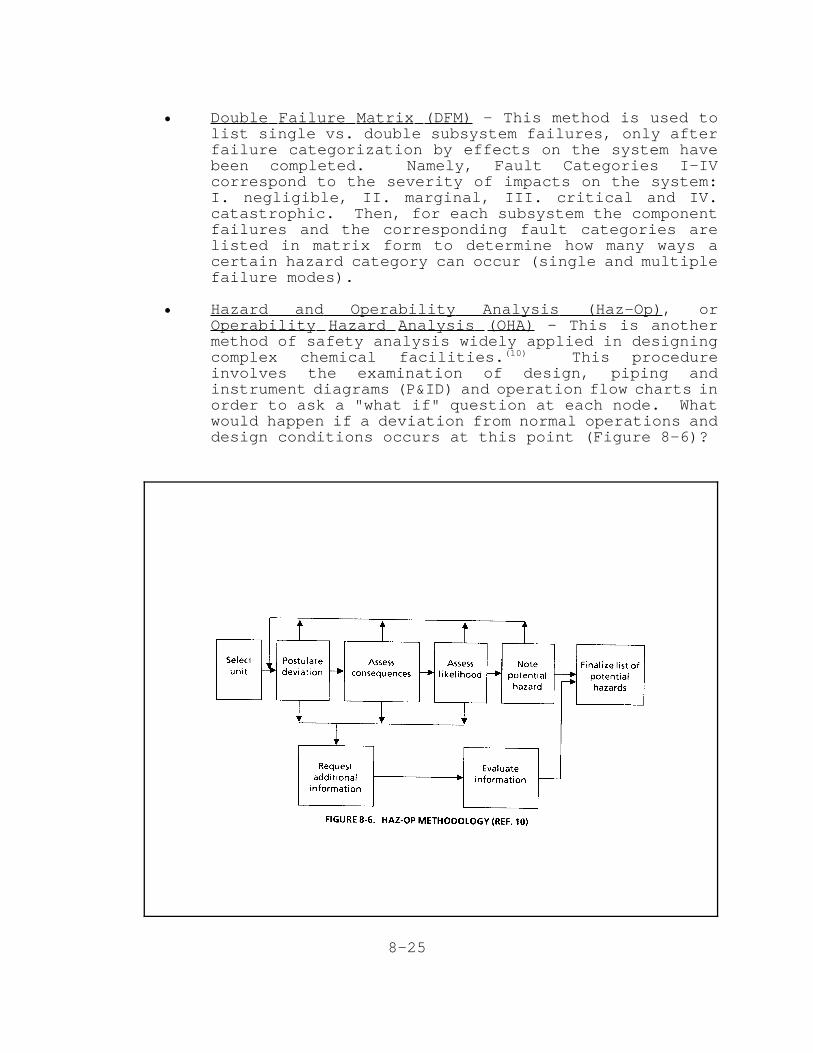
• Double Failure Matrix (DFM) - This method is used tolist single vs. double subsystem failures, only afterfailure categorization by effects on the system havebeen completed. Namely, Fault Categories I-IVcorrespond to the severity of impacts on the system:I. negligible, II. marginal, III. critical and IV.catastrophic. Then, for each subsystem the componentfailures and the corresponding fault categories arelisted in matrix form to determine how many ways acertain hazard category can occur (single and multiplefailure modes).
• Hazard and Operability Analysis (Haz-Op), orOperability Hazard Analysis (OHA) - This is anothermethod of safety analysis widely applied in designingcomplex chemical facilities.(10) This procedureinvolves the examination of design, piping andinstrument diagrams (P&ID) and operation flow charts inorder to ask a "what if" question at each node. Whatwould happen if a deviation from normal operations anddesign conditions occurs at this point (Figure 8-6)?
8-25
This method is equivalent to the FMEA analysis in the sensethat it permits identification of critical failureinitiators, single point failures, malfunction chains andtheir effects on other parts of the system propagation offailure. Design flaws that require safeguards to insureoperability (double valves, bypass redundance logic, manualoverrides, etc.) can thus be uncovered. This method is usedboth in pre-design and post-design analyses to achievedesign verification, set acceptance criteria, meetobjectives in system operation, provide proceduralmodifications to ensure safe operation and emplacemonitoring of safety critical items. A Haz-Op variant isLAD (Loss Analysis Diagram), used to compare design optionsand determine the risk acceptability levels or safetymargins in design. Similarly, contingency analysis is usedas a complementary risk analysis method to Haz-Op, in orderto manage risks, when loss of control or a critical accidentoccurs.
In contrast to the above approaches, deductive risk analysismethods require reasoning from the general to the specific: Asystem failure is postulated and the subsystem failure modesleading to it are analyzed and broken down to the terminal orinitiating failure event level ("top to bottom" or "top down"approach). Most accident investigations are of this type and areused to determine how a system failure can occur.(8) Thisincludes:
• The Fault Tree Analysis (FTA) Methodology for HazardAssessment - The FTA technique is a logical method fordisplay and analysis of the hierarchical linkage andpropagation of failure events leading to the adverse endresult, placed at the top of the "tree." Branches in thislogic tree represent alternative failure paths leading tothe stipulated end event and display interdependencies offailures. A staged fault tree (Figure 8-7) allows thedefinition of intermediate levels of the events andconditions that are necessary or enable failures topropagate to the top of the tree. The intermediate failureevents may, in turn, result from the aggregation of lowerlevel failures from system-level down to subsystems andcomponent failures. The bottom levels display the failureinitiating or tree terminal events. Critical factors andinterrupt modes for failure chains can be identified andquantitatively examined. The nodes of the fault treerepresent logic AND or OR gates.
8-26
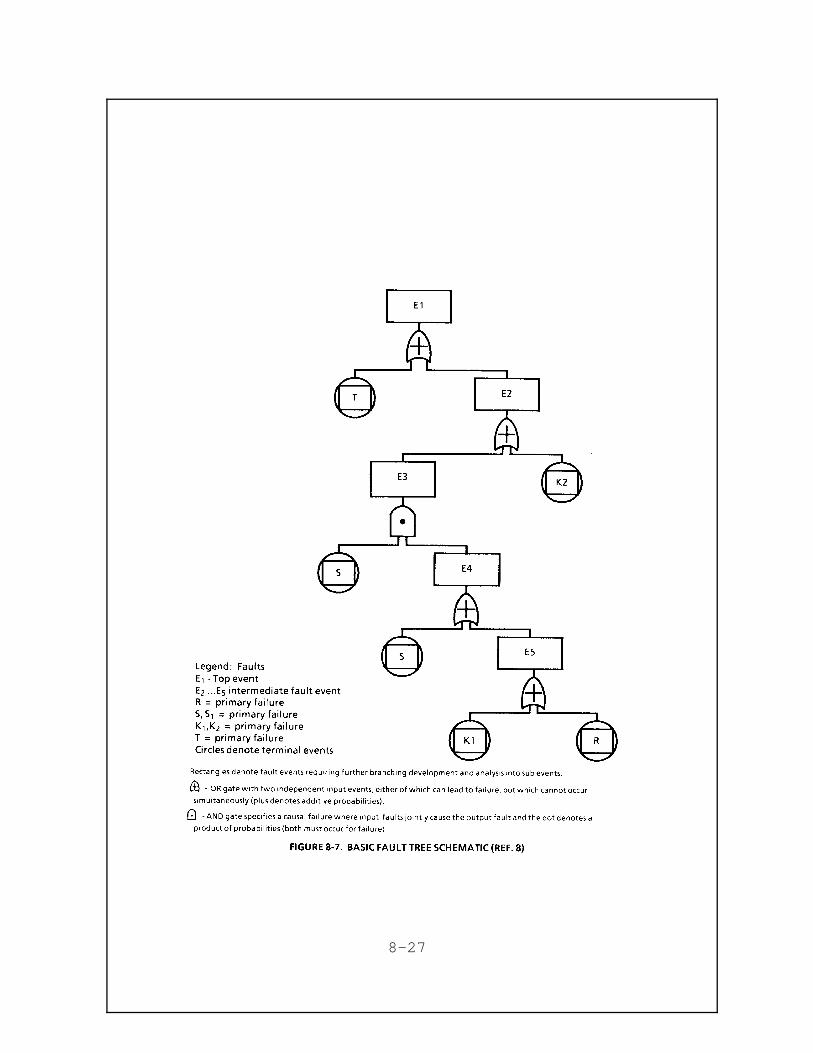
8-27
The AND gate represents the simultaneous occurrence of conditionsor events necessary to result in failure propagation up the tree.An OR gate indicates that each individual failure event enteringis capable of leading to higher level failures. Carefulconsideration must be given to the independence or mutualinterdependence of events entering a particular logic gate toinsure the correct use of joint and conditional probabilityconcepts.
In the case of ELV launch or orbital failures, a fault tree maybe used to highlight single point (critical) failures and "commoncause" (not independent) failures which must be "designed out" byredundancy or greater safety margins. Clever analysts use"exclusive OR gates," by defining mutually exclusive sets offailure events or aggregating lower level failure events intocomplementary groups to facilitate estimation of probability ateach node of this event fault tree. FTA can be used both forqualitative, and for quantitative analysis of hazards. However,qualitative results must be combined with accurate failure ratedata in order to achieve meaningful quantitative results.
Assuming independence of failures, there are five "minimal cutsets," i.e., intersection of events, whose probabilities areadded at OR gates (provided that individual failure probabilitiesare very small so that probability products are negligiblecompared to their sum), and multiplied at the AND gate.
E1 = T + E2 == T + (K2 + E3) == T + K2 + (S·E4) == T + K2 + S·(S1 + ES) == T + K2 + (S·S1) + S·(K1 + R) == T + K2 + (S·S1) + S·(K1 + S)·R
The minimal cut sets are T, K2, S·S1, S·K1 and S·R (two singlesand three doubles). The largest contribution to theprobabilities will come from the single point failures T andK2 (critical failures), since the small probabilities ofoccurrence for the individual failure events, S, S1, K1 and R,the product of their probabilities will make a very small, andpossibly negligible, contribution to the final eventprobability. Probabilities of simultaneous failures at ANDgates necessary for a higher level failure to occur, may bemultiplied in some approximations only if conditionalprobabilities for interdependent failures are subtracted andthe correct dimensionality is preserved. Usually,probabilities of independent events at OR gates are added, ifP<1. Correct dimensionality must be observed for all types oflogic gates.(8)
8-28
Each branch of a failure event tree must be quantified in aconsistent manner using either frequency units (1/timedimensions, rate per year, per hour or per event) or normalizeddimensionless probabilities. By using observed orprojected/expected values for the frequency or probability ofvarious failure modes and by analyzing how they occur, thelikelihood of each hazardous event can be quantified. Risk isthe product of this probability (or frequency) by theconsequence magnitude of the undesirable event. The correctprobabilistic dependencies (conditional, joint, mutuallyexclusive) for the occurrence of failure events of the lowerbranches permit their quantitative aggregation at gates and upthe tree. References 1, 3, 7, 8 and 10 discuss and illustratethe application, use and practice of FTA and otherProbabilistic Risk Analysis (PRA) methods, such as FMEA, inindustry and Government.
The NRC and DOE have made extensive use of PRA in analyzing,licensing and regulating the operation of nuclear power plants;in prioritizing generic nuclear industry, transportation andwaste disposal safety issues and in performing environmentalimpact analyses.(14-16) DOD has also used PRA to develop and testnuclear weapon systems. PRA is a comprehensive and integratedanalysis of failures capable of revealing theirinterrelationship and their likelihood. Thus, in spite of itsuncertainties, high cost, effort and limitations, PRA hasproven useful to regulators of technological risk both tohighlight gaps in knowledge and areas of research need and indirecting the industry and regulatory efforts towards redressof high leverage safety problems. PRA's have aided informulating safety goals, criteria and defining riskacceptability levels and numerical compliance targets forindustry.
8-29
REFERENCES TO CHAPTER 8
1. "A Review of Risk Assessment Methodologies" - Report bythe Congressional Research Service (CRS), Comm. on Sci.and Technology, Comm. Print 98-929 (1983)
2. "Risk Assessment in the Federal Government: Managing theProcess," NAS (1983)
3. "Risk Assessment and Risk Management: Framework forDecision making," EPA Policy Paper, 1984; also "Science,Risk and Public Policy," W.D. Ruckelshaus, Science 221.1026 (1983).
4. "The Perils of Prudence," A. L. Nichols and R. J.Zeckhauser, in "Regulation," Nov/Dec 1986, p. 13 et ag.
5. "The Dangers of Caution: Conservatism in Assessment andManagement of Risk," A. L. Nichols & R. J. Zeckhauser, p.5-582 in Advances in Appl. Micro- Economics, Vol. 4 on"Risk, Uncertainty and the Value of Benefits and Costs."
6. "Product Safety Management and Engineering," WillieHammer, Prentice Hall Intl., 1980.
7. "System Safety Engineering and Management," H. E. Rolandand B. Moriarty, J. Wiley & Sons, 1983.
8. "Fault Tree Handbook," NUREG-0492, Jan. 1981, Vesely, W.,et. al.
9. "Social Benefits vs. Technological Risk," Chauncey Starr,Science 165, 1232 (Sept. 19, 1969).
10. "Hazard Identification and Quantification," H. Ozog and L.M. Bendixen, Chemical Engineering Progress, April 1987, p.55-64.
11. "Inferences from Alarming Events," J. W. Pratt and R. J.Zeckhauser, J. Policy Analysis and Mgt., 1, 321 (1982).
12. "Computing Risk Profiles for Composite Low Probabilty HighConsequence Events," D. J. Heimann and T. S. Glickman,Annals of Operations Res. (1987), 9, 545-560 (1987) in"Statistical and Computational Issues in ProbabilityModeling II, (eds. S. L. Albin and C. M. Harris).
13. "Review of RTG Utilization in Space Missions," Hearing,House Comm. on Sci. & Tech., March 4, 1986 (Rept. # 97),see Testimony and Appendices (esp. pp. 252, 280, et seq.).
8-30
14. "Risk Management Guide", G.J. Briscoe, EG&G, Idaho, forDOE, DOE/SSDC-76- 45/11- Rev.1, Sept. 1982.
15. "Probabilistic Risk Assessment (PRA) Reference Document,"NRC, NUREG- 1050-F, Sept. 1984.
16. "PRA Procedures Guide- A guide for the Performance ofProbabilistic risk assessments for Nuclear power plants,"NRC, NUREG-CR-2300, 1981.
17. "An Anatomy of Risk," W.D. Rowe,J.Wiley and Sons, NewYork, 1977; Second Ed., 1986.
18. "Methodologies for Hazard Analysis and Risk Assessment inthe Petroleum Refining and Storage Industry," Concawe,Report 10-82, 1982.
19. "Regulatory Program of the US Government, April 1, 1986 -March 31, 1987," Exec. Off. of the President, OMB, (p. xx,T.2).
8-31
10/2/95 rev9. APPLICATIONS OF RISK ANALYSIS TO SPACE LAUNCH
OPERATIONS
9.1 LAUNCH RISK ANALYSIS OBJECTIVES
Risk Analysis is not an end in itself, but rather a means toaccomplish other goals: the identification of hazards and theassessment and quantification of risk provide insight to theoverall acceptability of a program, such a commercial spacelaunch campaign, from operational, regulatory or societalviewpoints. If the associated risk level appears unacceptablyhigh to the public agency sponsoring or regulating the activity,the analysis can provide information needed to control and reducethe risk. The whole Range Safety Control process ( see Ch.2,Vol.1) is predicated on risk avoidance, minimization of accidentimpacts and the protection of population centers (see also Ch.10). Risk values related to space-launch activities may begenerally categorized in two ways: (1) the probability ofvehicle failure, including all possible failure modes, that couldlead to debris impact events and their probabilities; and (2)consequence estimation, i.e., expected casualties or damage. Theprobability of debris impacts generally means that at least oneobject impacts in a specific area. The casualty estimationgenerally used is one of two types: (1) the probability ofcasualty, defined as the probability of one or more personssustaining an injury; or (2) the expected number of casualties,defined as the number of persons expected to sustain an injury asa result of at least one object impact in a specific area. Theseconcepts have also been discussed and illustrated in the contextof Range Safety destruct actions (Ch. 2, Vol.1 and Ch. 10 ) andre-entry hazards (Ch. 7, Vol.2).
The following is a list of general uses and applications of RiskAnalysis in the context of space mission planning, approval andimplementation:
• A risk study can serve as a tool in the total decisionmaking process for the Range or the sponsoring organization.
• Excessive risk may reveal the need for a Flight TerminationSystem (FTS) or other program restrictions (e.g., restrictland overflight or launch azimuths).(29,32)
• Results are a tool to help underwriters price commercialspace insurance.
• Results may indicate the requirement that an existing orpre-designed FTS or other critical ELV system be redesigned,if such a redesign can significantly reduce
9-1
these risk levels via greater safety margins or introducingredundancies.(33)
• Results may indicate the need for evacuation of Rangepersonnel, enforcement of roadblocks, restricted sea lanesor airspace, movement of critical equipment, call-up/purchase of additional real estate or justification forcurrently controlled land.(2 b)
• Results might show the necessity to modify the support plansfor other Range support elements permitted within theevacuated area, i.e., manned optical tracking sites.
• Results can be used in the development of ELV flight safetyoperational support plans to include procedures, destructcriteria and whole vehicle versus destruct case (manyfragments) impact decisions.(10,11)
• Results can be used to alert the Range or Sponsor managementto excessive on-site or public risk exposure levels forgiven launches or total programs. It is then the decisionof management on which course to proceed.(17)
• Results might identify launch scenarios and patterns thatrequire mission operational procedure changes or hardwareredesign/modification to allow the selection of lesshazardous options, based on cost/benefit or operationalconstraints and priorities.(18)
• Results may indicate the need to construct new facilities incases where it is not acceptable to use existingfacilities.(20)
• Results might reveal the need and advantage of providingpositive protection for nonevacuated personnel (shelters,barricades, bunkers, blockhouses, etc.) and criticalequipment required in the evacuated area.(20)
• Results can be used to establish and define limitingcriteria which may be used both quantitatively andqualitatively. Impacts of single launches or cumulativeimpacts of space launch programs can be compared in thismanner.(19,32)
• Risk studies can provide documented evidence that specifichazards were considered in an objective and rational mannerin developing operation plans.(8-13)
9-2
• "Risks to launch" results identify the reliability of theRange support equipment and personnel and can be used forthe following purposes:(19,32)
a. Identify high risk from inadequate Range supportelements and, therefore, assist in increasing totalreliability and reducing hazards involved in launching.
b. Increase Range operational safety and supportability.
c. Increase Range capability and attractiveness topotential users.
A general method that satisfies all possible analytical problemsrelated to space operations does not exist, as discussed in Ch. 8. Historically, the National Ranges have developed theirown computer programs for risk studies and analyses, asappropriate to specific tests, launch vehicle systems or Rangeoperation problems. Although no standardization exists atpresent between the Ranges regarding methodology, computerprograms and analytical tools (mainly because of different sitingand demographics, but also because of specialized uses of eachRange), the major types and elements of space risk analysis dorecur. Moreover, there are technology transfer andstandardization efforts in progress at ESMC and WSMC. A typicalRisk Analysis requires five basic categories of data:
1. Systems failure modes and their probabilities.2. Impact probabilities and distributions resulting from
failures or normal launches.3. A measure of lethality of impacting debris.4. Location and nature of population and structures placed
at risk by the mission.5. Launch plans, subject to Ground Safety and Range Safety
constraints.
Various elements of these categories may be considered indevelopment of a Risk Analysis for a space launch vehicle,mission and/or operation.
The end result of a Risk Analysis for a specific launch andorbital mission is valid only to the degree of reliability andcompleteness of the inputs and their applicability to a givenlaunch vehicle or site. A result valid for one Range may bemeaningless for another, because flight corridors, destructcriteria and impact limit lines are designed to be site-specificand are tied to the launch azimuth. Risk Analysis results mayhave orders of magnitude uncertainties, since they generallyreflect compounded uncertainties in both initial and boundaryconditions, i.e., in assumptions, modeling simplifications,approximations and possible errors of omission in the anticipated
9-3
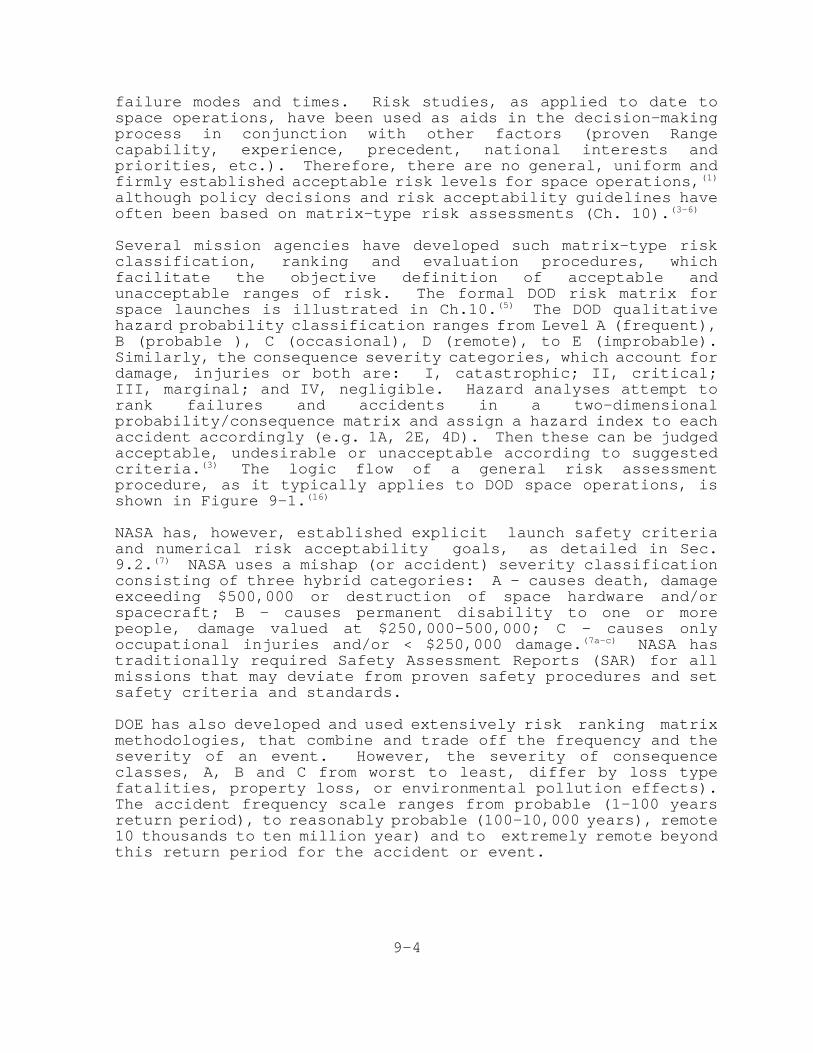
failure modes and times. Risk studies, as applied to date tospace operations, have been used as aids in the decision-makingprocess in conjunction with other factors (proven Rangecapability, experience, precedent, national interests andpriorities, etc.). Therefore, there are no general, uniform andfirmly established acceptable risk levels for space operations,(1)
although policy decisions and risk acceptability guidelines haveoften been based on matrix-type risk assessments (Ch. 10).(3-6)
Several mission agencies have developed such matrix-type riskclassification, ranking and evaluation procedures, whichfacilitate the objective definition of acceptable andunacceptable ranges of risk. The formal DOD risk matrix forspace launches is illustrated in Ch.10.(5) The DOD qualitativehazard probability classification ranges from Level A (frequent),B (probable ), C (occasional), D (remote), to E (improbable).Similarly, the consequence severity categories, which account fordamage, injuries or both are: I, catastrophic; II, critical;III, marginal; and IV, negligible. Hazard analyses attempt torank failures and accidents in a two-dimensionalprobability/consequence matrix and assign a hazard index to eachaccident accordingly (e.g. 1A, 2E, 4D). Then these can be judgedacceptable, undesirable or unacceptable according to suggestedcriteria.(3) The logic flow of a general risk assessmentprocedure, as it typically applies to DOD space operations, isshown in Figure 9-1.(16)
NASA has, however, established explicit launch safety criteriaand numerical risk acceptability goals, as detailed in Sec.9.2.(7) NASA uses a mishap (or accident) severity classificationconsisting of three hybrid categories: A - causes death, damageexceeding $500,000 or destruction of space hardware and/orspacecraft; B - causes permanent disability to one or morepeople, damage valued at $250,000-500,000; C - causes onlyoccupational injuries and/or < $250,000 damage.(7a-c) NASA hastraditionally required Safety Assessment Reports (SAR) for allmissions that may deviate from proven safety procedures and setsafety criteria and standards.
DOE has also developed and used extensively risk ranking matrixmethodologies, that combine and trade off the frequency and theseverity of an event. However, the severity of consequenceclasses, A, B and C from worst to least, differ by loss typefatalities, property loss, or environmental pollution effects).The accident frequency scale ranges from probable (1-100 yearsreturn period), to reasonably probable (100-10,000 years), remote10 thousands to ten million year) and to extremely remote beyondthis return period for the accident or event.
9-4
9-5
Note that the probability of an event corresponding to a 100years return period is 10-2 per year. The matrix risk rankingscheme permits first order (probable and severe) risks to bedefined, down to fourth order (remote - C, or extremely remote -Bevents).(37)
9.1.1 System Failure Modes and Probabilities
Launch Vehicle physical data used may include:
• Propellants• Explosive/fuel chemical properties• Fragmentation characteristics• Mass• Shape• Ballistic coefficients• Flight dynamics• Flight Termination System (FTS) • Guidance and control• Stage burn times and separation characteristics• Lethality of debris, as represented by the Lethal Area
The failure modes and associated probability of failure arerequired if other than a normal launch is addressed.(9,10)
Estimates for failure mode probabilities are typically based uponknowledge of the vehicle's critical systems and expert assessmentof their reliability combined with historical data, whenavailable.(8-11,17,18) The single point (critical) failure systems,such as the FTS, are designed, tested and certified to very highreliability standards: at WSMR the FTS reliability quoted for anon- redundant FTS required for a typical sub-orbital research orsounding rocket system is .997 at a 95% confidence level.However, higher reliabilities with failure probabilities of 10-6
apply to redundant FTS systems required for large ELV's.Typically, FTS designs are required to be "single fault tolerant"i.e., redundant.(6)
The total probability of an ELV operational failure includescontributions from all foreseeable failure modes which can leadto either thrust termination or malfunction turns. Theoccurrence of failures during a critical time interval, such asthe boost phase or stage separation, permits the estimation offailure rates versus time into flight. Illustrative figures forthe two major failure modes for Titan 34D as a function of timeinto flight are given in Table 9-1. These figures are based onan analysis of past launch performance data for the Titan familyof vehicles, corrected for learning, i.e., the improvements inmanufacturing, assembly and operational procedures which takeplace after a failure is diagnosed, analyzed and fixed.(38,39)
9-6
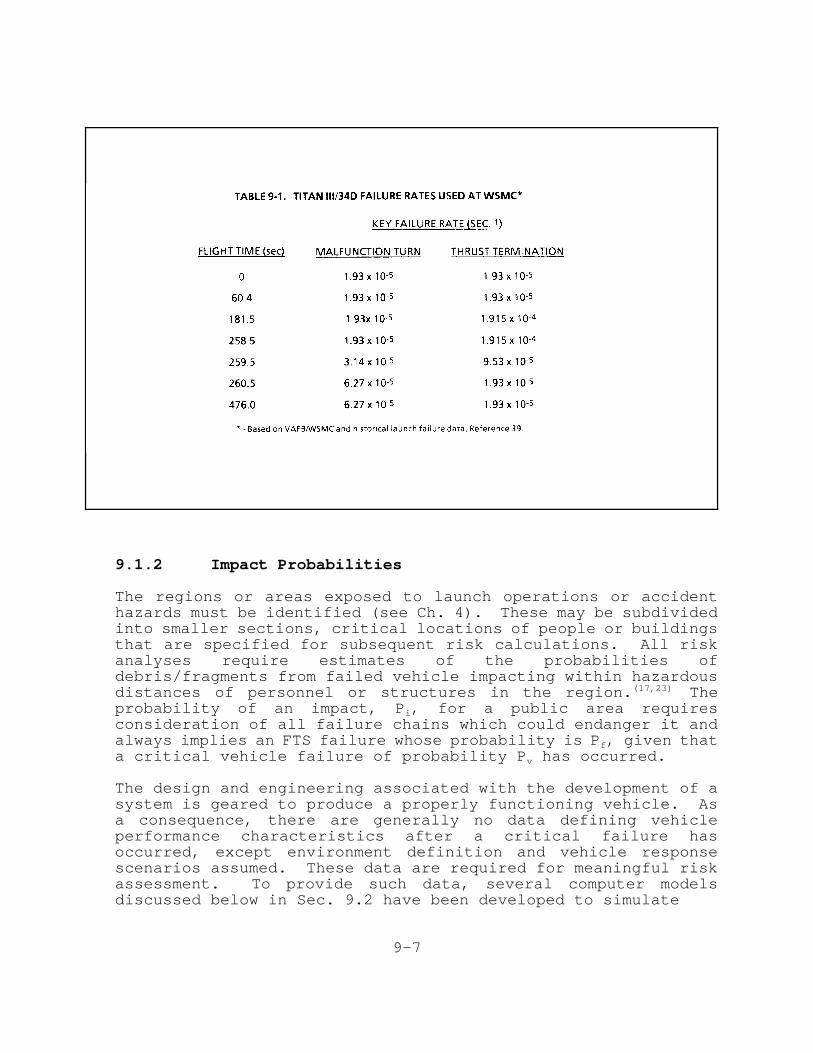
9.1.2 Impact Probabilities
The regions or areas exposed to launch operations or accidenthazards must be identified (see Ch. 4). These may be subdividedinto smaller sections, critical locations of people or buildingsthat are specified for subsequent risk calculations. All riskanalyses require estimates of the probabilities ofdebris/fragments from failed vehicle impacting within hazardousdistances of personnel or structures in the region.(17,23) Theprobability of an impact, Pi, for a public area requiresconsideration of all failure chains which could endanger it andalways implies an FTS failure whose probability is Pf, given thata critical vehicle failure of probability Pv has occurred.
The design and engineering associated with the development of asystem is geared to produce a properly functioning vehicle. Asa consequence, there are generally no data defining vehicleperformance characteristics after a critical failure hasoccurred, except environment definition and vehicle responsescenarios assumed. These data are required for meaningful riskassessment. To provide such data, several computer modelsdiscussed below in Sec. 9.2 have been developed to simulate
9-7
vehicle responses after a given gross failure mode hasoccurred.(19) These computer models are used as part of thecomputational process for generating debris impact probabilitydensity functions. These models combine, statistically anddynamically, well defined vehicle data with expert engineeringestimates to predict vehicle performance after a failure occurs(e.g., Table 9-1). Sometimes failures that occurred duringdesign verification and system tests can be used to infer in-flight failure behavior. Also, Mishap Reports, which are basedon failure diagnostics and accident investigations, help torefine these computer programs or their external data files withfield data.(33,34) Failures possible during each launch and flightphase must be considered separately, in order to isolate thosewith the potential for public safety impacts.
9.1.3 Debris Lethality
An important aspect of the vehicle data problem that must beaddressed prior to performing risk calculations is to determinewhat occurs after vehicle failure and fragmentation (whether oncommand or spontaneous) leading to ground impact. The number offragments, their sizes and shapes will ultimately define thehazard and casualty area for a given vehicle or fragment impact(Table 9, Ref. 37b). Debris are characterized by their size,mass, area and ballistic coefficient to determine if they survivere-entry and their terminal velocity at ground impact. The dataitems which are often developed for this part of the probleminclude: an impact energy distribution budget, secondaryexplosive energies available (if any) at impact, secondaryfragments which may result from impact (splatter effect) andricochet probabilities and characteristics.(20,22) Also, thelikelihood, severity and extent of toxic vapor clouds, pool firesand blasts are used to calculate hazard areas for the varioushazard mechanisms (see also Ch. 5, Vol. 2 and Ch. 10).
9.1.4 The Meaning of Casualty Expectation
The quantity most frequently employed to evaluate the riskassociated with the testing and operation of a space launchsystem is called casualty expectation, Ec. This quantitycorresponds to the expected or mean number of casualties orinjuries if an ELV is launched according to a specific missionplan. The specific approach to compute casualty expectation isadapted by the National Ranges to fit their specific problems andlaunch situations.(17-23) In general, Ec is obtained by consideringthe following quantities:
• The area, A, in which debris impacts can occur,partitioned into Ai subsets of areas.
9-8
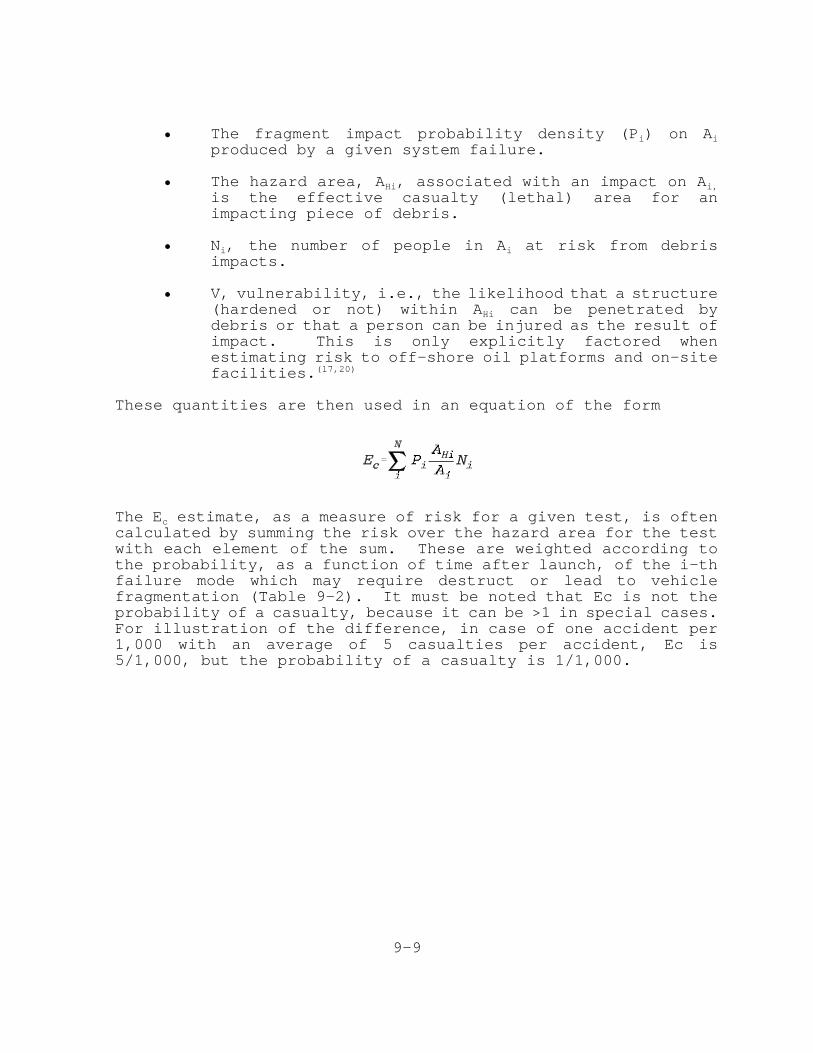
• The fragment impact probability density (Pi) on Ai
produced by a given system failure.
• The hazard area, AHi, associated with an impact on Ai,
is the effective casualty (lethal) area for animpacting piece of debris.
• Ni, the number of people in Ai at risk from debrisimpacts.
• V, vulnerability, i.e., the likelihood that a structure(hardened or not) within AHi can be penetrated bydebris or that a person can be injured as the result ofimpact. This is only explicitly factored whenestimating risk to off-shore oil platforms and on-sitefacilities.(17,20)
These quantities are then used in an equation of the form
The Ec estimate, as a measure of risk for a given test, is oftencalculated by summing the risk over the hazard area for the testwith each element of the sum. These are weighted according tothe probability, as a function of time after launch, of the i-thfailure mode which may require destruct or lead to vehiclefragmentation (Table 9-2). It must be noted that Ec is not theprobability of a casualty, because it can be >1 in special cases.For illustration of the difference, in case of one accident per1,000 with an average of 5 casualties per accident, Ec is5/1,000, but the probability of a casualty is 1/1,000.
9-9
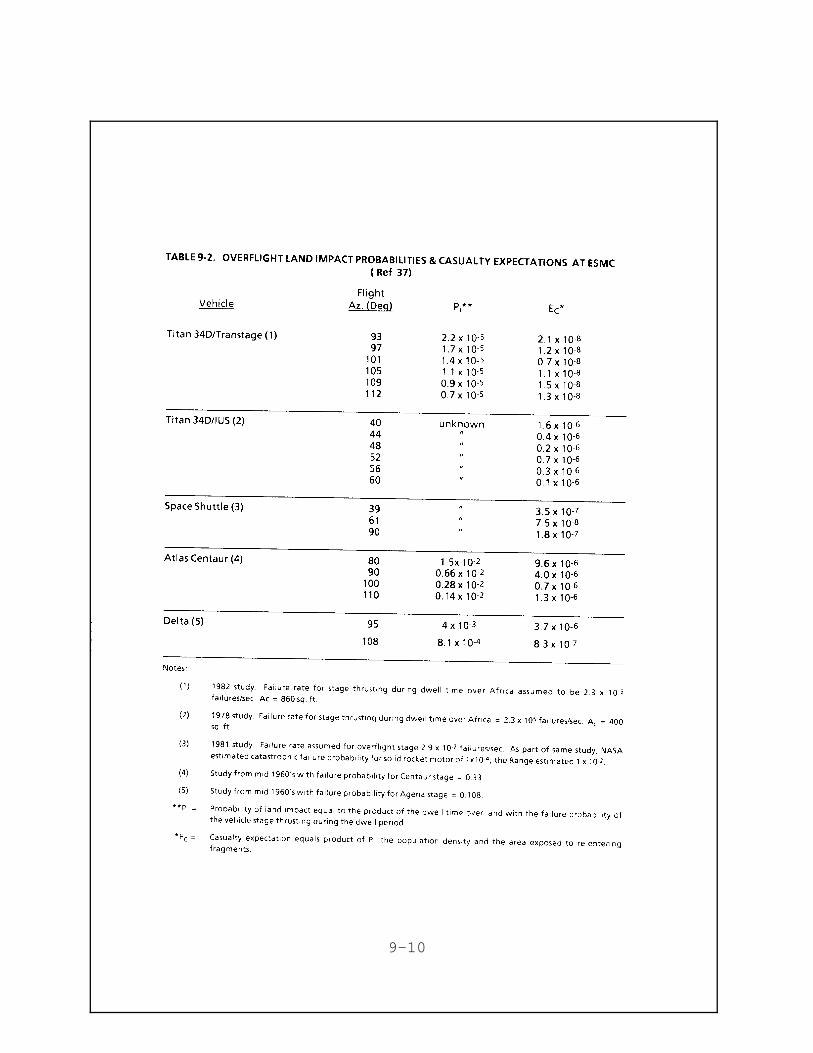
9-10
9.1.5 Population/Structures Data
The major purpose of a launch risk analysis is to determine themagnitude of hazards to personnel and structures posed by alaunch and/or total program. Public risk exposure is of concernprimarily near the launch site and during the first minute afterlaunch, when, if the vehicle fails, it may veer towards populatedareas protected by impact limit lines. The FTS must also fail (adouble failure must occur) in order to violate the destructlimits designed to protect the public. The probabilities of suchdouble failures are typically very low, on the order of 10-6 to 10-8.(37) Locations of buildings and structures and thedistribution of population throughout the area must be known, aswell as other facts, including:
• Sheltering capability of occupied structures, i.e., theability to withstand debris impact and protect againstoverpressures from explosions or impact kinetic energyconversion;
• Frequently, population distributions may be functionsof the time of day or week and may be significant inrisk tradeoff studies;
• Risk levels can be directly affected and controlled tosome extent by population control, sheltering, Rangeclearance or by preventing people from entering theseareas (e.g., road-blocks).
Based on such an analysis combined with mission profileconstraints, the Impact Limit Lines (ILL) beyond which thevehicle and its fragments should not impact are determined foreach launch to protect population and structures. Infringementof the ILL warrants a positive destruct action (see Ch.2, Vol.1).
9.1.6 Launch and Mission Planning
The actual implementation of operational plans under launchconditions ultimately determines the actual risk exposure levelson and off-site.(11-13,18) Integral to the analysis are theconstraints posed by the following:
• Launch area/Range geometry and siting
• Nominal flight trajectories/profiles
• Launch/release points
9-11
• Impact limit lines, whether based on risk topopulation/facilities or balanced risk criteria.
• FTS and destruct criteria
• Wind/weather restrictions
• Instrumentation for ground tracking and sensing on-board the vehicle
• Essential support personnel requirements.
The Range Safety Group (or its equivalent) typically reviews andapproves launch plans, imposes and implements destruct lines andother safeguards, such as NOTAMs (Notice to Airmen), Air SpaceDanger Area notifications and radio-frequency monitoring (seeCh.2, Vol 1).
The launch (normal and failure) scenarios are modeled andpossible system failure modes are superimposed against theproposed nominal flight plan. Hazards and risk resulting fromall known or hypothetical failures are summed in the overall Ec
for the launch. A range of values (risk envelope) rather than asingle probability or casualty expectation value is determined.The hazard to third parties is dependent upon the vehicleconfiguration, flight path, launch location, weather and manyother factors ( see Ch.5, Vol.2). It should be possible totabulate casualty expectations and impact probabilities for aparticular range, vehicle and typical flight path, but thisinformation is not easily available in the public domainpresently.
9.2 LAUNCH RISK ANALYSIS TOOLS.
9.2.1 Pre-launch Safety Requirements.
Any contractor or launch vehicle manufacturer using a NationalRange must comply with extensive safety requirements,(4-6) andsubmit sufficient data regarding the mission trajectory andvehicle performance to support the mission safety evaluation,operational planning and approval.(8-12) A Blast Danger Area aroundthe ELV on the launch pad and a Launch danger Area (a circlecentered on the pad with tangents extended along the launchtrajectory) are prescribed for each ELV depending on its type,configuration, amount of propellants and their toxicity, TNTequivalents, explosive fragment velocities anticipated in case ofan accident, typical weather conditions and plume models of thelaunch area.
The list of safety documents that a Range User must comply withis a comprehensive set of Ground and Range Safety requirements(5-7,16). The scope of the effort involved to apply them
9-12
to mission analysis and approval is well illustrated in a fourvolume Integrated Accident Risk Assessment Report (IARAR), whichincludes quality assurance and certification of criticalcomponents and subsystems, electro-explosives, hazardouspropellants and chemical information, vehicle description andpayload/system safety checks.(8) In the case of man-rated spacesystems, like the Shuttle, the customary safety requirements andthe lengthy lead time required for mission planning and approvalbecome even more cumbersome.(29-32) More typical are the missionapproval documentation submitted to the Range, such as the FlightPlan Approval and Flight Termination reports illustrated by Refs.10-13 and 15.
A Flight Safety Plan and supporting data must be supplied by theUser to the National Range, prior to mission approval andoperational planning.(36) Each launch is evaluated based on:
• Range User data submission requirements from the hazardanalysis view point;(18,22)
• launch vehicle analyses to determine all significantfailure modes and their corresponding probability ofoccurrence (FMEA's and Reliability Analyses);(9a,b)
• the vehicle trajectory, under significant failure modeconditions, which is analyzed to derive the impactprobability density functions for intact, structurallyfailed and destructed options;(11-13)
• the vehicle casualty area based upon anticipated(modeled) conditions at the time of impact;(10,13)
• computed casualty expectations given the specificlaunch and mission profile, population data near theRange and along the ground track.(10,15) Shelters may beprovided, or evacuation policies adopted, in additionto restricting the airspace along the launch corridorand notifying the air and shipping communities (NOTAM)to avoid and/or minimize risks;
• an Accident Risk Assessment Report (ARAR) prepared toidentify hazards of concern, causes, controls andverification procedures for implementing suchcontrols.(8)
The ESMC and WSMC Range Safety Requirements specify the datasubmissions expected from Range Users to enable hazardassessments prior to granting launch approval, including:
• determination of significant failure modes andderivation of impact probability densityfunctions(PDF);
9-14
• evaluation of casualty area based on vehicle break-upanalysis;
• computation of dwell times over land; impactprobabilities; casualty expectations based on landarea, geography and population densities;
• sample calculations and documentation.
Missions involving nuclear power packs or payloads must qualifybased on very stringent safety criteria and are approved onlyafter review by an Interagency Nuclear Safety Review Panel(INSRP). Detailed risk assessments have been performed by NASA,DOE, DOD and their contractors for the INSRP prior being allowedto launch satellites with nuclear power sources such asRadioisotope Thermal Generators (RTG) on-board the STS.(25-28)
9.2.2 Risk Models and Safety Criteria Used at NationalRanges.
The Range Safety Group, Range Commanders Council (RSG/RCC) hasreviewed a number of the computer models used by five of NationalRanges (including the White Sands Missile Range - WSMR, WesternSpace and Missile Center - WSMC, the Pacific Missile Test Center- PMTC, US Army Kwajalein Atoll - USAKA, and the ArmamentDevelopment Test Center - ADTC) to assess launch-related risks toon-Range personnel and the public.(1) Different models andcomputer codes are used at the Eastern (ESMC) and Western (WSMC)Test Ranges, and at the NASA/GSFC Wallops Island Launch Facility(WFF) because launch vehicles, mission objectives and sitespecifics vary.(7,18,19)
The evaluation of launch associated hazards is based on Rangedestruct criteria designed to minimize risk exposure to on andoff-Range population and facilities. Computer models are used tosimulate missions for optimization and approval or run in realtime for Range Safety Control Officers to monitor flightperformance.
The DOD Ranges do not have published requirements for acceptablelevels of public risks, presumably because national securityinterests can take precedence in testing new launch systems andlaunching defense payloads and spacecraft. Since launch riskexposure to the public is primarily controlled in real-time bythe Range Safety personnel rather than the Range User, theresidual and uncontrollable hazards to the public are re-entryhazards due to failures to achieve proper orbit and premature re-entry of the payload.
9-15
The NASA/WFF Flight Safety Plan, compares the risks associatedwith a specific mission to "acceptable risk criteria," such that:
• casualty expectation ≤10-7 for planned or accidentalimpact and re-entry of any part of the launch vehicleover any land mass, sea or airspace;
• probability of impact with potential damage to privateproperty ≤10- 3 (unless an SAR is prepared and approvedor a waiver is obtained);
• probability of impact with flight support aircraft (formeteorological monitoring, or tracking support of ≤10-6(note that other aircraft are excluded by NOTAM andairspace restrictions);
• probability of impact with ships and boats within theimpact area (inside a 50 mile radius from the launchpoints) of ≤10-5. (Some Ranges observe a 20mi.radius;(37b) Wallops Flight Facility surveys out to 100miles.(40))
From 1961 to 1983, Wallops has experienced 14 launch failures outof over 10,000 sub-orbital launches of sounding rockets,resulting in an observed land impact probability of 2.8 x 10⁻³.Of these, only three impacted outside the launch site area (i.e.,P = 6 x 10⁻⁴). Assuming an average population density of 64 persq mi., the casualty expectation based on this observed vehiclefailure rate is 8 x 10⁻⁹. Similarly, for debris dispersal overwater, a ship traffic density of 2.6 x 10⁻⁵ per sq. nmi per daywas used, resulting in an expected 3.7 x 10⁻⁷ probability of asustainer impacting a ship. For comparison, Wallops thresholdship-impact probability criteria are ≤10-5, corresponding to 20xincreased allowance for ship impact.
Range Safety Reports, Safety Analysis Reports (SAR's) and othersuch probabilistic Hazard Analyses must be prepared by RangeUsers for Mission Approval at most National Ranges whenever a newlaunch vehicle configuration (e.g., a Titan with an IUS orCentaur upper stage), an unusually hazardous payload (e.g., anuclear powered spacecraft) or a trajectory with land overflightare involved (i.e., whenever "deviations" from approved safeprocedures, vehicles and programs are filed). Similar reportsare needed for US-sponsored launches from foreign territories.Either the User submits the data for the Range to carry out itsown hazard analyses or the User prepares such a document onrequest.(6)
Safety Assessment Reports (SAR's) were typically prepared by NASAGSFC/Wallops Flight Facility (WFF) for sub-orbital launches fromforeign territory. Two references are representative of the
9-16
types of launch hazards of concern and the NASA approach to riskassessment: The SAR for Project CONDOR involved launches in 1983from Punta Lobos, Peru, using Taurus-Orion, Terrier Malemutes,Nike-Orion, Black Brants and similar sub-orbital vehicles tolaunch retrievable atmospheric sounding research payloads.(7e-g)
Range Safety Guidelines minimize post-launch risks to the publicby imposing a number of restrictions: e.g., no land over-flightcorridors are selected if it is possible to have launches andflight paths over water. However, for land-locked launch sitessuch as WSMR, strict overflight criteria restrict both land andairspace corridors to on-Range and Extended Range areas.(2) Thereare no intentional off-Range land impacts permitted for anynormally jettisoned booster and sustainer casings and sufficientsafety margins are provided within the destruct corridor to avoidimpacts on population centers by accidentally or intentionallygenerated debris. For WSMR launches, typical observed limits onrisk to nearby population centers are land impact probabilitiesof < 10-5 on-range and < 10-7 off-range, resulting in casualtyexpectations of < 10-7 to 10-9.
Models, run sequentially or in parallel, are designed to computerisks based on estimating both the probabilities and consequencesof launch failures as a function of time into the mission.Inputs and external data bases include data on mission profile,launch vehicle specifics (e.g., solid or liquid rockets, stages,configuration), local weather conditions and the surroundingpopulation distribution. Given a mission profile, orbitalinsertion parameters and desired final orbit, the risks will varyin time and space (see Ch. 10). Therefore, a launch trajectoryoptimization is performed by the Range for each proposed launch,subject to risk minimization and mission objective constraints.The debris impact probabilities and lethality are then estimatedfor each launch considering the geographic setting, normaljettisons, failure debris and demographic data to define destructlines to confine and/or minimize potential public risk ofcasualty or property damage.
The National Ranges use either a circular or an ellipticalfootprint dispersion model to analyze vacuum and wind-modifiedinstantaneous impact points (IIP) from both normal stagesjettisoned during launch and launch debris (failure ordestruct).(1) The debris dispersal estimates generally assumebivariate Gaussian dispersion distributions.(19,21) Risk contoursare estimated as impact probabilities or casualties expected perunit area centered on the II (nominal impact points) or on aspecific site (land, community or Range) of interest. All thesemodels are similar in approach, but quite site-specific in theuse of databases, which depend on Range location and on thegeographic area and associated population distribution at risk.The models may be run either as simulation to assist in analyzing
9-17
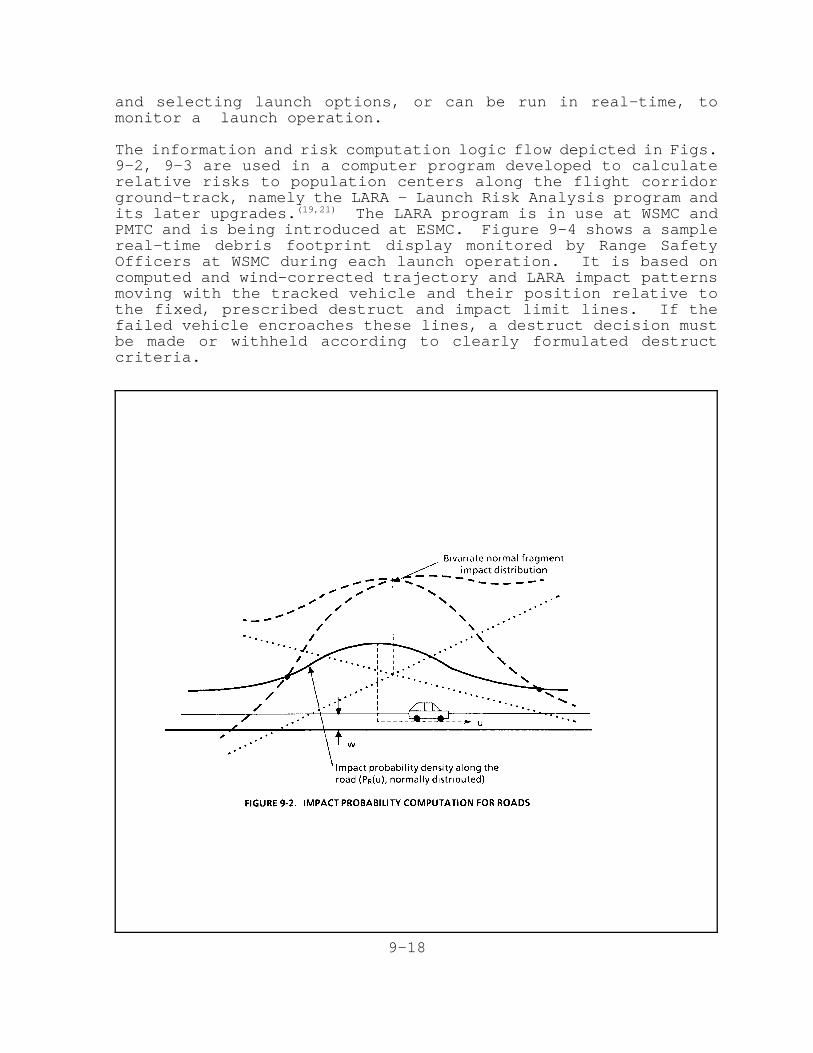
and selecting launch options, or can be run in real-time, tomonitor a launch operation.
The information and risk computation logic flow depicted in Figs.9-2, 9-3 are used in a computer program developed to calculaterelative risks to population centers along the flight corridorground-track, namely the LARA - Launch Risk Analysis program andits later upgrades.(19,21) The LARA program is in use at WSMC andPMTC and is being introduced at ESMC. Figure 9-4 shows a samplereal-time debris footprint display monitored by Range SafetyOfficers at WSMC during each launch operation. It is based oncomputed and wind-corrected trajectory and LARA impact patternsmoving with the tracked vehicle and their position relative tothe fixed, prescribed destruct and impact limit lines. If thefailed vehicle encroaches these lines, a destruct decision mustbe made or withheld according to clearly formulated destructcriteria.
9-18
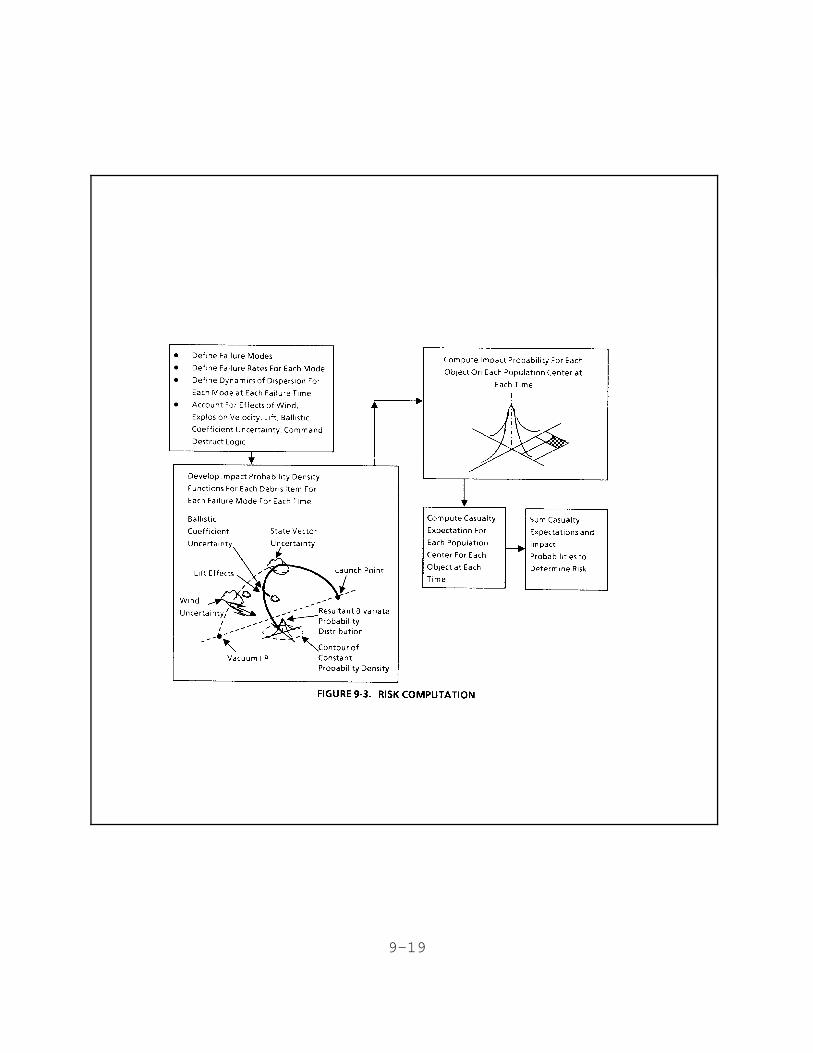
9-19
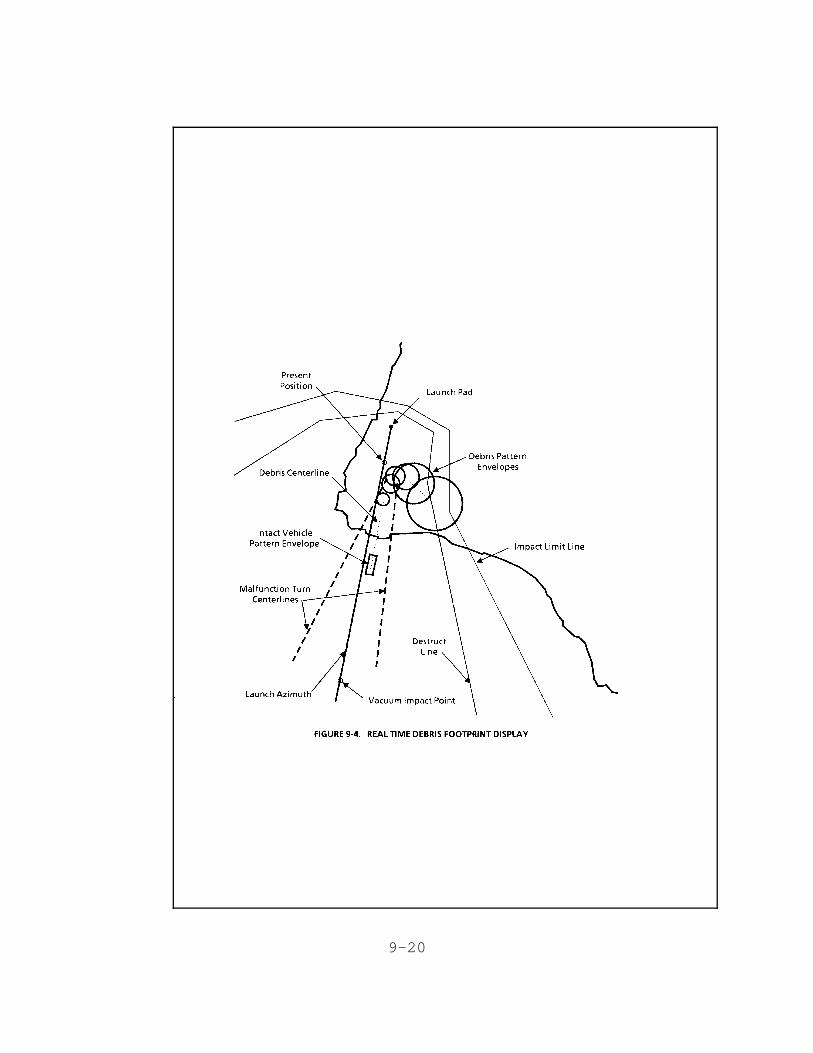
9-20
Since WSMR is a land-based Range, safety considerations areparticularly important in authorizing tests that might endangerthe public. Computer models in use at the Range support pre-mission simulations of normal and failed flights, as well asreal-time tracking and destruct decisions based on vacuum anddrag corrected IIPs. The library of risk computation and utilitycodes used by Range Safety include: SAFETY.SITE (generatesscaled maps of the range and tracking installations), SAFETY.DMA(converts maps to desired coordinate scale), SAFETY.GIP (predictsboth vacuum and drag corrected impact coordinates) and severalother external modules for population data and impact pointprediction. The WSMR Hazard Analysis method and its applicationto launches of sub-orbital vehicles with recoverable payloads wasillustrated in a 1986 study.(2b) Other risk analyses have beenperformed for specific tests and launch vehicles based ontailored models using the vehicle characteristics and launchgeometry.
WSMC has an extensive array of software developed to assist inevaluating hazards to facilities and population centers anddevising appropriate risk control options.(19-21) These include:LARA, CONDEC (Conditional Casualty Expectation), RBAC (Risk BasedDestruct Criteria), ACE (which combines CONDEC and RBAC tocompute casualty expectation along arbitrary destruct lines),SLCRSK and LCCRSK (which compute probabilities and expectedmagnitude of damage to the reinforced launch control center andto other VAFB facilities, such as SLC-6, for certain launchazimuths).(20) Other special purpose models are: BLAST, to assessexplosion shock wave far-field impacts; SABER, to evaluatesupersonic boom effects; REEDM, for hot toxic gas predictions anda series of cold spill toxic prediction algorithms for toxicreleases.
ESMC has its own library of codes used to support launches aspre-flight simulations and real-time monitoring and display.These include: BLST, similar to BLAST above; COLA, a collisionavoidance program used to ensure that a proposed launch will notjeopardize any satellite in orbit; RAID, the major real-timeRange Safety program which displays the ELV position and II basedon tracking data; RSAC and RSTR, which provide plots in site-centered coordinates; REED, used for launch and post launchenvironmental analysis of exhaust cloud effects; RIPP, aninteractive impact point and destruct line plot and RSIP (RangeSafety Impact Predictor), which computes impact positionparameters along the trajectory with and without wind data.Other codes are used to assess the fate of an errant ELV, such asRSPFT (Range Safety Powered Flight and Turns) and RSTT (RangeSafety Tumble Trajectory), to predict malfunction behavior foreach vehicle type and nominal trajectory; and RSMR, which
9-21
computes the maximum pad-to-impact range for a vehicle and itsdebris. External modules are used to update wind corrections(RSRK, for Range Safety Radiosonde Data) and assess risks toocean traffic (RSSP or Range Safety Ship Hit Probability).
For any developmental vehicle, safety assessments must precedeflight testing and launch approval. For example, the newcommercial launch vehicle Conestoga has been flight testedrecently; Conestoga failure modes and rates were based onprevious experience with the Aries rocket and the Minuteman Isecond stage motor, which were reconfigured as the Conestoga.Special attention was given to the possibility of impact anddamage to off-shore oil platforms in the Gulf Area, given theflight path, ground track and safety corridor for Conestoga undera range of plausible vehicle failure scenarios and weatherconditions.(36) However, because of redesign of the Conestoga,some of the safety assessments are being re-evaluated forlaunches from WFF.
The hazard models used by NORAD and AFSC to estimate far-fieldpublic risk exposure (i.e., for assessing the probability that afailed vehicle, re-entering second stage or debris will impact inCONUS and/or foreign countries and cause damage and casualties)were originally developed by the Aerospace Corporation.(34,35) Thesere-entry risks for second and upper stages and for low-orbitpayloads appear, typically, to be several orders of magnitudelarger than launch and orbit insertion risks (see Ch.7, Vol.2)because they integrate world-wide casualty expectation. Impactprobabilities and casualty expectations for a specific countryare much smaller and proportional to their area and populationcontribution to the integral.
Overflight risks are also a modeling and operational planningconcern for Range Safety: some trajectories may traverse Japan,Australia, Africa and South America (see Ch.10 also). Table 9-2summarizes extant risk results, namely the probabilities of landimpacts and projected casualties for typical ELV's on allowedazimuths for ESMC launches over water.(37) These flights mustprotect the "African Gate" during overflight(see also Ch.10).
This performance gate defines the maximum cross-range deviationsfrom the nominal overflight trajectory which may be toleratedwithout termination action. These are well within the destructlimits to better protect populated areas at risk in case ofabnormal vehicle performance.
To place the criteria and goals for public risk exposure perspace launch in perspective, it is instructive to compare themwith other common, but voluntarily assumed or socially acceptedtransportation risks (see also Ch.5, Vol.2 and Ch.8). Ref. 29,published prior to the 1986 Challenger accident, estimated the
9-22
casualty probability per flight for commercial air carriers to be6.6 x 10-5 (based on 1972-74 data) vs. 1-3 x 10⁻⁵ for the SpaceShuttle (to compare respective risks from an STS failure with andwithout a destruct system on-board). For comparison, the 1982-84transportation accident statistics give fatality rates per 100million passenger-miles of .02 for inter-city buses, .04 forairlines and .07 for railroads. These values correspond to acasualty probabilities of 2-7 x 10⁻¹⁰ per mile. This probabilitymust be converted to units of interest to space operations (perlaunch event or per year) and then further normalized to theexposed population and the area at risk. Further,utility/benefit considerations must be brought to bear for ameaningful comparison of public transportation with spacetransportation risks.
9-23
REFERENCES FOR CHAPTER 9
1. a)"Risk Analysis Techniques," Range Safety Group/ RangeCommanders Council (RSG/RCC), Document 315-79, 1979b)"Unguided Rocket Safety," RSG/RCC Technical Report, March1982.
2. a)"White Sands Missile Range (WSMR) User's Handbook," 2Vols., 1987.b)W.C. Wolff, "Black Brant Hazard Analysis," WSMR Report,Jan. 1986.
3. "Systems Safety Program for Space and Missile Systems", MIL-STD-1574A (USAF), Aug. 1979, Rev. 1985.
4. "Use, Management and Operation of DOD Major Ranges and TestFacilities," DOD Directive 3200.11.
5. a)"Military Standard System Safety Program Requirements,"MIL-STD-882B, March 1983, and "System Safety ProgramRequirements for Space Systems and Their Facilities," MIL-STD-882B-1, 1986. (Draft)b)"Investigating and Reporting Air Force Mishaps," AFR 127-4, January 1984.
6. a)"Range Safety Manual," USAF/AFETRM 127-1, 1972;b)"Range Safety Requirements, Range Safety Regulations,"WSMCR 127-1, May 1985.;c)"Eastern Space and Missile Center-Range Safety," ESMCR127-1, July 1984;
7. a)"Range Safety Policies and Criteria", NASA/GSFC-WFF GMI1771.1, Rev. 1, 1979; b)"Range Safety", GHB 1771.1, NASA/GSFC, September 1984;and "Issuance Information Sheet on Range Safety;"c)"Range Users Safety Handbook," WHB 1771.1, NASA/WFF, March1979;d)"NASA Safety Manual," NASA NHB 1700.1;e)"Safety Assessment Report (SAR) for Project CONDOR,"NASA/GSFC-WFF, 1983;f)"SAR for Project COPE," NASA/GSFC-WFF, 1984;g)"Risk Assessment for Black Brant X from Poker Flats, AL.and Malemute from Fort Yukon, Al.," NASA/GSFC, 1983.
8. "Titan IV Integrated Accident Risk Assessment Report (IARAR)- Phase II", Martin Marietta (MCR-85-2514), 4 Vols., Jan.1987.
9-24
9. a)"Failure Mode and Effect Analysis Report for Delta II",MDC H3324, July 1987, McDonnell Douglas Astronautics Co.,for USAF MLV/GPS Program .b)"Delta II Reliability and Maintainability Allocations,Assessment and Analysis Report," MDC H3058 A, March 1987,MDAC for USAF MLV/GPS Program.
10. a)"Delta Range Safety Land Impact Probability Study for theS-17 Spacecraft Mission," Douglas Aircraft Co., Report SM-43503 (for NASA), July 16, 1963.b)"Analysis of Delta Impact and Kill Probability PredictionProbabilities, (Including 2nd Stage Failure Mode and EffectAnalysis)," Booz-Allen Applied Research, Report 862-3-41-1,Feb. 1966.
11. "Delta 181 Range Safety Flight Termination Report," MDCH3161, Sept 1987, MDAC for NASA.
12. a)"Flight Plan Approval Package for Delta II," MDC H2747,June 1987, MDAC for USAF MLV.b)"Titan CELV/IUS Range Safety Flight Plan ApprovalRequest," Martin Marietta, June 1986.
13. "Delta 392X Range Safety Flight Mechanics DestructAnalysis," McDonnell Douglas Astronautics Co., Report MDC-M3398, May 1987.
14. a)"Report of Delta 178/GOES-G Mission Failure InvestigationBoard," Vols. 1&2, Final NASA Report, July 1986.b)"Delta 178 Investigation Report," MDC H2505, MDAC forNASA, Aug. 1986.
15. "Missile System Ground Safety Approval for DSV-3P-11E/EDelta Launch Vehicles," McDonnell Douglas Astronautics Co.,Report MDC-G9455, April 1982.
16. "Explosives Safety Standards," AFR 27-100, Rev. 2, 1985.
17. a)Bugno, W.T., D.M. Benn, J.D. Collins and J.M. Hudson,"Missile Overflight Risks and Platform Design," (ASME,Petroleum Division, R. Welch, ed.), Drilling and ProductionTechnology Symposium, 1986, pp. 57-61;b)Benn, D.M., " A Brief Survey of Risk Management in DODSafety and Related Areas," PRC/ Omnitek , March 1987.
18. "Range Safety and Range Planning Trajectory Data for the AC-68/F-8 Atlas G/Centaur Fltsatcom Follow on Mission", GeneralDynamics, Report GDSS-SP-87- 010, May 1987.
19. Collins, J.D., "Risk Analysis Methodologies Developed forthe U.S. Department of Defense," Journal of ReliabilityEngineering 1, #1, Jan 1988.
9-25
20. Harnitcheck, J.J., and J.D. Collins, "Risk Analysis of TitanLaunches over SLC 6," for WSMC/VAFB, May 1987.
21. a)Baeker, J.B., J.D. Collins, Haber, J.M., "Launch RiskAnalysis", Spacecraft & Rockets, vol 14 No. 12, Dec 1977,pp. 733-738.b)Baeker, J.B., "Launch Risk Analysis Program (LARA): PartI- Specification," J.H.Wiggins Co., 1975.
22. McMunn, J.C., J.D. Collins and B. Brown, "A Hazards Modelfor Exploding Solid Propellant Rockets," Journal ofSpacecraft and Rockets, 6, Dec. 1969, pp. 1423-1429.
23. Collins, J.D., M. Jameson and J.L. Lanz, "Real-Time DebrisPatterns for Ballistic Missile Launches," Journal ofSpacecraft and Rockets, 13, May 1976, pp. 310-315.
24. Rice, E.E., R.S. Deming, A.L. Friedlander and C.C. Priest,"Preliminary Risk Benefit Assessment for Nuclear WasteDisposal in Space," Earth Oriented Applic. Sp. Technol., 3,1983, pp. 127-137.
25. "Preliminary Risk Assessment for Nuclear Waste Disposal inSpace," NASA CR 162028, Batelle for NASA/ Marshall, Feb.1982.
26. "Space Shuttle Data for Nuclear Safety Analysis," NASA/ JSC16087, Sept. 1979.
27. Weatherwax, R.K., and E.W. Colglazier," Review of Shuttle/Centaur Failure Probabilities for Space Nuclear MissionApplications,"AFWL-TR-83-61, Dec. 1983
28. "Review of RTG Utilization in Space Missions," CongressionalHearing, House Comm. on Sci. and Tech., March 4, 1986.
29. Baeker, J.B., "Space Shuttle Range Safety Hazards Analysis,"NASA/JSC TR81-1329, J.H. Wiggins Co., July 1981.
30. Hudson, J.M., "Development of STS/Centaur FailureProbabilities: Liftoff to Centaur Separation," NASA/JSC TR82-1404, By J.H. Wiggins Co., Feb. 1982.
31. Hudson, J.M., "Development of STS Failure Probabilities,MECO to Payload Separation," NASA/JSC TR 70-1359, J.H.Wiggins Co., 1979.
32. "Report of the STS Flight Termination Criteria EvaluationCommittee," WSMC Report, June 2, 1986(restricted).
9-26

33. a)"Report of the Presidential Commission of the SpaceShuttle Challenger Accident," June 6, 1987. b)"Investigation of the Challenger Accident," US Congress,House Comm. Sci.and Tech., Rep. 99-1016, Oct. 1986.
34. "Implementation of a Safety Policy Related to Random Re-entry of Satellites Decaying from Orbit," AF 04 (695)-100 1,Mar. 1967.
35. "Random Re-entry Hazard Calculations for Titan IIIC FlightPlans VIID and VIIE," TOR-0059 (6112-50)-5, June 1971.
36. "Range Safety Report for the Conestoga I Sub-Orbital LaunchVehicle," Space Vector Corp., 1982.
37. Briscoe, G.J., "Risk Management Guide," E G & G, Idaho, forDOE, DOE/SSDC-76-45/11, Rev.1, September 1982.
37. a)Parker, L.C. and R.M. Montgomery, "An Evaluation of the -Department of Transportation Responsibilities for CommercialLaunches from a National Range," Research Triangle InstituteReport (RTI) to DOT, Sept. 1986.b)"ESMC Baseline Assessment," RTI Draft Report to DOT, May1988.
38. Heubach, W.F. and L.L.Philipson: a) "Investigation of LARAFailure Rate Methodology," J.H.Wiggins Co. for USAF/WSMC,September 1985, TR 85-3135; b) "Investigation ofApproximations and Assumptions in New LARA Failure RateMethodology," NTS Eng. for USAF/WSMC, September 1986, TR 86-3147.02.
39. Baeker, J.B., "Failure Rate Methodology Implementation andTitan 34D Failure Rate Assessment," NTS for USAF/WSMC,1987, TR 87-3154.
40. Oral Communication from WFF to OCST, May 2, 1988.
9-27
10/2/95 rev10. A GENERIC RISK ASSESSMENT OF REPRESENTATIVE LAUNCH
SCENARIOS
10.1 INTRODUCTION
Since the beginning of US space launch operations in the 1950's,there have been no launch operation accidents that have producedany general public casualties outside any of the GovernmentLaunch facilities. There has been some damage to some Rangefacilities and structures used to support the launches, butlittle damage to public property outside the perimeter of thelaunch sites. Considering the fact that there have beenunavoidable failures during thirty years of new rocketry andspacecraft testing and streamlining of launch operations, it isevident that the Range Safety Control process and systems inplace have prevented and controlled the risk from launchaccidents that could have lead to potentially significant claimsagainst the Government.
This proven track record of success for the Range Safety Controlsystems and practices at the National Ranges may cast doubt onthe need to discuss the public risk exposure levels and thepotential for third party liability claims. It is worthwhile,however, to discuss the consequences of ELV launch failures inthe absence of the Range Safety Control system since proposedcommercial space launches could originate at new launch sites(perhaps an island site or an ocean platform); use novel,untested or reconfigured tracking and control systems; and notrequire an FTS of high reliability on-board ELV's. This approachwill permit an assessment of the extent of potential damageand/or casualties that can be avoided by the established RangeControl Systems and safety practices (see also Ch.2, Vol.1, andCh.9). While much of the qualitative hazards analysis of launch-related accidents has been given previously in Ch.5, Vol.2, theintent of this chapter is to provide a coherent, self-containeddiscussion of generic public risk associated with commerciallaunch operations for existing ELV's which weighs theconsequences of each accident by its probability of occurrence ina Risk Matrix according to the methods and tools illustrated inChs. 8 and 9.
10.2 RISKS DURING DIFFERENT PHASES OF A TYPICAL MISSION
10.2.1 Pre-Launch Hazards
During the preparation of a vehicle for launch, the chief hazardsderive from the storage and handling of propellants andexplosives. The Ground Safety procedures applied to storedexplosives and propellants that can explode are similar to thoseused in the transportation and handling of these same materialsoff-site. The protective measures include quantity-distance
10-1
requirements, so that parties uninvolved with the launch cannotbe affected by any accident. In addition, other structuralprotection (e.g., hardened concrete) and emergency preparednessmeasures are used to contain toxic or corrosive materials withinthe boundaries of the Range in case of an accident on the pad(see also Ch.5, Vol.2).(1,12)
Accidents occurring prior to launch can result in on padexplosions, potential destruction of the vehicle and damage tofacilities within range of the blast wave as well as dispersionof debris in the vicinity of the pad. The types of accidentsdepend upon the nature of the propellants, as discussed in Ch.5.In the case of cryogenic propellants, liquid oxygen alone willcause fires and explosive conditions; if used in association withliquid hydrogen, it can lead to very explosive conditions. Undersomewhat ideal conditions, the TNT equivalence of a hydrogen-oxygen propellant explosion can be as much as 60 percent of theirweight, while that of an RP-1-oxygen explosion can be 20 percentof the weight of the propellants (see Ch.5, Vol.2).(1)
An accident in handling storable hypergolic propellants couldproduce a toxic cloud, liable to move as a plume and dispersebeyond the boundaries of the facility. The risk to the publicwill then depend upon the concentration of population in the pathof this toxic plume and on the ability to evacuate or protect thepopulation at risk until the cloud is dispersed. It is obviouslyadvantageous if the winds generally blow away from populatedareas. There are also specific safety requirements and risksassociated with ground support equipment. The design and use ofthis equipment must incorporate safety considerations.
10.2.2 Launch Hazards
Generally, the on-board destruct system is not activated early inflight (during the first 10 seconds or so) until the failedvehicle clears the Range. This protects Range personnel andfacilities from a command explosion. Failures during the veryearly portion of launch and ascent to orbit can be divided intotwo categories: propulsion and guidance/control. Lighting, windand other meteorological hazards (e.g., temperature inversions)must be considered prior to launch countdown.
Propulsion failures produce a loss of thrust and the inability ofthe vehicle to ascend. Depending on its altitude and speed whenthrust ceases, the vehicle can fall back intact or break up underaerodynamic stresses. If the vehicle falls back, theconsequences are similar to those of an explosion on the ground.The exception is when intact solid rocket motors impact theground at a velocity exceeding approximately 300 fps. In thatcase, the explosive yield may be significantly increased. Ifthere are liquid fuels (hydrogen-oxygen), there is also potential
10-2
for a large explosion, much higher overpressures and more damageto structures at the launch facility. It could also createhigher overpressures off the facility which could break windowsand possibly do minor structural damage to residential andcommercial buildings (see Ch.5, Vol.2).
Solid rocket motor (SRM) failures can be due to a burn-through ofthe motor casing or damage or burn-through of the motor nozzle.In a motor burn- through there is a loss of chamber pressure andan opening is created in the side of the case, frequentlyresulting in structural breakup. The nozzle burn-through mayaffect both the magnitude and the direction of thrust. There isno way to halt the burning of a solid rocket once initiated.Hence, an SRM failure almost inevitably puts the entire launchvehicle and mission at risk. When there are several strapped-onSRM boosters, as is commonly the case, the probability of afailure of this type is increased, since any one of these failingcan lead to mission loss.
The purpose of the Range Safety Control system is to destroy,halt or neutralize the thrust of an errant vehicle before itsdebris can be dispersed off-Range and become capable of causingdamage or loss of life. Without a flight termination system(FTS), the debris could land on a population center and,depending upon the type of debris (inert or burning propellant),cause considerable damage. The destruct system generally isactivated either on command or spontaneously (ISDS - theinadvertent separation destruct system is activated automaticallyin case of a stage separation failure) at or soon after the timeof failure. In flight destruction limits vehicle debrisdispersion and enables dispersion of propellants, thus reducingthe possibility of secondary explosions upon ground impact. Thedestruct systems on vehicles having cryogenics are designed tominimize the mixing of the propellants, i.e., holes are opened onthe opposite ends of the fuel tanks. This contrasts withvehicles with liquid storable propellants (e.g., Aerozine-50 andN2O4) where the destruct system is designed to promote the mixingand consumption of the propellant. Solid rocket destruct systemsusually consist of linear shaped charges running along the lengthof the rocket which open up the side of the casing like a clamshell. This causes an abrupt loss of pressure and thrust. Itmay, however, produce many pieces of debris in the form ofburning chunks of propellant and fragments of the motor casingand engines.
The Titan 34D accident on April 18, 1986, about 8 seconds afterlaunch, is an example of a propulsion failure which causedconsiderable and costly damage to the VAFB facility.(2) In thiscase, the solid rocket case failed and the vehicle fragmented andspread burning propellant over the launch site. Typical debrisvelocities were 100 to 300 fps. This Titan 34D failure was the
10-3
result of a burn-through of one of the rocket motor casings. Theexplosion, which occurred at an 800 ft. altitude, was not adetonation, where there is almost instant burning of propellantaccompanied by a significant air blast, but a deflagration, wheremost of the propellant was not consumed in the explosion, butformed a cloud of flying burning debris. Some of the burningpropellant still encased in a section of the rocket motor didappear to explode upon impact. The evidence was a flash of lightrecorded by a camera, although the camera was not directed at thepoint of impact. A series of small craters were also observedafter the accident. It is believed that some of these craterswere formed by violent burning in the soft soil (sand) ratherthan by explosions. Films do show rebound of propellant chunksand shattering upon the rebound. This type of behavior was alsoobserved in earlier Minuteman failures.
In addition to complete loss of control, there are three otherearly flight guidance and control failures that have beenobserved with launch vehicles over the life span of the spaceprogram: failure to pitch over, pitching over but flying in thewrong direction (i.e., failure to roll prior to the pitchovermaneuver) and having the wrong trajectory programmed into theguidance computer. The likelihood of these circumstances dependsupon the type of guidance and control used during the earlyportion of flight. The types are open or closed loop (i.e., nofeedback corrections) and programmer or guidance controlled. Inthe case of vehicles which use programming and open-loop guidanceduring the first portion of flight, failure to roll and pitch ispossible, although relatively unlikely, based on historicalflight data. If the vehicle fails to pitchover, it risesvertically until it is destroyed. As it gains altitude, thedestruct debris can spread over an increasingly larger area.Consequently, most Ranges watch for the pitchover and if it doesnot occur before a specified time, they destroy the vehiclebefore its debris pattern can pose significant risk to structuresand people outside the launch facility or the region anticipatedto be a hazard zone, where restrictions on airspace and shiptraffic apply. Failure to halt the vehicle within this time canproduce a significant risk to those not associated with launchoperations.
With open-loop Stage 1 guidance, a launch in the wrong directioncan occur due to improper programming or improper roll of thevehicle during its vertical rise. This circumstance, althoughconsidered improbable, can be very hazardous. If the Range doesnot halt the flight immediately, the vehicle could overflypopulated regions. Then, even if the vehicle is normal in everyother respect, it could drop jettisoned stages on populatedareas, creating the potential for damage, injury and loss oflife. The detection of improper launch azimuth is usuallyaccomplished visually because radar tracking may not be effectivevery early in flight. Consequently, in making the decision to
10-4
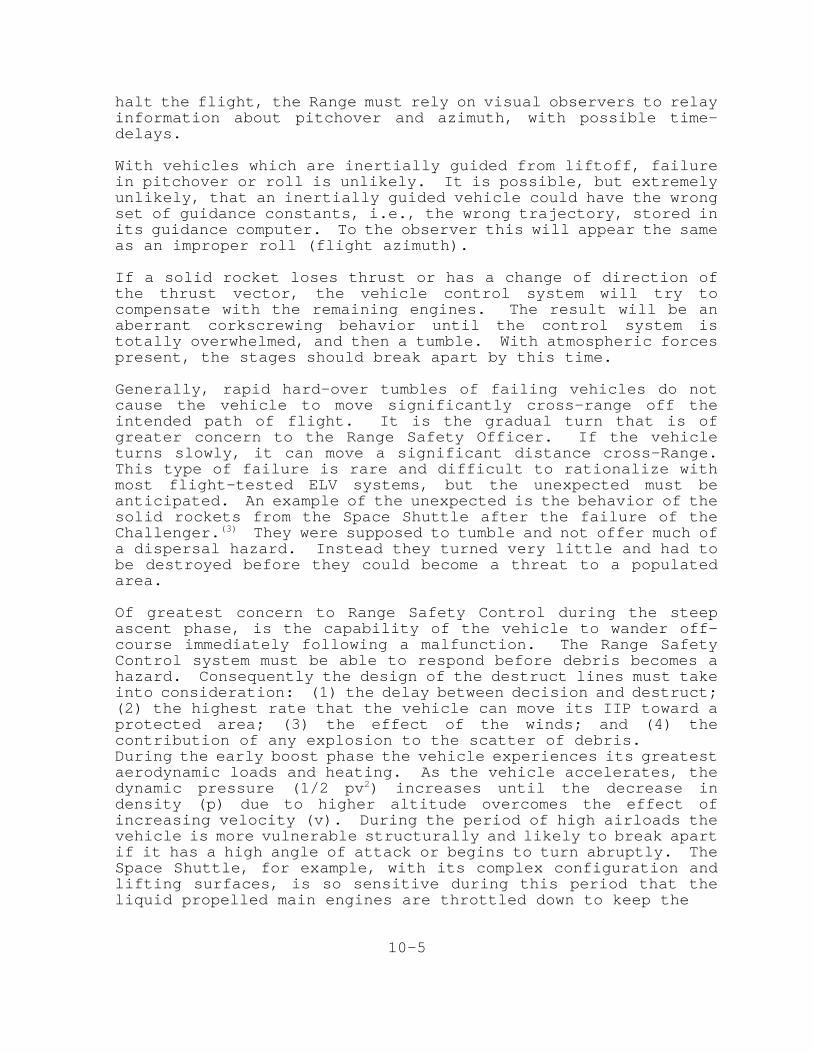
halt the flight, the Range must rely on visual observers to relayinformation about pitchover and azimuth, with possible time-delays.
With vehicles which are inertially guided from liftoff, failurein pitchover or roll is unlikely. It is possible, but extremelyunlikely, that an inertially guided vehicle could have the wrongset of guidance constants, i.e., the wrong trajectory, stored inits guidance computer. To the observer this will appear the sameas an improper roll (flight azimuth).
If a solid rocket loses thrust or has a change of direction ofthe thrust vector, the vehicle control system will try tocompensate with the remaining engines. The result will be anaberrant corkscrewing behavior until the control system istotally overwhelmed, and then a tumble. With atmospheric forcespresent, the stages should break apart by this time.
Generally, rapid hard-over tumbles of failing vehicles do notcause the vehicle to move significantly cross-range off theintended path of flight. It is the gradual turn that is ofgreater concern to the Range Safety Officer. If the vehicleturns slowly, it can move a significant distance cross-Range.This type of failure is rare and difficult to rationalize withmost flight-tested ELV systems, but the unexpected must beanticipated. An example of the unexpected is the behavior of thesolid rockets from the Space Shuttle after the failure of theChallenger.(3) They were supposed to tumble and not offer much ofa dispersal hazard. Instead they turned very little and had tobe destroyed before they could become a threat to a populatedarea.
Of greatest concern to Range Safety Control during the steepascent phase, is the capability of the vehicle to wander off-course immediately following a malfunction. The Range SafetyControl system must be able to respond before debris becomes ahazard. Consequently the design of the destruct lines must takeinto consideration: (1) the delay between decision and destruct;(2) the highest rate that the vehicle can move its IIP toward aprotected area; (3) the effect of the winds; and (4) thecontribution of any explosion to the scatter of debris. During the early boost phase the vehicle experiences its greatestaerodynamic loads and heating. As the vehicle accelerates, thedynamic pressure (1/2 pv2) increases until the decrease indensity (p) due to higher altitude overcomes the effect ofincreasing velocity (v). During the period of high airloads thevehicle is more vulnerable structurally and likely to break apartif it has a high angle of attack or begins to turn abruptly. TheSpace Shuttle, for example, with its complex configuration andlifting surfaces, is so sensitive during this period that theliquid propelled main engines are throttled down to keep the
10-5
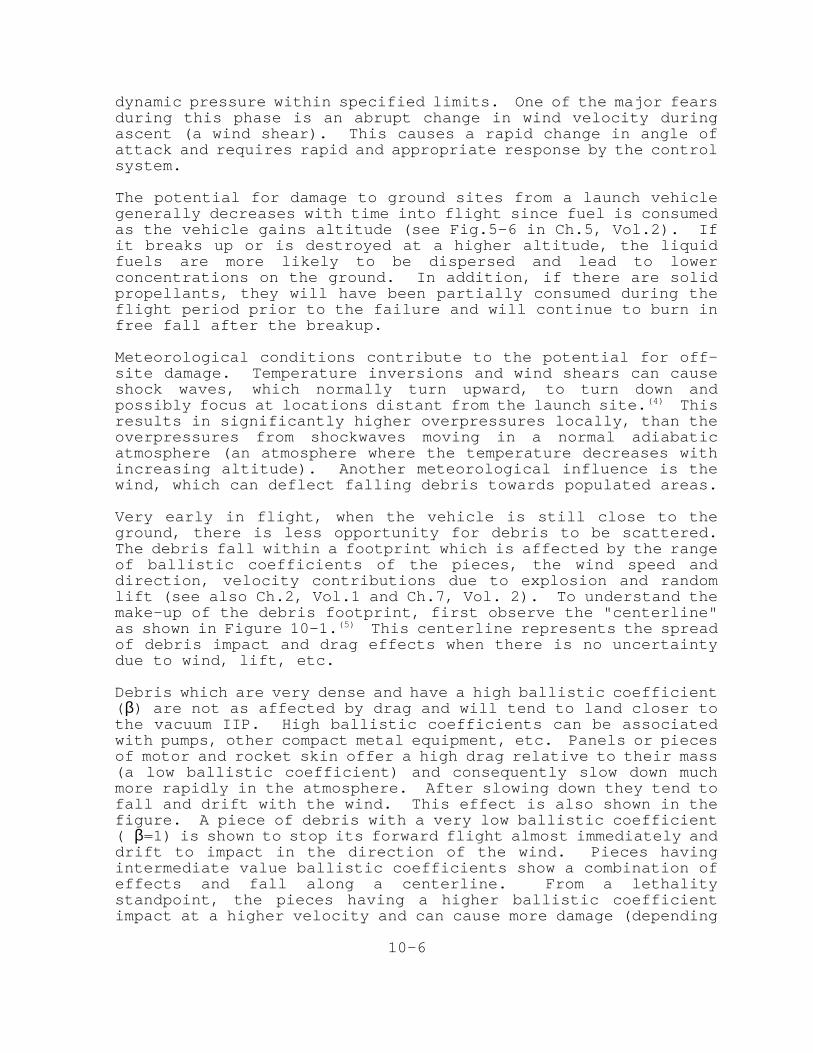
dynamic pressure within specified limits. One of the major fearsduring this phase is an abrupt change in wind velocity duringascent (a wind shear). This causes a rapid change in angle ofattack and requires rapid and appropriate response by the controlsystem.
The potential for damage to ground sites from a launch vehiclegenerally decreases with time into flight since fuel is consumedas the vehicle gains altitude (see Fig.5-6 in Ch.5, Vol.2). Ifit breaks up or is destroyed at a higher altitude, the liquidfuels are more likely to be dispersed and lead to lowerconcentrations on the ground. In addition, if there are solidpropellants, they will have been partially consumed during theflight period prior to the failure and will continue to burn infree fall after the breakup.
Meteorological conditions contribute to the potential for off-site damage. Temperature inversions and wind shears can causeshock waves, which normally turn upward, to turn down andpossibly focus at locations distant from the launch site.(4) Thisresults in significantly higher overpressures locally, than theoverpressures from shockwaves moving in a normal adiabaticatmosphere (an atmosphere where the temperature decreases withincreasing altitude). Another meteorological influence is thewind, which can deflect falling debris towards populated areas.
Very early in flight, when the vehicle is still close to theground, there is less opportunity for debris to be scattered.The debris fall within a footprint which is affected by the rangeof ballistic coefficients of the pieces, the wind speed anddirection, velocity contributions due to explosion and randomlift (see also Ch.2, Vol.1 and Ch.7, Vol. 2). To understand themake-up of the debris footprint, first observe the "centerline"as shown in Figure 10-1.(5) This centerline represents the spreadof debris impact and drag effects when there is no uncertaintydue to wind, lift, etc.
Debris which are very dense and have a high ballistic coefficient(β) are not as affected by drag and will tend to land closer tothe vacuum IIP. High ballistic coefficients can be associatedwith pumps, other compact metal equipment, etc. Panels or piecesof motor and rocket skin offer a high drag relative to their mass(a low ballistic coefficient) and consequently slow down muchmore rapidly in the atmosphere. After slowing down they tend tofall and drift with the wind. This effect is also shown in thefigure. A piece of debris with a very low ballistic coefficient( β=1) is shown to stop its forward flight almost immediately anddrift to impact in the direction of the wind. Pieces havingintermediate value ballistic coefficients show a combination ofeffects and fall along a centerline. From a lethalitystandpoint, the pieces having a higher ballistic coefficientimpact at a higher velocity and can cause more damage (depending
10-6
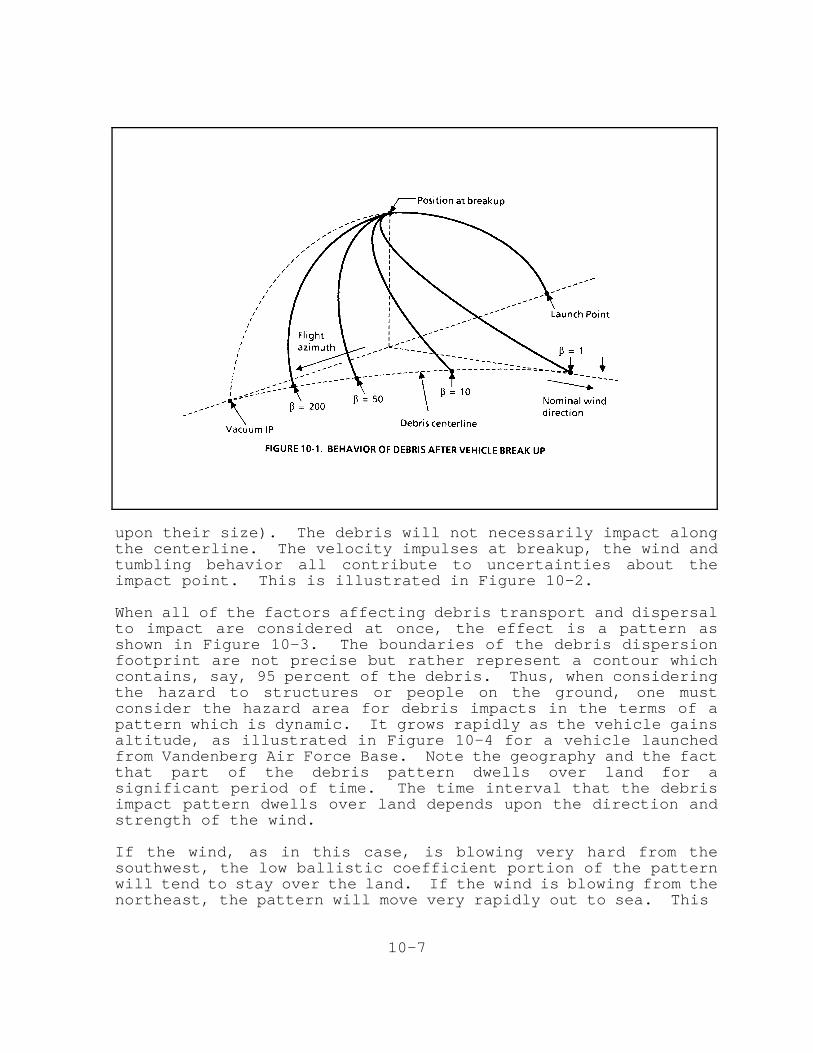
upon their size). The debris will not necessarily impact alongthe centerline. The velocity impulses at breakup, the wind andtumbling behavior all contribute to uncertainties about theimpact point. This is illustrated in Figure 10-2.
When all of the factors affecting debris transport and dispersalto impact are considered at once, the effect is a pattern asshown in Figure 10-3. The boundaries of the debris dispersionfootprint are not precise but rather represent a contour whichcontains, say, 95 percent of the debris. Thus, when consideringthe hazard to structures or people on the ground, one mustconsider the hazard area for debris impacts in the terms of apattern which is dynamic. It grows rapidly as the vehicle gainsaltitude, as illustrated in Figure 10-4 for a vehicle launchedfrom Vandenberg Air Force Base. Note the geography and the factthat part of the debris pattern dwells over land for asignificant period of time. The time interval that the debrisimpact pattern dwells over land depends upon the direction andstrength of the wind.
If the wind, as in this case, is blowing very hard from thesouthwest, the low ballistic coefficient portion of the patternwill tend to stay over the land. If the wind is blowing from thenortheast, the pattern will move very rapidly out to sea. This
10-7
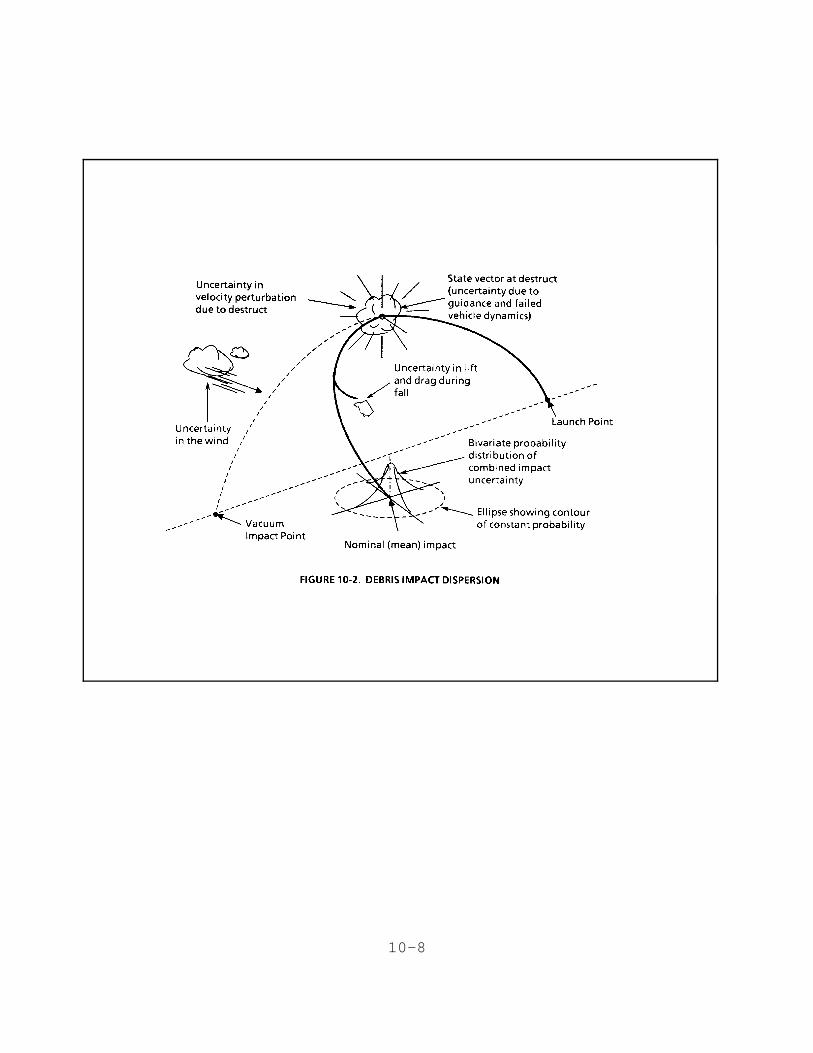
10-8
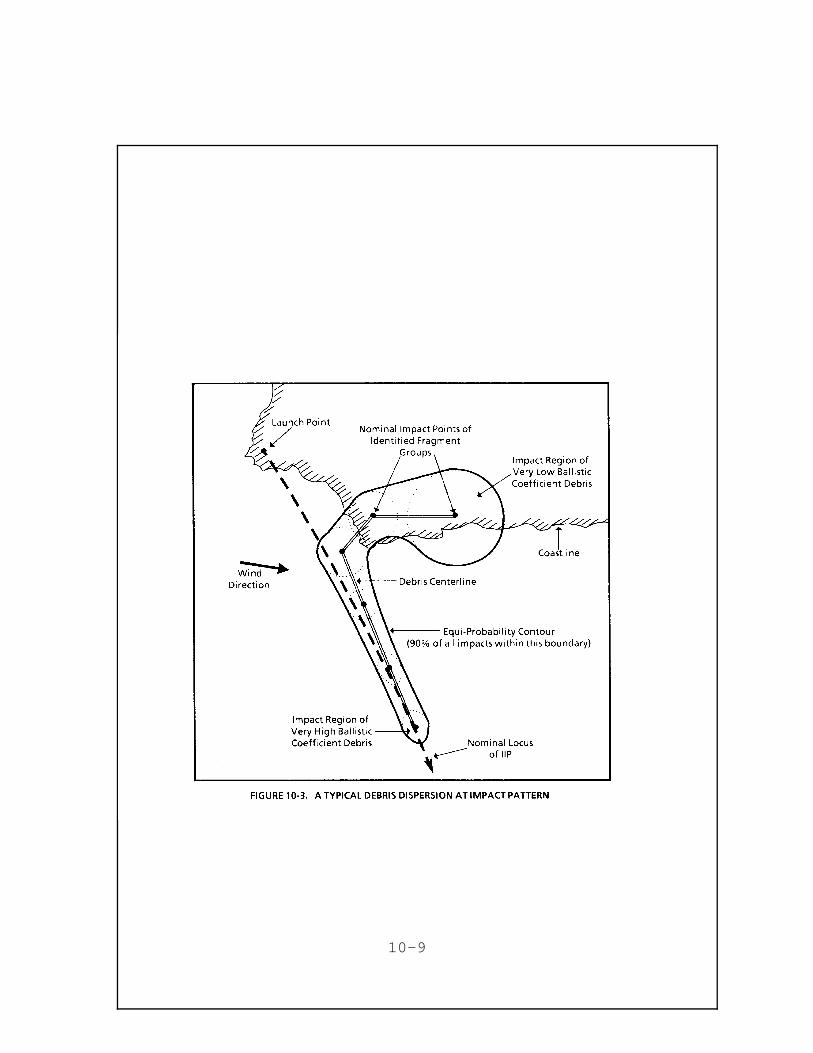
10-9
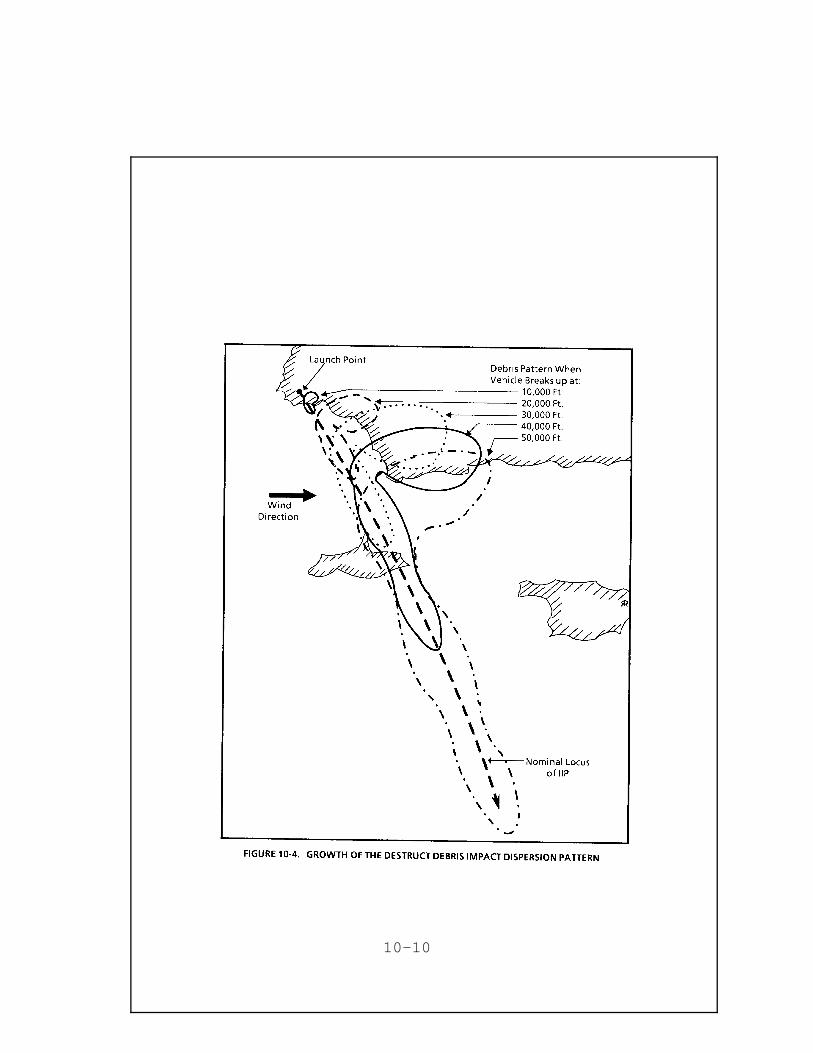
10-10
demonstrates the very important role of wind in evaluating risksof a launch. Depending on prevailing meteorological conditions,including clouds, visibility, atmospheric electricity,temperature and wind conditions, a launch may be postponed untiladverse conditions subside. The bulge in the center of thegrowing debris pattern in Figure 10-4 is due to debris which havevelocities imparted to them from an explosion (spontaneous ordestruct action). The upper-right-hand portion of the debrispattern consists of debris which have a high drag to weightratio, slow down quickly and are carried by the wind, which, inthis case, is blowing from the west. Notice how the debrispattern stretches as the vehicle increases in altitude. Thiseffect continues until the vehicle reaches an altitude whereaerodynamic drag no longer has an effect on dispersion.
For all launches, the boosters, sustainers and other expendableequipment are always jettisoned and fall back to the Earth.Therefore, in planning a mission, care must be taken to keepthese objects from impacting on land, offshore oil platforms,aircraft and shipping lanes. The impact locations are normallyquite predictable, so risks can be avoided or minimized.
As mentioned earlier, during the entire history of the space andmissile programs at VAFB and Cape Canaveral/Cape Kennedy, noerrant launch vehicle has ever been allowed to wander over apopulated area near the launch site and deposit debris upon it. As a consequence there have been no claims, damages orcasualties. This is a convincing argument in the support ofcontinued safe launch and mission planning and approvalprocedures, reinforced by a reliable Range Safety Control system.
10.2.3 Pre-Orbital Hazards
After jettison of the booster stage and, in some cases, the solidrockets, the remaining core vehicle usually contains only liquidpropellants and is at a fairly high altitude. If a failureoccurs and no destruct action takes place, the vehicle may falland remain largely intact till ground impact. Depending upon theinitial altitude, the airloads during the fall may becomesufficient to contribute to the vehicle breakup. If this occurs,the propellants will most likely be dispersed and the only hazardwill be from impacting "inert" debris. In the unlikely eventthat the tanks do remain intact, some explosion may occur atimpact. If the propellants are hypergolic, as in the case of theTitan, there may be considerable burning and a cloud appearing inthe impact area. In this latter case, the damage from debrisimpact will probably be less than the hazard from the toxicpropellants. When an altitude is reached where the vehiclestages can no longer remain intact because of airloads andheating, the only hazard will be due to impacting debris.
10-11
If a destruct or thrust termination system is used to haltascent, as is usually the case, the propellants will be dispersedand should offer very little threat to people on the ground. Aproduct of the destruct action will be inert debris, which couldpresent a hazard at ground impact (for fire, explosion and toxichazards, see Ch.5, Vol 2).
During the boost trajectory of almost any space vehicle from anyUS National Range, the IIP will at some time pass over occupiedland. For Titan 3 launches due east from Cape Canaveral, the IIPwill begin to pass over Africa at t = 475 seconds, and leaveAfrica 3 seconds later. For some southerly launches fromVandenberg Air Force Base, the IIP can pass over southernArgentina and Chile. Activation of the destruct system is of novalue at this point because it poses risks of land impact. It isoften better to let the failing vehicle continue with the hopethat it will clear the land area and impact in the ocean. Thethreat from either launch condition is relatively small becausein both cases the IIP is traveling very fast over land areas(hundreds of miles per second). If, for example, the failurerate of the Titan 3 were uniformly 0.000075 failures per second(historical launch failure probability of .036 divided by 480sec. of burn operation) and the time required for the IIP tocross Africa is 3.2 seconds (see Figure 10-5), then theprobability of failing and causing debris to fall on Africa is3.2 times 7.5 x 10-5 or 2.4 x 10⁻⁴ (one chance in approx. 4200).If the combined cross section of debris which survive to landimpact is on the order of 1000 sq. ft.,and the average density ofpopulation which can be harmed by the debris is 50 per squarestatute mile (according to Ref. 5, this figure is higher than theaverage of the population densities of Zambia, Angola andZimbabwe), then the average number of casualties per launch dueto an African impact is:
Ec =(failure rate)x(dwell time over land)x(debris "casualtyarea")x(population density)
= 7.5 x 10-5 x 3.2 x 1000 x (50/52802) = 4 x 10⁻⁷
This corresponds to less than one chance in a million of acasualty per launch. Whereas Range Safety Control systems canact very positively to restrict and prevent debris from fallingon populated areas earlier in flight, there is no effective riskcontrol when the flight plan calls for a direct land overflight,such as the one discussed above. Consequently the casualtyexpectation of 8x10⁻⁷ is the same with or without a flighttermination system on-board the ELV.
The potential for damage from the impact is based on the area offalling debris (in this case estimated to be 1000 ft.2) and thelikelihood of impacting a structure of value. With a population
10-12
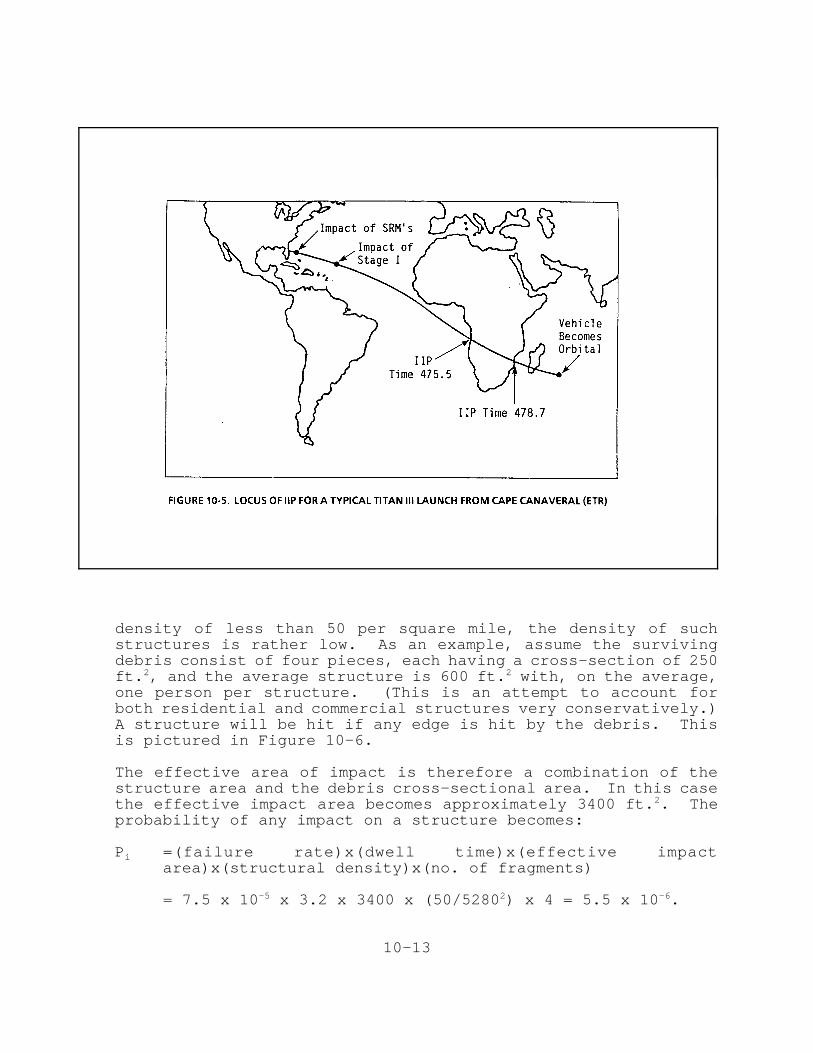
density of less than 50 per square mile, the density of suchstructures is rather low. As an example, assume the survivingdebris consist of four pieces, each having a cross-section of 250ft.2, and the average structure is 600 ft.2 with, on the average,one person per structure. (This is an attempt to account forboth residential and commercial structures very conservatively.)A structure will be hit if any edge is hit by the debris. Thisis pictured in Figure 10-6.
The effective area of impact is therefore a combination of thestructure area and the debris cross-sectional area. In this casethe effective impact area becomes approximately 3400 ft.2. Theprobability of any impact on a structure becomes:
Pi =(failure rate)x(dwell time)x(effective impactarea)x(structural density)x(no. of fragments)
= 7.5 x 10-5 x 3.2 x 3400 x (50/52802) x 4 = 5.5 x 10⁻⁶.
10-13
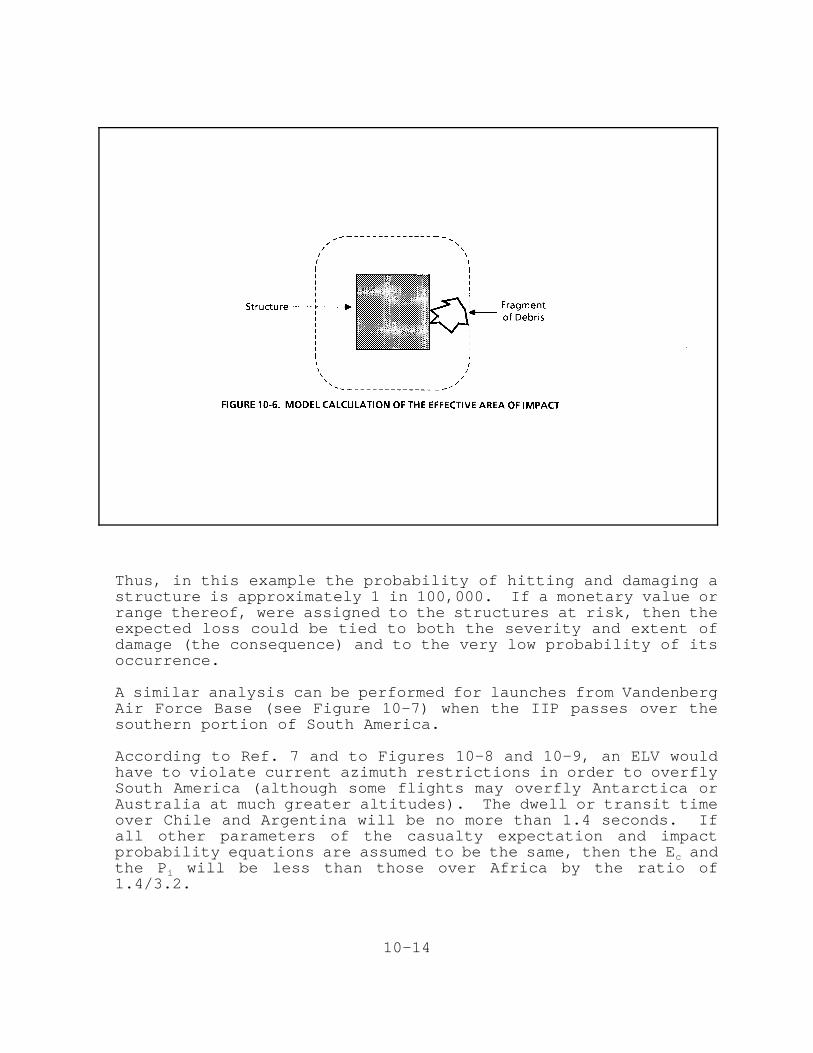
Thus, in this example the probability of hitting and damaging astructure is approximately 1 in 100,000. If a monetary value orrange thereof, were assigned to the structures at risk, then theexpected loss could be tied to both the severity and extent ofdamage (the consequence) and to the very low probability of itsoccurrence.
A similar analysis can be performed for launches from VandenbergAir Force Base (see Figure 10-7) when the IIP passes over thesouthern portion of South America.
According to Ref. 7 and to Figures 10-8 and 10-9, an ELV wouldhave to violate current azimuth restrictions in order to overflySouth America (although some flights may overfly Antarctica orAustralia at much greater altitudes). The dwell or transit timeover Chile and Argentina will be no more than 1.4 seconds. Ifall other parameters of the casualty expectation and impactprobability equations are assumed to be the same, then the Ec andthe Pi will be less than those over Africa by the ratio of1.4/3.2.
10-14
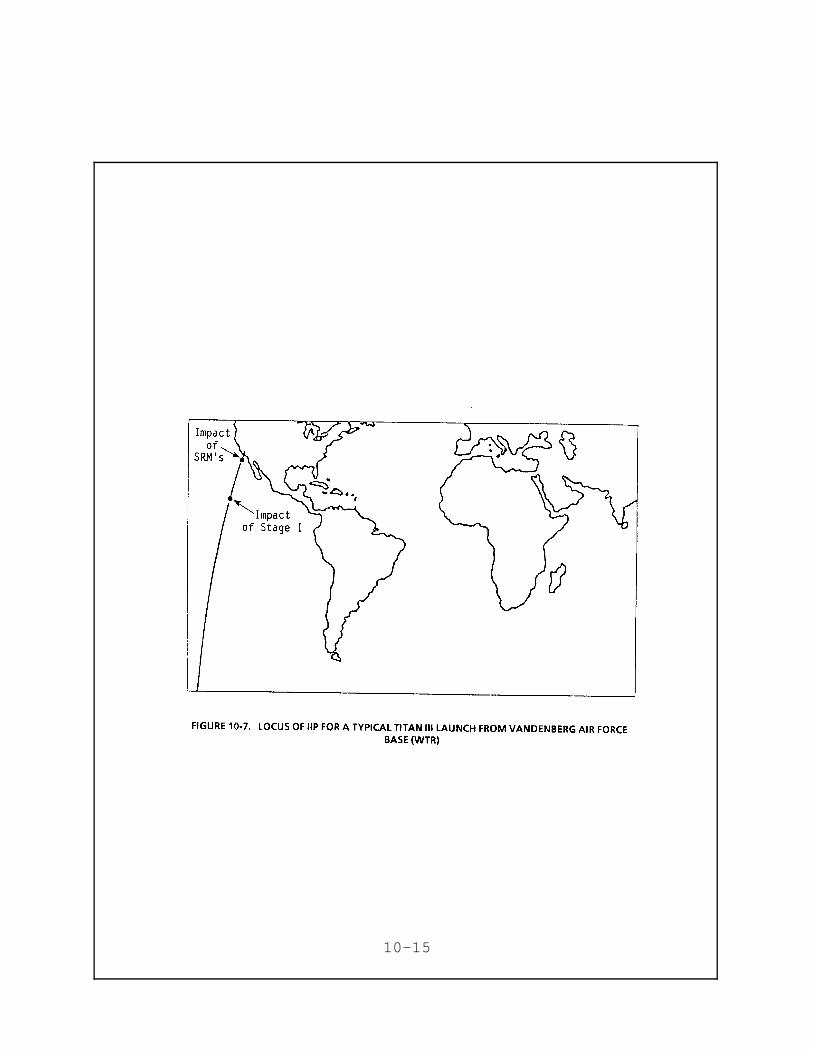
10-15
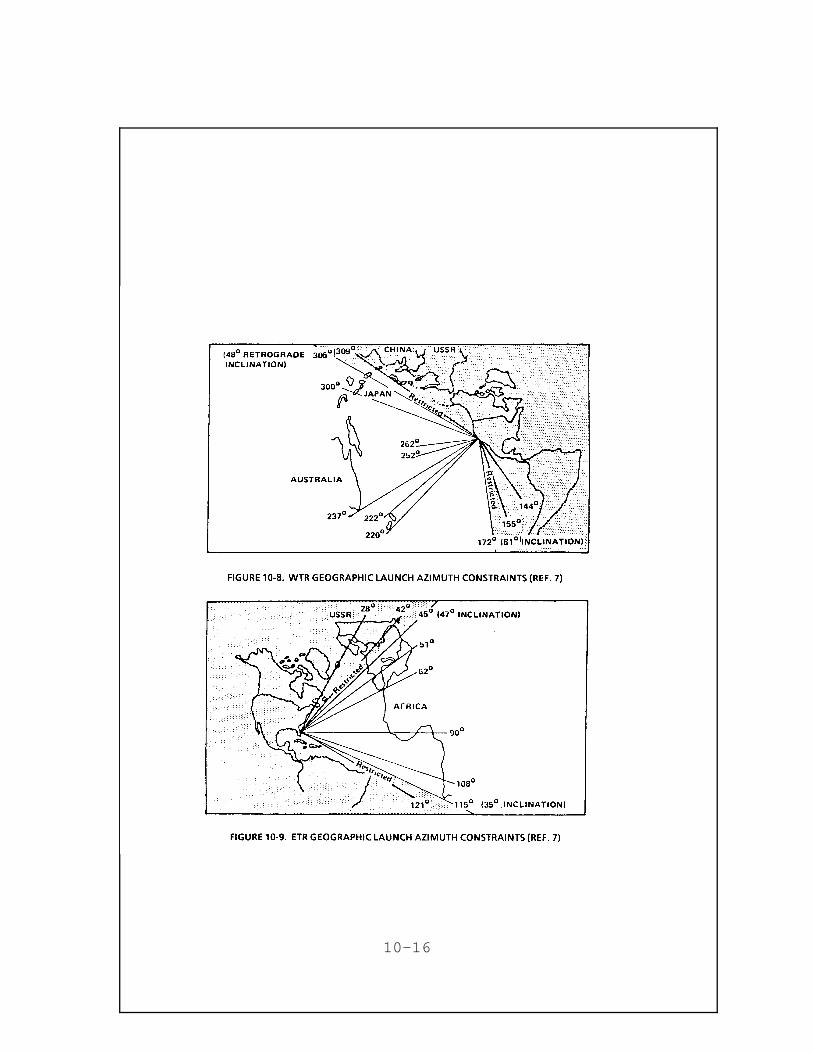
10-16
Thus, very approximately, the casualty expectation for overflightover the southern region of South America will be 1.75 x 10⁻⁷ andthe impact probability on a dwelling or commercial structure willbe 2.3 x 10⁻⁶.
On-orbit collision hazards, once the satellite has been properlyinserted into final orbit, have been discussed in detail in Ch.7. Similarly, orbital decay and re-entry hazards for satellitesand spent rocket stages have been addressed in Ch. 8. Althoughthey contribute to the overall space mission- related hazards,they will not be discussed any further here.
10.3 LAUNCH SITE RISK CONSTRAINTS
The location of the launch facility has a significant impact onthe options for launch missions. Launches to the east alwaysbenefit from the west to east rotation of the Earth.Consequently, equatorial orbits (0o inclination) are bestachieved by launching from facilities which are near the equatorand have a broad ocean area to the east of the launch site.Figures 10-8 and 10-9 above, show the acceptable and restrictedazimuths for launches from the USAF Eastern and Western TestRanges.(6) It becomes apparent that ETR is best suited forlaunches into equatorial orbits and WTR is best suited forachieving polar orbits.
Launches at ETR can also have inclinations other than 0o. If avehicle is launched at an azimuth of 45o from true north, anorbit with an inclination angle of approximately 47o will result.A satellite in an orbit inclined at 47o would cover a groundtrackover the region of the Earth between ±47o latitude. From a riskstandpoint, as the launch azimuth decreases, the locus of IIPmoves closer to the East coast of the US. and Canada. There isalso considerably more overflight of countries in the EasternHemisphere, with potential political and internationalrepercussions for a space launch accident.
The lowest risk to populated areas is almost always associatedwith missions where the launch azimuth is perpendicular to thecoastline and the wind blows in the direction of the launch.This situation is experienced with many launches at the EasternTest Range (from Cape Kennedy or Cape Canaveral). Launches intopolar orbit from Vandenberg Air Force Base have a southerlylaunch azimuth, which is perpendicular to the coast at the launchsite, but then moves parallel to the coast as the Californiacoastline becomes more aligned north to south. Prevailing windsin the region of the Vandenberg launch site tend to be moreonshore and this must be accounted for in establishing destructlines for Range Safety Control.
10-17
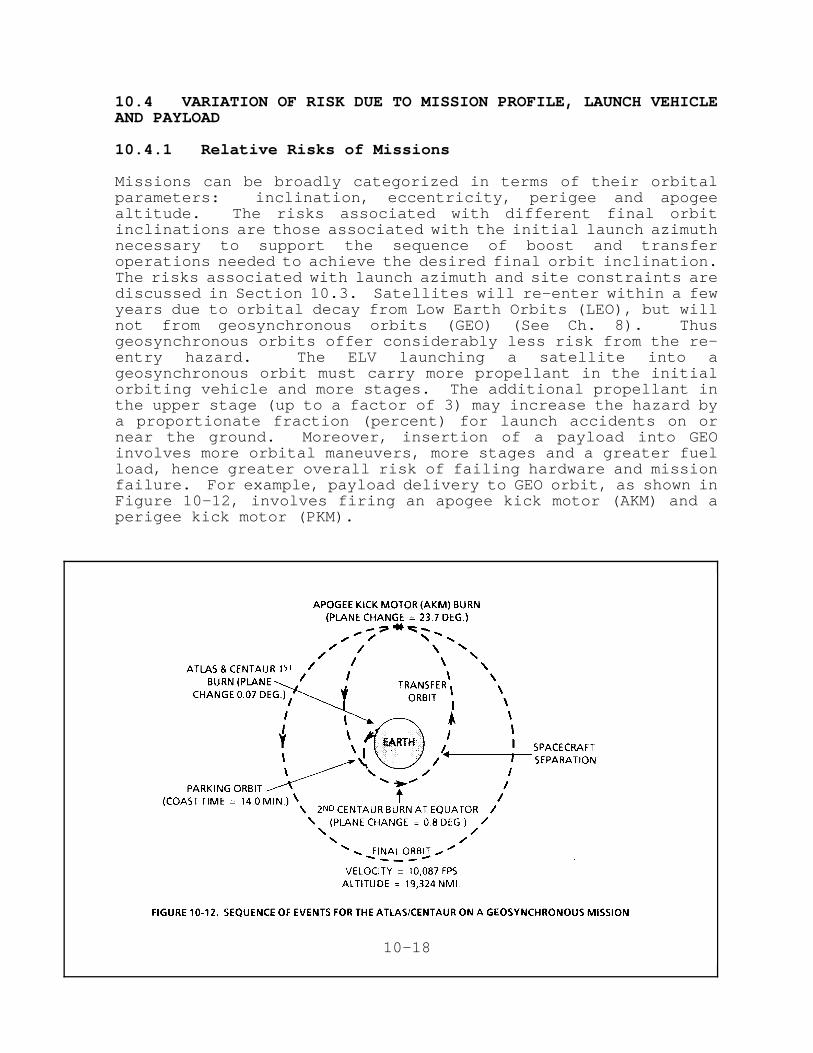
10.4 VARIATION OF RISK DUE TO MISSION PROFILE, LAUNCH VEHICLEAND PAYLOAD
10.4.1 Relative Risks of Missions
Missions can be broadly categorized in terms of their orbitalparameters: inclination, eccentricity, perigee and apogeealtitude. The risks associated with different final orbitinclinations are those associated with the initial launch azimuthnecessary to support the sequence of boost and transferoperations needed to achieve the desired final orbit inclination.The risks associated with launch azimuth and site constraints arediscussed in Section 10.3. Satellites will re-enter within a fewyears due to orbital decay from Low Earth Orbits (LEO), but willnot from geosynchronous orbits (GEO) (See Ch. 8). Thusgeosynchronous orbits offer considerably less risk from the re-entry hazard. The ELV launching a satellite into ageosynchronous orbit must carry more propellant in the initialorbiting vehicle and more stages. The additional propellant inthe upper stage (up to a factor of 3) may increase the hazard bya proportionate fraction (percent) for launch accidents on ornear the ground. Moreover, insertion of a payload into GEOinvolves more orbital maneuvers, more stages and a greater fuelload, hence greater overall risk of failing hardware and missionfailure. For example, payload delivery to GEO orbit, as shown inFigure 10-12, involves firing an apogee kick motor (AKM) and aperigee kick motor (PKM).
10-18
However, even if the mission fails to insert the payload into thecorrect final orbit, public hazards may not increase unless ahighly elliptical transfer orbit leads to early uncontrolled re-entry of upper stages and payload or an on-orbit explosioncreates collision hazards for GEO and LEO operational satellites.
However, for accidents at high altitude when the vehicle is nearorbital, the vehicle with a geosynchronous orbit destination willhave less inert debris and the propellant will probably beconsumed before ground impact. Hence, in this case, the LowEarth Orbit vehicle will have a larger casualty area and offer asomewhat greater overall risk. In general, the changes in risklevel due to the mission profile are relatively small, with theexception of missions requiring restricted azimuths or riskierstaging and orbital maneuvers for achieving the missionobjective.
10.4.2 Hazardous Characteristics of Typical ELV's
Two ELV's, Atlas/Centaur and Titan III, are the primary subjectsof this discussion, although the Delta is also discussed briefly.They offer a broad range of payload lift capacity, they are thelargest of the currently available vehicles and they present avariety of propulsion types and representative associatedhazards. Furthermore, a hazard analysis for two plausibleaccident scenarios, based on a typical Delta vehicle and flightprofile as a function of time after launch and down-range andaltitude evolution, was presented earlier in Figs. 5-5, 5-6 ofCh.5, Vol.2.
10.4.2.1 Titan - The basic Titan III is illustrated in Ch. 5,Figure 5-4. Its central core vehicle consists of two liquid fuelstages, a Transtage and a payload. Two solid rockets (zerostage) are attached to the first core stage and these fire atliftoff and continue until their fuel is consumed. The firstcore stage is ignited near the end of the solid rocket burn(about 108 seconds after lift-off). After the solid rocket fuelis depleted and the first stage ignites, the empty solid motorsare jettisoned (approximately 116 seconds after liftoff). Thefirst stage continues to burn until approximately 273 secondsafter liftoff, when its fuel is depleted and the stage isjettisoned. The fairing around the payload is also jettisoned atthis time to reduce the weight that will have to be acceleratedby the core second stage engine. The fairing is used to reducethe drag and protect the payload during ascent in the atmosphere.At the time of jettison, the vehicle is at an altitude of 400,000feet (130 km) and is essentially out of the atmosphere. Thesecond core stage fires up immediately and thrusts for 216seconds. The Transtage has a restartable rocket motor used for
10-19
orbital maneuvers. Various upper stages can be added for missionand payload flexibility.
During a normal mission, the only risks offered by the Titan arefrom vehicle hardware which is jettisoned. The impact locationsand the approximate locus of IIP for launches from Cape Canaveralare shown in the map in Figure 10-5. The Stage 1 engine coversare not shown there, but are dropped off during the zero-stagesolid rocket motor phase of flight. This particular launchtrajectory is intended to have a minimum inclination angle inorder to support transfer to a geosynchronous orbit.
The impact locations and the approximate locus of IIP for a Titanlaunch from Vandenberg Air Force Base are shown in the map inFigure 10-7. The requirements for "polar" orbits may notactually need fly over of the poles, but rather very highinclination angles, such as 70o. In addition, launches withinclination angles lower than 90o from VAFB can have largerpayloads. Consequently, launches from VAFB may have a range oflaunch azimuths, as indicated in Figure 10-7, depending on theminimum orbital plane inclination angle.
The liquid fuels which propel the core vehicle and Transtage ofthe Titan are non-cryogenic and storable: Aerozine-50 andnitrogen tetroxide used in the core vehicle are highly toxic, ifreleased by accidental venting or a spill (see Appendix B andCh.5, Vol.2). Pre-launch and launch hazards are controlled byhandling and storage regulations and by specifying optimalweather conditions for launch which permit toxic vapors and plumedispersal in case of an accident. If the vehicle is destroyed,these hypergolic propellants do not react as energetically ascryogenic propellants. The spontaneous ignition does not allowthem to mix before igniting and, consequently, they burn, buthave no significant explosion. However, there was an exception:On March 16, 1982, a Titan II, which is basically the first twocore stages of the Titan 3, blew up in its silo at Little RockAir Force Base near Damascus, Arkansas. A very significantexplosion resulted which destroyed the entire facility. Themagnitude of the explosion was ascribed to the confinementprovided by the silo, which did not permit the propellants toscatter while burning. On the other hand, tests of the destructsystem of the Titan have generally indicated that the unconfinedburning propellants have very little explosive energy.
The more pressing problem with Titan liquid propellants is theirtoxicity and corrosivity. The destruction of the vehicle mayproduce a white and reddish-brown (Aerozine-50 and N2O4) cloudwhich is very toxic and also very harmful to vegetation.
In addition to the liquid propellants, the Titan has strap-onsolid propellant motors (similar to the Space Shuttle). The
10-20
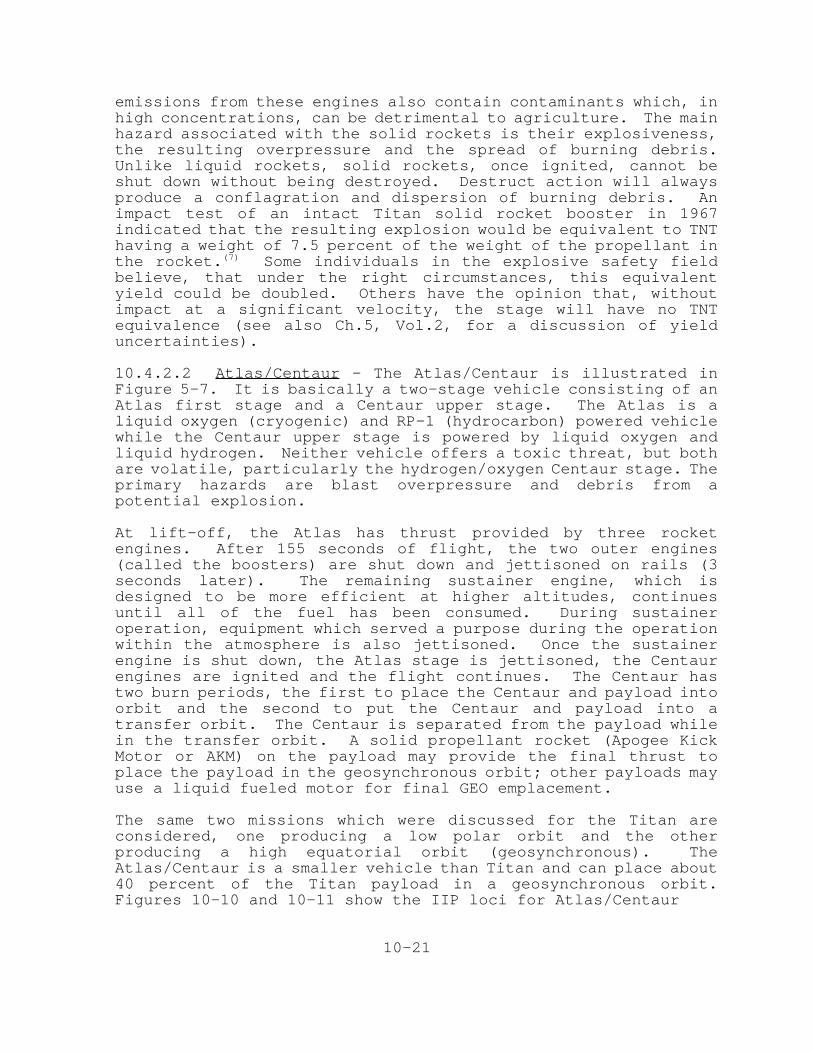
emissions from these engines also contain contaminants which, inhigh concentrations, can be detrimental to agriculture. The mainhazard associated with the solid rockets is their explosiveness,the resulting overpressure and the spread of burning debris.Unlike liquid rockets, solid rockets, once ignited, cannot beshut down without being destroyed. Destruct action will alwaysproduce a conflagration and dispersion of burning debris. Animpact test of an intact Titan solid rocket booster in 1967indicated that the resulting explosion would be equivalent to TNThaving a weight of 7.5 percent of the weight of the propellant inthe rocket.(7) Some individuals in the explosive safety fieldbelieve, that under the right circumstances, this equivalentyield could be doubled. Others have the opinion that, withoutimpact at a significant velocity, the stage will have no TNTequivalence (see also Ch.5, Vol.2, for a discussion of yielduncertainties).
10.4.2.2 Atlas/Centaur - The Atlas/Centaur is illustrated inFigure 5-7. It is basically a two-stage vehicle consisting of anAtlas first stage and a Centaur upper stage. The Atlas is aliquid oxygen (cryogenic) and RP-1 (hydrocarbon) powered vehiclewhile the Centaur upper stage is powered by liquid oxygen andliquid hydrogen. Neither vehicle offers a toxic threat, but bothare volatile, particularly the hydrogen/oxygen Centaur stage. Theprimary hazards are blast overpressure and debris from apotential explosion.
At lift-off, the Atlas has thrust provided by three rocketengines. After 155 seconds of flight, the two outer engines(called the boosters) are shut down and jettisoned on rails (3seconds later). The remaining sustainer engine, which isdesigned to be more efficient at higher altitudes, continuesuntil all of the fuel has been consumed. During sustaineroperation, equipment which served a purpose during the operationwithin the atmosphere is also jettisoned. Once the sustainerengine is shut down, the Atlas stage is jettisoned, the Centaurengines are ignited and the flight continues. The Centaur hastwo burn periods, the first to place the Centaur and payload intoorbit and the second to put the Centaur and payload into atransfer orbit. The Centaur is separated from the payload whilein the transfer orbit. A solid propellant rocket (Apogee KickMotor or AKM) on the payload may provide the final thrust toplace the payload in the geosynchronous orbit; other payloads mayuse a liquid fueled motor for final GEO emplacement.
The same two missions which were discussed for the Titan areconsidered, one producing a low polar orbit and the otherproducing a high equatorial orbit (geosynchronous). TheAtlas/Centaur is a smaller vehicle than Titan and can place about40 percent of the Titan payload in a geosynchronous orbit.Figures 10-10 and 10-11 show the IIP loci for Atlas/Centaur
10-21
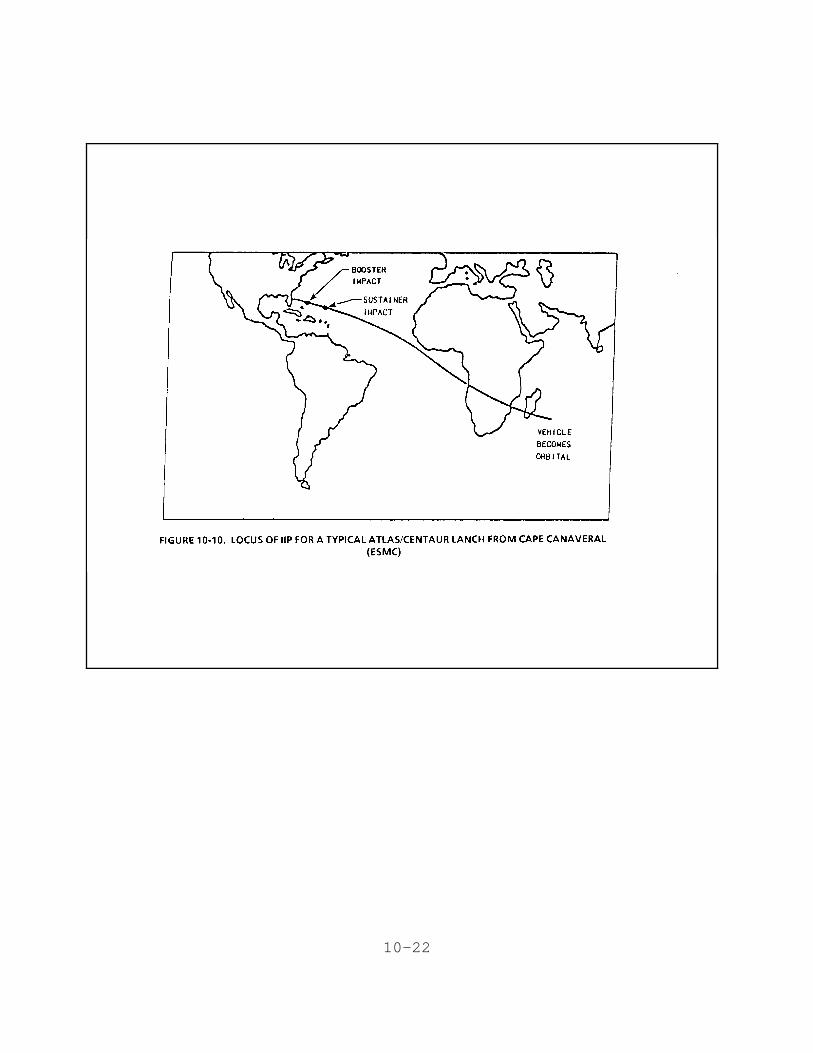
10-22
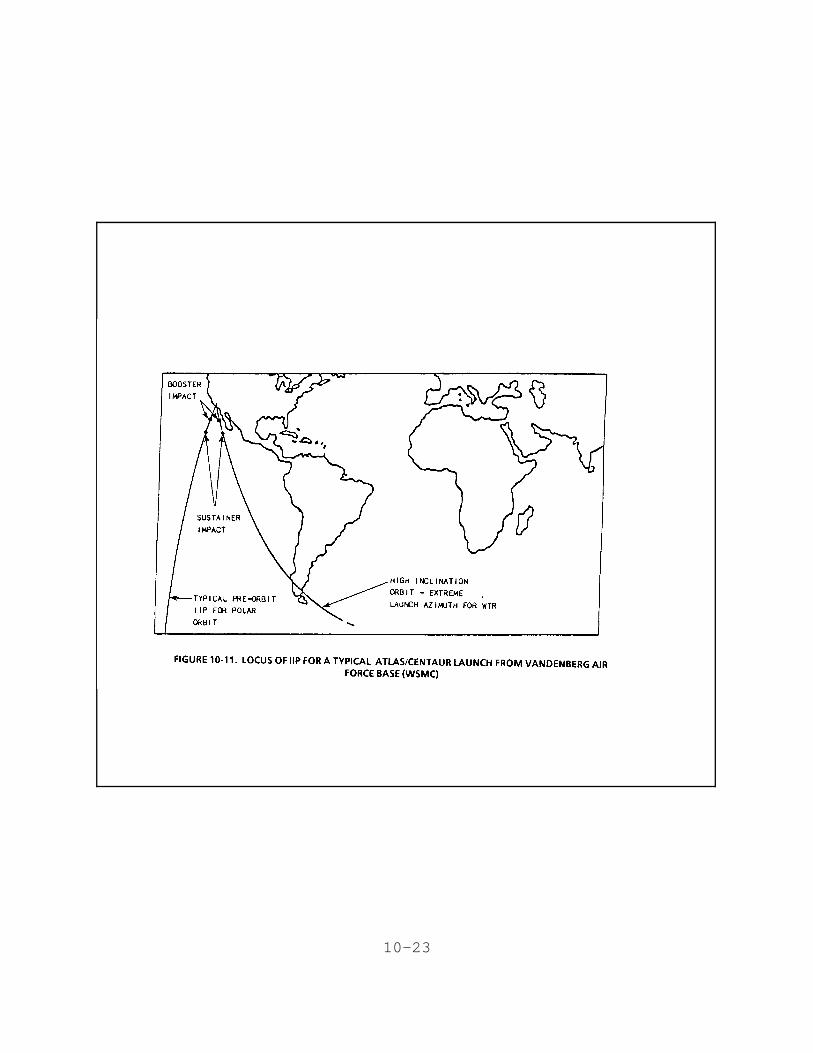
10-23
missions from ESMC and WSMC during the pre-orbital phase. Duringa normal mission, the only hazards associated with theAtlas/Centaur launch are from the jettisoned spent stages, whoseimpact locations are shown in the figures.
The sequence of orbital events for an Atlas/Centaur FLTSATCOMmission is shown above in Figure 10-12.(3) This is a mission verysimilar to any other Atlas/Centaur geosynchronous mission,although in this particular case, there is no initial parkingorbit. The vehicle, after becoming orbital, continues toaccelerate directly into the transfer orbit. Note from Figure10-12 that the Apogee Kick Motor burn also provides the planechange necessary to achieve an equatorial geosynchronous finalorbit.
The hazard potential for the Atlas/Centaur launch will decreasewith time into mission as the vehicle and payload gain altitudeand propellant is consumed (see Figs. 5-5 and 5-6 in Ch.5,illustrating the risk vs. time for a Delta vehicle). The RP-1propellant will not be absorbed into the atmosphere, but it willbecome more widely dispersed as the vehicle reaches a higheraltitude. Note that RP-1 fuel is not toxic or corrosive in thesame sense as hypergolic liquid propellants.
Fewer pieces of debris are expected from an Atlas/Centaurdestruct than for a Titan. This is because of its smaller sizeand it uses only liquid rocket engines. However, the structureof the Atlas is more fragile than that of the Titan and will mostlikely break into more pieces than the Titan core vehicle. Thevery thin Atlas skin pieces will probably scatter more in thewind than the Titan pieces and, consequently, the low ballisticcoefficient portion of the Atlas debris pattern will show greaterdispersion. In this case, greater dispersion does not meangreater risk to ground objects since Atlas debris are lighter andsmaller.
If a failure occurs during the Centaur sustainer burn phase ofthe flight and no destruct action takes place, the vehicle mayremain somewhat intact, depending upon its altitude at that timeand on the nature of the failure. Normally, the airloads duringthe fall will cause vehicle breakup. If this occurs, thepropellants will be dispersed and the only hazard will be fromimpacting "inert" debris. If the tanks were to remain intact,some explosion might occur at ground impacts. However, it isvery unlikely that the tanks will remain intact under highairloads given their structural vulnerability.
The principal hazard anticipated is damage from impacting debris.If the vehicle is destroyed by a destruct command, there will be
10-24
more numerous pieces of debris, but the vehicle will not havebeen allowed to wander over a possibly populated area.
For launches of geosynchronous satellites from Cape Canaveral,the IIP will move over Africa late in pre-orbital flight, asdescribed for the Titan in Section 10.2.3. The previousdiscussion of debris impact hazards to Africa and South Americais also applicable to Atlas/Centaur, except that it will haveless massive debris and the risks may be reduced by as much as afactor of two.
10.4.2.3 Delta - The Delta launch vehicle offers the variety ofpropellants and components of both the Titan and theAtlas/Centaur vehicles. The Delta has strap-on solid propellantboosters (Castor 4 for Stage 0), a core booster stage (Stage 1)which uses cryogenic liquid oxygen and RP-1, an upper stage(Stage 2) which uses liquid storable propellants (Aerozine-50 andN2O4) and a Stage 3 which has a solid rocket motor. The Delta hasbeen launched in a variety of configurations with differentnumbers of solid rocket boosters and different upper stages. Forexample, the enhanced Delta configuration, illustrated in Ch.4,Vol.1, has the capability to place 5,500 lbs. of payload into aLow Earth Orbit and 2,800 lbs. of payload in a GeosynchronousTransfer Orbit. The hazards from a typical Delta launch failurehave been discussed qualitatively and illustrated quantitativelyin Ch.5, Vol.2.
From a comparative risk standpoint, most of the elements of theDelta are on a smaller scale, but there are more of them: thereis considerably less hypergolic propellant than on the Titan (see Ch.4 and App. B); there are solid boosters as on the Titan,but they are much smaller and more numerous; there is also lesscryogenic propellant in the vehicle than the Atlas/Centaur andthere is no explosive and combustible liquid hydrogen fuel. Astrap-down inertial guidance system provides guidance throughoutbooster and upper stage flight. The Delta was considered themost reliable ELV by NASA with an overall failure rate of 6.7percent, due to 12 failures out of 181 launches; only four launchfailures required destruct action. Only six failures led to re-entry of various stages and payload and only one of the six ledto ground impact, but no damage was reported (see Table 3-5, Cap.3, Vol. 1). A discussion of ELV reliability and the implicationsfor public safety from the historical launch statistics were alsodiscussed in Ch.3, Vol.1) The most recent launch accident (Delta178, on May 3, 1986, at Cape Canaveral) occurred 71 seconds afterlaunch when the main engine was prematurely shut-off by anelectrical short, the vehicle tumbled out of control and had tobe destroyed by Range Safety (see Ref.to Mishap Report, Ch.9).The NOAA weather satellite GOES-G payload was destroyed; nodamage or injury resulted from debris.
10-25
10.4.3 Payload Contributions to Launch and Mission Risk
The payload can contribute to overall launch and mission hazardsin several ways:
(1) The payload can initiate a malfunction in the launchvehicle by causing a failure (e.g., electrical short orsurge) or an explosion during launch which could affectthe rest of the vehicle. Generally, the payload isunlikely to cause a launch vehicle failure.
(2) The payload could contribute to the amount of thehazardous material resulting from the accident.Normally this would be in the form of propellant, butif a nuclear heat source is considered, the debris froman accident could present a significant radioactivehazard (see Chs. 7 and 8).
(3) The payload could re-enter and impact on land alongwith other destruct debris, in case of a launch failurethat requires destruct action.
Any payload-related hazards to the public will have to beidentified, examined, quantified and managed to tolerable levelsas part of the DOT/ OCST licensing safety audit (see Ch.1,Vol.1).
10.5 BENEFITS OF RANGE SAFETY CONTROL
10.5.1 Range Safety Control System Reliability
Range Safety Control systems have played a very important role inthe success of the space program. Combined with an outstandingRisk Prevention and Control program, their success has been suchthat there have been no casualties resulting from in-flightlaunch vehicle failures. As mentioned in Ch. 4, this is due toboth mission planning and to the design standards and performancereliability of the Flight Termination Systems (FTS). The USAFdesign goal for FTS hardware reliability is .999 at a 95%confidence level for WSMC and ESMC, whereas the WSMR design goalfor sub-orbital ELV's is .997 to the same confidence level (seeCh.8 and Ch.9 discussions of reliability vs. safety).Performance testing and verification of the FTS reliabilitydepends on the number of such failures, environmental stressduring testing or accident and on other accident specifics. Thereliability that has been achieved is due in part to theredundancies built into both the ground and airborne componentsof the systems. There are no published figures on theoperational reliability of Range Safety systems, but withhundreds of vehicles destroyed with no system failures, one couldconclude that the probability of system failure is less than 1 in1000.
10-26
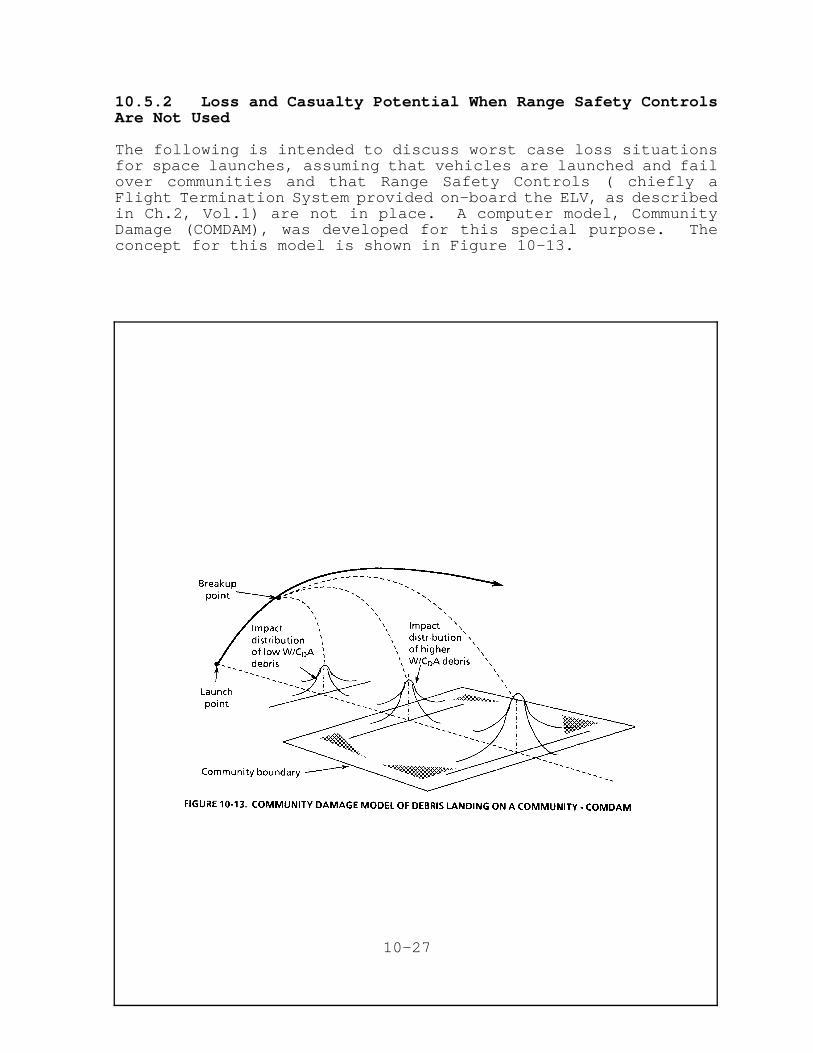
10.5.2 Loss and Casualty Potential When Range Safety ControlsAre Not Used
The following is intended to discuss worst case loss situationsfor space launches, assuming that vehicles are launched and failover communities and that Range Safety Controls ( chiefly aFlight Termination System provided on-board the ELV, as describedin Ch.2, Vol.1) are not in place. A computer model, CommunityDamage (COMDAM), was developed for this special purpose. Theconcept for this model is shown in Figure 10-13.
10-27
The model is deterministic, not probabilistic (see Ch. 8), i.e.,given a catastrophic ELV failure and the absence of a destructsystem, it examines the nature and severity of possibleconsequences of interest, namely a conditional casualtyexpectation. In reality, implementation of Range Safetyrestricts launch azimuths as well as decreasing the likelihood ofany accident that could have public impacts (see Ch.9).
The launch vehicle is assumed to overfly and fail above acommunity located in the vicinity of the Range. This model mightapply to evaluating damage from debris impacting in the vicinityof a Range, say, to Santa Barbara or the Channel Islands nearWSMC, or to Miami Beach near ESMC, or to Albuquerque near WSMR.These scenarios are obviously unrealistic because launch vehiclesare neither allowed to overfly populated areas nor allowed toproceed without certified Flight Termination Systems. On theother hand, COMDAM may afford insight into the potential ofunconstrained launch operations for accidental casualty andproperty loss.
For simplicity, the hypothetical community at risk is laid out asa square, with several types of structures spaced evenly over thearea within the community boundaries. The ELV is assumed to failand break into pieces spontaneously due to aerodynamic stress.These fragments must be classified according to their ballisticcoefficient and explosiveness (if solid propellant). The debriscan be dispersed by scattering (lift/drag) effects and velocityimpulses which may be imparted to the debris at the time of anexplosive in-flight failure. If a piece of debris impacts theground and explodes, the overpressure (P) and impulse (I) arecomputed on all of the adjoining structures (see also Ch.5,Vol.2). The explosive damage to each structure is computed usingthe formula D = a(Pb)(Ic), where D is the percent damage and thecoefficients a, b and c are unique for each different structureclass and were developed from data gathered from explosiveaccidents.(9,10) If the structure is calculated to be more thansixty percent damaged, it is assumed that it must be totallyreplaced and, thus, equivalent to being 100% damaged. The dollarloss is obtained by multiplying percent damage times the averagebuilding value.
For damage due to inert (non-explosive) debris, kinetic energythresholds are set. If the kinetic energy of an impact fragmentdid not exceed a pre-specified level, it is assumed not topenetrate the structure and cause any damage. If it did exceedthe threshold, the damage to the structure is assumed to be theratio of the area of the fragment to the projected area of thestructure. Casualty expectations, EC, were computed using themodel developed in Ref. 13.
10-28
The flow diagram for this specifically adopted analyticalprocedure is shown in Figure 10-14. These algorithms and logiccan be programmed and used to estimate the approximate expectedlosses and casualties similar to those discussed above. One ofthe reasons for developing such an unrealistic worst-caseconsequence model was to show several effects, such as:
1) the change in total losses as a function of the time oflaunch vehicle failure:
2) the effect of the distance from the point of launch onthe population center at risk; and
3) the influence of exploding debris.
The COMDAM numbers must be treated as approximate at best, andillustrative only, since no specific community has beenconsidered and the consequences of accidents can varysignificantly even under essentially the same conditions. Thefinancial (dollar loss) consequence estimates consider onlydamage, and not business interruption costs.
It should be noted that the above model accounts for structuraldamage produced by:
1- direct impact of inert fragments
2- blasts triggered by the explosion of burning fragmentsupon impact with ground.
Damage mechanisms not included in the model are:
a- fires initiated by burning fragments upon impact withground (e.g., brush fires, gas main explosions andfires).
b- vapor clouds produced by burnt/unburned propellants.
c- blast and fire ball produced in the air at the instantof vehicle breakup.
This COMDAM model does not predict what would occurrealistically, but rather what is the worst that could happen.With the addition of launch azimuth restrictions enforced toavoid land overflight, the provision of a highly reliable FTS on-board the ELV and an effective ground-based Range Safety Controlnetwork, such public damage and casualties as a consequence oflaunch accidents become highly unlikely.
10-29
10-30
10.5.3 Comparison of Risk Acceptability
MIL-STD-882B provides only qualitative definitions of theseverity and frequency of accidents for the purpose of riskassessment.(12) These definitions are reproduced in Tables 10-1and 10-2, since they could be used to demonstrate the relativeacceptability of risks from launch vehicles both with and withoutRange Safety Controls in place.
Although these qualitative definitions apply to military systemsincluding space system certification, acceptance and failure riskanalysis, they can also be applied to hazard assessment forcommercial launches.
Tables 10-3 and 10-4 give two examples from MIL-STD-882B for riskacceptability, in the form of a hazard risk assessment matrix.(12)
The next step is to find the risk associated with ELV launches inthe hazard frequency/acceptability format exhibited in theprevious four tables. When a vehicle (e.g., Titan, Atlas/Centauror Delta) is not under Range Safety Control, there is potentialfor catastrophe if the vehicle fails fairly early in flight nearor over a community. Since all prospective commercial launchvehicles have a historical launch failure frequency of more than4 percent (range from 4 to 14 percent) (see Ch. 3, Vol 1), thismust be considered an "occasional event." With the Range SafetyControl System in place, there is potential for catastrophe onlywhen this system fails to perform its function. Given the provenreliability of modern Range Safety Control systems, theoccurrence of a accidental failure with major public safetyimpacts must be considered improbable or remote.
As the vehicle progresses from launch toward achieving orbit, theassociated risk to the public is reduced, as discussed in Section10.2.3. At this stage the Range Safety System provides little orno benefit, because the debris produced from high altitudedestruct action will be similar to that without destruct andthere is no way to restrict the impact location of the debris.Consequently, both with and without a Range Safety ControlSystem, the risk to the public is approximately the same in thepre-orbital and orbital stage, a marginal hazard with a remoteprobability of occurrence. In returning from orbit (uncontrolledre-entry), there is no possibility of Range Safety Control andthe public risk is again marginal, with a remote probability ofdebris causing any casualties.
10-31
10-32
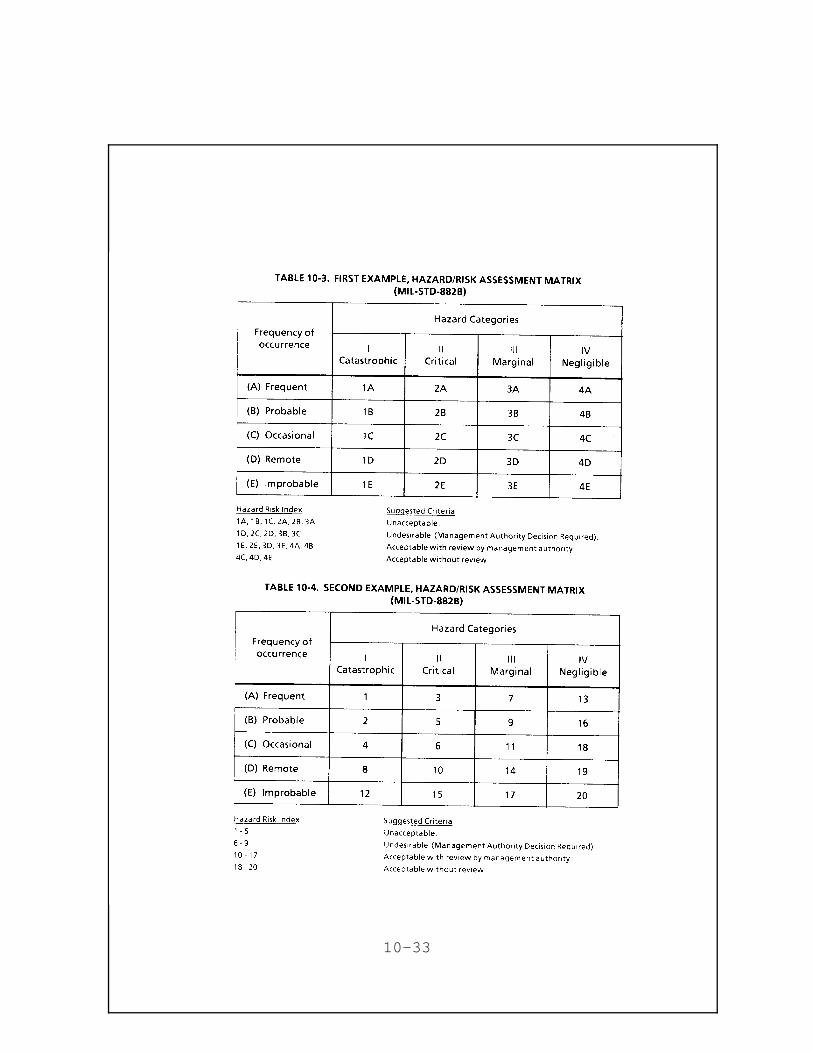
10-33
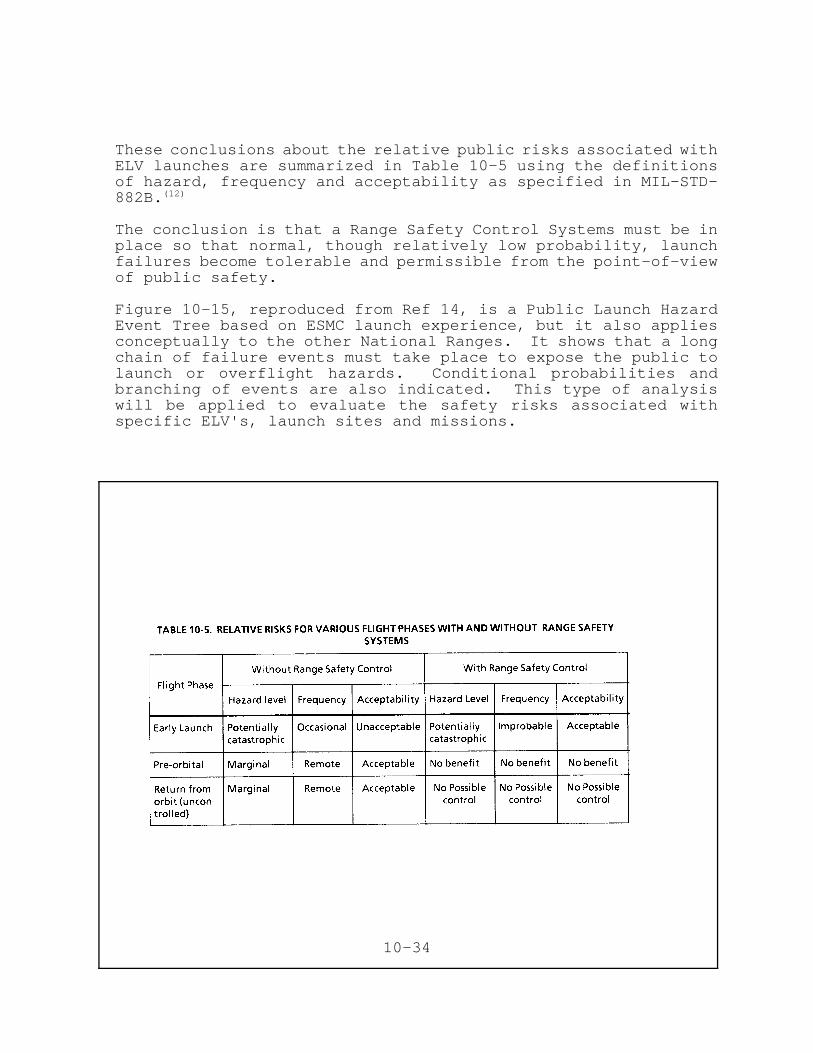
These conclusions about the relative public risks associated withELV launches are summarized in Table 10-5 using the definitionsof hazard, frequency and acceptability as specified in MIL-STD-882B.(12)
The conclusion is that a Range Safety Control Systems must be inplace so that normal, though relatively low probability, launchfailures become tolerable and permissible from the point-of-viewof public safety.
Figure 10-15, reproduced from Ref 14, is a Public Launch HazardEvent Tree based on ESMC launch experience, but it also appliesconceptually to the other National Ranges. It shows that a longchain of failure events must take place to expose the public tolaunch or overflight hazards. Conditional probabilities andbranching of events are also indicated. This type of analysiswill be applied to evaluate the safety risks associated withspecific ELV's, launch sites and missions.
10-34
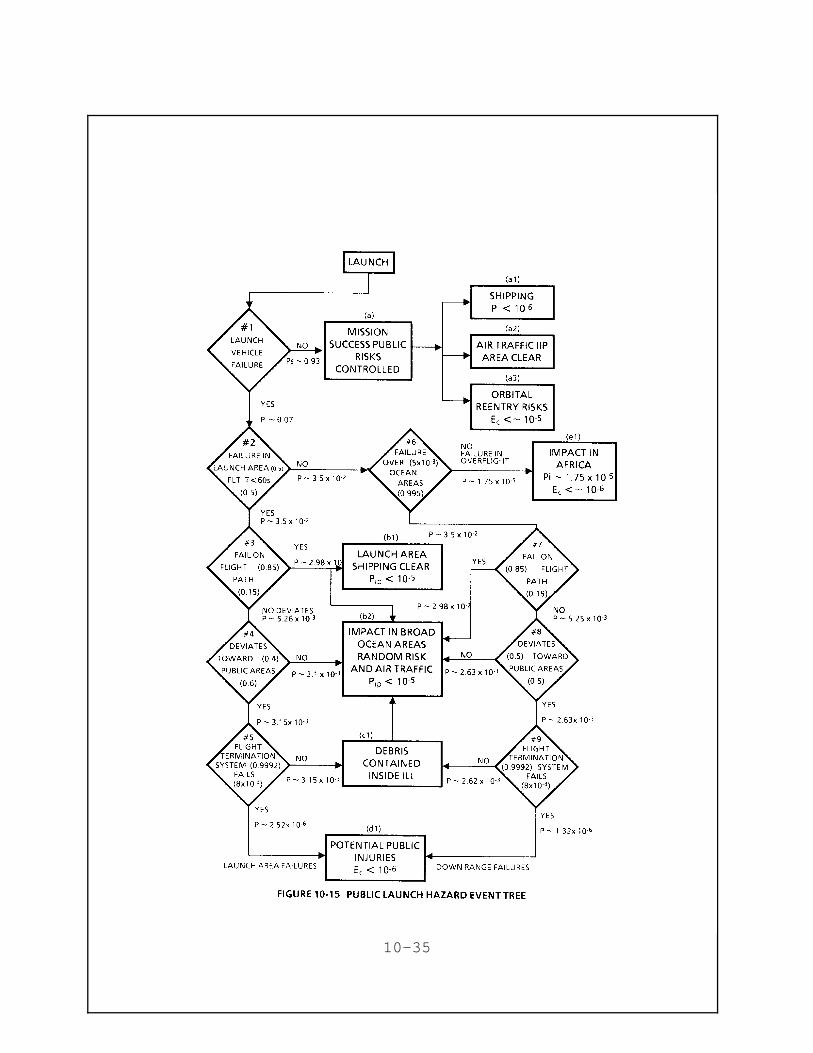
10-35
REFERENCES TO CHAPTER 10
1. "Explosive Safety Standard," AFR 127-100, Headquarters,United States Air Force, Washington, D.C., May 20, 1983.
2. a) "Titan Analysis Unable to Show Cause of InsulationSeparation from Casing," Av. Week and SpaceTechnology, July 7, 1986.
b) "Titan Accident Disrupts Military Space Program,"Science 232, 702, May 9, 1986.
c) "Air Force Determines Potential Cause of TitanExplosion," Science 233, 78 July 18, 1986.
d) "Titan Solid Booster Failure Caused VandenbergAccident," Av. Week and Space Technology, p. 24, May 5,1986.
3. Report of the Presidential Commission on the Space ShuttleChallenger Accident, June 6, 1986, Washington, D.C.
4. Baecker, James B., William F. Heubach and J. RichardWestlake, "Blast Overpressure Window Breakage and CasualtyModeling," Report No. 85-3119-2, J. H. Wiggins Co., RedondoBeach, California, September 1985.
5. Collins, Jon D., Moroni Jameson Jr. and J.L. Jantz, "Real-Time Debris Patterns for Ballistic Missile Launches,"Journal of Spacecraft and Rockets, 13, No. 5, May 1976, pp.310-315.
6. Espenshade, Edward B. Jr. and Joel L. Morrison, Goode'sWorld Atlas, 17th Edition, Rand McNally and Corp., New York,1986.
7. Hazard, Hap (edited by Heizz F. Gehlhaar and Lt. Ronald G.Higden), US Space Launch Systems (Rev. 2), Navy SpaceSystems Activity, Los Angeles, California, July 1, 1977.
8. Vorwerk, Robert F. and Frederick Weals, "624A SolidPropellant Motor Impact Test," Technical Progress Report No.381, NOTS TP3674, US Naval Ordinance Test Station, ChinaLake, California, October 1964.
9. "Range Safety and Range Planning Trajectory Data for the AC-68/F-8 Atlas G/Centaur FLTSATCOM Follow-On Mission," ReportNo. GDSS-SP-87-010, General Dynamics Space Systems Division,San Diego, California, May 1987.
10-36
10. Tancreto, J.E., "Risk Quantification - Part I - StructuralDamage: State of the Art," TM No. 51-81-02, US Naval CivilEngineering Laboratory, Pt. Hueneme, California, January1981.
11. Harnitchek, John J. and Jon D. Collins, "Risk Analysis ofTitan Launches Over SLC 6," Federal Electric Corporation,Vandenberg Air Force Base, California, March 31, 1987.
12. "Military Standard, System Safety Program Requirements,"MIL-STD-882B, US Dept. of Defense, March 30, 1983.
13. Baeker, J.B., J.D. Collins and J.M. Haber, "Launch RiskAnalysis," Journal of Spacecraft and Rockets, 14, pp. 733-738, Dec. 1977.
14. "Baseline Assessment - ESMC," RTI Draft Report for DOT/OCST,May 1988.
10-37
10/2/95 revAPPENDIX A
GLOSSARY AND DEFINITION OF TERMS
Many documents have been referenced to obtain the definitions of
terms that are used in this document. In most cases, the
definitions from the referenced documents have been used
directly, while others have been modified to more fully apply to
the text herein, and where appropriate, some have been developed
by the authors.
The referenced documents are as follows:
1. AFETRM 127-1, Sept. 1972
2. MIL-STD-882, March 30, 1984
3. WSMCR 127-1, May 15, 1985
4. ESMCR 127-1, July 30, 1984
5. NASA GHB 1771.1, Sept. 14, 1984
6. Federal Register, Vol. 51, No. 38, Part 401.5
7. Public Law 98-575, Oct. 30, 1984
8. UMTA System Safety Glossary, June,1986
9. The Aerospace Age Dictionary, 1965
10. The Dictionary of Space Technology, by J.A. Angelo Jr., 1982
11. CPIA 394, Sept. 1984
A-1
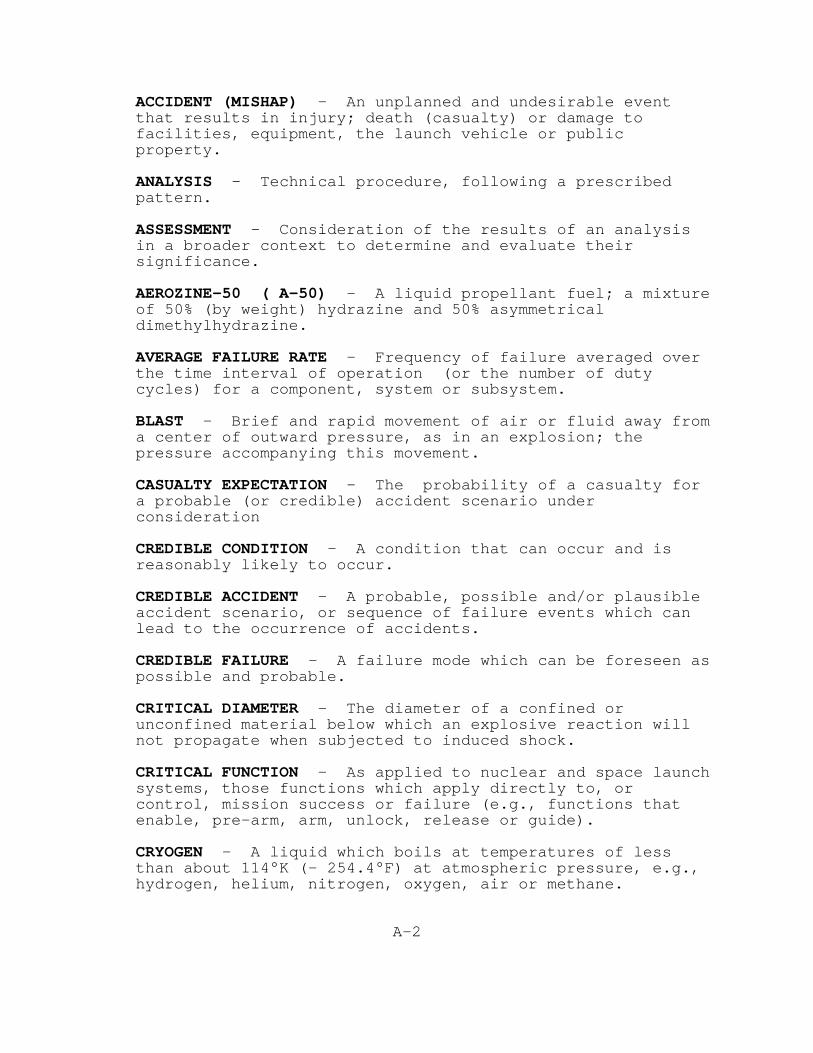
ACCIDENT (MISHAP) - An unplanned and undesirable eventthat results in injury; death (casualty) or damage tofacilities, equipment, the launch vehicle or publicproperty.
ANALYSIS - Technical procedure, following a prescribedpattern.
ASSESSMENT - Consideration of the results of an analysisin a broader context to determine and evaluate theirsignificance.
AEROZINE-50 ( A-50) - A liquid propellant fuel; a mixtureof 50% (by weight) hydrazine and 50% asymmetricaldimethylhydrazine.
AVERAGE FAILURE RATE - Frequency of failure averaged overthe time interval of operation (or the number of dutycycles) for a component, system or subsystem.
BLAST - Brief and rapid movement of air or fluid away froma center of outward pressure, as in an explosion; thepressure accompanying this movement.
CASUALTY EXPECTATION - The probability of a casualty fora probable (or credible) accident scenario underconsideration
CREDIBLE CONDITION - A condition that can occur and isreasonably likely to occur.
CREDIBLE ACCIDENT - A probable, possible and/or plausibleaccident scenario, or sequence of failure events which canlead to the occurrence of accidents.
CREDIBLE FAILURE - A failure mode which can be foreseen aspossible and probable.
CRITICAL DIAMETER - The diameter of a confined orunconfined material below which an explosive reaction willnot propagate when subjected to induced shock.
CRITICAL FUNCTION - As applied to nuclear and space launchsystems, those functions which apply directly to, orcontrol, mission success or failure (e.g., functions thatenable, pre-arm, arm, unlock, release or guide).
CRYOGEN - A liquid which boils at temperatures of lessthan about 114°K (- 254.4°F) at atmospheric pressure, e.g.,hydrogen, helium, nitrogen, oxygen, air or methane.
A-2
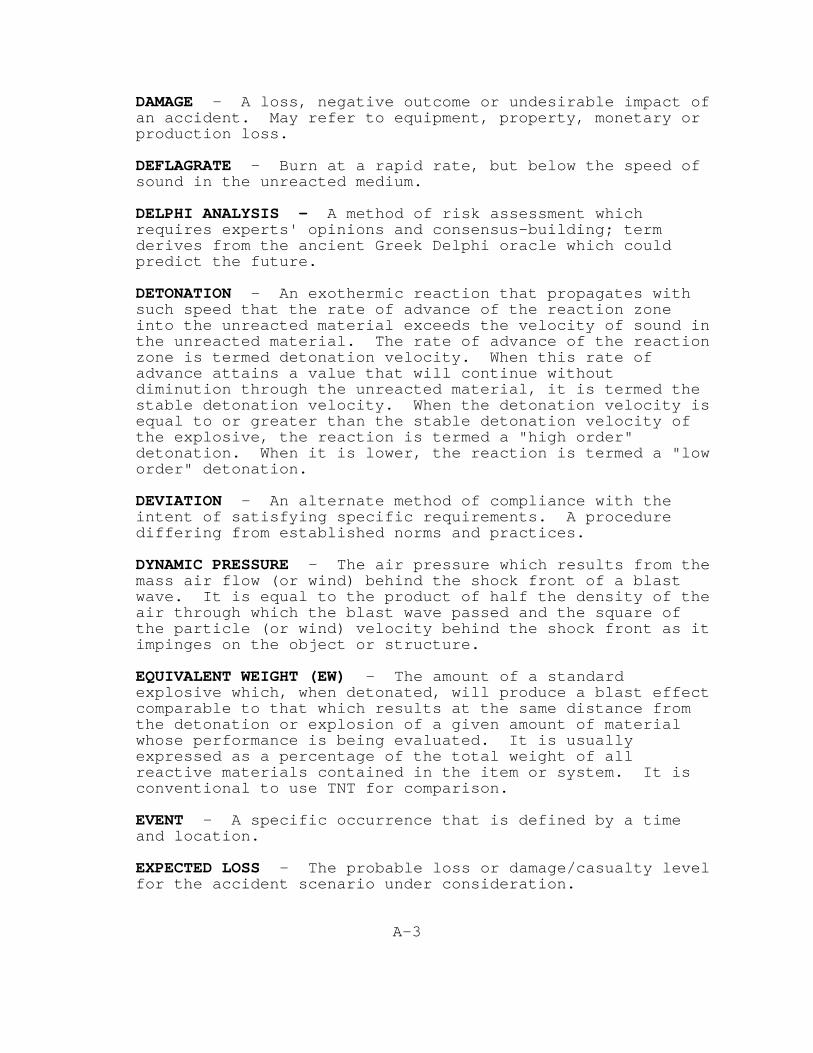
DAMAGE - A loss, negative outcome or undesirable impact ofan accident. May refer to equipment, property, monetary orproduction loss.
DEFLAGRATE - Burn at a rapid rate, but below the speed ofsound in the unreacted medium.
DELPHI ANALYSIS - A method of risk assessment whichrequires experts' opinions and consensus-building; termderives from the ancient Greek Delphi oracle which couldpredict the future.
DETONATION - An exothermic reaction that propagates withsuch speed that the rate of advance of the reaction zoneinto the unreacted material exceeds the velocity of sound inthe unreacted material. The rate of advance of the reactionzone is termed detonation velocity. When this rate ofadvance attains a value that will continue withoutdiminution through the unreacted material, it is termed thestable detonation velocity. When the detonation velocity isequal to or greater than the stable detonation velocity ofthe explosive, the reaction is termed a "high order"detonation. When it is lower, the reaction is termed a "loworder" detonation.
DEVIATION - An alternate method of compliance with theintent of satisfying specific requirements. A procedurediffering from established norms and practices.
DYNAMIC PRESSURE - The air pressure which results from themass air flow (or wind) behind the shock front of a blastwave. It is equal to the product of half the density of theair through which the blast wave passed and the square ofthe particle (or wind) velocity behind the shock front as itimpinges on the object or structure.
EQUIVALENT WEIGHT (EW) - The amount of a standardexplosive which, when detonated, will produce a blast effectcomparable to that which results at the same distance fromthe detonation or explosion of a given amount of materialwhose performance is being evaluated. It is usuallyexpressed as a percentage of the total weight of allreactive materials contained in the item or system. It isconventional to use TNT for comparison.
EVENT - A specific occurrence that is defined by a timeand location.
EXPECTED LOSS - The probable loss or damage/casualty levelfor the accident scenario under consideration.
A-3
EXPENDABLE LAUNCH VEHICLE (ELV) - A launch vehicle(configuration of rocket motors) intended to be used onlyonce, because the majority of its components are expected tobe destroyed or discarded after the launch, during orbitinsertion and/or re-entry.
EXPLOSION - A rapid expansion of matter into a volumegreater than its original one, accompanied (in air) by loudsounds.
EXPLOSIVE - Any chemical compound or mechanical mixturewhich, when subjected to heat, impact, friction, detonationor other suitable initiation, undergoes a very rapidchemical change with the production of large volumes ofhighly heated gases which exert pressures in the surroundingmedium. The term applies to materials that either detonateor deflagrate.
FAILURE - A condition of a component, subsystem or systemin which the intended design or specified operation is notmet.
FAILURE ANALYSIS - The process by which the cause, effect,responsibility and cost of an accident is determined andreported. A method to identify the types of faults ormalfunctions that may occur and lead to accidents.
FAILURE MODE - A specific failure for a criticalcomponent, subsystem or system which can be foreseen oridentified .
FAILURE MODE AND EFFECT ANALYSIS (FMEA) - An inductiveprocedure in which potential malfunctions are identified andthen analyzed as to their possible effects.
FAULT TREE ANALYSIS (FTA) - A deductive analysis procedurewhich graphically presents all possible sequences offailures and chains of events which can result in the finalundesired event (accident) at the top of the tree; used todetermine possible and most probable causes.
FIREBALL - A more or less spherical ball of flamesproduced by the instantaneous release, evaporation andignition of propellants. Generally, the fireball expandsand rises in the atmosphere until the propellant isconsumed.
FIREBRAND - A projected burning or hot fragment whosethermal energy is transferred to a receptor.
A-4
FLAMMABLE LIMITS - The upper and lower vaporconcentrations of fuel to air which will ignite and burn(i.e., deflagrate) in the presence of external ignitionsources; often referred to as the explosive range, althoughthey are not identical.
FLASH EVAPORATION - The changing of a liquid propellantinto a gas when the external pressure is released during therupture of a vessel.
FLIGHT - That period of time beginning with engineignition and continuing until earth impact for suborbital ororbital trajectories, or indefinitely for deep spacetrajectories.
FLIGHT AZIMUTH - The angular direction of the launch andflight trajectory of a launch vehicle measured in degreesfrom true north.
FLIGHT CORRIDOR - Two-dimensional area on Earth's surface(ground track) above which a launch vehicle can fly safely.
FLIGHT PATH - The path traversed through the atmosphere orthrough space by a launch vehicle or spacecraft.
FLIGHT PLAN - Description of the proposed launch and itsevents, including description and definition of payloadorbit.
FLIGHT SAFETY - Protection of the public health and safetyand safety of property during the flight of the launchvehicle and its payload.
FLIGHT TERMINATION SYSTEM (FTS) - Explosive or otherdisabling equipment installed in the ELV stages plusassociated ground equipment for tracking and terminating theflight should it become necessary in order to protect peopleand property on the ground from a malfunctioning ELV. Alsocalled Flight Safety Control System. A Thrust TerminationSystem is a special type of FTS which shuts down thepropulsion system.
GEO - Geosynchronous or Geostationary Earth orbit;equatorial, high altitude Earth orbits in which a satelliterotates with Earth's spin period, thus appearing stationarywith respect to its sub-Earth point.
A-5
GROUND TRACK - The projection of a spacecraft launch,flight and orbital trajectory onto the surface of the Earth,traced by the motion of its sub- Earth point.
HAZARD - Any existing or potential condition that cancause injury or death, that leads to risk of damage to orloss of equipment or property. Also; A source of potentialdamage or harm, in case of an accident.
HAZARD ANALYSIS - An analysis performed to identifyhazardous conditions for the purpose of their elimination orcontrol.
HAZARD MANAGEMENT - An element of the system safetymanagement function that evaluates the safety effects ofpotential hazards by considering acceptance, control orelimination of such hazards.
HAZARDOUS CONDITION - A situation where, because of thenature of the equipment, facilities, personnel, environmentor operation being performed, there is a potential for anaccident. For example, hazardous conditions may exist:1. During propellant transfer to or from the ELV, wheneverwork is in progress on a rocket containing propellant andwhenever a solid propellant motor is in a propulsive state.2. During installation, electrical connection, testing andhandling of ordinance items also, while ordinance items areelectrically connected in the missile.3. Whenever vehicle pressurization systems fail to satisfysafety factors.4. Whenever any toxic or flammable materials are used forany purpose in ELV handling areas.5. Any time that electrical storms are within five milesof the launch complex.
HAZARDOUS EVENT - An accidental occurrence that endangerspeople or property
HAZARDOUS EVENT PROBABILITY - The likelihood, expressed inquantitative terms, that a hazardous event will occur. Bothunits of frequency, (1/ time) and probability(dimensionless), can be used. See also next entry.
A-6
HAZARD PROBABILITY - The probability that a hazard willoccur during the planned life or operation of the system. Hazard probability may also be expressed in qualitativeterms using a relative ranking system, such as:
A. FrequentB. ProbableC. OccasionalD. RemoteE. ImprobableF. Impossible
HAZARD SEVERITY - A qualitative measure of the potentialconsequences that could be caused by a specific hazard incase of an accident. An example of a hazard severityranking system is:
A. CatastrophicB. CriticalC. MarginalD. Negligible
HYPERGOLIC - Term applied to the self ignition of a fueland an oxidizer upon mixing with each other without a sparkor other external aid.
IGNITION TEMPERATURE - The mean temperature at which acombustible material can be ignited and will continue toburn when the ignition source is removed. The ignition temperature for any one substance will varywith its particle size, confinement, moisture content andambient temperature.
IMPACT AREA - An area surrounding an approved impact pointfor vehicle stages under normal operation or for destructedvehicle debris. The extent and configuration of the area isbased upon the vehicle or stage dispersion characteristics.
IMPACT LIMIT LINE - A predetermined line defining a limitbeyond which a failed ELV or its jettisoned spent stageswill not be allowed to impact on the ground, in order toprotect people or property.
IMPULSE - Blast wave parameter denoting the integral ofpressure over pulse duration. It may be positive ornegative depending on whether the pressure is above or belowambient.
A-7
LAUNCH - Release a powered rocket/spacecraft from aspecially designed launch pad or platform.
LAUNCH ABORT - Premature and abrupt termination of alaunch operation because of a potential or diagnosed failureof the launch system or noncompliance with the launch safetyrequirements.
LAUNCH ACTIVITY - The preparation, test or execution oflaunch; the operation of a launch site or both.
LAUNCH AZIMUTH - The horizontal angular directioninitially taken by a launch vehicle at lift-off, measuredclockwise in degrees from true north (see flight azimuth).
LAUNCH COMPLEX - The facility, usually fenced, whichcontains the ELV launch facilities including: the launchpad and servicing structures, the blockhouse or controlbuilding, propellant transfer equipment, support buildings(e.g., vehicle assembly building, VAB) required to support alaunch.
LAUNCH CONTROL CENTER (LCC) - The facility from whichlaunch operations are conducted and monitored.
LAUNCH CONTROL OFFICER - The individual who supervises andcoordinates activities in the launch complex duringprelaunch and post-launch. Also called Range Safety Officer(RSO).
LAUNCH OPERATION - Site, personnel, procedures, equipmentand vehicles, which are collectively used for launchpreparation or launch of a launch vehicle.
LAUNCH PROPERTY - Propellants, launch vehicles andcomponents thereof and other physical items constructed for,or used in, the preparation or launch of a launch vehicle.
LAUNCH RANGE - A finite area along the path of a launchvehicle beginning at a launch site and ending at a pointwhere the vehicle impacts on Earth, achieves orbit orreaches escape velocity. Includes instrumentationthroughout that area used to monitor the flight of thelaunch vehicle for safety and other purposes.
LAUNCH SAFETY - Protection of personnel, safety ofproperty on the ground and of the public health and safetyduring and after a launch operation.
A-8
LAUNCH SERVICES - Activities involved in the preparationof a launch vehicle and its payload (including assembly,test, integration and environmental protection) for launchand the conduct of a launch.
LAUNCH SITE - The geographical location from which alaunch takes place, as defined in any license issued ortransferred by DOT. Includes all facilities located on alaunch site which are necessary to conduct a launch. Seealso Launch Complex.
LAUNCH SITE OPERATOR - A sponsoring or contractororganization (government or commercial) which has thedemonstrated capability to satisfactorily conduct a launchoperation safely from a particular launch site.
LAUNCH VEHICLE - Any rocket propulsion or similarlycapable vehicle constructed for the purpose of inserting apayload in a ballistic or orbital trajectory.
LICENSEE - The person or organization authorized by alicense to conduct specified commercial launch activitiesand who is responsible for conducting such activities inconformance with applicable DOT regulatory requirements.
LIQUEFIED GASES - Substances which are gases at ambientconditions of temperature and pressure that have beenconverted to liquids under controlled pressure andtemperature.
LOW EARTH ORBIT (LEO) - Orbital altitudes up to about1,000 km. (see Ch. 6, Vol.2).
LOWER FLAMMABLE LIMIT (LFL) - The lowest concentration, bypercent of volume, of a gas or vapor in the atmosphere atnormal temperatures and pressures at which the gas or vaporwill ignite and sustain combustion.
MISHAP - An unplanned event or series of undesirableevents that result in death, injury, damage or loss ofequipment and/or property. (See also ACCIDENT)
MISSION - The objective to be accomplished by a proposedlaunch and the general plan for achieving that objective,namely launch azimuth, site, orbital parameters, vehicleconfiguration, design, etc.
ORBIT INCLINATION - The angle between the plane of aparticular orbit and the equator.
A-9
ORBITAL INJECTION - The sequence of operations, in timeand space, whereby a vehicle achieves a combination ofvelocity and position so that its payload is placed into thedesired Earth orbit.
ORBITAL VELOCITY - The velocity at which the centrifugalforce created by the launch vehicle's motion around theEarth equals the Earth's gravity; at this point the vehiclewill orbit the Earth until some other force is applied.
OBLATENESS - The deviation of the Earth's shape from aperfect sphere (flattened poles, bulging equator).
OVERPRESSURE - Blast wave parameter denoting the peakpressure rise over ambient.
PASCAL - Unit of pressure. 1kPa = 1000 Pa. 1 atmosphere= 101 kPa
POOL FIRE - A fuel film formed on the ground and burningin a turbulent diffusion flame located above the film.
PRELIMINARY HAZARD ANALYSIS (PHA) - A qualitative listingand ranking of hazards of interest.
PROPELLANTS - Balanced mixtures of fuel and oxidizerdesigned to produce large volumes of hot gases atcontrolled, predetermined rates, once the burning reactionis initiated.
PSI - Pounds per square inch, a unit of pressure. 1atmosphere = 14.7 psi.
RESIDUAL RISK - Risk exposure levels which cannot befurther reduced or eliminated by risk mitigation(management) strategies and must be accepted.
RISK - The potential for an undesirable consequence toarise from an accident occurring during a hazardousactivity. Technically, Risk (R) is the product of theprobability (p) or frequency (f) of occurrence and itsconsequence (C) (the severity of its impact).
A-10
RISK ANALYSIS - A detailed examination of systems andoperations which involves both the estimation of theexpected frequency or probability of adverse events and theseverity (magnitude) of their consequence expressed in unitsof interest (property damage, casualties, down time,production or business losses). Risk analysis requires;first the identification and characterization of hazards(qualitative analysis); then a quantification and ranking ofhazards in terms of the likelihood of their occurrence,severity of their consequence or their expected risk figure.
RISK ASSESSMENT- Evaluation of analytical results of RiskAnalysis in a broader context.
RISK SCREENING - The ordered ranking of hazards so thatacceptable risk thresholds can be defined and intolerablerisk levels that require reduction and management resourcescan be identified.
RISK MANAGEMENT - The process used to form decisions thatcontrol risk (reduce, eliminate or accept) based on systemsafety analysis. The set of policy and operational controloptions that must be introduced in order to avoid, reduceand eliminate risks. Risk management may focus on eitherprevention and diminished probability of occurrence ofhazardous events or on controlling the impacts of suchevents by emergency preparedness and response planning. Risk management options are usually selected based on cost-benefit analyses.
SAFETY ASSESSMENT REPORT (SAR) - A comprehensiveevaluation of the safety risks being assumed prior to testor operation of the system. It identifies all safetyfeatures of the system, as well as the design and proceduralhazards present and specific controls to be adopted.
SAFETY - A reasonable degree of freedom from thoseconditions that can cause injury, death to personnel, damageor loss of equipment or property; freedom from danger.
SAFETY CRITICAL - A designation placed on a system,subsystem, element, component, device or function denotingthat satisfactory operation of such is mandatory to ensure asafe operation. Such a designation dictates incorporationof special safety design considerations and features. Anycondition, event, operation, process, equipment or systemwith a potential for major injury or damage.
A-11
SAFETY OPERATIONS - Collectively the personnel, equipment,facilities, documented plans, procedures and any otherresource needed for safe preparation and launch of a launchvehicle and its payload.
SHOCK WAVE - A relatively thin region of discontinuitywhich can propagate through fluids and solids and acrosswhich properties (pressure, velocity, density andtemperature) change very rapidly.
SOLID PROPELLANTS - Solid propellants act asmonopropellants. Homogeneous propellants are true solidmonopropellants; each molecule contains both fuel and oxygen(e.g., nitrocellulose-containing compounds). Compositepropellants are physical (not chemical) mixtures of a finelyground oxidizer in a matrix of plastic, resinous orelastomeric fuel (e.g., ammonium perchlorate in a resinbinder).
SYSTEM - A composite, at any level of complexity, ofpersonnel, procedures, materials, tools, equipment,facilities and software. The elements of this compositeentity are used together in the intended operational orsupport environment to perform a given task or achieve aspecific production, support or mission requirement.
SYSTEM SAFETY - The application of engineering andmanagement principles, criteria and techniques to optimizesafety within the constraints of operational effectiveness,time and cost throughout all phases of the system lifecycle.
SYSTEM SAFETY MANAGEMENT - The element that defines thesystem safety program requirements and ensures the planning,implementation and accomplishment of system safety tasks andactivities.
SUBORBITAL LAUNCH - A launch during which the vehicle doesnot achieve orbital velocity and, therefore, falls back tothe Earth's surface following a ballistic trajectory afterthe completion of powered flight.
SUBORBITAL TRAJECTORY - The ballistic path a launchvehicle follows during a suborbital launch.
THERMAL RADIATION - Thermal energy emitted by hot surfacesor gases by virtue of their temperatures.
THRESHOLD LIMIT VALUE (TLV) - The lowest concentrationlevel of a toxic substance at which toxic effects maydevelop.
A-12
TNT EQUIVALENT YIELD - Energy release in an explosioninferred from measurements of the characteristics of blastwaves generated by the explosion.
TRAJECTORY - A series of points in three dimensional spacerelative to time that describes the exact position of thevehicle at any time with respect to Earth's surface.
UPPER FLAMMABLE LIMIT (UFL) - The highest concentration,by percent of volume, of a gas or vapor in the atmosphere atnormal temperatures and pressures at which the gas or vaporwill ignite and sustain combustion.
VOLATILE - A substance that has a high vapor pressure(i.e., it will readily vaporize) at a low temperature.
A-13
10/2/95 rev
APPENDIX B
FUEL PROPERTIES AND CHARACTERISTICS
(from CPIA Publication 394, "Hazards of Chemical Rockets andPropellants", by John Hopkins University, Applied Physics
Laboratory, Laurel, MD, Sept. 1984)
B-1
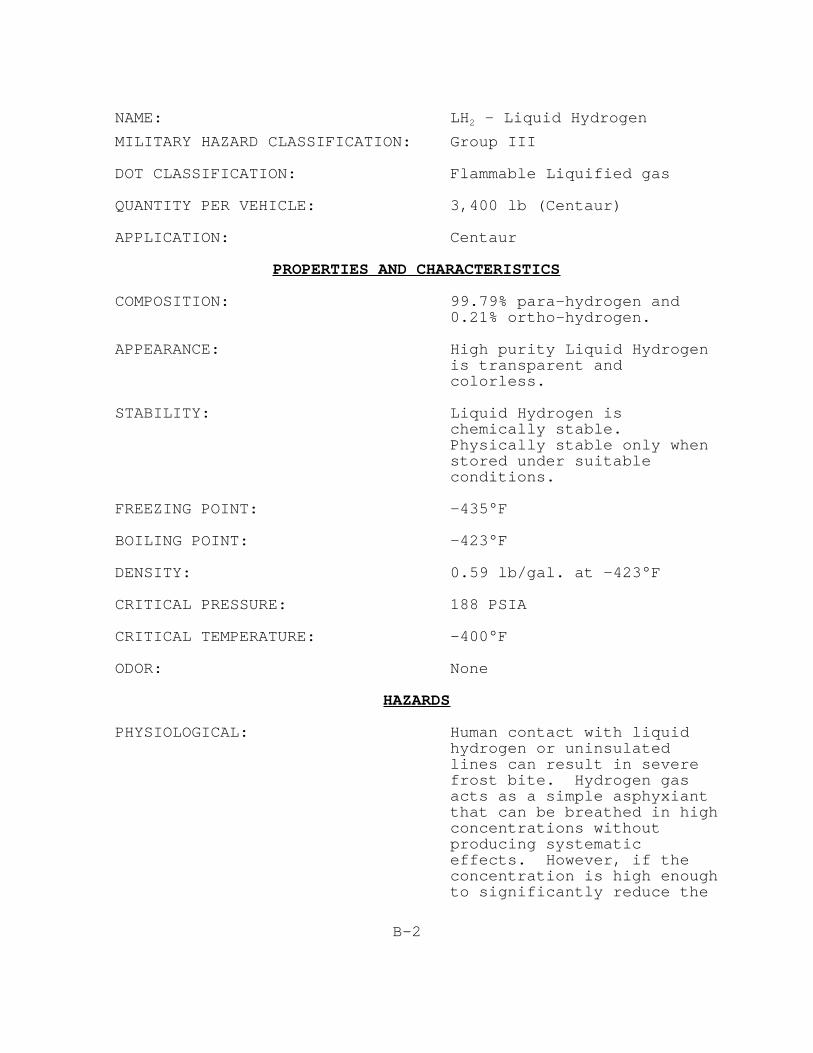
NAME: LH2 — Liquid Hydrogen
MILITARY HAZARD CLASSIFICATION: Group III
DOT CLASSIFICATION: Flammable Liquified gas
QUANTITY PER VEHICLE: 3,400 lb (Centaur)
APPLICATION: Centaur
PROPERTIES AND CHARACTERISTICS
COMPOSITION: 99.79% para-hydrogen and0.21% ortho-hydrogen.
APPEARANCE: High purity Liquid Hydrogenis transparent andcolorless.
STABILITY: Liquid Hydrogen ischemically stable. Physically stable only whenstored under suitableconditions.
FREEZING POINT: -435°F
BOILING POINT: -423°F
DENSITY: 0.59 lb/gal. at -423°F
CRITICAL PRESSURE: 188 PSIA
CRITICAL TEMPERATURE: -400°F
ODOR: None
HAZARDS
PHYSIOLOGICAL: Human contact with liquidhydrogen or uninsulatedlines can result in severefrost bite. Hydrogen gasacts as a simple asphyxiantthat can be breathed in highconcentrations withoutproducing systematiceffects. However, if theconcentration is high enoughto significantly reduce the
B-2
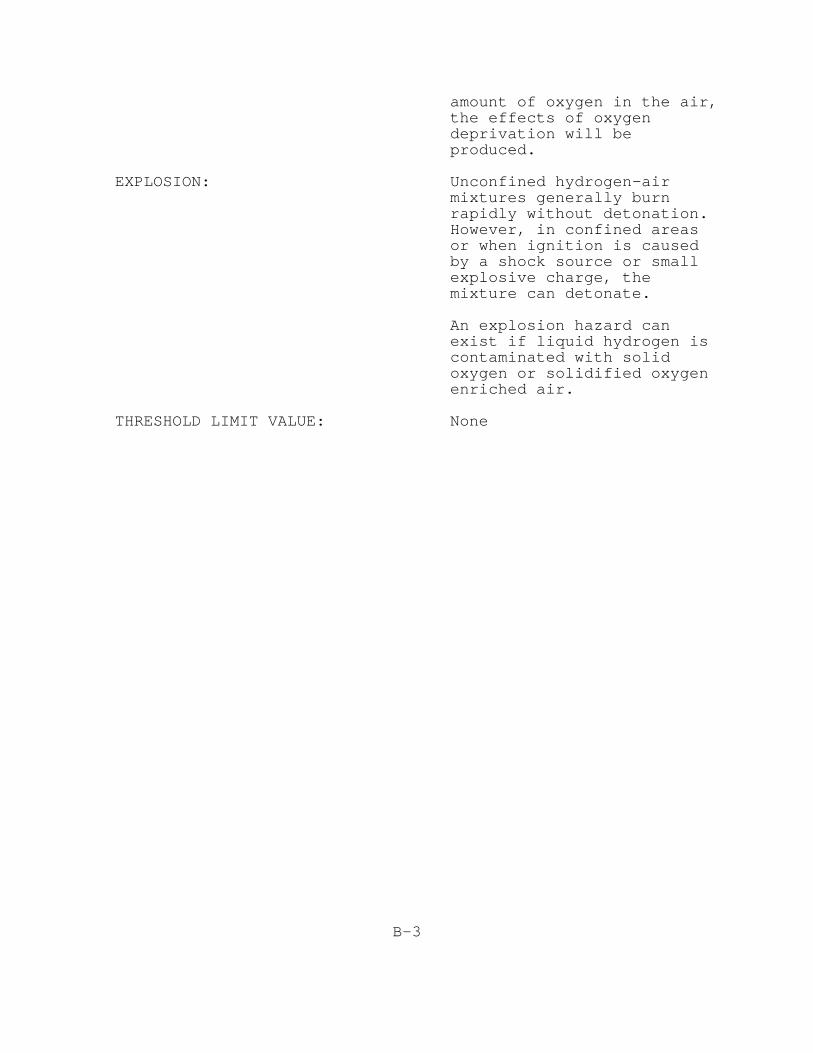
amount of oxygen in the air,the effects of oxygendeprivation will beproduced.
EXPLOSION: Unconfined hydrogen-airmixtures generally burnrapidly without detonation. However, in confined areasor when ignition is causedby a shock source or smallexplosive charge, themixture can detonate.
An explosion hazard canexist if liquid hydrogen iscontaminated with solidoxygen or solidified oxygenenriched air.
THRESHOLD LIMIT VALUE: None
B-3
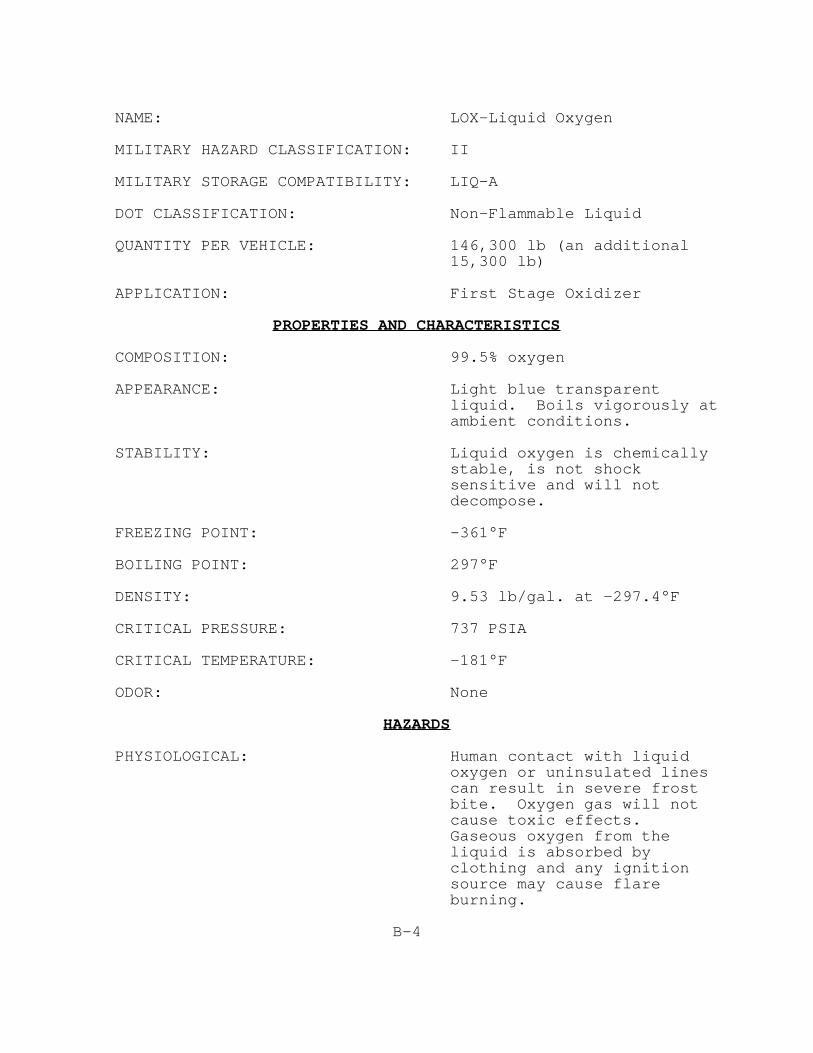
NAME: LOX-Liquid Oxygen
MILITARY HAZARD CLASSIFICATION: II
MILITARY STORAGE COMPATIBILITY: LIQ-A
DOT CLASSIFICATION: Non-Flammable Liquid
QUANTITY PER VEHICLE: 146,300 lb (an additional15,300 lb)
APPLICATION: First Stage Oxidizer
PROPERTIES AND CHARACTERISTICS
COMPOSITION: 99.5% oxygen
APPEARANCE: Light blue transparentliquid. Boils vigorously atambient conditions.
STABILITY: Liquid oxygen is chemicallystable, is not shocksensitive and will notdecompose.
FREEZING POINT: -361°F
BOILING POINT: 297°F
DENSITY: 9.53 lb/gal. at -297.4°F
CRITICAL PRESSURE: 737 PSIA
CRITICAL TEMPERATURE: -181°F
ODOR: None
HAZARDS
PHYSIOLOGICAL: Human contact with liquidoxygen or uninsulated linescan result in severe frostbite. Oxygen gas will notcause toxic effects. Gaseous oxygen from theliquid is absorbed byclothing and any ignitionsource may cause flareburning.
B-4

EXPLOSION: When mixed with liquidoxygen, all materials thatburn represent explosivehazards.
THRESHOLD LIMIT VALUE: None
B-5
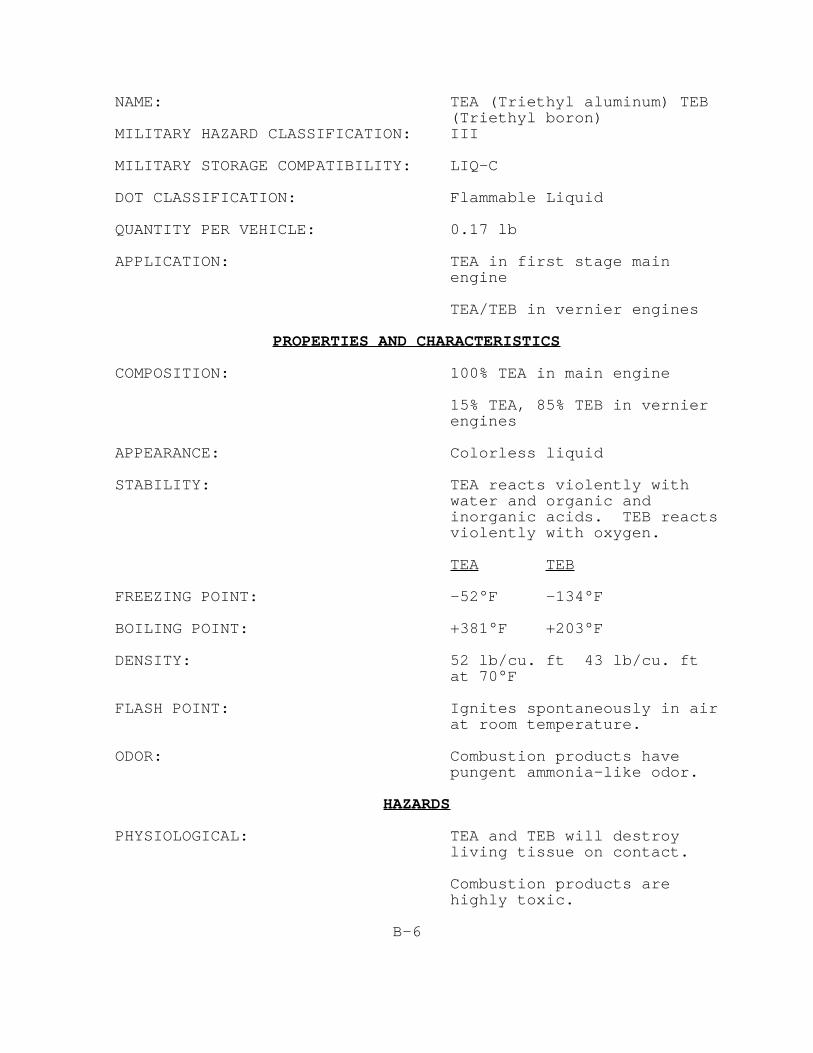
NAME: TEA (Triethyl aluminum) TEB(Triethyl boron)
MILITARY HAZARD CLASSIFICATION: III
MILITARY STORAGE COMPATIBILITY: LIQ-C
DOT CLASSIFICATION: Flammable Liquid
QUANTITY PER VEHICLE: 0.17 lb
APPLICATION: TEA in first stage mainengine
TEA/TEB in vernier engines
PROPERTIES AND CHARACTERISTICS
COMPOSITION: 100% TEA in main engine
15% TEA, 85% TEB in vernierengines
APPEARANCE: Colorless liquid
STABILITY: TEA reacts violently withwater and organic andinorganic acids. TEB reactsviolently with oxygen.
TEA TEB
FREEZING POINT: -52°F -134°F
BOILING POINT: +381°F +203°F
DENSITY: 52 lb/cu. ft 43 lb/cu. ftat 70°F
FLASH POINT: Ignites spontaneously in airat room temperature.
ODOR: Combustion products havepungent ammonia-like odor.
HAZARDS
PHYSIOLOGICAL: TEA and TEB will destroyliving tissue on contact.
Combustion products arehighly toxic.
B-6

FLAMMABILITY: TEA and TEB ignitesspontaneously in air at roomtemperature.
THRESHOLD LIMIT VALUE: Zero
B-7
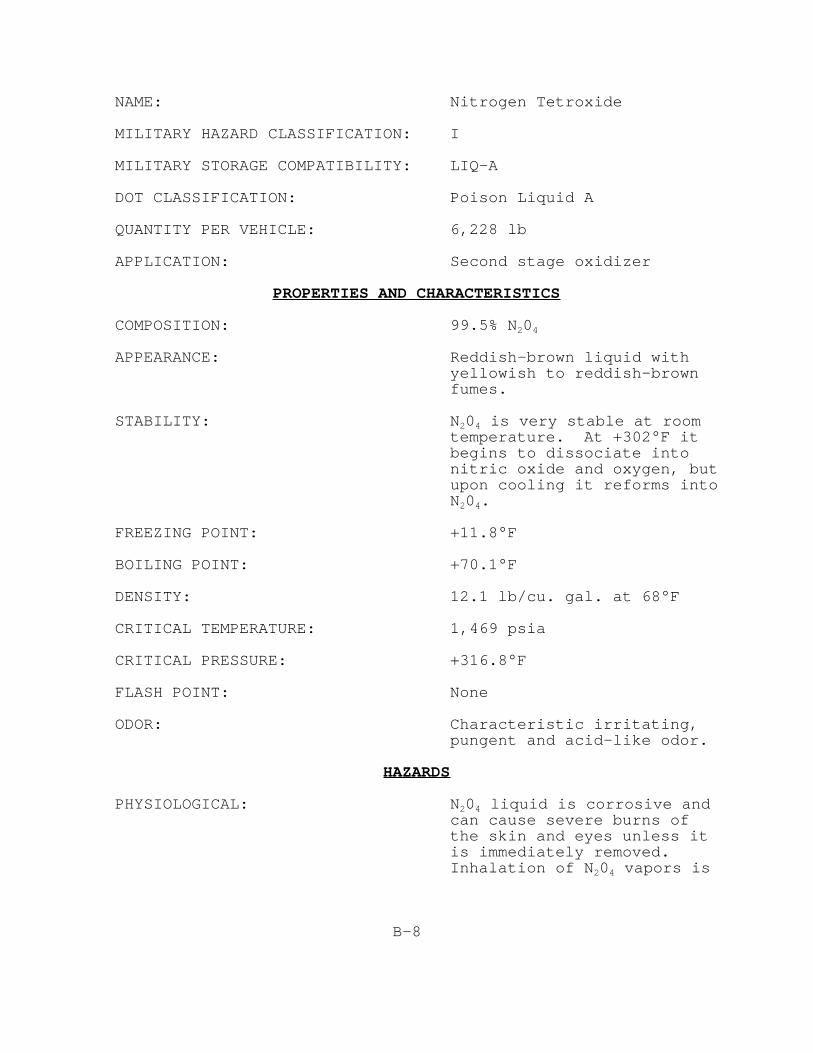
NAME: Nitrogen Tetroxide
MILITARY HAZARD CLASSIFICATION: I
MILITARY STORAGE COMPATIBILITY: LIQ-A
DOT CLASSIFICATION: Poison Liquid A
QUANTITY PER VEHICLE: 6,228 lb
APPLICATION: Second stage oxidizer
PROPERTIES AND CHARACTERISTICS
COMPOSITION: 99.5% N204
APPEARANCE: Reddish-brown liquid withyellowish to reddish-brownfumes.
STABILITY: N204 is very stable at roomtemperature. At +302°F itbegins to dissociate intonitric oxide and oxygen, butupon cooling it reforms intoN204.
FREEZING POINT: +11.8°F
BOILING POINT: +70.1°F
DENSITY: 12.1 lb/cu. gal. at 68°F
CRITICAL TEMPERATURE: 1,469 psia
CRITICAL PRESSURE: +316.8°F
FLASH POINT: None
ODOR: Characteristic irritating,pungent and acid-like odor.
HAZARDS
PHYSIOLOGICAL: N204 liquid is corrosive andcan cause severe burns ofthe skin and eyes unless itis immediately removed. Inhalation of N204 vapors is
B-8
normally the most serioushazard.
SYMPTOMS OF POISONING: Irritation of the eyes andthroat, cough, tightness ofthe chest, and nausea - areslight and may not benoticed. Then hoursafterward, severe symptomsbegin; their onset may besudden and precipitated byexertion. Coughing, afeeling of constriction inthe chest, and difficultbreathing are typical.
FLAMMABILITY: N204 is a corrosive agentwhose corrosiveness isenhanced in the presence ofwater. It is not sensitiveto shock, heat, ordetonation. It is notflammable in air but willsupport combustion.
THRESHOLD LIMIT VALUE: 3 ppm for N02
2.5 ppm for N204
At no time will personnel besubjected to anyconcentration greater thanTLV.
B-9
NAME: RP-1
MILITARY HAZARD CLASSIFICATION: I
MILITARY STORAGE COMPATIBILITY: LIQ-C
DOT CLASSIFICATION: Flammable Liquid
QUANTITY PER VEHICLE: 67,000 lb (an additional11,000 lb.)
APPLICATION: RP-1 is a thermally stablekerosene having a very highenergy content. It is usedfor first stage fuel.
PROPERTIES AND CHARACTERISTICS
COMPOSITION: Hydrocarbon
APPEARANCE: Clear liquid ranging incolor from water-white to apale yellow.
STABILITY: A mixture of RP-1 and liquidoxygen forms a gel which mayexplode upon being subjectedto impact or shock.
FREEZING POINT: -40°F Max.
BOILING POINT: 350° to 525°F
DENSITY: 49.95 to 50.82 lb/ft3 at60°F
FLASH POINT: 110°F
ODOR: Strong, kerosene-like
HAZARDS
PHYSIOLOGICAL: Inhaling vapors may causeheadache, dizziness ornausea. Continuous contactwith the skin can causeirritation.
EXPLOSION: A mixture of vapor and airis dangerous and should beconsidered as an explosive
B-10

mixture.
THRESHOLD LIMIT VALUE: 500 PPM in air.
At no time will personnel besubjected to anyconcentration greater thanthe threshold limit value(TLV).
B-11
NAME: Aerozine 50
MILITARY HAZARD CLASSIFICATION: III
MILITARY STORAGE COMPATIBILITY: LIQ-C
DOT CLASSIFICATION: Flammable Liquid
QUANTITY PER VEHICLE: 3,892 lb
APPLICATION: Second-stage fuel
PROPERTIES AND CHARACTERISTICS
COMPOSITION: Mixture of 50% UDMH and 50%hydrazine
APPEARANCE: Clear, colorless liquid
STABILITY: A-50 is thermally stable andis not shock or frictionsensitive.
FREEZING POINT: +18.8°F
BOILING POINT: +158.2°F
DENSITY: 56.1 lb/cu. ft at 77°F
FLASH POINT: +104°F
CRITICAL TEMPERATURE: +634°F
CRITICAL PRESSURE: 1,696 psia
ODOR: Ammonia gas
HAZARDS
PHYSIOLOGICAL: The liquid can be absorbedthrough the skin; the vaporscan be inhaled. Exposuremay cause irritation of themucous membranes of theeyes, respiratory passages,lungs,and gastro-intestinaltract. Direct skin contactcan cause severe burns.
B-12
MMH and UDMH are convulsantagents, irritants to therespiratory tract and eyesand may irritate the skin. They are absorbed by theskin, oral and inhalationroutes. Hydrazine fuelsform carcinogenicnitrosamine compounds. Also, ACGIH has listed thehydrazines as "SuspectedHuman Carcinogens."
EXPLOSIVE: Liquid is flammable andreacts violently with acidsand oxidizing agents.
THRESHOLD LIMIT VALUE: 0.5 ppm in air.
At no time will personnel besubjected to anyconcentration greater thanthe TLV.
B-13
NAME: Oronite Extreme PressureAdditive
MILITARY HAZARD CLASSIFICATION: None
MILITARY STORAGE COMPATIBILITY: None
DOT CLASSIFICATION: Flammable Liquid
QUANTITY PER VEHICLE: 5.96 lb
APPLICATION: First-stage booster enginelubricant.
PROPERTIES AND CHARACTERISTICS
COMPOSITION: Phosphorus, zinc, sulphur,calcium
APPEARANCE: Transparent, light orangeoil
STABILITY: Stable at controlled storagetemperature below +100°F
FREEZING POINT: +17°F
BOILING POINT: Not Available
DENSITY: 67.8 lb/cu. ft at 60°F
FLASH POINT: +340°F
ODOR: Foul, sulphur-like smell
HAZARDS
PHYSIOLOGICAL: None. Inhaling vapors isunpleasant.
EXPLOSION: A mixture of additive andliquid oxygen forms a gelwhich may explode upon beingsubjected to impact orshock; however, such contactdoes not normally occur. Amixture of additive and fuelis normal in the lubricationsystem and is not hazardous.
THRESHOLD LIMIT VALUE: None
B-14