Embed Size (px)
Citation preview
Hays City Services Survey 2002
By
Brett Zollinger, Ph.D.
University Center for Survey ResearchFort Hays State University
Hays, Kansas 67601
Survey Objectives• Determine citizens’ evaluation of City
services and City government and compare to responses in previous surveys where trend data are available
• Determine perceived need for City economic development activity
• Determine shopping behavior in communities other than Hays
Methods• Telephone survey of Hays residents
• Conducted April 4 to April 24, 2002• Randomly generated phone numbers in
sample (includes unlisted numbers)
• 395 adult respondents (Margin of error = +/-5%)
• Cooperation rate = 74%
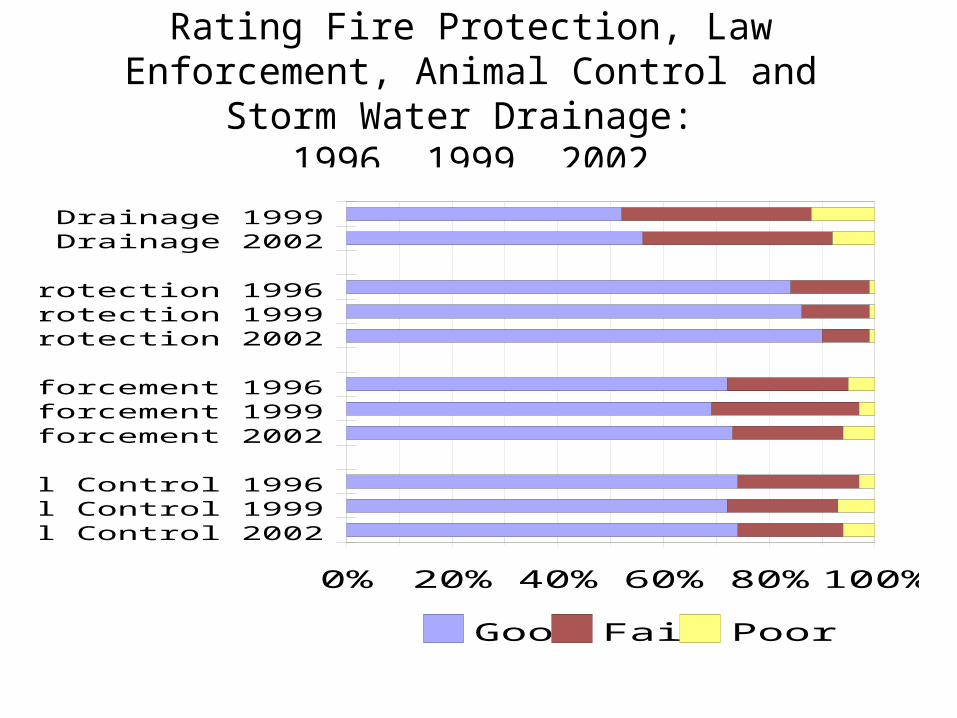
Rating Fire Protection, Law Enforcement, Animal Control and Storm Water Drainage:
1996, 1999, 2002
0% 20% 40% 60% 80% 100%
Animal Control 2002Animal Control 1999Animal Control 1996
Law Enforcement 2002Law Enforcement 1999Law Enforcement 1996
Fire Protection 2002Fire Protection 1999Fire Protection 1996
Storm Water Drainage 2002Storm Water Drainage 1999
Good Fair Poor
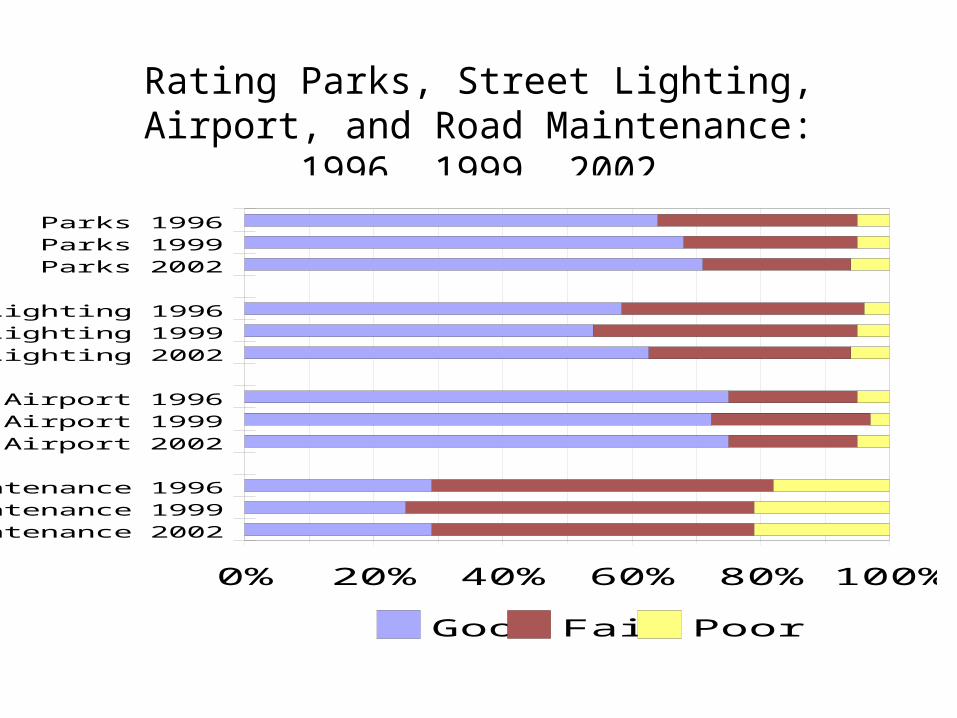
Rating Parks, Street Lighting, Airport, and Road Maintenance: 1996, 1999, 2002
0% 20% 40% 60% 80% 100%
Road Maintenance 2002Road Maintenance 1999Road Maintenance 1996
Airport 2002Airport 1999Airport 1996
Street Lighting 2002Street Lighting 1999Street Lighting 1996
Parks 2002Parks 1999Parks 1996
Good Fair Poor
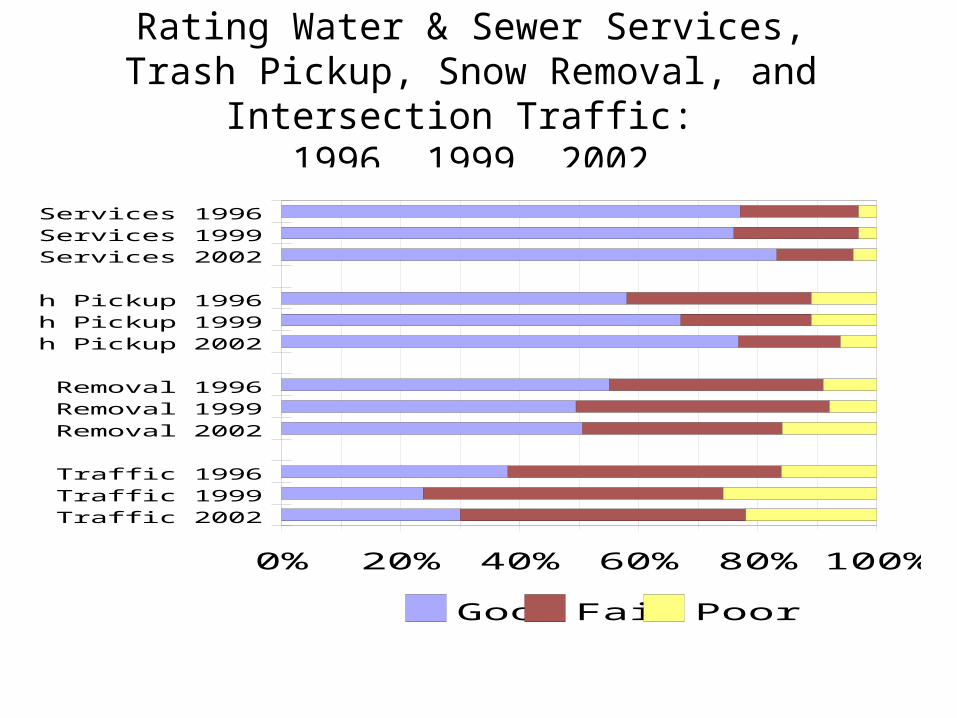
Rating Water & Sewer Services, Trash Pickup, Snow Removal, and Intersection Traffic:
1996, 1999, 2002
0% 20% 40% 60% 80% 100%
Intersection Traffic 2002Intersection Traffic 1999Intersection Traffic 1996
Snow Removal 2002Snow Removal 1999Snow Removal 1996
Trash Pickup 2002Trash Pickup 1999Trash Pickup 1996
Water-Sewer Services 2002Water-Sewer Services 1999Water-Sewer Services 1996
Good Fair Poor
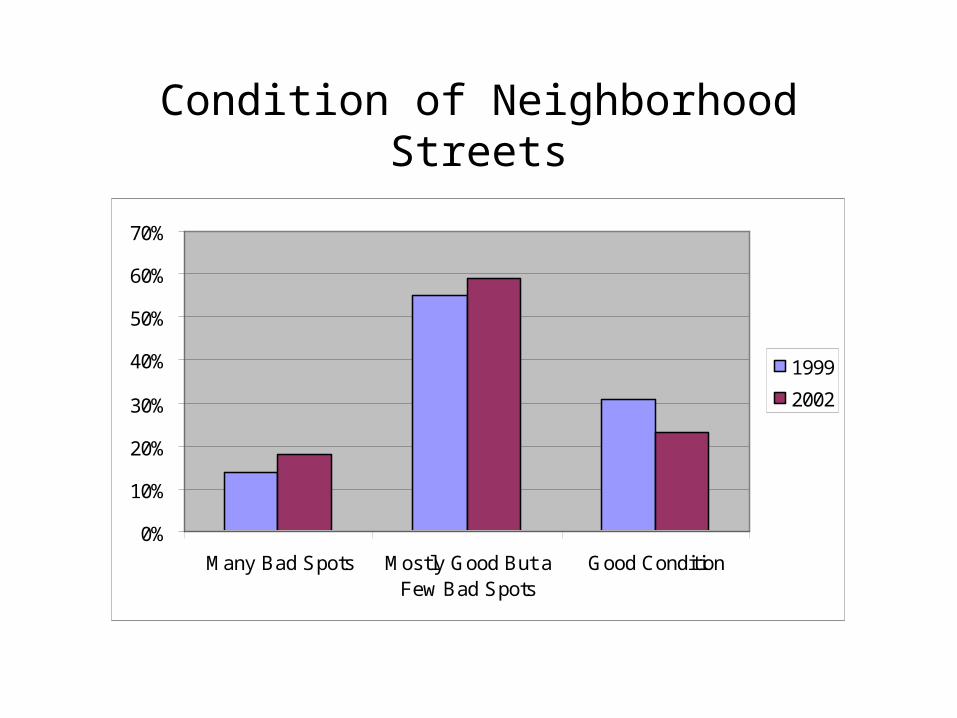
Condition of Neighborhood Streets
0%
10%
20%
30%
40%
50%
60%
70%
Many Bad Spots Mostly Good But aFew Bad Spots
Good Condition
1999
2002
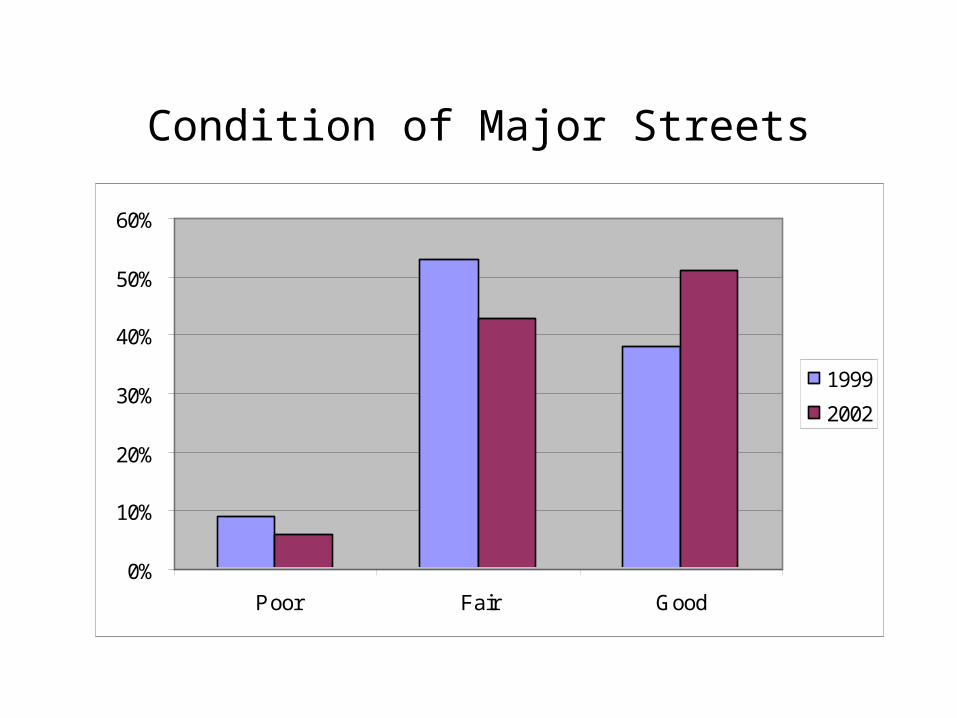
Condition of Major Streets
0%
10%
20%
30%
40%
50%
60%
Poor Fair Good
1999
2002
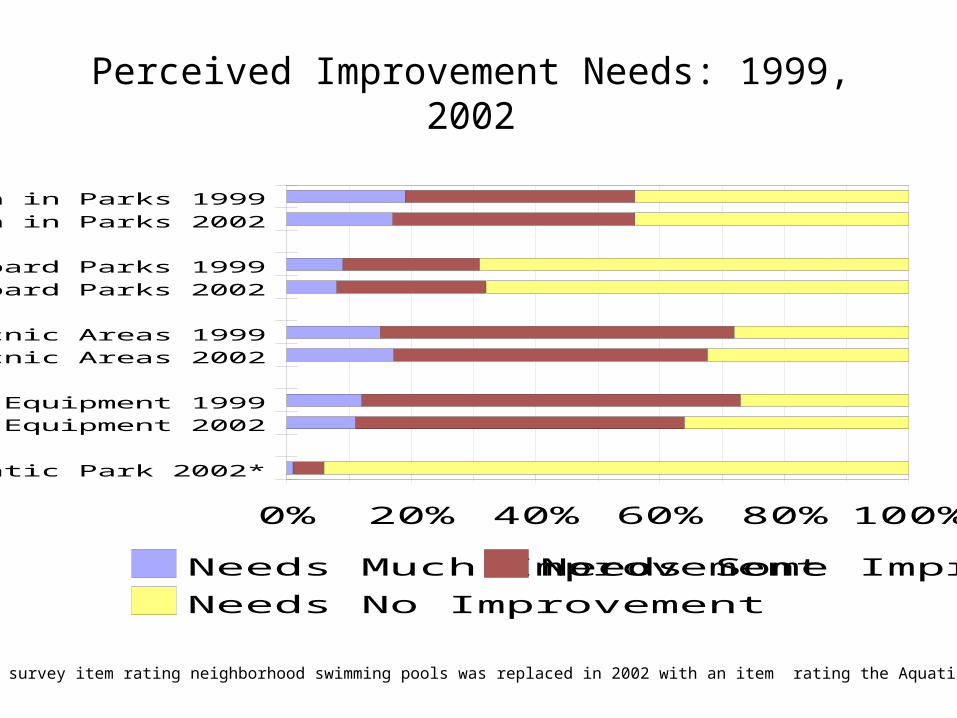
Perceived Improvement Needs: 1999, 2002
0% 20% 40% 60% 80% 100%
Aquatic Park 2002*
Playground Equipment 2002
Playground Equipment 1999
Shelter and Picnic Areas 2002
Shelter and Picnic Areas 1999
Skateboard Parks 2002
Skateboard Parks 1999
Vegetation in Parks 2002
Vegetation in Parks 1999
Needs Much ImprovementNeeds Some Improvement
Needs No Improvement
*The 1999 survey item rating neighborhood swimming pools was replaced in 2002 with an item rating the Aquatic Park.
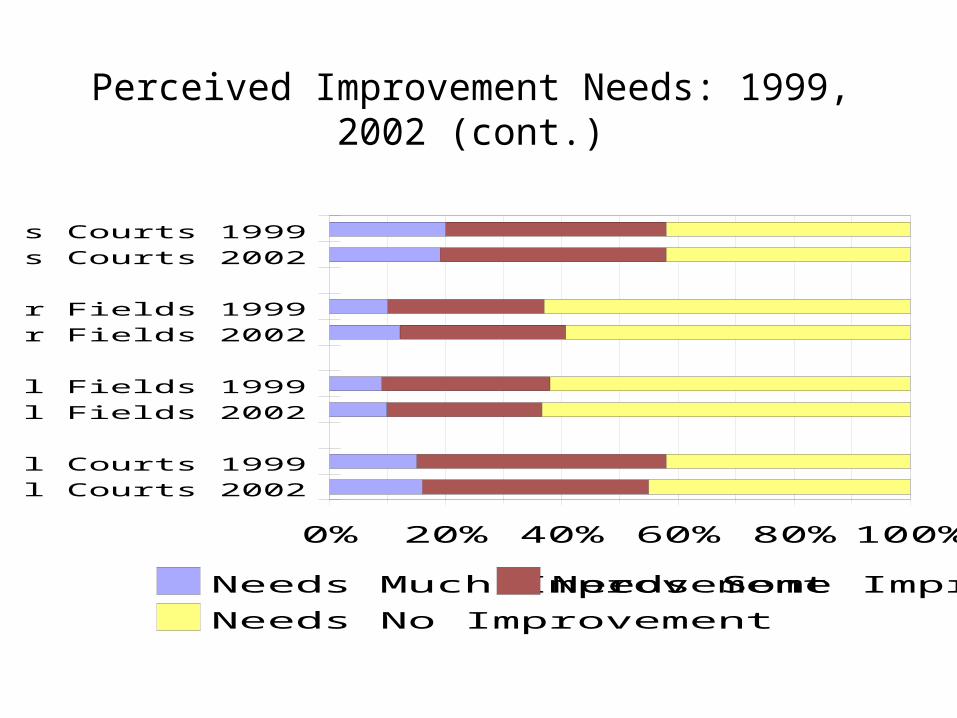
Perceived Improvement Needs: 1999, 2002 (cont.)
0% 20% 40% 60% 80% 100%
Basketball Courts 2002
Basketball Courts 1999
Baseball/Softball Fields 2002
Baseball/Softball Fields 1999
Soccer Fields 2002
Soccer Fields 1999
Tennis Courts 2002
Tennis Courts 1999
Needs Much ImprovementNeeds Some Improvement
Needs No Improvement
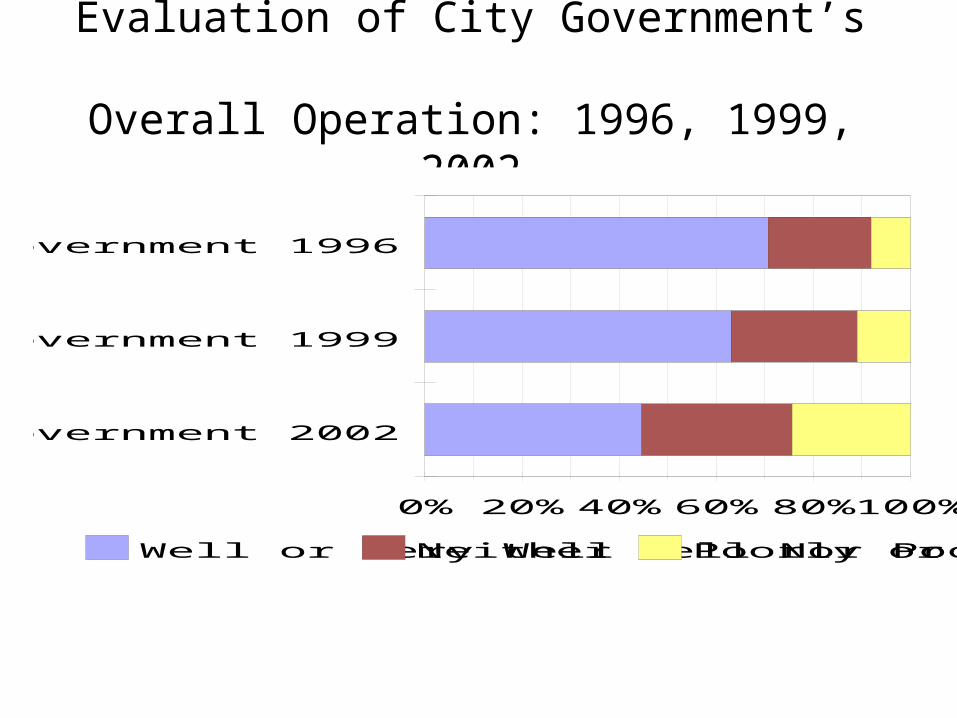
Evaluation of City Government’s Overall Operation: 1996, 1999, 2002
0% 20%40%60%80%100%
Operation of City Government 2002
Operation of City Government 1999
Operation of City Government 1996
Well or Very WellNeither Well Nor PoorlyPoorly or Very Poorly
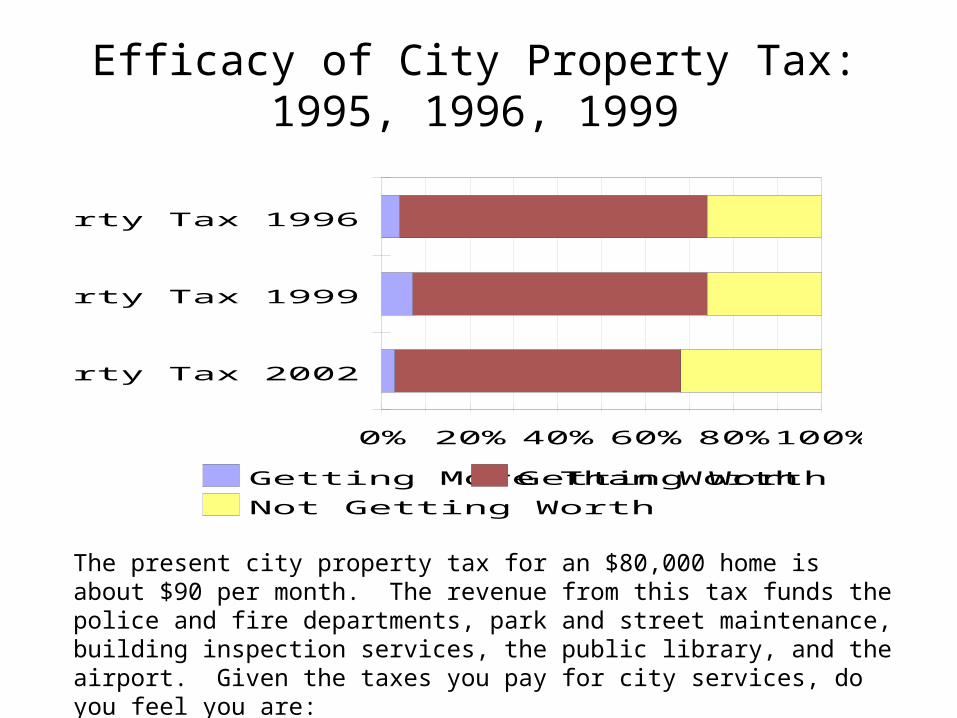
Efficacy of City Property Tax: 1995, 1996, 1999
0% 20% 40% 60% 80%100%
Efficacy of Property Tax 2002
Efficacy of Property Tax 1999
Efficacy of Property Tax 1996
Getting More Than WorthGetting Worth
Not Getting Worth
The present city property tax for an $80,000 home is about $90 per month. The revenue from this tax funds the police and fire departments, park and street maintenance, building inspection services, the public library, and the airport. Given the taxes you pay for city services, do you feel you are:
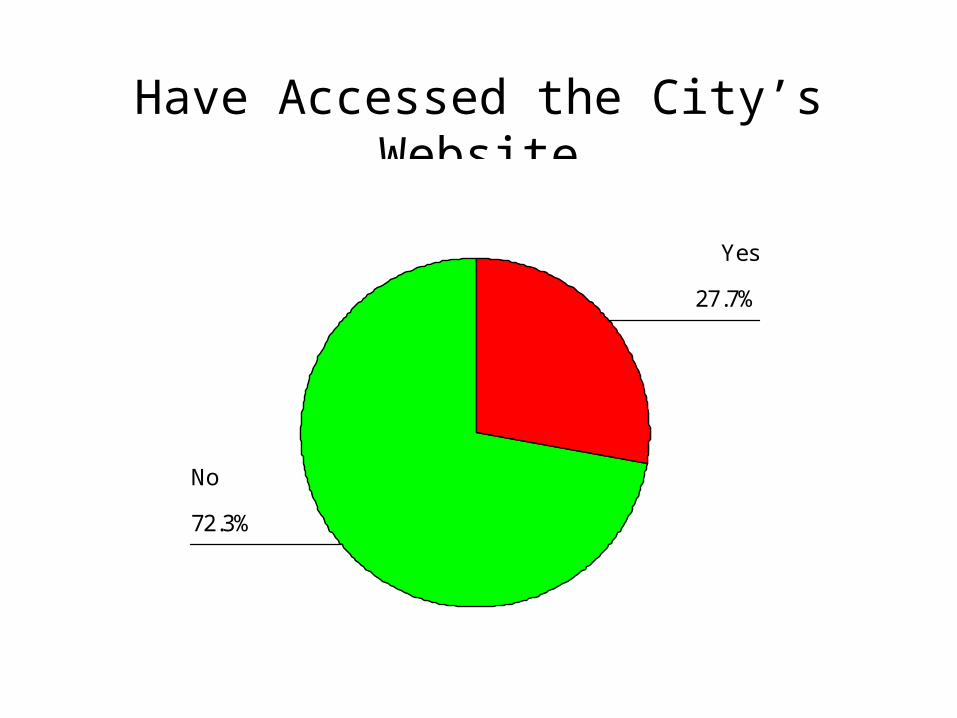
Have Accessed the City’s Website
72.3%
27.7%
No
Yes
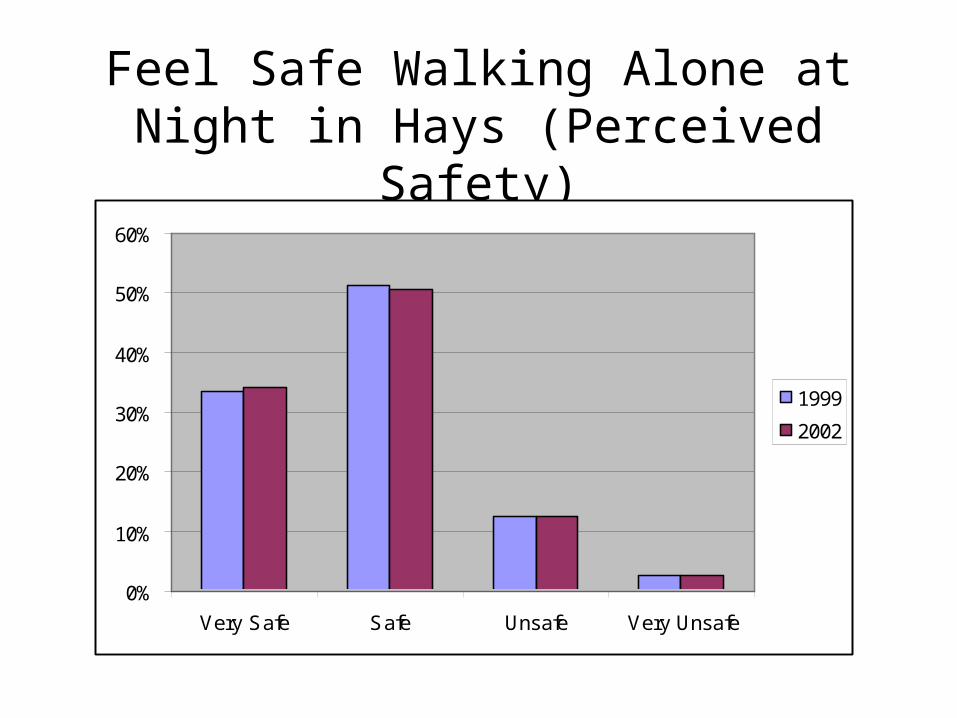
Feel Safe Walking Alone at Night in Hays (Perceived Safety)
0%
10%
20%
30%
40%
50%
60%
Very Safe Safe Unsafe Very Unsafe
1999
2002
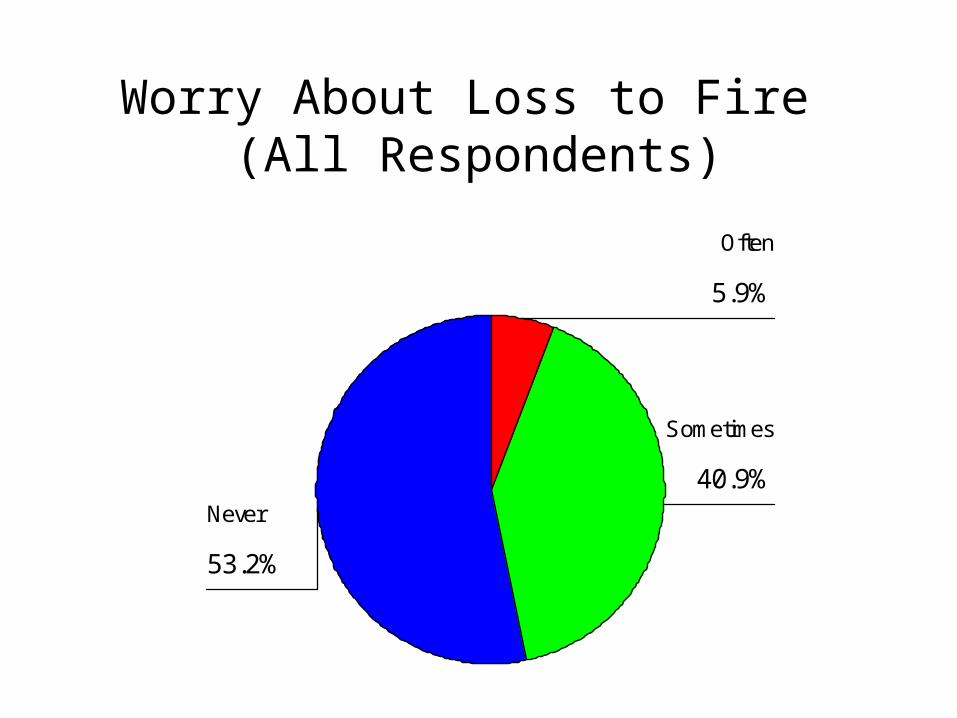
Worry About Loss to Fire (All Respondents)
53.2%
40.9%
5.9%
Never
Sometimes
Often
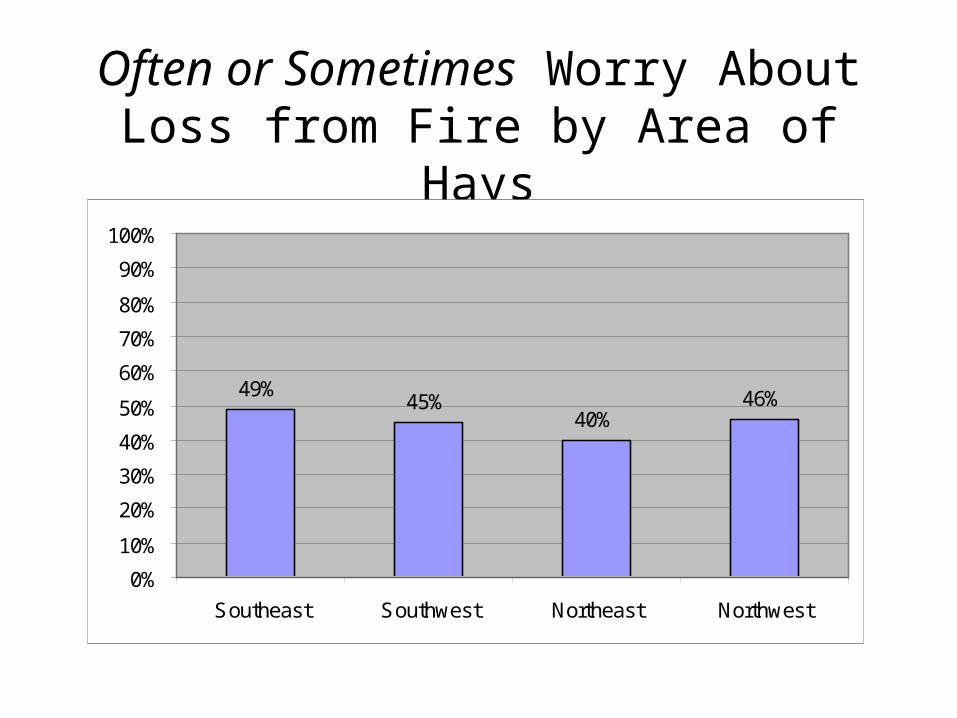
Often or Sometimes Worry About Loss from Fire by Area of Hays
49%45%
40%46%
0%
10%
20%
30%
40%
50%
60%
70%
80%
90%
100%
Southeast Southwest Northeast Northwest
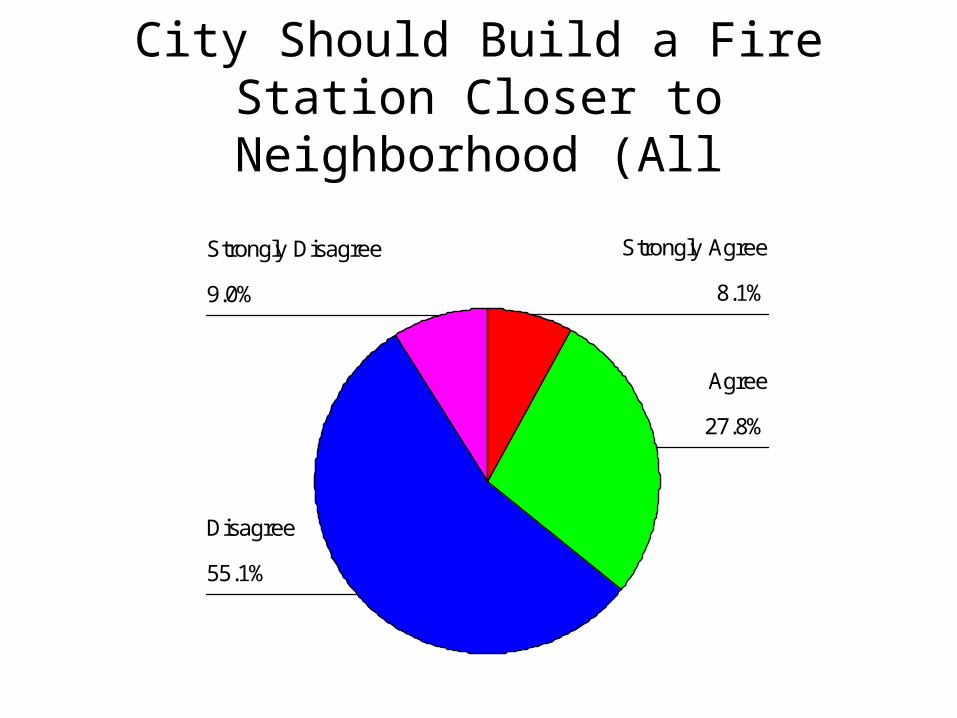
City Should Build a Fire Station Closer to Neighborhood (All Respondents)
9.0%
55.1%
27.8%
8.1%
Strongly Disagree
Disagree
Agree
Strongly Agree
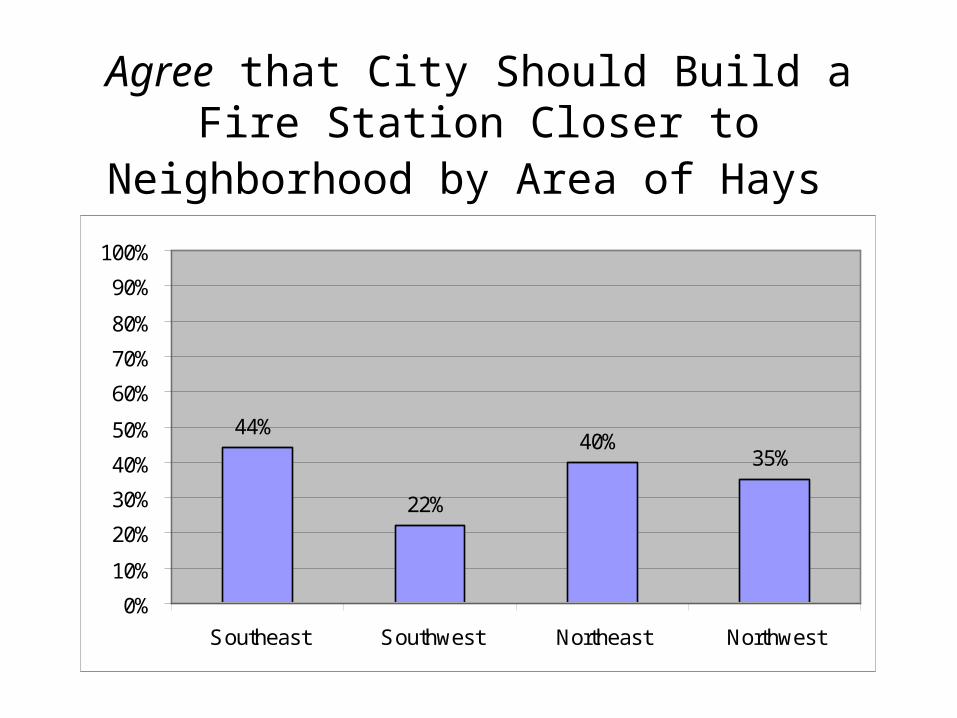
Agree that City Should Build a Fire Station Closer to Neighborhood by Area of Hays
44%
22%
40%35%
0%
10%
20%
30%
40%
50%
60%
70%
80%
90%
100%
Southeast Southwest Northeast Northwest
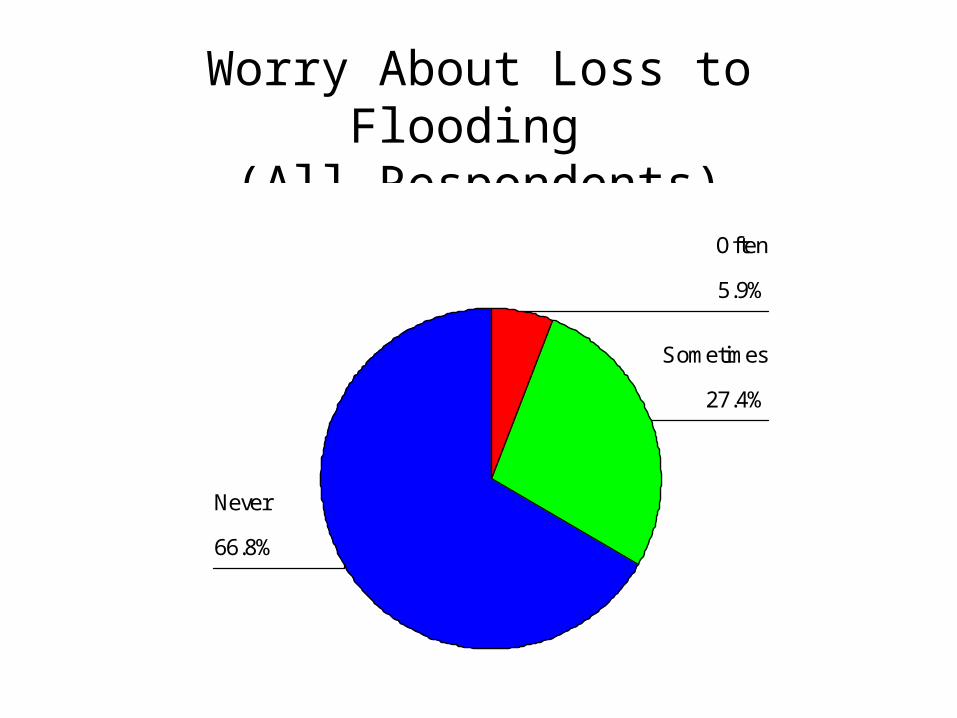
Worry About Loss to Flooding (All Respondents)
66.8%
27.4%
5.9%
Never
Sometimes
Often
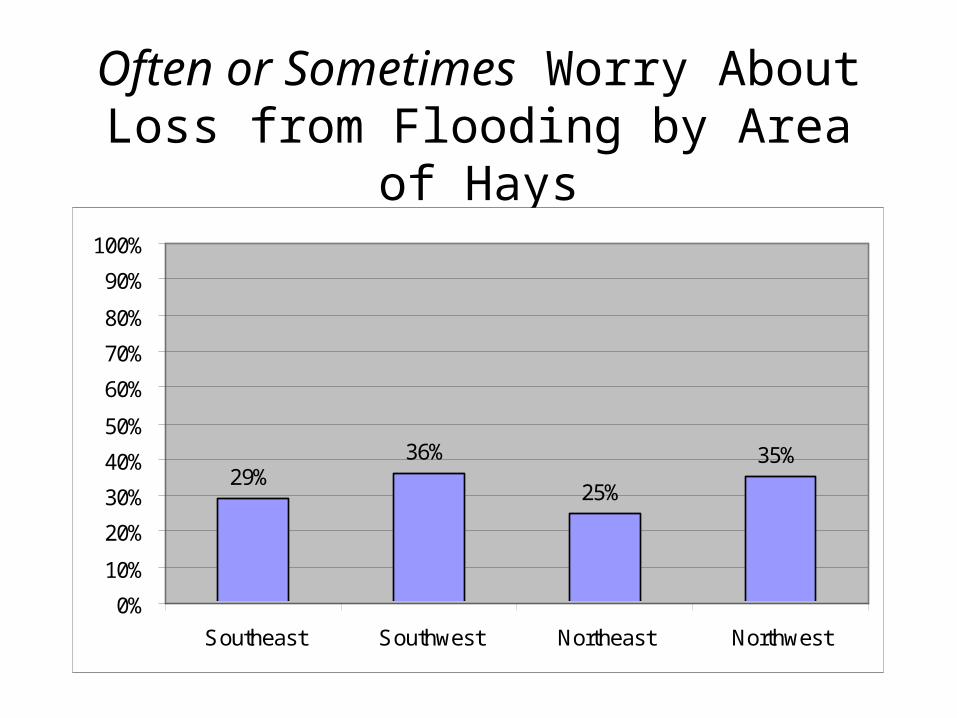
Often or Sometimes Worry About Loss from Flooding by Area of Hays
29%36%
25%
35%
0%
10%
20%
30%
40%
50%
60%
70%
80%
90%
100%
Southeast Southwest Northeast Northwest
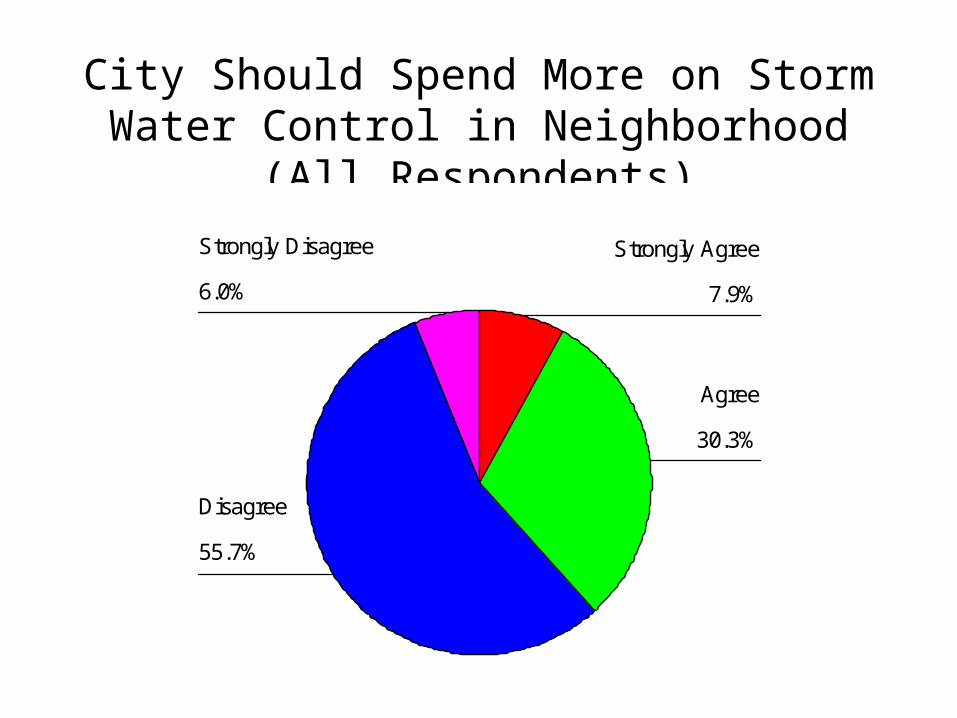
City Should Spend More on Storm Water Control in Neighborhood (All Respondents)
6.0%
55.7%
30.3%
7.9%
Strongly Disagree
Disagree
Agree
Strongly Agree
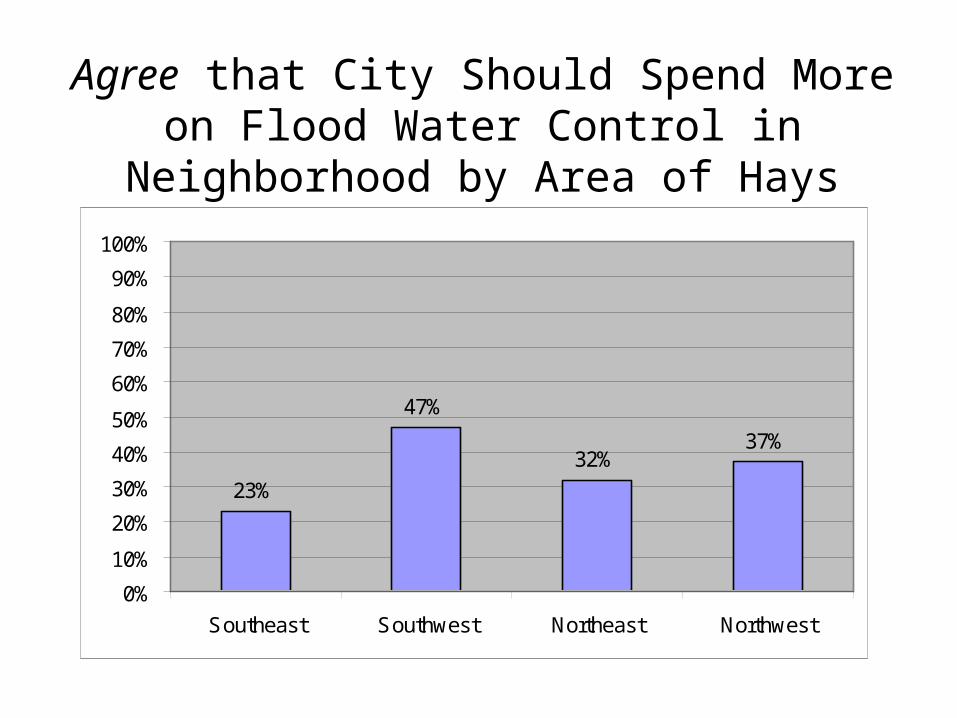
Agree that City Should Spend More on Flood Water Control in Neighborhood by Area of Hays
23%
47%
32%37%
0%
10%
20%
30%
40%
50%
60%
70%
80%
90%
100%
Southeast Southwest Northeast Northwest

Opinions on Possible Hays City Business Development Efforts
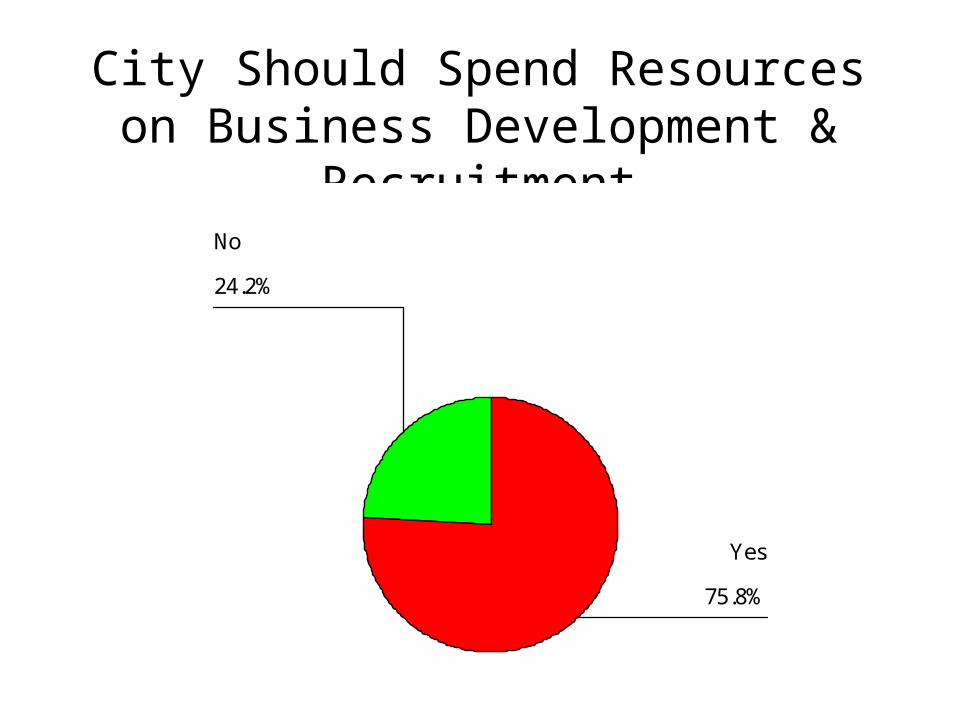
City Should Spend Resources on Business Development & Recruitment
24.2%
75.8%
No
Yes
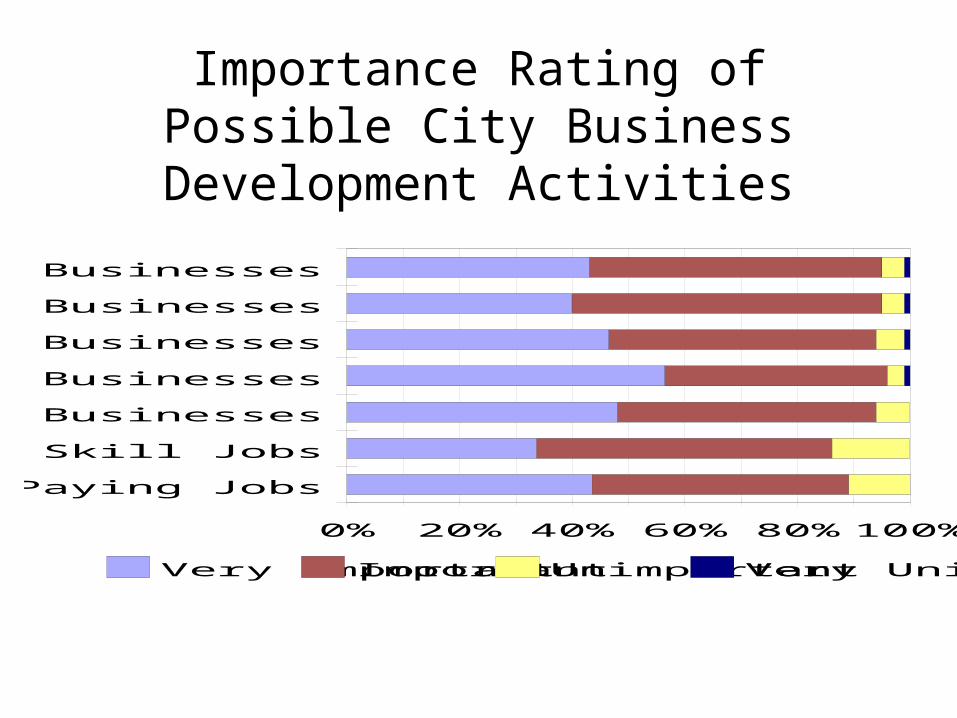
Importance Rating of Possible City Business Development Activities
0% 20% 40% 60% 80% 100%
Create High Paying Jobs
Create High Skill Jobs
Help Small Start-Up Businesses
Help Existing Small Businesses
Recruit High Tech. Businesses
Recruit Retail Businesses
Recruit Manufacturing Businesses
Very ImportantImportantUnimportantVery Unimportant
Non-local Shopping Behavior and Preferences (Leakages)
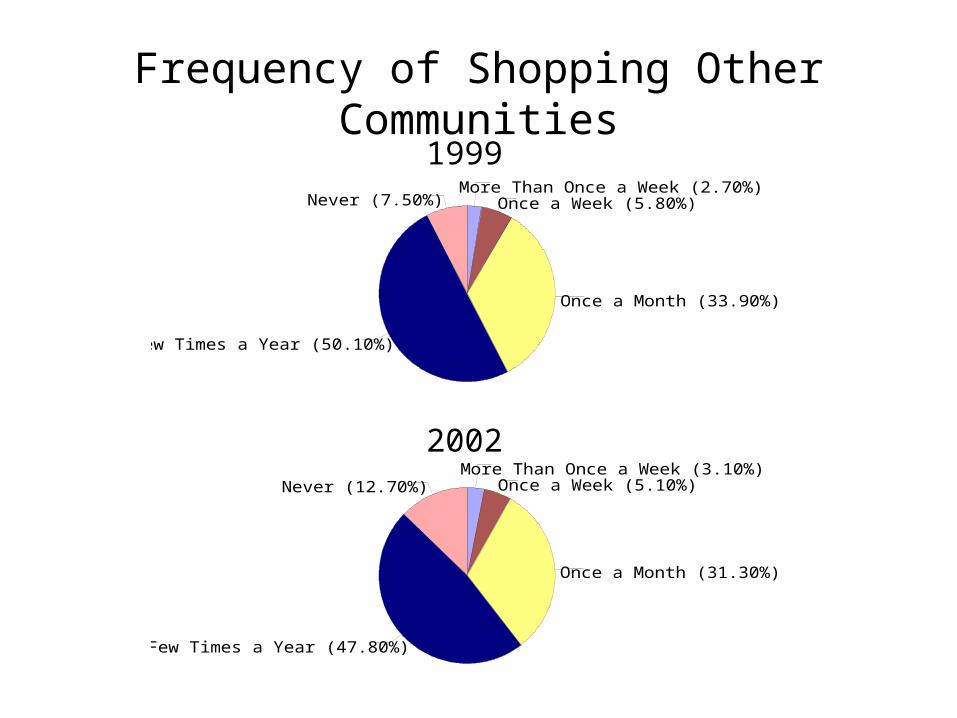
Frequency of Shopping Other Communities
Once a Week (5.80%)More Than Once a Week (2.70%)
Never (7.50%)
Once a Month (33.90%)
A Few Times a Year (50.10%)
Once a Month (31.30%)
Once a Week (5.10%)More Than Once a Week (3.10%)
Never (12.70%)
A Few Times a Year (47.80%)
1999
2002
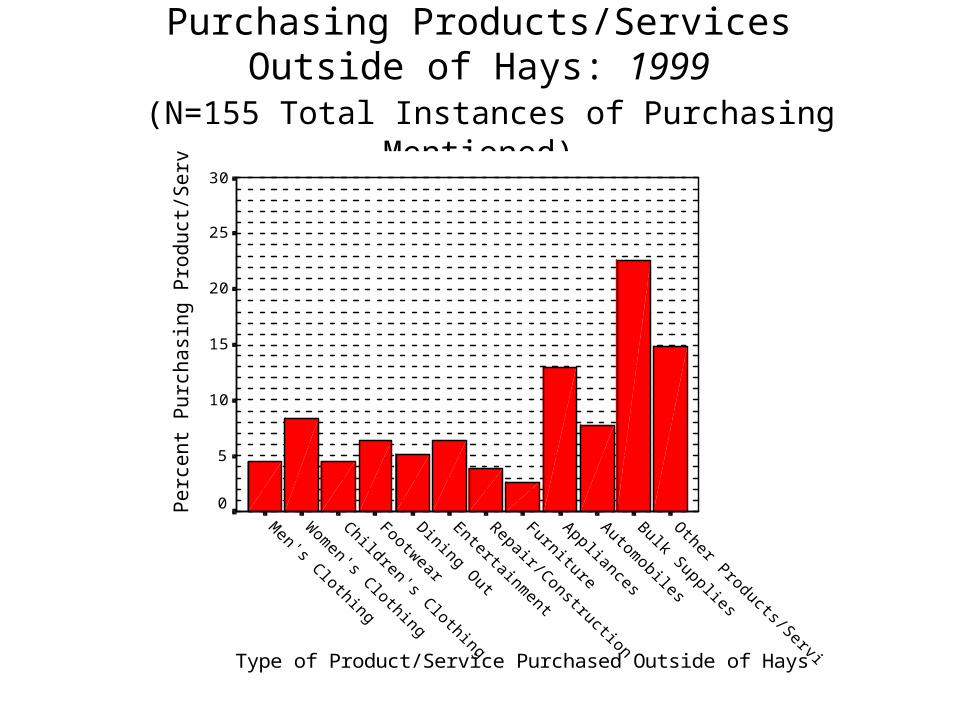
Purchasing Products/Services Outside of Hays: 1999 (N=155 Total Instances of Purchasing Mentioned)
Type of Product/Service Purchased Outside of Hays
Pe
rce
nt
Pu
rch
asi
ng
Pro
du
ct/S
erv
ice 30
25
20
15
10
5
0
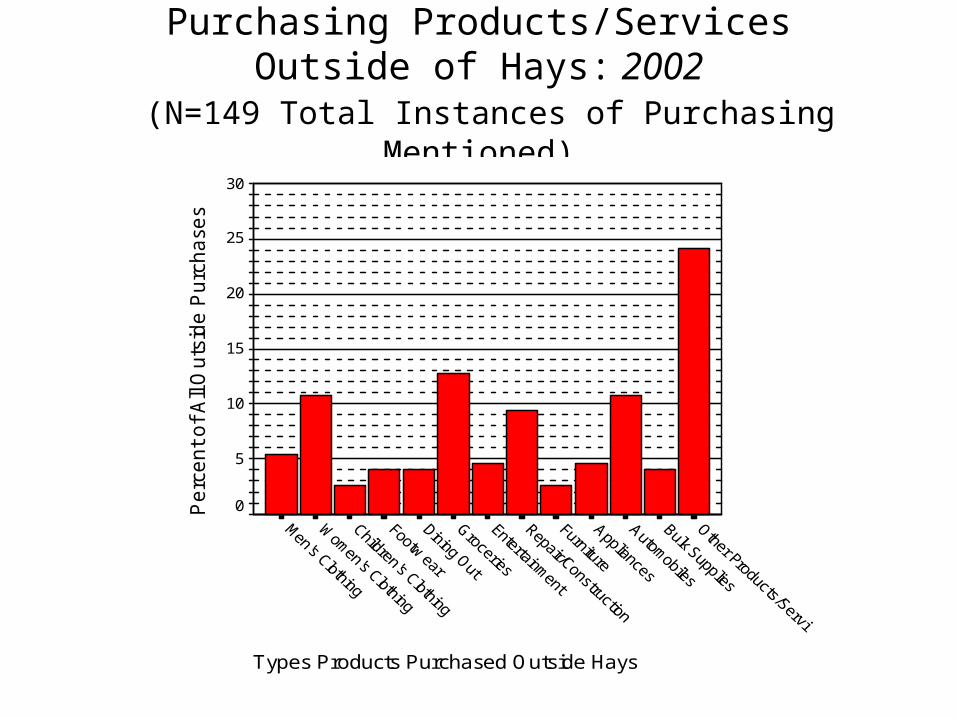
Purchasing Products/Services Outside of Hays: 2002 (N=149 Total Instances of Purchasing Mentioned)
Types Products Purchased Outside Hays
Pe
rce
nt
of
All
Ou
tsid
e P
urc
ha
ses
30
25
20
15
10
5
0
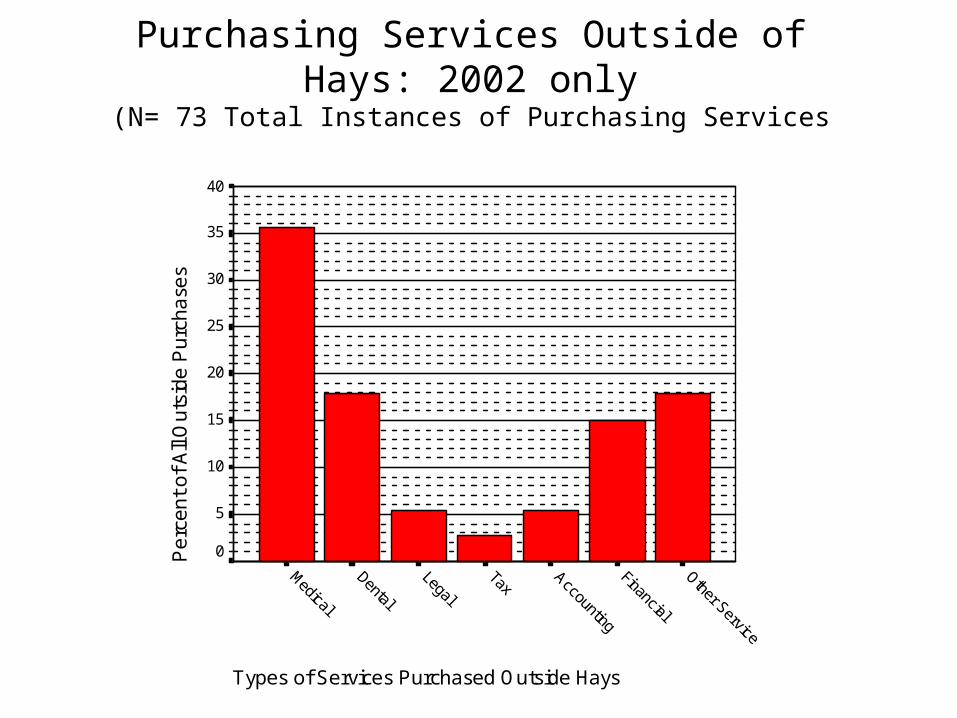
Purchasing Services Outside of Hays: 2002 only
(N= 73 Total Instances of Purchasing Services Outside of Hays)
Types of Services Purchased Outside Hays
Other Service
Financial
Accounting
TaxLegal
Dental
Medical
Pe
rce
nt
of
All
Ou
tsid
e P
urc
ha
ses
40
35
30
25
20
15
10
5
0
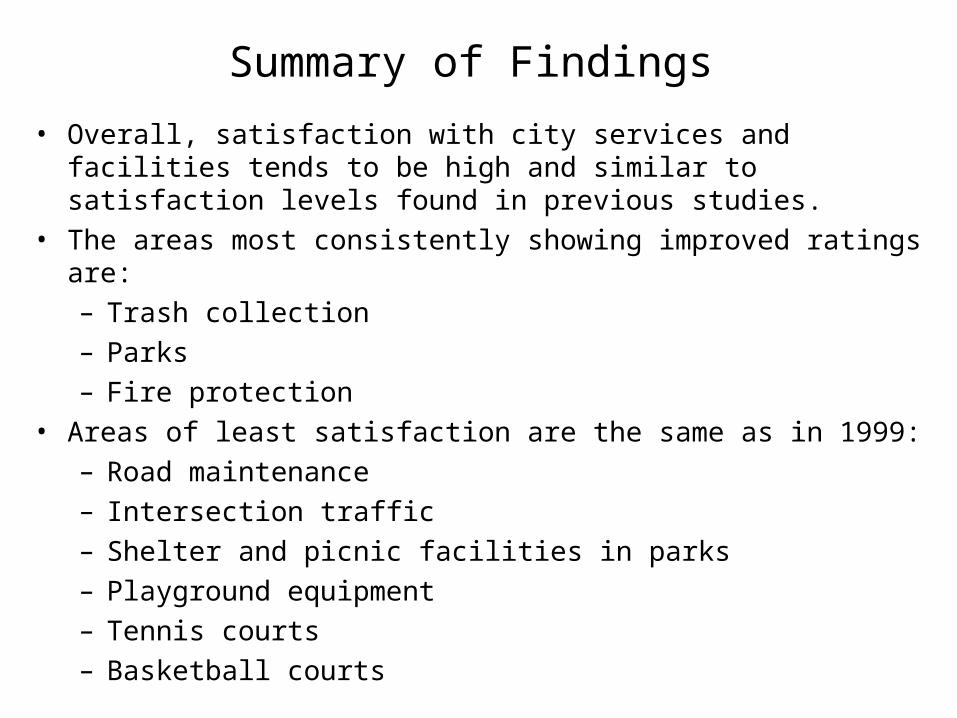
Summary of Findings
• Overall, satisfaction with city services and facilities tends to be high and similar to satisfaction levels found in previous studies.
• The areas most consistently showing improved ratings are:
– Trash collection
– Parks
– Fire protection
• Areas of least satisfaction are the same as in 1999:
– Road maintenance
– Intersection traffic
– Shelter and picnic facilities in parks
– Playground equipment
– Tennis courts
– Basketball courts
Summary of Findings (continued)
• Positive ratings of neighborhood streets have declined since 1999, but positive ratings for major streets have increased since 1999.
• Rating of the overall performance of city government has declined.
• Perceived efficacy of City property tax is high but slightly lower than in past years.
Summary of Findings (continued)
• Perceived personal safety in Hays is high and unchanged since 1999.
• 47% of all respondents often or sometimes worry about losses due to fire; this is highest in the southeast (49%) and lowest in the northeast (40%).
• 36% of all respondents think the city should build another fire station; this is highest in the southeast (44%) and lowest in the southwest (22%).
• 33% of all respondents often or sometimes worry about losses due to flooding; this is highest in the southwest (36%) and lowest in the northeast (25%).
• 38% of all respondents think the city should spend more on flood prevention; this is highest in the southwest (47%) and lowest in the southeast (23%).
Summary of Findings (continued)
• Three fourths (76%) of all respondents feel that the City of Hays should be involved in business development & recruitment.
• Very high percentages (85%+) of respondents rate all forms of business development offered as very important or important.
• The approach perceived as most important, by a slim margin, is “helping existing businesses,” and the least important is “creating high skill jobs.”
Summary of Findings (continued)
• Under half (39%) of all respondents shop in communities other than Hays on a regular basis (at least once a month), only slightly lower than in 1999 when 43% indicated they do so.
• In 1999, bulk supplies were the most often purchased item outside of Hays, but in 2002, the most often purchased item is groceries.
• The most often purchased service outside of Hays in 2002 is medical services, followed by dental, and the least often purchased service outside of Hays is tax services.

University Center for Survey Research785-628-5881