Embed Size (px)
Citation preview

Hawawini & Viallet Chapter 7 1
Chapter 7
ALTERNATIVES TO THE NPV RULE
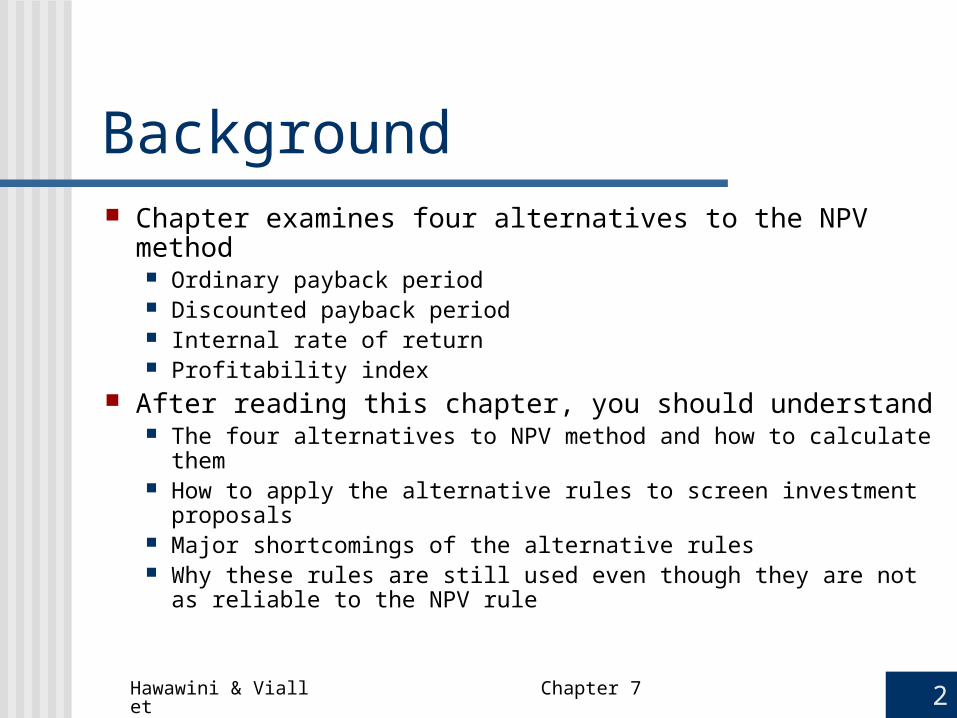
Hawawini & Viallet Chapter 7 2
Background Chapter examines four alternatives to the NPV method
Ordinary payback period Discounted payback period Internal rate of return Profitability index
After reading this chapter, you should understand The four alternatives to NPV method and how to calculate them How to apply the alternative rules to screen investment
proposals Major shortcomings of the alternative rules Why these rules are still used even though they are not as
reliable to the NPV rule

Hawawini & Viallet Chapter 7 3
Projects Examined Six different investment projects are utilized to
illustrate how these rules are applied Each alternative is evaluated as to whether it
satisfies the conditions of a good investment decision • Does it adjust for the timing of the cash flows? • Does it take risk into consideration?
• Does it maximize the firm’s equity value?
The projects on the following slides are evaluated using the four alternatives

Hawawini & Viallet Chapter 7 4
END OF YEAR INVESTMENT A INVESTMENT B
1 $600,000 $100,000
2 300,000 300,000
3 100,000 600,000
4 200,000 200,000
5 300,000 300,000
Total Cash Flows $1,500,000 $1,500,000Cost of Capital 10% 10%
NPV $191,399 $112,511
INVESTMENTS A AND B
EXHIBIT 7.1a:Expected Cash-Flow Streams and the Cost of Capital in Alternative Investment Proposals.All investments are five years long and require an initial cash outlay of $1 million
Hawawini & Viallet Chapter 7 5
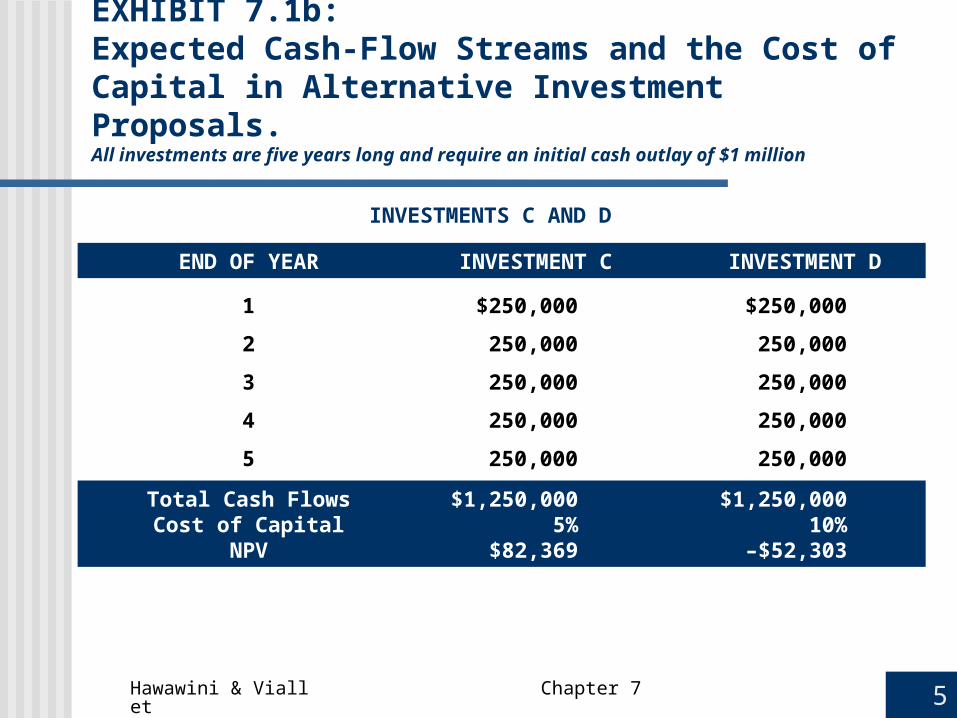
END OF YEAR INVESTMENT C INVESTMENT D
1 $250,000 $250,000
2 250,000 250,000
3 250,000 250,000
4 250,000 250,000
5 250,000 250,000
Total Cash Flows $1,250,000 $1,250,000Cost of Capital 5% 10%
NPV $82,369 –$52,303
INVESTMENTS C AND D
EXHIBIT 7.1b: Expected Cash-Flow Streams and the Cost of Capital in Alternative Investment Proposals.All investments are five years long and require an initial cash outlay of $1 million

Hawawini & Viallet Chapter 7 6
END OF YEAR INVESTMENT E INVESTMENT F
1 $325,000 $ 325,000
2 325,000 325,000
3 325,000 325,000
4 325,000 325,000
5 325,000 975,000
Total Cash Flows $1,625,000 $2,275,000Cost of Capital 10% 10%
NPV $232,006 $635,605
INVESTMENTS E AND F
EXHIBIT 7.1c: Expected Cash-Flow Streams and the Cost of Capital in Alternative Investment Proposals.All investments are five years long and require an initial cash outlay of $1 million

Hawawini & Viallet Chapter 7 7
The Payback Period
A project’s payback period is the number of periods required for the sum of the project’s cash flows to equal its initial cash outlay Usually measured in years

Hawawini & Viallet Chapter 7 8
EXPECTED CUMULATIVEEND OF YEAR CASH FLOWS CASH FLOWS
1 $600,000 $ 600,000
2 300,000 900,000
3 100,000 1,000,000
4 200,000 1,200,000
5 300,000 1,500, 000
EXHIBIT 7.3: Payback Periods for Six Investments in Exhibit 7.1.
INVESTMENT A B C D EFPayback period (in years) 3.00 3.00 4.00 4.00 3.08
3.08
A’s cash outlay was $1,000,000. This amount is
fully recovered at the end of year 3.
EXHIBIT 7.2: Expected and Cumulative Cash Flows for Investment A.Expected cash flows from Exhibit 7.1

Hawawini & Viallet Chapter 7 9
The Payback Period Rule
According to this rule, a project is acceptable if its payback period is shorter than or equal to the cutoff period For mutually exclusive projects, the one with
the shortest payback period should be accepted

Hawawini & Viallet Chapter 7 10
The Payback Period Rule Does the payback period rule meet the
conditions of a good investment decision? Adjustment for the timing of cash flows?
• Ignores the time value of money • Both Investments A and B require the same initial cash outlay,
have the same useful life, and carry the same risk • Timing differs but their payback periods are the same
Adjustment for risk?• Ignores risk
• Both Investments C and D are five-year projects and have the same initial cash outlay and expected annual cash flows
• Even though D is riskier than C their payback periods are the same

Hawawini & Viallet Chapter 7 11
The Payback Period Rule Maximization of the firm’s equity value?
• No objective reason to believe that there exists a particular cutoff period that is consistent with the maximization of the market value of the firm’s equity
• The choice of a cutoff period is always arbitrary • The rule is biased against long-term projects
• Both E and F have the same payback period (3.08 years)
• F is preferable to E because, at the end of year 5, F is expected to generate a cash inflow that is three times larger than the one generated by E

Hawawini & Viallet Chapter 7 12
Why Do Managers Use The Payback
Period Rule? Payback period rule is used by many managers
Often in addition to other approaches Redeeming qualities of this rule
Simple and easy to apply for small, repetitive investments Favors projects that “pay back quickly”
• Thus, contribute to the firm’s overall liquidity• Can be particularly important for small firms
Makes sense to apply the payback period rule to two investments that have the same NPV
• See Exhibit 7.4, which compares two such investments Because it favors short-term investments, the rule is often
employed when future events are difficult to quantify• Such as for projects subject to political risk

Hawawini & Viallet Chapter 7 13
END OF YEAR INVESTMENT A INVESTMENT G
Now –$1,000,000 –$1,000,000
1 600,000 200,000
2 300,000 200,000
3 100,000 300,000
4 200,000 300,000
5 300,000 666,740
NPV (AT 10%) $191,399 $191,399PAYBACK PERIOD 3 YEARS 4 YEARS
EXHIBIT 7.4: Comparison of Two Investments with the Same NPV and Different Payback Periods.

Hawawini & Viallet Chapter 7 14
The Discounted Payback Period The discounted payback period, or
economic payback period Number of periods required for the sum of
the present values of the project’s expected cash flows to equal its initial cash outlay
• Compared to ordinary payback periods• Discounted payback periods are longer
• May result in a different project ranking

Hawawini & Viallet Chapter 7 15
END OF EXPECTED DISCOUNT PRESENT CUMULATIVE PRESENT YEAR CASH FLOWS FACTOR AT 10% VALUE VALUE OF CASH FLOWS
1 $600,000 0.9091 $545,455 $545,455
2 300,000 0.8264 247,934 793,389
3 100,000 0.7513 75,131 868,520
4 200,000 0.6830 136,603 1,005,123
5 300,000 0.6209 186,276 1,191,399
EXHIBIT 7.6: Discounted Payback Periods for Six Investments in Exhibit 7.1.
INVESTMENT A B C D EFDiscounted payback period (in years) 3.96 4.40 4.58 > 5 3.86
3.86
EXHIBIT 7.5: Discounted Payback Period Calculations for Investment A.Expected Cash Flows from Exhibit 7.1

Hawawini & Viallet Chapter 7 16
The Discounted Payback Period Rule
The discounted payback period rule says that a project is acceptable If discounted payback period is shorter or
equal to the cutoff period Among several projects, the one with the
shortest period should be accepted

Hawawini & Viallet Chapter 7 17
The Discounted Payback Period Rule Does the discounted payback period rule meet
the conditions of a good investment decision? Adjustment for the timing of cash flows?
• The rule considers the time value of money • Both Investments A and B differ in terms of the timing of the
cash flows• Their discounted payback periods are different (3.96
years vs. 4.40 years).
Adjustment for risk?• The rule considers risk
• Both Investments C and D have identical cash flow streams • D is riskier than C and the discounted payback periods
are different

Hawawini & Viallet Chapter 7 18
The Discounted Payback Period Rule
Maximization of the firm’s equity value?• If a project’s discounted payback period is shorter
than the cutoff period• Project’s NPV when estimated with cash flows up to the
cutoff period is always positive
• The rule is biased against long-term projects• Consider projects E and F that both have the same
discounted payback period (3.86 years)• The discounted payback period rule cannot
discriminate between the two investments • It ignores the fifth year’s cash flow, which is three
times larger for F than for E

Hawawini & Viallet Chapter 7 19
The Discounted Payback Period Rule Versus The Ordinary Payback Period Rule
The discounted payback period rule is superior to the ordinary payback period rule Considers the time value of money Considers the risk of the investment’s expected cash
flows
However, the discounted payback period rule is more difficult to apply Requires the same inputs as the NPV rule Used less than the ordinary payback period rule

Hawawini & Viallet Chapter 7 20
The Internal Rate Of Return (IRR) A project's internal rate of return (IRR) is the discount
rate that makes the net present value (NPV) of the project equal to zero The IRRs of the six projects being considered are presented in
Exhibit 7.7
An investment’s IRR summarizes its expected cash flow stream with a single rate of return that is called internal Because it only considers the expected cash flows related to
the investment• Does not depend on rates that can be earned on alternative
investments

Hawawini & Viallet Chapter 7 21
INVESTMENT A B C D E F
IRR 19.05% 13.92% 7.93% 7.93% 18.72%28.52%
EXHIBIT 7.7: IRR for Six Investments in Exhibit 7.1.

Hawawini & Viallet Chapter 7 22
The IRR Rule A project should be accepted if its IRR is higher than its
cost of capital and rejected if it is lower If a project’s IRR is lower than its cost of capital, the project
does not earn its cost of capital and should be rejected
Does the IRR rule meet the conditions of a good investment decision? Adjustment for the timing of cash flows?
• Considers the time value of money • Consider investments A and B
• A is preferable to B because its largest cash flow occurs earlier• IRR rule indicates the same preference because the IRR of A
(19.05 percent) is higher than the IRR of B (13.92 percent)

Hawawini & Viallet Chapter 7 23
The IRR Rule Adjustment for risk?
• The rule takes risk into consideration• Consider investments C and D which have the same expected cash-
flow stream, but D is riskier than C• Both have the same IRR (7.93 percent) • The IRR rule takes the risk of the two investments into
consideration indirectly by comparing the investment’s IRR with its cost of capital
• The IRR of C (7.93 percent) is greater than its cost of capital (5 percent)--should be accepted
• Investment D should be rejected because its IRR (7.93 percent) is lower than its cost of capital (10 percent)
• The risk of an investment does not enter into the computation of its IRR, but the IRR rule does consider the risk of the investment because it compares the project’s IRR with the minimum required rate of return--a measure of the risk of the investment

Hawawini & Viallet Chapter 7 24
The IRR Rule Maximization of the firm’s equity value?
• Exhibit 7.8 provides investment E’s NPV for various discount rates.
• It shows, as does the graph (NPV profile) in Exhibit 7.9, an inverse relationship between NPV and the discount rate.

Hawawini & Viallet Chapter 7 25
DISCOUNT RATE 0% 5% 10% 15% 20% 25%30%NPV(E) $625,000 $407,080 $232,006 $89,450 –$28,051 –$125,984
–$208,440
EXHIBIT 7.8: Net Present Value of Investment E for Various Discount Rates.
Hawawini & Viallet Chapter 7 26
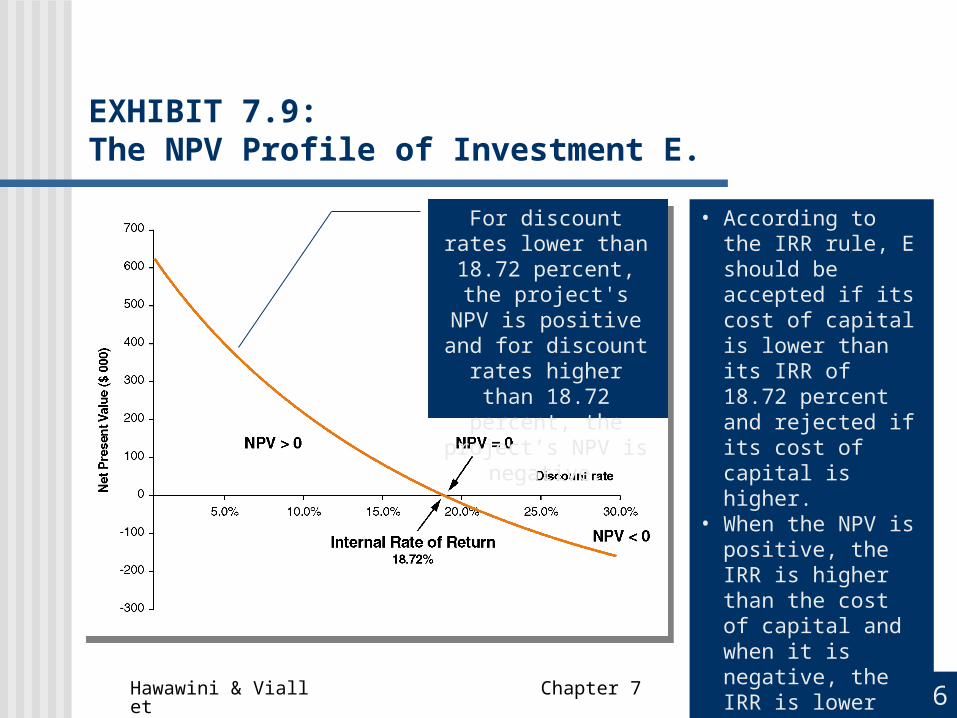
EXHIBIT 7.9: The NPV Profile of Investment E.
For discount rates lower than 18.72
percent, the project's NPV is positive and for discount rates higher than 18.72 percent, the project’s NPV is
negative.
• According to the IRR rule, E should be accepted if its cost of capital is lower than its IRR of 18.72 percent and rejected if its cost of capital is higher.
• When the NPV is positive, the IRR is higher than the cost of capital and when it is negative, the IRR is lower than the cost of capital.

Hawawini & Viallet Chapter 7 27
The IRR Rule May Be Unreliable
The IRR rule may lead to an incorrect investment decision when Two mutually exclusive projects are
considered A project’s cash flow stream changes sign
more than once

Hawawini & Viallet Chapter 7 28
END OF YEAR INVESTMENT E INVESTMENT H
1 $325,000 $100,000
2 325,000 100,000
3 325,000 100,000
4 325,000 150,000
5 325,000 1,500, 000
IRR 18.72% 16.59%
INVESTMENTS E AND F
EXHIBIT 7.10: Comparison of Two Mutually Exclusive Investments with Different Expected Cash Flows and IRR. Useful life = 5 years; $1 million initial cash outlay; k = 0.10.
Exhibit 7.10 compares investments E and H as two mutually exclusive projects.
Hawawini & Viallet Chapter 7 29
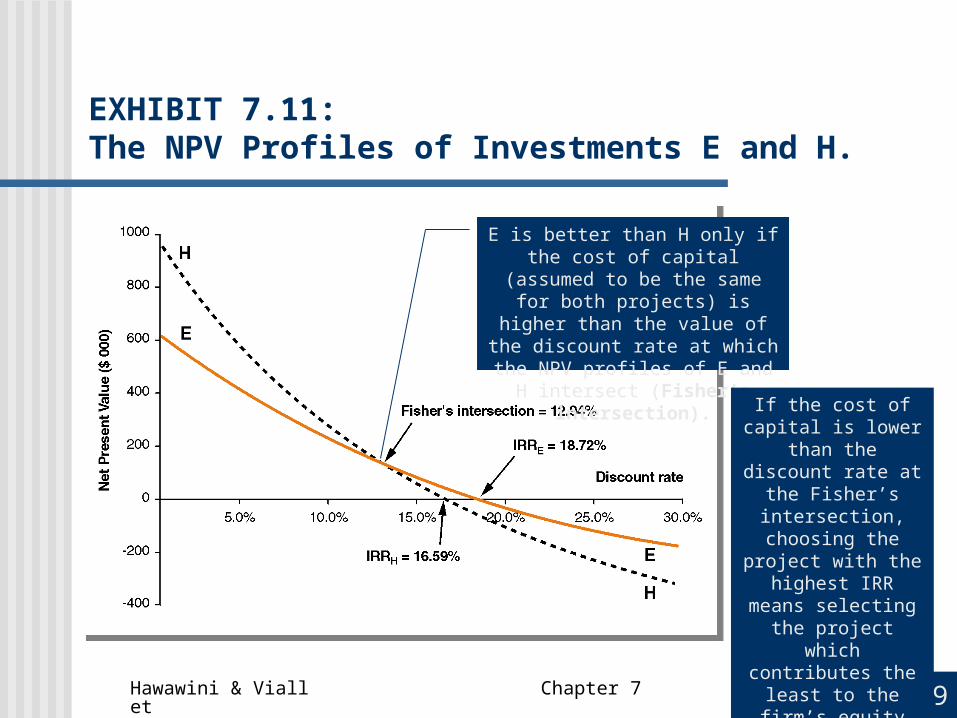
EXHIBIT 7.11: The NPV Profiles of Investments E and H.
E is better than H only if the cost of capital (assumed to be the same
for both projects) is higher than the value of the discount rate at which
the NPV profiles of E and H intersect (Fisher’s intersection).
If the cost of capital is lower than the
discount rate at the Fisher’s intersection, choosing the project with the highest IRR means selecting the
project which contributes the least to the firm’s equity
value.

Hawawini & Viallet Chapter 7 30
Investments With Some Negative Future Cash Flows
Negative cash flows can occur when an investment requires the construction of several facilities that are built at different times
When negative cash flows occur a project may have multiple IRRs or none at all Firm should ignore the IRR rule and use the
NPV rule instead

Hawawini & Viallet Chapter 7 31
END OF YEAR CASH FLOW
Now –$1,000,000
1 +$2,450,000
2 –$1,470,000
IRR 5% and 40%NPV (at 20%) +$20,833
EXHIBIT 7.12: Expected Cash Flows, IRR, and NPV of a Project with Negative Cash Flows and k = 0.20.
Exhibit 7.12 presents the case of an investment that includes negative cash flows.

Hawawini & Viallet Chapter 7 32
Why Do Managers Usually Prefer The IRR Rule To The NPV Rule? IRR calculation requires only a single input (the cash
flow stream) However, applying the IRR rule still requires a second input—
the cost of capital• When a project’s cost of capital is uncertain, the IRR method may
be the answer
Most managers find the IRR easier to understand Managers usually have a good understanding of what an
investment should "return” Authors’ advice: Compute both a project’s IRR and NPV
If they agree, use the IRR If they disagree, trust the NPV rule

Hawawini & Viallet Chapter 7 33
The Profitability Index (PI)
The profitability index Benefit-to-cost ratio equal to the ratio of the
present value of a project’s expected cash flows to its initial cash outlay

Hawawini & Viallet Chapter 7 34
INVESTMENT A B C D EFProfitability index 1.19 1.11 1.08 0.95 1.23
1.64
EXHIBIT 7.13: Profitability Indexes for Six Investments in Exhibit 7.1.

Hawawini & Viallet Chapter 7 35
The Profitability Index Rule According to the PI rule a project should be
accepted if its profitability index is greater than one and rejected if it is less than one Does the PI rule meet the conditions of a good
investment decision?• Adjustment for the timing of cash flows?
• Takes into account the time value of money• Project’s expected cash flows are discounted at their cost
of capital• Consider projects A and B--PI rule favours project A over
project B (as does the NPV and IRR rules)—the only difference between these two projects is the timing of their respective expected cash flows

Hawawini & Viallet Chapter 7 36
The Profitability Index Rule Adjustment for risk?
The PI rule considers risk because it uses the cost of capital as the discount rate
Consider projects C and D • Like the NPV and IRR rules, the profitability index rule
chooses investment C over investment D• D is the riskier of the two investments

Hawawini & Viallet Chapter 7 37
The Profitability Index Rule Maximization of the firm’s equity value?
• When a project’s PI > 1 the project’s NPV > 0 and vice-versa
• Thus, it may appear that PI is a substitute for the NPV rule
• Unfortunately, the PI rule may lead to a faulty decision when applied to mutually exclusive investments with different initial cash outlays
• Consider investments A and K in Exhibit 7.14

Hawawini & Viallet Chapter 7 38
END OF YEAR INVESTMENT A INVESTMENT K
Now –$1,000,000 –$2,000,000
1 600,000 100,000
2 300,000 300,000
3 100,000 600,000
4 200,000 200,000
5 300,000 2,100,000
NPV (at 10%) $191,399 $230,169Profitability Index 1.19 1.12
EXHIBIT 7.14: Comparison of Two Mutually Exclusive Investments with Different Initial Cash Outlays and Expected Cash Flows.
K has the same useful life (5
years) and the same cost of capital (10
percent) as A, but requires twice the initial cash outlay
and has a different cash-flow stream.
A has a higher profitability index than K--thus, the PI rule is not consistent with the firm’s value
maximization goal

Hawawini & Viallet Chapter 7 39
Use Of The Profitability Index Rule
The PI is a relative measure of an investment’s value NPV is an absolute measure
Thus, the PI rule can be a useful substitute for the NPV rule when presenting a project’s benefits per dollar of investment