Embed Size (px)
Citation preview
2013-14 School Accountability Report Card for Vista High School (Independent Study) Page 1 of 14
Vista High School (Independent Study)
School Accountability Report Card
Reported Using Data from the 2013-14 School Year
Published During 2014-15
Every school in California is required by state law to publish a School Accountability Report Card (SARC), by February 1 of each year. The SARC contains information about the condition and performance of each California public school. Under the Local Control Funding Formula (LCFF) all local educational agencies (LEAs) are required to prepare a Local Control Accountability Plan (LCAP), which describes how they intend to meet annual school-specific goals for all pupils, with specific activities to address state and local priorities. Additionally, data reported in an LCAP is to be consistent with data reported in the SARC. • For more information about SARC requirements, see the California Department of Education (CDE) SARC Web page at
http://www.cde.ca.gov/ta/ac/sa/. • View this SARC online at the school and/or LEA Web sites. • For more information about the LCFF or LCAP, see the CDE LCFF Web page at http://www.cde.ca.gov/fg/aa/lc/. • For additional information about the school, parents and community members should contact the school principal or the district
office.
About This School Contact Information (Most Recent Year)
School Contact Information
School Name------- Vista High School (Independent Study)
Street------- 2625 Barnard Road
City, State, Zip------- Richmond, CA 94806
Phone Number------- (510) 231-1431
Principal------- Linda Delgado
E-mail Address------- [email protected]
Web Site------- http://www.wccusd.net/site/Default.aspx?PageID=2642
CDS Code 07-61796-0730325
District Contact Information
District Name------- West Contra Costa Unified School District
Phone Number------- (510) 231-1100
Superintendent------- Dr. Bruce Harter
E-mail Address------- [email protected]
Web Site------- www.wccusd.net

2013-14 School Accountability Report Card for Vista High School (Independent Study) Page 2 of 14
School Description and Mission Statement (Most Recent Year)
The West Contra Costa Unified School District serves a primarily urban, lower to middle class population from the cities of Richmond, San Pablo, Pinole, El Cerrito, Hercules, and El Sobrante. Vista draws students from all parts of the WCCUSD who voluntairily choose Vista as the school that will best serve their academic and social skills and needs. Our student population is very diverse, representing all socio-economic levels and multiple cultures and ethinicty. Vista High School mission is to provide all students with an individualized independent study program that will enable them to achieve their educational goals, by enhancing self-esteem and providing an integrated curriculum involving the school, home, and community environment. Vista High School was founded in 1987 to provide a challenging, supportive, and successful one-on-one independent study school for at-risk, urban youth who were seeking a high school experience that would help prepare them for college, career, and life. Although the original focus was for at-risk students, today Vista High serves a wide range of students, students who excel in the smaller setting and the safe environment of Vista's campus. Students come to Vista for three reasons. First, there are those who are drawn to independent study as a first choice because they want to pursue an individualized path to reach educational goals. Others come to Vista because they have found impediments to their education: overcrowded classes, inability to focus on specific tasks, peer pressure to follow others/not attend classes, or inappropriate class placement. The third group of students has outside obligations such as work, childcare, or other family responsibilities. Vista High provides all students with an individualized independent study program that will enable them to successfully achieve their educational goals. By enhancing self-esteem and providing an integrated curriculum involving the school, home, and community environment, the program endeavors to inspire students to pursue their education, earn a high school diploma, and continue to pursue knowledge post graduation in college or university. The staff constantly builds on and maintains a quality, personalized program that will be both demanding and rewarding for the students. Vista High School is devoted entirely to providing an optional instructional strategy by which all enrolled pupils may reach curriculum objectives and fulfill A- G graduation requirements through an independent study format. There are approximately 200 students in grades 7 through 12 who are enrolled in this school. Each secondary student are assigned to one supervising teacher. During the once-a-week meeting the supervising teacher makes appropriate assignments for the following week and reviews and evaluates the work from the previous week. Areas of strength and weakness are noted and reviewed to insure that the student is making progress towards fulfilling the academic content standards. The minimum commitment is that the student will do at least 20 hours of work per week. At the high school level it is necessary to do 30 hours of work per week to maintain the 30 credits per semester needed to graduate. Although the foundation of the instructional program is the one-on-one session with student and supervising teacher, other educational opportunities are available beyond the individual meeting. Students may be enrolled in classes and/or attend labs at Vista, or do a concurrent enrollment with the local community college.Currently Vista offers biology, chemistry, Algebra I, Algebra II, geometry, pre-calculus, and French as classes that meet once or twice a week in a more traditional classroom format with one teacher. Vista also has an Advanced Placement program. AP environmental science and AP composition are taught in small group settings. An English Language Development class is held twice a week for students who have been designated ELD 3 or 4. For additional tutoring in all subjects, we have open labs twice a week facilitated by Vista teachers. Cyber High courses are available to students in enroll at Vista with credit deficiencies. Vista provides a clear, well-rounded and rigorous student achievement program that addresses the full range of student needs that results in all students being prepared for a successful life. We follow the independent format, developing individualized educational plans for each student. Our teachers assess each student weekly and develop strategies for students based on the California Common Core State standards. We draw from all resources, both district and community to meet the needs of our students. Our remarkable staff develops and shares a variety of strategies electronically and at weekly Staff Development meetings. The entire staff uses data to form plans guided by the Instructional Leadership Team. We review data from individual assessments to develop individual plans and all attendance, credit and grades are based solely on student "work product" which is continually assessed by the staff. At Vista, every student has a teacher who knows his/her strengths and needs and uses differentiated instruction. Vista students continue to take advantage of the opportunity to take classes at Contra Costa Community College and other local community colleges. Vista is "alternative" in the delivery of instruction. The same courses, standardized curriculum and textbooks as the district’s comprehensive high schools and middle schools are used at Vista. The district uses state approved texts that are aligned with Common Core State Standards. We treat every student as a unique individual and all aspects of our program reflect this.

2013-14 School Accountability Report Card for Vista High School (Independent Study) Page 3 of 14
Student Enrollment by Grade Level (School Year 2013-14)
Grade Level Number of Students
Grade 1------- 1
Grade 2------- 1
Grade 4------- 1
Grade 5------- 1
Grade 6------- 3
Grade 7------- 3
Grade 8 3
Grade 9------- 18
Grade 10------- 30
Grade 11------- 84
Grade 12------- 163
Ungraded Secondary------- 108
Total Enrollment------- 416
Student Enrollment by Group (School Year 2013-14)
Group Percent of Total Enrollment
Black or African American------- 25.5
American Indian or Alaska Native------- 0.2
Asian------- 4.1
Filipino------- 3.4
Hispanic or Latino------- 50.5
Native Hawaiian or Pacific Islander 0.2
White 13.2
Two or More Races 2.2
Socioeconomically Disadvantaged 65.4
English Learners 26.7
Students with Disabilities 30.5
A. Conditions of Learning
State Priority: Basic The SARC provides the following information relevant to the Basic State Priority (Priority 1): • Degree to which teachers are appropriately assigned and fully credentialed in the subject area and for the pupils they are
teaching; • Pupils have access to standards-aligned instructional materials; and • School facilities are maintained in good repair. Teacher Credentials
Teachers School District
2012-13 2013-14 2014-15 2014-15
With Full Credential 12 10 9 9
Without Full Credential 0 0 0 0
Teaching Outside Subject Area of Competence (with full credential) 0 0 0 0

2013-14 School Accountability Report Card for Vista High School (Independent Study) Page 4 of 14
Teacher Misassignments and Vacant Teacher Positions
Indicator 2012-13 2013-14 2014-15
Misassignments of Teachers of English Learners 0 0 0
Total Teacher Misassignments * 0 0 0
Vacant Teacher Positions 0 0 0 Note: “Misassignments” refers to the number of positions filled by teachers who lack legal authorization to teach that grade level, subject area, student group, etc. * Total Teacher Misassignments includes the number of Misassignments of Teachers of English Learners. Core Academic Classes Taught by Highly Qualified Teachers (School Year 2013-14)
Location of Classes Percent of Classes In Core Academic Subjects
Taught by Highly Qualified Teachers Not Taught by Highly Qualified Teachers
This School 100.00 0.00
All Schools in District 95.82 4.18
High-Poverty Schools in District 95.70 4.30
Low-Poverty Schools in District 99.07 0.93 Note: High-poverty schools are defined as those schools with student eligibility of approximately 40 percent or more in the free and reduced price meals program. Low-poverty schools are those with student eligibility of approximately 39 percent or less in the free and reduced price meals program. Quality, Currency, Availability of Textbooks and Instructional Materials (School Year 2014-15) Year and month in which data were collected:
Core Curriculum Area Textbooks and Instructional Materials/
Year of Adoption
From Most Recent
Adoption?
Percent of Students Lacking Own
Assigned Copy
Reading/Language Arts Selected Novels for each grade level. Prentice Hall Literature: Timeless Voices – Gold (English 1); Prentice Hall Literature, Timeless Voices – Platinum (English 2); Prentice Hall Literature – Ruby (English 3) ELD: Keystone
Intervention: READ 180.
Yes 0%
Mathematics Prentice Hall, Algebra 1; Key Curriculum Advanced Algebra (Algebra 2); Key Curriculum Geometry, Geometry; Glencoe Advanced Mathematical Concepts (Math Analysis); Prentice Hall, Calculus
Yes 0%
Science------- Cambridge Physics Outlet (CPO) High School Chemistry: Prentice Hall Chemistry High School Biology: McDougal Littel Biology Prentice Hall: Biology
Pearson Ed: Biology (AP class) Prentice Hall: Exploring Physical Science (AP) Prentice Hall: Environmental Science (AP class)
Yes 0%
History-Social Science World Geography and Cultures, Glencoe, Cultural Geography
High School World History: The Modern World McDougal Littell High School US History: The Americas
McDougal Littell High School Economics: McDougal Littell Economics 2007 edition
Prentice Hall Magrudar's American Government, American Government
Yes 0%

2013-14 School Accountability Report Card for Vista High School (Independent Study) Page 5 of 14
Core Curriculum Area Textbooks and Instructional Materials/
Year of Adoption
From Most Recent
Adoption?
Percent of Students Lacking Own
Assigned Copy
Foreign Language EMC/Paradigm Publishing
Spanish 1: Realidades 1- Prentice-Hall Spanish 2: Realidades 2- Prentice-Hall Spanish 3: Realidades 3 - Prentice-Hall Spanish 4: Aventura – EMC Publishing
Spanish 5(AP) Cumbre-Heinle
Yes 0%
Health------- Glencoe/McGraw-Hill: Teen Health Course 0%
Science Laboratory Equipment (grades 9-12)
Laboratory equipment is provided to meet the needs of all high school classes in science.
Yes 0%
School Facility Conditions and Planned Improvements (Most Recent Year)
Vista High School (alternative-independent study) is located at the Vista Hills Education Center. School Facility Good Repair Status (Most Recent Year)
School Facility Good Repair Status (Most Recent Year) Year and month in which data were collected: October 2014
System Inspected Repair Status Repair Needed and
Action Taken or Planned Good Fair Poor
Systems: Gas Leaks, Mechanical/HVAC, Sewer
[X] [ ] [ ]
Interior: Interior Surfaces
[ ] [X] [ ] White board needed (work complete)
Cleanliness: Overall Cleanliness, Pest/ Vermin Infestation
[X] [ ] [ ]
Electrical: Electrical
[ ] [X] [ ]
Restrooms/Fountains: Restrooms, Sinks/ Fountains
[ ] [X] [ ]
Safety: Fire Safety, Hazardous Materials
[X] [ ] [ ]
Structural: Structural Damage, Roofs
[X] [ ] [ ]
External: Playground/School Grounds, Windows/ Doors/Gates/Fences
[ ] [X] [ ]
Overall Facility Rating (Most Recent Year)
Overall Rating Exemplary Good Fair Poor
[ ] [X] [ ] [ ]
2013-14 School Accountability Report Card for Vista High School (Independent Study) Page 6 of 14
B. Pupil Outcomes
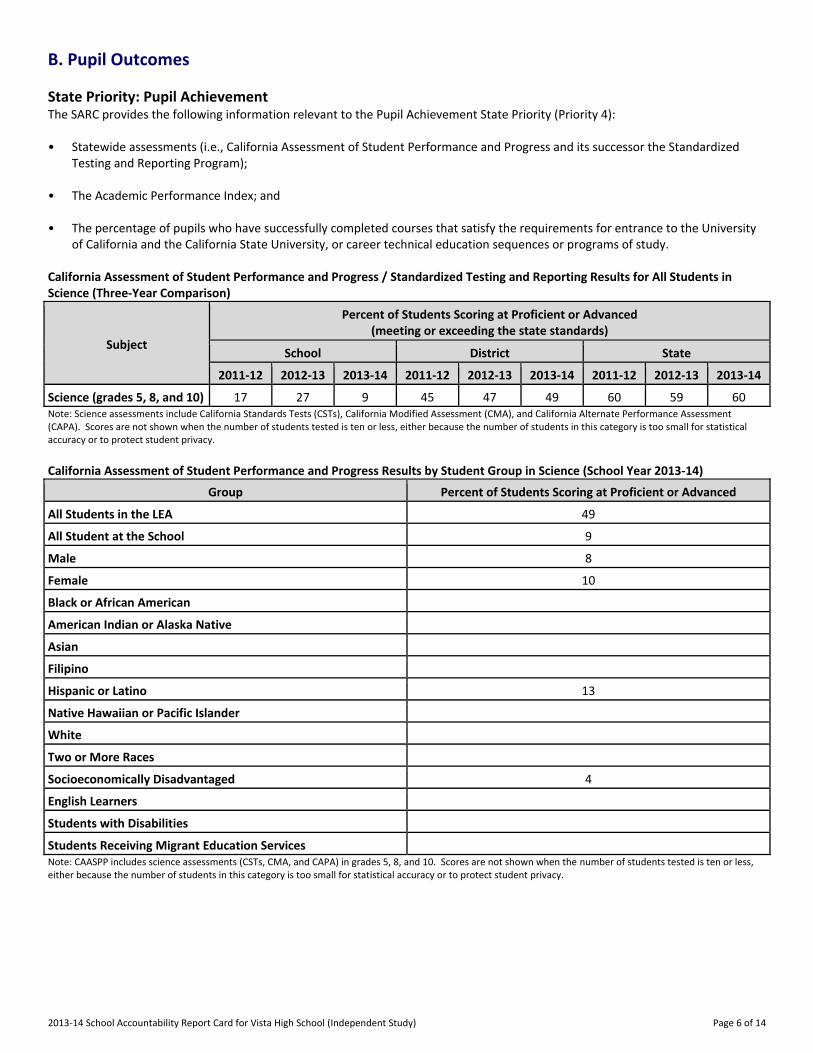
State Priority: Pupil Achievement The SARC provides the following information relevant to the Pupil Achievement State Priority (Priority 4): • Statewide assessments (i.e., California Assessment of Student Performance and Progress and its successor the Standardized
Testing and Reporting Program); • The Academic Performance Index; and • The percentage of pupils who have successfully completed courses that satisfy the requirements for entrance to the University
of California and the California State University, or career technical education sequences or programs of study. California Assessment of Student Performance and Progress / Standardized Testing and Reporting Results for All Students in Science (Three-Year Comparison)
Subject
Percent of Students Scoring at Proficient or Advanced (meeting or exceeding the state standards)
School District State
2011-12 2012-13 2013-14 2011-12 2012-13 2013-14 2011-12 2012-13 2013-14
Science (grades 5, 8, and 10) 17 27 9 45 47 49 60 59 60 Note: Science assessments include California Standards Tests (CSTs), California Modified Assessment (CMA), and California Alternate Performance Assessment (CAPA). Scores are not shown when the number of students tested is ten or less, either because the number of students in this category is too small for statistical accuracy or to protect student privacy.
California Assessment of Student Performance and Progress Results by Student Group in Science (School Year 2013-14)
Group Percent of Students Scoring at Proficient or Advanced
All Students in the LEA 49
All Student at the School 9
Male------- 8
Female------- 10
Black or African American
American Indian or Alaska Native
Asian-------
Filipino-------
Hispanic or Latino 13
Native Hawaiian or Pacific Islander
White-------
Two or More Races-------
Socioeconomically Disadvantaged 4
English Learners-------
Students with Disabilities
Students Receiving Migrant Education Services Note: CAASPP includes science assessments (CSTs, CMA, and CAPA) in grades 5, 8, and 10. Scores are not shown when the number of students tested is ten or less, either because the number of students in this category is too small for statistical accuracy or to protect student privacy.

2013-14 School Accountability Report Card for Vista High School (Independent Study) Page 7 of 14
Standardized Testing and Reporting Results for All Students (Three-Year Comparison)
Subject
Percent of Students Scoring at Proficient or Advanced (meeting or exceeding the state standards)
School District State
2010-11 2011-12 2012-13 2010-11 2011-12 2012-13 2010-11 2011-12 2012-13
English-Language Arts 22 23 22 41 43 42 54 56 55
Mathematics------- 2 9 5 37 38 38 49 50 50
History-Social Science 10 13 15 28 30 32 48 49 49 Note: STAR Program was last administered in 2012-13. Percentages are not calculated when the number of students tested is ten or less, either because the number of students in this category is too small for statistical accuracy or to protect student privacy. Academic Performance Index Ranks (Three-Year Comparison)
API Rank 2010-11 2011-12 2012-13
Statewide------- B B B
Similar Schools------- B B B Note: For 2014 and subsequent years, the statewide and similar schools ranks will no longer be produced. Academic Performance Index Growth by Student Group (Three-Year Comparison)
Group Actual API Change
2010-11 2011-12 2012-13
All Students at the School -26 11 41
Black or African American
American Indian or Alaska Native
Asian-------
Filipino-------
Hispanic or Latino -34
Native Hawaiian/Pacific Islander
White-------
Two or More Races
Socioeconomically Disadvantaged
English Learners
Students with Disabilities Note: "N/D” means that no data were available to the CDE or LEA to report. “B” means the school did not have a valid API Base and there is no Growth or target information. “C” means the school had significant demographic changes and there is no Growth or target information.
Career Technical Education Programs (School Year 2013-14)
Career Technical Education Participation (School Year 2013-14)
Measure CTE Program Participation
Number of pupils participating in CTE N/A
% of pupils completing a CTE program and earning a high school diploma N/A
% of CTE courses sequenced or articulated between the school and institutions of postsecondary education N/A
2013-14 School Accountability Report Card for Vista High School (Independent Study) Page 8 of 14
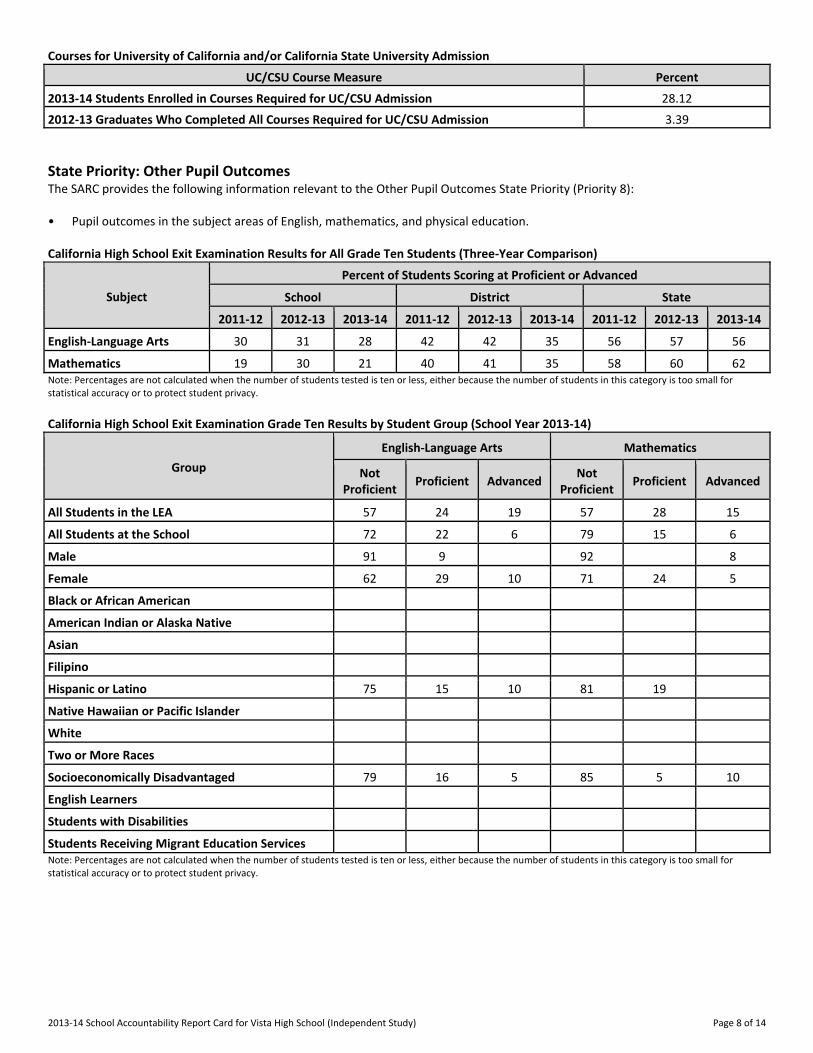
Courses for University of California and/or California State University Admission
UC/CSU Course Measure Percent
2013-14 Students Enrolled in Courses Required for UC/CSU Admission 28.12
2012-13 Graduates Who Completed All Courses Required for UC/CSU Admission 3.39
State Priority: Other Pupil Outcomes The SARC provides the following information relevant to the Other Pupil Outcomes State Priority (Priority 8): • Pupil outcomes in the subject areas of English, mathematics, and physical education. California High School Exit Examination Results for All Grade Ten Students (Three-Year Comparison)
Subject
Percent of Students Scoring at Proficient or Advanced
School District State
2011-12 2012-13 2013-14 2011-12 2012-13 2013-14 2011-12 2012-13 2013-14
English-Language Arts 30 31 28 42 42 35 56 57 56
Mathematics 19 30 21 40 41 35 58 60 62 Note: Percentages are not calculated when the number of students tested is ten or less, either because the number of students in this category is too small for statistical accuracy or to protect student privacy. California High School Exit Examination Grade Ten Results by Student Group (School Year 2013-14)
Group
English-Language Arts Mathematics
Not Proficient
Proficient Advanced Not
Proficient Proficient Advanced
All Students in the LEA 57 24 19 57 28 15
All Students at the School 72 22 6 79 15 6
Male------- 91 9 92 8
Female------- 62 29 10 71 24 5
Black or African American
American Indian or Alaska Native
Asian-------
Filipino-------
Hispanic or Latino 75 15 10 81 19
Native Hawaiian or Pacific Islander
White-------
Two or More Races
Socioeconomically Disadvantaged 79 16 5 85 5 10
English Learners-------
Students with Disabilities
Students Receiving Migrant Education Services Note: Percentages are not calculated when the number of students tested is ten or less, either because the number of students in this category is too small for statistical accuracy or to protect student privacy.

2013-14 School Accountability Report Card for Vista High School (Independent Study) Page 9 of 14
California Physical Fitness Test Results (School Year 2013-14)
Grade Level
Percent of Students Meeting Fitness Standards
Four of Six Standards Five of Six Standards Six of Six Standards
-------5-------
-------7-------
-------9------- 5.9 23.5 5.9 Note: Percentages are not calculated when the number of students tested is ten or less, either because the number of students in this category is too small for statistical accuracy or to protect student privacy.
C. Engagement
State Priority: Parental Involvement The SARC provides the following information relevant to the Parental Involvement State Priority (Priority 3): • Efforts the school district makes to seek parent input in making decisions for the school district and each schoolsite. Opportunities for Parental Involvement (Most Recent Year)
Teachers call parents about their student’s successes as well as their tardies, absences, and problems. Parents are welcome to attend weekly student appointments. Teachers, students and parents review data from individuallized student assessments to develop individual student educational plans. In independent study all attendance, credit and grades are based solely on student "work product" as assessed on an individual basis. The parent and student must attend the Vista orientation as part of the admission process. At orientation, the lead teacher clearly explains the Independent Study program. Since the program is voluntary entrance, the counselor at the students comprehensive high school of residence has a pre-conference with the student and the parent or guardian explaining the Referral Process to Alternative Education. There is a 2-3 week process which includes a mandatory orientation of 90 minutes with the parent/guardian and the Reading and Mathematics test to determine the students ability to handle a minumum of 20 hours of homework per week on an independent basis. Following the test a practice packet is given to the student to be completed and returned to the Vista High main office within one week. The parent is advised not to help the student with this first packet to make sure they can study alone. Additionally, Vista held a parent and student group orientation/ preparing for the new year in August. 90% of the parents attended, and many reported benefits from the event. WASC Focus Groups: Vista is going through the WASC accreditation process that gave parents a collaborative role. Parents are active in focus groups focused on Instruction, Curriculum, Assessment, and Student Support. Parents are an active part of our plan to forge a positive, dynamic, world-class image of Vista High. Vista is engaged in the WASC accreditation process for this year on a three year revisit for a 6 year accreditation.
State Priority: Pupil Engagement The SARC provides the following information relevant to the Pupil Engagement State Priority (Priority 5): • High school dropout rates; and • High school graduation rates. Dropout Rate and Graduation Rate (Four-Year Cohort Rate)
Indicator School District State
2010-11 2011-12 2012-13 2010-11 2011-12 2012-13 2010-11 2011-12 2012-13
Dropout Rate 18.1 18.2 13.3 18.1 18.2 13.3 14.7 13.1 11.4
Graduation Rate 76.99 75.72 79.88 76.99 75.72 79.88 77.14 78.87 80.44
2013-14 School Accountability Report Card for Vista High School (Independent Study) Page 10 of 14
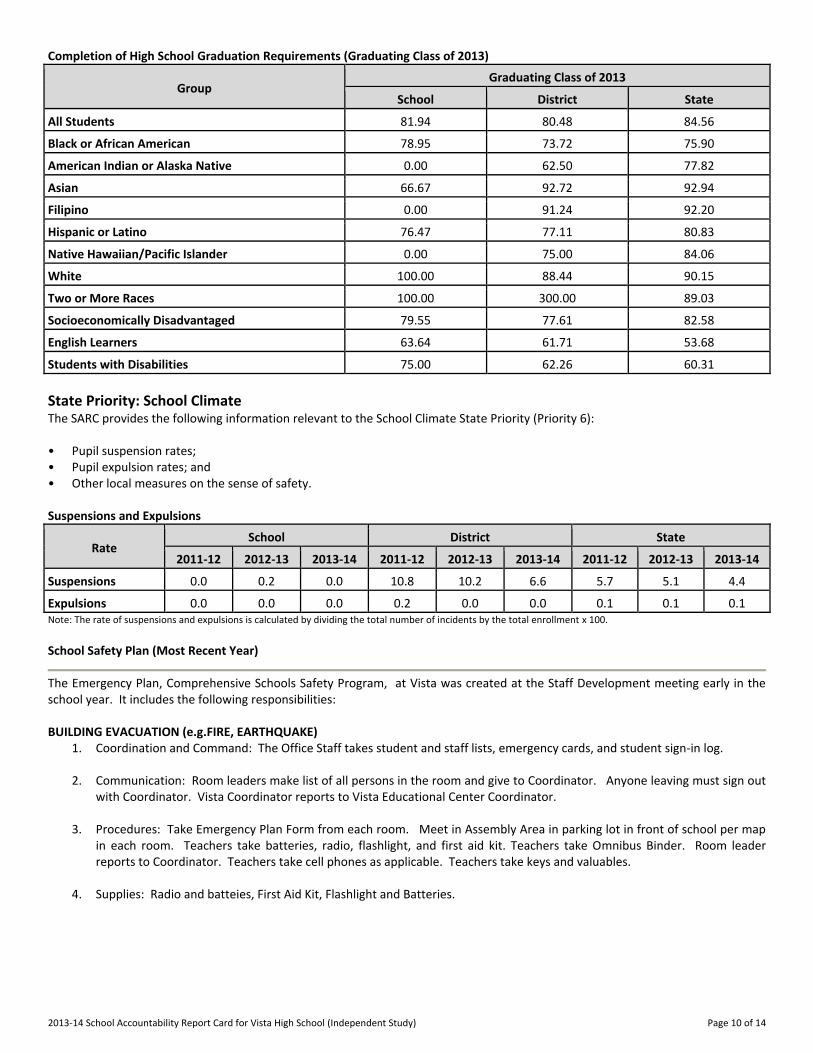
Completion of High School Graduation Requirements (Graduating Class of 2013)
Group Graduating Class of 2013
School District State
All Students 81.94 80.48 84.56
Black or African American 78.95 73.72 75.90
American Indian or Alaska Native 0.00 62.50 77.82
Asian------- 66.67 92.72 92.94
Filipino------- 0.00 91.24 92.20
Hispanic or Latino 76.47 77.11 80.83
Native Hawaiian/Pacific Islander 0.00 75.00 84.06
White------- 100.00 88.44 90.15
Two or More Races 100.00 300.00 89.03
Socioeconomically Disadvantaged 79.55 77.61 82.58
English Learners 63.64 61.71 53.68
Students with Disabilities 75.00 62.26 60.31
State Priority: School Climate The SARC provides the following information relevant to the School Climate State Priority (Priority 6): • Pupil suspension rates; • Pupil expulsion rates; and • Other local measures on the sense of safety. Suspensions and Expulsions
Rate School District State
2011-12 2012-13 2013-14 2011-12 2012-13 2013-14 2011-12 2012-13 2013-14
Suspensions------- 0.0 0.2 0.0 10.8 10.2 6.6 5.7 5.1 4.4
Expulsions------- 0.0 0.0 0.0 0.2 0.0 0.0 0.1 0.1 0.1 Note: The rate of suspensions and expulsions is calculated by dividing the total number of incidents by the total enrollment x 100. School Safety Plan (Most Recent Year)
The Emergency Plan, Comprehensive Schools Safety Program, at Vista was created at the Staff Development meeting early in the school year. It includes the following responsibilities: BUILDING EVACUATION (e.g.FIRE, EARTHQUAKE)
1. Coordination and Command: The Office Staff takes student and staff lists, emergency cards, and student sign-in log.
2. Communication: Room leaders make list of all persons in the room and give to Coordinator. Anyone leaving must sign out with Coordinator. Vista Coordinator reports to Vista Educational Center Coordinator.
3. Procedures: Take Emergency Plan Form from each room. Meet in Assembly Area in parking lot in front of school per map
in each room. Teachers take batteries, radio, flashlight, and first aid kit. Teachers take Omnibus Binder. Room leader reports to Coordinator. Teachers take cell phones as applicable. Teachers take keys and valuables.
4. Supplies: Radio and batteies, First Aid Kit, Flashlight and Batteries.

2013-14 School Accountability Report Card for Vista High School (Independent Study) Page 11 of 14
SHELTER IN PLACE (e.g.CHEMICAL RELEASE)
1. Communication: Room leaders make list of all persons in the room and call in to Coordinator. No one is to leave before all clear from county or district and Vista Coordinator. Anyone leaving must sign out with Coordinator. Vista Coordinator reports to Vista Hills Educational Center Coordinator.
2. Procedures: Stay in place with doors and windows shut. Room leader reports names of all people in each room to school
Coordinator. Turn on radio for info from outside but follow instructions from school Coordinator. Use school phones or cell phones to communicate from room to room and to contact parents/guardians. Anyone leaving must sign out with Coordinator.
3. Supplies: Radio and batteries, First Aid Kit, Flashlight and Batteries, Water (12 bottles per room), Powerbars (or something
similar). KEY TERMS:
The room leaders signed up at the Staff Development meeting.
The Omnibus is how teachers account for each student.
The Emergency Card indicates the legal release of students only to parents or indicated guardians. The School Safety and Emergency Team meets at the beginning of the year and there after as needed. Their role includes the following as coordinated by the Administration: * Have classes practice walking to their designated outdoor area in case of an emergency; and
• Be sure there are exit signs near each door; • Update the First Aid kit in every room and create a visual identification to show where it is stored; • Stock each room with a flashlight, radio, and water; • Ensure usage of identification badgeswhich are issued to students during the first week of school.
D. Other SARC Information
The information in this section is required to be in the SARC but is not included in the state priorities for LCFF. Adequate Yearly Progress Overall and by Criteria (School Year 2013-14)
AYP Criteria School District
Made AYP Overall
Met Participation Rate: English-Language Arts
Met Participation Rate: Mathematics
Met Percent Proficient: English-Language Arts
Met Percent Proficient: Mathematics
Met Graduation Rate (if applicable)
Federal Intervention Program (School Year 2014-15)
Indicator School District
Program Improvement Status In PI
First Year of Program Improvement 2004-2005
Year in Program Improvement* Year 3
Number of Schools Currently in Program Improvement --- 23
Percent of Schools Currently in Program Improvement --- 82.1 Note: Cells with “---“ do not require data. * DW (determination waiver) indicates that the PI status of the school was carried over from the prior year in accordance with the flexibility granted through the federal waiver process.

2013-14 School Accountability Report Card for Vista High School (Independent Study) Page 12 of 14
Average Class Size and Class Size Distribution (Elementary)
Grade Level
2011-12 2012-13 2013-14
Avg. Class Size
Number of Classes Avg. Class Size
Number of Classes Avg. Class Size
Number of Classes
1-20 21-32 33+ 1-20 21-32 33+ 1-20 21-32 33+
K ----------
1 ----------
3 1 1 1
2 ----------
1 1
3 ----------
2 1
4 ----------
1 1 1 1
5 ----------
3 1 1 1
6 ----------
3 1
Other ----------
0 8 0 0 11 10 Note: Number of classes indicates how many classes fall into each size category (a range of total students per class).
Average Class Size and Class Size Distribution (Secondary)
Subject
2011-12 2012-13 2013-14
Avg. Class Size
Number of Classrooms Avg. Class Size
Number of Classrooms Avg. Class Size
Number of Classrooms
1-22 23-32 33+ 1-22 23-32 33+ 1-22 23-32 33+
English------- ----------
18 2 2
Mathematics ----------
27 4
Science------- ----------
Social Science ----------
29 2 1 Note: Number of classes indicates how many classrooms fall into each size category (a range of total students per classroom). At the secondary school level, this information is reported by subject area rather than grade level. Academic Counselors and Other Support Staff (School Year 2013-14)
Title Number of FTE
Assigned to School Average Number of Students per
Academic Counselor
Academic Counselor------- 0
Counselor (Social/Behavioral or Career Development) 0 ---
Library Media Teacher (Librarian) 0 ---
Library Media Services Staff (Paraprofessional) 0 ---
Psychologist------- .025 ---
Social Worker------- ---
Nurse------- ---
Speech/Language/Hearing Specialist 0 ---
Resource Specialist------- 0 ---
Other------- 0 --- Note: Cells with “---“ do not require data. One Full Time Equivalent (FTE) equals one staff member working full time; one FTE could also represent two staff members who each work 50 percent of full time.

2013-14 School Accountability Report Card for Vista High School (Independent Study) Page 13 of 14
Expenditures per Pupil and School Site Teacher Salaries (Fiscal Year 2012-13)
Level
Expenditures Per Pupil Average Teacher Salary Total
Supplemental/ Restricted
Basic/ Unrestricted
School Site------- $7,971.93 $637.68 $7,334.25 $71,612.35
District------- --- --- $5,547.14 $57,253
Percent Difference: School Site and District --- --- 32.2 30.0
State------- --- --- $4,690 $70,720
Percent Difference: School Site and State --- --- 32.5 2.7 Note: Cells with “---“ do not require data.
Types of Services Funded (Fiscal Year 2013-14)
Eighty percent of our operating expenditures go to salaries and benefits of teachers and support staff. Other expenses include books, supplies, and operational services such as utilities. Much of the operating revenues we receive from state, federal and local resources is for programs with specific guidelines and regulations governing their use. Examples include Special Education, Title I, II, II, V, School Improvement, Healthy Start, Gifted and Talented, Tenth Grade Counseling, Immediate Intervention Underperforming Schools Program and High Priority Schools grants. Revenues generated by the passage of two local bond measures, Measure M and Measure D, are accounted for in separate bond funds and designated exclusively for building modernization. In 2005 the voters approved Measure J, which will be accounted for in a separate bond fund and designated exclusively for building construction, technology, and modernization. Programs and services available at Vista School include:
• English Language Acquisition Program – Teacher Training • LEP Economic Impact Aid • Gifted & Talented Education • School & Library Improvement Block Grant • Discretionary Block Grant
Teacher and Administrative Salaries (Fiscal Year 2012-13)
Category District Amount State Average for Districts In Same Category
Beginning Teacher Salary $36,777 $41,761
Mid-Range Teacher Salary $56,678 $66,895
Highest Teacher Salary $75,980 $86,565
Average Principal Salary (Elementary) $87,412 $108,011
Average Principal Salary (Middle) $92,657 $113,058
Average Principal Salary (High) $103,480 $123,217
Superintendent Salary $227,250 $227,183
Percent of Budget for Teacher Salaries 31 38
Percent of Budget for Administrative Salaries 5 5 For detailed information on salaries, see the CDE Certificated Salaries & Benefits Web page at http://www.cde.ca.gov/ds/fd/cs/.

2013-14 School Accountability Report Card for Vista High School (Independent Study) Page 14 of 14
Advanced Placement Courses (School Year 2013-14)
Subject Number of AP Courses Offered* Percent of Students In AP Courses
Computer Science ---
English------- ---
Fine and Performing Arts ---
Foreign Language ---
Mathematics ---
Science------- ---
Social Science ---
All courses Note: Cells with “---“ do not require data. * Where there are student course enrollments.
Professional Development
Vista High provides professional development on the use of data, instructional strategies for both mathematics and English/Language Arts, and the use of new materials for intervention. Faculty representatives attend district-wide professional development activities and Independent Study conferences. Staff and leadership have engaged in aggressive expansion of technology use for both staff and students. Thanks to the District's leader in technology, each school has received a number of notebooks and a cart. Teachers who work with groups of students have used these for enhancing teaching and learning to great effect. The Science teacher, as technology lead, has undertaken extensive use of the Illuminate software, and has used this for checking for understanding, and using other purpose built assessments to guide instruction. Other teachers have embraced technology, providing opportunities for students to view pertinent videos, collaborate online, and leveraging other web-based technology. Quality instruction and instructional leadership are at the heart of the district's achievement efforts. To ensure this, the Academic Support Division engages teachers, administrators and other personnel in ongoing professional development focused on improving teaching and learning. Training is provided to principals and other administrators to improve their ability to provide strong instructional leadership and guide teaching and learning at school sites. The principals, in turn, provide support to teachers through staff conferences, opportunities for collaborative study and planning, and individual coaching based on ongoing classroom observations. Teachers and other staff are provided with both on and off-site professional development in all standards based curriculum content areas. Beyond the content areas, professional development is provided in English Language Development, Gifted and Talented Education (GATE), differentiated instruction and educational technology. In addition, training is made available in classroom management and the effective use of assessment data and teacher data teams in meeting the needs of all students. A primary goal of the professional development program is ensuring that all students are served by skilled, highly qualified teachers and that teachers are supported by strong, knowledgeable instructional leaders.