Embed Size (px)
DESCRIPTION
Have you ever used Qwizdom ? A. Yes B. No. This map shows information about:. A. Climate B. Temperature C. Precipitation D. Elevation. Be prepared to share your answer !. This map shows information about:. Climate. - PowerPoint PPT Presentation
Citation preview

Have you ever used Qwizdom?A. Yes B. No
This map shows information about:A. Climate B. Temperature
C. Precipitation D. Elevation
Be prepared to share your answer !
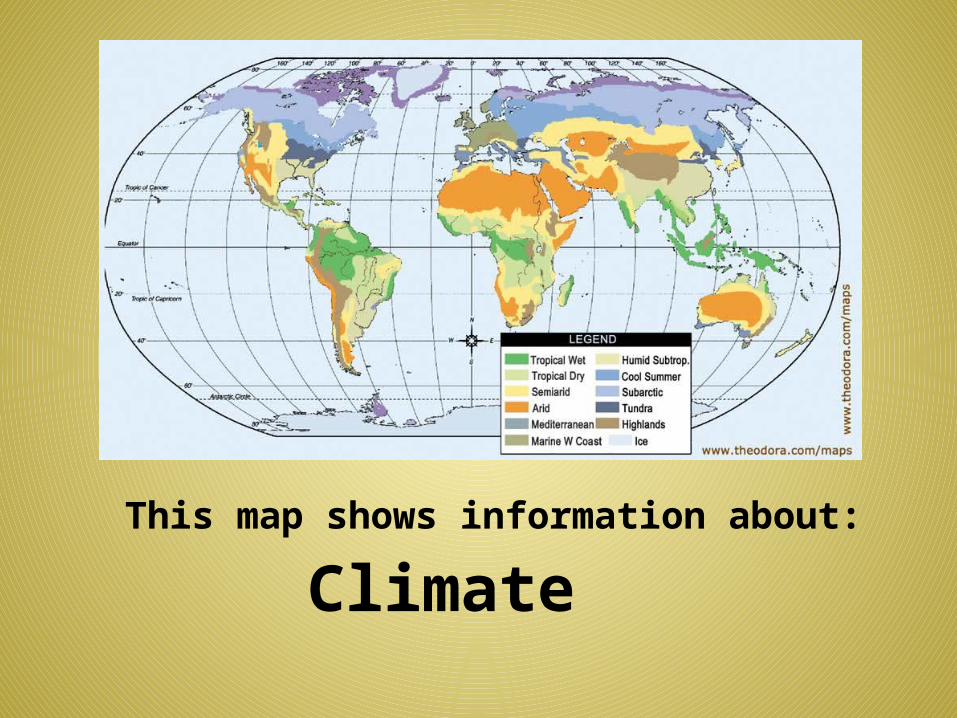
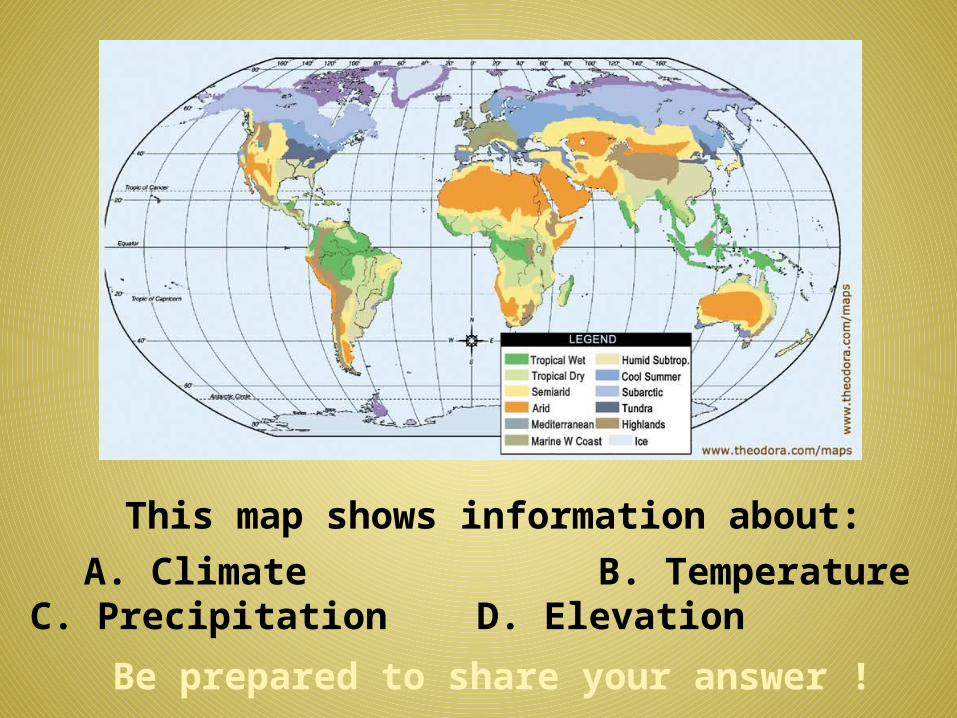
This map shows information about:
Climate
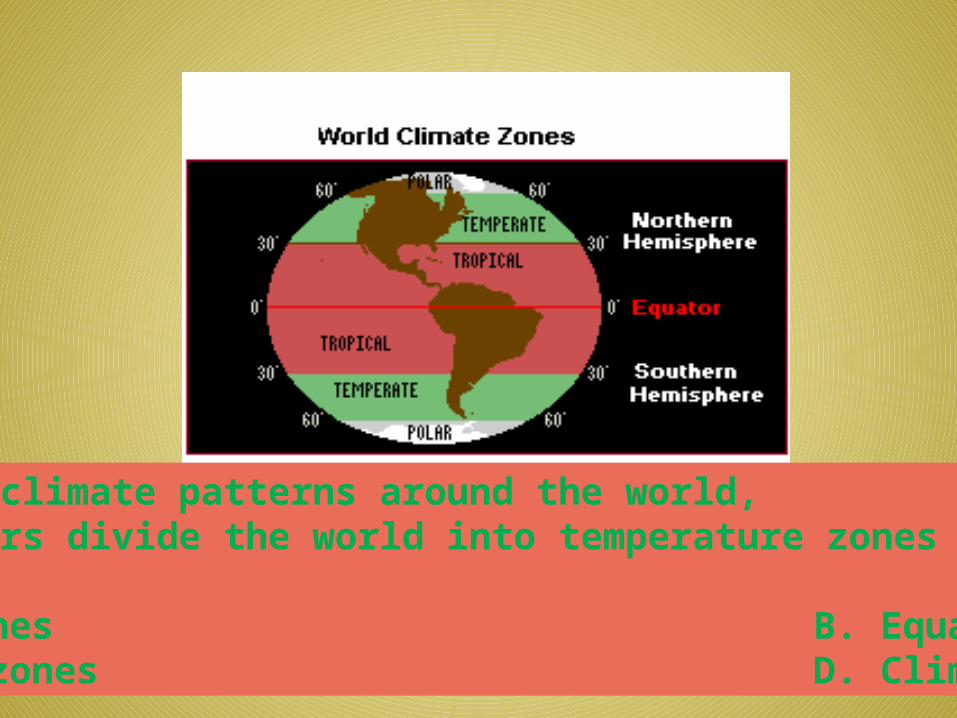
To study climate patterns around the world,geographers divide the world into temperature zones called?
A. Sun zones B. Equator zonesB. Polar zones D. Climate zones
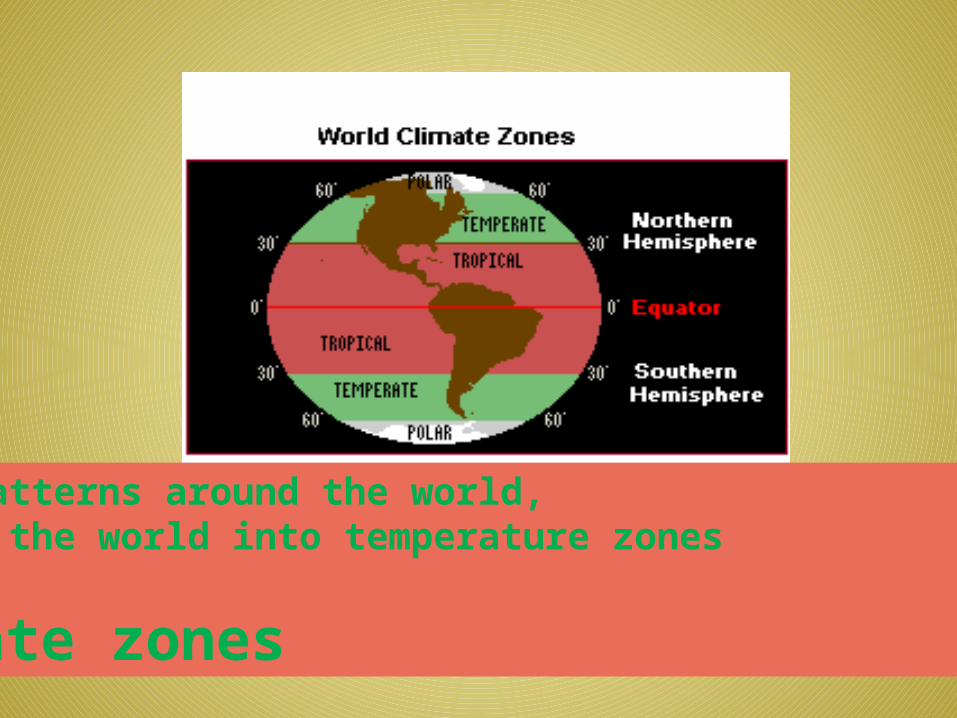
To study climate patterns around the world,geographers divide the world into temperature zones called?
Climate zones
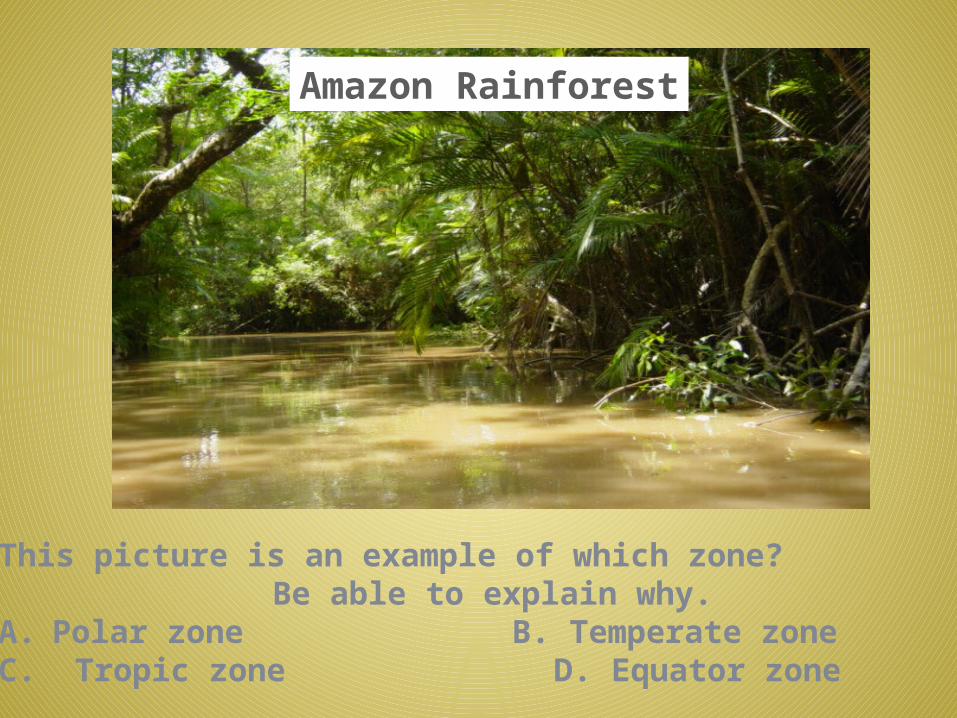
This picture is an example of which zone? Be able to explain why.
A. Polar zone B. Temperate zoneC. Tropic zone D. Equator zone
Amazon Rainforest
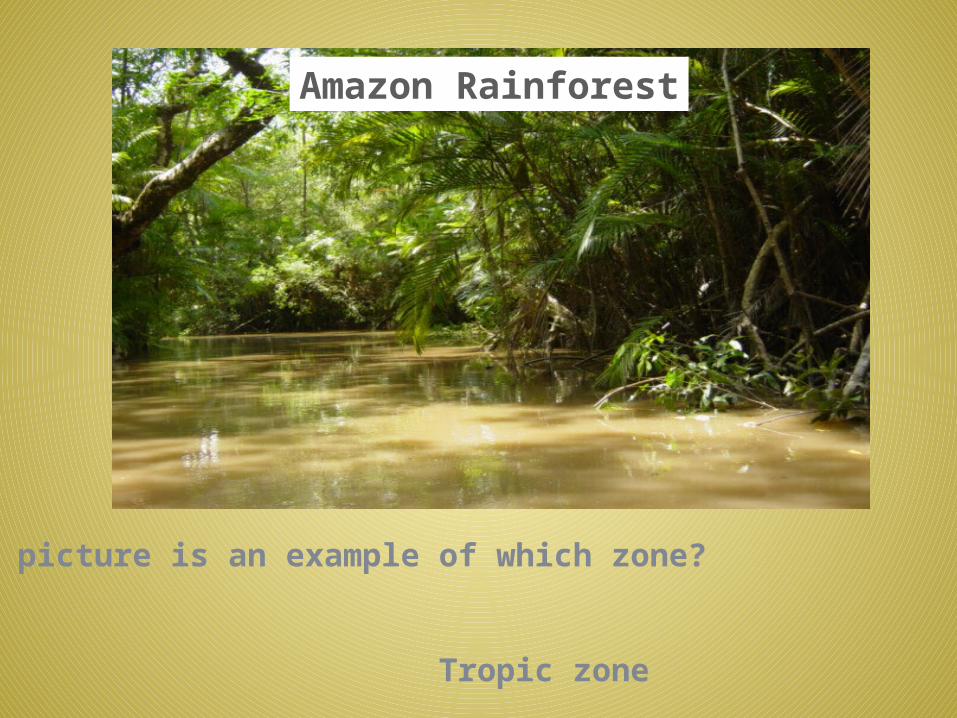
This picture is an example of which zone?
Tropic zone
Amazon Rainforest
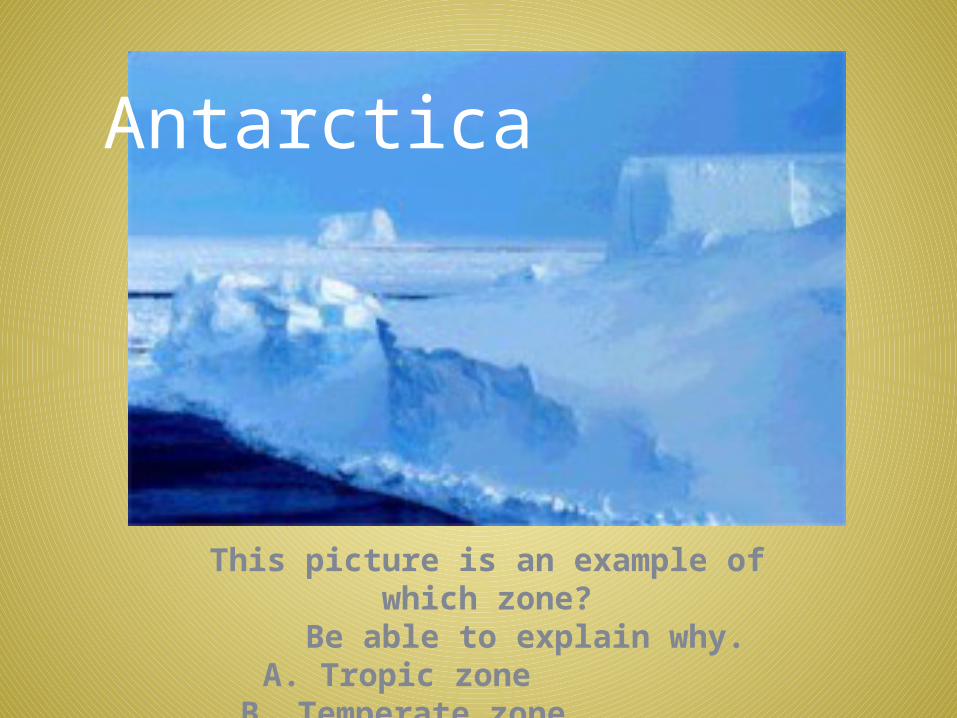
Antarctica
This picture is an example of which zone? Be able to explain why.
A. Tropic zone B. Temperate zone C. Polar zone D. Arctic Circle
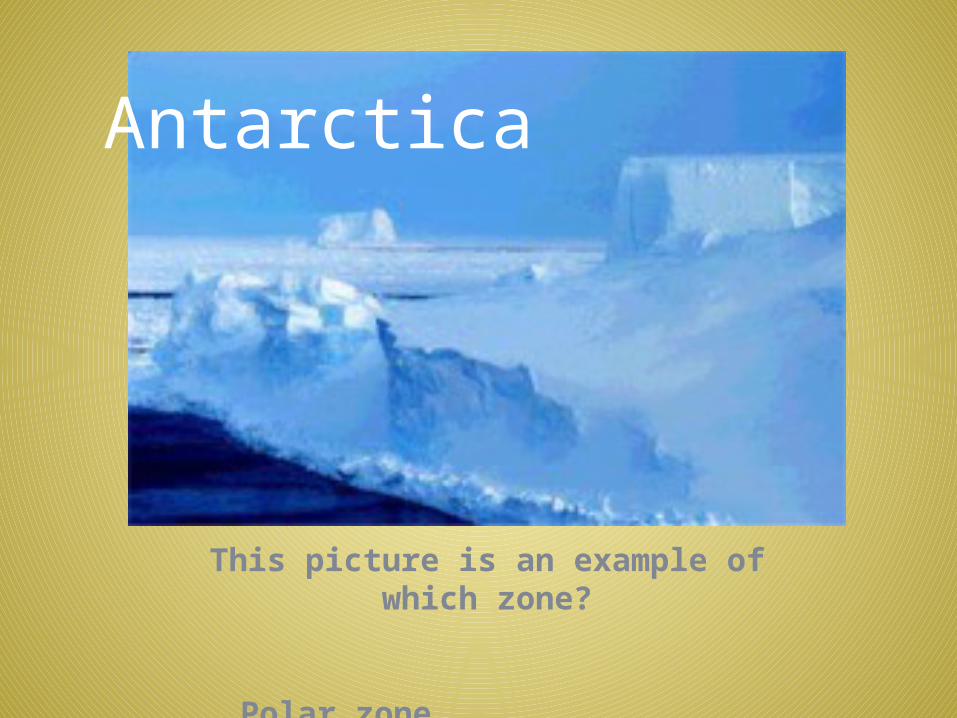
Antarctica
This picture is an example of which zone?
Polar zone
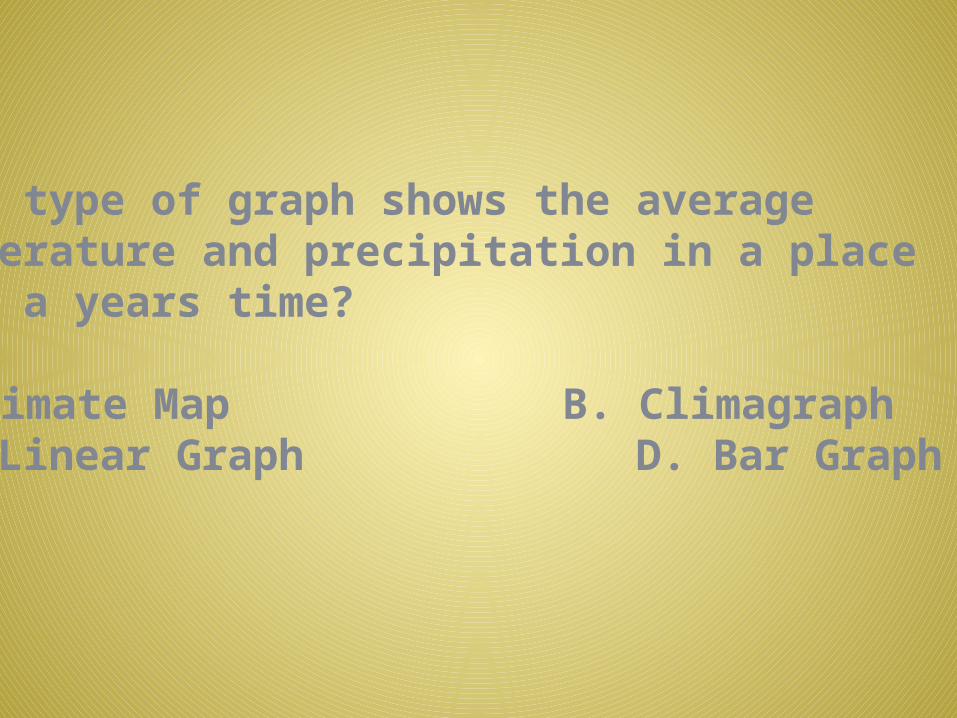
What type of graph shows the average temperature and precipitation in a place over a years time?
A. Climate Map B. ClimagraphC. Linear Graph D. Bar Graph
What type of graph shows the average temperature and precipitation in a place over a years time?
Climagragh
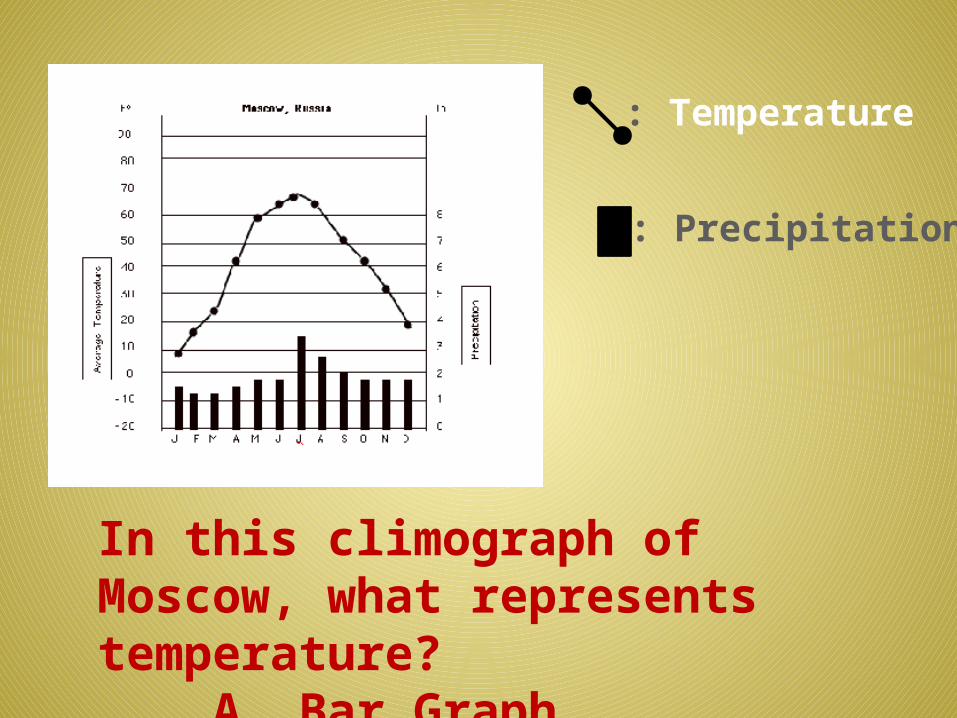
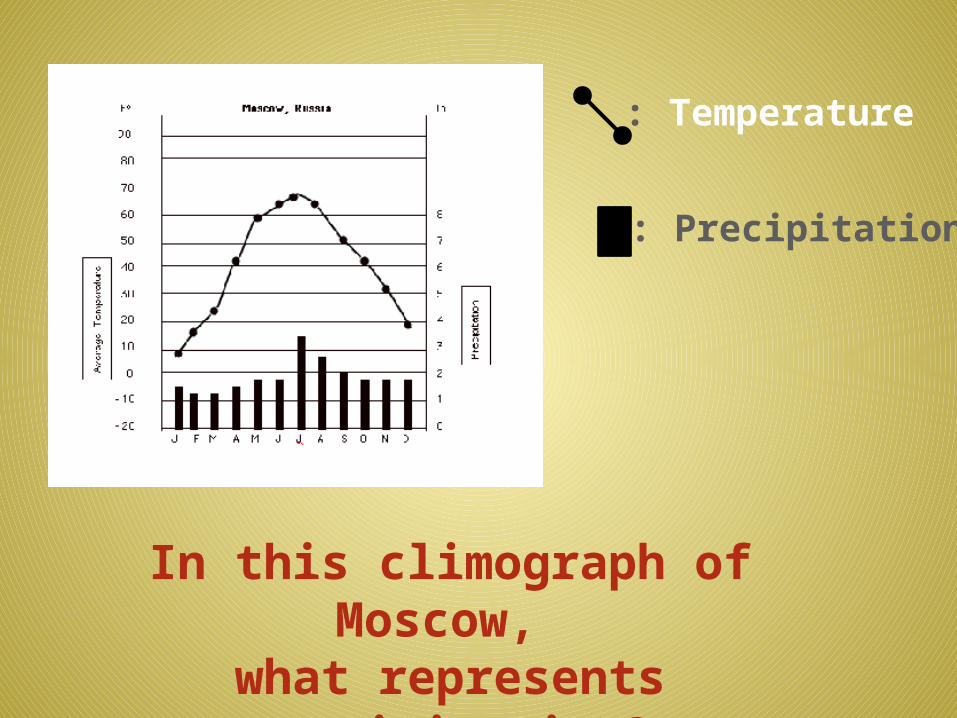
: Temperature
In this climograph of Moscow, what represents temperature? A. Bar Graph B. Line Graph
: Precipitation
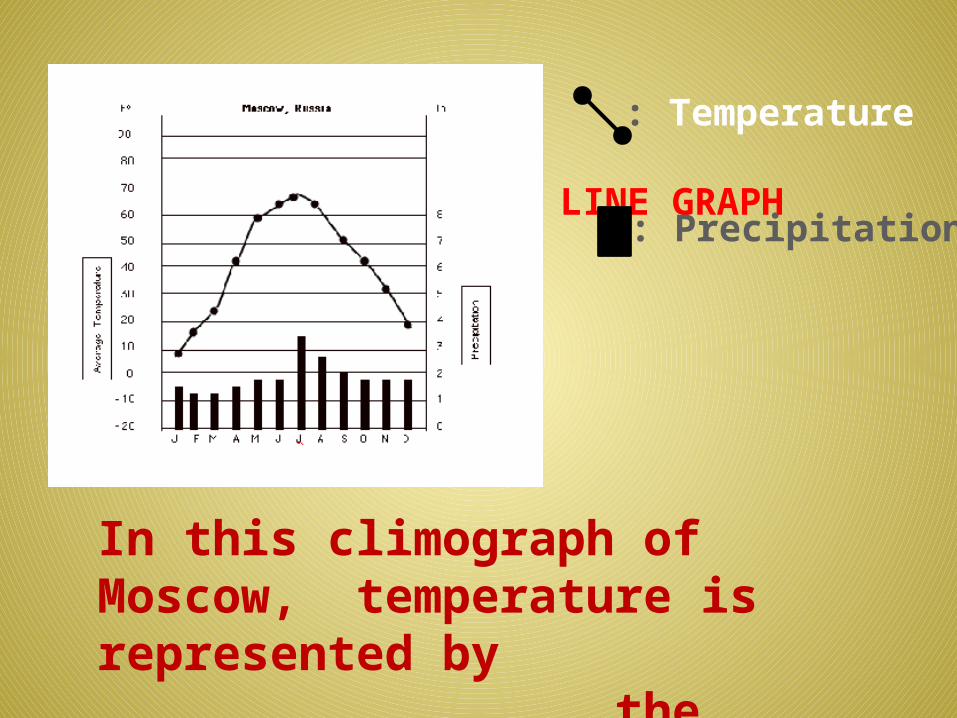
: Temperature LINE GRAPH
In this climograph of Moscow, temperature is represented by the Line Graph
: Precipitation
: Temperature
In this climograph of Moscow, what represents precipitation?
A. Bar Graph B. Line Graph
: Precipitation
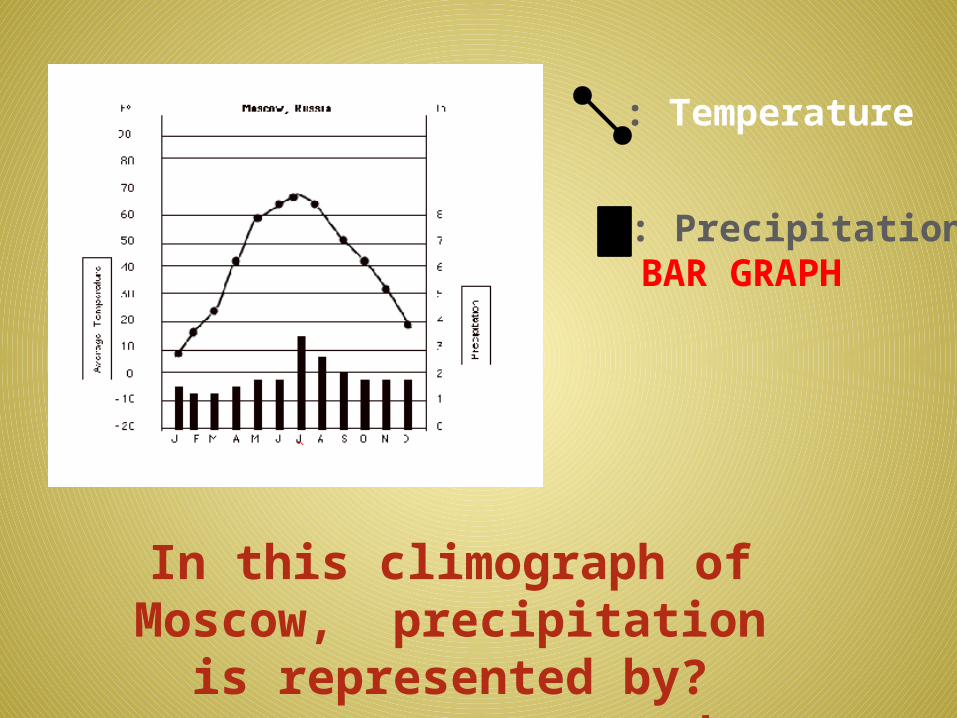
: Temperature
In this climograph of Moscow, precipitation is represented by?
the Bar Graph
: PrecipitationBAR GRAPH
Precipitation and temperate can be measured on either the bar or line graph.Look at the key to determine which one represents precipitation or temperature.Check out the next examples.
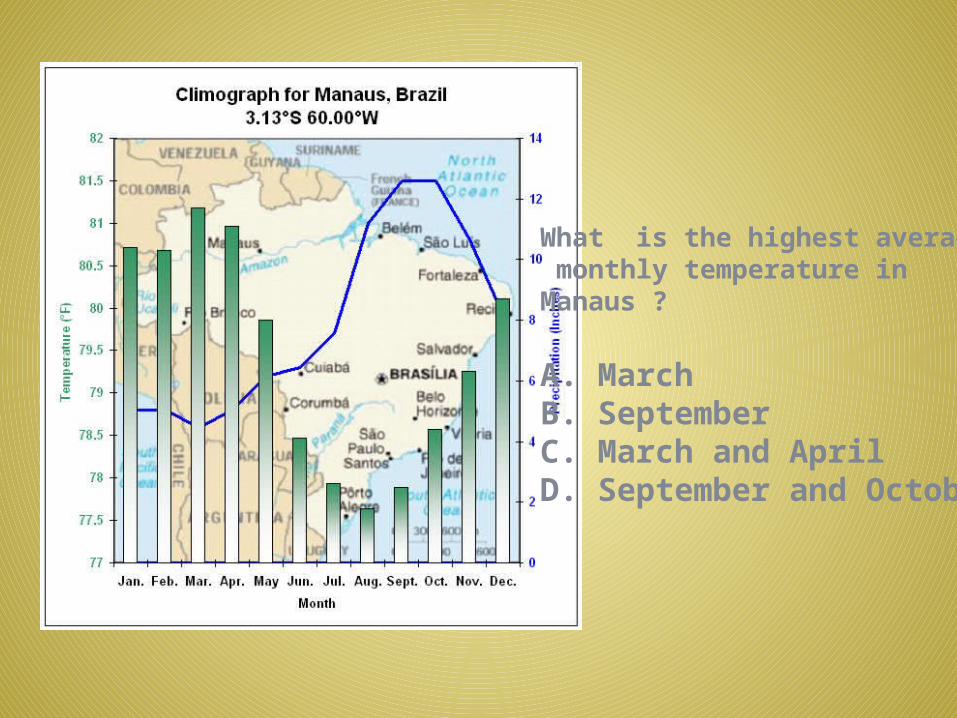
What is the highest average monthly temperature in Manaus ?
A. MarchB. SeptemberC. March and AprilD. September and October

What is the highest average monthly temperature in Manaus ?
March almost 81.5° Temperature is measured on the Bar Graph.Notice the green text of Temperature and the greenBar graph. This is the Key!
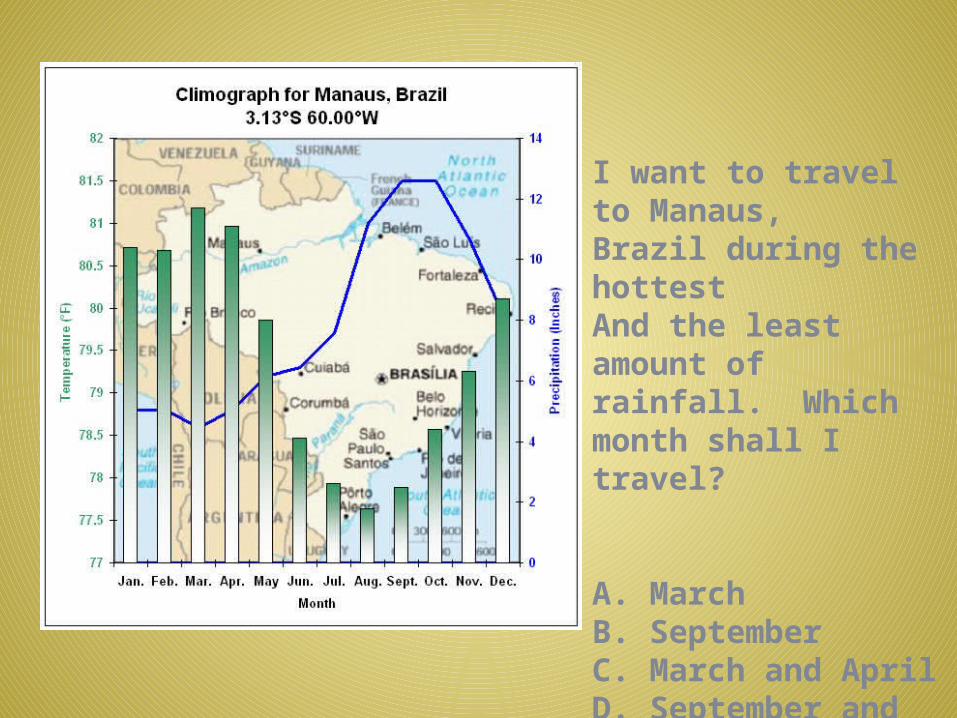
I want to travel to Manaus,Brazil during the hottest And the least amount of rainfall. Which month shall I travel?
A. MarchB. SeptemberC. March and AprilD. September and October
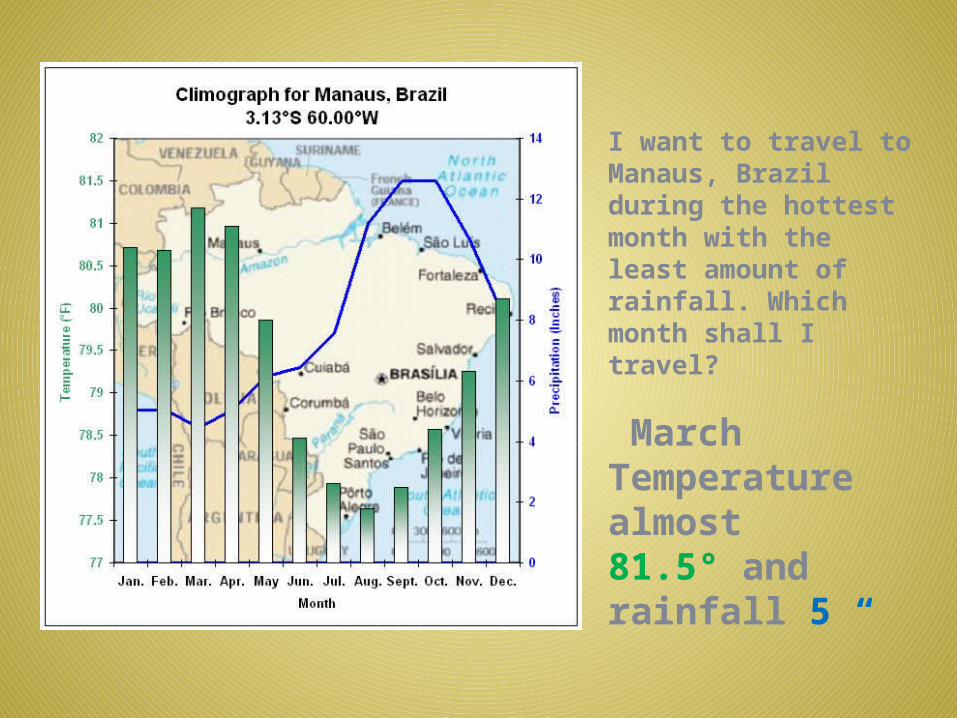
I want to travel to Manaus, Brazil during the hottest month with the least amount of rainfall. Which month shall I travel?
MarchTemperature almost81.5° and rainfall 5 “
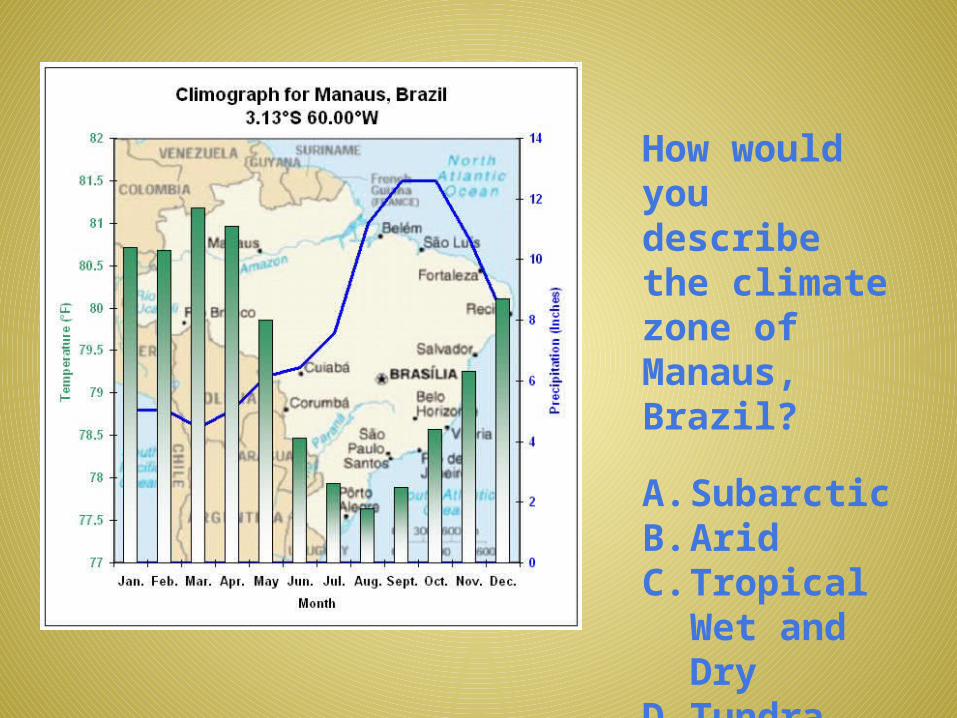
How would you describe the climate zone of Manaus, Brazil?
A. SubarcticB. AridC. Tropical Wet
and DryD. Tundra
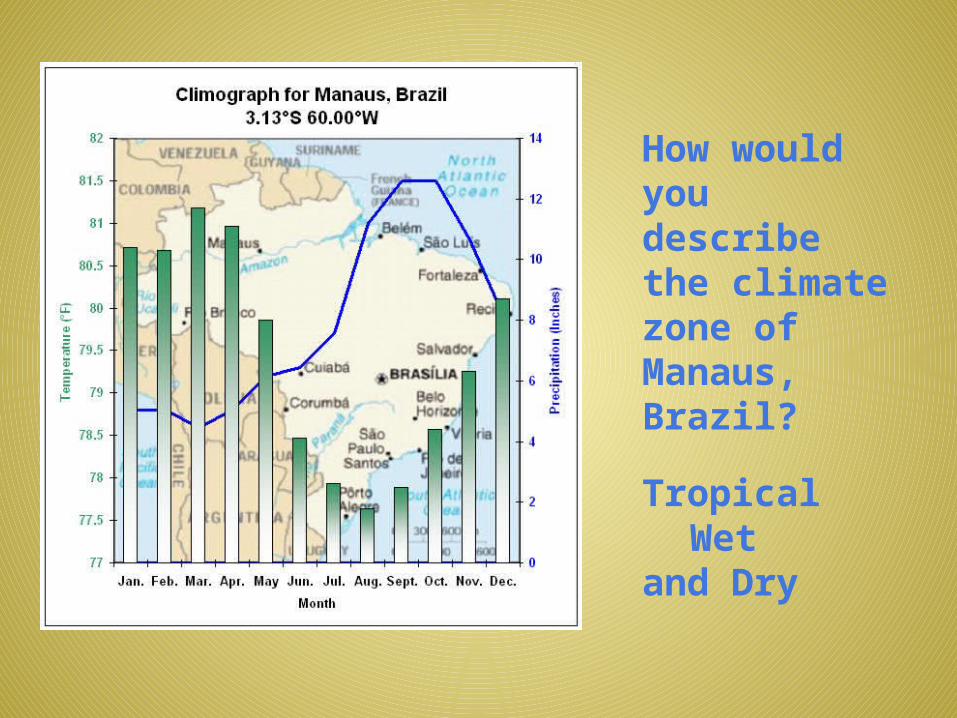
How would you describe the climate zone of Manaus, Brazil?
Tropical Wet and Dry
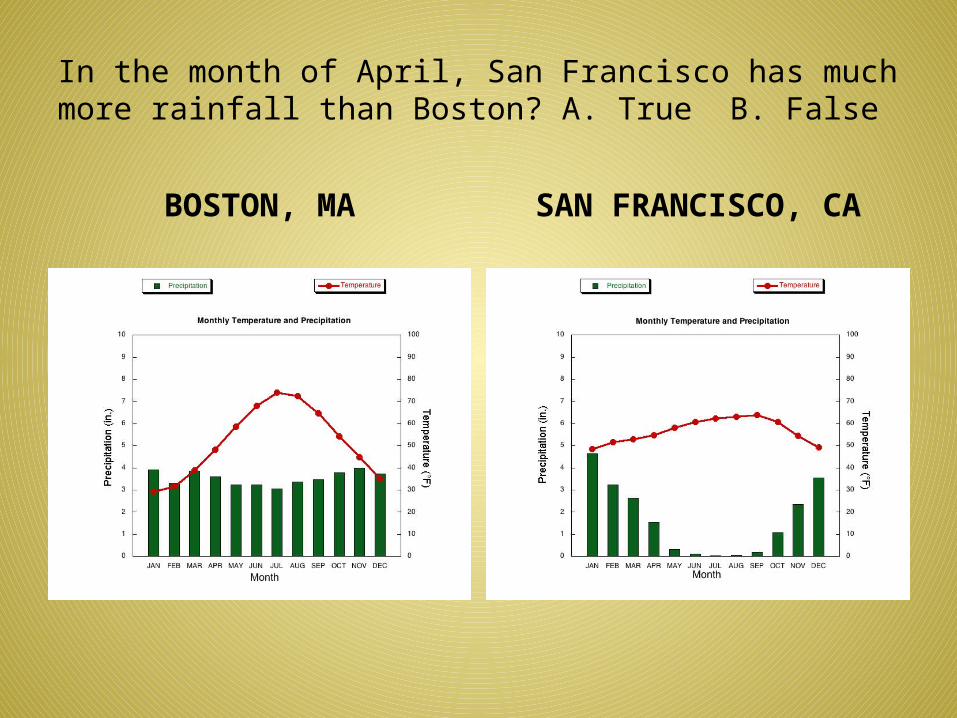
In the month of April, San Francisco has much more rainfall than Boston? A. True B. False
BOSTON, MA SAN FRANCISCO, CA
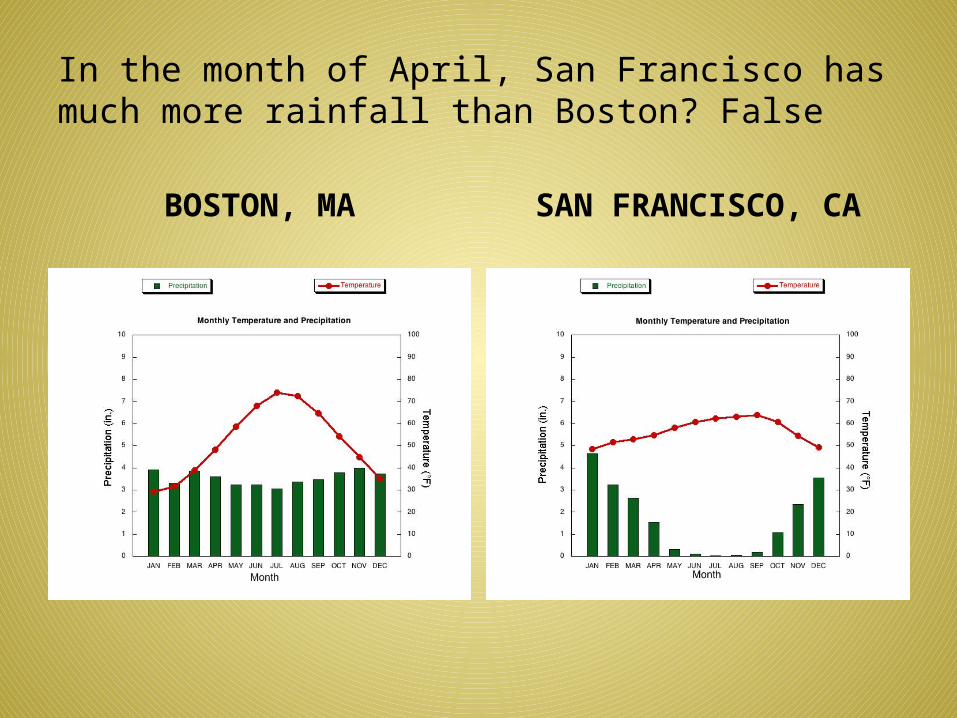
In the month of April, San Francisco has much more rainfall than Boston? False
BOSTON, MA SAN FRANCISCO, CA
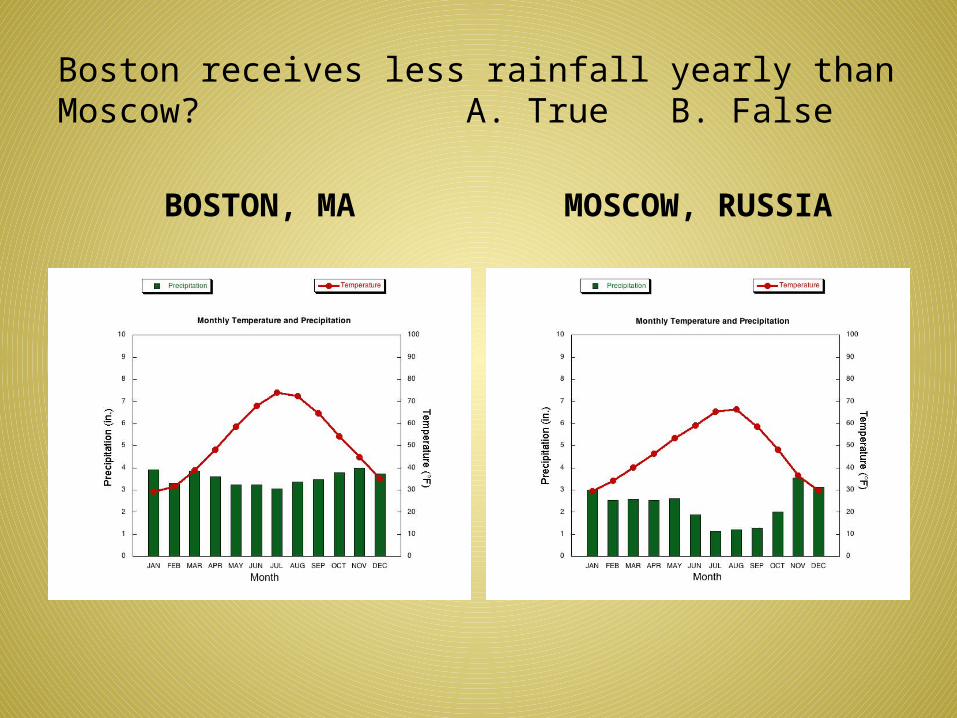
Boston receives less rainfall yearly than Moscow? A. True B. False
BOSTON, MA MOSCOW, RUSSIA
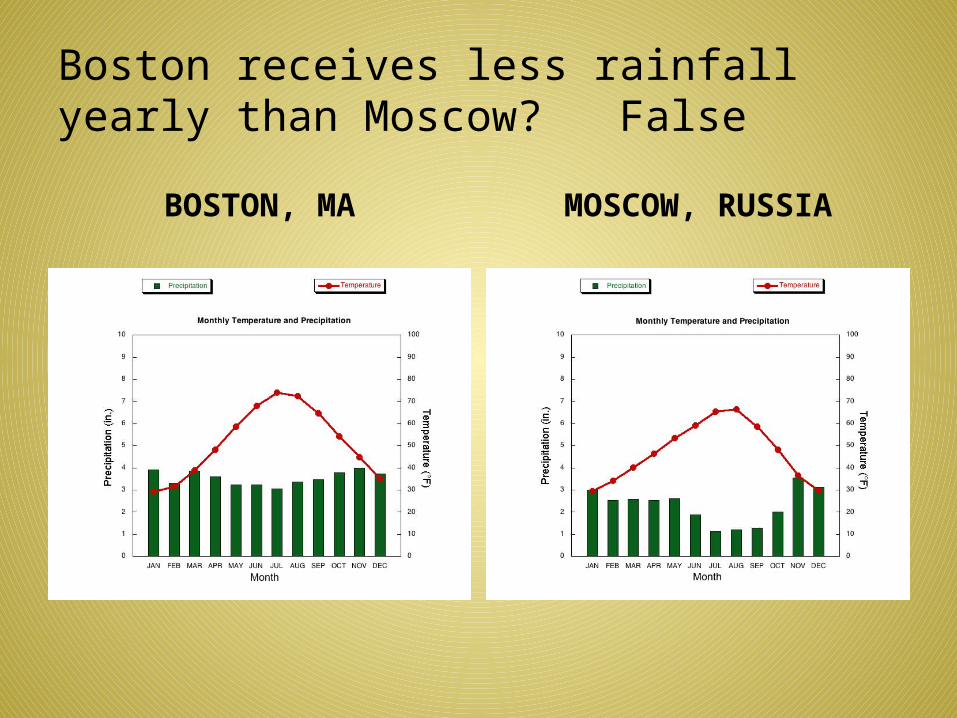
Boston receives less rainfall yearly than Moscow? False
BOSTON, MA MOSCOW, RUSSIA
Climate affects vegetation is best explained by which statement.
A. Cactus grow in the desert.B. Elevated areas, such as mountains, grow many plants.C. What grows in an area, depends on temperature and precipitation.D. Plants and trees need direct sunlight.
Climate affects vegetation is best explained by which statement.
What grows in an area, depends on temperature and precipitation.