Embed Size (px)
Citation preview

HAT m:N Cognitive Task Analysis (CTA)Scott ScheffHF Designworks, Inc.
March 26, 2021

Cognitive Task Analysis Study Overview
• Goal - understand the capability of the NASA-Jobym:N Tactical Operator (TO) interfaces to support TOs supervising up to 100 independent small unmanned aerial systems (sUAS)
• Introduction - Use incident-based cognitive task analysis methods with aviation SMEs who have served in analogous roles:
– Examine cognitive support provided by m:NTO interface in simulations that included n=12 and n=100 scenarios
– Elicit tacit aspects of expertise and complex mission settings related to command of multiple aircraft with relevance to the TO role and might require support from the m:N TO Interface
• Analysis– Identify interface elements that were and
were not supportive
– Articulate cognitive requirements associated with command of multiple aircraft and mission contexts that increase complexity for the human operator 2

CTA Interview
Adapted from Applied Cognitive Task Analysis (Militello & Hutton, 1998)
• Interviews occurred over two 1-hour sessions
• All interviews were conducted remotely using GoToMeeting with the interviewer, interviewee – Some interviews also included a note-taker and/or second interviewer
• Sessions were video-recorded and transcribed using an AI transcriber
Session 1Demographics
Simulation 1: n=12 sUAS
Session 2Simulation 2: n=100sUAS
Task DiagramKnowledge Audit
3

CTA Interview
• Each simulation included three events: nominal start, caution/warning event, and complex caution/warning event
• Events were followed by a series of questions to understand the interviewees assessment of the situation, potential actions, alternatives, communication needs
4

CTA Interview
• Each scenario included follow-on questions based on hypotheses about how the user would be supported by the interface
• Hypotheses– Interviewees would be able to supervise 100 assets– Interviewees would understand alerts and know what steps to take– Interviewees would choose to drop the payload– Interviewees would want to customize displays– Interviewees would want to handoff off-nominal assets– Interviewees would accept system recommendations– Interviewees would use the Recently Viewed Assets table
– True– False– False– False– True– Mixed– False
5

CTA Interview
Task Diagram• Interviewee asked to reflect on role
where they had control of other aircraft and react to unexpected events
• Decompose task into three to six subtasks
• Identify subtasks that required most expertise
Knowledge Audit• Reflecting on that same role, asked to
provide an example for each of three cognitive probes about an aspect of expertise– Noticing– Big Picture– Job Smarts
• Follow on questions regarding what made this task hard, and cues and strategies
6
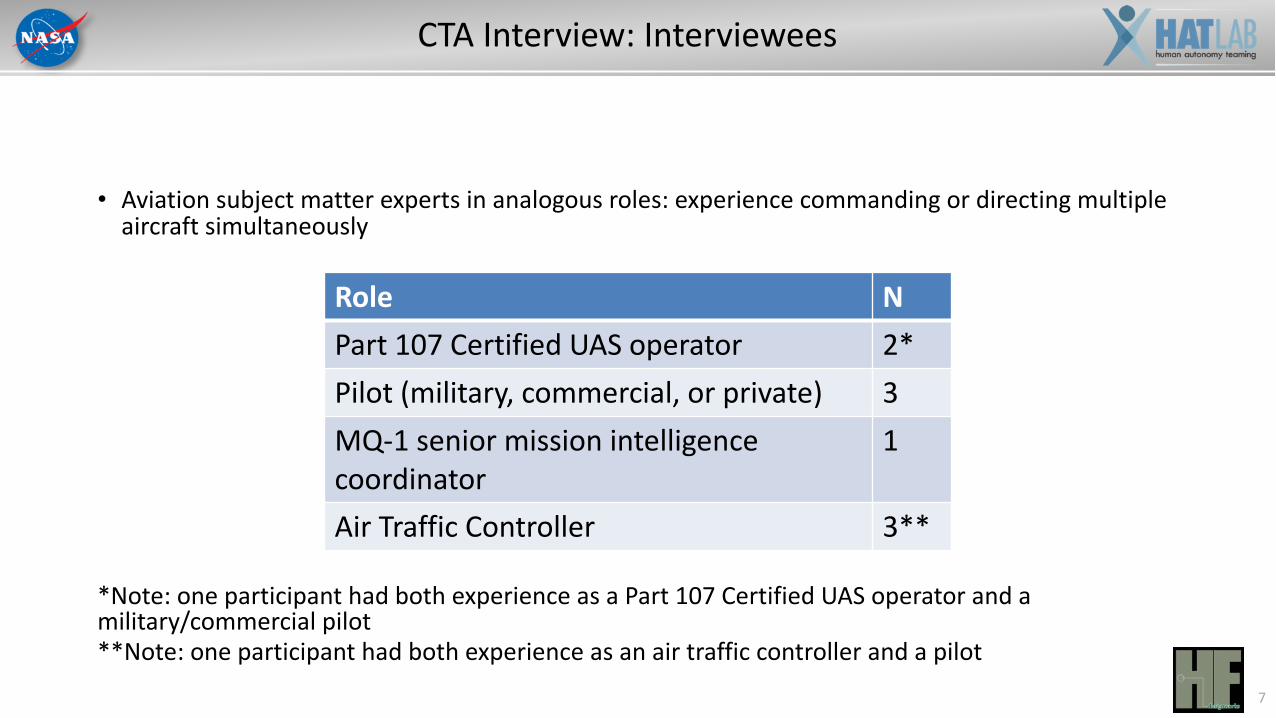
CTA Interview: Interviewees
• Aviation subject matter experts in analogous roles: experience commanding or directing multiple aircraft simultaneously
*Note: one participant had both experience as a Part 107 Certified UAS operator and a military/commercial pilot**Note: one participant had both experience as an air traffic controller and a pilot
Role NPart 107 Certified UAS operator 2*Pilot (military, commercial, or private) 3MQ-1 senior mission intelligence coordinator
1
Air Traffic Controller 3**
7

CTA Analysis: User Interface
• Data set: 16 video recordings, transcripts, 8 task diagrams, 8 knowledge audit tables
• Qualitative data analysis tool: Dedoose Version 8.0.35 – Transcripts uploaded to Dedoose for qualitative data
analysis
– Fixed coding scheme to identify content about specific interface elements
– Flexible coding scheme to identify other content relative to CTA objectives
– Example codes: Alerts, Asset Telemetry, Locate Uber Driver, Management by exception, Desired Feature, Map filters/layers
8

CTA Analysis: Cognitive Requirements
• Cognitive requirements table (see excerpt below) draws primarily from– Task diagram and knowledge audit tables– Interviewee statements on past role during simulation interview
Name What makes this hard? Cues Strategies Vignette
Predicting mission flow over time (on time, late)
Mission flow is affected by independent mission attributes such as the amount of cargo, or potential bottlenecks in the system from outside forces that are unaware of their impact.
Visually inspecting the size of the luggage cart, the amount of ground traffic, the orientation of aircraft and how aircraft are lined up to land or takeoff. Understanding weather impacts.
Early on, get stopwatch estimates of task times to understand normal variation and abnormal. Understanding the steps in the workflow. Knowing typical events or flow specific to area of responsibility. Widening the field of view on displays to see what coming into sector to affect your operations
There is a certain pattern and pace to getting an aircraft loaded on time. …seeing how close they were going to put an arrival and departure together, especially at the start. I think that expertise to pull those arrivals and departures apart by a good extra five minutes to give ourselves some time to kind of get through the process the first time.
9

CTA Analysis: Complexities Analysis
• Mission or context-specific examples that increase task complexity
• Drawn from complexities described by interviewees during the simulation or specific lived experiences
• Examples:– Aircraft controlled landing in uncontrolled area– Payload too heavy for airframe– Battery status inaccurate– Automation failure undetected and unrepresented to the TO– Congested intersection point
10

Findings: UI Overview
Dedoose Code Cloud• Depicts frequency of codes representing
features, tasks and concerns• Guided organization of findings
11

Findings: UI Interface Elements
Desired Features• Screen within a screen• Micro/macro view• Safe landing locations with real time
video of the area• Excess payload weight• Amount of delay • Representation of vehicle connectivity• Phase of flight on mission timeline• Resize chat and asset telemetry as
needed
• Auto resolve actions• Select sUAS on map and see additional
information including telemetry• At a glance representation of recently
off-nominal sUAS • TSD new chat notification• Battery information• Sparklines for planned and actual
altitude
12

Key Findings: UI - TSD
• Screen within a screen (so users can see the full map but when desired zoom in on a specific grid or map tile to get a better view of a particular sUAS).
• Micro/Macro view (helpful when trying to see all assets, including those that might be out of the current view).
Screen Design Mockup to Illustrate a Micro/Macro View Concept
13

Key Findings: UI - TSD
• The central display, also known as the TSD, was considered by all but one interviewee to be the cornerstone of the interface. Users stated they spent between 60-80% of their time looking at this display followed by the Telemetry screen, Chat screen, and then the Timeline screen. – Percentage of time working with the TSD did reduce as more assets (and more assets in off-
nominal states) were added to the map and management by exemption came into play– Participants still looked at the TSD the majority of the time however
14

Key Findings: UI – TSD and Color Coding
• There was some concern over the colors used in the coding scheme as well as the use of dark colors over a dark map • While interviewees could easily ascertain that red signaled a warning and yellow a
caution, they were less sure of the dark blue vs. lighter blue for sUAS icons and routes. White routes over grey streets was also a complaint
“The thing that immediately jumps out to me is, it's a little hard for my eyes to deal with the blue, with the black. I would want to make the targets more salient. So whatever the options were, my goal would be making sure that the background didn't mask the targets and the information display.” – Interviewee 8, ATC
15

Key Findings: UI – Weather Layer
• Interviewees wanted access to weather information, either as part of a brief, and/or as part of a map filter. Weather especially came up with the payload scenario when interviewees were trying to troubleshoot why an asset could not reach its designated altitude. – Consider incorporating weather patterns, wind speed and heading, and barometric pressure as a
map layer.
“I’m thinking that wind measurements should be on the screen so that I can know what’s going on with wind and weather.” - Interviewee 6, ATC
“Weather observations should be given to me in my brief.” - Interviewee 6, ATC“If I saw an anomaly I might flip on the weather and see if there was a non-loss event that just happened with the weather.” - Interviewee 1, Mission Coordinator
“I’d usually use just general forecasts from like Accuweather, and then we had a local weather station as well that was showing wind speed and barometric pressure.” - Interviewee 3, Pilot
16

Key Findings: UI - Alerts
• Interviewees were challenged with understanding some of the terminology used in the alerts, understanding what steps the auto resolver was going to make, how to get more information on an alert, and how to take next steps to dealing with the alert.
“I need additional information to interpret, to start augmenting my decisionmaking.” - Interviewee 8, ATC
“It says auto resolving and asset and timeline, which is super unsatisfactory for me because I don't know what auto resolving means. I'm not getting any additional information about this. There's too many aircraft for me to have an idea of what everyone's flight plan is. When something like this pops up, I would like the information so I know, OK, payload, issue. Maybe, you don't have more information on the issue but I would certainly want as much as there was. Hopefully it's more than auto resolving and a timeline. That's nice, but maybe some checklist tailored to the issue, especially if this is a thing that comes up often, so at least I have some reference to it.” - Interviewee 8, ATC
• The prioritization of options in the alert was not always liked. For the payload issue for example, the first option of abandoning (releasing) the payload was either the last resort or would not be considered by most interviewees and as such interviewees felt that option should be listed at the bottom of the message, or not at all.
17

Key Findings: UI – Altitude Status
• Interviewees found the altitude sparkline very important but also felt it wasn’t enough. The dot representing where the asset was, was just a single snapshot in time. Interviewees wanted to see trends.
“If there was a planned elevation, then maybe I would understand that here’s the path, and here’s where they are, and if they’re deviating higher or lower.” - Interviewee 1, Mission Commander
18

Findings: Cognitive Requirements
• Facilitating mission flow– Recognize and foresee potential bottlenecks, conflicts, and barriers to mission flow• Importance of weather• Known set of abnormal events
– Initiate corrective actions early
• Predicting automation in context– Robust mental model of sUAS operations even when interface is not transparent– Calibrating trust in automation
• Maintaining big picture perspective– Use knowledge of aircraft type and capabilities, weather, mission, location, adjacent aircraft– Understand second and third order effects– Operators force themselves to maintain scan even during emergency/off-nominal
19

Findings: Complexities
Non-exhaustive categorized examples of complexities, useful for hypothesis testing and scenario design:
• sUAS air vehicle and payload – controlled and uncontrolled landings (injury, property damage), battery state, in-flight automation failure
• Environmental conditions - fixed and mobile vertical obstructions, weather
• Food delivery service - arising from the nature of food delivery
• sUAS/Driver infrastructure - arising from n sUAS operations, necessary interface between sUAS and driver, or sUAS and ground personnel
• TO personnel - TO behaviors or support to the TO
20

Next Steps
• Iterate future designs and user feedback, including more in-depth navigation and asset handoff exploration
• Google Forms for a deeper dive on Handoffs
• UsabilityHub.com survey to capture user interactions and feedback
21