Embed Size (px)
Citation preview
Atypical phonemic discrimination but not audiovisual speech integration in children with autism and the broader autism phenotype.
Julia Irwin1,2, Trey Avery1, Jacqueline Turcios1,2, Lawrence Brancazio1,2, Barbara Cook2 and Nicole Landi1,3
1Haskins Laboratories, USA 2Southern Connecticut State University, USA
3University of Connecticut, USA [email protected]; [email protected]
Abstract When a speaker talks, the consequences of this can be heard (audio) and seen (visual). We use a novel visual phonemic restoration task to assess behavioral discrimination and neural signatures (ERP) of audiovisual processing in typically developing children with a range of social and communicative skill and in children with autism. In an auditory oddball design we presented two types of stimuli to the listener, a clear exemplar of an auditory consonant-vowel syllable /ba/ and a syllable in which the auditory cues for the consonant was substantially weakened, creating a stimulus which is more like /a/. All speech tokens were paired with a face producing /ba/ or a face with a pixelated mouth, effectively masking visual speech articulation. In this paradigm, the visual /ba/ should cause the auditory /a/ to be perceived as /ba/, creating an attenuated oddball response (phonemic restoration), but the pixelated video should not have this effect. Across two studies we observed behavioral and ERP effects that are consistent with phonemic restoration overall; however, autism-like traits and autism were associated with overall reductions in phonemic discrimination regardless of face context, suggesting that autism may be associated with impairments in speech processing but not AV speech integration. Index Terms: audiovisual speech perception; development; broader autism phenotype; autism; ERP.
1. Introduction When a speaker talks, the consequences of this can both be heard and seen. Visual information about speech has been shown to influence what listeners hear, both in noisy environments (known as visual gain) [1] and when the auditory portion of the speech signal can be clearly heard (mismatched audiovisual speech demonstrates a visual influence in clear listening conditions, known as the McGurk effect) [2].
Deficits in audiovisual processing have been reported in children with autism spectrum disorders (ASD). For example, Foxe et al (2013) [3] examined perception of visible speech in the presence of auditory noise in a cross-sectional sample of children and adolescents with ASD. School-aged ASD children (5–12 year olds) showed less visual gain (i.e., an increased ability to identify what is being said when visible articulatory information is available in the context of noisy speech) than did controls. Irwin, Tornatore, Brancazio &
Whalen (2011) [4] tested children with ASD on a set of audiovisual speech perception tasks, including an AV speech-in-noise (visual gain) and a McGurk-type task. Given the possibility that previous reports of deficits in AV speech perception were simply due to less looking at the face of the speaker (a hallmark of autism), simultaneous eye fixation patterns were recorded and trials where the participant did not fixate on the speaker's face excluded. Even when fixated on the speaker’s face, children with ASD were less influenced by visible articulatory information than TD controls, in speechreading (visual-only), speech-in-noise and with audiovisual mismatched (McGurk) stimuli. Using a task that isolates the mouth of the speaker, Iarocci, Rombough, Yager, Weeks & Chua (2010) [5] also report that children and adolescents with ASD are poorer at identifying what is said from visual only stimuli (speechreading) and less likely to report a visually influenced response in a McGurk-type task. In addition to these behavioral findings, a recent study utilizing ERP found that adults with an ASD do not show a late effect of congruency (e.g. speaking face and voice matching, or mismatching) in frontal and central-parietal areas exhibited by typical controls, indicating that adults with ASD are less sensitive to mismatching AV speech stimuli [6]. Taken together, these studies suggest that individuals with ASD may have difficulty using visual speech information during perception of a speaking face. Because natural listening environments are often noisy (e.g. classrooms, cafeterias, playgrounds), the ability to make use of visual articulatory information on the speaker’s face to repair the intended message is critical. Any loss in this ability to repair can lead to cascading negative effects in social communication, already primary deficits for individuals with an ASD. In addition to the auditory perception deficits observed in young and school aged children with ASD described above, infant siblings of those with an ASD (who are at greater risk of ASD themselves) [7,8] also appear to be less visually influenced by mismatched AV speech stimuli [9]. Further, a recent ERP study found that infant siblings of individuals diagnosed with ASD show a prolonged latency in later P400 components in responding to direct gaze during face processing [10]. These findings suggest that family members of individuals with ASD, who share a higher proportion of their genome than unrelated individuals, may also process faces [11], and, potentially, speaking faces differently than TD perceivers [12]. These findings suggest atypical face and audiovisual processing in siblings of individuals with ASD

and are consistent with the fact that ASD has a significant genetic component and is heritable [13, for a review, see 14]. Indeed, first degree relatives of individuals with an ASD (both parents and siblings) have been reported to present sub-threshold behaviors associated with an autism diagnosis, commonly referred to as the "Broader Autism Phenotype" (BAP) [13, 14, 15, 16]. Thus, children with ASD and those who exhibit the broader autism phenotype may both be less visually influenced by a speaking face. Existing work on the BAP, consistent with a polygenic model of ASD in which commonly occurring genetic variation contributes to the autism phenotype, suggests that there is a distribution of autism-like traits in the general population [17] (these “autism-like traits” are measured in the current study using the Social Responsiveness Scale Second Edition; SRS-2) [18]. However, there have been no studies that we are aware of that have investigated AV speech processing in typically developing children that vary on measures of these traits. Given that visual influence on heard speech is known to vary among individuals [19], better understanding of this variability and whether autism-like traits contribute to this variability is of interest. While existing studies are suggestive of atypical response to AV speech in ASD and siblings of children with ASD, the paradigms used to date for studying AV speech may not be ideal for use in this population because they make additional processing demands beyond the audio and visual speech. Specifically, studies that use speech in noise and/or mismatched (or McGurk type) AV tasks have potential limitations for young children and those with ASD or ASD-like traits [20]. The McGurk Effect creates a percept that differs from either the visual or auditory signal alone because of conflict between the two modalities. These percepts are identified as poorer exemplars of a category than matched A + V stimuli [21]. This approach may be particularly problematic for those with ASD or ASD-like traits because weaknesses in executive function can lead to difficulties in identification of ambiguous stimuli [22]. Additionally, studying AV speech perception using paradigms that utilize auditory noise is problematic because noise is generally disruptive for individuals with ASD in the perception of speech [23]. In order to examine visual influence on heard speech in children who exhibit autism or “autism-like traits” (or the broader autism phenotype), we have developed a measure that involves neither noise nor auditory and visual category conflict that can serve as an alternative to assessing audiovisual speech processing (also see [24] for a related approach). This new paradigm, which we describe in detail in Irwin et al. [25], uses restoration of weakened auditory tokens with visual stimuli. Two types of stimuli are presented to the listener: clear exemplars of an auditory consonant-vowel syllable (in this case, /ba/), and syllables in which the auditory cues for the consonant are substantially weakened, creating a stimulus which is more /a/ like, from this point on referred to as /a/. The auditory stimuli are created by synthesizing speech based on a natural production of the syllable and systematically flattening the formant transitions to create the /a/. Video of the speaker’s face does not change (always producing /ba/), but the auditory stimuli (/ba/ or /a/) vary. Thus, when the /a/ stimulus is dubbed over the visual /ba/, a visual influence will result in effectively "restoring" the weakened auditory cues so that the stimulus is perceived as a /ba/, akin to a visual phonemic restoration effect [26, 27, 28].
Here we examine behavioral discrimination and neural signatures (using event related potentials [ERP]) of audiovisual processing using this novel visual phonemic restoration method in children with typical development with a range of social and communicative skills, and in children with autism. Given the dearth of ERP studies on AV speech perception in typically developing children and those with ASD, we look at the relation between AV speech processing and performance on the social responsiveness scale in children with typical development, which measures “autism-like traits” (SRS-2) [18] (Study 1) and in a sample of children with a diagnosis of autism (Study 2). As in Irwin et al (accepted) [25], we utilize an oddball paradigm to elicit ERP responses to infrequently occurring /a/s embedded within the more frequently occurring /ba/s. All speech tokens are paired with a face producing /ba/ or a face with a pixelated mouth containing motion but no visual articulation. If the visual /ba/ causes the auditory /a/ to be perceived as /ba/ (phonemic restoration), then the oddball response to this stimulus should be attenuated. In contrast, a pixelated video (without articulatory information) should not have this effect. With respect to our predictions, if phonemic restoration occurs, we would expect poorer behavioral performance (detection of the oddball), measured here with d’, for /a/ paired with a visual /ba/ (AV condition) than with a pixelated video (PX condition). In our ERP data, overall, we expect a P300 effect, with larger amplitudes to the infrequent /a/ within the 300-700 ms time window. If phonemic restoration from the visual /ba/ occurs, we should observe a reduction in the amplitude increase for /a/ in the AV condition relative to PX (consistent with behavioral predictions). Critically, if ASD or ASD-like traits are associated with deficits in integration, we would expect that typically developing children with higher scores on the SRS-2 (indicating an increased number of “autism-like traits”) and children with autism will be less likely to use visual speech to effectively restore the /a/ to a full /ba/. This would result in greater sensitivity to the /a/ in the AV speech condition in comparison to typically developing children with low SRS-2 scores. Likewise, in our ERP data, children with high SRS-2 scores and with a diagnosis of autism should show similar P300 effects for both the AV and PX conditions, and typically developing with low SRS-2 scores should show reduced P300 effects for the AV condition.
2. Materials and Methods All participants were monolingual speakers of American English, passed vision screenings with a Snellen eye chart (natural or corrected vision to at least 20/20), and hearing screenings using a portable audiometer (responded to 500hz, 1000hz, 2000hz, 4000hz tones in each ear). The typically developing children were reported by parents to have no history of speech, learning or social problems.
Study 1:
Participants: Participants were 34 typically developing children (17 females and 17 males, age range 6.0 to 12.25, mean age = 9.22 years, SD = 1.77 years), recruited from the greater New Haven community with a range of scores on the SRS-2 from 38 to 65, with a mean score of 45.58 (SD 5.69). A higher overall score will mean greater severity and greater

number of behaviors characteristic of an ASD [18]. Audiovisual Stimuli and Experimental Paradigm The audiovisual stimuli and experimental paradigm are the same as Irwin et al. (under review) [29]. The stimuli were created by videotaping and recording an adult male speaker of English producing the syllable /ba/. Using Praat [30], we extracted acoustic parameters for the token, including formant trajectories, amplitude contour, voicing and pitch contour. Critically, the token had rising formant transitions for F1, F2, and to a lesser extent F3, characteristic of /ba/. To create our /ba/ stimulus, we synthesized a new token of /ba/ based on these values. To create our /a/ stimulus we then modified the synthesis parameters: we changed the onset values for F1 and F2 to reduce the extent of the transitions and lengthened the transition durations for F1, F2, and F3, and then synthesized a new stimulus. To produce the AV stimuli, the /ba/ and /a/ synthesized auditory stimuli were dubbed onto video of the speaker producing /ba/, with the acoustic onsets synchronized with the visible articulation. A second condition was created in which the mouth portion of the video was pixelated so that the articulatory movement surrounding the mouth could not be perceived but general head movement was preserved (although variation in the pixelation indicated movement). As in the AV condition, the synthesized /ba/ and /a/ stimuli were dubbed onto the pixelated video (see Figure 1 below).
Figure 1: Audiovisual (AV) and pixelated (PX) face stimuli.
Within the full EEG session, the experiment was blocked into two face context conditions (AV and pixelated face, see Figure 1 above). Each face context block was 18 minutes and contained 200 trials lasting 2 seconds each. After each 50 trials the participant was given a break and instructed to press the response button when they were ready to resume the experiment. First was the (AV) block (where the speaking face was fully visible) and second was the pixelated (or PX) block (where the area around the mouth was pixelated to obscure features of the mouth). This presentation order was intentional to ensure that the phonemic restoration effect was tested without exposure to the contrast of the /ba/ and /a/ auditory tokens, which should be clearly contrastive without the visible articulation from the mouth. An 80/20 oddball design was used for presentation of the speech stimuli, with /a/ serving as the infrequently occurring (or deviant stimulus) in both face contexts. Participants were played the deviant sound (/a/) before each block to remind them what they were listening for, and instructed to press the response button only after the presentation of that deviant stimulus and to otherwise remain as still as possible. Total experiment time was approximately 30 minutes depending on length of breaks and amount of EEG net rehydration between blocks. EEG Data Collection EEG data was collected with an Electrical Geodesics Inc. (EGI) netamps 300 high impedance amplifier, using 128 Ag/AgCl electrodes embedded in soft sponges woven into
a geodesic array. The EEG sensor nets were soaked for up to ten minutes prior to use in a warm potassium chloride solution (2 teaspoons of potassium chloride, 1 liter of water purified by reverse osmosis, and 3 ccs of Johnson & Johnson baby shampoo to remove oils from the scalp). The high-density hydrocel geodesic sensor nets and associated high impedance amplifiers have been designed to accept impedance values ranging as high as 100kΩ, which permits the sensor nets to be applied in under ten minutes and without scalp abrasion, recording paste, or gel [e.g., 31, 32]. Impedance for all electrodes was kept below 40kΩ throughout the experimental run (impedances were re-checked between blocks). Online recordings at each electrode used the vertex electrode as the reference and were later referenced to the average reference. EEG was continuously recorded using Netstation 5.2 on a MacPro running OS X 10.11 while participants completed experimental tasks. Stimuli were presented using E-Prime (PST) version 2.0.8.90 on a Dell Optiplex 755 (Intel Core 2 Duo at 2.53 GHz and 3.37 GB RAM) running Windows XP. Audio stimuli were presented from an audio speaker centered 85 cm above the participant connected to a Creative SB X-Fi audio card. Visual stimuli were presented at a visual angle of 23.62 degrees (video was 9.44 inches / 24 cm wide and 7.87 inches / 20 cm tall) on Dell 17inch flat panel monitors 60 cm from the participant connected to a Nvidia GeForce GT 630 video card. Speech sounds were presented free field at 65 decibels, measured by a sound pressure meter. ERP Data Processing Initial processing was conducted using Netstation 4.5.7. EEG data were band pass filtered at .3 to 30hz (Passband Gain: 99.0 % [-0.1 dB], Stopband Gain: 1.0 % [-40.0 dB], Rolloff: 2.00 Hz) and segmented by condition, 100 milliseconds pre-stimulus to 800 milliseconds post-stimulus. In order to balance the number of standards and deviants in the ERP analysis, only the standard before each deviant was included for analysis resulting in 40 possible trials for each standard and deviant speech sound in each face context. Eye blinks and vertical eye movements were examined with electrodes located below and above the eyes (channels 8, 126, 25, 127). Horizontal eye movements were measured using channels 125 and 128, located at positions to the left and right of the eyes. Artifacts were automatically detected and manually verified for exclusion from additional analysis (bad channel > 200 microvolts, eye blinks > 140 microvolts and eye movement > 55 microvolts). For every channel, 50% or greater bad segments was used as the criteria for marking the channel bad; for every segment, greater than 20 bad channels was used as a criterion for marking a segment bad. Participants with less than 25% of a possible 40 usable trials in any condition were excluded from analysis. Bad channels (fluctuations over 200 µV) were spherical spline interpolated from nearby electrodes. Data were baseline corrected using a 100 ms window prior to onset of all stimuli. Data were re-referenced from vertex recording to an average reference of all 128 channels. For ERP analysis, only standard /ba/ sounds before the deviant (/a/) were included. All processed, artifact-free segments were averaged by condition producing a single event related potential waveform
for each condition for all participants and exported for plotting and statistical analysis in R. Visual inspection of our data for the PX and AV conditions revealed a large positive P300 component that began around 380 milliseconds and returned to baseline between 600 and 700 milliseconds in a central cluster of electrodes For analysis we defined the P300 to be the most positive peak between 400 and 600 milliseconds following stimulus onset, both within a cluster of eleven central electrodes. In study 1, given the morphology of the waveforms (steeper initial rising slope in the PX condition), this was divided into early and late P300 windows, and analyzed for the full window and the early and late windows independently. Study 2: Participants Participants were 20 children: 10 typically developing children (5 females and 5 males, age range 6.3 to 11.83, mean age = 8.99 years, SD = 1.72 years) and 10 children with autism (4 females and 6 males, age range 7.17 to 13, mean age = 9.79 years, SD 1.91 years). The children with autism met criteria for inclusion in the following manner: 1) a diagnosis of autism by a licensed clinician familiar with autism, 2) a score derived from the algorithm of autism on the Autism Diagnostic Observation Schedule - second edition (ADOS-2)[33] and 3) a score indicative of autism on the Autism Diagnostic Interview-Revised (ADI-R [34]),) a standardized interview for parents of children with an autism spectrum disorder. Participant scores on the SRS-2 were a mean of 40.30 (SD 1.64) for the TD group and 70.75 (SD 10.7) for the ASD group. Audiovisual Stimuli and Experimental Paradigm Identical to Study 1. EEG Data Collection Identical to Study 1. ERP Data Processing Identical to Study 1, with the exception that we analyzed the full P300 window only.
3. Results Study 11 Behavioral Response Responses are reported as a d’ sensitivity score. A pairwise comparison of sensitivity scores between the AV and PX conditions revealed a significant difference t (27) = -5.748, p < .001, d = 1.106, such that participants showed greater sensitivity to the deviant oddball target stimuli in the PX relative to the AV condition. P300 Effects To examine the ERP effects of speech stimulus (standard /ba/ vs. deviant /a/) as a function of face context (mouth visible [AV] vs. mouth pixelated [PX]), we ran 3 separate a 2 x 2 repeated measures ANOVAs with speech stimulus (standard /ba/ vs. deviant /a/) and face context (AV vs. PX) as within 1 Study 1 findings are a subset of findings from a larger study that is currently under review (Irwin et al. under review [29]). Study 2 findings are new to this paper.
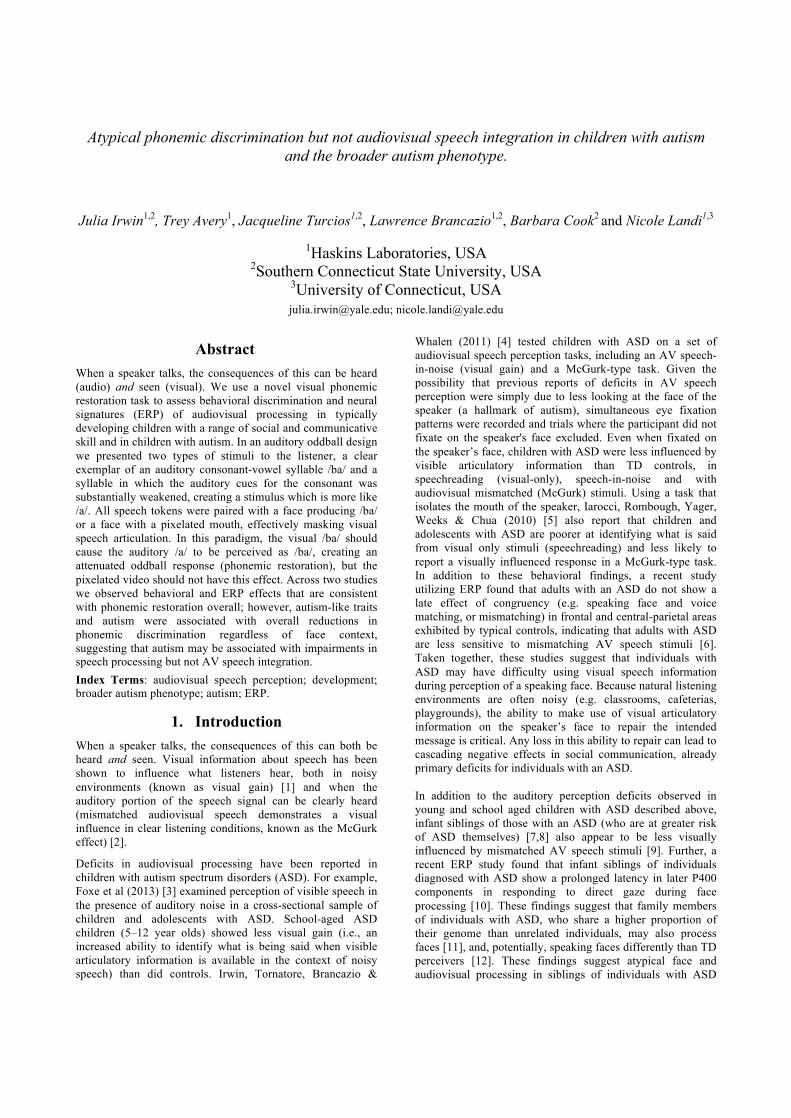
subjects variables. Full P300 time window (400-600 milliseconds): we observed a main effect of speech stimulus, F (1,33) = 27.27, p <.01, η2 = 0. 50, with a more positive ERP response to deviant /a/s relative to standard /ba/s. The main effect of face context was not significant F(1,33) = 0.57, p = 0.45, η2 = 0.02 and there was no interaction between face context and speech stimulus F(1,33) = 1.32, p = 0.25, η2 = 0.04. Early P300 time window (400-500 ms): we observed a significant main effect of speech stimulus F(1,33) = 34.96, p < 0.01, η2 = 0.51 with a more positive ERP response to deviant /a/s relative to standard /ba/s. The main effect of face context was not significant F(1,33) = 1.64, p = 0.21, η2 = 0.05. We also observed a marginally significant speech stimulus by face context interaction F(1,33) = 3.08, p = 0.08, η2 = 0.08. This trend suggests some attenuation of the early P300 in the presence of the visual /ba/, indicating phonemic restoration. Late P300 time window (500-600 ms): we observed a significant main effect of speech stimulus F(1,33) = 27.27, p < 0.001, η2 = 0.45, with larger amplitudes for deviant /a/s relative to standard /ba/s. The main effect of face context was not significant, F(1,33) = 0.60, p = 0.44, η2 = 0.01 and there was no interaction between face context and speech stimulus F(1,33) = 0.001, p = 0.97, η2 = 0.00. These data are presented in Figure 2.
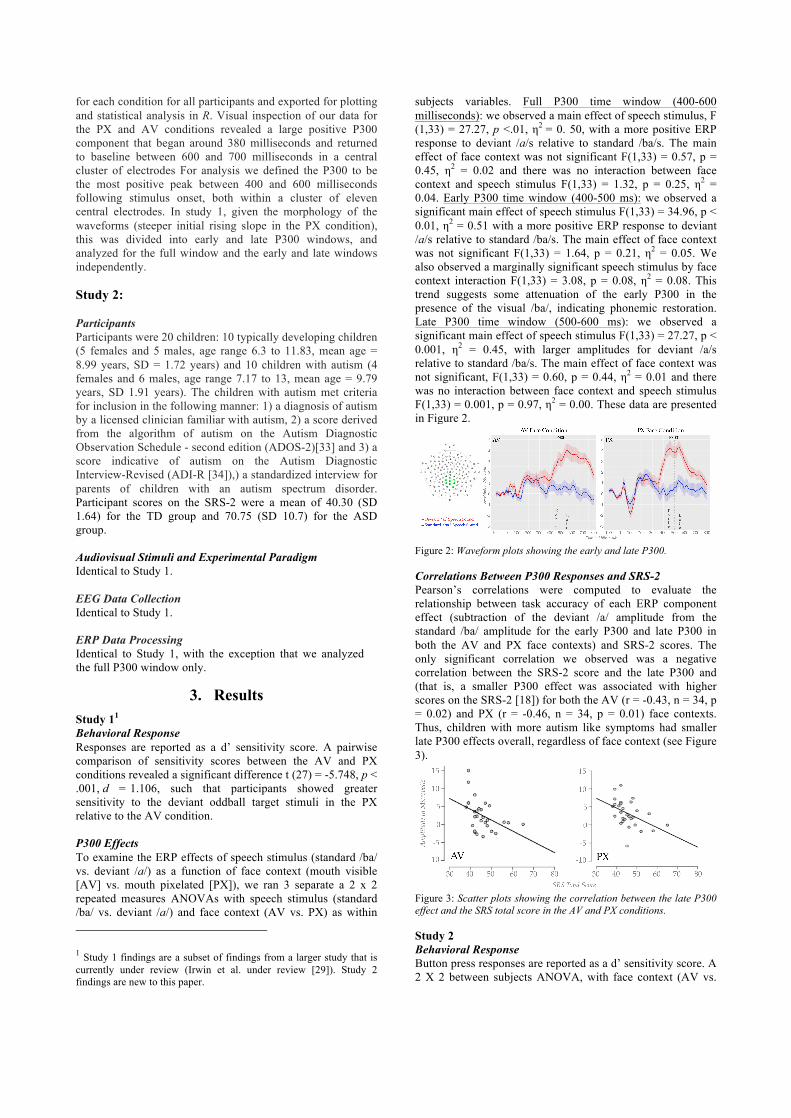
Figure 2: Waveform plots showing the early and late P300. Correlations Between P300 Responses and SRS-2 Pearson’s correlations were computed to evaluate the relationship between task accuracy of each ERP component effect (subtraction of the deviant /a/ amplitude from the standard /ba/ amplitude for the early P300 and late P300 in both the AV and PX face contexts) and SRS-2 scores. The only significant correlation we observed was a negative correlation between the SRS-2 score and the late P300 and (that is, a smaller P300 effect was associated with higher scores on the SRS-2 [18]) for both the AV (r = -0.43, n = 34, p = 0.02) and PX (r = -0.46, n = 34, p = 0.01) face contexts. Thus, children with more autism like symptoms had smaller late P300 effects overall, regardless of face context (see Figure 3).
Figure 3: Scatter plots showing the correlation between the late P300 effect and the SRS total score in the AV and PX conditions. Study 2 Behavioral Response Button press responses are reported as a d’ sensitivity score. A 2 X 2 between subjects ANOVA, with face context (AV vs.

PX) and group (ASD vs. TD) as factors revealed no main effect of face context F(1,9) = 1.991, p = 0.192, η2 = 0.157, no main effect of group F(1,9) = 2.270, p = 0.988, η2 = 0.000 and no interaction between group and face context F(1,9) =1.669, p = 0.229, η2 = 0.132. P300 Effects We first ran a 2 X 2 X 2 mixed model repeated measures ANOVA with speech stimulus (/ba/ vs. /a/) and face context (AV vs. PX) as within subjects factors and group as a between subjects factor. We observed a main effect of speech stimulus, F (1,18) = 41.53, p <.001, η2 = 0.66, with a more positive ERP response to deviant /a/s relative to standard /ba/s (P300 effect). The main effect of face context (AV, PX) was not significant F(1,18) = 1.74, p = 0.99, η2 = 0.00 and there were no significant interactions between conditions or with group (all p’s > .05). Given our observed association between the size of the P300 and SRS scores in Study 1, planned t tests were conducted to compare the size of the P300 effect (/a/ - /ba/) between the groups for each face context. Numerically, the size of the P300 effect was larger for the TD group for both face contexts: AV mean difference = 5.09 (SD =5.64); PX mean difference = 5.92 (SD= 3.09), relative to the ASD participants AV mean difference = 2.45 (SD =2.60); PX mean difference = 4.04 (SD= 3.52), but the statistical contrasts failed to reach significance; AV t(18) = -1.34, p = .19, d= -.6; PX t(18) = -1.26, p = .22, d= -.5. These data are shown in Figures 4 and 5.
Figure 4: Waveform plots showing the P300 for TD and ASD children.
Figure 5: Mean amplitude of the P300 response for TD and ASD children for the AV and PX face context conditions.
4. Discussion In Study 1 our behavioral measure of discrimination sensitivity (d’) indicated that children found the deviant /a/ more difficult to discriminate in the context of a visual articulation of /ba/, suggesting a visual phonemic restoration
effect for the /a/ token in the AV condition. We did not observe this effect in Study 2, although we also observed large subject response variability for both the TD and ASD children in this sample. With respect to our ERP data, findings from Study 1 suggest a trend for phonemic restoration, observed as a marginally reduced P300 effect for the late P300 in the AV relative to the PX condition. With respect to associations with autism like traits, we observed reduced sensitivity to the speech contrast (smaller late P300 effects) for children with more ASD-like traits across face contexts. This finding suggests reduced sensitivity to the speech stimuli in general, rather than reduced integration of visual and auditory speech.
In Study 2, although our current sample of children with ASD and TD children is small, we observed a numerical (non- significant) pattern that is consistent with our findings from Study 1, namely reduced P300 effects for children with ASD regardless of face context. Although our findings from children with autism are preliminary, together, findings from Study 1 and 2 suggest an association between reduced phonetic discrimination and autism, but no evidence for any relationship between ASD-like traits or ASD and reduced AV speech integration.
5. Conclusions Children with autism and autism-like traits appeared to be less sensitive in phonemic discrimination overall, regardless of whether the speaker’s mouth was visible or obscured. Thus, preliminary results from this work indicate that autism may be associated with impairments in speech processing, but not in AV speech integration.
6. Acknowledgments
Supported by NIH DC013864; DC011342, J. Irwin, PI.
7. References 1. Sumby, W. H.; Pollack, I. Visual contribution to speech
intelligibility in noise. J. Acoust. Soc. Am., Volume 26(2), 212-215, 1954.,
2. McGurk, Harry, and John MacDonald. Hearing lips and seeing voices. Nature, 746-748, 1976.
3. Foxe, J. J., Molholm, S., Del Bene, V.A., Frey, H. P., Ruso, N. N., Blanco, D., … & Ross, L.A. Severe multisensory speech integration deficits in high-functioning school-aged children with autism spectrum disorder (ASD) and their resolution during early adolescence. Cereb Cortex, 2013.
4. Irwin, J. R., Tornatore, L. A., Brancazio, L., & Whalen, D. H. . Can children with autism spectrum disorders “hear” a speaking face?. Child Dev, 82(5), 1397-1403, 2011.
5. Iarocci, G., Rombough, A., Yager, J., Weeks, D. J., & Chua, R. Visual influences on speech perception in children with autism. Autism, 14(4), 305-320, 2010.
6. Magnée, M. J., de Gelder, B., van Engeland, H., & Kemner, C. Atypical processing of fearful face–voice pairs in Pervasive Developmental Disorder: An ERP study. Clin Neurophys, 119(9), 2008.
7. Tager-Flusberg, H. . The origins of social impairments in autism spectrum disorder: studies of infants at risk. Neural Networks, 23(8), 1072-1076, 2010.
8. Rogers, S. J. What are infant siblings teaching us about autism in infancy? Autism Res, 2(3), 125-137, 2009.
9. Guiraud, J. A., Tomalski, P., Kushnerenko, E., Ribeiro, H., Davies, K., Charman, T., . & BASIS Team. Atypical audiovisual speech integration in infants at risk for autism. PloS One, 7(5), e36428, 2012.

10. Elsabbagh, M., Volein, A., Holmboe, K., Tucker, L., Csibra, G., Baron‐Cohen, S., . & Johnson, M. H. Visual orienting in the early broader autism phenotype: disengagement and facilitation. J Child Psychol Psychiatry, 50(5), 637-642, 2009.
11. Colvert, E., Tick, B., McEwen F., Stewart, C., Curran, S.R., Woodhouse, E., Gillan, N., Hallett, V., Lietz, S., Garnett T., Ronald, A., Plomin, R., Rijsdijk, F., Happé, F., Bolton, P. Heritability of Autism Spectrum Disorder in a UK Population Based Twin Sample. JAMA Psychiatry, 72(5):415-423. doi:10.1001/jamapsychiatry.2014.3028, 2015.
12. Chahrour, M., O’Roak, B.J., Santini, E., Samaco, R.C., Kleiman, R.J. & Manzini, M.C. Current perspectives in autism spectrum disorder: From genes to therapy. J Neurosci, 36(45), 11402-11410; DOI:https://doi.org/10.1523/JNEUROSCI.2335-16.2016
13. Billeci L, Calderoni S, Conti E, Gesi C, Carmassi C, Dell'Osso L, Cioni G, Muratori F, Guzzetta A. The Broad Autism (Endo)Phenotype: Neurostructural and Neurofunctional Correlates in Parents of Individuals with Autism Spectrum Disorders. Front Neurosci, 10:346.doi:10.3389/fnins.2016.00346, 2016.
14. Losh, M., Adolphs, R., & Piven, J. The broad autism phenotype. Autism spectrum disorders, 457-476, 2011.
15. Piven, J., Palmer, P., Jacobi, D., Childress, D., & Arndt, S. Broader autism phenotype: evidence from a family history study of multiple incidence autism families. Am J Psychiatry, 154(2), 185 190, 1997.
16. Parr, J., & Le Couteur, A. S. Broader Autism Phenotype. In Encyclopedia of Autism Spectrum Disorders (pp. 478-478). Springer, New York, 2013.
17. Bolton, P. F., Golding, J., Emond, A., & Steer, C. D. Autism spectrum disorder and autistic traits in the Avon Longitudinal Study of Parents and Children: precursors and early signs. J Am Acad Child Adolesc Psychiatry, 51(3), 249-260, 2012.
18. Constantino, J. N., Gruber, C.P. Social Responsiveness Scale (2nd ed.) (SRS-2) [Manual]. Torrance, CA: Western Psychological Services, 2012.
19. Nath, A. R., & Beauchamp, M. S. A neural basis for interindividual differences in the McGurk effect, a multisensory speech illusion. Neuroimage, 59(1), 781-787, 2012.
20. Irwin, J. & DiBlasi, L. Audiovisual speech perception: A new approach and implications for clinical populations. Lang Linguist Compass. DOI: 10.1111/lnc3.12237, 2017.
21. Brancazio, L. Lexical influences in audiovisual speech perception. J Exp Psychol Hum Percept Perform, 30(3), 445, 2004.
22. Eigsti, I. M., & Shapiro, T. A systems neuroscience approach to autism: biological, cognitive, and clinical perspectives. Ment Retard Dev Disabil Res Rev, 9(3), 206-216, 2003.
23. Alcántara, J. I., Weisblatt, E. J., Moore, B. C., & Bolton, P. F. Speech‐in‐noise perception in high‐functioning individuals with autism or Asperger's syndrome. J Child Psychol Psychiatry, 45(6), 1107-1114, 2004.
24. Jerger, S., Damian, M. F., Tye-Murray, N., & Abdi, H. Children use visual speech to compensate for non-intact auditory speech. J. Exp Child Psychol, 126, 295-312, 2014.
25. Irwin, J., Avery, T., Brancazio, L., Ryherd, K., Turcios, J. & Landi, N. Electrophysiological indices of Audiovisual Speech Perception: Beyond the McGurk Effect and Speech in Noise. Multisensory Research (accepted).
26. Warren, R. M. Perceptual restoration of missing speech sounds. Science, 167(3917), 392-393, 1970.
27. Samuel, A. G. Phonemic restoration: insights from a new methodology. J Exp Psychol General, 110(4), 474, 1981.
28. Kashino, M. (2006). Phonemic restoration: The brain creates missing speech sounds. Acoust Sci Technol, 27(6), 318-321, 2006.
29. Irwin, J., Avery, T. Turcios, J., Brancazio, L., Cook, B. & Landi, N. Electrophysiological indices of audiovisual speech perception and social responsiveness in children with the broader autism phenotype. Brain Sciences, Under Review.
30. Boersma, P. & Weeninck, D. Praat: Doing phonetics by computer [Computer program.] Retrieved from http://www.praat.org/, 2016.
31. Ferree, T. C., Luu, P., Russell, G. S., & Tucker, D. M. Scalp electrode impedance, infection risk, and EEG data quality. Clin Neurophys, 112(3), 536-544, 2001.
32. Pizzagalli, D. A. Electroencephalography and high-density electrophysiological source localization. Hand Psychophys, 3, 56-84, 2007.
33. Lord, C., Rutter, M., DiLavore, P., Risi, S., Gotham, K., & Bishop, S. Autism diagnostic observation schedule–2nd edition (ADOS-2). Los Angeles, CA: Western Psychological Corporation, 2012.
34. Lord C, Rutter, M and LeCouteur A. Autism Diagnostic Interview-Revised: A revised version of a diagnostic interview for caregivers of individuals with possible pervasive developmental disorders. J Autism Developmental Disor, 24, 659-685, 1994.