Embed Size (px)
Citation preview
PAG
E 7
3
Sirsa
Hisar
Jind
Bhiwani
Karnal
Nuh
Kaithal
Jhajjar
Sonipat
Fatehabad
Rohtak
Rewari
Palwal
Ambala
Panipat
Kurukshetra
Gurugram
Yamunanagar
Charkhi Dadri
Faridabad
Mahendragarh
Panchkula
Salient Features· Decrease in wastelands area by 107.51 sq. km. is observed.
· Reduc�on in degraded land under planta�on crop by 1.08 sq. km. and land with open scrub by 0.86 sq. km. is recorded; there was an increase in area under land with dense scrub by 1.86 sq. km. and industrial wastelands by 0.03 sq. km.
· Wastelands area of 1.40 sq. km. was brought under planta�on, which has been contributed by land with open scrub and degraded land under planta�on crop.
· Rewari district witnessed net decrease in wastelands area by 0.25 sq. km.; maximum decrease was observed under degraded land under planta�on crop by 2.11 sq. km.; land with open scrub by 0.28 sq. km.
· Ambala district observed a decrease in wastelands area by 0.23 sq. km. mainly contributed by land with open scrub.
· Gurugram district witnessed increase in wastelands area by 0.54 sq. km. contributed by land with open scrub.
HARYANAWastelands Changes2008-09 - 2015-16
-8.00
-7.99 - -3.00
-2.99 - -1.00
-0.99 - -0.50
-0.49 - -0.10
-0.09 - -0.05
-0.04 - 0.00
0.01 - 0.05
0.06 - 0.10
0.11 - 0.50
0.51 - 1.00
1.01 - 3.00
3.01 - 8.000 40 80 120 16020
Km.
% Change to Total Geographical Areaof a District
PUNJAB
UTTAR PRADESH
RAJASTHANDELHI
PAGE 74
Sirsa
HisarJind
Bhiwani
Karnal
Nuh
Kaithal
Jhajjar
Sonipat
Fatehabad
Rohtak
Rewari
Palwal
Ambala
Panipat
Kurukshetra
Gurugram
Charkhi Dadri
Faridabad
Mahendragarh
Yamunanagar
Panchkula2015-16
HARYANA
0 30 60 90 12015Kms
Par
tner
Inst
.
Exe
cute
d B
y
Dept. of Land ResourcesMin. of Rural DevelopmentG - Wing, Nirman BhawanGOI, New Delhi - 110 011
Spo
nsor
ed b
yLand Use & Cover Monitoring Divn.LRUMG,Remote Sensing ApplicationNational Remote Sensing CentreISRO, Dept. of Space, GOIBalanagar, Hyderabad - 500037
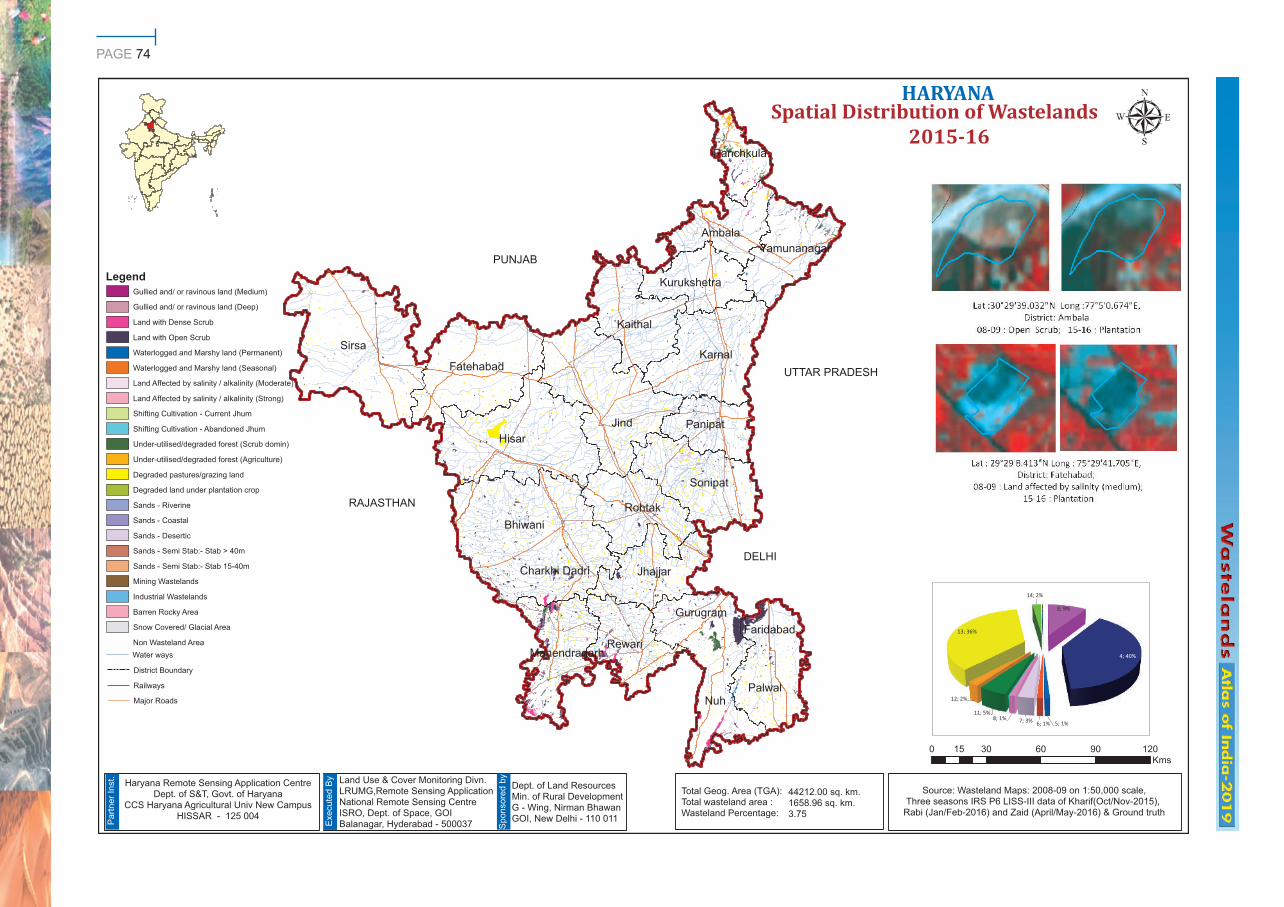
Source: Wasteland Maps: 2008-09 on 1:50,000 scale,Three seasons IRS P6 LISS-III data of Kharif(Oct/Nov-2015), Rabi (Jan/Feb-2016) and Zaid (April/May-2016) & Ground truth
Haryana Remote Sensing Application CentreDept. of S&T, Govt. of Haryana
CCS Haryana Agricultural Univ New CampusHISSAR - 125 004
Legend
Non Wasteland AreaWater ways
District Boundary
Railways
Major Roads
Gullied and/ or ravinous land (Medium)
Gullied and/ or ravinous land (Deep)
Land with Dense Scrub
Land with Open Scrub
Waterlogged and Marshy land (Permanent)
Waterlogged and Marshy land (Seasonal)
Land Affected by salinity / alkalinity (Moderate)
Land Affected by salinity / alkalinity (Strong)
Shifting Cultivation - Current Jhum
Shifting Cultivation - Abandoned Jhum
Under-utilised/degraded forest (Scrub domin)
Under-utilised/degraded forest (Agriculture)
Degraded pastures/grazing land
Degraded land under plantation crop
Sands - Riverine
Sands - Coastal
Sands - Desertic
Sands - Semi Stab:- Stab > 40m
Sands - Semi Stab:- Stab 15-40m
Mining Wastelands
Industrial Wastelands
Barren Rocky Area
Snow Covered/ Glacial Area
Spatial Distribution of Wastelands
Total Geog. Area (TGA):Total wasteland area :Wasteland Percentage:
44212.00 sq. km.1658.96 sq. km.3.75
PUNJAB
UTTAR PRADESH
RAJASTHAN
DELHI
3; 9%
4; 40%
5; 1%6; 1%7; 3%8; 1%11; 5%
12; 2%
13; 36%
14; 2%

PAGE 75
107.51
HARYANAWastelands Area Change Matrix : 2008-09 and 2015-16
PAG
E 7
6
District WL_Class 1 2 3 4 5 6 7 8 9 10 11
Ambala
2008-09 -- -- 1.70 11.16 0.13 0.06 -- -- -- -- 0.06
2015-16 -- -- 8.41 11.79 0.13 0.06 -- -- -- -- 0.06
Change -- -- 6.70 0.63 0.00 0.00 -- -- -- -- 0.00
Bhiwani
2008-09 -- -- 3.80 46.06 0.16 2.22 0.48 0.13 -- -- --
2015-16 -- -- 3.80 46.06 0.16 2.22 0.48 0.13 -- -- --
Change -- -- 0.00 0.00 0.00 0.00 0.00 0.00 -- -- --
Charkhi Dadri
2008-09 -- -- 13.81 30.29 0.50 1.55 1.73 -- -- -- 0.28
2015-16 -- -- 13.81 30.29 0.50 1.55 1.73 -- -- -- 0.28
Change -- -- 0.00 0.00 0.00 0.00 0.00 -- -- -- 0.00
Faridabad
2008-09 -- -- 3.06 91.01 -- -- 0.72 -- -- -- --
2015-16 -- -- 3.06 90.69 -- -- 1.06 -- -- -- --
Change -- -- 0.00 -0.31 -- -- 0.34 -- -- -- --
Fatehabad
2008-09 -- -- 0.04 5.63 -- 0.64 0.39 -- -- -- --
2015-16 -- -- 0.04 5.79 -- 0.64 0.26 -- -- -- --
Change -- -- 0.00 0.16 -- 0.00 -0.13 -- -- -- --
Gurugram
2008-09 -- -- 2.33 96.04 0.30 0.18 0.91 0.41 -- -- 15.16
2015-16 -- -- 2.33 96.58 0.30 0.18 0.91 0.41 -- -- 15.16
Change -- -- 0.00 0.54 0.00 0.00 0.00 0.00 -- -- 0.00
Hisar
2008-09 -- -- 14.29 28.49 0.15 1.37 0.26 -- -- -- --
2015-16 -- -- 0.18 25.52 0.15 1.37 0.26 -- -- -- --
Change -- -- -14.11 -2.97 0.00 0.00 0.00 -- -- -- --
Jhajjar
2008-09 -- -- -- 26.60 2.18 3.32 6.71 1.67 -- -- --
2015-16 -- -- -- 26.60 2.18 3.32 6.71 1.67 -- -- --
Change -- -- -- 0.00 0.00 0.00 0.00 0.00 -- -- --
Jind
2008-09 -- -- 0.05 2.53 0.62 0.51 0.42 0.07 -- -- --
2015-16 -- -- 0.05 2.69 0.62 0.51 0.42 0.07 -- -- --
Change -- -- 0.00 0.15 0.00 0.00 0.00 0.00 -- -- --
Kaithal
2008-09 -- -- -- 18.47 0.25 0.10 0.99 -- -- -- --
2015-16 -- -- 0.18 8.29 0.25 0.10 0.99 -- -- -- --
Change -- -- -- -10.19 0.00 0.00 0.00 -- -- -- --
Karnal
2008-09 -- -- 0.04 19.05 0.05 -- 0.18 -- -- -- --
2015-16 -- -- 0.81 16.63 0.05 -- 0.18 -- -- -- --
Change -- -- 0.77 -2.42 0.00 -- 0.00 -- -- -- --
Kurukshetra
2008-09 -- -- -- 11.34 0.91 0.06 -- -- -- -- --
2015-16 -- -- 0.37 6.40 0.91 0.06 -- -- -- -- --
Change -- -- -- -4.94 0.00 0.00 -- -- -- -- --
Mahendra garh
2008-09 -- -- 49.69 112.63 -- -- -- -- -- -- 6.45
2015-16 -- -- 49.69 113.04 -- -- -- -- -- -- 6.45
Change -- -- 0.00 0.40 -- -- -- -- -- -- 0.00
Nuh
2008-09 -- -- 36.15 26.36 4.44 0.31 10.81 1.75 -- -- 14.71
2015-16 -- -- 36.15 26.36 4.44 0.31 10.81 1.75 -- -- 14.71
Change -- -- 0.00 0.00 0.00 0.00 0.00 0.00 -- -- 0.00
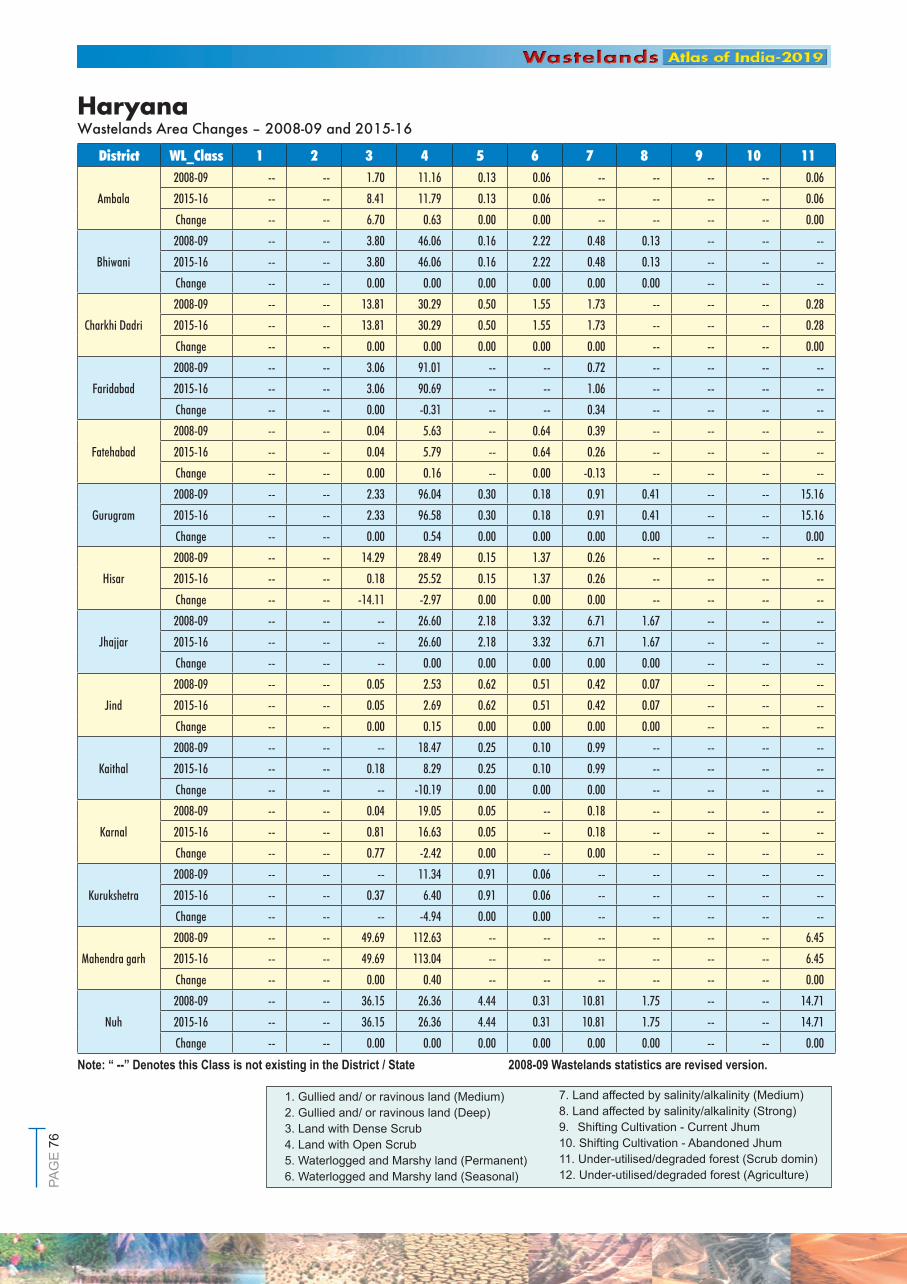
HaryanaWastelands Area Changes – 2008-09 and 2015-16
1. Gullied and/ or ravinous land (Medium)2. Gullied and/ or ravinous land (Deep)3. Land with Dense Scrub4. Land with Open Scrub5. Waterlogged and Marshy land (Permanent)6. Waterlogged and Marshy land (Seasonal)
7. Land affected by salinity/alkalinity (Medium)8. Land affected by salinity/alkalinity (Strong)9. Shifting Cultivation - Current Jhum10. Shifting Cultivation - Abandoned Jhum11. Under-utilised/degraded forest (Scrub domin)12. Under-utilised/degraded forest (Agriculture)
Note: “ --” Denotes this Class is not existing in the District / State 2008-09 Wastelands statistics are revised version.

PAG
E 7
7
12 13 14 15 16 17 18 19 20 21 22 23 Total TGA3.97 20.44 -- -- -- -- -- -- -- -- -- -- 37.53
15743.97 12.88 -- -- -- -- -- -- -- -- -- -- 37.30
0.00 -7.56 -- -- -- -- -- -- -- -- -- -- -0.23
-- 43.66 0.67 -- -- 0.07 -- -- -- -- -- -- 97.25
3403 -- 43.66 0.67 -- -- 0.07 -- -- -- -- -- -- 97.25
-- 0.00 0.00 -- -- 0.00 -- -- -- -- -- -- 0.00
-- 28.52 0.56 -- -- -- -- -- -- -- -- -- 77.26
1375 -- 28.52 0.56 -- -- -- -- -- -- -- -- -- 77.26
-- 0.00 0.00 -- -- -- -- -- -- -- -- -- 0.00
-- 3.20 0.45 0.12 -- -- -- -- 0.05 -- -- -- 98.60
745 -- 3.20 0.45 0.12 -- -- -- -- 0.02 -- -- -- 98.60
-- 0.00 0.00 0.00 -- -- -- -- -0.03 -- -- -- 0.00
-- 34.35 0.08 -- -- -- -- -- -- -- -- -- 41.11
2538 -- 27.33 0.08 -- -- -- -- -- -- -- -- -- 34.13
-- -7.02 0.00 -- -- -- -- -- -- -- -- -- -6.98
-- 3.67 1.54 -- -- -- -- -- 0.93 0.20 -- -- 121.68
1254 -- 3.67 1.54 -- -- -- -- -- 0.93 0.20 -- -- 122.22
-- 0.00 0.00 -- -- -- -- -- 0.00 0.00 -- -- 0.54
-- 107.12 1.02 -- -- 0.03 -- -- -- -- -- -- 152.71
3983 -- 101.20 1.02 -- -- 0.03 -- -- -- -- -- -- 129.72
-- -5.91 0.00 -- -- 0.00 -- -- -- -- -- -- -22.99
-- 42.71 2.06 -- -- -- -- -- -- -- -- -- 85.25
1834 -- 42.71 2.06 -- -- -- -- -- -- -- -- -- 85.25
-- 0.00 0.00 -- -- -- -- -- -- -- -- -- 0.00
-- 56.97 0.20 -- -- -- -- -- -- -- -- -- 61.37
2702 -- 54.87 0.20 -- -- -- -- -- -- -- -- -- 59.43
-- -2.10 0.00 -- -- -- -- -- -- -- -- -- -1.95
-- 18.46 -- -- -- -- -- -- -- -- -- -- 38.28
2317 -- 14.23 -- -- -- -- -- -- -- -- -- -- 24.03
-- -4.24 -- -- -- -- -- -- -- -- -- -- -14.42
-- 16.79 0.83 0.09 -- -- -- -- 0.03 -- -- -- 37.06
2520 -- 12.79 0.96 0.09 -- -- -- -- -- 0.03 -- -- 31.54
-- -4.00 0.13 0.00 -- -- -- -- -- -- -- -- -5.52
-- 11.51 -- -- -- -- -- -- -- -- -- -- 23.81
1530 -- 7.08 -- -- -- -- -- -- -- -- -- -- 14.82
-- -4.43 -- -- -- -- -- -- -- -- -- -- -9.36
-- 32.09 16.85 -- -- -- -- -- -- -- -- -- 217.71
1899 -- 31.56 16.85 -- -- -- -- -- -- -- -- -- 217.59
-- -0.53 0.00 -- -- -- -- -- -- -- -- -- -0.13
-- 19.52 0.04 -- -- -- -- -- -- -- -- -- 114.09
1507 -- 19.52 0.04 -- -- -- -- -- -- -- -- -- 114.09
-- 0.00 0.00 -- -- -- -- -- -- -- -- -- 0.00
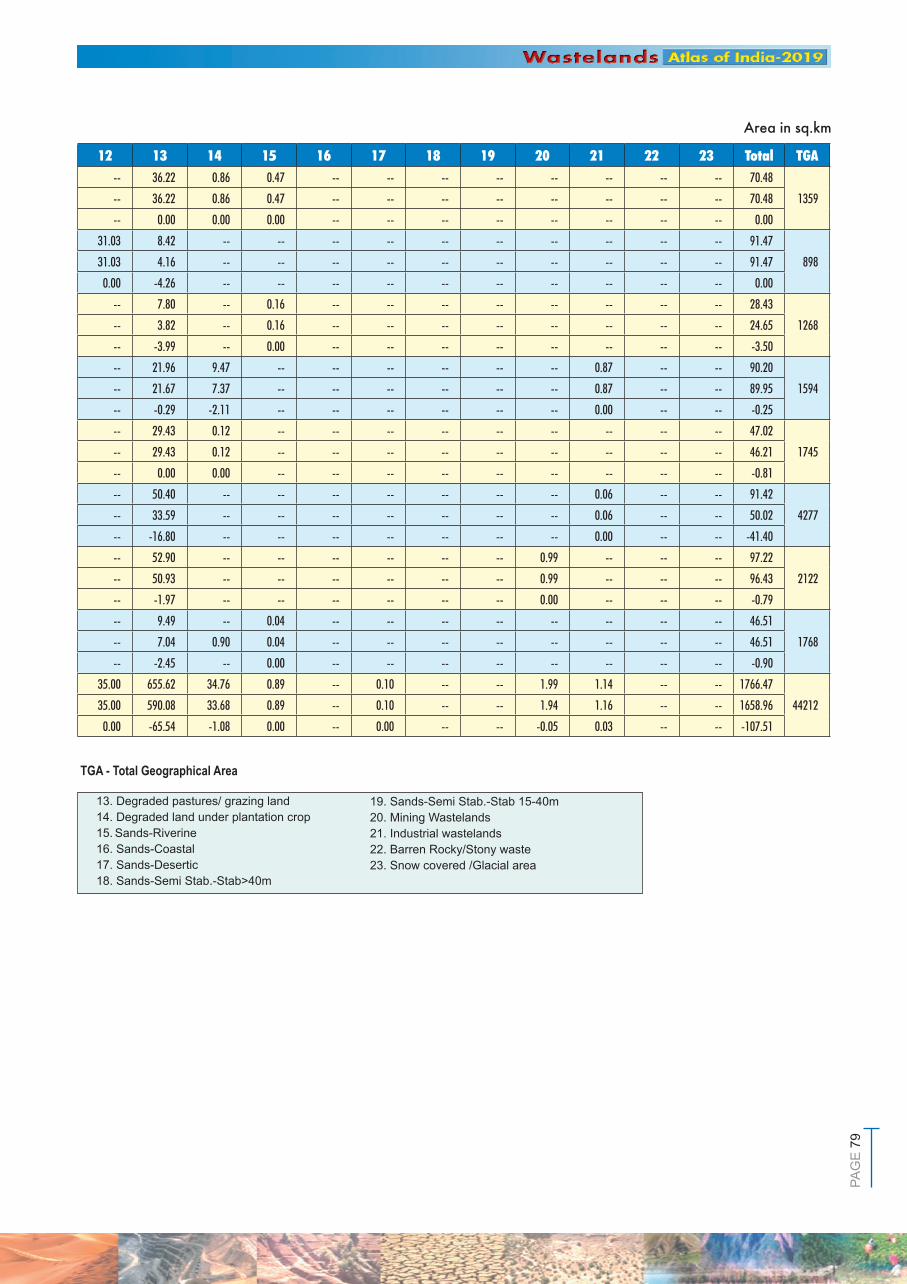
13. Degraded pastures/ grazing land14. Degraded land under plantation crop15. Sands-Riverine16. Sands-Coastal17. Sands-Desertic18. Sands-Semi Stab.-Stab>40m
19. Sands-Semi Stab.-Stab 15-40m20. Mining Wastelands21. Industrial wastelands22. Barren Rocky/Stony waste23. Snow covered /Glacial area
TGA - Total Geographical Area
Area in sq.km
PAG
E 7
8
District WL_Class 1 2 3 4 5 6 7 8 9 10 11
Palwal
2008-09 -- -- 0.76 21.29 5.40 1.44 3.76 0.29 -- -- --
2015-16 -- -- 0.76 21.29 5.40 1.44 3.76 0.29 -- -- --
Change -- -- 0.00 0.00 0.00 0.00 0.00 0.00 -- -- --
Panchkula
2008-09 -- -- 0.29 16.70 -- -- -- -- -- -- 35.04
2015-16 -- -- 4.54 16.70 -- -- -- -- -- -- 35.04
Change -- -- 4.26 0.00 -- -- -- -- -- -- 0.00
Panipat
2008-09 -- -- 0.28 14.07 -- 1.26 3.73 1.12 -- -- --
2015-16 -- -- -- 14.35 -- 1.26 3.94 1.12 -- -- --
Change -- -- -- 0.28 -- 0.00 0.21 0.00 -- -- --
Rewari
2008-09 -- -- 22.02 35.79 -- 0.08 -- -- -- -- --
2015-16 -- -- 24.44 35.51 -- 0.08 -- -- -- -- --
Change -- -- 2.43 -0.28 -- 0.00 -- -- -- -- --
Rohtak
2008-09 -- -- 0.64 11.51 0.20 1.62 1.51 1.99 -- -- --
2015-16 -- -- 0.64 10.70 0.20 1.62 1.51 1.99 -- -- --
Change -- -- 0.00 -0.81 0.00 0.00 0.00 0.00 -- -- --
Sirsa
2008-09 -- -- 0.19 35.93 -- 1.59 2.98 0.27 -- -- --
2015-16 -- -- 0.19 11.34 -- 1.59 2.98 0.27 -- -- --
Change -- -- 0.00 -24.59 -- 0.00 0.00 0.00 -- -- --
Sonipat
2008-09 -- -- 0.12 17.22 0.52 3.55 11.86 10.06 -- -- --
2015-16 -- -- 0.90 18.09 0.52 3.09 11.86 10.06 -- -- --
Change -- -- 0.78 0.87 0.00 -0.46 0.00 0.00 -- -- --
Yamunanagar
2008-09 -- -- 1.34 23.54 0.02 0.03 -- -- -- -- 12.04
2015-16 -- -- 2.11 24.33 0.02 0.03 -- -- -- -- 12.04
Change -- -- 0.76 0.79 0.00 0.00 -- -- -- -- 0.00
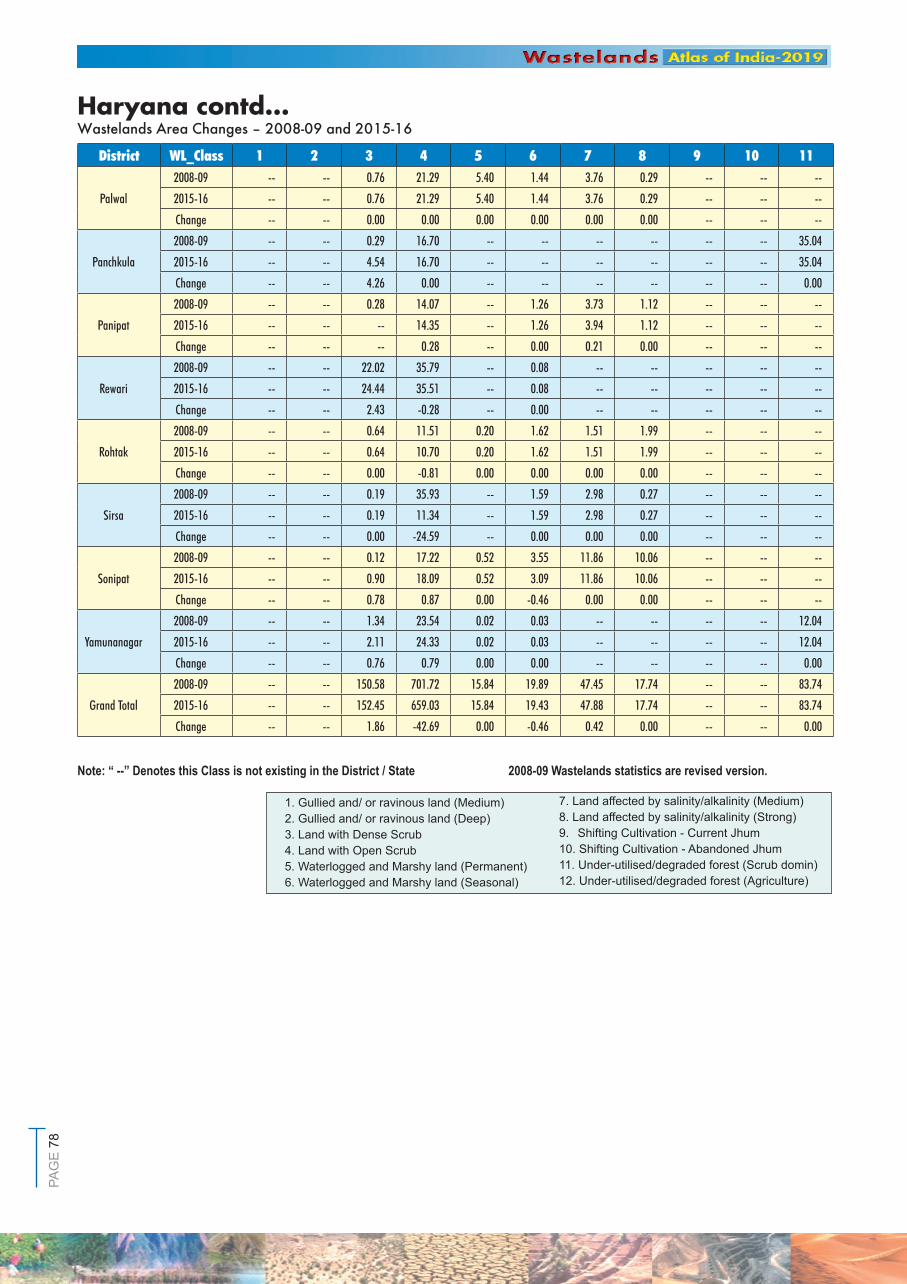
Grand Total
2008-09 -- -- 150.58 701.72 15.84 19.89 47.45 17.74 -- -- 83.74
2015-16 -- -- 152.45 659.03 15.84 19.43 47.88 17.74 -- -- 83.74
Change -- -- 1.86 -42.69 0.00 -0.46 0.42 0.00 -- -- 0.00
Haryana contd...Wastelands Area Changes – 2008-09 and 2015-16
1. Gullied and/ or ravinous land (Medium)2. Gullied and/ or ravinous land (Deep)3. Land with Dense Scrub4. Land with Open Scrub5. Waterlogged and Marshy land (Permanent)6. Waterlogged and Marshy land (Seasonal)
7. Land affected by salinity/alkalinity (Medium)8. Land affected by salinity/alkalinity (Strong)9. Shifting Cultivation - Current Jhum10. Shifting Cultivation - Abandoned Jhum11. Under-utilised/degraded forest (Scrub domin)12. Under-utilised/degraded forest (Agriculture)
Note: “ --” Denotes this Class is not existing in the District / State 2008-09 Wastelands statistics are revised version.
PAG
E 7
9
12 13 14 15 16 17 18 19 20 21 22 23 Total TGA -- 36.22 0.86 0.47 -- -- -- -- -- -- -- -- 70.48
1359 -- 36.22 0.86 0.47 -- -- -- -- -- -- -- -- 70.48
-- 0.00 0.00 0.00 -- -- -- -- -- -- -- -- 0.00
31.03 8.42 -- -- -- -- -- -- -- -- -- -- 91.47
89831.03 4.16 -- -- -- -- -- -- -- -- -- -- 91.47
0.00 -4.26 -- -- -- -- -- -- -- -- -- -- 0.00
-- 7.80 -- 0.16 -- -- -- -- -- -- -- -- 28.43
1268 -- 3.82 -- 0.16 -- -- -- -- -- -- -- -- 24.65
-- -3.99 -- 0.00 -- -- -- -- -- -- -- -- -3.50
-- 21.96 9.47 -- -- -- -- -- -- 0.87 -- -- 90.20
1594 -- 21.67 7.37 -- -- -- -- -- -- 0.87 -- -- 89.95
-- -0.29 -2.11 -- -- -- -- -- -- 0.00 -- -- -0.25
-- 29.43 0.12 -- -- -- -- -- -- -- -- -- 47.02
1745 -- 29.43 0.12 -- -- -- -- -- -- -- -- -- 46.21
-- 0.00 0.00 -- -- -- -- -- -- -- -- -- -0.81
-- 50.40 -- -- -- -- -- -- -- 0.06 -- -- 91.42
4277 -- 33.59 -- -- -- -- -- -- -- 0.06 -- -- 50.02
-- -16.80 -- -- -- -- -- -- -- 0.00 -- -- -41.40
-- 52.90 -- -- -- -- -- -- 0.99 -- -- -- 97.22
2122 -- 50.93 -- -- -- -- -- -- 0.99 -- -- -- 96.43
-- -1.97 -- -- -- -- -- -- 0.00 -- -- -- -0.79
-- 9.49 -- 0.04 -- -- -- -- -- -- -- -- 46.51
1768 -- 7.04 0.90 0.04 -- -- -- -- -- -- -- -- 46.51
-- -2.45 -- 0.00 -- -- -- -- -- -- -- -- -0.90
35.00 655.62 34.76 0.89 -- 0.10 -- -- 1.99 1.14 -- -- 1766.47
4421235.00 590.08 33.68 0.89 -- 0.10 -- -- 1.94 1.16 -- -- 1658.96
0.00 -65.54 -1.08 0.00 -- 0.00 -- -- -0.05 0.03 -- -- -107.51
13. Degraded pastures/ grazing land14. Degraded land under plantation crop15. Sands-Riverine16. Sands-Coastal17. Sands-Desertic18. Sands-Semi Stab.-Stab>40m
19. Sands-Semi Stab.-Stab 15-40m20. Mining Wastelands21. Industrial wastelands22. Barren Rocky/Stony waste23. Snow covered /Glacial area
TGA - Total Geographical Area
Area in sq.km

![HARYANA GOVERNMENT EDUCATION …schooleducationharyana.gov.in/downloads_pdf/daily_orders/2012/T...HARYANA GOVERNMENT EDUCATION DEPARTMENT ... D.I.E.T. Shahpur (Karnal) [4613] (Rural)](https://img.pdfslide.us/doc/110x75/5ab2ed0c7f8b9a00728dab7e/haryana-government-education-sc-government-education-department-diet.jpg)