Embed Size (px)
Citation preview

Curtin University is a trademark of Curtin University of Technology. CRICOS Provider Code 00301J (WA), 02637B (NSW)
HARVEY 2D TEST SEISMIC SURVEY – ISSUES AND OPTIMISATIONS
Final report
ANLEC R&D Project 7-1213-0223
Prepared by:
M. Urosevic, S. Ziramov, R. Pevzner and A. Kepic 3
CURTIN UNIVERSITY
8/20/2014

1
CONTENTS
ACKNOWLEDGEMENTS .......................................................................................................... 2
EXECUTIVE SUMMARY ........................................................................................................... 3
Table of abbreviation .............................................................................................................. 4
ACQUISITION AND PROCESSING OF SOUTH WEST HUB 2D EXPERIMENTAL SEISMIC
DATA ......................................................................................................................................... 6
INTRODUCTION ....................................................................................................................... 5
Data Acquisition ..................................................................................................................... 6
Sweep tests ............................................................................................................................ 8
Processing Sequence ............................................................................................................ 9
Fault expression ...................................................................................................................16
CONCLUSIONS ........................................................................................................................18
REFERENCES .........................................................................................................................18

2
ACKNOWLEDGEMENTS
The authors would like to acknowledge contributions to the South West Hub Flagship project by
the Western Australian Department of Mines and Petroleum (including the Geological Survey of
Western Australia), and the Commonwealth Department of Industry. The authors wish to also
acknowledge financial assistance provided through Australian National Low Emissions Coal
Research and Development (ANLEC R&D). ANLEC R&D is supported by Australian Coal
Association Low Emissions Technology Limited and the Australian Government through the
Clean Energy Initiative.

3
EXECUTIVE SUMMARY
A large 3D seismic survey at the South West CO2 Hub Project near Harvey, covering an area of
approximately130 km2, will be acquired in the first quarter of 2014. The survey is of great
importance for characterisation of the reservoir, seals and structures in the area where future
industrial scale CO2 sequestration is being considered. The major issues encountered with the
upcoming 3D survey relates to accessibility and the environmental sensitivity in the area,
particularly for positioning of source points. The large size commercial seismic vibrating trucks
may cause significant disturbance to the landowners as they require significant manoeuvring
space during normal seismic operations. This could mean pulling down some fences and gates
(because they are too wide to pass through most access points), and in some cases leaving
large footprints into a soft ground. It is therefore of high importance to investigate the use of
alternative sources to replace conventional seismic sources in exclusion zones of the 3D survey
area. The UNIVIB sources (UV – made by INOVA, US), environmentally friendly mini-vibrator
acquired under the EIF grant scheme to the National Geosequestration Laboratory (NGL)
consortium (CSIRO, Curtin, UWA), was used to test their resolution and penetrating power.
Additional objective was to demonstrate to the general community their relatively low
environmental impact. A vibrator truck was exhibited at the Harvey Agricultural show in late
2013 and attracted a lot of interest and positive comments from the local community.
The UV trucks proved to be able of generating exceptionally broad band sweeps (over 5.5
octaves) without stressing their hardware capabilities. The high-quality, broad band signal
generated by the new Vibrators was combined with the use of single receivers separated at
12.5 m to demonstrate that a relatively lightweight, low-impact seismic survey can be used to
acquire the necessary and valuable geological information. Shallow structures, less than
1000m, were imaged with higher precision and resolution. Such images of the shallow
sediments were not possible to achieve with the 2011 data as the survey parameters were
adjusted for considerably greater depths in the order to map the potential CO2 reservoir zones.
The results of the new survey demonstrated that high resolution surveys were important for
imaging the top 1000 m of sediments. The UV when operated smartly also proved to be a quite
powerful source, capable of producing enough energy to enable record of reflections from
depths over 3000 m. Our source tests with the UV source showed that long duration, broad
band sweeps were superior to conventional short sweeps and may be used to inject high
frequencies to significant depths for better resolving power. Therefore it may be possible to
utilise UV trucks to close the (accessibility) gaps in the existing large scale 3D design. Data
acquired in December 2013 along Riverdale road with UV trucks will be discussed in more detail
in this report and also compared to 2011 survey results.

4
Table of abbreviations
Abbreviation Description
2D 2 dimensional survey
UV UNIVIB (INOVA, 24, 000 Lb) – NGL owned
and operated
RP Receiver point
SP Source point
CDP Common depth point
CSP Common source point
AGC Automatic gain control
NMO Normal move-out
m Meter
km Kilometre
s Second
ms Millisecond
kg Kilogram
S/N Signal to noise ratio
DMO Dip move-out or partial pre-stack migration

5
ACQUISITION AND PROCESSING OF SOUTH WEST HUB 2D
EXPERIMENTAL SEISMIC DATA
In this report we describe results and findings from the experimental 2D seismic survey acquired
along Riverdale Rd with newly acquired NGL UNIVIB seismic vibrating sources. Results are
compared to previous work from 2011 involving conventional large size vibrating trucks.
INTRODUCTION
In December 2013 the Exploration Geophysics Curtin university group re-acquired most of the
11GA-LL2 line over a length of approximately 7.7 km. The new experimental line, named 13UV-
LL2, was acquired with recently purchased NGL high-technology Vibroseis trucks by INOVA.
The UV is a broad band, low footprint, vibrating seismic source capable of variable peak
downward force (up to 26,000 lb) and weighting about 15,000 kg fully laden (Figure 1). The
13UV-LL2 line track is also shown in Figure 1, together with other 2D lines surveyed in 2011.
Figure 1. Location of the new line 13UV-LL2 recorded over 11GA-LL2 track
UTM X (m)
UTM
Y (
m)
11GA-LL1
11GA-LL2
GSWA Harvey-1
13UV-LL2
UNIVIB VIB
6
The main objectives of the survey were:
a) Evaluate the performance of the new NGL source in terms of depth of penetration and
resolution.
b) Find the best sweep characteristics to be utilised in future 3D survey that is aimed at
fault characterisation in the first 1000.
c) Execute survey with practically no footprint using lightweight recording equipment, single
geophone and UV source with extra wide tyres that result in very small ground pressure.
d) Demonstrate non-destructive character of the survey to the local community
e) Process, evaluate and compare new data to 2011 data set produced with big vibrators.
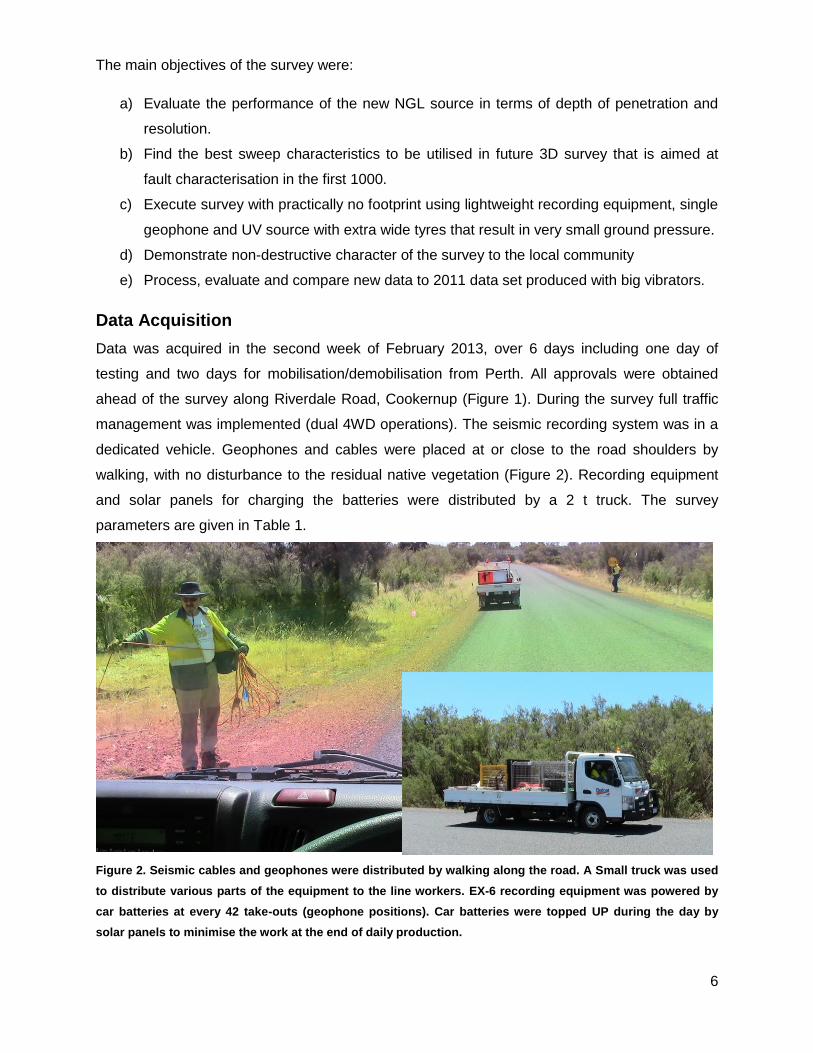
Data Acquisition
Data was acquired in the second week of February 2013, over 6 days including one day of
testing and two days for mobilisation/demobilisation from Perth. All approvals were obtained
ahead of the survey along Riverdale Road, Cookernup (Figure 1). During the survey full traffic
management was implemented (dual 4WD operations). The seismic recording system was in a
dedicated vehicle. Geophones and cables were placed at or close to the road shoulders by
walking, with no disturbance to the residual native vegetation (Figure 2). Recording equipment
and solar panels for charging the batteries were distributed by a 2 t truck. The survey
parameters are given in Table 1.
Figure 2. Seismic cables and geophones were distributed by walking along the road. A Small truck was used
to distribute various parts of the equipment to the line workers. EX-6 recording equipment was powered by
car batteries at every 42 take-outs (geophone positions). Car batteries were topped UP during the day by
solar panels to minimise the work at the end of daily production.

7
Table 1: Survey geometry and recording parameters
General Survey Parameters
Survey name Experimental
Survey location Riverdale Road, Cookernup and Harvey
Date of recording December, 2013
Total Number of Lines 1 Line, plus testing
Total Number of Source Points 330
Bin Size 6.75 m
Total Number of Bins 7984
Nominal Stacking Fold 150
Offset Range 0-7487.5m
Geo Datum GDA94, MGA Zone 50
Source Parameters
Source Type EUNIVIB, INOVA
Source Array 2 Vibrators 25m array length
Sweep Parameters 3 sweeps: 8 – 150 Hz, 16s Source Point Spacing 25 m
Receiver Parameters
Receiver Array Single Sensor 10 Hz Receiver Point Spacing 12.5 m
Number of Channels 600
Nominal Split-spread Array 3737.5-6.75-0-6.75-3737.5
Recording Parameters
Instrument type Seistronix EX-6
Record length 22000 ms
Sample Interval 2 ms
Recording Filters High Cut: open
Tape Format SEG-Y
Line track and elevation along the receiver line are shown in Figure 3. Very small elevation
differences were encountered which made acquisition straightforward. Deviation from the
straight line was of no concern to the processing.
Figure 3. Line track and elevation profile (coloured)
Sweep tests
Prior to data acquisition along Riverdale Road, Cookernup, we conducted extensive testing
which aimed to evaluate the following:

8
1. Capability of UV trucks to produce broad band signal using (at least 80% of the
maximum allowable peak force)
2. Correlation performance at high frequencies (linearity and harmonics)
3. Energy: different sweeps, different number of stacks
4. Return of frequency content from the shallow sediments
5. Depth of penetration
One full day was devoted to the tests which were conducted at the eastern side of the 2D line.
Parameters tested included: a) sweep duration, b) number of sweeps stacked, c) frequency
content, d) sweep type (linear vs. random) and e) peak force level.
Figure 4. Sweep tests going left to right using conventional narrow to unconventional broad band sweeps.
Standard commercial sweep is compared to a long broad band sweep. Long sweeps performed the best.
The results are summarised in Figures 4 and 5. Extensive sweep testing showed that superior
results are achieved with unconventionally long sweeps (24 seconds). Energy wise a stack of
two 24 seconds long sweeps provides more power than 4 stacks of short conventional sweeps
(8-90 Hz), while having superior frequency content and hence resolving power. Short sweeps
with long listen times are inefficient in putting energy into the ground. Indeed further frequency
content analysis showed that some energy is returned even to frequencies to 240 Hz (two times
greater than conventional approaches attempt). The tests show that the power/resolution ratio is
close to be optimal for a stack of 2 sweeps, 24 seconds long, in the frequency range 6-150 Hz.
Hence these parameters will be adopted for the future mini 3D survey in this area.
8-90 Hz
4 s
7 sweeps
8-90 Hz
8 s
4 sweeps
8-90 Hz
16 s
3 sweeps
6-150 Hz
16 s
3 sweeps
6-150 Hz
24 s
2 sweeps
6-250 Hz
24 s
3 sweeps

9
Figure 5. Log-Amplitude spectra for sweeps presented in Figure 4. Useful frequency range extends even to
250Hz. The optimum sweep is considered to be: 6-150Hz, 24 seconds long.
Processing sequence
After testing was completed we started the production survey which covered some 7.7 km of the
previous 11GA-LL2 line. The parameters used are given in Table 1. Data processing
commenced in early January. Data was binned using a 6.75 m in-line bin size, while cross-line
bin size was chosen to include all scatter points (point dispersion due to crookedness of the
line). Most of the processing time was spent with first break picking, trace editing (significant
ambient noise caused by traffic and operating farm equipment) and velocity analysis. High traffic
noise was not edited rigorously; rather the stack power (fold of 150) was used to overcome the
effects. This type of noise was present on 50% of the records. One example of a typical noisy
record is shown in Figure 6. Initial refraction statics solution provided reasonable results but
superior solution was achieved using the approach of Hatherly et al. (1994). The advantage of
this approach is that it is fully automatic so that the processor influence is removed from the
solution. An example is shown in Figure 7. Apart from the application of non-standard statics
solution a conventional processing flow was adopted. No specific signal enhancement was
applied to the data. The application of multi-channel filters was avoided to preserve the near
surface information and steep dips (possible reflections from the fault plane). The processing
workflow is presented in Table 2. Velocities were analysed in two passes. The final RMS
velocity field is shown in Figure 8. Brute stack and DMO stacks are shown in Figure 9. Constant
LCCC Meeting Harvey 19th Feb, 2014 – 2D Seismic Overview 5
(Log)Amplitude spectra
F (
Hz)
Shallow zone returns frequencies of 150 Hz and higher, some at 250 Hz

10
velocity shot record DMO (Deregowski, 1982) is applied to enhance shallow depths. This type of
DMO does discriminate against deeper targets, as demonstrated in Figure 8.
Table 2: Processing Flow Chart
Procedure Parameters
Data Input SEG-2 data Input
Geometry assignment Applied from ASCII files and observer’s log
Binning Bin size 6.75 m
Trace Editing Kill bad traces
Elevation Statics Final datum elevation – 40 m, Replacement Velocity – 2250 m/s
True Amplitude Recovery time power constant 0.5
Air Blast Attenuation Attenuation mode for the velocity 331 m/s
First break picking Frequency range 8-60 Hz, Burg deconvolution
Spiking Deconvolution Zero-phase, applied in a1.4 sec gate below first breaks Decon Operator length – 80 ms, ‘white noise’ level – 1%
Bandpass Filtering 8-16-90-125 Hz
Trace Muting Top muting
Linear Moveout Correction V=2250 m/s
Static correction solution LMO based
Static QC Every 10th shot
Application of statics
Interactive Velocity Analysis 2 iterations
Normal Moveout Correction 30% - NMO muting
CDP stacking Method of trace summing – Mean, Power scalar for stack normalization 0.5
DMO Shot based (v=2500 m/s)
DMO stack plus FX-deconvolution
Wiener Levinson filter, Hz
Migration Time and depth (Kirchhoff and finite difference)
Figure 6. Selected shot record along seismic line.

11
Figure 7. A) Shot record before (left) and after (right) application of static corrections. Arrows depict areas where the “roughness” due to variable time delays is eliminated after computation of surface consistent LMO energy-based static corrections and B) LMO statics (blue) and the total static (green) after adding datum statics.
Figure 8. Final stacking velocities.
A
B

12
The DMO process did however greatly enhance the first kilometre of the section which was one
of the objectives of this study. This is better viewed in Figure 10 where only the first 600 ms are
displayed for both brute stack (top) and DMO stack (bottom). Shallow layers, particularly
unconformity are much better seen in the DMO stack. Evanescent energy is also well
attenuated in DMO stack. Final processing stages include time and depth migrations. Time
migration of the DMO stack is shown in Figure 11. Depth migration result is shown in Figure 12.
The interval velocity field used for depth migration is shown in Figure 13.
Figure 9. Brute stack (top) and DMO stack (bottom). Events pas pass 1200 ms are better seen in Brute stack
compared to DMO stack.
Figure 10. The geological unconformity in the top layers is well seen in the DMO stack (bottom) and the
image is clear off evanescent energy.

13
Figure 11. Phase shift time migration applied to the DMO stack.
Figure 12. Wave equation finite difference depth migration of the DMO stack.
Figure 13. Interval velocity field used for the depth migration process.

14
2011-2013 survey comparison
In 2011 three 50,000 Lb Hemi vibes were used to vibrate each point. The line was shot in May
2011 using the parameters shown in Table 3.
Compared to Table 1 it is clear that the survey geometries are very similar in terms of maximum
offset and fold. The differences are principally in the source energy/frequency content. Thus,
the 2011 survey had higher initial signal to noise (S/N) ratio (but over a smaller range of
frequencies) and a receiver array was used in 2011 as opposed to a single receiver in 2013
(which can improve signal-to-noise, but often at the expense of resolution in shallow zone). The
processing sequences in 2011 and 2013 were different, but largely comparable. The data in
2013 was “less processed” in terms a lack of multi-channel filter application. Nevertheless, the
results were comparable, particularly in the eastern part of the section where good surface
ground conditions existed so that a single geophone was coupled well to the ground. Over the
entire length we observe that the new data is of much higher resolution, and provides a clearer
picture of the near surface sediments and structures (Figure 14). This is of particular importance
for the future high-resolution “nested” 3D survey as the current results clearly suggest that such
a survey will be able to clearly resolve full 3D nature of the F10 fault system. A direct
comparison of the resolving power and the continuity of reflectors between the two data sets
can be better seen in Figure 15, where an enlarged cross section is displayed. The shallow
sediments are more continuous and better defined with 2013 data using the new NGL source.

15
Figure 14. A comparative display: 2011 data processed fully to PSTM (left) and the new 2013 data processed
“lightly” through DMO and post stack phase shift migration.

16
Figure 15. 2011 PSTM section in the background. Overlaid is a segment of 2013 data set.
Fault expression
The new data allows fault analysis close to the main unconformity. A preliminary analysis
suggests that there are a number of faults from large zones (F10) to many small throw faults.
Most of them (if not all) appear to be normal faults, but more complex patterns cannot be
excluded. It is hoped that the new high resolution 3D (embedded) survey will shed further light
on the fault patterns in the near surface. As the unconformity appears to be “pick-able” it seems
that no faults penetrate into it (i.e. no reactivation took place recently). Some faults are
suggested on a Perigram (reflection strength*continuity) display in Figure 16.

17
Figure 16. A preliminary analysis of discontinuities along LL2 recorded in 2013 with NGL vibrator.

18
CONCLUSIONS
A high quality, broad band, low impact seismic source produced very high resolution data in the
first kilometre of depth along Riverdale Road, Cookernup. Despite the high ambient noise (traffic
and farming machinery) this source combined with unconventionally light-weight seismic
equipment produced high quality data. Shallow sediments are imaged with superior resolution
and the main unconformity can now be mapped with much improved accuracy in comparison to
the 2011 data acquired with much stronger sources, but with geophones (in groups) spaced at
25 m rather than 12.5 as used for 2013 survey.
The results of the new survey demonstrate that high resolution surveys are important for
imaging top 1000 m of sediments and improving pour understanding of the fault patterns. The
new broad band source also proved to be a quite powerful source, capable of producing enough
energy to records of reflections from depths of over 3000 m. Moreover, extensive tests showed
that long duration, broad band sweeps, were superior to summing shorter sweeps and may be
used to inject high frequencies not only at shallow depths, but also at greater depths. Thus, it
may be possible to utilise UNIVIB trucks to close the gaps in survey coverage, where access is
otherwise not possible, in the existing large size 3D survey.
Based on the results achieved with this 2D test we expect that the future high resolution 3D
survey will be of great importance for understanding and mapping the fault patterns, particularly
in the near surface.
REFERENCES
Deregowski. S.M. 19H2. Dip-Moveout and Reflector Point Dispersal. Geophysical Prospecting
30.31 H-322.
Hatherly, P., Urosevic, M., Lambourne, A., and Evans, B. J., 1994, A simple approach to
calculating refraction statics calculations: Geophysics: 59, 156-160.