Embed Size (px)
Citation preview

Harvard University
Life Cycle Cost Calculator
Harvard Life Cycle Calculator Training Joel McKellar Green Building Services 11.06.2012
Harvard University
Life Cycle Cost Calculator
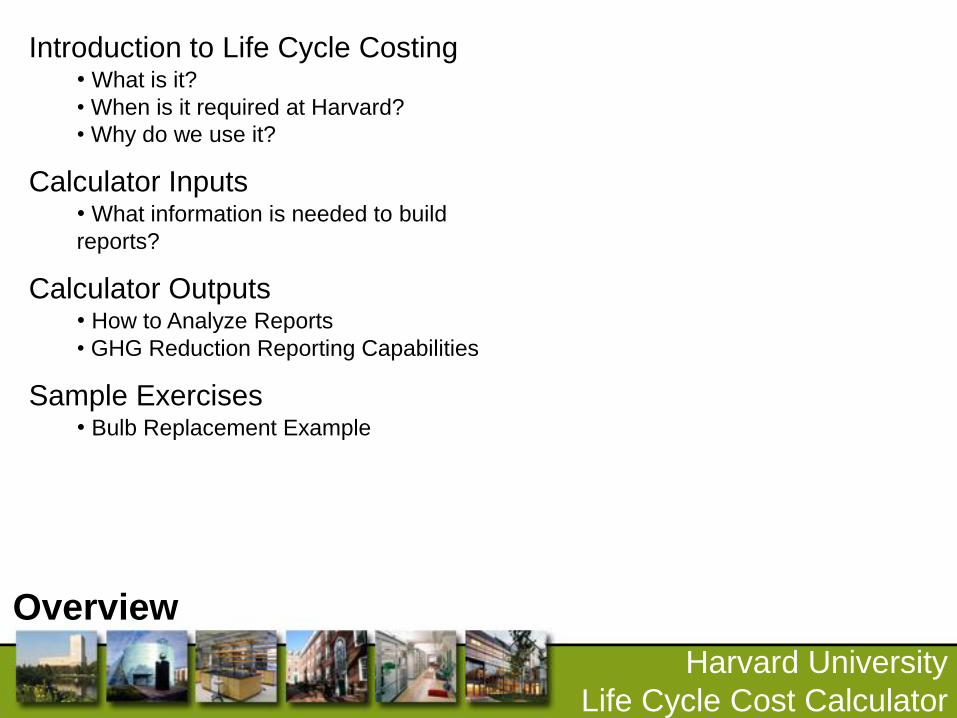
Overview
Introduction to Life Cycle Costing • What is it?
• When is it required at Harvard?
• Why do we use it?
Calculator Inputs • What information is needed to build
reports?
Calculator Outputs • How to Analyze Reports
• GHG Reduction Reporting Capabilities
Sample Exercises • Bulb Replacement Example

Harvard University
Life Cycle Cost Calculator
Introduction to Life Cycle Costing
(LCC) What is it?
A method to calculate the full costs and savings of a project including initial costs
(present costs), utility, operations & maintenance, and replacement costs (future
costs) over a set period of time.

Harvard University
Life Cycle Cost Calculator
Introduction to Life Cycle Costing
(LCC)
When is it required at Harvard? The Harvard University Green Building Standards (Nov. 2009) require LCC in
three situations:
•New buildings and building-wide, full-gut renovations (LEVEL I)
•Partial building interior fit-outs (LEVEL I)
•Limited Scope Projects with Energy and GHG impact (LEVEL II)
LEVEL I – Multiple iterations of LCC at planning/conceptual design stage, schematic
design, and any value engineering exercises. Early investigations are broad and aim
to reduce scope of investigation, while later stages are more detailed.
LEVEL II – Single 20 year LCC for specific measures being considered.
Overview

Harvard University
Life Cycle Cost Calculator
Overview
Introduction to Life Cycle Costing
(LCC) Why do we use it?
Initial costs are deceiving. LCC examines the total cost of ownership over 20
years, not just the initial construction cost.
Today’s money ≠ tomorrow’s money. LCC converts all future costs into present
value to allow ‘apples to apples’ comparisons.
Simple paybacks aren’t the full story. Looking only at initial costs and expected
annual savings will not reflect variances in expected equipment lifetimes,
maintenance cost differences, and rebates/incentives that affect total ownership
cost.
The Harvard LCC calculator is specific to Harvard. Our LCC allows for simple
analysis of the use of complex district thermal and energy systems with rate
information updated annually by E&U.

Harvard University
Life Cycle Cost Calculator
Overview
Introduction to Life Cycle Costing
(LCC) Why do we use it?
GHG Reduction Goal – 30% by 2016 from 2006, including growth
• At the university level, LCC allows for a common set of financial metrics to
compare ECMs for cost and GHG reduction effectiveness
• At the school or department level, LCC enables prioritization of ECMs for GHG
reduction plan implementation.
• At the project level, LCC provides a means to link capital budgets to operating
budgets to ensure sound decision making in terms of long-term cost and
emissions.

Harvard University
Life Cycle Cost Calculator
Overview
ECM < $100K
ECM Project Identified
Use Simple Payback
Analysis
< 5 Yr Simple
Payback
Implement ECM
Add to GHG
Prioritization List
Use NPV to compare
options
Part of Larger
Capital Project
Use IRR Analysis
> 20% 10-yr IRR
Implement ECM
20 yr NPV of
ECM >
alternative
Implement ECM
Yes
No
Yes
No Yes
Yes Yes
Use NPV $ / MTCDE
to Prioritize
Develop multi-year capital
plan to achieve GHG goals
No
No
Do Not Implement ECM
for Financial ReasonsNo
ECM Financial Analysis Flow Diagram

Harvard University
Life Cycle Cost Calculator
Overview
Assumptions and Escalation Rates
Assumptions & rates selected in 2009 by the Finance Working Group, one of five
working groups charged with implementing the recommendations of the GHG Task
Force.
• Discount Rate - 8%
• Accounts for the value you could earn if money was invested elsewhere
• Estimate of Harvard’s endowment’s rate of return
• Study period – 20 years
• Cost of Carbon (MTCDE) – $0
• Not currently included in calculations, but cell is functional.
Assumptions
Discount Rate Escalation Rate
Utilities
Escalation Rate
CUSTOM Units
Escalation Rate
Cost of Carbon
Escalation Rate
Materials
Escalation Rate
Labor/Maintenan
ce
Study Period
(Years)
Cost of Carbon
(per MTCDE)
8.00% 4.33% 4.33% 4.33% 1.84% 1.84% 20 $ -

Harvard University
Life Cycle Cost Calculator
Overview
Assumptions and Escalation Rates
Non-Utility Escalation Rates Maintenance and Material Costs Escalation Rate – 1.84%
Energy Information Agency’s estimate of inflation
Utility Escalation Rates Non-fixed Costs – 4.33%
Harvard University
Life Cycle Cost Calculator
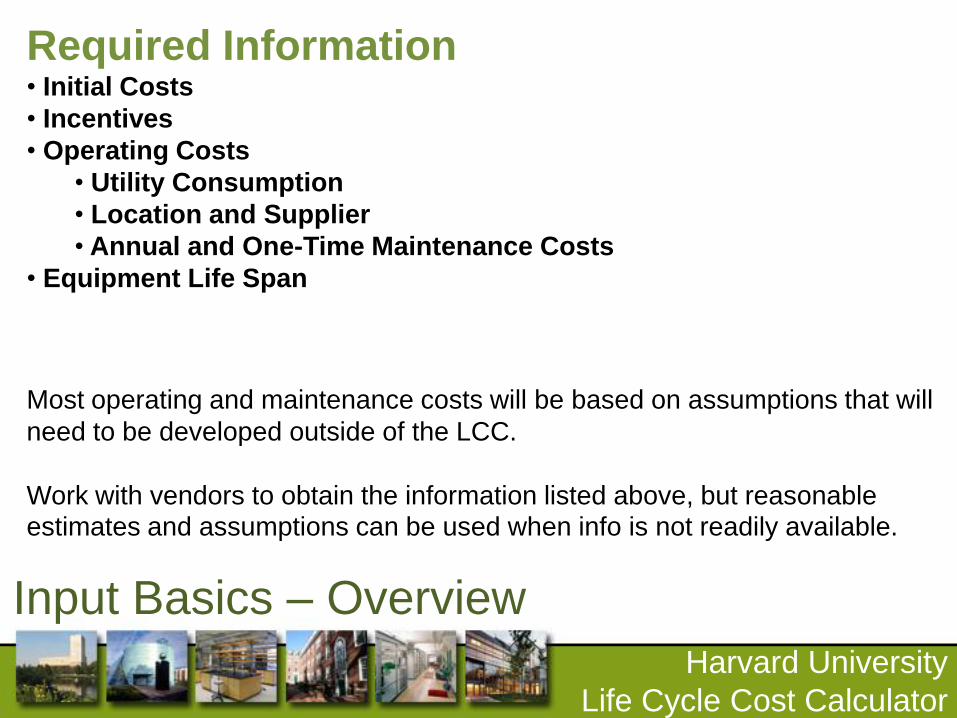
Input Basics – Overview
Required Information • Initial Costs
• Incentives
• Operating Costs
• Utility Consumption
• Location and Supplier
• Annual and One-Time Maintenance Costs
• Equipment Life Span
Most operating and maintenance costs will be based on assumptions that will
need to be developed outside of the LCC.
Work with vendors to obtain the information listed above, but reasonable estimates and assumptions can be used when info is not readily available.

Harvard University
Life Cycle Cost Calculator
Input Basics – Savings vs. Options Costs
Options Calculator Insert TOTAL COST for each item in the appropriate box.
• If the baseline is an item that is already installed, enter $0 in the initial
cost box.
Savings Calculator Insert DIFFERENCE in costs between baseline and ECM
• If ECM is a completely new system or replacing something in otherwise working
order, then add all costs to “Total Cost” section (e.g. installing new windows in an
existing building)
• If the ECM is an alternative (e.g. upgrading to better windows in a new
construction project) to a lower cost product, only add the cost premium.
The information required for both options and the resulting analysis is almost
exactly the same, it is simply entered in a different format.

Harvard University
Life Cycle Cost Calculator
Input Basics – Forms
Savings calculation inputs >
Options calculation inputs ˇ

Harvard University
Life Cycle Cost Calculator
Initial Costs
Savings Comparison Shown Above
“Total Cost” should be complete investment cost, including labor and overhead, for the
ECM being considered.
•For the “Savings Comparison”, enter the difference in cost between the baseline
and the ECM being considered.
•For the “Options Comparison”, enter the total cost of each system. If the
Baseline is already installed, enter $0.
If incentives are available, enter them in the incentive box, and the “Net Cost” will be
calculated automatically.
The replacement cost will automatically assume it is the same as the “Total Cost”
without incentives, however this figure can be overwritten as necessary.
Cost Differential between Baseline and Proposed Ongoing Costs
Total Cost ($) Incentives ($) Net Cost ($) Equipment Life (Years) Replacement Cost ($)
$ 30,000 $ 10,000 $ 20,000.00 15 $ 30,000

Harvard University
Life Cycle Cost Calculator
Input Basics – Incentives
http://www.nstar.com/business/energy_efficiency/application_forms/application_forms.asp
For prescriptive incentives,
application forms list per
unit/fixture/watt reduction/etc.
rebates that can be plugged
directly into calculations.
For custom or performance
incentives, additional
calculations may be required.
All savings rates are listed on
these application forms.

Harvard University
Life Cycle Cost Calculator
Input Basics – Maintenance/Material Costs
Material Costs Include items that will have value once installed
• Replacement Period In Years
• Replacement Costs (if different from initial)
• Insert everything in present value regardless of year investment will take place
Maintenance/Labor Costs Include items that will not have value once installed.
• e.g. CO2 sensors must be calibrated every five years, so labor expenditures
would be placed here, but once completed there’s no inherent value remaining.
Remaining Equipment Value in Year 20 For investment/capital equipment that has remaining life beyond the 20 year study
period, this is an adjustment made in year 20 that accounts for the value of the
equipment’s remaining life.

Harvard University
Life Cycle Cost Calculator
Input Basics – Maintenance/Material Costs
Annual Operating/Replacement Cost Savings
Materials Labor/Maintenance Material Labor/Maintenance
Year 1 $ - Year 11 $ -
Year 2 $ - Year 12 $ -
Year 3 $ - Year 13 $ -
Year 4 $ - Year 14 $ -
Year 5 $ - $ 250 Year 15 $ 30,000 $ 250
Year 6 $ - Year 16 $ -
Year 7 $ - Year 17 $ -
Year 8 $ - Year 18 $ -
Year 9 $ - Year 19 $ -
Year 10 $ - $ 250 Year 20 $ - $ 250
Total 20 Year Materials Cost (Unescalated) $ 30,000
Total 20 Year Labor Cost (Unescalated) $ 1,000
Remaining Equipment Value in Year 20 $ 20,000
Savings comparison shown above

Harvard University
Life Cycle Cost Calculator
Input Basics – Maintenance Costs
If historical cost data is
unavailable, Whitestone
Research’s Facility
Maintenance and Repair Cost
Reference provides some
reasonable assumptions.
Copies are available at PIRC.

Harvard University
Life Cycle Cost Calculator
Input Basics – Utility Consumption
The LCC does not calculate energy/utility savings for your
ECM, it only weighs those savings against the costs to earn
them.
Work with vendors/consultans for energy savings
calculations.
Consumption is measured in common units (e.g. kWh for
electricity) and converted into dollars based on standard
assumptions in the LCC.
Location is important, because the rate structures are different for
each source (e.g. Blackstone steam vs. Longwood steam)

Harvard University
Life Cycle Cost Calculator
Input Basics – Utility Consumption
Annual Savings Cambridge Boston (Allston) Boston (Longwood) Boston (Other)
Savings Cost GHG Savings Cost GHG Savings Cost GHG Savings Cost GHG
Electricity (kWh) (3,000) $ (357) -1.18 $ - 0.00 - $ - 0.00 $ - 0.00
Natural Gas (Therms) 3,500 $ 4,375 18.61 $ - 0.00 $ - 0.00 $ - 0.00
Chilled Water (Ton-Days) $ - 0.00 N/A $ - 0.00 N/A
Steam (MMBtu) $ - 0.00 $ - 0.00 $ - 0.00 N/A
Water/Sewer (Ccf) $ - N/A $ - N/A $ - N/A $ - N/A
#2 Fuel Oil (Gallons) $ - 0.00 $ - 0.00 $ - 0.00 $ - 0.00
#4 Fuel Oil (Barrels) $ - 0.00 $ - 0.00 $ - 0.00 $ - 0.00
Transportation Gas (Therms) $ - 0.00 $ - 0.00 $ - 0.00 $ - 0.00
Res. Direct Electricity (kWh) $ - 0.00 N/A N/A N/A
CUSTOM $ - 0.00 $ - 0.00 $ - 0.00 $ - 0.00
CUSTOM Cost/Unit ($)
CUSTOM GHG/Unit
(MTCDE)
Total Annual Cost
Savings $ 4,018 Total Annual GHG
Savings 17.44

Harvard University
Life Cycle Cost Calculator
Output Basics – Overview
Financial Costs • 20 year NPV cost of system
Financial Savings • 20 year savings to ratepayer
• 20 year net savings
Investment Performance • 20 year - Savings to Investment Ratio (SIR)
• Return on Investment (ROI)
• Internal Rate of Return
• Simple and Discounted Payback Periods
Greenhouse Gas Metrics • Annual and Cumulative MTCDE Reductions
• GHG Reduction Plan Formatted Info
LCC allows you to examine the effectiveness of an ECM from both a financial and GHG reduction perspective.

Harvard University
Life Cycle Cost Calculator
Output Basics – Financial Metrics
Analysis Metrics – Savings Comparison
20 Year Savings
(NPV) $29,601 20 Year GHG Savings
(MTCDE) 348.72
Simple Payback Analysis
Savings to University
Variable Cost Only
Annual Savings (FY12 rates) $4,018
Simple Payback Period (Years) 4.98
Return on Investment 20.1%
Life Cycle Cost Metrics
Savings to University
Variable Cost Only
20 Year Net Present Savings $29,601
20 Yr Savings to Investment Ratio 2.11
Discounted Payback Period See 'Net Savings' graph
Internal Rate of Return 22.9%
Greenhouse Gas Metrics
Savings to University
Variable Cost Only
Annual GHG Savings (MTCDE) 17.44
20 Year GHG Savings (MTCDE) 348.72
20 Yr Investment Cost / 20 Yr GHG $77
20 Yr Net Present Savings / 20 Yr GHG $85 Note: Discounted Payback Period occurs on the last year the line crosses the x axis
$-
$500.00
$1,000.00
$1,500.00
$2,000.00
$2,500.00
$3,000.00
$3,500.00
$4,000.00
$4,500.00
0 5 10 15 20
Ne
t S
avin
gs
Year
Net Savings: Discounted Payback Period

Harvard University
Life Cycle Cost Calculator
Output Basics – Overview
Basic Cost and Savings Metrics
Additional Investment: The difference in initial cost between the ECM and the baseline. Annual Operating Savings: The difference in operating costs between the ECM and the baseline. Simple Payback Period: (Additional Investment/Annual Operating Savings)
• Result is in years • Does not account for future investments and expenditures!
20 Year Net Present Cost: The TOTAL cost of owning the system over 20 years. • Only available for Options Comparison where total costs are entered • The higher the number, the more expensive the ECM is to own and operate.
20 Year Net Present Value: The total DIFFERENCE in cost between the ECM and the baseline over 20 years.
• Available for both Options and Savings Comparisons Formulas • Figure includes fixed costs in rates • The higher the number, the more savings the ECM will provide compared to the baseline. • Negative NPV means that it is more expensive to own the ECM than the baseline.

Harvard University
Life Cycle Cost Calculator
Output Basics – Overview
Basic Cost and Savings Metrics
Baseline 20 Year Net Present Cost $ 31,199
ALTERNATE 1 – VFD/ Occupancy Control of Ventilation Additional Investment $ 4,000
20 Year GHG Savings (MTCDE) 52 Simple Payback Analysis
Savings to University
Variable Cost Only
Annual Savings (FY12 rates) $597
Simple Payback Period (Years) 6.70
Return on Investment 14.9%

Harvard University
Life Cycle Cost Calculator
Output Basics – Financial Metrics
Analysis Metrics Savings to Investment Ratio (SIR) : 20 Year Investment Savings / 20 Year Costs
• If greater that 1.0, then project saves more than it costs over 20 years. • If less than 1.0, the project costs more than it saves over 20 years. • A rating of 2.0 would mean you save twice as much as you invest, 3.0 would mean you save three times as much as you invest, etc.
Return on Investment (ROI): (Annual Savings – Initial Investment) / Investment * 100 • Provides a value showing the percentage of savings earned beyond the initial investment. • A negative ROI shows that you’re losing money • A positive ROI shows that you’re savings exceed your initial investment • Does not account for future investments and expenditures!
Internal Rate of Return (IRR): Discount Rate at which 20 Year NPV would equal $0 • Assumed Discount Rate is 8.0%, so if value is equal to or lower than 8% than the project does not offer savings in present dollars. • Allows you to examine project viability if assumptions about the discount rate are adjusted.

Harvard University
Life Cycle Cost Calculator
Advanced Cost and Savings Metrics
ALTERNATE 1 – VFD/ Occupancy Control of Ventilation Life Cycle Cost Metrics
Savings to University
Variable Cost Only
20 Year Net Present Savings $2,956
20 Yr Savings to Investment Ratio 0.59
Discounted Payback Period See 'Net Savings' graph
Internal Rate of Return 15.7%
(5,000)
(4,000)
(3,000)
(2,000)
(1,000)
0
1,000
2,000
3,000
4,000
0 5 10 15 20
Net
Sa
vin
gs
Year
Net Savings: Discounted Payback Period

Harvard University
Life Cycle Cost Calculator
Output Basics – Greenhouse Gases
Analysis Metrics
20 year Cost / 20 year MTCDE: Result indicates a cost per ton reduction
•Lower costs mean better cost efficiency at reducing GHG emissions
NPV / Total GHG Reduction: Result indicates how much savings (or losses) a project incurs per ton of GHG
•Generally most useful for NPV negative projects, when it describes how much additional cost you’re paying per ton compared to the baseline.
Greenhouse Gas Metrics
Savings to
University
Variable Cost Only
Annual GHG Savings (MTCDE) 17.44
20 Year GHG Savings (MTCDE) 348.72
20 Yr Investment Cost / 20 Yr GHG $77
20 Yr Net Present Savings / 20 Yr GHG $85

Harvard University
Life Cycle Cost Calculator
Output Basics – Cost Isn’t Everything!
Analysis Metrics
Sometimes the most favorable project from an economic perspective is not the most favorable from a GHG reduction standpoint. As the campus gets more and more efficient, we will likely need to pursue GHG reduction projects with increasingly less favorable economic outcomes, though currently there are still many ECMs that result in both GHG and long
term cost savings.

Harvard University
Life Cycle Cost Calculator
Example – Savings Comparison
Upgrade Motor to Premium Efficiency? Existing 5HP fan is powered by a motor that runs year round and is only 85% efficient, and the building manager is considering upgrading to a motor that is 91% efficient. Baseline Cost - $0 New Motor Installed Cost - $2,500 Incentives available - $500 Equipment life for both existing and new motor is 15 years, but the existing motor costs 300 less than the new motor installed. Savings Anticipated: kWh =(.746*5*8760)/(.91-.85)= 2,354 kWh/year