Embed Size (px)
Citation preview

HARRINGTON PARK
BOARD OF EDUCATION
Harrington Park Board of Education Harrington Park, New Jersey
Comprehensive Annual Financial Report For The Fiscal Year Ended June 30, 2015

COMPREHENSIVE ANNUAL
FINANCIAL REPORT
of the
Harrington Park Board of Education
Harrington Park, New Jersey
For The Fiscal Year Ended June 30, 2015
Prepared by
Harrington Park Board of Education Finance Department

HARRINGTON PARK BOARD OF EDUCATION TABLE OF CONTENTS
Letter of Transmittal Organizational Chart Roster of Officials Consultants and Advisors
Independent Auditor's Report
INTRODUCTORY SECTION
FINANCIAL SECTION
Required Supplementary Information- Part I
Management's Discussion and Analysis
Basic Financial Statements
A. District-wide Financial Statements:
A-1 A-2
Statement of Net Position Statement of Activities
B. Fund Financial Statements:
Governmental Funds: B-1 Balance Sheet B-2 B-3
Statement of Revenues, Expenditures, and Changes in Fund Balances Illustrative Reconciliation of the Governmental Funds Statement of Revenues,
Expenditures, and Changes in Fund Balances with the District-Wide Statements
Proprietary Funds: B-4 Statement of Net Position B-5 B-6
Statement of Revenues, Expenses, and Changes in Net Position Statement of Cash Flows
Fiduciary Funds: B-7 Statement of Fiduciary Net Position
Notes to the Financial Statements
i-iii iv v
vi
1-3
4-17
18 19
20-21 22
23
24 25 26
28
29-62

HARRINGTON PARK BOARD OF EDUCATION TABLE OF CONTENTS
Required Supplementary Information- Part II
C. Budgetary Comparison Schedules
C-1 C-2
Budgetary Comparison Schedule - General Fund Budgetary Comparison Schedule- Special Revenue Fund
Notes to the Required Supplementary Information- Part II
C-3 Budgetary Comparison Schedule- Note to Required Supplementary Infonnation
Required Supplementary Information- Part fii
L. Schedules Related to Accounting and Reporting for Pensions (GASB 68)
L-1
L-2
L-3
Required Supplementary Information- Schedule of the District's Proportionate Share of the Net Pension Liability- Public Employees Retirement System
Required Supplementary Information- Schedule of District ContributionsPublic Employees Retirement System
Required Supplementary Information- Schedule of the District's Proportionate Share of the Net Pension Liability- Teachers Pension and Annuity Fund
Notes to Required Supplementary Information
D. School Level Schedules- Not Applicable
E. Special Revenue Fund:
E-1
E-2
Combining Schedule of Program Revenues and Expenditures Special Revenue Fund- Budgetary Basis
Schedule of Preschool Education Aid ExpendituresBudgetary Basis- Not Applicable
F. Capital Projects Fund:
F-1 Summary Statement of Project Expenditures F-2 Summary Schedule of Revenues, Expenditures and Changes in
Fund Balance- Budgetary Basis- Not Applicable F-2a Schedule of Project Revenues, Expenditures, Project Balance and
Project Status- Budgetary Basis- Boiler Replacement at Harrington Park Public School
G. Proprietary Funds:
Enterprise Fund: G-1 Statement of Net Position- Not Applicable G-2 Statement of Revenues, Expenses and Changes in
Net Position -Not Applicable G-3 Statement of Cash Flows -Not Applicable
63-68 69
70
71
72
73
74
75
76
77
78
79
80
80 80

HARRINGTON PARK BOARD OF EDUCATION TABLE OF CONTENTS
H. Fiduciary Funds:
I.
H-1 H-2 H-3 H-4
Combining Statement of Assets and Liabilities Combing Statement of Changes in Fiduciary Net Position -Not Applicable Student Activity Agency Fund Schedule of Receipts and Disbursements Payroll Agency Fund Schedule of Receipts and Disbursements
Long-Term Debt:
I-1 Schedule of Serial Bonds I-2 Schedule of Obligations Under Capital Leases- Not Applicable I-3 Debt Service Fund Budgetary Comparison Schedule
STATISTICAL SECTION (Unaudited)
J-1 Net Position by Component J-2 Changes in Net Position J-3 Fund Balances - Governmental Funds J-4 Changes in Fund Balances - Governmental Funds J-5 General Fund Other Local Revenue by Source J-6 Assessed Value and Actual Value of Taxable Property J-7 Direct and Overlapping Property Tax Rates J-8 Principal Property Taxpayers J-9 Property Tax Levies and Collections J-10 Ratios of Outstanding Debt by Type J-11 Ratios of Net General Obligation Debt Outstanding J-12 Direct and Overlapping Governmental Activities Debt J-13 Legal Debt Margin Information J-14 Demographic and Economic Statistics J-15 Principal Employers J-16 Full-Time Equivalent District Employees by Function/Program J-17 Operating Statistics J-18 School Building Information J-19 Schedule of Required Maintenance for School Facilities J-20 Insurance Schedule
SINGLE AUDIT SECTION
K-1 Report on Internal Control Over Financial Reporting and on Compliance and Other Matters Based on an Audit of Financial Statements Performed in Accordance With Government Auditing Standards
K-2 Report on Compliance for each Major State Program; Report on Internal Control Over Compliance; and Report on Schedule of Expenditures of State Financial Assistance as Required by New Jersey OMB Circular 15-08- Independent Auditor's Report
K-3 Schedule of Expenditures of Federal Awards
81 82 82 83
84 85 86
87 88 89 90 91 92 93 94 95 96 97 98 99
100 101 102 103 104 105 106
107-108
109-111
112

K-4
K-5
K-6
K-7
HARRINGTON PARK BOARD OF EDUCATION TABLE OF CONTENTS
SINGLE AUDIT SECTION (continued)
Schedule of Expenditures of State Financial Assistance
Notes to the Schedules of Expenditures of Federal Awards and State Financial Assistance
Schedule of Findings and Questioned Costs
Summary Schedule of Prior Audit Findings
113
114-1!5
116-118
119
INTRODUCTORY SECTION

HARRINGTON PARK SCHOOL DISTRICT
BOARD OF EDUCATION
Adam D. Fried, Ed. D. Superintendent/Board Secretary
December 19, 2015
Honorable President and Members of the Harrington Park Board of Education Harrington Park, New Jersey 07640
Dear Board Members:
Bryan .Jursca Business Administrator
The comprehensive annual financial report of the Harrington Park School District for the fiscal year ending June 30, 2015 is hereby submitted. Responsibility for both the accuracy of the data and completeness and fairness of the presentation, including all disclosures, rests with the management of the Board of Education (Board). To the best of our knowledge and belief, the data presented in this report is accurate in all material respects and is reported in a manner designed to present fairly the basic fmancial statements and results of operations of the District. All disclosures necessary to enable the reader to gain an understanding of the District's financial activities have been included.
The comprehensive annual financial report is presented in four sections: introductory, financial, statistical and single audit. The introductory section includes this transmittal letter, the District's organizational chart and a list of principal officials. The financial section includes the independent auditor's report, management discussion and analysis, the basic financial statements and notes. The statistical section includes selected financial and demographic information, generally presented on a multi-year basis. The District is required to undergo an annual single audit in conformity with the provisions of the State Treasury Circular Letter OMB 15-08, "Single Audit Policy for Recipients of Federal Grants, State Grants and State Aid Payments". Information related to this single audit, including the auditor's report on the internal control structure and compliance with applicable laws and regulations and findings and recommendations, are included in the single audit section of this report.
1. REPORTING ENTITY AND ITS SERVICES: Harrington Park School District is an independent reporting entity within the criteria adopted by the GASB as established by GASB Statement No. 14. All funds of the District are included in this report. The Han·ington Park Board of Education and its school constitute the District's reporting entity.
The District provides a full range of educational services appropriate to grade levels K through 8. These include regular, as well as special education for handicapped youngsters. The 2014-15 fiscal year enrollment was 633 students. The following details the changes in the student enrollment of the District over the last ten years.
i

Student Enrollment
Fiscal Student Percent Year Enrollment Change
2014-15 633.0 -0.63 2013-14 637.0 - 1.73 2012-13 648.0 -6.64 2011-12 691.0 +0.14 2010-11 690.0 -3.04 2009-10 711.6 - 1.30 2008-09 721.0 -2.30 2007-08 738.0 +3.65 2006-07 712.0 + 1.71 2005-06 700.0 +3.83
2. ECONOMIC CONDITION AND OUTLOOK: The Harrington Park area continues to experience development and expansion as new residential housing permits mostly for significant expansions or demolition of current homes which are replaced by larger residences. Also, the trend continues for longtime residents without children in the school system to sell to younger families with school-age children.
3. MAJOR INITIATIVES: During the 2014-15 academic year, the Harrington Park School District continued its long-term focus on improving students' performance in all academic areas. The District provided professional development opportunities for all staff members who are responsible for implementing new programs or curriculum.
4. FINANCIAL ACCOUNTING CONTROLS: Administrators of the District are responsible for establishing and maintaining an internal control structure designed to ensure that the assets of the District are protected from loss, theft or misuse, and to ensure that adequate accounting data is compiled to allow for the preparation of financial statements in conformity with generally accepted accounting principles (GAAP). The internal control structure is designed to provide reasonable, but not absolute, assurance that these objectives are met. The concept of reasonable assurance recognizes that:
(I) the cost of a control should not exceed the benefits likely to be derived; and (2) the valuation of costs and benefits requires estimates and judgments by management.
As a recipient of Federal and State financial assistance, the District also is responsible for ensuring that au adequate internal control structure is in place to ensure compliance with applicable laws and regulations related to those programs. The internal control structure is also subject to periodic evaluation by the District management.
As part of the District's single audit described earlier, tests are made to determine the adequacy of the internal control structure, including the portion related to federal aud state financial assistance programs, as well as to determine that the District has complied with applicable laws and regulations.
ii
5. BUDGETARY CONTROLS: In addition to internal accounting controls, the District maintains budgetary controls. The objective of these budgetary controls is to ensure compliance with legal provisions embodied in the annual appropriated budget approved by the voters of the municipality. Annual appropriated budgets are adopted for the general fund, the special revenue fund, and the debt service fund. Project-length budgets are approved for the capital improvements accounted for in the capital projects fund. The final budget amount as amended for the fiscal year is reflected in the financial section.
An encumbrance accounting system is used to record outstanding purchase commitments on a line item basis. Open encumbrances at year-end are either canceled or are included as re-appropriations of fund balance in the subsequent year. Those amounts to be re-appropriated are reported as reservations of fund balance at June 30,2015.
6. CASH MANAGEMENT: The investment policy of the District is guided in large part by state statute as detailed in "Notes to the Financial Statements". The District has adopted a cash management plan which requires it to deposit public funds in public depositories protected from loss under the provisions of the Governmental Unit Deposit Protection Act ("GUDPA"). GUDPA was enacted in 1970 to protect Governmental Units from a loss of funds on deposit with a failed banking institution in New Jersey. The law requires governmental units to deposit public funds only in public depositories located in New Jersey, where the funds are secured in accordance with the Act.
7. RISK MANAGEMENT: The Board carries various forms of insurance, including but not limited to general liability, automobile liability and comprehensive/collision, hazard and theft insurance on property and contents and fidelity bonds.
8. INDEPENDENT AUDIT: State statutes require an annual audit by independent certified public accountants or registered municipal accountants. The accounting firm of Lerch, Vinci & Higgins, LLP was selected by the Board. In addition to meeting the requirements set forth in State statutes, the audit also was designed to meet the requirements of the State Treasury Circular Letter OMB 15-08. The auditor's report on the basic financial statements and specific required supplemental information is included in the financial section of this report. The auditor's reports related specifically to the single audit are included in the single audit section of this report.
9. ACKNOWLEDGMENTS:
We would like to express our appreciation to the members of the Harrington Park School Board for their concern in providing fiscal accountability to the citizens and taxpayers of the school district and thereby contributing their full support to the development and maintenance of our financial operation. The preparation of this report could not have been accomplished without the efficient and dedicated services of our financial and accounting secretaries.
Respectfully submitted,
Adam D. Fried, Ed. D. Superintendent/Board Secretary
iii
B"f''K t.ltu'lma
Bryan Jursca Business Administrator
f"· <
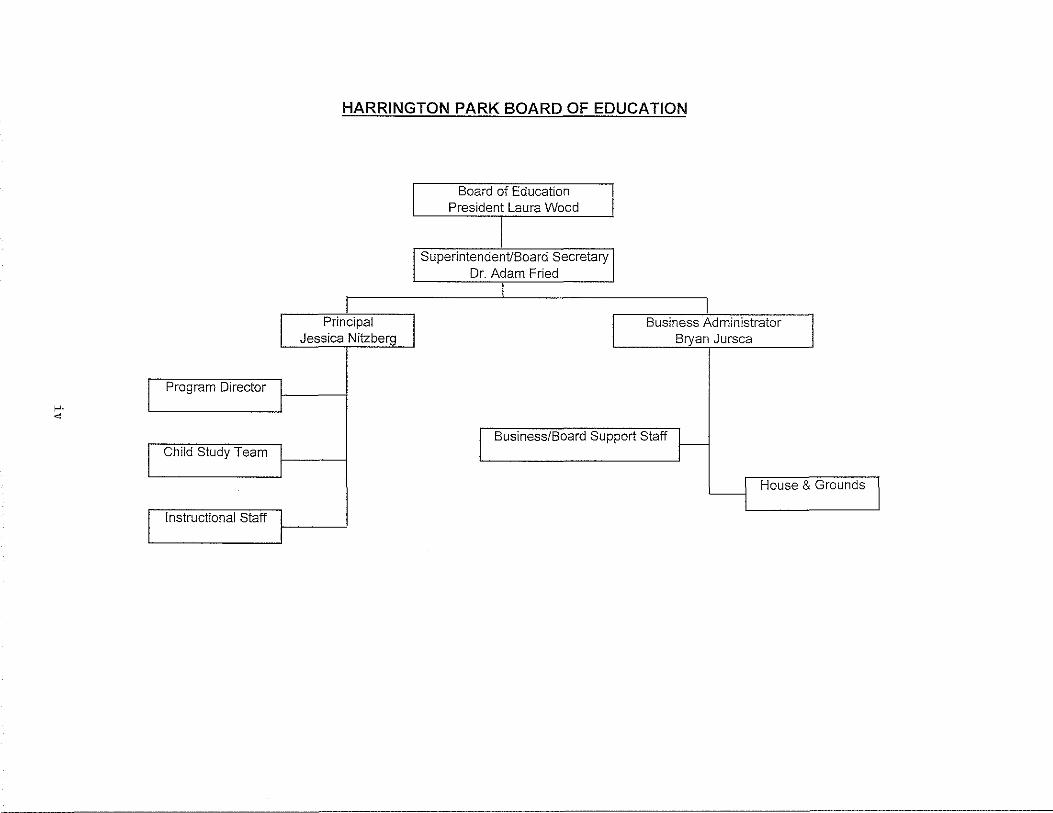
HARRINGTON PARK BOARD OF EDUCATION
l Board of Education President Laura Wood
l J
I Superintendent/Board Secretary_ I
Dr. Adam Fried
I
I Principal I
Jessica Nitzberg I Business Administrator
Bryan Jursca
I Program Direc:iol'] I
I Child Study Team -~ I I Business/Board Support Staff r-
J
y House & Grounds I
r Instructional Staff 1-1----'
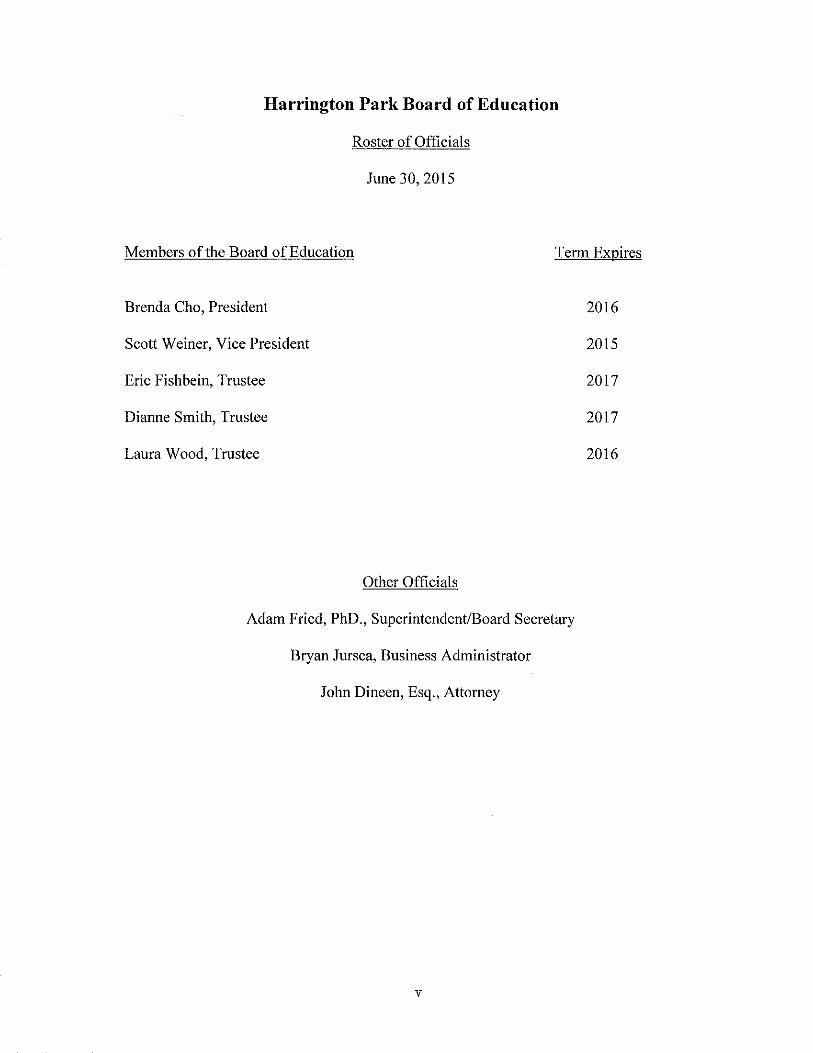
Harrington Park Board of Education
Roster of Officials
June 30,2015
Members of the Board of Education Term Expires
Brenda Cho, President
Scott Weiner, Vice President
Eric Fishbein, Trustee
Dianne Smith, Trustee
Laura Wood, Trustee
Other Officials
Adam Fried, PhD., Superintendent/Board Secretary
Bryan Jursca, Business Administrator
John Dineen, Esq., Attorney
v
2016
2015
2017
2017
2016

HARRINGTON PARK BOARD OF EDUCATION CONSULTANTS AND ADVISORS
Audit Firm
Lerch, Vinci & Higgins, LLP 17-17 Route 208
Fair Lawn, NJ 07410
Attorney
Netchert, Dineen & Hillman, Esq. 294 Harrington Ave., Suite 3
Closter, NJ 07624
Official Depository
Capital One Bank 600 Piermont Rd. Closter, NJ 07624
vi

FINANCIAL SECTION
LERCH, VINCI & HIGGINS,LLP CERTIFIED PUBLIC ACCOUNTANTS REGISTERED MUNICIPAL ACCOUNTANTS
DIETER P. LERCH, CPA, RMA, PSA
GARY J. VINCI, CPA, RMA, PSA
GARY W. HIGGINS, CPA, RMA, PSA
JEFFREY C. BLISS, CPA, RMA, PSA
PAULl. LERCH, CPA, RMA, PSA
DONNA L. JAPHET, CPA, PSA
JULIUS B. CONSONJ, CPA, PSA
ELIZABETH A. SHICK, CI'A, RMA, PSA
ANDREW PARENTE, CPA, RMA, PSA
ROBERT W. HAAG, CPA, PSA
DEBORAH K. LERCH, CPA, PSA
RALPH M. PICONE , CPA, RMA, PSA
Honorable President and Members of the Board ofEducation
Harrington Park Board of Education Harrington Park, New Jersey
Report on the Financial Statements
INDEPENDENT AUDITOR'S REPORT
DEBRA GOLLE, CPA
CINDY JANACEK, CPA, RMA
MARK SACO, CPA
SHERYL M. NI COLOSI, CPA
KATHLEEN WANG, CPA
ROBERT AMPONSAH, CPA
We have audited the accompanying financial statements of the governmental activities, the business-type activities, each major fund, and the aggregate remaining fund information of the Harrington Park Board of Education as of and for the fiscal year ended June 30, 2015 and the related notes to the financial statements, which collectively comprise the Board of Education's basic financial statements as listed in the table of contents.
Management's Responsibility for the Financial Statements
Management is responsible for the preparation and fair presentation of these financial statements in accordance with accounting principles generally accepted in the United States of America; thi s includes the des ign, implementation, and maintenance of internal control relevant to the preparation and fair presentation of financial statements that are free from material misstatement, whether due to fraud or error. ·
Auditor's Responsibility
Our responsibility is to express opinions on these financial statements based on our audit. We conducted our audit in accordance with auditing standards generally accepted in the United States of America, the standards applicable to financial audits contained in the Government Auditing Standards, issued by the Comptroller General of the United States and audit requirements as prescribed by the Office of School Finance, Department of Education, State of New Jersey. Those standards require that we plan and perform the audit to obtain reasonable assurance about whether the financial statements are free of material misstatement.
An audit involves performing procedures to obtain audit evidence about the amounts and disclosures in the financial statements. The procedures selected depend on the auditor 's judgment, including the assessment of the risks of material misstatement of the financial statements, whether due to fraud or error. In making those risk assessments, the auditor considers internal control relevant to the entity' s preparation and fair presentation of the financial statements in order to design audit procedures that are appropriate in the circumstances, but not for the purpose of expressing an opinion on the effectiveness of the entity' s internal control. Accordingly, we express no such opinion. An audit al so includes evaluating the appropriateness of accounting policies used and the reasonableness of significant accounting estimates made by management, as well as evaluating the overall presentation of the financial statements.
We believe that the audit evidence we have obtained is sufficient and appropriate to provide a basis for our audit opinions.
17-17 ROUTE 208•FATR LAWN, NJ 07410<'> TELEPHONE <201) 791 -7100 "FACSIMILE (201) 79 1-3035
WWW.LVHfPA.COM

Opinions
In our opinion, the financial statements referred to above present fairly, in all material respects, the respective financial position of the governmental activities, the business-type activities, each major fund, and the aggregate remaining fund information of the Harrington Park Board of Education as of June 30, 2015, and the respective changes in financial position and, where applicable, cash flows thereof for the fiscal year then ended in accordance with accounting principles generally accepted in the United States of America.
Emphasis of Matter
Adoption of New Accounting Pronouncement
As discussed in Note l to the financial statements, in the fiscal year ended June 30, 2015, the Harrington Park Board of Education adopted new accounting guidance, Governmental Accounting Standards Board Statement No. 68, Accounting and Financial Reporting for Pensions. Our opinion is not modified with respect to this matter.
Other Matters
Required Supp/ementmy Information
Accounting principles generally accepted in the United States of America require that the management's discussion and analysis, budgetary comparison information, and pension information be presented to supplement the basic financial statements. Such information, although not a part of the basic financial statements, is required by the Governmental Accounting Standards Board, who considers it to be an essential part of financial reporting for placing the basic financial statements in an appropriate operational, economic, or historical context. We have applied certain limited procedures to the required supplementary information in accordance with auditing standards generally accepted in the United States of America, which consisted of inquiries of management about the methods of preparing the information and comparing the information for consistency with management's responses to our inquiries, the basic financial statements, and other knowledge we obtained during our audit of the basic financial statements. We do not express an opinion or provide any assurance on the information because the limited procedures do not provide us with sufficient evidence to express an opinion or provide any assurance.
Other Information
Our audit was conducted for the purpose of forming opinions on the financial statements that collectively comprise the Harrington Park Board of Education's basic financial statements. The introductory section, combining fund financial statements, financial schedules, statistical section, schedule of expenditures of federal awards and schedule of expenditures of state financial assistance as required by New Jersey OMB Circular 15-08, Single Audit Policy for Recipients of Federal Grants, State Grants and State Aid, are presented for purposes of additional analysis and are not a required part of the basic financial statements of the Harrington Park Board of Education.
The combining fnnd financial statements, schedule of expenditures of federal awards and schedule of expenditures of state financial assistance are the responsibility of management and were derived from and relate directly to the underlying accounting and other records used to prepare the basic financial statements. Such information has been subjected to the auditing procedures applied in the audit of the basic financial statements and certain additional procedures, including comparing and reconciling such information directly to the underlying accounting and other records used to prepare the basic financial statements or to the basic financial statements themselves, and other additional procedures in accordance with auditing standards generally accepted in the United States of America. In our opinion, the combining fund financial statements, schedules of expenditures of federal awards and state financial assistance are fairly stated in all material respects in relation to the basic financial statements as a whole.
2

The introductory section, financial schedules and statistical section have not been subjected to the auditing procedures applied in the audit of the basic financial statements and, accordingly, we do not express an opinion or provide any assurance on them.
Other Reporting Required by Government Auditing Standards
In accordance with Government Auditing Standards, we have also issued our report dated December 19, 2015 on our consideration of the Harrington Park Board of Education ' s internal control over financial reporting and on our tests of its compliance with certain provisions of laws, regulations, contracts, and grant agreements and other matters. The purpose of that report is to describe the scope of our testing of internal control over fmancial reporting and compliance and the results of that testing, and not to provide an opinion on internal control over fmancial reporting or on compliance. That report is an integral part of an audit performed in accordance with Government Auditing Standards in considering the Harrington Park Board of Education's internal control over financial reporting and compliance.
Fair Lawn, New Jersey December 19,2015
~::~~r~j~ Certified Public Accountants
3

MANAGEMENT'S DISCUSSION AND ANALYSIS
HARRINGTON PARK BOARD OF EDUCATION
Management's Discussion and Analysis
Year Ended June 30,2015
This section of the Harrington Park Board of Education's annual financial report presents our discussion and analysis of the District's financial performance during the fiscal year that ended on June 30, 2015. Please read it in conjunction with the transmittal letter at the front of this report and the District's financial statements, which immediately follows this section.
The Management's Discussion and Analysis (MD&A) is an element of Required Supplementary Information specified in the Governmental Accounting Standard Board's (GASB) Statement No. 34- Basic Financial Statements- and Management's Discussion and Analysis - for State and Local Governments. Certain comparative information between the current year (2014-2015) and the prior year (2013-2014) is required to be presented in the MD&A.
FINANCIAL HIGHLIGHTS
Key financial highlights for the 2014-2015 fiscal year include the following:
• The assets and deferred outflows of resources of the Harrington Park Board of Education exceeded its liabilities and deferred inflows of resources at the close of the fiscal year by $3,595,234 (net position).
• The District's total net position increased $341,574. • Overall District revenues were $14,044,936 which were $341,574 more than
overall District expenses of $13,703,362. General revenues accounted for $11,100,728 or 79% of all revenues. Program specific revenues in the form of charges for services, grants and contributions account for $2,944,208 or 21% of total revenues.
• The School District had $13,682,897 in expenses for governmental activities; only $2,924,234 of these expenses were offset by program specific charges, grants or contributions. General revenues (predominantly property taxes) of $11,100,728 were adequate to provide for these programs.
• As of the close of the current fiscal year, the District's governmental funds reported combined ending fund balances of $1,866,569. Of that amount, $224,304 (12%) is available for spending at the District's discretion (unassigned fund balance).
• The General Fund unassigned fund balance was $224,304 at June 30, 2015, is a decrease of$1,760 when compared with the beginning balance at July 1, 2014.
• The General Fund unassigned budgetary basis fund balance at June 30, 2015 was $512,172, which represents a decrease of $33,036 compared to the ending budgetary basis fund balance at June 30, 2014 of $545,208.
4

HARRINGTON PARK BOARD OF EDUCATION
Management's Discussion and Analysis
Year Ended June 30,2015
OVERVIEW OF THE FINANCIAL STATEMENTS
The financial section of the annual report consists of four parts- Independent Auditor's Report, required supplementary information which includes the management's discussion and analysis (this section), the basic financial statements, and supplemental information. The basic financial statements include two kinds of statements that present different views of the District:
• The first two statements are district wide financial statements that provide both short-term and long-term information about the District's overall financial status.
• The remaining statements are fund financial statements that focus on individual parts of the District, reporting the District's operations in more detail than the district-wide statements.
• The governmental funds statements tell how basic services were financed in the short term as well as what remains for future spending
• Proprietary funds statements offer short-term and long-term financial information about the activities the district operated like businesses.
• Fiduciary funds statements provide information about the financial relationships in which the District acts solely as a trustee or agent for the benefit of others to whom the resources belong.
The basic financial statements also include notes that explain some of the information in the statements and provide more detailed data. The Figure below shows how the various parts ofthis annual report are arranged and related to one another.
Management's Basic Discussion and Analysis - Financial
Statements
I I
District-Wide Fund Notes to the Financial Financial Financial
Statements Statements Statements
Summary ~~ ~~ Detail
5

HARRINGTON PARK BOARD OF EDUCATION
Management's Discussion and Analysis
Year Ended June 30,2015
The following table summarizes the major features of the District's financial statements, including the portion of the District's activities they cover and the types of information they contain. The remainder of this overview section of management's discussion and analysis highlights the structure and contents of each of the statements.
M' F a.1or eatures o t e 1stnct-f h D' W'd I e an dF d un Fmancml s tatements District-Wide Statements Fund Financial Statements
Governmental Funds Proprietary Funds Fiduciary Funds
Scope Entire district The activities of the Activities the district Instances in which (except fiduciary district that are not operates similar to the district funds) proprietary or fiduciary, private businesses; food administers
such as instruction; service. resources on behalf building maintenance, of someone else, transportation, and such as administration. scholarship,
donations, student activities, and payroll deductions.
Required Financial Statements ofNet Balance Sheet Statement of Net Statements of Statements Position Statement of Revenues, Position Fiduciary Net
Statement of Expenditures and changes Statement of Revenues, Position Activities in Fund Balances Expenses and changes Statement of
in Fund Net Position changes in Statement of Cash Fiduciary Net Flows Position
Accounting Basis Accrual accounting Modified accrual Accrual accounting and Accrual accounting
and Measurement and economic accounting and current economic resources and economic Focus resources focus financial focus focus resources focus Type of All assets, liabilities, Generally assets expected All assets, liabilities All assets and Asset/Liability and deferred to be used up and and deferred liabilities both Information outflows/inflows of liabilities that come due outflows/inflows of short and long-term
resources, both during the year or soon resources, both funds do not financial and capital, there after; no capital financial and capital, currently contain short-term and long- assets or long-term short-term and long- capital assets term liabilities included term although they can
Type of All revenues and Revenues for which cash All revenues and All additions and
Inflow/Outflow expenses during the is received during or soon expenses during the dedications during
Information year, regardless of after the end of the year; year, regardless of the year, regardless when cash is expenditures when goods when cash is received of when cash is received and the or services have been or paid. received or paid. related liability is received and the related due and payable liability is due and
payable.
6

HARRINGTON PARK BOARD OF EDUCATION
Management's Discussion and Analysis
Year Ended June 30, 2015 District-wide Statements
The district-wide statements report information about the District as a whole using accouoting methods similar to those used by private-sector companies. The statement of net position includes all of the district's assets, liabilities and deferred outflows/inflows of resources. All of the current year's revenues and expenses are accounted for in the statement of activities regardless of when cash is received or paid.
The two district-wide statements report the Districts net position and how they have changed. Net position - the difference between the District's assets, deferred outflows and liabilities, deferred inflows - is one way to measure the District's financial health or position.
• Over time, increases or decreases in the District's net position are an indicator of whether its financial position is improving or deteriorating, respectively.
• To assess the overall health of the District you need to consider additional nonfinancial factors such as changes in the District's property tax base and the condition of school buildings and other facilities.
In the District-wide financial statement's the District's activities are shown m two categories:
• Governmental activities- Most of the District's basic services are included here, such as instruction, support services, operations and maintenance of plant facilities, pupil transportation and extracurricular activities. Property taxes and State and Federal aids finance most of these activities.
• Business-type activities - The District charges fees to customers to help it cover the costs of certain services it provides. The District's Special Milk Program Fund is included here.
Fund Financial Statements
The fuod financial statements provide more detailed information about the District's funds - focusing on its most significant or "major" fuods - not the district as a whole. Fuods are accounting devices the District uses to keep track of specific sources of funding and spending on particular programs.
7

HARRINGTON PARK BOARD OF EDUCATION
Management's Discussion and Analysis
Year Ended June 30, 2015 The District has three kinds of funds:
•
•
Governmental funds - Most of the District's basic services are included in governmental funds, which generally focus on (1) how cash and other financial assets that can readily be converted to cash, flow in and out and (2) the balances left at year-end that are available for spendin15. Consequently, the governmental funds statements provide a detailed short-term view that lielps to determine whether there are more or fewer financial resources that can be spent in the near future to finance the District's programs. Because this information does not encompass the additional long-term focus of the District-wide statements, we provide additional information at the bottom of the governmental funds statements that explain the relationship (or differences) between them.
Proprietary funds - Services for which the District charges a fee are generally reported in proprietary funds. Proprietary funds are reported in the same way as the District-wide statements.
o Enterprise Funds - This fund is established to account for operations that are financed and operated in a manner similar to private business enterprises. The stated intent is that costs of providing goods or services to the students on a continuing basis are financed or recovered primarily through user charges. The Distnct currently has one enterprise fund for its food service operations.
• Fiduciary funds - The District is the trustee, or fiduciary, for assets held in trust for State unemployment insurance claims, joint purchasing contributions for the early warning lightning detection system, payroll and payroll agency funds, and student activity funds. The District is responsible for ensunng that the assets reported in these funds are used for their intended purposes. All of the District's fiduciary activities are reported in a separate statement of fiduciary net position and a statement of changes in fiduciary net position. We exclude these activities from the District's governmentwide financial statements because the District cannot use these assets to finance its operations.
Notes to the Financial Statements
The notes provide additional information that is essential to a full understanding of the data provided in the district-wide and fnnd financial statements. The notes to the financial statements can be found following the financial statements.
Other Information
In addition to the basic financial statements, this report also presents certain required supplementary information concerning the District's budget process. The District adopts an annual expenditure budget for the general, special revenue and debt service funds. Budgetary comparison statements have been provided for the general and special revenue funds as required supplementary information. The required supplementary information can be found following the notes to the financial statements.
Combining statements and schedules are presented immediately following the major budgetary comparisons.
8

HARRINGTON PARK BOARD OF EDUCATION
Management's Discussion and Analysis
Year Ended June 30, 2015 FINANCIAL ANALYSIS OF THE DISTRICT AS A WHOLE
The district's financial position is the product of several financial transactions including the net results of activities, the acquisition and payment of debt, the acquisition and disposal of capital assets, and the depreciation of capital assets.
The following provides a summary of the school district's net position. The District's combined net position were $3,595,234 and $3,253,660 on June 30, 2015 and 2014, respectively.
Assets Current and other assets Capital assets Total assets
Deferred Outflow of Resources
Total Assets and Defe1·red Outflows of Resources
Liabilities CuiTent liabilities Noncurrent liabilities
Total liabilities
Deferred Inflow of Resources
Total Liabilities and Deferred Inflows
of Resources
Net Position
$
Table I Net Position
Governmental Tv pes
2015 2014
2,223,186 $ 7,434,367 9,657,553
387,510
10,045,063
403,733 5,853,244 6,256,977
198,454
6,455,431
1,731,865 $ 7,504,307
9,236,172
9,236,172
120,235 5,868,370 5,988,605
5,988,605
BusinesswType Activities
2015 2014
3,303 $ 2,226,439 $ 3,253 $ 2,349 __ ,2,'-'79020 7,436,716 5,602
5,602
__ ,6,"'09c:_3 9,663, !55
387,510
__ ,6,"'09c:_3 10,050,665
403,733 5,853,244 6,256,977
198,454
6,455,431
1,735,168 7,507,097 9,242,265
9,242,265
120,235 5,868,370 5,988,605
5,988,605
Net Investment in Capital Assets Restricted Unrestricted
5,064,058 558,360
(2,032,786)
4,805,127 575,001
(2,132,561)
2,349 2,790
3,253 3,303
5,066,407 558,360
(2,029,533)
4,807,917 575,001
(2,129,258)
Total net position $ 3,589,632 $ 3,247,567 $ 5,602 ~$ ~~6,~09:,;:.3 $ 3,595,234 $ 3,253,660
By far the largest portion of the District's net position reflects its investment in capital assets (e.g., land and improvements, buildings and improvements, vehicles, furniture and equipment); less any related debt used to acquire those assets that are still outstanding. The District uses these capital assets to provide services to its students; consequently, these assets are not available for future spending. Although the District's investment in its capital assets is reported net of related debt, it should be noted that the resources needed to repay this debt must be provided from other sources, since the capital assets themselves cannot be used to liquidate these liabilities.
9

HARRINGTON PARK BOARD OF EDUCATION
Management's Discussion and Analysis
Year Ended June 30, 2015
The following shows changes in net position for fiscal years 2015 and 2014.
Table 2 Changes in Net Position
Governmental Business-Type Types Activities Total
2015 2014 2015 2014 2015 2014 Revenues Program revenues
Charges for services and sales $ 31,603 $ 13,592 $ 12,673 $ 12,180 $ 44,276 $ 25,772 Operating grants and contributions 2,814,871 1,528,619 7,301 7,014 2,822,172 I ,535,633 Capital grants and contributions 77,760 77,760
General revenues Property taxes, levied for
general purposes 10,511,796 10,112,096 10,511,796 10,112,096 Property taxes levied for debt service 398,722 399,006 398,722 399,006 Federal and State Aid Not Restricted 27,218 24,967 27,218 24,967 Other 162,992 108,765 162,992 108,765
Total revenues 14,024,962 12,187,045 19,974 19,194 14,044,936 12,206,239
Program Expenses Instruction Regular 5,712,168 4,854,990 5,712,168 4,854,990
Special Education 3,266,950 2,853,907 3,266,950 2,853,907
Other Instruction 131,207 139,432 131,207 139,432 School Sponsored Activities and Athletics 144,791 153,697 144,791 153,697
Support services Student and Instruction Related Services 1,744,656 1,578,732 1,744,656 1,578,732 General Administration Services 496,322 479,183 496,322 479,183 School Administration Services 338,671 280,728 338,671 280,728 Business/Central Services 321,499 289,350 321,499 289,350 Administrative Information Technology 46,408 41,786 46,408 41,786 Operation and Maintenance of Facilities 1,283,846 1,259,132 1,283,846 1,259,132 Pupil Transportation 89,243 131,349 89,243 131,349
Debt Service Interest and Other Charges 107,136 121,501 107,136 121,501
Food Service 20,465 22, Ill 20,465 22,111
Total expenses 13,682,897 12,183,787 20,465 22,111 13,703,362 12,205,898
Change in Net Position 342,065 3,258 (491) (2,917) 341,574 341
Net Position, Beginning of Year 3,247,567 6,308,829 6,093 9,010 3,253,660 6,317,839
Prior Period Adjustment (3,064,520) (3,064,520)
Net Position, End of Year $ 3,589,632 $ 3,247,567 $ 5,602 $ 6,093 $ 3,595,234 $ 3,253,660
10

HARRINGTON PARK BOARD OF EDUCATION
Management's Discussion and Analysis
. Year Ended June 30, 2015
Governmental Activities. The District's total govemmental activities' revenues, which includes State and Federal grants, were $14,024,962 for the year ended June 30, 2015, property taxes of $10,910,518 represented 78% of revenues. Another significant potiion of revenues came from State aid; total State, Federal and Local Aid and Grants were $2,919,849 and represented 21% of revenues. In addition, revenue is earned from tuition and miscellaneous income which includes items such as interest, prior year refunds and other miscellaneous items.
The total cost of all governmental activities programs and services was $13,682,897. The district's expenses are predominantly related to educating and caring for students. Instruction totaled $9,255,116 (68%) oftotal expenses. Support services, total $4,320,645 (32%) of total expenses. The remaining expenses were for interest costs on long-term debt outstanding.
Total govetnmental activities revenues exceeded expenses, increasing net position by $342,065 from the previous year.
Revenues by Type - Governmental Activities For Fiscal Year 2015
Federal, State,
Local Aid and Grants
21%
Other 1%
11
Property Tax Levy
78%

HARRINGTON PARK BOARD OF EDUCATION
Management's Discussion and Analysis
Plant Oper. & Maint. 9%
Other 1%
Pupil Trans portation
1%
Year Ended June 30, 2015
Expenses by Type - Governmental Activities For Fiscal Year 2015
Student and Instruction
Related
Services 13% --=.,..-..---~---
School, General & Central
Administration 8%
Instruction 68%
Net Cost of Governmental Activities. The District's total cost of services was $13,682,897. After applying program revenues, derived from operating grants and contributions of$2,924,234 the net cost of services ofthe District is $10,758,663.
12

HARRINGTON PARK BOARD OF EDUCATION
Management's Discussion and Analysis
Year Ended June 30, 2015 Total and Net Cost of Governmental Activities
for the Fiscal Years Ended June 30,2015 and 2014
Total Cost of Services Net Cost of Services 2015 2014 2015 2014
Instruction Regular $ 5,712,168 $ 4,854,990 $ 4,188,447 $ 4,205,293
Special Education 3,266,950 2,853,907 2,327,670 2,182,673
Other Instruction 131,207 139,432 94,218 90,522
School Sponsored Activities and Athletics 144,791 153,697 144,791 153,697
Support Services Student and Instruction Related Services 1,744,656 1,578,732 1,491,581 1,459,994
General Administration Services 496,322 479,183 496,322 479,183
School Administration Services 338,671 280,728 268,736 252,079
Central Services 321,499 289,350 321,499 289,350
Administrative Info Tech 46,408 41,786 46,408 41,786
Operation and Maintenance of Facilities 1,283,846 1 ,259,132 1' 196,560 1,249,551
Pupil Transportation 89,243 131,349 84,000 125,378 Interest on Debt 107,136 121,501 98,431 112,070
Total $ 13,682,897 $ 12,183,787 $ 10,758,663 $ 10,641,576
Business-Type Activities The cost of Business-Type Activities for the fiscal year ended June 30, 2015 was $20,465. These costs were funded by charges for services of $12,673 (63%) and operating grants of $7,301 (37%), as detailed in the change in net position schedule.
Total business-type activities expenses exceeded revenues, decreasing net position by $491 over the previous year.
FINANCIAL ANALYSIS OF THE DISTRICT'S FUNDS
The financial performance of the District as a whole is reflected in its governmental funds as well. As the District completed the year, its governmental funds reported a combined fund balance of $1,866,569 at June 30, 2015 compared to a combined fund balance of . $1,665,015 at June 30, 2014.
Revenues for the District's governmental funds were $12,942,718, while total expenditures were $12,741,164.
13
HARRINGTON PARK BOARD OF EDUCATION
Management's Discussion and Analysis
Year Ended June 30, 2015 GENERAL FUND
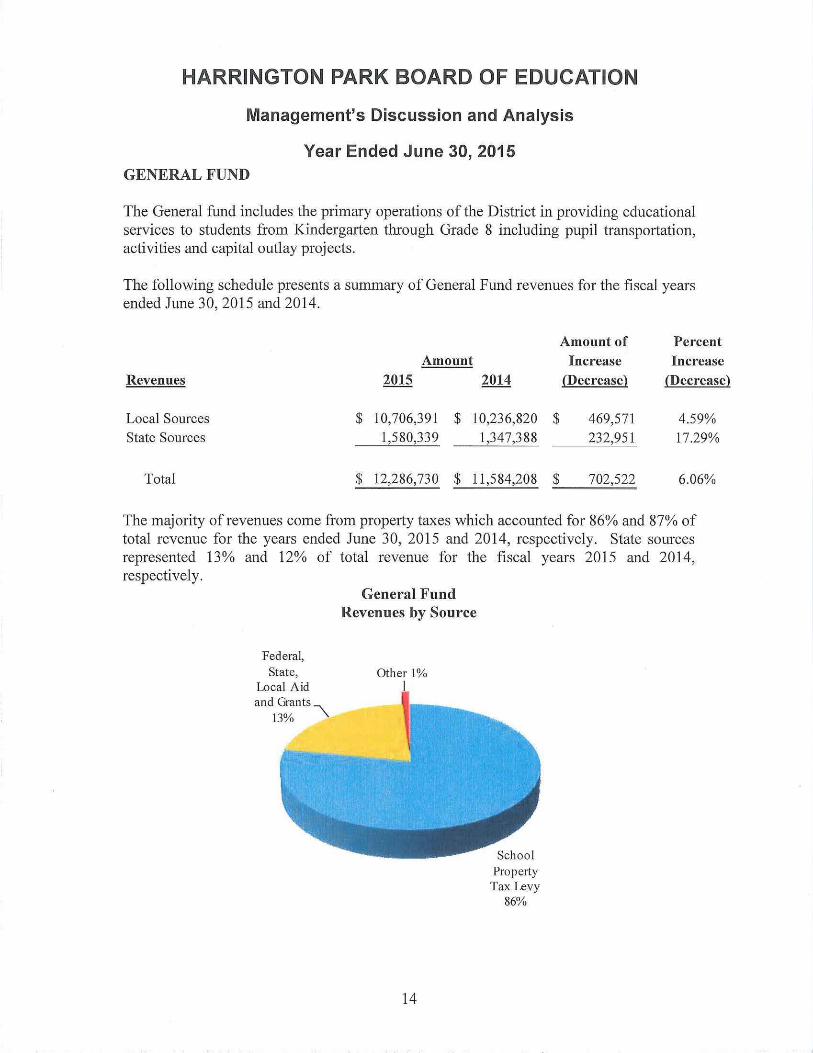
The General fund includes the primary operations of the District in providing educational services to students from Kindergarten through Grade 8 including pupil transportation, activities and capital outlay projects.
The following schedule presents a summary of General Fund revenues for the fiscal years ended June 30, 2015 and 2014.
Amount of Percent Amount Increase Increase
Revenues 2015 2014 (Decrease) (Decrease)
Local Sources $ 10,706,391 $ 10,236,820 $ 469,571 4.59% State Sources 1,580,339 1,347,388 232,951 17.29%
Total $ 12,286,730 $ 11,584,208 $ 702,522 6.06%
The majority of revenues come from property taxes which accounted for 86% and 87% of total revenue for the years ended June 30, 2015 and 2014, respectively. State sources represented 13% and 12% of total revenue for the fiscal years 2015 and 2014, respectively.
Federal, State,
Local Aid and Grants'--
13%
General Fund Revenues by Source
Other 1%
14
Prope1ty Tax Levy
86%
HARRINGTON PARK BOARD OF EDUCATION
Management's Discussion and Analysis
Year Ended June 30, 2015 Amount of Percent
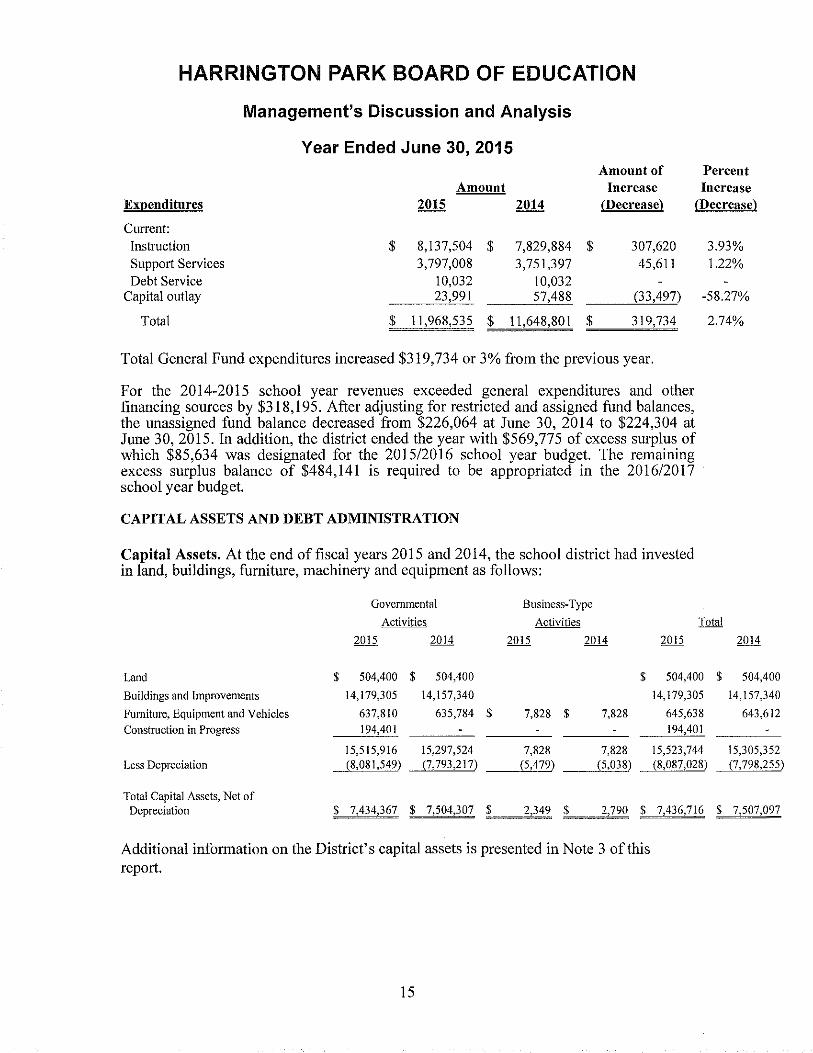
Amount Increase Increase Ex11enditures 2015 2014 (Decrease} (Decrease}
Current: Instruction $ 8,137,504 $ 7,829,884 $ 307,620 3.93% Support Services 3,797,008 3,751,397 45,611 1.22% Debt Service 10,032 10,032
Capital outlay 23,991 57,488 (33,497) -58.27%
Total $ 11,968,535 $ 11,648,801 $ 319,734
Total General Fund expenditures increased $319,734 or 3% from the previous year.
For the 2014-2015 school year revenues exceeded general expenditures and other financing sources by $318,195. After adjusting for restricted and assigned fund balances, the unassigned fund balance decreased from $226,064 at June 30, 2014 to $224,304 at June 30, 2015. In addition, the district ended the year with $569,775 of excess surplus of which $85,634 was designated for the 2015/2016 school year budget. The remaining excess surplus balance of $484,141 is required to be appropriated in the 2016/2017 school year budget.
CAPITAL ASSETS AND DEBT ADMINISTRATION
Capital Assets. At the end of fiscal years 2015 and 2014, the school district had invested in land, buildings, furniture, machinery and equipment as follows:
Governmental Business-Type
2.74%
Activities Activities Total
2015 2014 2015 2014
Land $ 504,400 $ 504,400 $
Buildings and Improvements 14,179,305 14,157,340
Furniture, Equipment and Vehicles 637,810 635,784 $ 7,828 $ 7,828 Construction in Progress 194,401
15,515,916 15,297,524 7,828 7,828 Less Depreciation (8,081,549) (7,793,217) (5,479) (5,038)
Total Capital Assets, Net of Depreciation $ 7,434,367 $ 7,504,307 $ 2,349 $ 2,790 $
Additional information on the District's capital assets is presented in Note 3 of this report.
15
2015 2014
504,400 $ 504,400
14,179,305 14,157,340
645,638 643,612 194,401
15,523,744 15,305,352 (8,087,028) (7,798,255)
7,436,716 $ 7,507,097

HARRINGTON PARK BOARD OF EDUCATION
Management's Discussion and Analysis
Year Ended June 30, 2015 Debt Administration. As of June 30, 2015 and 2014 the school district had long-term debt and outstanding long-term liabilities in the amount of $5,853,244 and $5,868,100 as follows:
Outstanding Long-Term Liabilities As of June 30, 2015 and 2014
Serial Bonds Payable Capital Leases Payable Net Pension Liability Compensated Absences
Total
$ 2,342,000 $ 28,309
3,330,066 152,869
$ 5,853,244 $
2,662,000 37,180
3,064,250 104,670
5,868,100
Additional information on the District's long-term liabilities is presented in Note 3 of this report.
GENERAL FUND BUDGETARY HIGHLIGHTS
General Fund budgetary basis revenues and other financing sources exceeded budgetary basis expenditures increasing budgetary basis fund balance by $286,919 from the previous year. After deducting restricted and designated fund balances, the unassigned budgetary fund balance decreased $33,036 from $545,208 at June 30,2014 to $512,172 at June 30, 2015. In addition, the District has established a capital reserve and a maintenance reserve in the amounts of$550,001 and $125,000, respectively. In addition, the District ended the year with excess surplus of$569,775. Ofthis amount, $85,634 was the excess resulting from the prior 2013/2014 school year and the remaining $484,141 was the excess resulting from the current 2014/2015 school year. In accordance with State regulations, the District appropriated the $85,634 of excess surplus for use in 2015/2016 school year budget as required.
ECONOMIC FACTORS AND NEXT YEAR'S BUDGET
While many factors influence the District's future, the availability of State funding, special education needs, capital improvements, student enrollment and the economy will have the most impact on educational and fiscal decisions in the future.
Many factors were considered by the District's administration during the process of developing the fiscal year 2015-2016 budget. The primary factors were the District's projected student population, anticipated state and federal aid, contractual salary and related benefit cost increases, as well as, increased special education tuition costs.
These indicators were considered when adopting the budget for fiscal year 2015-2016. Budgeted expenditures in the General Fund increased approximately 6% to $12,208,556 for fiscal year 2015-2016.
16
HARRINGTON PARK BOARD OF EDUCATION
Management's Discussion and Analysis
Year Ended June 30,2015
CONTACTING THE DISTRICT'S FINANCIAL MANAGEMENT
This financial report is designed to provide our citizens, taxpayers, customers, and investors and creditors with a general overview of the District's finances and to demonstrate the District's accountability for the money it receives. If you have questions about this report or need additional financial information contact the Business Office, Harrington Park Board of Education, Administrative Offices, 191 Harriot A venue, Harrington Park, New Jersey 07640
17

BASIC FINANCIAL STATEMENTS

EXHIBIT A-1
HARRINGTON PARK BOARD OF EDUCATION STATEMENT OF NET POSITION
AS OF JUNE 30, 2015
Governmental Business-Type Activities Activities Total
ASSETS
Cash and Cash Equivalents $ 1,875,030 $ 2,819 $ 1,877,849 Receivables, net 348,156 434 348,590 Capital Assets, net Not Being Depreciated 698,801 698,801 Being Depreciated 6,735,566 2,349 6,737,915
Total Assets 9,657,553 5,602 9,663,155
DEFERRED OUTFLOWS OF RESOURCES Deferred Amounts on Net Pension Liability 387,510 387,510
Total Deferred Outflows of Resources 387,510 387,510
Total Assets and Deferred Outflows of Resources 10,045,063 5,602 10,050,665
LIABILITIES
Accounts Payable and Other Current Liabilities 204,373 204,373 Accrued Interest Payable 47,116 47,116 Unearned Revenue 152,244 152,244 Noncurrent Liabilities
Due within one year 502,302 502,302 Due beyond one year 5,350,942 5,350,942
Total Liabilities 6,256,977 6,256,977
DEFERRED INFLOWS OF RESOURCES Deferred Amounts on Net Pension Liability 198,454 198,454
Total Deferred Inflows of Resources 198,454 198,454
Total Liabilities and Deferred Inflows of Resources 6,455,431 6,455,431
NET POSITION
Net Investment in Capital Assets 5,064,058 2,349 5,066,407 Restricted for
Capital Projects 433,360 433,360 Maintenance Reserve 125,000 125,000
Unrestricted (2,032, 786) 3,253 (2,029,533)
Total Net Position $ 3,589,632 $ 5,602 $ 3,595,234
The accompanying Notes to the Financial Statements are an integral part of this statement.
18

EXHIBIT A~2
HARRINGTON PARK BOARD OF EDUCATION STATEMENT OF ACTIVITIES
FOR THE FISCAL YEAR ENDED JUNE 30, 2015 Net (Expenses) Revenues and
Program Re,·enues Changes in Net Position Operating Capital
Charges for Grants and Grants and Governmental Business~ Type Functions/Programs Expenses Services Contributions Contributions Activities Activities Total
Governmental Activities Instruction
Regular $ 5,712,168 $ 31,603 $ 1,492,118 $ (4,188,447) $ (4,188,447) Special Education 3,266,950 939,280 (2,327,670) (2,327,670) Other Instruction 131,207 36,989 (94,218) (94,218) School Sponsored Activities and Athletics 144,791 (144,791) (144,791)
Support Services Student and Instruction Related Services 1,744,656 253,075 (1,491,581) (1,491,581) General Administmtion Services 496,322 (496,322) (496,322) School Administration Services 338.671 69,935 (268,736) (268,736) Business/Central Services 321,499 (321,499) (321,499) Administrative Info Tech 46,408 (46,408) (46,408) Operation and Maintenance of facilities 1,283,846 9,526 s 77,760 (I, 196,560) (IJ96,560) Pupil Transportation 89,243 5,243 (84,000) (84,000)
Interest on Debt 107.Jl§_ 8,705 (98,431) (98,431)
Total Governmental Activities 13,682 897 31,603 2 814,871 77,760 {10,758,663) (10,758,663)
:0 Business~ Type Activities
Food Service 20,465 12,673 7,301 $ (491) (491)
Total Business-Type Activities 20,465 12,673 7 301 (491) (491)
Total Primary Government LJ1,703,362 s 44,276 $ 2,822,172 $ 77,760 (10,758,663) (491) (10,759,154)
General Revenues Property Taxes, Levied for General purposes 10,511,796 10,511,796 Property Taxes Levied for Debt Service 398,722 398,722
State Aid - Unrestricted 27,218 27,218 Miscellaneous Revenues 162,992 162,992
Total General Revenues and Other Items 11,100,728 11,100,728
Change in Net Position 342,065 (491) 341,574
Net Position, Beginning of Year (Restated) 3,247,567 6,093 3,253,660
Net Position, End of Year $ 3,589,632 $ 5,602 $ 3,595,234
The accompanying Notes to the Financial Statements are an Integral Part of this Statement

FUND FINANCIAL STATEMENTS

HARRINGTON PARK BOARD OF EDUCATION GOVERNMENTAL FUNDS
BALANCE SHEET AS OF JUNE 30,2015
Special General Revenue
Fund Fund ASSETS
Cash and Cash Equivalents $ 1,875,030 Due from Other Funds 85,095 Receivables from:
Governments 19,537 Other 13,520 $ 25,800
Total Assets $ 1,993,182 $ 25,800
LIABILITIES AND FUND BALANCES Liabilities Accounts Payable $ 788 Due to Other Funds 9,184 $ 21,796 Unearned Revenue 4,004
Total Liabilities 9,972 25,800
Fund Balances Restricted Fund Balance
Excess Surplus 484,141 Excess Surplus~ Designated for
Subsequent Year's Expenditures 85,634 Capital Reserve • Designated for
Subsequent Year's Expenditures 550,001 Emergency Reserve 176,644 Maintenance Reserve 125,000 Capital Projects
Assigned Year Encumbrances 135,340 Designated for Subsequent Year's
Expenditures 202,146 Unassigned 224,304
Total Fund Balances 1,983,210
Total Liabilities and Fund Balances $ 1,993,182 $ 25,800
The accompanying Notes to the Financial Statements are an Integral Part of this Statement 20
Capital Projects
Fund
$ 226,000
$ 226,000
$ 194,401
148,240
342,641
(116,641)
(116,641)
$ 226,000
EXHIBIT B-1
Debt Total Service Governmental Fund Funds
$ 1,875,030 85,095
245,537 39,320
$ $ 2,244,982
$ 195,189 30,980
152,244
378,413
484,141
85,634
550,001 176,644 125,000
(116,641)
135,340
202,146 224,304
1,866,569
$

HARRINGTON PARK BOARD OF EDUCATION GOVERNMENTAL FUNDS
BALANCE SHEET
Total Fund Balances (Exhibit B~l)
Amounts reported for governmental activities in the statement of net position (A-I) are different because:
Capital assets used in governmental activities are not financial resources and therefore are not reported in the funds. The cost of the assets is $15,515,916 and the accumulated depreciation is $8,081,549.
Certain amounts resulted from the measurement of the net pension liability are reported as either deferred inflows of resources or deferred outflows of resources on the statement of net pension and deferred over future years.
AS OF JUNE 30,2015
Deferred Outflows of Resources Deferred Inflows of Resources
The District has financed capital assets through the issuance of serial bonds and long-term lease obligations. The interest accrual at year end is:
Long-term liabilities are not due and payable in the current period and therefore are not reported as liabilities in the funds
Serial Bonds Payable
Capital Leases Payable
Compensated Absences Payable
Net Pension Liability
Net position of governmental activities
The accompanying Notes to the Financial Statements arc an Integral Part of this Statement 21
387,510 (]98 454)
(2,342,000)
(28,309)
(152,869)
(3,330,066)
$
$
EXHIBIT B-1
1,866,569
7,434,367
189,056
(47,116)
(5,853,244)
3,589,632

HARRINGTON PARK BOARD OF EllUCA TJON GOVERNMENTAL FUNDS
STATEMENT OF REVENUES, EXPENDITURES, AND CHANGES IN FUND BALANCES .'OR THE FISCAL YEAR ENDED JUNE 30, 2015
Special General Revenue
Fund Fund REVENUES Local Sources
Property Tax Levy $ 10,511,796 Miscellaneous 194,595 $ 37
Total ~Local Sources 10,706,391 37
State Sources 1,580,339 242 Federal Sources 145,705
Total Revenues 12,286,730 145,984
EXPENDITURES Current
Regular Instruction 4,913,773 8,205
Special Education Instruction 2,976,635 110,954
Other Instruction 109,809 3,364 School-Sponsored Activities and Athletics 137,287
Support Services Student and Instruction Related Services 1,567,483 23,461 General Administration Services 468,193
School Administration Services 299,531
Central Services 312,244 Administrative Info Tech 46,408
Plant Operations and Maintenance 1,018,169
Pupil Transportation 84,980
Debt Service Principal 8,871
Interest and Other Charges 1,161 Capital Outlay 23,991
Total Expenditures 11,968,535 145,984
Excess (Deficit) of Revenues Over (Under) Expenditures 318,195
Fund Balance, Beginning of Year 1,665,015
Fund Balance (Deficit), End of Year $ 1,983,210 $
The accompanying Notes to the Financial Statements are an Integral Part of this Statement 22
Capital Projects
Fund
$ 77,760
77,760
194,401
194,401
(116,641)
$ (116,641)
Debt Service Fund
$ 398,722
398,722
33,522
432,244
320,000 112,244
432,244
$
EXHIBIT B-2
Total Governmental
Funds
$ 10,910,518 194,632
11,105,150
1,691,863 145,705
12,942,718
4,921,978
3,087,589 113,173 137,287
1,590,944 468,193 299,531
312,244 46,408
1,018,169
84,980
328,871 113,405 218,392
12,741,164
201,554
1,665,015
$ 1,866,569

HARRINGTON PARK BOARD OF EDUCATION RECONCILIATION OF THE GOVERNMENTAL FUNDS STATEMENT OF
REVENUES, EXPENDITURES AND CHANGES IN FUND BALANCES WITH THE DISTRICT-WIDE STATEMENTS
FOR THE FISCAL YEAR ENDED JUNE 30,2015
Total net change in fund balances - governmental funds (Exhibit B-2)
Amounts reported for governmental activities in the statement of activities are different because:
Capital Outlays are reported in governmental funds as expenditures. However, in the statement of activities, the cost of those assets is allocated over their estimated useful lives as depreciation expense. This is the amount by which depreciation exceeds capital asset additions in the period
Depreciation Expense Capital Outlays
$ (288,332)
The issuance of long-term debt (e.g. bonds, leases) provides current financial resources to governmental funds, while the repayment of the principal of long-term debt consumes the current financial resources of governmental funds. Neither transaction, however, has any effect on net position. This amount is the net effect of these differences in the treatment of long-term debt and related items.
Principal Repayments: Serial Bonds Payable Capital Leases Payable
In the statement of activities, certain operating expenses, e.g., compensated absences and pension expense are measured by the amounts earned or accrued during the year. In the governmental funds, however, expenditures for these items are reported in the amount of financial resources used (paid). When the earned amount exceeds the paid amount, the difference is reduction in the reconciliation (-); when the paid amount exceeds the earned amount the difference is an addition to the reconciliation(+).
Increase in Compensated Absences Increase in Pension Expense
In the statement of activities, interest on long-tenn debt in the statement of activities is accrued, regardless of when due. In the governmental funds, interest is reported when due. An increase in accrued interest is a decrease in the reconciliation and a decrease in accrued interest is an increase.
Decrease in Accrued Interest
Change in net position of governmental activities
The accompanying Notes to the Financial Statements are an Integral Part of this Statement 23
218,392
320,000 8,871
(48,199) (76,490)
EXHIBIT B-3
$ 201,554
(69,940)
328,871
(124,689)
6,269
$ 342,065

HARRINGTON PARK BOARD OF EDUCATION PROPRIETARY FUND
ENTERPRISE FUND STATEMENT OF NET POSITION
ASSETS
Current Assets Cash and Cash Equivalents Intergovernmental Receivable Federal
Total Current Assets
Capital Assets Equipment Less: Accumulated Depreciation
Total Capital Assets
Total Assets
NET POSITION
Net Investment in Capital Assets Unrestricted
Total Net Position
AS OF JUNE 30, 2015
$
$
The accompanying Notes to the Financial Statements are an Integral Part of this Statement 24
EXHIBITB-4
Special Milk
Program
2,819
434
3,253
7,828 (5,479)
2,349
5,602
2,349 3,253
5,602
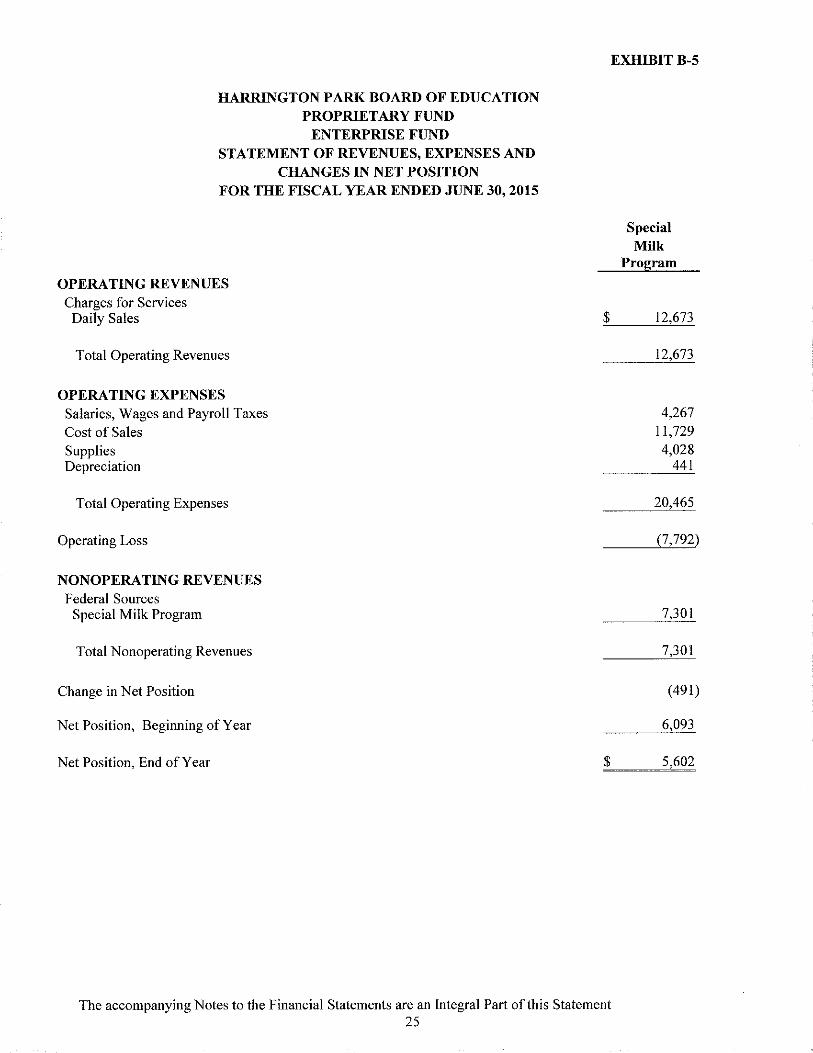
EXHIBIT B-5
HARRINGTON PARK BOARD OF EDUCATION PROPRIETARY FUND
ENTERPRISE FUND STATEMENT OF REVENUES, EXPENSES AND
CHANGES IN NET POSITION FOR THE FISCAL YEAR ENDED JUNE 30, 2015
OPERATING REVENUES Charges for Services
Daily Sales
Total Operating Revenues
OPERATING EXPENSES Salaries, Wages and Payroll Taxes Cost of Sales Supplies Depreciation
Total Operating Expenses
Operating Loss
NONOPERATING REVENUES Federal Sources
Special Milk Program
Total Nonoperating Revenues
Change in Net Position
Net Position, Beginning of Year
Net Position, End of Year
$
$
The accompanying Notes to the Financial Statements are an Integral Part of this Statement 25
Special Milk
Program
12,673
12,673
4,267 11,729 4,028
441
20,465
(7,792)
7,301
7,301
(491)
6,093
5,602

HARRINGTON PARK BOARD OF EDUCATION PROPRIETARY FUND
ENTERPRISE FUND STATEMENT OF CASH FLOWS
FOR THE FISCAL YEAR ENDED JUNE 30, 2015
Cash Flows from Operating Activities Cash Received from Customers Cash Payments to Suppliers for Salaries and Wages,
and Benefits Cash Payments to Suppliers for Goods and Services
Net Cash Used by Operating Activities
Cash Flows from Noncapital Financing Activities Cash Received from State and Federal Subsidy Reimbursements
Net Cash Provided by Noncapital Financing Activities
Net Increase in Cash and Cash Equivalents
Cash and Cash Equivalents, Beginning of Year
Cash and Cash Equivalents, End of Year
Reconciliation of Operating Loss to Net Cash Used by Operating Activities Operating Loss
Adjustments to Reconcile Operating Loss to Net Cash Used by Operating Activities Depreciation
Total Adjustments
Net Cash Used by Operating Activities
$
$
$
$
The accompanying Notes to the Financial Statements are an Integral Part of this Statement 26
EXHIBITB-6
Special Milk
Program
12,673
(4,267) (15, 757)
(7,351)
7,538
7,538
187
2,632
2,819
(7,792)
441
441
(7,351)

HARRINGTON PARK BOARD OF EDUCATION FIDUCIARY FUNDS
STATEMENT OF FIDUCIARY NET POSITION
ASSETS Cash and Cash Equivalents Receivables from Other Governments Due from Other Funds
Total Assets
LIABILITIES Accounts Payable Accrued Salaries and Wages Payroll Deductions and Withholdings Flexible Spending Benefits Due to Student Groups Due to Other Funds
Total Liabilities
NET POSITION
Held in Trust for Unemployment Claims and Other Purposes
AS OF JUNE 30,2015
Unemployment Compensation Trust
$ 55,359
9,184
64,543
4,692
4,692
$ 59,851
The accompanying Notes to the Financial Statements are an Integral Part of this Statement 27
Lightning Detection Private
Purpose Trust Fund
$ 6,680 8,368
15,048
10,270
10,270
$ 4,778
EXHIBIT B-7
Agency Fund
$ 82,314
4,692
$ 87,006
$ 2,634 1,534
13,325 6,214
63,299
$ 87,006

HARRINGTON PARK BOARD OF EDUCATION FIDUCIARY FUNDS
STATEMENT OF CHANGES IN FIDUCIARY NET POSITION FOR THE FISCAL YEAR ENDED JUNE 30, 2015
EXHIBIT B-8
Lightning Detection Unemployment Private Purpose
Comuensation Trust Trust Fund ADDITIONS
Contributions Employees $ 10,719 District 4,904
Interest on Deposits 148
Total Additions 15,771
DEDUCTIONS Unemployment Claims and Contributions 4,904
Total Deductions 4,904
Change in Net Position 10,867
Net Position, Beginning of Year 48 984 $
Net Position, End of Y car $ 59,851 $
The accompanying Notes to the Financial Statements are an Integral Part of this Statement 28
4.778
4,778
NOTES TO THE FINANCIAL STATEMENTS
HARRINGTON PARK BOARD OF EDUCATION NOTES TO THE FINANCIAL STATEMENTS FOR THE FISCAL YEAR ENDED JUNE 30, 2015
NOTE 1 SUMMARY OF SIGNIFICANT ACCOUNTING POLICIES
A. Reporting Entity
The Harrington Park Board of Education (the "Board" or the "District") is an instrumentality of the State of New Jersey, established to function as an education institution. The Board consists of five elected officials and is responsible for the fiscal control of the District. A superintendent is appointed by the Board and is responsible for the administrative control of the District. Under existing statutes, the Board's duties and powers include, but are not limited to, the development and adoption of a school program; the establishment, organization and operation of schools; and the acquisition, maintenance and disposition of school property.
The Board also has broad financial responsibilities, including the approval of the annual budget and the establishment of a system of accounting and budgetary controls.
The reporting entity is composed of the primary goverrunent, and other organizations that are included to ensure that the financial statements of the District are not misleading. The primary goverrunent consists of all funds, departments, boards and agencies that are not legally separate from the District. For the Harrin~>ton Park Board of Education this includes general operations, special milk and student related activities of the District.
Component units are legally separate organizations for which the District is financially accountable. The District is financially accountable for an organization if the District appoints a voting majority of the organization's governing board and (1) the District is able to significantly influence the programs or services perfonned or provided by the organization; or (2) the District is legally entitled to or can otherwise access the organization's resources; the District is legally obligated or has otherwise assumed the responsibility to finance the deficits of, or provide financial support to, the organization; or the District is obligated for the debt of the organization. Component units may also include organizations that are fiscally dependent on the District in that the District approves the budget, the issuance of debt or the levying of taxes. Based on the foregoing criteria, the District has no component units. Furthermore, the District is not includable in any other reporting entity as a component unit.
B. New Accounting Standards
During fiscal year 2015, the District adopted the following GASB statements:
•
•
GASB 68, Accounting and Financial Reporting for Pensions. The objective of this Statement is to improve accounting and financial reporting by state and local goverrunents for pensions. It also improves information provided by state and local governmental employers about financial support for pensions that is provided by other entities. This Statement replaces the requirements of Statement No. 27, Accounting for Pensions by State and Local Governmental Employers, as well as the requirements of Statement No. 50, Pension Disclosures, as they relate to pensions that are provided through pension plans administered as trusts or equivalent arrangements that meet certain criteria.
GASB 71, Pension Transition for Contributions Made Subsequent to the Measurement Date - an amendment of GASB Statement No. 68, should be applied simultaneously with the provisions of Statement No. 68. The objective of this Statement is to address an issue regarding application of the transition provisions of Statement No. 68, Accounting and Financial Reporting for Pensions. The issue relates to amounts associated with contributions, if any, made by a state or local government employer or nonemployer contributing entity to a defined benefit pension plan after the measurement date of the government's beginning net pension liability.
29

HARRINGTON PARK BOARD OF EDUCATION NOTES TO THE FINANCIAL STATEMENTS FOR THE FISCAL YEAR ENDED JUNE 30, 2015
NOTE 1 SUMMARY OF SIGNIFICANT ACCOUNTING POLICIES (Continued)
B. New Accounting Standards (Continued)
Other accounting standards that the District is currently reviewing for applicability and potential impact on the financial statements include:
• GASB 72, Fair Value Measurement and Application, will be effective beginning with the fiscal year ending June 30, 2016. This Statement addresses accounting and financial reporting issues related to fair value measurements. This Statement provides guidance for determining a fair value measurement for financial reporting purposes. This Statement also provides guidance for applying fair value to certain investments and disclosures related to all fair value measurements.
• GASB 73, Accounting and Financial Reporting for Pensions and Related Assets that Are Not Within the Scope of GASB Statement 68. and Amendments to Certain Provisions of GASB Statements 67 and 68, will be effective beginning with the fiscal year ending June 30, 2017. The objective of this Statement is to improve the usefulness of information about pensions included in the general purpose external financial reports of state and local governments for making decisions and assessing accountability.
• GASB 74, Financial Reporting for Postemployment Benefit Plans Other than Pension Plans. will be effective beginning with the fiscal year ending June 30, 2017. The objective oftbis Statement is to improve the usefulness of information about postemployment benefits other than pensions (other postemployment benefits or OPEB) included in the general purpose external financial reports of state and local governmental OPEB plans for making decisions and assessing accountability.
• GASB 75, Accounting and Financial Reporting for Postemployment Benefits Other Than Pensions, will be effective beginning with the fiscal year ending June 30, 2018. The primary objective of this Statement is to improve accounting and financial reporting by state and local governments for postemployment benefits other than pensions (other postemployment benefits or OPEB). lt also improves information provided by state and local governmental employers about financial support for OPEB that is provided by other entities.
• GASB 76, The Hierarchy of Generally Accepted Accounting Principles for State and Local Governments, will be effective beginning with the fiscal year ending June 30, 2016. The objective of this Statement is to identifY- in the context of the current governmental financial reporting environment - the hierarchy of generally accepted accounting principles (GAAP). The "GAAP hierarchy" consists of tbe sources of accounting principles used to prepare financial statements of state and local governmental entities in conformity with GAAP and the framework for selecting those principles. This Statement reduces the GAAP hierarchy to two categories of authoritative GAAP and addresses the use of authoritative and nonauthoritative literature in the event that tbe accounting treatment for a transaction or other event is not specified within a source of authoritative GAAP.
C. Basis of Presentation - Financial Statements
The financial statements include both district-wide financial statements (based on tbe District as a whole) and fund financial statements (based on specific District activities or objectives). Both the district-wide and fund financial statements categorize activities as either governmental activities or business-type activities. While separate district-wide and fund financial statements are presented, they are interrelated. In the district-wide financial statements, the governmental activities column incorporates data from governmental funds, while bnsiness-type activities incorporate data from the District's enterprise funds. Fiduciary funds are excluded from the district-wide financial statements.
30

HARRINGTON PARK BOARD OF EDUCATION NOTES TO THE FINANCIAL STATEMENTS FOR THE FISCAL YEAR ENDED JUNE 30, 2015
NOTE 1 SUMMARY OF SIGNIFICANT ACCOUNTING POLICIES (Continued)
C. Basis of Presentation- Financial Statements (Continued)
District-Wide Financial Statements
The district-wide financial statements (i.e., the statement of net position and the statement of activities) report information on all of the nonfiduciary activities of the Board of Education. All fiduciary activities are reported only in the fund financial statements. For the most part, the effect of interfund activity has been removed from these statements. Governmental activities, which normally are supported by property taxes and intergovernmental revenues, are reported separately from business-type activities, which rely to a significant extent on fees and charges for support. In the statement of net position, both the governmental and business-type activities columns (a) are presented on a consolidated basis by column, and (b) reflect on a full accrual economic resource basis, which incorporates long-term assets and receivables as well as long-term debt and obligations.
The statement of activities demonstrates the degree to which the direct expenses of a given function or segment are offset by program revenues. Direct expenses are those that are clearly identifiable with a specific function or segment. Program revenues include 1) charges to customers or other governmental entities, including other school districts, who purchase, use, or directly benefit from goods or services provided by a given function or segment and 2) grants and contributions that are restricted to meeting the operational or capital requirements of a particular function or segment. Property taxes, unrestricted state aid, and other items not properly included among program revenues are reported instead as general revenues.
As a general rule the effect of interfund activity has been eliminated from the district-wide financial statements. Exceptions to this general rule are charges between the Board's proprietary and fiduciary funds since elimination of these charges would distort the direct costs and program revenues reported for the various functions concerned.
Fund Financial Statements
Separate fund financial statements are provided for governmental, proprietary, and fiduciary activities, even though the latter are excluded from the district-wide financial statements. The emphasis of fund financial statements is on major individual governmental and enterprise funds, each reported as separate columns in the fund financial statements. All remaining governmental and enterprise funds are aggregated and reported as nonmajor funds. The District considers all of its governmental and enterprise funds to be major funds.
The District reports the following major governmental funds:
The general fund is the School District's primary operating fund. It accounts for all financial resources of the District, except those to be accounted for in another fund.
The special revenue fund accounts for the proceeds of specific revenue sources legally restricted to expenditures for specified purposes. This fund accounts for federal, state and local financial programs, with the exception of grants for major capital projects and the child nutrition programs.
The capital projects fund accounts for the proceeds from the sale of bonds, lease purchases and other revenues used for the acquisition or construction of capital facilities and other capital assets, other than those financed by the proprietary funds.
The debt service fond accounts for the accumulation of resources that are restricted, committed or assigned for the payment of principal and interest on long-term general obligation debt of governmental funds.
31

HARRINGTON PARK BOARD OF EDUCATION NOTES TO THE FINANCIAL STATEMENTS FOR THE FISCAL YEAR ENDED JUNE 30, 2015
NOTE 1 SUMMARY OF SIGNIFICANT ACCOUNTING POLICIES (Continued)
C. Basis of Presentation- Financial Statements (Continued)
Fund Financial Statements (Continued)
The District reports the following major proprietary fund which is organized to be self-supporting through user charges:
The special milkjimd accounts for the activities of the school cafeteria, which provides milk to students.
Additionally, the government reports the following fund type:
The fiduciary trust fund is used to account for resources legally held in trust for the state unemployment insurance claims, joint purchasing contributions for the early warning lightning detection system, payroll related activities and student related activities which are supported and controlled by student organizations and clubs. All resources of the fund, including any earnings on invested resources, may be used to support the intended purpose. There is no requirement that any portion of these resources be preserved as capital.
Activity between funds that are representative of lending/borrowing arrangements outstanding at the end of the fiscal year are referred to as either "due to/from other funds" (i.e., the current portion of interfund loans) or "advances to/from other funds" (i.e., the non-current portion of interfund loans). All other outstanding balances between funds are reported as "due to/from other funds". Any residual balances outstanding between the governmental activities and business-type activities are reported in the district-wide financial statements as "internal balances".
Reclassifications
Certain amounts presented in the prior year data may have been reclassified in order to be consistent with the current year's presentation.
D. Measurement Focus and Basis of Accounting
The accounting and financial reporting treatment is determined by the applicable measurement focus and basis of accounting. Measurement focus indicates the type of resources being measured such as current financial resources or economic resources. The basis of accounting indicates the timing of transactions or events for recognition in the financial statements.
The district-wide financial statements are reported using the economic resources measurement focus and the accrual basis of accounting, as are the proprietary fund and fiduciary fund financial statements with the exception of the agency fund which does not have a measurement focus. All assets, all liabilities and all deferred outflows/inflows of resources associated with these operations (with the exception of the fiduciary funds) are included on the Statement of Net Position. Revenues are recorded when earned and expenses are recorded at the time liabilities are incurred, regardless of the timing of related cash flows. Property taxes are recognized as revenues in the year for which they are levied. Grants and similar items are recognized as revenue as soon as all eligibility requirements imposed by the provider have been met.
Governmental fund financial statements are reported using the current financial resources measurement focus and the modified accrual basis of accounting. Revenues are recognized when susceptible to accrual (i.e. when they are both measurable and available). Revenues are considered to be available when they are collectible within the current period or soon enough thereafter to pay liabilities of the current period. For this purpose, the Board considers revenues to be available if they are collected within 60 days after year-end. Expenditures are recorded when a liability is incurred, as under accrual basis of accounting, with the exception of debt service expenditures as well as expenditures related to compensated absences and claims and judgments which are recorded only when payment is due. General capital asset acquisitions are reported as expenditures in governmental funds. Issuance of long-term debt and acquisitions under capital leases are reported as other financing sources.
32

HARRINGTON PARK BOARD OF EDUCATION NOTES TO THE FINANCIAL STATEMENTS FOR THE FISCAL YEAR ENDED JUNE 30, 2015
NOTE 1 SUMMARY OF SIGNIFICANT ACCOUNTING POLICIES (Continued)
D. Measurement Focus and Basis of Accounting (Continued)
Property taxes, tuition, and unrestricted state aid associated with the current fiscal period are all considered to be susceptible to accrual and so have been recognized as revenues of the current fiscal period. Entitlements (formula-type grants and aid) are recorded as revenues when all eligibility requirements are met, including any time requirements, and the amount is received during the period or within the availability period for this revenue source. Expenditure-driven grants and similar awards (reimbursement-type grants and awards) are recognized as revenue when the qualifYing expenditures have been incurred and all other eligibility requirements imposed by the grantor or provider have been met, and the amount is received during the period or within the availability period for this revenue source. All other revenue items are considered to be measurable and available only when cash is received by the District.
When both restricted and unrestricted resources are available for use, it is the government's policy to use restricted resources first, then unrestricted resources as they are needed.
E. Assets, Liabilities, Deferred Outflows/Inflows of Resources, and Net Position/Fund Balance
I. Cash, Cash Equivalents and Investments
Cash and cash equivalents are considered to be cash on hand, demand deposits, and short-tenn investments with original maturities of three months or less from the date of acquisition.
Investments are reported at fair value and are limited by N.J.S.A. 18A:20-37.
2. Receivables
All receivables are reported at their gross value, and where appropriate, are reduced by the estimated portion that is expected to be uncollectible.
3. Inventories
The cost of inventories of the goverrnnental fund types are recorded as expenditures at the time individual inventory items are purchased.
4. Capital Assets
Capital assets, which include property, plant and equipment, are reported in the applicable governmental or business-type activities columns in the district-wide financial statements. Capital assets are defmed by the Board as assets with an initial, individual cost of$2,000 and an estimated useful life in excess of two years. The District was able to estimate the historical cost for the initial reporting of these capital assets through back trending. As the District constructs or acquires additional capital assets each period, they are capitalized and reported at historical cost. Donated capital assets are recorded at estimated fair market value at the date of donation. The costs of normal maintenance and repairs that do not add to the value of the asset or materially extend its useful life are not capitalized.
Major outlays for capital assets and improvements are capitalized as projects are constructed. Interest incurred during the construction phase of capital assets of business-type activities is included as part of the capitalized value of the assets constructed.
33

HARRINGTON PARK BOARD OF EDUCATION NOTES TO THE FINANCIAL STATEMENTS FOR THE FISCAL YEAR ENDED JUNE 30, 2015
NOTE 1 SUMMARY OF SIGNIFICANT ACCOUNTING POLICIES (Continued)
E. Assets, Liabilities, Deferred Outflows/Inflows of Resources, and Net Position/Fund Balance (Continued)
4. Capital Assets (Continued)
Land and construction in progress are not depreciated. The other property, plant, and equipment of the District IS
depreciated using the straight line method over the following estimated useful lives:
Land Improvements Buildings Building Improvements Office Equipment and Furniture Computer Equipment
5. Deferred Outjlows/lnflows of Resources
20 7-40 7-40 5-20 5-20
In addition to assets, the statement of financial position will sometimes report a separate section for deferred outflows of resources. This separate financial statement element, deferred outflows of resources, represents a consumption of net position that applies to a future period and so will not be recognized as an outflow of resources (expense/expenditure) until then. The government has one item which arises only under the accrual basis of accounting that qualifies for reporting in this category. The item that qualifies for reporting in this category is the deferred amounts on net pension liability. Deferred amounts on net pension liability are reported in the district-wide statement of net position and result from: (I) differences between expected and actual experience; (2) changes in assumptions; (3) net difference between projected and actual investment earnings on pension plan investments; ( 4) changes in proportion and differences between employer contributions and proportionate share of contributions; and (5) contributions made subsequent to the measurement date. These amounts are deferred and amortized over future years.
In additions to liabilities, the statement of financial position will sometimes report a separate section for deferred inflows of resources. This separate financial statement element, deferred inflows of resources, represents an acquisition of net position that applies to future periods and so will not be recognized as an inflow of resources (revenue) until that time. The goverrunent has only one type of item, which arises only under the accrual basis of accounting that qualifies for reporting in this category. It is the deferred amounts on net pension liability are reported in the district-wide statement of net position and result from: (I) differences between expected and actual experience; (2) changes in assumptions; (3) net difference between projected and actual investment earnings on pension plan investments; and ( 4) changes in proportion and differences between employer contributions and proportionate share of contributions. These amounts are deferred and amortized over future years.
6. Compensated Absences
It is the District's policy to pennit employees to accumulate (with certain restrictions) earned but unused vacation and sick leave benefits. A long-term liability of accumulated vacation and sick leave and salary related payments has been recorded in the governmental activities in the district-wide financial statements, representing the Board's commitment to fund such costs from future operations. A liability is reported in the governmental funds only to the amount actually due at year end as a result of employee resignations and retirements.
34

HARRINGTON PARK BOARD OF EDUCATION NOTES TO THE FINANCIAL STATEMENTS FOR THE FISCAL YEAR ENDED JUNE 30, 2015
NOTE 1 SUMMARY OF SIGNIFICANT ACCOUNTING POLICIES (Continued)
E. Assets, Liabilities, Deferred Outflows/Inflows of Resources, and Net Position/Fund Balance (Continued)
7. Pensions
In the district-wide financial statements, for purposes of measuring the net pension liability, deferred outflows of resources and deferred inflows of resources related to pensions, and pension expense, information about the fiduciary net position of the retirement systems sponsored and administered by the State of New Jersey and additions to/deductions from these retirement systems' fiduciary net position have been determined on the same basis as they are reported by the retirement systems. For this purpose, benefit payments (including refunds of employee contributions) are recognized when due and payable in accordance with the benefit terms. Investments are reported at fair value.
In the governmental fund financial statements, net pension liabilities represent amounts normally expected to be liquidated with expendable available financial resources for required pension contributions that are due and payable at year end. Pension expenditures are recognized based on contractual pension contributions that are required to be made to the pension plan during the fiscal year.
8. Long-Term Obligations
In the district-wide financial statements, and proprietary fund types in the fund financial statements, long-term debt and other long-term obligations are reported as liabilities in the applicable governmental activities, business-type activities, or proprietary fund type statement of net position.
9. Net Position/Fund Balance
District-Wide Statements
In the district-wide statements, there are three classes of net position:
• Net Investment in Capital Assets- consists of net capital assets (cost less accumulated depreciation) reduced by outstanding balances of related debt obligations from the acquisition, construction or improvement of those assets.
• Restricted Net Position -reports net position when constraints placed on the residual amount of noncapital assets are either externally imposed by creditors (such as through debt covenants), grantors, contributors, or laws or regulations of other governments, or imposed by law through constitutional provisions or enabling legislation.
• Unrestricted Net Position - any portion of net position not already classified as either net investment in capital assets or net position- restricted is classified as net position -unrestricted.
Governmental Fund Statements
Fund balance categories are desi~'Ded to make the nature and extent of the constraints placed on the District's fund balance more transparent. These categories are comprised of a hierarchy based primarily on the extent to which the District is bound to observe constraints imposed upon the use of the resources reported in governmental funds.
35

HARRINGTON PARK BOARD OF EDUCATION NOTES TO THE FINANCIAL STATEMENTS FOR THE FISCAL YEAR ENDED JUNE 30, 2015
NOTE 1 SUMMARY OF SIGNIFICANT ACCOUNTING POLICIES (Continued)
E. Assets, Liabilities, Deferred Outflows/Inflows of Resources, and Net Position/Fund Balance (Continued)
9. Net Position/Fund Balance (Continued)
Governmental Fund Statements (Continued)
Restricted Fund Balance- Amounts constrained to specific purposes by their providers (such as grantors, bondholders, and higher levels of government), through constitutional provisions, or by enabling legislation.
Excess Surplus - Desirmated for Subsequent Year's Expenditures - This restriction was created in accordance with NJSA 18A:7F-7 to represent the June 30, 2014 audited excess surplus that was appropriated in the 2015/2016 original budget certified for taxes.
Excess Surplus- This restriction was created in accordance with NJSA 18A:7F-7 to represent the June 30, 2015 audited excess surplus that is required to be appropriated in the 2016/201 7 original budget certified for taxes.
Capital Reserve - Designated for Subsequent Year's Budget- This designation was created to dedicate the portion of capital reserve fund balance appropriated in the adopted 2015/2016 District budget certified for taxes.
Maintenance Reserve - This restriction was created by the Board in accordance with NJAC 6A:23A-14.2 to accumulate funds for the required maintenance of school facilities in accordance with the EFCA (NJSA 18A:7G-9) for a thorough and efficient education.
Emergency Reserve -This restriction was created in accordance with NJAC 6A:23A-14.4(A)1 to accumulate funds in accordance with State statute to finance unanticipated general fund expenditures required for a thorough and efficient education.
Capital Projects - Represents fund balance restricted specifically for capital acquisitions and improvements in the Capital Projects Fund.
Assigned Fund Balance - Amounts a government intends to use for a specific purpose; intent can be expressed by the governing body or by an official or body to which the governing body delegates the authority.
Designated for Subsequent Year's Expenditures - This designation was created to dedicate the portion of fund balance appropriated in the adopted 2015/2016 District budget certified for taxes.
Year-End Encumbrances - Represent outstanding purchase orders for goods or services approved by management for specific purposes from available resources of the current year for which the goods and materials have not yet been received or the services have not yet been rendered at June 30.
Unassigned Fund Balance - Represents fund balance that has not been restricted, committed or assigned to specific purposes within the governmental funds.
36

HARRINGTON PARK BOARD OF EDUCA TJON NOTES TO THE FINANCIAL STATEMENTS FOR THE FISCAL YEAR ENDED JUNE 30, 2015
NOTE 1 SUMMARY OF SIGNIFICANT ACCOUNTING POLICIES (Continued)
F. Revenues and Expenditures/Expenses
1. Program Revenues
Amounts reported as program revenues in the district-wide statement of activities include 1) charges to customers or applicants for goods or services, provided, 2) operating grants and contributions, and 3) capital grants and contributions. Internally dedicated resources are reported as general revenues rather than as program revenues. Likewise, general revenues include all property taxes, unrestricted state aid and miscellaneous revenues.
2. Property Taxes
Property taxes are levied pursuant to law and are collected by the municipality and are transferred to the District as requested. Property tax revenues are recognized in the year they are levied and become available. Property taxes collected in advance of the year-end for which they are levied and transferred to the District are reported as deferred inflows of resources. The tax bills are mailed annually in June by the municipal tax collector and are levied and due in four quarterly installments on August 1, November 1, February 1 and May 1 of the fiscal year. When unpaid, taxes or any other municipal lien, or part thereof, on real property, remains in arrears on April 1 '' in the year following the calendar year levy when the same became in arrears, the tax collector of the municipality shall, subject to the provisions of New Jersey Statute, enforce the lien by placing the property on a tax sale. The municipality may institute annual "in rem" tax foreclosure proceedings to enforce the tax collection or acquisition of title to the property.
3. Tuition Revenues and Expenditures
Tuition Revenues - Tuition charges were established by the Board of Education based on estimated costs. The charges are subject to adjustment when the final costs are determined and certified by the State Department of Education.
Tuition Expenditures- Tuition charges for the fiscal years 2013-2014 and 2014-2015 were based on rates established by the receiving district. These rates are subject to change when the actual costs have been certified by the State Department of Education.
4. Proprietary Funds, Operating and Non-Operating Revenues and Expenses
Proprietary funds distinguish operating revenues and expenses from nonoperating items. Operating revenues and expenses generally result from providing services and producing and delivering goods in connection with a proprietary fund's principal ongoing operations. The principal operating revenues of the special milk enterprise fund are charges to customers for sales and services. Operating expenses for the enterprise funds include the cost of sales and services, administrative expenses, and depreciation on capital assets. All revenues and expenses not meeting this definition are reported as nonoperating revenues and expenses. Federal subsidies for the food service operation are considered nonoperating revenues.
37

HARRINGTON PARK BOARD OF EDUCATION NOTES TO THE FINANCIAL STATEMENTS FOR THE FISCAL YEAR ENDED JUNE 30, 2015
NOTE 2 STEWARDSHIP, COMPLIANCE AND ACCOUNTABILITY
A. Budgetary Information
In accordance with the requirements of the New Jersey Department of Education ("the Department"), the District annually prepares its operating budget for the forthcoming year. The budget, except for the general fund and special revenue fund, which is more fully explained below and in the notes to the required supplementary information, is prepared in accordance with accounting principles generally accepted in the United States of America and serves as a fonnal plan for expenditures and the proposed means for financing them. Capital lease transactions are accounted for on the GAAP basis.
Prior to the 2012/2013 budget year, the annual budget was required to be voted upon at the annual school election held on the third Tuesday in April. On January 17, 2012, Chapter 202 of the Laws of P.L. 2011 was approved which established procedures for moving the date of a school district's aruma! school election from April to the general election in November. Under the new law, districts that have their school board members elected in November no longer have to submit their budgets that meet levy cap requirements for voter approval beginning with the 2012/2013 budget year. Only a school board decision to exceed the tax levy cap would require voter approval for the additional amount on the November ballot. On January 23, 2014, the Board adopted a resolution to move its annual election to the date of the general elections in accordance with the law; therefore voter approval of the aruma! budget is not required.
Budget adoptions and amendments are recorded in the District's board minutes. The budget is amended by the Board of Trustees as needed throughout the year. The budget for revenues, other resources, other uses, and fund balances is prepared by fund source and amount. The budget for expenditures is prepared by fund, program, function, object and amount. The legal level of budgetary control is established at the line item account within each fund. Line item accounts are defined as the lowest (most specific) level of detail as established pursuant to the minimum chart of accounts referenced in N.J.A.C. 6:20-2A.2(m)l. The Board approved several budget transfers during 2014/2015. Also, during 2014/2015 the Board increased the original budget by $168,119. The increase was funded by prior year state aid, additional grant awards and the reappropriation of prior year general fund encumbrances.
Formal budgetary integration into the accounting system is employed as a management control device during the. year. For governmental funds there are no substantial differences between the budgetary basis of accounting and accounting principles generally accepted in the United States of America, with the exception of the legally mandated revenue recognition of certain state aid payments for budgetary purposes only and the treatment of encumbrances in the special revenue fund as described in the Notes to Required Supplementary Information (RSI). Encumbrance accounting is also employed as an extension of formal budgetary integration in the governmental fund types. Unencumbered appropriations lapse at fiscal year end.
Encumbrance accounting is employed in the governmental funds. Under encumbrance accounting, purchase orders, contracts and other commitments for the expenditure of resources are recorded to reserve a portion of the applicable appropriation. Open encumbrances in governmental funds other than the special revenue fund are reported as committed and/or assigned fund balances at fiscal year end as they do not constitute expenditures or liabilities but rather commitments related to unperformed contracts for goods and services which are reappropriated and honored during the subsequent fiscal year.
B. Deficit Fund Eqnity
The District has an accumulated deficit in fund balance of $116,641 in the Capital Projects Fund. The District expects to eliminate this deficit through the transfer from capital reserve funds in the General Fund to the Capital Projects Fund in the 2015/2016 school year.
38

HARRINGTON PARK BOARD OF EDUCATION NOTES TO THE FINANCIAL STATEMENTS FOR THE FISCAL YEAR ENDED JUNE 30, 2015
NOTE 2 STEWARDSHIP, COMPLIANCE AND ACCOUNTABILITY (Continued)
B. Capital Reserve
A capital reserve account was established by the District The accumulation of funds will be used for capital outlay expenditures in subsequent fiscal years. The capital reserve is maintained in the general fund and its activity is included in the general fund annual budget.
Funds placed in the capital reserve are restricted to capital projects in the district's approved Long Range Facilities Plan (LRFP). Upon submission of the LRFP to the Department, a district may increase the balance in the capital reserve by appropriating funds in the annual general fund budget certified for taxes or by transfer by board resolution at year end of any unanticipated revenue or unexpended line-item appropriation amounts or both. A district may also appropriate additional amounts when the express approval of the voters has been obtained either by a separate proposal at budget time or by a special question at one of the four special elections authorized pursuant to N.J.S.A. 19:60-2. Pursuant to N.J.A.C. 6:23A-14.1(g), the balance in the reserve cannot at any time exceed the local support costs of uncompleted capital projects in its approved LRFP.
The activity of the capital reserve for the fiscal year ended June 30, 2015 is as follows:
Balance, July I, 2014 $ 450,001
Increased by Deposits approved by Board Resolution 100,000
Balance, June 30,2015 $ 550,001
C. Maintenance Reserve
A maintenance reserve account was established by the District. The accumulation of funds will be used for required maintenance of school facilities expenditures in subsequent fiscal years. The maintenance reserve is maintained in the General Fund and its activity is included in the General Fund annual budget.
Funds placed in the maintenance reserve are restricted to required maintenance activities for a school facility as reported in the comprehensive maintenance plan. A District may appropriate funds into the maintenance reserve in the armual General Fund budget certified for taxes or by transfer by board resolution at year end of any unanticipated revenue or unexpended line item appropriation amounts or both. Pursuant to N.J.A.C. 6A:23A-14.2(g), the balance in the reserve cannot at any time exceed four percent of the replacement cost of the school district's school facilities for the current year.
The activity of the maintenance reserve for the fiscal year ended June 30, 2015 is as follows:
Balance, July I, 2014 $ 125,000
Balance, June 30, 2015 $ 125,000
The June 30, 2015 comprehensive maintenance plan indicated a maximum maintenance reserve amount of $533,218.
39

HARRINGTON PARK BOARD OF EDUCATION NOTES TO THE FINANCIAL STATEMENTS FOR THE FISCAL YEAR ENDED JUNE 30,2015
NOTE 2 STEWARDSHIP, COMPLIANCE AND ACCOUNTABILITY (Continued)
D. Emergency Reserve
An emergency reserve account was established by the District. The accumulation of funds will be used to finance unanticipated General Fund current expenditures required for a thorough and efficient education in subsequent fiscal years.
Funds placed in the emergency reserve are restricted to finance reasonably unforeseeable costs and shall not include additional costs due to poor planning. A District may appropriate funds into the emergency reserve in the annual General Fund budget certified for taxes or by transfer by board resolution at year end of any unanticipated revenue or unexpended line item appropriation amounts or both. Withdrawals from the reserve require the approval of the Commissioner unless the withdrawal is necessary to meet an increase in total health care costs in excess of four percent. Pursuant to NJAC 6A:23A-14.4(A), the balance in the reserve cannot at any time exceed the greater of $250,000 or one percent of the school district's General Fund budget as certified for taxes up to a maximum of $1,000,000.
The activity of the emergency reserve for the fiscal year ended June 30, 2015 is as follows:
Balance, July I, 2014 $ 176,644
Balance, June 30,2015 $ 176,644
E. Calculation of Excess Surplus
In accordance with N.J.S.A. 18A:7F-7, as amended, the restricted fund balance for Reserved Excess Surplus is a required calculation pursuant to the New Jersey Comprehensive Educational Improvement and Financing Act of 1996 (CEJFA). New Jersey school districts are required to reserve General Fund fund balance in excess of 2% of budget expenditures at the fiscal year end of June 30 if they did not appropriate a required minimum amount as budgeted fund balance in their subsequent year's budget. The excess fund balance at June 30, 2015 is $569,775. Of this amount, $85,634 was designated and appropriated in the 2015/2016 original budget certified for taxes and the remaining amount of $484,141 will be appropriated in the 2016/2017 original budget certified for taxes.
NOTE 3 DETAILED NOTES ON ALL FUNDS
A. Cash Deposits and Investments
Cash Deposits
The Board's deposits are insured through either the Federal Deposit Insurance Corporation (FDIC), Securities Investor Protection Corporation (SIPC) or New Jersey's Governmental Unit Deposit Protection Act (GUDPA). The Board is required to deposit their funds in a depository which is protecting such funds pursuant to GUDPA. The New Jersey Governmental Unit Deposit Protection Act requires all banks doing business in the State of New Jersey to pledge collateral equal to at least 5% of the average amount of its public deposits and l 00% of the average amount of its public funds in excess of the lesser of 75% of its capital funds or $200 million for all deposits not covered by the FDIC.
40
HARRINGTON PARK BOARD OF EDUCATION NOTES TO THE FINANCIAL STATEMENTS FOR THE FISCAL YEAR ENDED JUNE 30, 2015
NOTE 3 DETAILED NOTES ON ALL FUNDS (Continued)
A. Cash Deposits and Investments (Continued)
Cash Deposits (Continued)
Bank balances are insured up to $250,000 in the aggregate by the FDIC for each bank. SlPC replaces cash claims up to a maximum of $250,000 for each failed brokerage firm. At June 30, 2015, the book value of the Board's deposits were $2,022,202 and bank and brokerage finn balances of the Board's deposits amounted to $2,166,978. The Board's deposits which are displayed on the various fund balance sheets as "cash and cash equivalents" are categorized as:
Depository Account
Insured $ 2,166,978
Custodial Credit Risk- Deposits- Custodial credit risk is the risk that in the event of a bank failure, the government's deposits may not be returned to it. The Board does not have a policy for custodial credit risk. As of June 30,2015 none of the Board's bank balances were exposed to custodial credit risk.
Investments
The Board is permitted to invest public funds in accordance with the types of securities authorized by N.J.S.A. 18A:20-37. Examples of the allowable investments are bonds or other obligations of the United States or obligations guaranteed by the United States of America, Government Money Market Mutnal Funds, bonds or other obligations of the school district or bonds or other obligations of the local unit or units within which the school district is located, Local Government investment pools, and agreements or the repurchase of fully collateralized securities, if transacted in accordance with the above statute.
As of June 30, 2015, the Board had no outstanding investments.
Interest Rate Risk- The Board does not have a formal investment policy that limits investment maturities as a means of managing its exposure to fair value losses arising from increasing interest rates.
Credit Risk - State law limits investments as noted above (N.J.S.A. 18A:20-37). The District does not have an investment policy that would further limit its investment choices.
Concentration of Credit Risk- The Board places no limit in the amount the District may invest in any one issuer.
41

HARRINGTON PARK BOARD OF EDUCATION NOTES TO THE FINANCIAL STATEMENTS FOR THE FISCAL YEAR ENDED JUNE 30, 2015
NOTE 3 DETAILED NOTES ON ALL FUNDS (Continued)
B. Receivables
Receivables as of June 30, 2015 for tbe district's individual major funds, and fiduciary funds in the aggregate, including the applicable allowances for uncollectible accounts, are as follows:
Receivables:
Intergovernmental
Federal
State
Other
Gross Receivables
Less: Allowance for
Uncollectibles
Net Total Receivables
C. Unearned Revenue
$
$
General
Fund
19,537
Special
Revenue
Fund
13,520 o:_$ _ __::2::25,::_:80:::_0
33,057 25,800
$
33,057 $ 25,800 $
Capital
Projects
Fund
226,000
226,000
$
226,000 $
Food
Service
Fund
434
434
Lightning Detection
Private Purpose
Trust Fund
$ 8,368
8,368
$ 434
245,537
47,688
293,659
434 ;:;,$ ___ =8,"'36~8 $ 293,659
Governmental funds report unearned revenue in connection with resources that have been received, but not yet earned. At the end of the current fiscal year, the various components of unearned revenue reported in the governmental funds were as follows:
Special Revenue Fund
Unencumbered Grant Draw Downs Grant Draw Downs Reserved for Encumbrances
Capital Projects Fund
Unrealized School Facilities Grants
Total Unearned Revenue for Governmental Funds
$
$
42
3,969
35
148,240
152,244

HARRINGTON PARK BOARD OF EDUCATION NOTES TO THE FINANCIAL STATEMENTS FOR THE FISCAL YEAR ENDED JUNE 30, 2015
NOTE 3 DETAILED NOTES ON ALL FUNDS (Continued)
D. Capital Assets
Capital asset activity for the fiscal year ended June 30, 2015 was as follows:
Balance, Balance,
July I, 2014 Increases Decreases June 30,2015
Governmental activities:
Capital assets, not being depreciated:
Land $ 504,400 $ 504,400
Construction in Progress $ 194,401 194,401
Total capital assets, not being depreciated 504,400 194,401 698,801
Capital assets, being depreciated:
Buildings and Building Improvements 14,157,340 21,965 14,179,305
Machinery and Equipment 635,784 2,026 637,810
Total capital assets being depreciated 14,793,124 23,991 14,817,115
Less accumulated depreciation for:
Buildings and Building Improvements (7,505,635) (240,007) (7,745,642) Machinery and equipment (287,582) (48,325) (335,907)
Total accumulated depreciation (7,793,217) (288,332) (8,081,549)
Total capital assets, being depreciated, net 6,999,907 (264,341) 6,735,566
Government activities capital assets, net $ 7,504,307 $ (69,940) $ $ 7,434,367
Balance, Balance,
July 1,2014 Increases Decreases June 30, 2015
Business-type activities: Capital assets, being depreciated:
Machinery and equipment $ 7,828 $ 7,828
Total capital assets being depreciated 7,828 7,828
Less accumulated depreciation for: Machinery and equipment (5,038) $ (441) (5,479)
Total accumulated depreciation (5,038) (441) (5,479)
Total capital assets, being depreciated, net 2,790 (441) 2,349
Business-type activities capital assets, net $ 2,790 $ (441) $ $ 2,349
43

HARRINGTON PARK BOARD OF EDUCATION NOTES TO THE FINANCIAL STATEMENTS FOR THE FISCAL YEAR ENDED JUNE 30,2015
NOTE 3 DETAILED NOTES ON ALL FUNDS (Continued)
D. Capital Assets (Continued)
Depreciation expense was charged to functions/programs of the District as follows:
Governmental activities:
Instruction
Regular School-Sponsored/Other Instructional
Total Instruction
Support Services
Student and Instruction Related Services
General Administration Services
Operation and Maintenance of Facilities Pupil Transportation
Total Support Services
Total Depreciation Expense -Governmental Activities
Business-Type Activities: Food Service Fund
Total Depreciation Expense-Business-Type Activities
Construction and Other Significant Commitments
The District has the following active construction projects as of June 3 0, 2015:
Project
Boiler Replacement at Harrington Park High School
44
Remaining
Commitment
$ 492,045
$
$
$
$
582 3,355
3,937
12,469
17,614 250,049
4,263
284,395
288,332
441
441

HARRINGTON PARK BOARD OF EDUCATION NOTES TO THE FINANCIAL STATEMENTS FOR THE FISCAL YEAR ENDED JUNE 30, 2015
NOTE 3 DETAILED NOTES ON ALL FUNDS (Continued)
E. Interfund Receivables, Payables, and Transfers
The composition of interfund balances as of June 30, 2015, is as follows:
Due to/from other funds
Receivable Fund Payable Fund
General Fund Special Revenue Fund General Fund Payroll Agency Fund Unemployment Fund General Fund Payroll Agency Fund Unemployment Fund
Total
Amount
$ 21,796 63,299
9,184 4,692
$ 98,971
The above balances are the result of revenues earned or other financing sources received in one fund which are due to another fund and/or expenditures paid by one fund on behalf of another fund and/or to cover cash balances which were in an overdraft position.
The District expects all interfund balances to be liquidated within one year.
F. Leases
Operating Leases
The District leases copier equipment under noncancelable operating leases. Lease payments for the fiscal year ended June 30, 2015 were $16,645. The future minimum lease payments for these operating leases are as follows:
Fiscal Year Ending June 30 Amount
2016 $ 16,645
Total $ 16,645
45
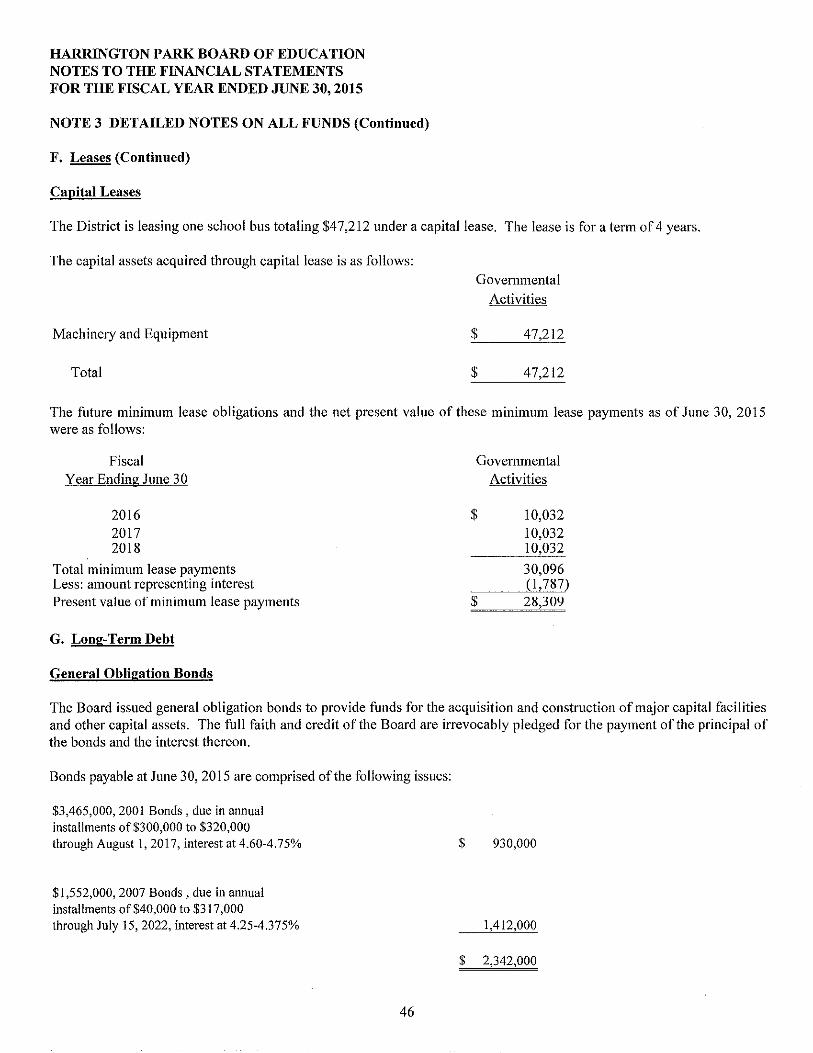
HARRINGTON PARK BOARD OF EDUCATION NOTES TO THE FINANCIAL STATEMENTS FOR THE FISCAL YEAR ENDED JUNE 30, 2015
NOTE 3 DETAILED NOTES ON ALL FUNDS (Continued)
F. Leases (Continued)
Capital Leases
The District is leasing one school bus totaling $47,212 under a capital lease. The lease is for a term of 4 years.
The capital assets acquired through capital lease is as follows:
Machinery and Equipment
Total
Governmental
Activities
$ 47,212
$ 47,212
The future minimum lease obligations and the net present value of these minimum lease payments as of June 30, 2015 were as follows:
Fiscal Year Ending June 30
2016 2017 2018
Total minimum lease payments Less: amount representing interest Present value of minimum lease payments
G. Long-Term Debt
General Obligation Bonds
Governmental Activities
$
$
10,032 I 0,032 10,032
30,096 (1,787) 28,309
The Board issued general obligation bonds to provide funds for the acquisition and construction of major capital facilities and other capital assets. The full faith and credit of the Board are irrevocably pledged for the payment of the principal of the bonds and the interest thereon.
Bonds payable at June 30, 2015 are comprised of the following issues:
$3,465,000,2001 Bonds, due in annual installments of$300,000 to $320,000 tlnough August 1, 2017, interest at 4.60-4.75%
$1,552,000, 2007 Bonds, due in annual installments of $40,000 to $317,000
$ 930,000
through July 15, 2022, interest at 4.25-4.375% 1,412,000
$ 2,342,000
46
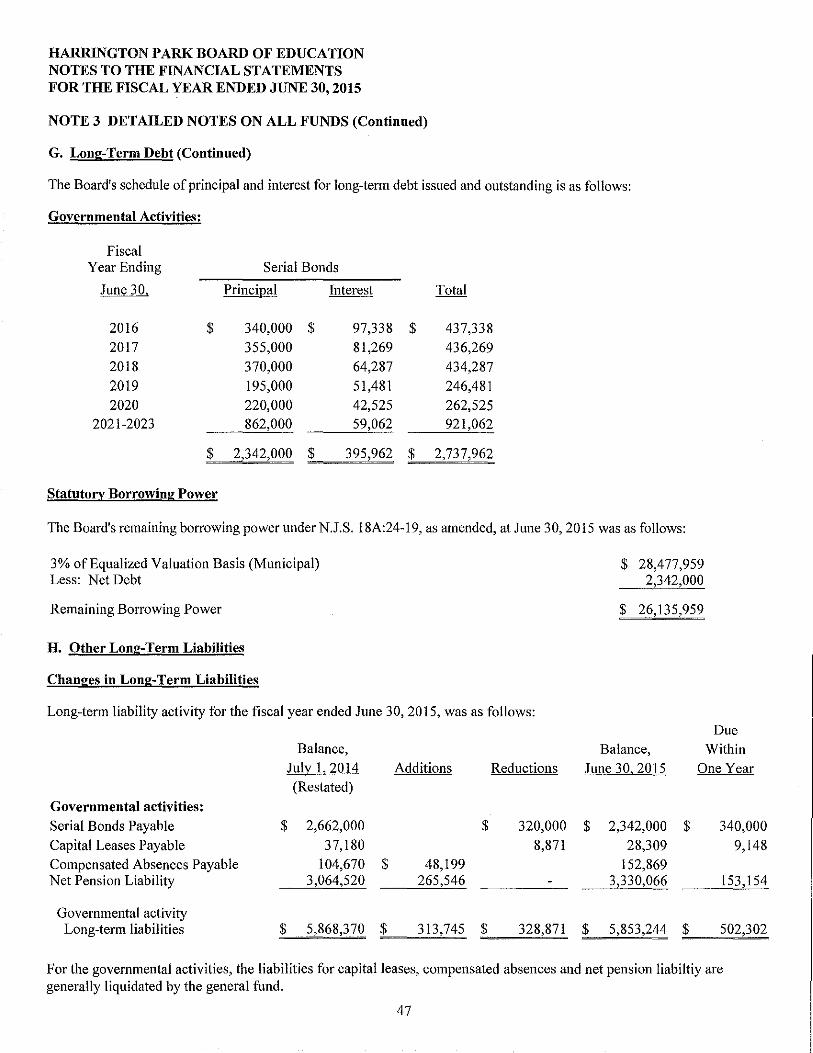
HARRINGTON PARK BOARD OF EDUCATION NOTES TO THE FINANCIAL STATEMENTS FOR THE FISCAL YEAR ENDED JUNE 30, 2015
NOTE 3 DETAILED NOTES ON ALL FUNDS (Continued)
G. Long-Term Debt (Continued)
The Board's schedule of principal and interest for long-term debt issued and outstanding is as follows:
Governmental Activities:
Fiscal Year Ending Serial Bonds
June 30, Principal Interest Total
2016 $ 340,000 $ 97,338 $ 437,338 2017 355,000 81,269 436,269 2018 370,000 64,287 434,287 2019 195,000 5 I ,481 246,481 2020 220,000 42,525 262,525
2021-2023 862,000 59,062 921,062
$ 2,342,000 $ 395,962 $ 2,737,962
Statuto a Borrowing Power
The Board's remaining borrowing power under N.J.S. 18A:24-19, as amended, at June 30, 2015 was as follows:
3% of Equalized Valuation Basis (Municipal) Less: Net Debt
Remaining Borrowing Power
H. Other Long-Term Liabilities
Changes in Long-Term Liabilities
Long-term liability activity for the fiscal year ended June 30,2015, was as follows:
Balance,
$ 28,477,959 2,342,000
$ 26,135,959
Balance, Due
Within July 1, 2014 Additions Reductions June 30, 2015 One Year (Restated)
Governmental activities: Serial Bonds Payable $ 2,662,000 $ 320,000 $ 2,342,000 $ 340,000 Capital Leases Payable 37,180 8,871 28,309 9,148 Compensated Absences Payable 104,670 $ 48,199 152,869 Net Pension Liability 3,064,520 265,546 3,330,066 153,154
Governmental activity Long-term liabilities $ 5,868,370 $ 313,745 $ 328,871 $ 5,853,244 $ 502,302
For the governmental activities, the liabilities for capital leases, compensated absences and net pension liabiltiy are generally liquidated by the general fund.
47

HARRINGTON PARK BOARD OF EDUCATION NOTES TO THE FINANCIAL STATEMENTS FOR THE FISCAL YEAR ENDED JUNE 30, 2015
NOTE 4 OTHER INFORMATION
A. Risk Management
The District is exposed to various risks of loss related to property, general liability, automobile coverage, theft of, damage to and destruction of assets; errors and omissions; injuries to employees; student accident; termination of employees and natural disasters. The Board has obtained commercial insurance coverage to guard against these events to minimize the exposure to the District should they occur. A complete schedule of insurance coverage can be found in the statistical section of this Comprehensive Annual Financial Report.
The District is a member of the Northeast Bergen County School Board Insurance Group (NESBIG). The Group is a risk sharing public entity pool, established for the purpose of insuring against worker's compensation claims.
The relationship between the Board and the insurance fund is governed by a contract and by-laws that have been adopted by resolution of each unit's governing body. The Board is contractually obligated to make all annual and supplementary contributions to the fund, to report claims on a timely basis, cooperate with the management of the fund, its claims administrator and attorneys in claims investigation and settlement, and to follow risk management procedures as outlined by the fund. Members have a contractual obligation to fund any deficit of the fund attributable to a membership year during which tl1ey were a member.
NESBIG provides its members with risk management services, including the defense of and settlement of claims and to establish reasonable and necessary loss reduction and prevention procedures to be followed by the members. Complete financial statements of the insurance fund are on file with the School's Business Administrator.
There has been no significant reduction in insurance coverage from the previous year nor have there been any settlements in excess of insurance coverage's in any of the prior three years.
The District has elected to fund its New Jersey Unemployment Compensation Insurance under the "Benefit Reimbursement Method". Under this plan the District is required to reimburse the New Jersey Unemployment Trust Fund for benefits paid to its former employees and charged to its account with the State. The District is billed quarterly for amounts due to the State. The following is a summary of District contributions, employee contributions, reimbursements to the State for benefits paid and the ending balance of the District's fiduciary trust fund for the current and previous two years:
District Employee Amount Ending Fiscal Year Contributions Contributions Reimbursed Balance
2015 $ 4,904 $ 10,719 $ 4,904 $ 59,851 2014 1,227 16,259 7,198 48,984 2013 8,849 10,190 8,849 33,859
B. Contingent Liabilities
The District is a party defendant in some lawsuits, none of a kind unusual for a school district of its size and scope of operation. In the opinion of the Board's Attorney the potential claims against the District not covered by insurance policies would not materially affect the financial condition of the District.
48

HARRINGTON PARK BOARD OF EDUCATION NOTES TO THE FINANCIAL STATEMENTS FOR THE FISCAL YEAR ENDED JUNE 30, 2015
NOTE 4 OTHER INFORMATION (Continued)
Federal and State Awards - The Board participates in a number of federal and state programs that are fully or partially funded by grants received from other governmental units. Expenditures financed by grants are subject to audit by the appropriate grantor government. If expenditures are disallowed due to noncompliance with grant program regulations, the Board may be required to reimburse the grantor government. As of June 30, 2015, significant amounts of grant expenditures have not been audited by the various grantor agencies but the Board believes that disallowed expenditures, if any, based on subsequent audits will not have a material effect on any of the individual governmental funds or the overall financial position of the District.
C. Federal Arbitrage Regulations
The District is subject to Section 148 of the Internal Revenue Code as it pertains to the arbitrage rebate on all tax-exempt obligations, both long and short-term debt. Under the 1986 Tax Reform Act, the Internal Revenue Service (IRS) required that all excess earnings from investment proceeds be rebated to the IRS. Arbitrage, for purposes of these regulations, is defined as the difference between the yield on the investment and the yield on the obligations issued. If there are excess eamings, this amount may be required to be rebated to the IRS. At June 30,2015, the District has not estimated its arbitrage earnings due to the IRS, if any.
D. Employee Retirement Systems and Pension Plans
The State of New Jersey sponsors and administers the following contributory defined benefit public employee retirement systems (retirement systems) covering substantially all eligible Board employees:
Public Employees' Retirement System (PERS)- Established in January 1955, under the provisions ofN.J.S.A. 43: !SA to provide coverage, including post-retirement health care, to substantially all full time employees of the State or any county, municipality, school district, or public agency provided the employee is not a member of another State-administered retirement system. Membership is mandatory for such employees and vesting occurs after 1 0 years of service for pension benefits and 25 years for post-retirement health care coverage. PERS is a cost sharing multi-employer defined benefit pension plan.
Teachers' Pension and Annuity Fnnd (TPAF)- Established in January 1955, under the provisions ofN.J.S.A. 18A:66 to provide coverage including post-retirement health care to substantially all full time certified teachers or professional staff of the public school systems in the State. Membership is mandatory for such employees and vesting occurs after 10 years of service for pension benefits and 25 years for post-retirement health care coverage. TP AF is a cost sharing plan with special funding situations.
The State of New Jersey sponsors and administers the following defined contribution public employee retirement program covering certain state and local government employees which include those Board employees who m·e eligible for pension coverage.
Defined Contribution Retirement Program (DCRP)- established under the provisions of Chapter 92, P.L. 2007 and Chapter I 03, P.L. 2008 to provide coverage to elected, certain appointed officials, and certain Board employees not eligible for enrollment in PERS or TPAF. Effective July 1, 2007 membership is mandatory for such individuals with vesting occurring after one (1) year of membership. DCRP is a defined contribution pension plan.
49
HARRINGTON PARK BOARD OF EDUCATION NOTES TO THE FINANCIAL STATEMENTS FOR THE FISCAL YEAR ENDED JUNE 30,2015
NOTE 4 OTHER INFORMATION (Continued)
D. Employee Retirement Systems and Pension Plans (Continued)
Other Pension Funds
The State established and administers a Supplemental Annuity Collective Trust Fund (SACT) which is available to active members of the State-administered retirement systems to purchase annuities to supplement the guaranteed benefits provided by their retirement system. The state or local government employers do not appropriate funds to SACT.
The cost of living increase for PERS and TPAF, are funded directly by each of the respective systems but are currently suspended as a result of reform legislation.
According to state law, all obligations of each retirement system will be assumed by the State of New Jersey should any retirement system be terminated.
The State of New Jersey, Department of the Treasury, Division of Pensions and Benefits, issues publicly available financial reports that include the financial statements and required supplementary information of each of the above systems. The financial reports may be accessed via the New Jersey, Division of Pensions and Benefits, website at www .state.nj. us/treasury/pensions.
Basis of Accounting
The financial statements of the retirement systems are prepared on the accrual basis of accounting. Employer contributions are recognized when payable to the retirement systems. Benefits or refunds are recognized when due and payable in accordance with the terms of the retirement systems.
Investment Valuation
Investments are reported at fair value. Securities traded on a national or international exchange are valued at the last reported sales price at current exchange rates. Mortgages are valued on the basis of future principal and interest payments, and are discounted at prevailing interest rates for similar instruments. The fair value of real estate investments is based on independent appraisals. Investments that do not have an established market are reported at estimated fair values.
The State of New Jersey, Department of the Treasury, Division of Investment, issues publicly available financial reports that include the financial statements of the State of New Jersey Cash Management Fund. The financial reports may be obtained in writing to the State of New Jersey, Department of the Treasury, Division of Investment, P.O. Box 290, Trenton, New Jersey 08625-0290 or at www.state.nj/treasury/doinvest.
50

HARRINGTON PARK BOARD OF EDUCATION NOTES TO THE FINANCIAL STATEMENTS FOR THE FISCAL YEAR ENDED JUNE 30, 2015
NOTE 4 OTHER INFORMATION (Continued)
D. Employee Retirement Systems and Pension Plans (Continued)
Funding Status and Funding Progress
As of July 1, 2013, the most recent actuarial valuation date, the aggregate funded ratio for all the State administered retirement systems including TPAF and PERS, is 62.8 percent with an unfunded actuarial accrued liability of $51.0 billion. The aggregate funded ratio and unfunded accrued liability for the State-funded systems is 54.2 percent and $37.3 billion, and the aggregate funded ratio and unfunded accrued liability for local PERS and Police and Firemen's Retirement System ("PFRS") is 75.4 percent and $13.7 billion, respectively.
The funded status and funding progress of the retirement systems is based on actuarial valuations which involve estimates of the value of reported amounts and assumptions about the probability of events far into the future. These amounts are subject to continual revision as actual results are compared to past expectations and new estimates are made about the probability of future events.
Actuarial calculations reflect a long-term perspective and are based on the benefits provided under the terms of the retirement systems in effect at the time of each valuation and also consider the pattem of the sharing of costs between the employer and members at that point in time. The projection of benefits for financing reporting purposes does not explicitly incorporate the potential effects of legal or contractual funding limitations on the pattern of cost sharing between the employer and members in the future.
Actuarial Methods and Assumptions
In the July 1, 2013 actuarial valuation, the projected unit credit was used as the actuarial cost method, and the five year average of market value was used as the asset valuation method for the retirement systems. The actuarial assumptions included (a) an investment rate of return for the retirement systems of 7.90 percent and (b) projected salary increases of 4.24 percent for the PERS and 3.33 percent for TPAF.
Employer and Employee Pension Contributions
The contribution policy is set by laws of the State of New Jersey and contributions are required by active members and participating employers. Plan member and employer contributions may be amended by State of New Jersey legislation with the amount of contributions by the State of New Jersey contingent upon the Annual Appropriations Act. As defined, the retirement systems require employee contributions based on 6.9% for PERS, 6.9% for TPAF and 5.50% for DCRP of the employee's annual compensation.
Annual Pension Costs (APC)
Per the requirements of GASB Statement No. 27 Accounting for Pensions by State and Local Government Employees, for the fiscal year ended June 30, 2015 for TPAF, which is a cost sharing plan with special funding situations, the annual pension cost differs from the annual required contribution. For PERS, which is a cost sharing multi-employer defined benefit pension plan, the annual pension cost equals contributions made. TP AF employer contributions are made annually by the State of New Jersey to the pension system on behalf of the Board. PERS employer contributions are made annually by the Board to the pension system in accordance with Chapter 114, P.L. 1997. In the DCRP, which is a defined contribution plan, member contributions are matched by a 3% employer contribution.
51

HARRINGTON PARK BOARD OF EDUCATION NOTES TO THE FINANCIAL STATEMENTS FOR THE FISCAL YEAR ENDED JUNE 30, 2015
NOTE 4 OTHER INFORMATION (Continued)
D. Employee Retirement Systems and Pension Plans (Continued)
During the fiscal years ended June 30, 2015, 2014 and 2013 the Board was required to contribute for PERS and DCRP and the State of New Jersey was required to contribute for TPAF for normal cost pension and accrued liability contributions (including non-contributory group life insurance (NCGI)) the following amounts:
Year Ended On-behalf June 30, PERS TPAF DCRP
2015 $ 146,783 $ 253,146 $ 2,029 2014 124,880 196,431 945 2013 117,148 308,079 784
For fiscal years 2014/2015 and 2012/2013, the state contributed $253,146 and $308,079, respectively for normal cost pension, accrued liability and the NCGI premium. For fiscal year 2013/2014 the State did not contribute to the TPAF for accrued liability but did contribute $196,431 for normal cost pension and NCGI premium.
The PERS contributions are recognized in the governmental fund financial statements (modified accrual basis) as an expenditure. The on-behalf TPAF contributions ru·e recognized in the governmental fund financial statements (modified accrual basis) as both a revenue and expenditure in accordance with GASB No. 24. The DCRP contributions are recognized in the governmental fund financial statements (modified accrual basis) as an expenditure, as well as, the district-wide financial statements (accrual basis) as an expense.
Also, in accordance with N.J.S.A. 18A:66-66 the State of New Jersey reimbursed the Board $343,257 during the fiscal year ended June 30, 2015 for the employer's share of social security contributions for TPAF members as calculated on their base salaries. This amount has been recognized in the district-wide financial statements (accrual basis) and the governmental fund financial statements (modified accrual basis) as a revenue and expense/expenditure in accordance with GASB No. 24.
Pension Liabilities, Pension Expense, and Deferred Outflows of Resources and Deferred Inflows of Resources Related to Pensions
Public Employees Retirement System (PERS)
At June 30, 2015, the District reported in the statement of net position (accrual basis) a liability of $3,330,066 for its proportionate share of the PERS net pension liability. The net pension liability was measured as of June 30,2014 and the total pension liability used to calculate the net pension liability was determined by an actuarial valuation as of that date. The District's proportionate share of the net pension liability was based on a projection of the District's long-term share of contributions to the pension plan relative to the projected contributions of all participating governmental entities, actuarially determined. At June 30, 2014, the District's proportionate share was .01779 percent, which was an increase of .00176 percent from its proportionate share measured as of June 30, 2013.
52
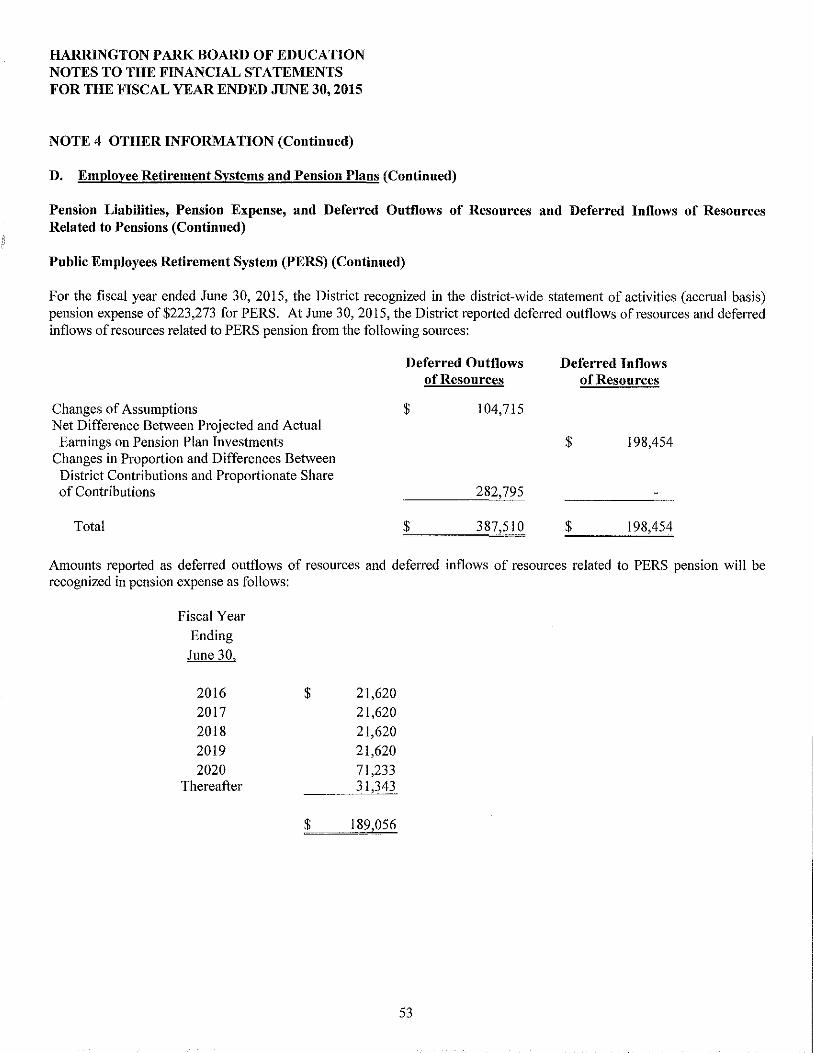
HARRINGTON PARK BOARD OF EDUCATION NOTES TO THE FINANCIAL STATEMENTS FOR THE FISCAL YEAR ENDED JUNE 30, 2015
NOTE 4 OTHER INFORMATION (Continued)
D. Employee Retirement Systems and Pension Plans (Continued)
Pension Liabilities, Pension Expense, and Deferred Outflows of Resources and Deferred Inflows of Resources Related to Pensions (Continued)
Public Employees Retirement System (PERS) (Continued)
For the fiscal year ended June 30, 2015, the District recognized in the district-wide statement of activities (accrual basis) pension expense of $223,273 for PERS. At June 30, 2015, the District rep01ted deferred outflows of resources and deferred inflows of resources related to PERS pension from the following sources:
Deferred Outflows Deferred Inflows of Resources of Resources
Changes of Assumptions $ 104,715 Net Difference Between Projected and Actual
Earnings on Pension Plan Investments $ 198,454 Changes in Proportion and Differences Between
District Contributions and Proportionate Share of Contributions 282,795
Total $ 387,510 $ 198,454
Amounts reported as deferred outflows of resources and deferred inflows of resources related to PERS pension will be recognized in pension expense as follows:
Fiscal Year Ending June 30,
2016 $ 21,620 2017 21,620 2018 21,620 2019 21,620 2020 71,233
Thereafter 31,343
$ 189,056
53

HARRINGTON PARK BOARD OF EDUCATION NOTES TO THE FINANCIAL STATEMENTS FOR THE FISCAL YEAR ENDED JUNE 30, 2015
NOTE 4 OTHER INFORMATION (Continued)
D. Employee Retirement Systems and Pension Plans (Continued)
Pension Liabilities, Pension Expense, and Deferred Outflows of Resources aud Deferred Inflows of Resources Related to Pensions (Continued)
Public Employees Retirement System (PERS) (Continued)
Actuarial Assumptions
The total pension liability for the June 30, 2014 measurement date was determined by an actuarial valuation as of July 1, 2013, which was rolled forward to June 30, 2014. The total pension liability for the June 30, 2013 measurement date was determined by an actuarial valuation as of July 1, 2013. This actuarial valuation used the following actuarial assumptions, applied to all periods in the measurement:
Inflation Rate Salary Increases:
2012-2021
Thereafter
Investment Rate of Return Mortality Rate Table Period of Actuarial Experience
Study Upon Which Actuarial Assumptions were Based
3.01%
2.15-4.40% Based on Age 3.15-5.40%
Based on Age 7.90%
RP-2000 July I, 2008-June 30, 2011
Assumptions for mortality improvements are based on Society of Actuaries Scale AA.
54

HARRINGTON PARK BOARD OF EDUCATION NOTES TO THE FINANCIAL STATEMENTS FOR THE FISCAL YEAR ENDED JUNE 30, 2015
NOTE 4 OTHER INFORMATION (Continued)
D. Employee Retirement Systems and Pension Plans (Continued)
Pension Liabilities, Pension Expense, and Deferred Outflows of Resources and Deferred Inflows of Resources Related to Pensions (Continued)
Public Employees Retirement System (PERS) (Continued)
Long-Term Expected Rate of Return
The long-term expected rate of return on pension plan investments was determined using a building-block method in which best-estimate ranges of expected future real rate of return (expected returns, net of pension plans investment expense and inflation) are developed for each major asset class. These ranges are combined to produce the long-term expected rate of return by weighting the expected future real rates of return by the target asset allocation percentage and by adding expected inflation. Best estimates of arithmetic real rates of return for each major asset class included in the pension plans' target asset allocation as of June 30, 2014 are summarized in the following table:
Long-Term
Target Expected Real
Asset Class Allocation Rate of Return
Cash 6.00% 0.80%
Core Bonds 1.00% 2.49%
Intermediate-Term Bonds 11.20% 2.26%
Mortgages 2.50% 2.17%
High Yield Bonds 5.50% 4.82%
Inflation-Indexed Bonds 2.50% 3.51%
Broad US Equities 25.90% 8.22%
Developed Foreign Equities 12.70% 8.12%
Emerging Market Equities 6.50% 9.91%
Private Equity 8.25% 13.02% Hedge Funds/ Absolute Return 12.25% 4.92%
Real Estate (Property) 3.20% 5.80% Commodities 2.50% 5.35%
Discount Rate
The discount rate used to measure the total pension liabilities of the PERS plan was as follows:
Discount Rate
PERS 5.39%
55

HARRINGTON PARK BOARD OF EDUCATION NOTES TO THE FINANCIAL STATEMENTS FOR THE FISCAL YEAR ENDED JUNE 30, 2015
NOTE 4 OTHER INFORMATION (Continued)
D. Employee Retirement Systems and Pension Plans (Continued)
Pension Liabilities, Pension Expense, and Deferred Outflows of Resources and Deferred Inflows of Resources Related to Pensions (Continued)
Public Employees Retirement System (PERS) (Continued)
Discount Rate (Continued)
The following table represents the crossover period, if applicable, for the PERS defined benefit plan:
Period of Projected Benefit Payments for which the Following Rates were Applied:
Long-Term Expected Rate of Return
Municipal Bond Rate *
Through June 30, 2033
From July 1, 2033 and Thereafter
* The municipal bond return rate used is 4.29%. The source is the Bond Buyer Go 20-Bond Municipal Bond Index, which includes tax-exempt general obligation municipal bonds with an average rating of AA/Aa or higher.
Sensitivity of Net Pension Liability
The following presents the District's proportionate share of the PERS net pension liability calculated using the discount rate of 5.39%, as well as what the District's proportionate share of the PERS net pension liability would be if it were calculated using a discount rate that is !-percentage-point lower (4.39 percent) or ]-percentage-point higher (6.39 percent) than the current rate:
District's Proportionate Share of the PERS Net Pension Liability
1% Decrease {4.39%)
$ 4,189,323 $
Current Discount Rate
{5.39%)
3,330,066
1% Increase {6.39%)
$ 2,608,507
The sensitivity analysis was based on the proportionate share of the District's net pension liability at June 30, 2014. A sensitivity analysis specific to the District's net pension liability was not provided by the pension system.
Pension Plan Fiduciary Net Position
Detailed information about the PERS pension plan's fiduciary net position is available in the separately issued financial report from the State of New Jersey, Department of the Treasury, Division of Pension and Benefits. The financial repmt may be accessed via the New Jersey, Division of Pensions and Benefits, website at www.state.nj.us/treasury/pensions.
56

HARRINGTON PARK BOARD OF EDUCATION NOTES TO THE FINANCIAL STATEMENTS FOR THE FISCAL YEAR ENDED JUNE 30, 2015
NOTE 4 OTHER INFORMATION (Continued)
D. Employee Retirement Systems and Pension Plans (Continued)
Pension Liabilities, Pension Expense, and Deferred Outflows of Resources and Deferred Inflows of Resources Related to Pensions (Continued)
Teachers Pension and Annuity Fund (TP AF)
In accordance with GASB Statement No. 68, Accounting and Financial Reporting for Pensions, the District is not required to recognize a net pension liability for TPAF. The State ofNew Jersey is the only entity that has a legal obligation to make employer contributions to TPAF on behalf of the District. Accordingly, the District's proportionate share percentage determined under Statement No. 68 is zero percent and the State's proportionate share is 100% for TPAF. Therefore, in addition, the District does not recognize any portion of the TPAF collective deferred outflows of resources and deferred inflows of resources.
For the fiscal year ended June 30, 2015, the District recognized in the district-wide statement of activities (accrual basis) pension expense of$1,335,390 for TPAF. This amount has been included in the district-wide statement of activities (accrual basis) as a revenue and expense in accordance with GASB No. 24.
At June 30, 2015 the State's proportionate share of the net pension liability attributable to the District is $24,817,038. The nonemployer allocation percentages are based on the ratio of the State's contributions made as an employer and nonemployer towards the actuarially determined contribution amount adjusted by locations who participated in the State early retirement incentives to total contributions to TPAF during the year ended June 30, 2014.
Actuarial Assumptions
The total pension liability for the June 30, 2014 measurement date was determined by an actuarial valuation as of July 1, 2013, which was rolled forward to June 30, 2014. The total pension liability for the June 30, 2013 measurement date was determined by an actuarial valuation as of July I, 2013. This actuarial valuation used the following actuarial assumptions, applied to all periods in the measurement.
Inflation Rate Salary Increases:
2012-2021
Thereafter
Investment Rate of Return Mortality Rate Table Period of Actuarial Experience
Study Upon Which Actuarial Assumptions were Based
2.50%
Varies based on experience Varies based on experience
7.90% RP-2000
July I, 2009-June 30, 2012
Assumptions for mortality improvements are based on Society of Actuaries Scale AA.
57

HARRINGTON PARK BOARD OF EDUCATION NOTES TO THE FINANCIAL STATEMENTS FOR THE FISCAL YEAR ENDED JUNE 30, 2015
NOTE 4 OTHER INFORMATION (Continued)
D. Employee Retirement Systems and Pension Plans (Continued)
Pension Liabilities, Pension Expense, and Deferred Outflows of Resources and Deferred Inflows of Resources Related to Pensions (Continued)
Teachers Pension and Annuity Fund (TPAF) (Continued)
Long-Term Expected Rate of Return
The long-term expected rate of return on pension plan investments was determined using a building-block method in which best-estimate ranges of expected future real rate of return (expected returns, net of pension plans investment expense and inflation) are developed for each major asset class. These ranges are combined to produce the long-term expected rate of return by weighting the expected future real rates of return by the target asset allocation percentage and by adding expected inflation. Best estimates of arithmetic real rates of return for each major asset class included in the pension plans' target asset allocation as of June 30,2014 are summarized in the following table:
Long-Term Target Expected Real
Asset Class Allocation Rate of Return
Cash 6.00% 0.50% Core Fixed Income 0.00% 2.19% Core Bonds 1.00% 1.38% Short-Term Bonds 0.00% 1.00% Intermediate-Term Bonds 11.20% 2.60% Long-Term Bonds 0.00% 3.23% Mortgages 2.50% 2.84% High Yield Bonds 5.50% 4.15% Non-US Fixed Income 0.00% 1.41% Inflation-Indexed Bonds 2.50% 1.30% Broad US Equities 25.90% 5.88% Large Cap US Equities 0.00% 5.62% Mid Cap US Equities 0.00% 6.39% Small Cap US Equities 0.00% 7.39% Developed Foreign Equities 12.70% 6.05% Emerging Market Equities 6.50% 8.90% Private Equity 8.25% 9.15% Hedge Funds/Absolute Return 12.25% 3.85%
Real Estate (Property) 3.20% 4.43% Real Estate (REITS) 0.00% 5.58% Commodities 2.50% 3.60%
Long Credit Bonds 0.00% 3.74%
58

HARRINGTON PARK BOARD OF EDUCATION NOTES TO THE FINANCIAL STATEMENTS FOR THE FISCAL YEAR ENDED JUNE 30, 2015
NOTE 4 OTHER INFORMATION (Continued)
D. Employee Retirement Systems and Pension Plans (Continued)
Pension Liabilities, Pension Expense, and Deferred Outflows of Resources and Deferred Inflows of Resources Related to Pensions (Continued)
Teachers Pension and Annuity Fund (TPAF) (Continued)
Discount Rate
The discount rate used to measure the total pension liabilities of the TPAF plan was as follows:
Discount Rate
TPAF 4.68%
The following table represents the crossover period, if applicable, for the TPAF defined benefit plan:
Period of Projected Benefit
Payments for which the Following
Rates were Applied:
Long-Term Expected Rate of Return
Municipal Bond Rate *
Through June 30, 2027
From July I, 2027
and Thereafter
* The municipal bond return rate used is 4.29%. The source is the Bond Buyer Go 20-Bond Municipal Bond lndex, which includes tax-exempt general obligation municipal bonds with an average rating of AA/Aa or higher.
Sensitivity of Net Pension Liability
The following presents the State's proportionate share of the TPAF net pension liability attributable to the District calculated using the discount rate of 4.68%, as well as what the State's proportionate share of the TPAF net pension liability attributable to the District that would be if it were calculated using a discount rate that is !-percentage-point lower (3.68 percent) or !-percentage-point higber (5.68 percent) than the current rate:
1% Current 1% Decrease Discount Rate Increase (3.68%) (4.68%) (5.68%)
State's Proportionate Share of the TPAF Net Pension Liability Attributable to the District $ 29,848,444 $ 24,817,038 $ 20,632,389
The sensitivity analysis was based on the State's proportionate share of the net pension liability attributable to the District at June 30, 2014. A sensitivity analysis specific to the State's propmtionate share of the net pension liability attributable to the District at June 30,2014 was not provided by the pension system.
59

HARRINGTON PARK BOARD OF EDUCATION NOTES TO THE FINANCIAL STATEMENTS FOR THE FISCAL YEAR ENDED JUNE 30, 2015
NOTE 4 OTHER INFORMATION (Continued)
D. Employee Retirement Systems and Pension Plans (Continued)
Pension Liabilities, Pension Expense, and Deferred Outflows of Resources and Deferred Inflows of Resources Related to Pensions (Continued)
Teachers Pension and Annuity Fund (TPAF) (Continued)
Pension Plan Fiduciary Net Position
Detailed information about the TPAF pension plan's fiduciary net position is available in the separately issued financial report from the State of New Jersey, Department of the Treasury, Division of Pension and Benefits. The financial report may be accessed via the New Jersey, Division of Pensions and Benefits, website at www.state.nj.us/treasury/pensions.
E. Post-Retirement Medical Benefits
The State of New Jersey sponsors and administers the post-retirement health benefit program plans for school districts. The Plans are classified as either single employer plans or cost sharing multiple employer defined benefit plans depending on the plan the eligible employee is covered under.
As a result of implementing Governmental Accounting Standards Board (GASB) Statement No. 43, Financial Reportingfor Post-employment Benefit Plans Other than Pension Plans (OPEB), effective for Fiscal Year 2007, the State Health Benefits Program (SHBP), and the Prescription Drug Program (PDP), and Post-Retirement Medical (PRM) of the PERS and TPAF are combined and reported as Pension and Other employee Benefit Trust Funds in the State's Comprehensive Annual Financial Report (CAFR). Specifically, SHBP-State, and the PRM of the PERS are combined and reported as a Health Benefits Program Fund - State classified as a single employer plan. The SHBP-Local, PDP-Local, and the PRM of the TPAF-Local are combined and reported as Health Benefits Program Fund -Local Government classified as a cost-sharing multiple-employer plan in the State's CAFR. The post-retirement benefit programs had a total of 590 state and local participating employers and contributing entities for Fiscal Year 2014.
The State of New Jersey sponsors and administers the following health benefit programs covering certain state and local government employees, including those Board employees and retirees eligible for coverage.
Health Benefits Program Fund (HBPF) - Local Education (including Prescription Drug Program Fund) - The State of New Jersey provides paid coverage to members of the Teachers' Pension and Annuity Fund who retire from a board of education or county college with 25 years of service or on a disability retirement. Under the provisions of P.L. 1992, c.l26, the State also provides paid coverage to members of the Public Employees' Retirement System and Alternate Benefits Program who retire from a board of education or county college with 25 years of service or on a disability retirement if the member's employer does not provide this coverage. Certain local participating employers also provide post-retirement medical coverage to their employees. Retirees who are not eligible for state paid health coverage at retirement can continue in the program if their employer participates in this program or if they are participating in the health benefits plan of their former employer and are enrolled in Medicare parts A and B by paying the cost of the insurance for themselves and their covered dependents. Also, education employees are eligible for the PDP coverage after 60 days of employment.
The State of New Jersey, Department of the Treasury, Division of Pensions and Benefits, issues publicly available financial reports that include the financial statements and required supplementary information of the above Fund. The financial reports may be accessed via the State ofNew Jersey, Department of the Treasury, Division of Pensions and Benefits, website at www.state.nj.us/treasury/pensions.
60

HARRINGTON PARK BOARD OF EDUCATION NOTES TO THE FINANCIAL STATEMENTS FOR THE FISCAL YEAR ENDED JUNE 30, 2015
NOTE 4 OTHER INFORMATION (Continued)
E. Post-Retirement Medical Benefits (Continued)
Basis of Accounting
The financial statements of the health benefit programs are prepared on the accrual basis of accounting. Employer contributions are recognized when payable to the health benefit programs. Benefits or refunds are recognized when due and payable in accordance with the terms of the health benefit programs.
Significant Legislation
P.L. 2011, c.78, effective October 2011, sets new employee contribution requirements towards the cost of employerprovided health benefit coverage. Employees are required to contribute a certain percentage of the cost of coverage. The rate of contribution is determined based on the employee's annual salary and the selected level of coverage. The increased employee contributions will be phased in over a 4-year period for those employed prior to this new legislation's effective date with a minimum contribution required to be at least 1.5% of salary.
Investment Valuation
Investments are reported at fair value. Investments that do not have an established market are reported at estimated fair values.
Funded Status and Funding Progress
As of July I, 2013, the most recent actuarial valuation date, the State had a $53.0 billion unfunded actuarial accrued liability for other post-employment benefits (OPEB) which is made up to $19.7 billion for state active and retired members and $33.3 billion for education employees and retirees that become the obligation of the State ofNew Jersey upon retirement.
The funded status and funding progress of the OPEB includes actuarial valuations which involve estimates of the value of reported amounts and assumptions about the probability of events far into the future. These amounts are subject to continual revision as actual results are compared to past expectations and new estimates are made about the probability of future events.
Actuarial calculations reflect a long-term perspective and are based on the benefits provided under the terms of the OPEB in effect at the time of each valuation and also consider the pattern of the sharing of costs between the employer and members at the point in time. The projection of benefits for financial reporting purposes does not explicitly incorporate the potential effects of legal or contractual funding limitations on the pattern of cost sharing between the employer and members in the future.
Actuarial Methods and Assumptions
In the July I, 2013, OPEB actuarial valuation, the projected unit credit was used as the actuarial cost method. The actuarial assumptions included an assumed investment rate of return of 4.50 percent.
61

HARRINGTON PARK BOARD OF EDUCATION NOTES TO THE FINANCIAL STATEMENTS FOR THE FISCAL YEAR ENDED JUNE 30, 2015
NOTE 4 OTHER INFORMATION (Continued)
E. Post-Retirement Medical Benefits (Continued)
Post-Retirement Medical Benefits Contributions
P.L. 1987, c. 384 and P.L. 1990, c.6 required the Teachers' Pension and Annuity Fund (TPAF) and Public Employees' Retirement System (PERS), respectively to fund post-retirement medical benefits for those State employees and education employees who retire after accumulating 25 years of credited service or on a disability retirement. As of June 30, 2014, there were 103,432, retirees receiving post-retirement medical benefits and the State contributed $1.04 billion on their behalf. The cost of these benefits is funded through contributions by the State and in accordance with P.L. 1994, c.62. Funding of post-retirement medical benefits changed from a pre-funding basis to a pay-as-you-go basis beginning in Fiscal Year 1994.
The State is also responsible for the cost attributable to P.L. 1992, c.126, which provides employer paid health benefits to members of PERS and the Alternate Benefit Program who retired from a board of education or county college with 25 years of service. The State paid $165.8 million toward Chapter 126 benefits for 18,122 eligible retired members in Fiscal Year 2014.
The State sets the contribution rate based on a pay as you go basis and not on the annual required contribution of the employers (ARC), an amount actuarially determined in accordance with the parameters of GASB Statement 45. The ARC represents a level of funding that, if paid on an ongoing basis, is projected to cover normal cost each year and amortize any unfunded actuarial liabilities (or funding excess) of the plan over a period not to exceed thirty years. The State's contributions to the State Health Benefits Program Fund for TPAF retirees' post-retirement benefits on behalf of the School District for the fiscal years ended June 30, 2015, 2014 and 2013 were $401,869, $322,074 and $348,360, respectively, which equaled the required contributions for each year. The State's contributions to the State Health Benefits Program Fund for PERS retirees' post-retirement benefits on behalf of the School District was not determined or made available by the State of New Jersey.
NOTE 5 RESTATEMENT
On July 1, 2014, the Harrington Park Board of Education implemented GASB Statement No. 68, "Accounting and Financial Reporting for Pensions. The Harrington Park Board of Education has determined that the effect of implementing this accounting change on the financial statements previously reported as of and for the fiscal year ended June 30, 2014 was to recognize the District's proportionate share of the Public Employees' Retirement System's (PERS) net pension liability, deferred outflows of resources and deferred inflows of resources with a corresponding reduction in the unrestricted component of net position in the amount of $3,064,520. The result of this restatement is to reduce total net position of Governmental Activities at June 30, 2014 from $6,312,087 as originally reported to $3,247,567 as adjusted for the effects of the change in accounting principle.
62

REQUIRED SUPPLEMENTARY INFORMATION- PART II
BUDGET COMPARISON SCHEDULES

EXHIBIT C~l
HARRINGTON PARK BOARD OF EDUCATION GENERAL FUND
SCHEDULE OF REVENUES, EXPENDITURES AND CHANGES IN FUND BALANCE- BUDGET AND ACTUAL FOR THE FISCAL YEAR ENDED JUNE 30, 2015
Variance Final Original Final Budget To Budget Adjustments Budget Actual Actual
REVENUES Local Sources
Local Tax Levy $ 10,511,796 $ 10,511,796 $ 10,511,796 Miscellaneous 146,577 146,577 194,595 $ 48,018
Total Local Sources 10,658,373 I 0,658,373 10,706,391 48,018
State Sources Special Education Aid 259,783 259,783 259,783 Transportation Aid 4,026 4,026 4,026 Equalization Aid 2,401 2,401 2,401 Security Aid 9,528 9,528 9,528 Additional Adjustment Aid I I I PAH .. CC Readiness Aid 6,440 6,440 6,440 Per Pupil Growth Aid 6,440 6,440 6,440 Extraordinary Aid 260,954 260,954 Non Public Transportation Aid 1,218 1,218 On~behalfTPAF Pension System Payments(Non~Budget) Normal Cost 236,156 236,156 NCGI 16,990 16,990 Post Retirement Medical Contribution 401,869 401,869 On~behalfTPAF Social Security Payments
(Non-Budget) 343,257 343,257
Total State Sources 288,619 288,619 1,549,063 1,260,444
Total Revenues 10,946,992 10,946,992 12,255,454 1,308,462
EXPENDITURES Instruction - Regular Programs
Salaries of Teachers Kindergarten 356,442 $ (13,122) 343,320 336,354 6,966 Grades 1-5 1,768,079 59,280 1,827,359 1,811,453 15,906 Grades 6-8 1,243,545 (137,214) 1,106,331 1,106,331
Regular Programs - Undistributed Instruction Purchased Professional-Educational Services 4,080 4,080 3,296 784 Other Purchased Services 62,982 4,397 67,379 57,762 9,617 General Supplies 75,000 21,626 96,626 88,506 8,120 Textbooks 35,000 (15,476) 19,524 19,344 180
Total Regular Programs 3,545,128 (80,509) 3,464,619 3,423,046 41,573
Special Education Resource Room/Resource Center
Salaries of Teachers 617,635 617,635 608,078 9,557 Other Salaries for Instruction 607,502 90,070 697,572 697,572 Purchased Professional Educational Services 1,534 1,534 1,534 General Supplies 2,400 (21) 2,379 1,966 413 Textbooks 4,125 4,125 3,894 231
Total Resource Room/Resource Center 1,227,537 95,708 I ,323,245 1,313,044 10,201
Continued 63

HARRINGTON PARK BOARD OF EDUCATION GENERAL FUND
SCHEDULE OF REVENlJES, EXPENDITURES AND CHANGES IN FUND BALANCE- BUDGET AND ACTUAL FOR THE FISCAL YEAR ENDED JUNE 30, 2015
EXHIBIT C-1
Variance Final Original Final Budget To Budget Adjustments Budget Actual Actual
EXPENDITURES CURRENT EXPENDITURES (Continued)
Home Instruction Purchased Professional Educational Services $ 43,000 $ 9,219 $ 52,219 $ 36,906 $ 15,313
Total Home Instruction 43,000 9,219 52,219 36,906 15,313
Total Special Education 1,270,537 104,927 1,375,464 1,349,950 25,514
Basic Skills/Remedial General Supplies 353 353 353
Total Basic Skills/Remedial 353 353 353
Bilingual Education- Instruction Salaries of Teachers 73,338 986 74,324 74,324
General Supplies 250 455 705 598 107 Textbooks 486 486 486
Total Bilingual Education- Instruction 73,588 1,927 75,515 75,408 107
School Sponsored Co/Extra Curricular Activities Salaries 63,060 16,161 79,221 79,221
Purchased Services 3,000 2,435 5,435 3,984 1,451 Supplies and Materials 500 (426) 74 74
Total School Sponsored Co/Extra Curricular Activities 66,560 18,170 84,730 83,205 1,525
School Sponsored Athletics Salaries 24,960 (13,209) 11,751 11,751
Purchased Services 4,500 (1,575) 2,925 2,925 Supplies and Materials 2,830 (1,417) 1,413 1,413
Total School Sponsored Athletics 32,290 (16,201) 16,089 16,089
Total Instruction 4,988,103 28,667 5,016,770 4,948,051 68,719
Undistributed Expenditures Instruction Tuition to Other LEAs Within the State~ Special 1,192,390 1,796 1,194,186 930,348 263,838 Tuition to Priv. School for the Disable WII State 84,801 41,654 126,455 126,455
Total Undistributed Expenditures-
Instruction 1,277,191 43,450 1,320,641 1,056,803 263,838
Attendance and Social Work Salaries 26,175 24,936 51,111 51,111
Total Attendance and Social Work 26,175 24,936 51,111 51,111
Health Services Salaries 76,827 3,446 80,273 80,273 Purchased Professional and Technical Services 7,500 (36) 7,464 7,390 74 Supplies and Materials 2,500 1,919 4,419 4,419
Total Health Services 86,827 5,329 92,156 92,082 74
64 Continued

EXHIBIT C-1
HARRINGTON PARK BOARD OF EDUCATION GENERAL FUND
SCHEDULE OF REVENUES, EXPENDITURES AND CHANGES IN FUND BALANCE- BUDGET AND ACTUAL FOR THE FISCAL YEAR ENDED JUNE 30, 2015
Variance Final Original Final Budget To Budget Adjustments Budget Actual Actual
EXPENDITURES CURRENT EXPENDITURES (Continued)
Speech, OT, PT & Related Services Salaries $ 148,343 $ (13,851) $ 134,492 $ 134,492 Purchased Professional-Educational Services 60,000 3,539 63,539 59,688 $ 3,851 Supplies and Materials 1,900 1,900 1,329 571
Total Speech, OT, PT & Related Services 208,343 (8,412) 199 931 195,509 4,422
Guidance Salaries of Other Professional Staff 120,173 (20,691) 99,482 98,177 1,305 Salaries of Secretarial and Clerical Assistants 15,820 15,820 15,329 491
Other Purchased Services 1,000 1,000 1,000 Supplies and Materials 500 500 90 410
Total Guidance 137,493 ___ (20,691) 116,802 113,596 3,206
Child Study Teams Salaries of Other Professional Staff 328,699 12,979 341,678 341,678
Salaries of Secretarial and Clerical Assistants 38,722 38,722 38,647 75
Purchased Professional-Educational Services 35,000 (500) 34,500 33,007 1,493
Other Purchased Services 1,737 27 1,764 1,764 Supplies and Materials 2,500 6,235 8,735 8,444 291
Total Child Study Teams 406,658 18,741 425,399 423,540 1,859
Improvement ofinst. Serv. Salaries of Other Professional Staff 67,670 67,670 67,670
Total improvement oflnst. Serv. 67,670 67,670 67,670
Educational Media Services/School Library Salaries 78,271 78,271 75,756 2,515
Purchased Professional and Technical Services 66,300 9,111 66,300 74,352 (8,052)
Other Purchased Services 9,111 (9,111) 9,111 9,111 Supplies and Materials 23 300 23,300 19,705 3,595
Total Educational Media Serv./School Library 176 982 176,982 169,813 7,169
Instructional Staff Training Services Salaries of Other Professional Staff 17,038 (11,329) 5,709 1,123 4,586
Purchased Professional - Educational Services 50,000 4,151 54,151 54,064 87
Other Purchased Services 500 294 794 794 Other Objects 250 250 250
Total Instructional StaffTraining Services 67,788 (6,884) 60,904 55,981 4,923
Continued 65

HARRINGTON l,ARK BOARD OF EDUCATION GENERAL FUND
SCHEDULE OF REVENUES, EXPENDITURES AND CHANGES IN FUND BALANCE- BUDGET AND ACTUAL FOR THE FISCAL YEAR ENDED .JUNE 30, 2015
EXIIIBIT C-1
Variance Final Original Final Budget To Budget Adjustments Budget Actual Actual
EXPENDITURES CURRENT EXPENDITURES (Continued)
Support Services General Administration
Salaries $ 237,721 $ (7,174) $ 230,547 $ 230,547
Legal Services 25,000 2,798 27,798 27,511 $ 287
Audit 17,500 19,050 36,550 18,350 18,200
Architectural/Engineering Services 5,000 3,520 8,520 8,520
Other Purchased Professional Services 2,000 2,000 2,000
Communicationsrfelephone 27,000 (1,363) 25,637 25,288 349
BOE Other Purchased Services 2,500 (582) 1,918 1,918
Miscellaneous Purchased Services 12,922 4,328 17,250 15,193 2,057
General Supplies 1,000 1,000 967 33 Miscellaneous Expenditures 10,000 2,000 12,000 11,369 631 BOE Membership Dues and Fees !0,000 863 10,863 !0,860 3
Total Support Services General Administration 348,643 25,440 374,083 352,523 21,560
Support Services School Administration Salaries of Principal/Asst. Principals 154,330 250 154,580 154,580
Salaries of Secretarial and Clerical Assistants 35,980 35,980 35,769 211
Other Purchased Services 5,300 5,300 4,822 478
Supplies and Materials 8,000 2,900 10,900 10,574 326 Other Objects 5,000 3,035 8,035 8,035
Total Support Services School Administration 208,610 6,!85 214,795 213,780 1,015
Central Services Salaries 203,530 458 203,988 202,936 1,052
Miscellaneous Purchased Services 14,341 1,475 15,816 15,633 183
Supplies and Materials 4,000 4,000 3,511 489 Miscellaneous Expenditures 2,000 5,014 7,014 5,414 1,600
Total Central Services 223,871 6,947 230,818 227,494 3,324
Admin. Info. Tech. Purchased Technical Serv. 25,127 (4,432) 20,695 20,380 315
Supplies and Materials 6,988 19,040 26,028 26,028 Other Objects 200 200 200
Total Admin. Info. Tech. 32,315 14,608 46,923 46,408 515
Required Maintenance for School Facilities Salaries 111,576 2,191 1!3,767 113,767
Cleaning, Repair and Maintenance 115,000 (14,852) 100,148 99,865 283
Travel 677 677 677
General Supplies !0,000 160 10,160 10,160 Other Objects 850 (500) 350 265 85
Total Required Maintenance for School Fac. 237,426 (12,324) 225,102 224,734 368
66 Continued

EXHIBIT C-1
HARRINGTON PARK BOARD OF ED!JCATION GENERAL FUND
SCHEDULE OF REVENUES, EXPENDITURES AND CHANGES IN FUND BALANCE- BUDGET AND ACTUAL FOR THE FISCAL YEAR ENDED JUNE 30, 2015
Variance Final Original Final Budget To Budget Adjustments Budget Actual Actual
EXPENDITURES CURRENT EXPENDITURES (Continued)
Undistributed Expenditures (Continued) Custodial Services
Salaries $ 135,153 $ 15,272 $ 150,425 $ 150,425 Salaries of Non-Instructional Aides 92,397 (13,055) 79,342 78,469 $ 873 Cleaning, Repair and Maint. Serv. 51,527 39,895 91,422 90,670 752 Other Purchased Property Services 32,000 8,833 40,833 40,076 757 Insurance 86,187 3,182 89,369 89,369 General Supplies 40,000 893 40,893 37,662 3,231 Energy (Natural Gas) 55,000 (2,400) 52,600 52,026 574 Energy (Electricity) 120,000 (8,813) 111,187 111,187 Other Objects 2,600 2,600 449 2,151
Total Custodial Services 614,864 43,807 658,671 650,333 8,338
Student Transportation Services Contracted Services - Aid in Lieu of Payments-
Non-Public Schools 4,000 2,188 6,188 6,188 Contracted Services (Between Home and School)-
Vendors 4,592 (4,592) Contracted Services (Other than Between Home and
School)-Vendors 19,000 19,000 13,705 5,295 Contracted Services (Between Home and School)-Joint Agreements 1,000 1,000 448 552
Contracted Services (Sp. Ed. Students) Joint Agreements 95,800 (6,162) 89,638 64,589 25,049
Lease Purchase Payments - School Buses 10,032 10,032 10,032 Misc. Purchased Services- Transportation 50 50 50
Total Student Transportation Services 124,392 1,516 125,908 95,012 30,896
Unallocated Benefits - Employee Benefits Social Security Contributions 143,000 1,267 144,267 144,267 Other Retirement Contributions -PERS 162,700 (15,917) 146,783 146,783 Other Retirement Contributions - Regular 2,029 2,029 2,029 Unemployment Compensation 20,000 (6,626) 13,374 4,904 8,470 Workmen's Compensation 66,260 (7,370) 58,890 52,930 5,960 Health Benefits 1,562,361 1,562,361 1,521,425 40,936 Tuition Reimbursement 15,000 (9, 105) 5,895 5,895 Other Employee Benefits 38,573 25,637 64,210 64,210
Total Unallocated Benefits- Employee Benefits 2,007,894 (10,085) 1,997,809 1,942,443 55,366
On-behalfTPAF Pension System Payments(Non-Budget) Normal Cost 236,156 (236,156) NCG1 16,990 (16,990) Post Retirement Medical Contribution 401,869 (401,869)
On-behalfTPAF Social Security Payments (Non-Budget) 343,257 (343,257)
Total Undistributed Expenditures 6,253,142 132,563 6,385,705 6,977,104 (591,399)
Total Expenditures- Current Expenditures 11,241,245 161,230 11,402,475 11,925,155 (522,680)
Continued 67

EXHIBIT C-1
HARRINGTON PARK BOARD OF EDUCATION GENERAL FUND
SCHEDULE OF REVENUES, EXPENDITURES AND CHANGES IN FUND BALANCE- BUDGET AND ACTUAL FOR THE FISCAL YEAR ENDED .JUNE 30,2015
Original EXPENDITURES Budget
CURRENT EXPENDITURES (Continued)
CAPJT AL OUTLAY Equipment Security School Buses - Regular
Total Equipment
Facilities Acquisition and Construction Services Assessment for Debt Serv on SDA Funding
Total Facilities Acquisition and Construction Services
Total Capital Outlay
Total Expenditures
Excess (Deficiency) of Revenues Over/(Under) Expenditures
Fund Balance, Beginning of Year
Fund Balance, End of Year
Recapitulation of Fund Balance Restricted Fund Balance
Excess Surplus
$
$
Excess Surplus- Designated for Subsequent Year's Expenditures Capital Reserve- Designated for Subsequent Year's Expenditures
Emergency Reserve Maintenance Reserve
Assigned
Year Encumbrances Designated for Subsequent Year's Expenditures
Unassigned
Reconciliation to Governmental Funds Statements (GAAP): Less: State Aid Payments Not Recognized on GAAP Basis
Fund Balance Per Governmental Funds (GAAP)
126,800 10,032
136,832
19,389
19,389
156,221
11,397,466
(450,474)
1,984,159
1,533,685
Adjustments
$ $ (10,032)
(10,032)
(10,032)
$ 151,198
(151,198)
$ (151,198) $
68
Final Budget
126,800 $
126,800
19,389
19,389
146,189
11,548,664
(601,672)
1,984,159
1,382,487 $
$
Actual
23,991
23,991
19,389
19,389
43,380
11,968,535
286,919
1,984,159
2,271,078
484,141 85,634
550,001 176,644 125,000
135,340 202,146 512,172
2,271,078 (287,868)
1,983,210
Variance Final Budget To
Actual
$ 102,809
102,809
102,809
(419,871)
888,591
$ 888,591
Continued
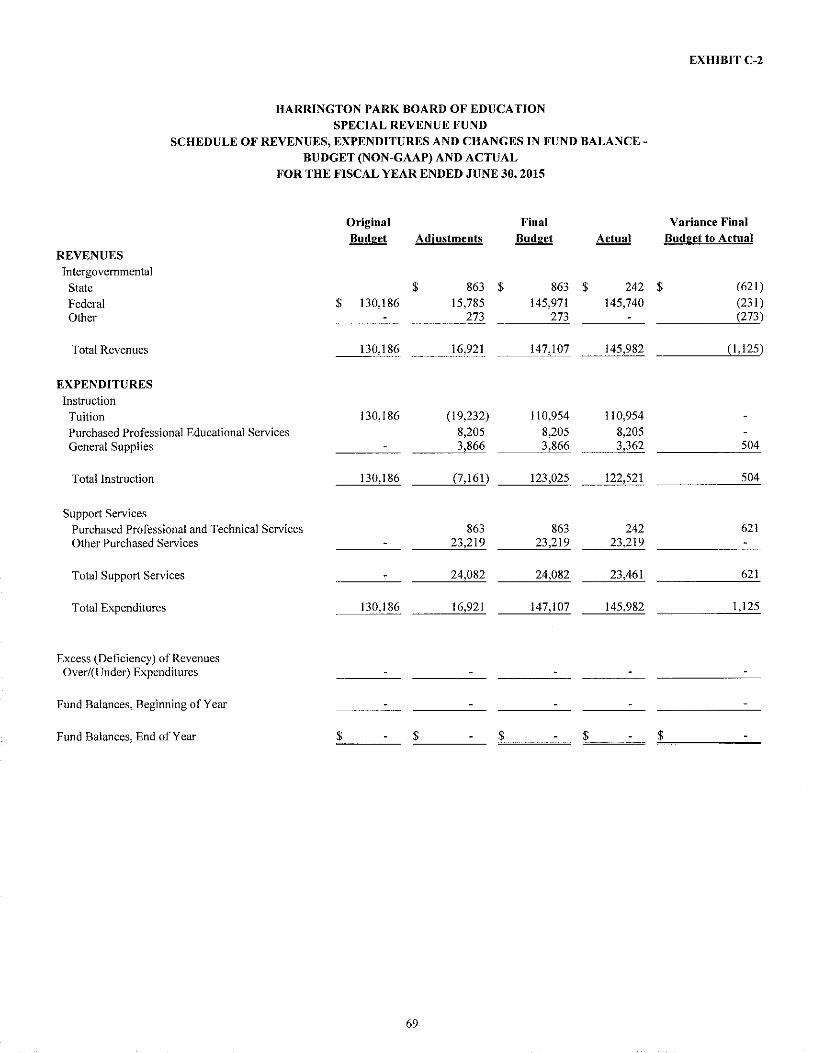
EXHIBITC-2
HARRINGTON PARK BOARD OF EDUCATION SPECIAL REVENUE FUND
SCHEDULE OF REVENUES, EXPENDITURES AND CHANGES IN FUND BALANCE-BUDGET (NON-GAAP) AND ACTUAL
FOR THE FISCAL YEAR ENDED JUNE 30,2015
Original Final Variance Final Budget Adjustments Budget Actual Budget to Actual
REVENUES Intergovernmental
State $ 863 $ 863 $ 242 $ (621)
Federal $ 130,186 15,785 145,971 145,740 (231) Other 273 273 (273)
Total Revenues 130,186 16,921 147,107 145,982 (1,125)
EXPENDITURES Instruction Tuition 130,186 (19,232) 110,954 110,954
Purchased Professional Educational Services 8,205 8,205 8,205 General Supplies 3,866 3,866 3,362 504
Total Instruction 130,186 (7,161) 123,025 122,521 504
Support Services Purchased Professional and Technical Services 863 863 242 621 Other Purchased Services 23,219 23,219 23,219
Total Support Services 24,082 24,082 23,461 621
Total Expenditures 130,186 16,921 147,107 145,982 I ,125
Excess (Deficiency) of Revenues Over/(Under) Expenditures
Fund Balances, Beginning of Year
Fund Balances, End of Year $ $ $ $ $
69

NOTES TO THE REQUIRED SUPPLEMENTARY INFORMATION- PART II

EXHIBIT C-3 HARRINGTON PARK BOARD OF EDUCATION REQUIRED SUPPLEMENTARY INFORMATION
SCHEDULE OF REVENUES, EXPENDITURES AND CHANGES IN FUND BALANCEBUDGET AND ACTUAL
NOTES TO THE REQUIRED SUPPLEMENTARY INFORMATION FOR THE FISCAL YEAR ENDED JUNE 30, 2015
Formal budgetary integration into the accounting system is employed as a management control device during the year. For governmental funds there arc no substantial differences between the budgetary basis of accounting and accounting principles generally accepted in the United States of America, with the exception of the legally mandated revenue recognition of certain state aid payments for budgetary purposes only and the treatment of encumbrances in the special revenue fund as described below. Encumbrance accounting is also employed as an extension of formal budgetary integration of the governmental fund types. Unencumbered appropriations lapse at fiscal year end.
The accounting records ofthe Special Revenue Fund is maintained on the grant accounting budgetary basis. The grant accounting budgetary basis differs from GAAP in that the grant accounting budgetary basis recognizes encumbrances as expenditures and also recognizes the related revenues, whereas the GAAP basis does not. Sufficient supplemental records are maintained to allow for the presentation of GAAP basis financial reports.
The following presents a reconciliation of the General and Special Revenue Funds from the budgetary basis of accounting as presented in the Budgetary Comparison Schedule- General Fund and Special Revenue Fund to the GAAP basis of accounting as presented in the Statement of Revenues, Expenditures and Changes in Fund Balance - Governmental Funds.
Special
Sources/inflows of resources Actual amounts (budgetary basis) 11 revenue11
from the budgetary comparison schedules (Exhibits C-1, C-2)
Difference - budget to GAAP: State Aid payments not recognized for budgetary purposes, recognized for
GAAP purposes, 2013/2014 State Aid State Aid payments recognized for budgetary purposes, not recognized for
GAAP purposes, 2014/2015 State Aid Grant accounting budgetary basis differs from GAAP in that
encumbrances are recognized as expenditures, and the related revenue is recognized.
Encumbrances, Prior Y car Encumbrances, Current Year
Total revenues as reported on the statement of revenues, expenditures and changes in fund balances- governmental funds (Exhibit B-2)
Uses/outflows of resources Actual amounts (budgetary basis) "total outflows11 from the
budgetary comparison schedules (Exhibit C-1, C-2)
Differences - budget to GAAP Encumbrances for supplies and equipment ordered but
not received are reported in the year the order is placed for budget my purposes, but in the year the supplies are received for financial reporting purposes.
Encumbrances, Prior Year
Encumbrances, Current Year
Total expenditures as reported on the statement of revenues, expenditures, and changes in fund balances- governmental funds (Exhibit B-2)
70
General Fund
$ 12,255,454
319,144
(287,868)
$ 12,286,730
$ 11,968,535
$ II ,968,535
$
$
$
$
Revenue Fund
145,982
37 (35)
145,984
145,982
37
(35)
145,984

REQUIRED SUPPLEMENTARY INFORMATION- PART III
PENSION INFORMATION

HARRINGTON PARK BOARD OF EDUCATION REQUIRED SUPPLEMENTARY INFORMATION
SCHEDULE OF THE DISTRICT'S PROPORTIONATE SHARE OF THE NET PENSION LIABILITY Public Employees Retirement System
Last Two Fiscal Years* (Dollar amounts in thousands)
2015
District's Proportion of the Net Position Liability (Asset) 0.01779%
District's Proportionate Share of the Net Pension Liability (Asset) $ 3,330,066
District's Covered-Employee Payroll $ 1,186,541
District's Proportionate Share of the Net Pension Liability (Asset) as a Percentage of its Covered-Employee Payroll 280.65%
Plan Fiduciary Net Position as a Percentage of the Total Pension Liability 52.08%
2014
0.01603%
$ 3,064,520
$ 1,198,576
255.68%
48.72%
EXHIBIT L-1
* The amounts presented for each fiscal year were determined as of the previous fiscal year-end.
This schedule is presented to illustrate the requirements to show information for I 0 years in accordance with GASB Statemetn No. 68. However, until a full I 0-year trend is compiled, the District will only present information for those years for which information is available.
71

HARRINGTON PARK BOARD OF EDUCATION REQUIRED SUPPLEMENTARY INFORMATION
SCHEDULE OF DISTRICT CONTRIBUTIONS
Public Employees Retirement System
Contractually Required Contribution
Contributions in Relation to the Contractually Required Contribution
Contribution Deficiency (Excess)
District's Covered-Employee Payroll
Contributions as a Percentage of Covered-Employee Payroll
Last Two Fiscal Years (Dollar amounts in thousands)
2015
$ 146,783
146,783
$
$ I, 186,541
12.37%
$
$
$
EXHIBITL-2
2014
124,880
124,880
1,198,576
10.42%
This schedule is presented to illustrate the requirement to show information for 10 years in accordance with GASB Statement No. 69. However, until the full 1 0-year trend is compiled, the District will only preset information for those years which information is available.
72

HARRINGTON PARK BOARD OF EDUCATION REQUIRED SUPPLEMENTARY INFORMATION
SCHEDULE OF THE DISTRICT'S PROPORTIONATE SHARE OF THE NET PENSION LIABILITY
Teachers Pension and Annnity Fnnd
Last Two Fiscal Years* (Dollar amonnts in thonsands)
District's Proportion of the Net Position Liability (Asset)
District's Proportionate Share of the Net Pension Liability (Asset)
State's Proportionate Share of the Net Pension Liability (Asset) Associated with the District
Total
District's Covered-Employee Payroll
District's Proportionate Share of the Net Pension Liability (Asset) as a Percentage of its Covered-Employee Payroll
Plan Fiduciary Net Position as a Percentage of the Total Pension Liability
2015
0%
$0
$ 24,817,038
$ 24,817,038
$ 4,934,879
0%
33.64%
2014
0%
$0
$ 24,096,592
$ 24,096,592
$ 4,622,396
0%
33.76%
EXHIBITL-3
* The amounts presented for each fiscal year were detennined as of the previous fiscal year-end.
This schedule is presented to illustrate the requirement to show information for 10 years in accordance with GASB Statement No. 69. However, until the full 1 0-year trend is compiled, the District will only present information for those years which information is available.
73

HARRINGTON PARK BOARD OF EDUCATION REQUIRED SUPPLEMENTARY INFORMATION
SCHEDULE OF DISTRICT'S PROPORTIONATE SHARE OF NET PENSION LIABILITY AND SCHEDULE OF DISTRICT CONTRIBUTIONS
NOTES TO REQUIRED SUPPLEMENTARY INFORMATION
Change of Benefit Terms:
Change of Assumptions:
FOR THE FISCAL YEAR ENDED JUNE 30, 2015
None.
The discount rate changed from the District's rate as of June 30, 2014 to the District's rate as of June 30,2015, in accordance with GASB Statement No. 67.
74

SCHOOL LEVEL SCHEDULES
(General Fund)
NOT APPLICABLE

SPECIAL REVENUE FUND

EXHIBITE-1
HARRJNGTON PARK BOARD OF EDUCATION SPECIAL REVENUE FUND
COMBINING SCHEDULE OF PROGRAM REVENUES AND EXPENDITURES -BUDGETARY BASIS FOR THE FISCAL YEAR ENDED .JliNE 30,2015
Anti Title Title IDEA IDEA Bullying
!!. III Basic Preschool Grant REVENUES
Intergovernmental State $ 242 $ Federal $ 8,205 $ 3,362 $ 123,219 $ 10,954
Total Revenues $ 8,205 $ 3,362 $ 123,219 $ 10,954 $ 242 $
EXPENDITURES Instruction
Tuition $ 100,000 $ 10,954 $ Purchased Professional Educational Services $ 8,205 General Supplies $ 3,362
Total Instruction 8,205 3,362 100,000 10,954
Support Services Purchased Professional and Technical Services $ 242 Other Purchased Services 23,219
Total Support Services 23,219 242
Total Expenditures $ 8,205 $ 3,362 $ 123,219 $ 10,954 $ 242 $
75
2015
242 145,740
145,982
110,954 8,205 3,362
122,521
242 23,219
23,461
145,982

HARRINGTON PARK BOARD OF EDUCATION SPECIAL REVENUE FUND
SCHEDULE OF PRESCHOOL PROGRAM AID EXPENDITURES BUDGETARY BASIS
FOR THE FISCAL YEAR ENDED JUNE 30, 2015
NOT APPLICABLE
76
EXHIBIT E-2
CAPITAL PROJECTS FUND

HARRINGTON PARK BOARD OF EDUCATION CAPITAL PROJECTS FIJND
SUMMARY SCHEDULE OF PROJECT EXPENDITURES- BUDGETARY BASIS FOR THE FISCAL YEAR ENDED JUNE 30, 2015
Less: On realized Expenditures
Local to Date
Issue/Project Title Appropriation Contribution Prior Years Current Year
Boiler Replacement at the $ 460,446 686,446 "$---=="" $ $ 194,401
Harrington Park High Public School 460,446 $ 686,446 "'$~~~.;,;;,;~~ $ $ 194,401
Reconciliation to GAAP
Project Balance- Budgetary Basis, June 30,2015
Less: Unearned SDA Grant Revenue
Fund Balance- GAAP Basis, June 30, 2015
Recapitulation of Fund Balance
Restricted fOr Capital Projects: Year End Encumbrances Unearned SDA Grant Revenue Capital Reserve Not Transferred
Total Fund Balance - Restricted for Capital Projects
77
EXIITBIT F-1
Unexpended Balance,
June 30,2015
$ 31,599
$ 31,599
$ 31,599
(148,240)
$ (116,641)
$ 492,045 (148,240) (460,446)
$ (116,641)

HARRINGTON PARK BOARD OF EDUCATION CAPITAL PROJECTS FUND
EXHIBITF-2
SUMMARY SCHEDULE OF REVENUES, EXPENDITURES AND CHANGES IN FUND BALANCE BUDGETARY BASIS
Revenues State Sources- SDA Grant
Total Revenues
Expenditures Construction Services
FOR THE FISCAL YEAR ENDED JUNE 30, 2015
Purchased Professional and Technical Services
Total Expenditures
Excess (Deficiency) of Revenues over (under) Expenditures
Fund Balance- Beginning of Year
Fund Balance- End of Year
Reconciliation to GAAP
Fund Balance- Ending- Budgetary Basis
Less: Unearned EDA Grant Revenue
Fund Balance, June 30, 2015 GAAP Basis
78
$ 226,000
226,000
163,755 30,646
194,401
31,599
$ 31,599
$ 31,599
(148,240)
$ (I 16,641)

SCHEDULE F-2a
HARRINGTON PARK BOARD OF EDUCATION CAPITAL PROJECTS FUND
SCHEDULE OF PROJECT REVENUES, EXPENDITURES, PROJECT BALANCE AND PROJECT STATUS- BUDGETARY BASIS
BOILER REPLACEMENT AT THE HARRINGTON PARK PUBLIC SCHOOL FROM INCEPTION AND FOR THE FISCAL YEAR ENDED JUNE 30, 2015
Revised Authorized
Revenues and Other Financing Sources State Sources- SDA Grant Other Local Sources - Capital Reserve
Total Revenues
Expenditures and Other Financing Uses
Construction Services
Purchased Professional and Technical Services
Unallocated
Total Expenditures
Excess of Revenue Over Expenditures
Additional Project Information: Project Number Grant Date Original Authorized Cost Additional Authorized Cost Revised Authorized Cost
Percentage Increase Over Original Authorized Cost
Percentage Completion Original Target Completion Date Revised Target Completion Date
Prior Periods Current Year
$ $
$
$ $
2050-050-14-100 1-G04 FY 2015
$ 565,000 121,446 686,446
21.49% 28%
Sep-15 Sep-15
79
226,000
226,000
163,755
30,646
194,401
31,599
Totals Cost
$226,000 $ 226,000 460,446
226,000 686,446
163,755 620,000
30,646 66,446
194,401 686,446
$ 31,599 $

ENTERPRISE FUND

HARRINGTON PARK BOARD OF EDUCATION ENTERPRISE FUND
COMBINING STATEMENT OF NET POSITION FOR THE FISCAL YEAR ENDED JUNE 30, 2015
TillS STATEMENT IS NOT APPLICABLE FINANCIAL STATEMENTS ARE PRESENTED ON EXHIBIT B-4
COMBINING STATEMENT OF REVENUES, EXPENSES AND CHANGES IN NET POSITION
FOR THE FISCAL YEAR ENDED JUNE 30, 2015
THIS STATEMENT IS NOT APPLICABLE FINANCIAL STATEMENTS ARE PRESENTED ON EXHIBIT B-5
COMBINING STATEMENT OF CASH FLOWS FOR THE FISCAL YEAR ENDED JUNE 30, 2015
THIS STATEMENT IS NOT APPLICABLE FINANCIAL STATEMENTS ARE PRESENTED ON EXHIBIT B-6
80
EXHIBIT G-1
EXHIBIT G-2
EXHIBITG-3

FIDUCIARY FUNDS

HARRINGTON PARK BOARD OF EDUCATION FIDUCIARY FUNDS
COMBINING STATEMENT OF ASSETS AND LIABILITIES AS OF JUNE 30, 2015
Agency Student Activity Payroll
ASSETS
Cash $ 6,214 $ 76,100 Due from Other Funds 4,692
Total Assets $ 6,214 $ 80,792
LIABILITIES
Payroll Deductions and Withholdings $ 1,534 Due to Other Funds 63,299 Flexible Spending Benefits 13,325 Accrued Salaries and Wages 2,634 Due to Student Groups $ 6,214
Total Liabilities $ 6,214 $ 80,792
81
EXHIBITH-1
Total
$ 82,314 4,692
$ 87,006
$ 1,534 63,299 13,325 2,634 6,214
$ 87,006

HARRINGTON PARK BOARD OF EDUCATION FIDUCIARY FUNDS
COMBINING STATEMENT OF CHANGES IN NET POSITION FOR THE FISCAL YEAR ENDED JUNE 30, 2015
THIS STATEMENT IS NOT APPLICABLE FINANCIAL STATEMENTS ARE PRESENTED ON EXHIBIT B-8
STUDENT ACTIVITY AGENCY FUND SCHEDULE OF RECEIPTS AND DISBURSEMENTS
FOR THE FISCAL YEAR ENDED JUNE 30, 2015
EXHIBITH-2
EXHIBITH-3
Balance, Balance, July 1, 2014 Receipts Disbursements June 30, 2015
Student Activity Account $ 6,917 $ 46,669 $ 4 7,3 72 :'C$ ___ 6::_c,2::_:1_:_4
Total All Schools $ 6,917 $ 46,669 $ 4 7,3 72 "'"$ --~6;;.;;,2;;.;1--'4
82

EXHIBITH-4
HARRINGTON PARK BOARD OF EDUCATION PAYROLL AGENCY FUND
SCHEDULE OF RECEIPTS AND DISBURSEMENTS FOR THE FISCAL YEAR ENDED JUNE 30, 2015
Balance, Balance, July 1, June 30, 2014 Additions Deletions 2015
LIABILITIES Payroll Deductions and Withholdings $ 2,361 $ 3,327,685 $ 3,328,512 $ 1,534
Due from Other Funds ( 4,221) 10,719 11,190 (4,692)
Due to Other Funds 60,191 362,398 359,290 63,299
Flexible Spending Benefits 5,278 33,761 25,714 13,325
Accrued Salaries and Wages 2,634 4,054,278 4,054,278 2,634
Total $ 66,243 $ 7,788,841 $ 7,778,984 $ 76,100
83

LONG-TERM DEBT

00 ...
Purpose
School Improvement Bonds
School Improvement Bonds
Date of Issue
8/1/2001 $
7115/2007
HARRINGTON PARK BOARD OF EDUCATION LONG-TERM DEBT
SCHEDULE OF SERIAL BONDS FOR THE FISCAL YEAR ENDED JUNE 30, 2015
Amount of Annual Maturities Interest Issue Date Amount Rate
3.465,000 8/112015 300,000 4.60% 8/1/2016 310,000 4.75% 811/2017 320,000 4.75%
1,552,000 7115/2015 40,000 4.250% 7115/2016 45,000 4.250% 7/15/2017 50,000 4.250% 7/15/2018 195,000 4.250% 7/15/2019 220,000 4.375%
7/15/2020 260,000 4.375% 7/15/2021 285,000 4.375% 7/15/2022 317,000 4.375%
EXHIBIT 1-1
Balance, Balance, Julv 1. 2014 Matured June 30. 2015
$ 1,215,000 $ 285,000 $ 930,000
1.447,000 35,000 1,412,000
$ 2,662,000 $ 320,000 $ 2,342,000

Purpose
School Bus
HARRINGTON PARK BOARD OF EDUCATION LONG-TERM DEBT
SCHEDULE OF OBLIGATIONS UNDER CAPITAL LEASES FOR THE FISCAL YEAR ENDED JUNE 30, 2015
$
Original Issue
47,212
Interest Rate
3.12%
85
Balance, June 30, 2014
$ 37,180
Issued
$
Matured
$ 8,871
EXHIBIT 1-2
Balance, June 30, 2015
$ 28,309

EXHIBIT 1-3
HARRINGTON PARK BOARD OF EDUCATION LONG-TERM DEBT
DEBT SERVICE FUND BUDGETARY COMPARISON SCHEDULE FOR THE FISCAL YEAR ENDED JUNE 30, 2015
Original Final Variance REVENUES Budget Adjustments Budget Actual Final to Actual
Local Sources Local Tax Levy $ 398,722 $ 398,722 $ 398,722 $
State Sources
Debt Service Aid 33,522 33,522 33,522
Total Revenues 432,244 432,244 432,244
EXPENDITURES Regular Debt Service
00 Principal 320,000 320,000 320,000 "' Interest 112,244 112,244 112,244
Total Expenditures 432,244 432,244 432,244
Excess (Deficiency) of Revenues Over (Under) Expenditures
Fund Balance, Beginning of Year
Fund Balance, End of Year $ $ $ $ $
------------------------------------------~-~~------- ,,,,,,,

STATISTICAL SECTION
This part of the Harrington Park Board of Education's comprehensive annual financial report presents detailed information as a context for understanding what the infonnation in the financial statements, note disclosures, and required supplementary information says about the government's overall financial healtb.
Contents
Financial Trends
These schedules contain trend information to help the reader understand how the government's financial performance and well-being have changed overtime.
Revenne Capacity
These schedules contain information to help the reader assess the government's most significant local revenue source, the property tax.
Debt Capacity
These schedules present information to help the reader assess the affordability of the government's current levels of outstanding debt and the government's ability to issue additional debt in the future.
Demographic and Economic Information
These schedules offer demographic and economic indicators to help the reader understand the environment within which the government's financial activities take place.
Operating Information
These schedules contain service and infrastructure data to help the reader understand how the information in the government's financial report
Exhibits
J-1 to J-5
J-6 to J-9
J-10 to J-13
J-14 and J-15
relates to the services the government provides and the activities it performs. J-16 to J-20
Sources: Unless otherwise noted, the information in these schedules is derived from the comprehensive annual financial reports for the relevant year.

EXHIBIT J-1 HARRINGTON PARK BOARD OF EDUCATION
NET POSITION BY COMPONENT LAST TEN FISCAL YEARS
(Unaudited) (accrual basis of accounting)
-2006 2007 2008 2009 2010 2011 2012 2013 2014 {12 2015
Governmental Activities Net Investment In Capital Assets $ 3.802,271 $ 4,114,481 $ 4,292,211 $ 4,315.081 $ 4.389,165 $ 4,556.039 $ 4,609,657 $ 4,765,442 $ 4,805,127 $ 5,064.058 Restricted 650,549 609,567 237,730 301,071 419,102 709.753 102.434 475,001 575,001 558,360 Unrestricted (! 1,399} £5.778} 66.017 129,454 86,282 294,672 879.470 1.068.386 £2,132,5612 {2.032,786}
Total Governmental Activities Net Position s 4,441.421 $ 4.718,270 $ 4,595,958 $ 4,745,606 $ 4,894,549 $ 5,560,464 $ 5,591,561 $ 6.308,829 $ 3,247,567 s 3,589,632
Business-Type Activities Net Investment In Capital Assets $ 2,054 s 4,748 s 4,556 s 6,284 $ 5,489 $ 5,028 $ 4,054 $ 3,422 $ 2,790 $ 2,349
00 Unrestricted 4,726 1,192 9.616 19,884 23,122 10,916 5,517 5,588 3.303 3.253 ~
Total Business-Type Activities Net Position $ 6,780 $ 5,940 $ 14.172 s 26,168 $ 28,611 $ 15,944 $ 9,57l s 9,010 s 6,093 $ 5,602
District-Wide Net Investment In Capital Assets $ 3,804,325 $ 4,119,229 $ 4,296,767 $ 4,321,365 s 4,394,654 $ 4,561,067 s 4,613,711 $ 4,768,864 $ 4,807,917 $ 5.066.407 Restricted 650,549 609,567 237.730 301,071 419,102 709,753 102.434 475.001 575.001 558,360
Unrestricted (6,673} (4,5862 75.633 149,338 109,404 305,588 884.987 1,073.974 £2,129.258) £2.029,533} Total District Net Position $ 4,448,201 $ 4,724.210 $ 4.610.130 $ 4.771,774 s 4,923,160 $ 5,576.408 s 5,601,132 $ 6,317.839 $ 3,253,660 $ 3,595,234
Note ! -Net Pension at Jnne 30. 20!4 is restated to reflect the implementation ofGASB Staten1ent No_ 68, "Accounting and Financial Reporting for Pensions".

E~pcn•••
Govcrnmentol Actiwi"" lnsttuotion
Regulor Speciol cducotwn Other special cducotion Other instruction School Sponrorcd Act!\'iti"" and Athletics
Suppmt Scn·io""· Tmmm Student & in•truction related =-t•iees General odministrotinn ;orvices School Administrative ('Ct;'ie<:s CcntraiSef'iccs Bu<iness admini•trati\'C services Administrative Information T echnnlogy Opcratton and maintenance of Facilities Pupil transpmtotion Uno\locoted Benefots
lntm..."<t On Long· T crm Debt Unollocotcd depreciation Capitol Outlay- nondcpreciohle
T otol Govommental Activitie.< E~pcn><:.<
l>usincos· T_vp<: Activities Specwl milk fund
T otall>usincos-Type Activil!es E~'pC!lSO Total District Exrenscs
Program R.,· • .,uc• Govcrnmentol Activities
Charges For &rcices· ln•truction - Rey;ulor ln<truction -Special education Pupil tron;portotion
Operating Gronl< And Contributions Capital Gronts And Contributions
Toto! Go\·ernmentol Activities Pro,.om Re,•cnucs
l>usin=-Typo Acti.-itics Charge• For Scn-ioes
Food"""·ioe Opernting Gronl; And Contributions Capitol Gmnts And Contributions
Toto I Business Type Activiti"" Program Rewnu"" Totnl Di•trict Program Revenues
Nd (E~pou .. )/Rennue Go\'errtmctl\nl Activities Busin.,.•· Type Activities Totol District-Wide Net E~1'cn_"'
Gencn>l Rcvonu"" And Otbcr Cbnn~: .. Jn Net P.,.itiou c,.wemrnen~'l Acm·itie.<
l'mp<:rtyTo~"" Le\ied ForGcnerol Plli)'O'""· Net To~es Lc\'i<>l For Debt Sen·ice State Aid· U.•vicd For Debt Service Fedcrol And Stale Aid- Unre<lrictcd ln\'c:<lmcnt Eornings Miscellaneous Income L<>ss on Di•posol ofCopital A"-"'l' Retirement of Loons Povable Refinancing Cr<>ltt Remaining Bnlanoc of loans Payable Cancelled Donations-Recon<lrllction of Harrington Pnrk School Fleld State Aid- Capital OutloyFocilities Grant Conccllcd
Totol Go,·emmental Activities
B<l>'im:s•-T ;1'" Activities Jnn:stmcnt Eamin~ Transfers
Total Bu"'"""·1\pe Acti,·itics Totol District-Wide
Cban~e In Net Po•ltion Go.-cnuncmal Aclivilles RtL•in«><-Tn'ei\ctiviti"" Tolol DlStr~ct
2006
3.118,:121 430.991 175,974 1%.096
936.372 1.268.532
373.702 241.668 286.455
5.577
715.685 259.664 574.2n:J 08.685 21.026
~ 8.699.171
.±&1&. 4.676
8.703.847
l4.'l.958
143.958
3.965 1.511
5.476 149.434
(8.555.213)
~ (8.554.413)
7.836.357 340.688
1.002.411
83.271
9.262.727
9.262.727
707.514
_.§QQ. 708.314
EXHIBITJ-2 HARRINGTON PARK BOARD OF EDUCATION
CJ:IANGES IN NET POSITION
2007
3.558.645 807.192 189.459 78.(>65
926.557 978.746 3%.227 272.245 289.801
835.686 238.155 945.323 J:l0.$05 190.796
2.385
~
6_5\2 6.5i2
9.847.099
112.511
112.511
5,702 3.154
8.856 121,367
(9.728_076)
8.245.695 327.097
1.372.011
61)J22
10_0()4,925
" "' 10,00~.987
276.849 2.406
279.255
LAST TEN FISCAL YEARS (accmal ba,,i,, <~f accounting)
2008
4.208.064 9{12.659 111.175 87.259
715,008 1.017.448
465.475 280,042 311.576
1.142.846 198.710 897.511 186.168 185.178 48.778
10_757.897
.2.i.!i 6.516
10.7(>4.413
155..181
155.381
8.817 5.733
2009
4.197.071 1.184.861
114_996 85.433
721.994 L\91.6:17
421.908 290.799 319.203
1.102.463 137.699 611.584 179.575 173.286
----l!ill 10.746.991
2&1.2. 9.679
10.756.670
212.6\7
212.617
15.423 6.11:1
21.536 234.153
2010
4.524.506 Ul7.979
35.256 181.3)8
630.014 1.166.438
3%.748 289.736 276.500
15.769 1.014.321
129.878 661.522 169.270 \95.574 646()8
1 1_069.4.17
llli2. 21.759
$ 11.091.196
258.525
258_525
18.032 6.042
2011
4.325.365 1.302.010
32.638 !25.045
615.603 1.236,942
395,164 271.855 207.368
50.626 945.598
80.050 715.032 158.177 227.708
15.993 10.705.174
1.!...lli. 31.156
10.736.330
184.507
184.507
10.330 8.080
18.410 202.917
4.962,477 2.454.921
91.839 112,742
1.441_239 457.667 224.550 259.835
53.940 1.150,032
143.844
146.434
11.499.520
1.1~1.672
1.191.672
14.700 8.692
2013
$ 4.6&5.539 2.630.838
10:1354 127.008
1.560.841 469.566 256.315 275.862
42,9:19 1.264.263
82.903
134.042
11.633.470
19,0G6
~ 11.652.476
1.885.350
1.885.35()
12.025 6.385
18.410 1.9{)3.760
2014
4.854.990 2.853.907
1:19.432 153.697
1.578,732 479.183 280.728 289.350
4\.786 1.259.132
131.349
121.501
12.183.787
.illJl 22.111
12.205.898
13.592
1.52&.619
1.542.211
!2.180 7.0l4
19,194 1.561.405
2015
$ 5.712.168 3.266.950
131.207 144.791
1.744.656 496.322 338.671 321.499
46.408 1.283.846
89.243
107.1:16
13.682.897
~ 20.4(>5
13.703,362
31.603
2.814.871 77.760
2,924.234
12.673 7.301
19,974 2.944.208
(10.602.516) $ (10.534374) $ (10.811),912] $ (10.520.667) $ (10.307.848) $ (9,748.120) s (10.641.576) $ (11),758.663) ~ 11.857 2.315 !1274(>1 (6.4321 5961 (2.917) 491) (10.594.482) $ 00.522,517) $ (10.808.5971 $ (lf1.533.4\3) $ (10.314.2801 $ (9.745.716) $ (\0.644.4931 $ (10,759.154)
8,575.523 367.321
1.381.566
155.794
)0.480.204
,,,
''" 10,480.402
(122.312)
-WL (114.1)80\
$ 9.0l6.820 370.797
1.147_732
148.667
10,684.(122
"' m
10.684.161
149.648
~ 161.644
9363.968 392.362
1.322.683
9<!.656
(244.241) 34.427
10.959.855
"" "" s 10,959.983
148.943 2.443
151.386
""
9.738.527 3%.966
938.155
122.934
11.186.582
" " I L\86,661
665.915 (\2.6671 653.248
$ 9,738.527 386.966
24.013 115
189.324
]1)_338.945
;,
;o $ 10.339.00~
31.097 .ili,ili_l 2-1.724
9.913.820 393.991
20.720 3.228
133.629
10.465.388
" " 10.465.423
717.268 __i&Ll 716.707
$ 10.112.096 399,006
24.967
111.132 (2,367)
10.644.834
$ 10,644.834
3.258 (2_9\ 7)
34i
10.511.796 398.722
27.218
162.992
11.100.728
11.100.728
342.065 (491)

HARRINGTON PARK BOARD OF EDUCATION FUND BALANCES- GOVERNMENTAL FUNDS
LAST TEN FISCAL YEARS (Unaudited)
(modified accrual basis of accounting)
2006 2007 2008 2009 2010 2011 2012
General Fund
Reserved $ 632,610 $ 549,491 $ 232,360 $ 303,188 $ 271,936 Unreserved 139,643 281,335 248,015 314,031 258,464 Restricted $ 508,809 $ 508,809 Committed 134,631 Assigned 61,800 394,836 Unassigned 461,700 207,642
Total General Fund $ 772,253 $ 830,826 $ 480,375 $ 617,219 $ 530 400 $ 1,166,940 $ 1,111,287
All Other Governmental Funds Reserved $ 7,700 $ 139,653 Unreserved $ 17,939 $ (65,605) (2,330) $ (2,117) 7,513 Restricted Assigned $ 6,876 Unassigned (2,363) $ (567)
Total All Other Governmental Funds $ 17,939 $ (65,605) $ 5,370 $ (2,117) $ 147,166 $ 4,513 $ (567)
Beginning with Fiscal Year 2011, the District implemented GASB Statement No. 54, "Fund Balance Reporting and Governmental Fund Type Definitions". The Statement provides more clearly defined fund balance categories to make the nature and extent of the constraints placed on a government's fund balance more transparent This Statement established fund balance classifications that comprise a hierarchy based primarily on the extent to which a government is bound to observe constraints imposed upon the use of the resources reported in governmental funds. Reclassification of prior year fund balance amounts to comply with Statement No. 54 is not required.
89
EXHIBIT J-3
2013 2014 2015
$1,102,119 $ 1,287,753 $ 1,421,420
354,687 151,198 337,486 225,590 226,064 224,304
$ 1,682,396 $ 1,665,015 $ 1,983,210
$ (116,641)
$ $
$ $ $ (116,641)

EXHIBIT J"4 HARRINGTON PARK BOARD OF EDUCATION
CHANGES IN FUND BALANCES- GOVERNMENTAL FUNDS LAST TEN FISCAL YEARS
(Unaudited) (modified accroal basis of accounting)
2006 2007 2008 2009 2010 2011 2012 2013 2014 _l2l1
Revenues Tax Levy $ 8,177.045 $ 8,572.792 $ 8,942.844 $ 9,387,617 $ 9.756,330 $ 10.125,493 $ 10,125,493 $ 10,307,811 $ 10.511.102 $ 10.910,518 Tuition Charges 83,271 60.804 157.592 167,413 125,308 122,934 Transportation Interest Earnings 115 3,228 Miscellaneous 233,747 136,743 158.343 194.632 Local Sources County Sources 75.000 State Sources 1,006,366 1,375,011 1,381,566 1.190,162 I, 174,317 949.232 1,016,346 1,752,579 1,379,857 1,691,863 Federal Sources 140.003 108,829 153,583 151,441 331.666 173,429 199,339 153,491 140,110 145.705
Total Revenue 9,406,685 10.117,436 10,635,585 10,896,633 11,462,621 11.371,088 11,575,040 12,353,852 12,189,412 12,942,718
Expenditures Instruction
Regular Instruction 2,612,369 2,901.012 3,460.984 3,451,376 3,736,654 3,429,241 4,979,400 4,677,377 4,842,248 4.921,978 Special Education Instruction 356.967 706.922 799.100 967,503 1.066,830 1,046,734 2,460,907 2,627.768 2,849,568 3,087,589 Other Special Instruction 133,608 152.640 89.501 94.599 12,702 14,954 Other Instruction 124.796 63,668 70,658 70.649 166,240 112,997 92,184 103,185 139.166 113.173 School Sponsored Activities And Athletics 108,807 122,276 149.981 137.287
Support Services: Tuition 936,372 926.557 715.008 721,994 630.014 615.603 Student & lnst. Related Services 1,095,227 840,596 863,899 1,033.274 989,685 1,020,783 1,437.136 1,549,588 1.563.367 1.590.944 General Administrative 325.047 343,912 396,515 357,790 333.858 322,737 447,025 467,415 461,001 468.193 School Administrative Services 200,966 226.215 227,695 239,627 237.929 217.741 225,354 255,917 280,046 299,531 Business and Other Support Services 260.754 275,413 Central Administrative Services 242,475 241,987 258,733 269,864 235.186 164,759 288.637 312.244 Administrative Info Tech 15.769 50.626 53.940 42,939 41,786 46,408 Plant Operations And Maintenance 710,714 769,175 1,047,292 932,123 930.612 849,282 913.100 1,014,881 1,008.111 1.018.169 Pupil Transportation 259,664 238.355 198,710 137,699 129.878 80.050 143,844 82.903 131,349 84,980 Unallocated Employee Benefits 1,031,228 1,189,017 1,298,233 1,384,599 1,502.082 1,693,841 TP AF Pension/Social Security 584,670 888,403 889,459 593,628 635.361 656,031
Capital Outlay 141,870 314,440 302,928 91,837 119.459 44.325 91.941 138,245 57,488 218,392 Debt Service:
Principal 198,625 205,493 217.407 229,401 240.000 255.000 270.000 285,000 315,032 328,871 Interest And Other Charges 142,063 134,014 159,121 183,613 173,657 162,844 151,381 139,269 126,225 113,405
Total Expenditures 9,096,661 10,142,406 10.995,243 10.759,576 11,155.916 10,737,548 11,635,773 11,782.176 12.254,005 12,74\,164 Excess (Deficiency) Of Revenues
Over (Under) Expenditures 310,024 (24,970) (359,658) 137,057 306.705 633,540 (60,733) 571,676 (64,593) 201,554
Other Financing Sources (Uses) Capital Leases (Non-Budgeted) 47,212 State Facilities Grant Cancelled (244,241) Transfers In 274,467 Transfers Out {274,467)
Total Other Financing Sources (Uses) f244,241) 47,212
Net Change In Fund Balances $ 310,024 $ _@_,2?9) . s .. m_?,_~-~-~2 $ .... __137.057 $ 62,464 s 633,540 $ __ L6_Q_,nh $ 571,676 $ (17,381) $ 201554
Debt Service As A Percentage Of Noncapital Expenditures 3.8% 3.5% 3.5% 3.9% 3.7% 3.9% 3.7% 3.6% 3.6% 3.5%
* Noncapital expenditures are total expenditures Jess capital outlay.
90
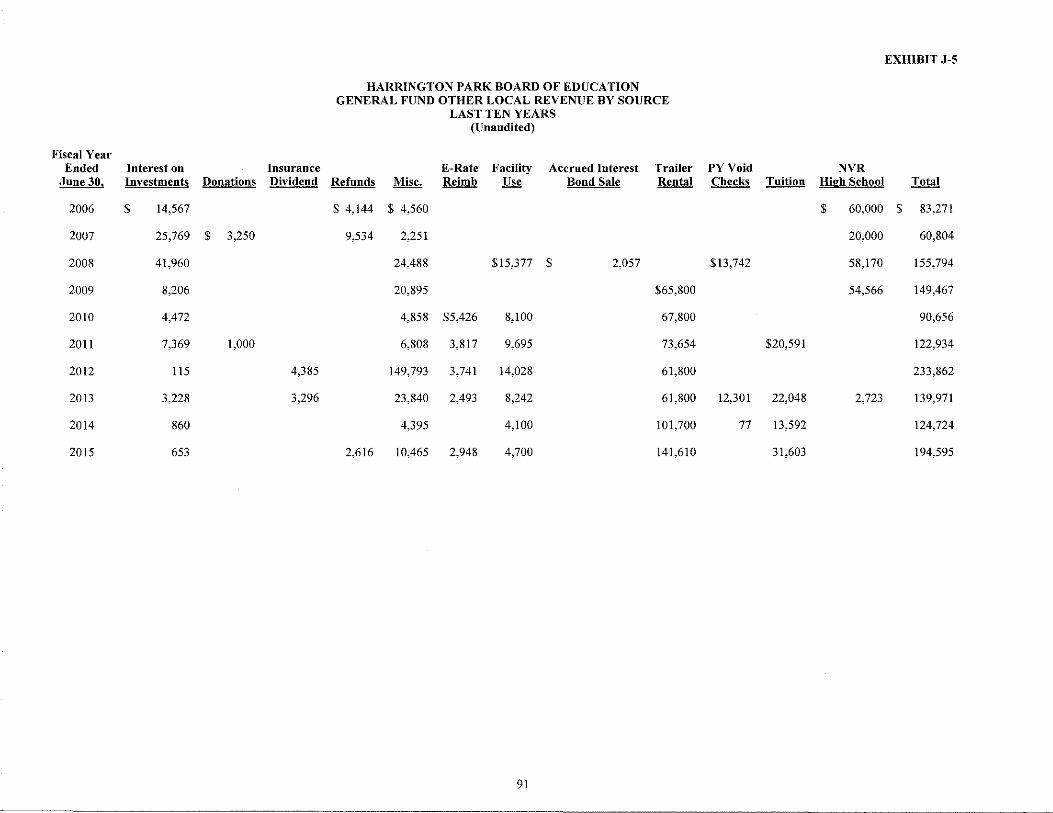
EXHIBIT J-5
HARRINGTON PARK BOARD OF EDUCATION GENERAL FUND OTHER LOCAL REVENUE BY SOURCE
LAST TEN YEARS (Unaudited)
Fiscal Year Ended Interest on Insurance E-Rate Facility Accrued Interest Trailer PYVoid NVR
June 30, Investments Donations _D_i.vid_~nd Refunds Misc. Reimb Use Bond Sale Rental Checks Tuition Hi2h School Total
2006 $ 14,567 $ 4,144 $ 4,560 $ 60,000 $ 83,271
2007 25,769 $ 3,250 9,534 2,251 20,000 60,804
2008 41,960 24,488 $15,377 $ 2,057 $13,742 58,170 155,794
2009 8,206 20,895 $65,800 54,566 149,467
2010 4,472 4,858 $5,426 8,100 67,800 90,656
20l1 7,369 1,000 6,808 3,817 9,695 73,654 $20,591 122,934
2012 l15 4,385 149,793 3,741 14,028 61,800 233,862
2013 3,228 3,296 23,840 2,493 8,242 61,800 12,301 22,048 2,723 139,971
2014 860 4,395 4,100 101,700 77 13,592 124,724
2015 653 2,616 10,465 2,948 4,700 141,610 31,603 194,595
91

~
"'
Fiscal Year
Ended June 30L Vacant Land
2006 $24,418,000 2007 22,888,400 2008 (A) 20,183,000 2009 16,477,300 2010 16,047,300 2011 15,178,500 2012 14,736,500 2013 (B) 12,498,400 2014 12,498,400 2015 12,498,400
Source: County Abstract of Ratables
(1) Tax rates are per $100
N/ A ~ Not Available
HARRINGTON PARK BOARD OF EDUCATION ASSESSED VALUE AND ACTUAL VALUE OF TAXABLE PROPERTY
LAST TEN YEARS (Unaudited)
Total Assessed Residential Commercial Value -
$1,007,282,100 $39,195,200 $ 1 ,070,895,300 1,012,540,900 37,777,900 1,073,207,200 1,029,990,700 37,155,400 1,087,329,100 1,035,505,100 37,155,400 1,089,137,800 1,034,946,900 37,240,800 1,088,235,000 1,025,271,300 38,617,600 1,079,067,400 1,016,222,100 32,441,300 1,063,399,900
856,365,100 28,418,700 897,282,200 855,446,400 28,221,900 896,166,700 854,583,200 28,151,900 895,233,500
Public Utilities
$820,664
Net Valuation Taxable
$ 1,070,895,300 1,073,207,200 1,087,329,100 1,089,137,800 1,088,235,000 1,079,067,400 1,064,220,564
897,282,200 896,166,700 895,233,500
(A) The Borough undertook a revaluation of real property, which became effective in the year 2008.
(B) The Borough undertook a revaluation of real property, which became effective in the year 2013.
EXHIBIT J-6
Estimated Actual Total Direct (County Equalized) School Tax
Value Rate (1)
$ 1,071,659,857 $ 0,800 1,057,948,194 0,830 1,125,158,811 0,863 1,160,438,606 0,895 1,113,572,454 0,930 1,036,552,493 0,937
983,913,449 0,970 918,267,904 Ll72 940,449,312 L218 957,430,915 L255

HARRINGTON PARK BOARD OF EDUCATION DIRECT AND OVERLAPPING PROPERTY TAX RATES
LAST TEN YEARS (Unaudited)
(rate per $100 of assessed value)
Overlapping Rates
EXHIBIT J-7
Total Direct and Overlapping Tax
Total Direct School Tax
Rate
Northern Valley
Regional H.S.
Harrington Park
Borough Bergen County Rate Calendar
Year
2006 $ 0.800 $ 0.345 $ 0.335 $ 0.170 $ 1.650
2007 0.830 0.330 0.339 0.168 1.670
2008 (A) 0.863 0.339 0.377 0.192 1.770
2009 0.895 0.397 0.403 0.205 1.900
2010 0.930 0.427 0.410 0.211 1.978 2011 0.937 0.449 0.427 0.208 2.021
2012 0.970 0.460 0.450 0.200 2.080
2013 (B) 1.172 0.546 0.544 0.233 2.495 2014 1.218 0.576 0.554 0.245 2.593
2015 1.255 0.587 0.555 0.257 2.654
(A) The Borough undertook a revaluation of real property which became effective in the year 2008.
(B) The Borough undertook a revaluation of real property which became effective in the year 2013.
Source: County Abstract ofRatables
93

EXHIBIT J-8 HARRINGTON PARK BOARD OF EDUCATION
PRINCIPAL PROPERTY TAXPAYERS CURRENT YEAR AND NINE YEARS AGO
(Unaudited)
2015 2006 Taxable %of Total Taxable %of Total Assessed District Net Assessed District Net
Taxpayer Value Assessed Value Value Assessed Value
United Water Resources $ 20,784,500 2.32% $ 31,683,700 2.96% Quantmeyer 2,913,300 0.33% 3,720,400 0.35% Rockland Electric 2,681,800 0.30% 3,018,800 0.28% 76 Schaa1enburgh Rd 1,900,000 0.21% Resident 1,473,500 0.16% 1,527,800 0.14% Resident 1,389,800 0.16% Resident 1,315,100 0.15% Resident 1,203,000 0.13% Resident 1,182,300 0.13% Resident 1,168,400 0.13% 1,564,800 0.15% Resident 1,602,700 0.15% Resident 1,369,200 0.13% Resident 1,341,000 0.13% Resident 1,327,700 0.12% Resident 1,323,800 0.12%
$ 36,011,700 4.02% $ 48,479,900 4.53%
Source: Municipal Tax Assessor
94

Fiscal Year
Ended June 30,
2006 2007 2008 2009 2010 2011 2012 2013 2014 2015
HARRINGTON PARK BOARD OF EDUCATION PROPERTY TAX LEVIES AND COLLECTIONS
LAST TEN FISCAL YEARS (Unaudited)
Collected within the Fiscal Year of the Levy School Taxes Levied for
the Fiscal Year Amount Percentage of Levy
$ 8,177,045 $ 8,177,045 100.00% 8,572,792 8,572,792 100.00% 8,942,844 8,942,844 100.00% 9,430,047 9,368,752 99.35% 9,756,330 9,753,605 99.97%
10,125,493 10,125,493 100.00% 10,125,493 10,125,493 100.00% 10,307,811 10,307,811 100.00% 10,511,102 9,632,462 91.64% 10,910,518 10,910,518 100.00%
95
EXHIBIT J-9
Collections in Subsequent Years
$ 61,295
878,640

Fiscal Year Ended June
30,
2006 $ 2007 2008 2009 2010 2011 2012 2013 2014 2015
HARRINGTON PARK BOARD OF EDUCATION RATIOS OF OUTSTANDING DEBT BY TYPE
LAST TEN FISCAL YEARS (Unaudited)
Governmental Activities
General Obligation
Bonds Loans Payable Total District Population
2,930,000 $ 187,307 $ 3,117,307 4,813 2,785,000 126,814 2,911,814 4,830 4,182,000 64,407 4,246,407 4,848 4,017,000 4,017,000 4,870 3,777,000 3,777,000 4,671 3,522,000 3,522,000 4,711 3,252,000 3,252,000 4,730 2,967,000 2,967,000 4,759 2,662,000 2,662,000 4,781 2,342,000 2,342,000 4,781
Source: District records
( 1) Estimated
96
EXHIBIT J-10
Per Capita
$ 648 603 876 825 809 750 688 623 557
(1) 490

HARRINGTON PARK BOARD OF EDUCATION RATIOS OF NET GENERAL OBLIGATION DEBT OUTSTANDING
LAST TEN FISCAL YEARS (Unaudited)
General Obligation Debt Outstanding
Fiscal Percentage of
Year General Net General Actual Taxable
Ended Obligation Bonded Debt Value" of June 30, Debt Deductions Outstanding Property
2006 $ 3,117,307 $ 3,117,307 030% 2007 2,911,814 2,911,814 0.27% 2008 4,246,407 4,246,407 039% 2009 4,017,000 4,017,000 036% 2010 3,777,000 3,777,000 035% 2011 3,522,000 3,522,000 033% 2012 3,252,000 3,252,000 030% 2013 2,967,000 2,967,000 033% 2014 2,662,000 2,662,000 030% 2015 2,342,000 2,342,000 0.26%
Source: District records
Notes: a See Exhibit J-6 for property tax data. b See Exhibit J-14 for population data.
97
EXHIBIT J-11
Per Capita •
$ 648 603 876 825 809 750 688 623 557 490

Source:
HARRINGTON PARK BOARD OF EDUCATION DIRECT AND OVERLAPPING GOVERNMENTAL ACTIVITIES DEBT
AS OF DECEMBER 31, 2014
Direct Debt: (I) Borough of Harrington Park Local School District Regional School District
(Unaudited)
Overlapping Debt Apportioned to the Municipality: Bergen County: County of Bergen (2) (A) Bergen County Utilities Authority (BCUA) (3) (B)
Total Direct and Overlapping Debt
(I) Borough of Harrington Park's 2014 Annual Debt Statement (2) Bergen County Annual Debt Statement (3) BCUA 2014 Annual Audit
(A) The debt for this entity was apportioned to the Borough of Harrington Park by dividing the municipality's 2014 equalized value by the total 2014 equalized value for Bergen County. (B) Overlapping debt was computed based upon municipal flow to the Authority.
98
EXHIBIT J-12
Gross Debt
$ 3,009,911
$
2,342,000 1,465,692
6,817,603
5,408,691 1,080,426
6,489,117
$ 13,306,720

2006
Debt limit $23,515,569
Total net debt applicable to limit 3,117,307
'Co Legal debt margin $20,398,262 'Co
Total net debt applicable to the limit as a percentage of debt limit 13.26%
Source: Annual Debt Statements
HARRINGTON PARK BOARD OF EDUCATION LEGAL DEBT MARGIN INFORMATION
LAST TEN FISCAL YEARS
2007 2008
$28,179,060 $31,158,381
2,911,814 4,246,407
$25,267,246 $26,911,974
10.33% 13.63%
Legal Debt Margin Calculation for Fiscal Year 2015
2009
$ 33,235,912
3,777,000
$ 29,458,912
11.36%
Average equalized valuation of taxable property
Debt limit (3 % ofaverage equalization value) Total Net Debt Applicable to Limit
Legal debt margin
2010 2011 2012
$33,819,648 $33,167,208 $ 31,534,822
3,777,000 3,522,000 3,252,000
$30,042,648 $29,645,208 $ 28,282,822
11.17% 10.62% 10.31%
Equalized valuation basis 2014 2013 2012
2013 2014
$ 29,895,701 $28,870,391
2,967,000 2,662,000
$ 26,928,701 $26,208,391
9.92% 9.22%
EXHIBIT J-13
$ 957,954,784 941,139,291 948,701,847
$ 2,84 7, 795,922
$ 949,265,307
28,477,959 2,342,000
$ 26,135,959
2015
$ 28,477,959
2,342,000
$ 26,135,959
8.22%

Year
2006 2007 2008 2009 2010 2011 2012 2013 2014 2015
HARRINGTON PARK BOARD OF EDUCATION DEMOGRAPHIC AND ECONOMIC STATISTICS
LAST TEN FISCAL YEARS (Unaudited)
School District Per Capita Population Personal Income
4,813 $ 63,103 4,830 67,544 4,848 67,331 4,870 63,874 4,671 63,885 4,711 67,248 4,730 69,281 4,759 69,495 4,781 69,495 (1) 4,781 (I) 69,495 (1)
Source: New Jersey State Department of Education
N/ A - not available
(1) Estimated
100
EXHIBIT J-14
Unemployment Rate
2.7% 2.4% 3.1% 5.6% 5.8% 5.7% 8.3% 8.3% 4.8% 4.8% (1)

Employer
HARRINGTON PARK BOARD OF EDUCATION PRINCIPAL EMPLOYERS
CURRENT YEAR AND NINE YEARS AGO (Unaudited)
Employees
2015
Percentage of Total Municipal
Employment
NOT AVAILABLE
101
Employees
EXHIBIT J-15
2006
Percentage of Total Municipal
Employment

EXHIBIT J-16 HARRINGTON PARK BOARD OF EDUCATION
FULL-TIME EQUIVALENT DISTRICT EMPLOYEES BY FUNCTION/PROGRAM LAST TEN FISCAL YEARS
(Unaudited)
2006 2007 2008 2009 2010 20ll 2012 2013 2014 2015 Function/Program
lnstmction Regular 63.0 66.6 720 68.1 64.5 47.0 47.5 47.5 47.6 47.0 Special education 0.0 0.0 0.0 6.0 6.5 25.5 30.0 30.0 28.0 30.0
Support Services: Student & instruction related services 7.9 7.3 84 8.0 9.6 124 12.2 12.2 10 9 12.4 General administration services 2.0 2.0 2.0 2.0 2.1 2.0 2.0 2.0 2.0 2.0 School administrative services 2.5 2.6 3.5 3.0 3.0 2.0 2.0 2.0 2.0 2.0 Business administrative services 2.6 3.0 3.0 3.0 3.0 2.5 3.0 3.0 3.0 3.0 Plant operations and maintenance 3.0 3.0 2.5 2.5 2.5 8.0 5.0 5.0 5.0 5.0
Total 81.0 84.5 91.4 92.6 91.2 99.4 1017 1017 98.5 101.4
Source: District Personnel Records
102

8
Operating Cost Per Percentage Fiscal Year Enrollment" [)(penditures ~ Pupil' Change
2006 704_0 $ 8,614,103 $ 12,236 0.15%
2007 712.0 9.488,459 13,326 8.91% 2008 738.0 10,315.787 13,978 4.89% 2009 726.0 10,254,725 14,125 1.05%
2010 712 0 10,622,800 14,920 5.63%
2011 687.0 10,118,751 14,729 -1.28% 2012 691.0 11,122.451 16,096 9.28%
2013 648.0 11,219,662 17,314 7.57% 2014 637.0 11.755,260 18,454 6.58% 2015 633.0 12,080,496 19,085 3.42%
Sources District records
Note: a Enrollment based on annual October district count b Operating expenditures equal total expenditures less debt service and capital outlay
Cost per pupil represents operating expenditures divided by enrollment
HARRINGTON PARK BOARD OF EDUCATION OPERATING STATISTICS LAST TEN FISCAL YEARS
(Unaudited)
Teacher/Pupil Ratio
Teaching Staff Elementary Middle School
57 1:11.3 NIA 67 I :12.3 NIA 72 1:10.6 N/A 72 1 ·10.3 NfA 71 1 :10_1 NIA 69 1:10.0 NIA 67 1:10.0 NfA 67 1:9.7 NIA 65 1:10.1 1:9.4
64 1 :9_8 1:10.1
High School
NIA NIA NIA NfA NIA NIA N/A
NIA NIA NIA
EXHIBIT J-17
Average Daily Average Daily %Change in Enrollment Attendance Average Daily Student Attendance
(ADE) (ADA) Enrollment Percentage
705 682 4.57% 9674% 703 678 -0_28% 96.44% 733 709 4.27% 96.73% 721 695 -1.64% 96_39% 712 688 -1.25% 9663% 688 664 -3.37% 96.51% 691 667 0.44% 96_53%
633 612 -8.39% 96.68% 636 616 0.47% 96.86% 633 617 -0.47% 97.47%

EXHIBIT J-I8
HARRINGTON PARK BOARD OF EDUCATION SCHOOL BUILDING INFORMATION
LAST TEN FISCAL YEARS (Unaudited)
2006 2007 2008 2009 2010 2011 2012 2013 2014 2015
District Buildinl! School Harrington Park School
Square Feet 69,250 95,250 95,250 95,250 95,250 95,250 95,250 95,250 95,250 95,250
Capacity (students) 635 775 775 775 775 775 775 775 775 775
Enrollment 704 712 738 726 712 687 691 648 637 633
Other Administration Trailer
Square Feet 600 600 Storage Trailer
Square Feet 1,800 1,800 1,800 1,800 1,800 1,800 1,800 1,800 1,800 1,800
Number of Buildings at June 30, 2015 Schools""' 1
0 Other= 1 .. Source: District Records

0 ~
Undistributed Expenditures- Required Maintenance for School Facilities 11-000-261-XXX
School Facilities Project# (s)
Harrington Park School NA
Total School Facilities
Source: District Records
HARRINGTON PARK BOARD OF EDUCATION GENERAL FUND
SCHEDULE OF REQUIRED MAINTENANCE FOR SCHOOL FACILITIES LAST TEN YEARS
(Unaudited)
M!l!!i M!!!1 2008 2009 2010 2011
$ 304,828 $ 171,485 $ 334,719 $ 263,107 $ 228,275 $ 199 179 $
$ 304,828 $ 171,485 $ 334,719 $ 263,107 $ 228,272~ $ 192cin $
-
EXHIBIT J-19
2012 2013 2014 2015
196 066 $ 262,351 $ 237,672 $ 224,734
126,066 $ 262,351 $ 237,672 $ 224,734
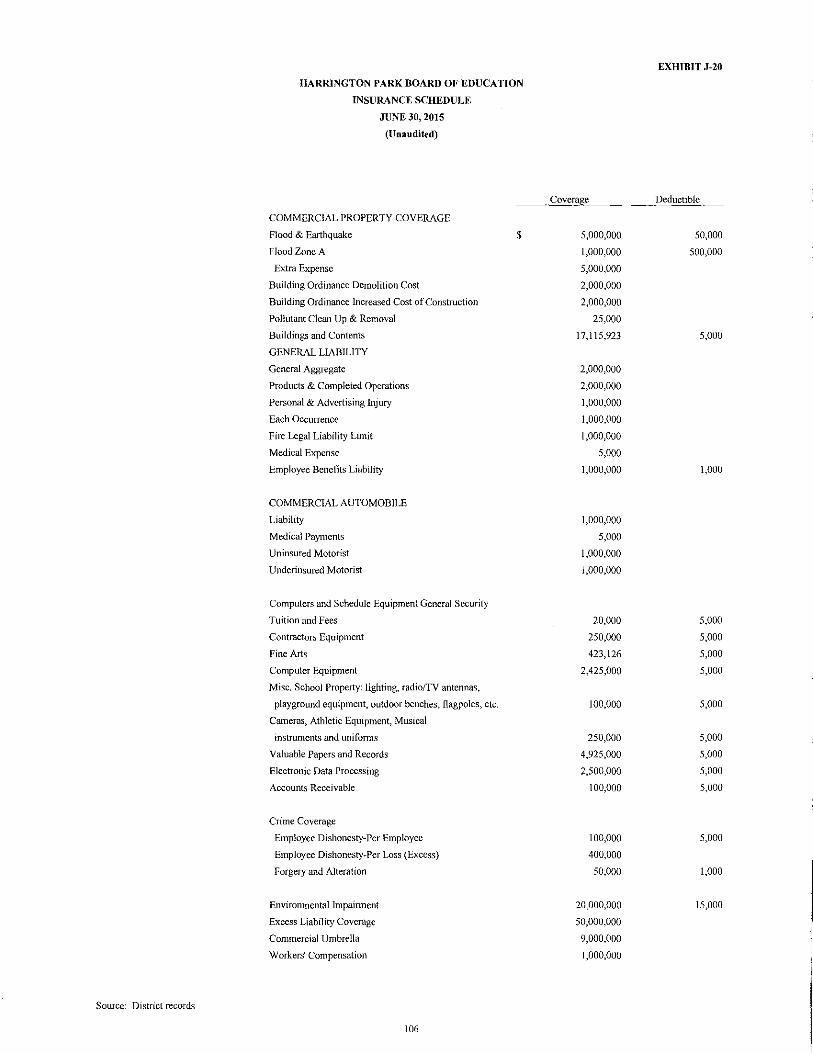
Source: District records
HARRINGTON PARK BOARD OF EDUCATION
INSURANCE SCHEDULE
JUNE 30, 2015
(Unaudited)
COMMERCIAL PROPERTY COVERAGE
Flood & Earthquake
Flood Zone A
Extra Expense
Building Ordinance Demolition Cost
Building Ordinance Increased Cost of Construction
Pollutant Clean Up & Removal
Buildings and Contents
GENERAL LIABILITY
General Aggregate
Products & Completed Operations
Personal & Advertising Injury
Each Occurrence
Fire Legal Liability Limit
Medical Expense
Employee Beneflts Liability
COMMERCIAL AUTOMOBILE
Liability
Medical Payments
Uninsured Motorist
Underinsured Motorist
Computers and Schedule Equipment General Security
Tuition and Fees
Contractors Equipment
Fine Arts
Computer Equipment
Misc. School Property: lighting, radioffV antennas,
playground equipment, outdoor benches, flagpoles, etc.
Cameras, Athletic Equipment, Musical
instruments and unifonns
Valuable Papers and Records
Electronic Data Processing
Accounts Receivable
Crime Coverage
Employee Dishonesty¥ Per Employee
Employee Dishonesty¥Per Loss (Excess)
Forgery and Alteration
Environmental lmpainncnt
Excess Liability Coverage
Commercial Umbrella
Workers' Compensation
I06
$
Coverage
5,000,000
I,OOO,OOO
5,000,000
2,000,000
2,000,000
25,000
I7,ll5,923
2,000,000
2,000,000
I,OOO,OOO
I,OOO,OOO
I,OOO,OOO
5,000
I,OOO,OOO
I,OOO,OOO
5,000
I,OOO,OOO
I,OOO,OOO
20,000
250,000
423,I26
2,425,000
IOO,OOO
250,000
4,925,000
2,500,000
\00,000
IOO,OOO
400,000
50,000
20,000,000
50,000,000
9,000,000
1,000,000
EXHIBIT J-20
Deductible
50,000
500,000
5,000
I,OOO
5,000
5,000
5,000
5,000
5,000
5,000
5,000
5,000
5,000
5,000
I,OOO
I5,000

SINGLE AUDIT SECTION

LERCH, VINCI & HIGGINS,LLP CERTIFIED PUBLIC ACCOUNTANTS REGISTERED MUNICIPAL ACCOUNTANTS
DIETER P. LERCH, CPA, RMA, PSA
GARY J. VINCI, CPA, RMA, PSA
GARY W. HIGGINS, CPA, RMA, PSA
ffiFPREY C. BLISS, CPA, RMA, PSA
PAULJ. LERCH, CPA, RMA, PSA
DONNA L. JAPHET, CPA, PSA
JULIUS B. CONSON!, CPA, PSA
ELIZABETH A. SHICK, CPA, RMA, PSA
ANDREW PARENTE, CPA, RMA, PSA
ROBERT W. HAAG, CPA, PSA
DEBORAH K. LERCH, CPA, PSA
RALPH M. PICONE, CPA, RMA, PSA
REPORT ON INTERNAL CONTROL OVER FINANCIAL REPORTING AND ON COMPLIANCE AND OTiillR MATTERS
BASED ON AN AUDIT OF FINANCIAL STATEMENTS PERFORMED IN ACCORDANCE WITH GOVERNMENT AUDITING STANDARDS
Honorable President and Members of the Board of Education
Harrington Park Board of Education Harrington Park, New Jersey
INDEPENDENT AUDITOR'S REPORT
EXIDBITK-1
DEBRA GOLLE, CPA
CINDY JANACEK, CPA, RMA
MARK SACO, CPA
SHERYL M. NICOLOSI, CPA
KATHLEEN WANG, CPA
ROBERT AMPONSAH, CPA
We have audited, in accordance with the auditing standards generally accepted in the United States of America; the standards applicable to financial audits contained in Government Auditing Standards issued by the Comptroller General of the United States and audit requirements prescribed by the Office of School Finance, Department of Education, State of New Jersey, the financial statements of the governmental activities, the business-type activities, each major fund, and the aggregate remaining fund information of the Harrington Park Board of Education as of and for the fiscal year ended June 30, 2015 and the related notes to the financial statements, which collectively comprise the Harrington Park Board of Education' s basic financial statements and have issued our report thereon dated December 19, 2015.
Internal Contr·ol Over Financial Reporting
In planning and performing our audit of the financial statements, we considered the Harrington Park Board of Education's internal control over financial reporting (internal control) to determine the audit procedures that are appropriate in the circumstances for the purpose of expressing our opinions on the financial statements but not for the purpose of expressing an opinion on the effectiveness of the Harrington Park Board of Education's internal control. Accordingly, we do not express an opinion on the effectiveness of the Harrington Park Board of Education' s internal control.
A deficiency in internal control exists when the design or operation of a control does not allow management or employees, in the normal course of performing their assigned functions, to prevent, or detect and correct, misstatements on a timely basis. A material weakness is a deficiency, or a combination of deficiencies, in internal control, such that there is a reasonable possibility that a material misstatement of the entity's financial statements will not be prevented, or detected and corrected on a timely basis. A significant deficiency is a deficiency, or a combination of deficiencies, in internal control that is less severe than a material weakness, yet important enough to merit attention by those charged with governance.
17-17 ROUTE 208 BFAIR LAWN, NJ 07410 ., TELEPHONE (20 1) 79 1-7100., FACSIM1LE (201) 791-3035
WWW.L1'D9'A.COM

Our consideration of internal control was for the limited purpose described in the first paragraph of this section and was not designed to identifY all deficiencies in internal control that might be material weaknesses or significant deficiencies and therefore, material weaknesses or significant deficiencies may exist that were not identified. Given these limitations, during our audit we did not identifY any deficiencies in internal control that we consider to be material weaknesses. We did identifY a certain deficiency in internal control, described in the accompanying schedule of findings and questioned costs as item 2015-00 I that we consider to be a significant deficiency in internal control over fmancial reporting.
Compliance and Other Matters
As part of obtaining reasonable assurance about whether the Harrington Park Board of Education's financial statements are free from material misstatement, we performed tests of its compliance with certain provisions of laws, regulations, contracts, and grant agreements, noncompliance with which could have a direct and material effect on the determination of financial statement amounts. However, providing an opinion on compliance with those provisions was not an objective of our audit, and accordingly, we do not express such an opinion. The results of our tests disclosed an instance of noncompliance or other matters that is required to be reported under Government Auditing Standards and audit requirements as prescribed by the Office of School Finance, Department of Education, State of New Jersey and which is described in the accompanying schedule of findings and questioned costs as item 2015-001.
We also noted certain matters that are not required to be reported under Government Auditing Standards that we reported to management of the Harrington Park Board of Education in a separate report entitled, "Auditor's Management Report on Administrative Findings- Financial, Compliance and Performance" dated December 19, 2015.
Harrington Park Board of Education's Responses to Findings
The Harrington Park Board of Education' s response to the finding identified in our audit is described in the accompanying schedule of findings and questioned costs. The Harrington Park Board of Education's response was not subjected to the auditing procedures applied in the audit of the financial statements and, accordingly, we express no opinion on the response.
Purpose of this Report
The purpose of this report is solely to describe the scope of our testing of intemal control and compliance and the results of that testing, and not to provide an opinion on the effectiveness of the Harrington Park Board of Education's internal control or on compliance. This report is an integral part of an audit performed in accordance with Government Auditing Standards in considering the Harrington Park Board of Education' s internal control and compliance. Accordingly, this communication is not suitable for any other purpose.
Fair Lawn, New Jersey December 19,2015
108
~~~'/L~- --!tiJ LERCH, VINCI & HlGGIN{, ;r '1 Certified Public Accountants Public School countants
Public School Accountant PSA Number CS00814

LERCH, VINCI & HIGGINS!)LLP
DIETER 1'. LERCH, CPA, RMA, PSA
GARY J. VINCI, CPA, RMA, PSA
GARY W. HIGGINS, CPA, RMA, PSA
JEFFREY C. BLISS, CPA, RMA, PSA
PAULJ. LERCH, CPA, RMA, PSA
DONNA L. JAPHET, CPA, PSA
JULIUS B. CONSONI, CPA, PSA
ELIZABETH A. SHICK, CPA, RMA, PSA
ANDREW PARENTE, CPA, RMA, PSA
ROBERT W. HAAG, CPA, PSA
DEBORAH K. LERCH, CPA, PSA
RALPH M. PICONE, CPA, RMA, PSA
CERTIFIED PUBLIC ACCOUNTANTS REGISTERED MUNICIPAL ACCOUNTANTS EXHIBITK-2
DEBRA GOLLE, CPA
CINDY JANACEK, CPA, RMA
MARK SACO, CPA
SHERYL M. NICOLOSI, CPA
KATITLEEN WANG, CPA
ROBERT AMPONSAH, CPA
REPORT ON COMPLIANCE FOR EACH MAJOR STATE PROGRAM; REPORT ON INTERNAL CONTROL OVER COMPLIANCE; AND REPORT
ON SCHEDULE OF EXPENDITURES OF STATE FINANCIAL ASSISTANCE AS REQUIRED BY NEW JERSEY OMB CIRCULAR 15-08
INDEPENDENT AUDITOR'S REPORT Honorable President and Members of the Board of Education
Harrington Park Board of Education Harrington Park, New Jersey
Report on Compliance for Each Major State Program
We have audited the Harrington Park Board of Education's compliance with the types of compliance requirements described in the New Jersey OMB Circular 15-08 State Aid/Grant Compliance Supplement that could have a direct and material effect on each of the Harrington Park Board of Education's major state programs for the fiscal year ended June 30, 2015. The Harrington Park Board of Education's major state programs are identified in the summary of auditor's results section of the accompanying schedule of findings and questioned costs.
Management's Responsibility
Management is responsible for compliance with the requirements of laws, regulations, contracts, and grants applicable to its state programs.
Auditor's Responsibility
Our responsibility is to express an op inion on compliance for each of the Harrington Park Board of Education's major state programs based on our audit of the types of compliance requirements referred to above. We conducted our audit of compliance in accordance with auditing standards generally accepted in the United States of America; the standards applicable to financial audits contained in Government Auditing Standards, issued by the Comptroller General of the United States; audit requirements as prescribed by the Office of School Finance, Department of Education, State of New Jersey; New Jersey OMB Circular 15-08, Single Audit Policy for Recipients of Federal Grants, State Grants and State Aid. Those standards and Circular require that we plan and perform the audit to obtain reasonable assurance about whether noncompliance with the types of compliance requirements referred to above that could have a direct and material effect on a major state program occurred. An audit includes examining, on a test basis, evidence about the Harrington Park Board of Education's compliance with those requirements and performing such other procedures as we considered necessary in the circumstances.
17-17 ROUTE 208 ~FAIR LAWN, NJ 07410" TELEPHONE (201) 791-7100 "FACSIMll..E (201) 791-3035
WWW.LVHCPA.COM
109

We believe that our audit provides a reasonable basis for our opinion on compliance for each major state program. However, our audit does not provide a legal determination of the Harrington Park Board of Education's compliance.
Opinion on Each Major State Program
In our opinion, the Harrington Park Board of Education complied, in all material respects, with the types of compliance requirements referred to above that could have a direct and material effect on each of its major state programs for the fiscal year ended June 30, 2015.
Report on Internal Control Over Compliance
Management of the Harrington Park Board of Education is responsible for establishing and maintaining effective internal control over compliance with the types of compliance requirements referred to above. In planning and performing our audit of compliance, we considered the Harrington Park Board of Education's internal control over compliance with the types of requirements that could have a direct and material effect on each major state program to determine the auditing procedures that are appropriate in the circumstances for the purpose of expressing an opinion on compliance for each major state program and to test and report on internal control over compliance in accordance with New Jersey OMB Circular 15-08, but not for the purpose of expressing an opinion on the effectiveness of internal control over compliance. Accordingly, we do not express an opinion on the effectiveness of the Harrington Park Board of Education's internal control over compliance.
A deficiency in internal control over compliance exists when the design or operation of a control over compliance does not allow management or employees, in the normal course of performing their assigned functions, to prevent, or detect and correct, noncompliance with a type of compliance requirement of a state program on a timely basis. A material weakness in internal control over compliance is a deficiency, or combination of deficiencies, in internal control over compliance, such that there is a reasonable possibility that material noncompliance with a type of compliance requirement of a state program will not be prevented, or detected and corrected, on a timely basis. A significant deficiency in internal control over compliance is a deficiency, or a combination of deficiencies, in internal control over compliance with a type of compliance requirement of a state program that is less severe than a material weakness in internal control over compliance, yet important enough to merit attention by those charged with governance.
Our consideration of internal control over compliance was for the limited purpose described in the first paragraph of this section and was not designed to identify all deficiencies in internal control over compliance that might be material weaknesses or significant deficiencies. We did not identify any deficiencies in internal control over compliance that we consider to be material weaknesses. However, material weaknesses may exist that have not been identified.
The purpose of this report on internal control over compliance is solely to describe the scope of our testing of internal control over compliance and the results of that testing based on the requirements of New Jersey OMB Circular 15-08. Accordingly, this report is not suitable for any other purpose.
Report on Schedule of Expenditures of State Financial Assistance Required by New Jersey OMB Circular 15-08
We have audited the financial statements of the governmental activities, the business-type activities, each major fund, and the aggregate remaining fund information of the Harrington Park Board of Education as of and for the fiscal year ended June 30, 2015 and the related notes to the financial statements, which collectively comprise the Board of Education's basic financial statements. We issued our report thereon dated December 19, 2015, which contained unmodified opinions on those financial statements. Our audit was conducted for the purpose of forming opinions on the financial statements that collectively comprise the basic financial statements. The accompanying schedule of expenditures of state financial assistance as required by New Jersey OMB Circular 15-08 is presented for purposes of additional analysis and is not a required part of the basic financial statements. Such information is the responsibility of management and was derived from and relates directly to the underlying accounting and other records used to prepare the basic financial statements. The information has been subjected to the auditing procedures applied in the audit of the financial statements and certain additional procedures, including comparing and reconciling such information directly to the underlying accounting and other
110

records used to prepare the basic financial statements or to the basic financial statements themselves, and other additional procedures in accordance with auditing standards generally accepted in the United States of America. In our opinion, the schedule of expenditures of state fmancial assistance is fairly stated in all material respects in relation to the basic financial statements as a whole.
Fair Lawn, New Jersey December 19, 2015
Ill
~::~G;(~_t~ Certified Public Accountants
_:z=unlli~,
Gary W. gins ~ Public chool Accountant PSA Number CS00814
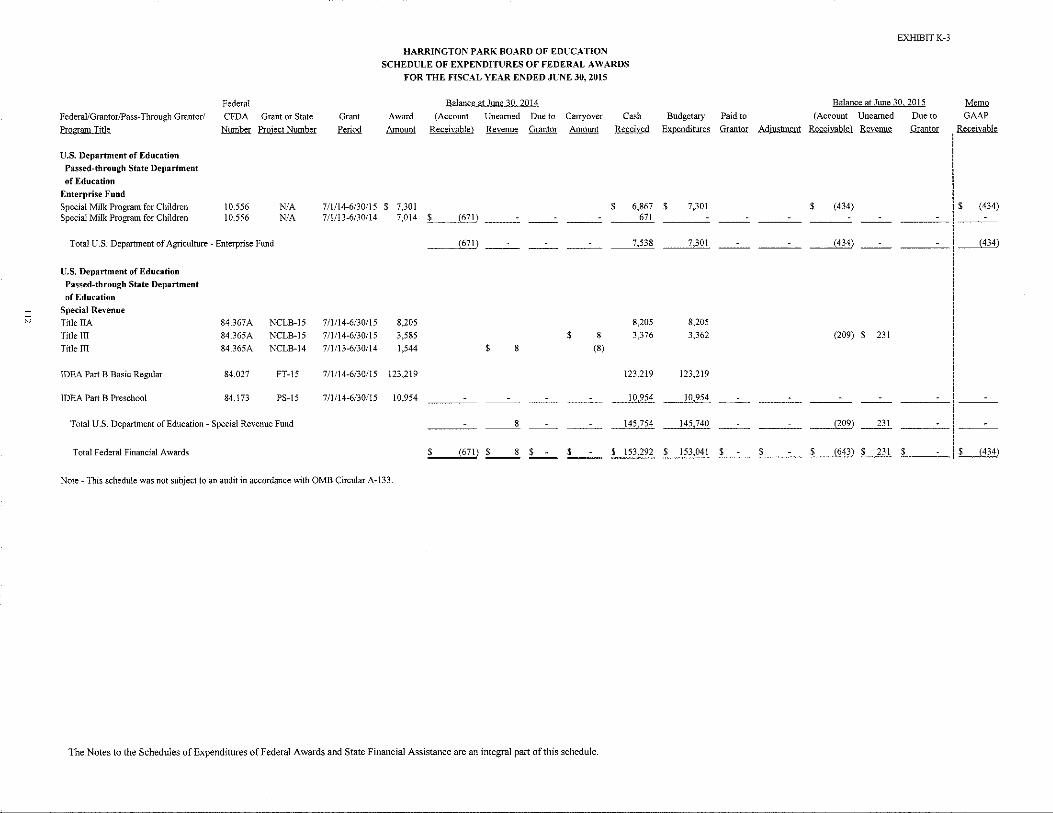
;:;
F ederai/Grantor/Pass-Through Grantor/
Program Title
U.S. Department of Education Passed-through State Department of Education
Enterprise Fund Special Milk Program for Children Special Milk Program for Children
Federal
CFDA Grant or State
Number Project Number
10.556 10.556
N/A N/A
Total U.S. Department of Agriculture- Enterprise Fund
U.S. Department of Education Passed-through State Department of Education
Special ReYenue Title IIA 84.367A NCLB-15
Title III 84.365A NCLB-15
Title III 84.365A NCLB-14
IDEA Part B Basic Regular 84.027 FT-15
IDEA Part B Preschool 84.173 PS-15
Total U.S. Department of Education- Special Revenue Fund
Grant
Period
HARRINGTON PARK BOARD OF EDUCATION SCHEDULE OF EXPENDITURES OF FEDERAL A WARDS
FOR THE FISCAL YEAR ENDED JUNE 30, 2015
Award
AmoWlt
Balance atJune 30 2014
(Account Unearned Due to Carryover
Receivable) Revenue Grantor Amount
Cash
Received
Budgetary
Expenditures
711114-6130115 $ 7,301 $ 6,867 $ 671
7,301 711113-6/30/14 7,014 $ (671)
(671) 7,538 7,301
711114-6130115 8,205 8.205 8,205
711114-6130115 3,585 s 8 3,376 3,362
7/1/13-6/30/14 1,544 $ 8 (8)
711114-6130115 123,219 123.219 123,219
7/l/14-6/30/l5 10,954 10,954 __ 1_0,954
8 145,754 145,740
EXHIBIT K-3
Balance at Jtme 30 2015
Paid to (Account Unearned
Grantor Adjusbnent Receivable) Revenue
$ (434)
l:'lil
(209) $ 231
--'("'20~9) 231
Due to
Grantor
Memo
GAAP
Receivable
$ (434)
__BH)
Total Federal Financial Awards s (671) _s __ s _s_-__ s __ $ 153,?92 $ I53,o4r _s __ :cs __ _ $ (643) Lill $ - f~
Note- This schedule was not subject to an audit in accordance with Ol\.18 Circular A-133.
The Notes to the Schedules of Expenditures of Federal Awards and State Financial Assistance are an integral part of this schedule.

EXHIBIT K-4
HARRINGTON PARK BOARD OF EDUCATION SCHEDULE OF EXPENDITURES OF STATE FINANCIAL ASSISTANCE
FOR THE FISCAL YEAR ENDED JUNE 30,2015
§alan~~ at June 30 2014 Repayment BalanceatJune30 2015 """"' Program or of Prior Combined Grant or State Award Grant (Accounts Ueamed Due to Carryover Cash Budgetary Years' (Accounts Unearned Due to GAAP Total
State Grantor!Program Title Project Number Amount Period Receivabl~ "'"""" lOrnJtQr - )'teceived Expenditures Adjustment Balances Receivable) Revenue Grantor Receivable Expenditures
State Department of Education General Fund Special Educational Aid 15-495-034-5120-089 $ 259,783 7/1/14-6130!15 $ 235,558 $ 259,783 $ (24,225) $ 259,783
Special Educational Aid 14-495-034-5120-089 259,783 7/1/13-6130/14 $ (24,143) 24,143 Transportation Aid 15-495-034-5120-014 4,026 7/J/14-6130/15 3,65\ 4,026 (375) 4,026
Transportation Aid 14-495-034-5120-014 4,026 711113-6130/14 (374) 374 Security Aid 15-495-034-5120-084 9,528 7/J/14-6130/15 8,640 9,528 (888) 9,528 Security Aid 14-495-034-5120-084 9,528 711113-6!30/14 (886) 886
Equalization Aid 15-495-034-5120-078 2,401 711114-6/30/15 2,177 2,401 (224) 2,401 Equalization Aid 14-495-034-5120-078 2,401 711113-6/30/14 (223) 223 Additional Adjustment Aid 15-495-034-5120-085 I 7!1!14-6!30/15 PARCC Readiness Aid 15-495-034-5120-098 6,440 7/l/!4-6!30/15 5,839 6,440 (601) 6,440 Per Pupil Grov..th Aid 15-495-034-5120-097 6,440 7ilil4-6/30/J5 5,839 6,440 (601) 6,440 Nonpublic Transportation Aid NIA 1,218 7!1/14-6/30/15 1,218 (1,218) $ (1,218) 1,218 Nonpublic Transportation Aid NIA 1,690 71!/13-6/301!4 (1,690) 1,690 Extraordinary Aid 15-100-034-5120-473 260,954 7/1/14-6/30115 260,954 (260,954) 260,954 Extraordinary Aid 14-100-034-5120-473 293,518 7/1113-6/301!4 (293,518) 293,518 TPAF Social Security Contrib 15-495-034-5094-003 343,257 7/1/14-6/30/15 324,938 343,257 (18,319) (18,319) 343,257 TPAF Social Security Contrib 14-495-034-5095-002 358,259 711113-6/30114 (19,279) 19,279
" TPAF Pension- NCGI 15-495-034-5094-007 16,990 7/1/14-6/30115 16,990 16,990 16,990 TPAF Pension- Nonnal Cost 15-495-034-5094-006 236,156 7/1/14-6/30/15 236,156 236,156 236,156 TPAF Pension Post Retirement Medical Contr. 15-495-034-5094-00 I 401,869 7!1114-6/30115 ---- --- --- ---~ 401,869 ---- ---- ---- ---- ---- ---- 401,869
Total General Fund _____lliQJ_ill --- --- --- ...l2!l:Il!. I 549,063 ---- ---- (307,405) ---- ---- ~~063
Special Rewnue Fund Anti Bullying NIA 1,113 7/1!13-6/30/14 ---- !_ill_ --- --- ---- 242 __ 6_2_1 242
Total Special Revenue Fund ---- _____lli_ --- --- ---- 242 __ 6_2_1 242
Capital Projects Fund SDA- Boiler Replacement at the Harrington Park
Public School 2050-050-14-1001-004 226,000 7(1!14-6(30115 ---- --- --- --- ---- 77.760 ---- ---- (226,000) 148,240 ---- (226,000) 77,760
Total Capital Projects Fund 77 760 ---- ---- (226,000) 148 240 ---- (226,000) -~
Debt Sen·ice Fund Debt Service Aid Type II 15-495-034-5120-017 33,522 7!1114-6!30115 33,522 33,522 33 522 ----
Total State Financial Assistance ~ ____§g ___ ___ I 615 293 I 660 587 ______illM@ _____l_1_M§l (245,537) ~587
State Financial Assistance Not Sub,ied to Single Audit Determination
General Fund On-BehalfTPAF Pension System NCGI 15-495-034-5094-007 16,990 7!1!14.6/30/15 (16.990) (16.990) (16,990) On-BehalfTPAF Pension System Nonnal Cost 15-495-034-5094-006 236,156 7/1/14-6/30/15 (236, 156) (236,156) (236, 156) On-BehalfTPAF Post-Retirement Medical Contr. 15-495-034-5094-00 1 401,869 7/1/14-6/30/15 ---- -- -- -- ~ (401 869\ --- -- --- --- --- --- (401 869)
Total State Financial Assistance Subject to Single Audit ~~ _, ___ , __ $ 960 278 $ 1,005,572 _, ____ , __ s (533.405) s 148.861 , ___ $ (245,537) s 1,005.572
The Notes to the Schedules of Expenditures of Federal Awards and State Financial Assistance are an integral part of the schedule

HARRINGTON PARK BOARD OF EDUCATION NOTES TO THE SCHEDULES OF EXPENDITURES OF FEDERAL AWARDS AND STATE FINANCIAL ASSISTANCE FOR THE FISCAL YEAR ENDED JUNE 30,2015
NOTE 1 GENERAL
EXHIBITK-5
The accompanying schedules present the activity of all federal and state financial assistance programs of the Harrington Park Board of Education. The Board of Education is defined in Note !(A) to the Board's financial statements. All federal financial assistance received directly from federal agencies, as well as federal awards and state financial assistance passed through other government agencies is included on the schedules of expenditures of federal awards and state financial assistance.
NOTE 2 BASIS OF ACCOUNTING
The accompanying schedules are prepared and presented using the budgetary basis of accounting with the exception of programs recorded in the food service fund, which are presented using the accrual basis of accouuting. These basis of accounting are described in Notes !(C) to the Board's financial statements. The information in these schedules is presented in accordance with requirements of U.S. OMB Circular A-133, "Audits of States, Local Governments and Non-Profit Organizations" and New Jersey OMB Circular 15-08, "Single Audit Policy for Recipients of Federal Grants, State Grants, and State Aid". Therefore, some amouuts presented in these schedules may differ from the amounts presented in, or used in the preparation of, the financial statements.
NOTE 3 RELATIONSHIP TO FINANCIAL STATEMENTS
The financial statements present the general fund and special revenue fund on a GAAP basis. Budgetary comparison statements or schedules (RSI) are presented for the general fund and special revenue fund to demonstrate finance-related legal compliance in which certain revenue is permitted by law or grant agreement to be recognized in the audit year, whereas for GAAP reporting, revenue is not recognized until the subsequent year or when expenditures have been made.
The general fund is presented in the accompanying schedules on a modified accrual basis with the exception of the revenue recognition of the delayed state aid payments in the current budget year, which is mandated pursuant to N.J.S.A. 18A:22-44.2.. For GAAP purposes, those payments are not recognized until the subsequent year due to the state deferral and recording of certain state aid payments in the subsequent year. The special revenue fund is presented in the accompanying schedules on the grant accounting budgetary basis which recognizes encumbrances as expenditures and also recognizes the related revenues, which may include the delayed state aid payments, whereas the GAAP basis does not. The special revenue fund also recognizes the delayed state aid payments in the current budget year, consistent with N.J.S.A. 1 8A:22-44.2.
The net adjustment to reconcile from the budgetary basis to the GAAP basis is an increase of $31,276 for the general fund and an increase of $2 for the special revenue fund. See the Notes to Required Supplementary Information for a reconciliation of the budgetary basis to the modified accrual basis of accounting for the general and special revenue funds. Awards and financial assistance revenues are reported in the Board's financial statements on a GAAP basis as presented as follows:
General Fund Special Revenue Fund Capital Projects Fund Debt Service Fund Food Service Fund
Total Financial Assistance
$
$
Federal State
$ 1,580,339 145,705 242
77,760 33,522
7,301
1,691,863 153,006 ;:;_$~~~=
114
Total
$ 1,580,339 145,947 77,760 33,522
7,301
$ 1,844,869

HARRINGTON PARK BOARD OF EDUCATION NOTES TO THE SCHEDULES OF EXPENDITURES OF FEDERAL AWARDS AND STATE FINANCIAL ASSISTANCE FOR THE FISCAL YEAR ENDED JUNE 30, 2015
NOTE 4 RELATIONSHIP TO FEDERAL AND STATE FINANCIAL REPORTS
EXHIBITK-5
Amounts reported in the accompanying schedules may not necessarily agree with the amounts reported in the related federal and state financial reports due to timing differences between the District's fiscal year and grant program years.
NOTE 5 OTHER INFORMATION
TPAF Social Security contributions in the amount of $343,257 represents the amount reimbursed by the State for the employer's share of social security contributions for TPAF members for the fiscal year ended June 30, 2015. The amount reported as TPAF Pension System Contributions in the amount of $253,146 and TPAF Post-Retirement Medical Benefits Contributions in the amount of $401,869 represents the amount paid by the State on behalf of the District for the fiscal year ended June 30, 2015.
NOTE 6 ON-BEHALF PROGRAMS NOT SUBJECT TO STATE SINGLE AUDIT
On-behalf State Programs for TPAF Pension and Post-Retirement Medical Benefits Contributions payments are not subject to a State single audit and, therefore, are excluded from major program determination. The Schedule of State Financial Assistance provides a reconciliation of State financial assistance reported in the District's financial statements and the amount subject to State single audit and major program determination.
115

HARRINGTON PARK BOARD OF EDUCATION SCHEDULE OF FINDINGS AND QUESTIONED COSTS
FOR THE FISCAL YEAR ENDED JUNE 30, 2015
Part I- Summary of Auditor's Results
Financial Statement Section
Type of auditors' report issued on financial statements
Internal control over financial reporting:
I) Material weaknesses identified?
2) Significant deficiencies identified that are not considered to be material weakness( es )?
Noncompliance material to the basic financial statements noted?
Federal Awards Section- NOT APPLICABLE
State Awards Section
Internal Control over major programs:
(I) Material weaknesses identified?
(2) Significant deficiencies identified that are not considered to be material weakness( es )?
Type of auditor's report issued on compliance tor major programs
Any audit findings disclosed that are required to be reported in accordance with N.J. Circular Letter 15-08?
Identification of major state programs:
GMIS Number(s)
15-495-034-5094-003
15-495-034-5120-089
I5-495-034-5120-084
15-495-034-5120-078
15-495-034-5120-085
15-495-034-5120-098
15-495-034-5120-097
Unmodified
____ yes X no
_...:X.:___ yes none
__ X:..;:__ yes no
____ yes X no
____ yes X none
Unmodified
___ yes X none
Name of State Program
TP AF Social Security Aid
Special Education Aid
Security Aid
Equalization Aid
Additional Adjustment Aid
P ARCC Readiness Aid
Per Pupil Growth Aid
EXHIBIT K-6
Dollar threshold used to distinguish between Type A and Type B programs: $300,000
Auditee qualified as low-risk auditee? _...:X.:__ yes no
116

HARRINGTON PARK BOARD OF EDUCATION SCHEDULE OF FINDINGS AND QUESTIONED COSTS
FOR THE FISCAL YEAR ENDED JUNE 30, 2015
Part 2- Schedule of Financial Statement Findings
EXHIBITK-6
This section identifies reportable conditions, material weaknesses, and instances of noncompliance related to the basic financial statements that are required to be reported in accordance with paragraphs 5.18 through 5.20 of Government Auditing Standards.
Finding 2015-001
Our audit of the Capital Projects Fund revealed the following:
• School Development Authority (SDA) grant awards and contracts awarded for the boiler replacement project were not recorded in the District's accounting records at year end.
• Anticipated revenue and appropriations for the boiler project were not established in the computerized accounting system.
Criteria or specific requirement
GAAP Technical Systems Manual; Internal controls over contract awards.
Condition
Contract awards and available project balances were not entered into the District's accounting records.
Context
Contracts awarded in the amount of $686,446 were not recorded in the District's accounting records. In addition, project balances for the local contribution and the SDA grant award were not entered into the subsidiary revenue and budget reports.
Financial statements do not properly reflect liabilities, expenditures and fund balance at year end.
Unknown.
Recommendation
Available project balances and contract awards in the Capital Projects Fund be entered into the District's computerized accounting system when available grants and contracts are awarded.
View of Responsible Officials and Planned Corrective Action
Management has reviewed this finding and has indicated that corrective action will be taken.
117

HARRINGTON PARK BOARD OF EDUCATION SCHEDULE OF FINDINGS AND QUESTIONED COSTS
FOR THE FISCAL YEAR ENDED JUNE 30, 2015
Part 3- Schedule of Federal and State Award Findings and Questioned Costs (Cont'd)
EXHIBITK-6
This section identifies the significant deficiencies, material weaknesses, and instances of noncompliance, including questioned costs, related to the audit of major federal and state programs, as required by OMB Circular A-133and New Jersey OMB's Circular 15-08.
CURRENT YEAR FEDERAL AWARDS
Not applicable.
CURRENT YEAR STATE AWARDS
There are none.
118

HARRINGTON PARK BOARD OF EDUCATION SUMMARY SCHEDULE OF PRIOR AUDIT FINDINGS
FOR THE FISCAL YEAR ENDED JUNE 30, 2015
EXHIBITK-7
This section identifies the status of prior-year findings related to the basic financial statements and federal and state awards that are required to be reported in accordance with Chapter 6.12 of Government Auditing Standards, U.S. OMB Circular A-133 (section .3l5(a)(b)) and New Jersey OMB's Circular 04-04.
STATUS OF PRIOR YEAR FINDINGS
There were none.
119


![[Dan Harrington, Bill Robertie] Harrington on Cash(BookZZ.org)](https://img.pdfslide.us/doc/110x75/55cf8546550346484b8c3513/dan-harrington-bill-robertie-harrington-on-cashbookzzorg.jpg)