Embed Size (px)
Citation preview
Painting has been a human endeavor probably since we developed op-posable thumbs. Traditionally, painting filled one of two purposes: either decorative, with splashes of colors and designs, or commemorative, cap-turing a scene. One of the challenges bedeviling artists for millennia is how to translate a three-dimensional person or landscape on to a two-dimensional object, like a canvas. A big step forward was made six hundred years ago by Filippo Brunelles-chi, a renown goldsmith, architect and artist, the first truly “Renaissance Man,” who had gained fame for constructing the magnificent brick dome of Florence’s main cathedral, the Santa Maria del Fiore.1 It was, and re-mains, a marvel of architecture, Brunelleschi’s gift to the world. But a more important legacy may be the two geometric drawings he made of the Baptistery adjacent to the cathedral. Drawn from two different angles, Brunelleschi illustrated the concept of linear perspective. He created a template of how to calculate, using Euclidean geometry, and then incor-porate, linear perspective in a drawing, thus endowing the two-dimensional canvas with a third dimension: depth. This was a remarkable breakthrough, but it still had its limits. Perspective added depth to a scene, but its subject was still painted in two dimen-sions, appearing flat on the canvas. Another technique would be needed to bring greater realism to art. This came in the following century from the
Boundaries
www.angelesadvisors.com 1 To this day, the largest brick dome in the world.
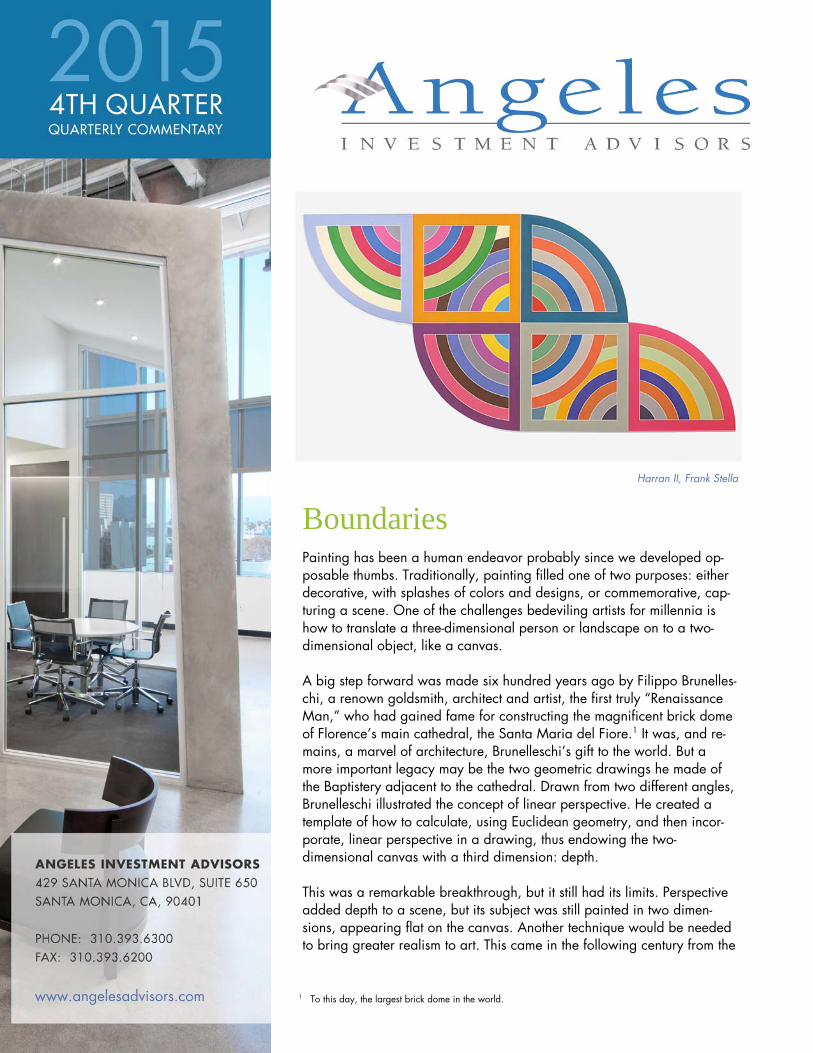
Harran II, Frank Stella
2
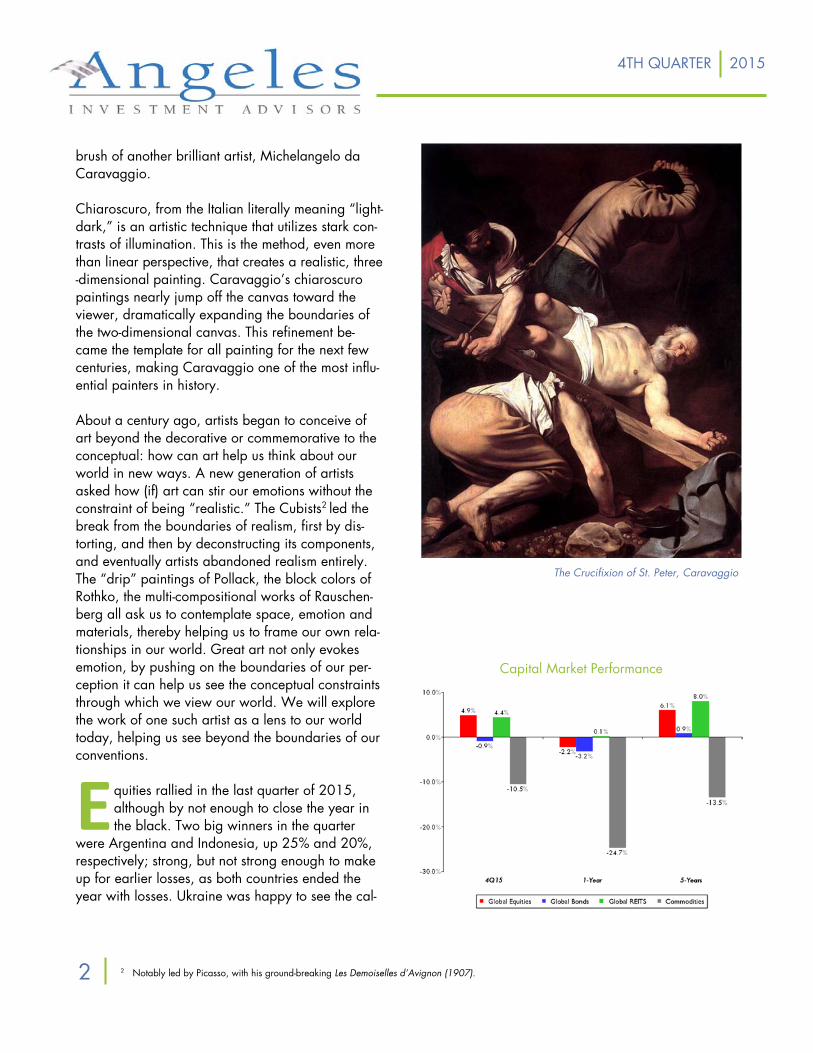
brush of another brilliant artist, Michelangelo da Caravaggio. Chiaroscuro, from the Italian literally meaning “light-dark,” is an artistic technique that utilizes stark con-trasts of illumination. This is the method, even more than linear perspective, that creates a realistic, three-dimensional painting. Caravaggio’s chiaroscuro paintings nearly jump off the canvas toward the viewer, dramatically expanding the boundaries of the two-dimensional canvas. This refinement be-came the template for all painting for the next few centuries, making Caravaggio one of the most influ-ential painters in history. About a century ago, artists began to conceive of art beyond the decorative or commemorative to the conceptual: how can art help us think about our world in new ways. A new generation of artists asked how (if) art can stir our emotions without the constraint of being “realistic.” The Cubists2 led the break from the boundaries of realism, first by dis-torting, and then by deconstructing its components, and eventually artists abandoned realism entirely. The “drip” paintings of Pollack, the block colors of Rothko, the multi-compositional works of Rauschen-berg all ask us to contemplate space, emotion and materials, thereby helping us to frame our own rela-tionships in our world. Great art not only evokes emotion, by pushing on the boundaries of our per-ception it can help us see the conceptual constraints through which we view our world. We will explore the work of one such artist as a lens to our world today, helping us see beyond the boundaries of our conventions.
E quities rallied in the last quarter of 2015, although by not enough to close the year in the black. Two big winners in the quarter
were Argentina and Indonesia, up 25% and 20%, respectively; strong, but not strong enough to make up for earlier losses, as both countries ended the year with losses. Ukraine was happy to see the cal-
Capital Market Performance
The Crucifixion of St. Peter, Caravaggio
2 Notably led by Picasso, with his ground-breaking Les Demoiselles d’Avignon (1907).
4TH QUARTER 2015
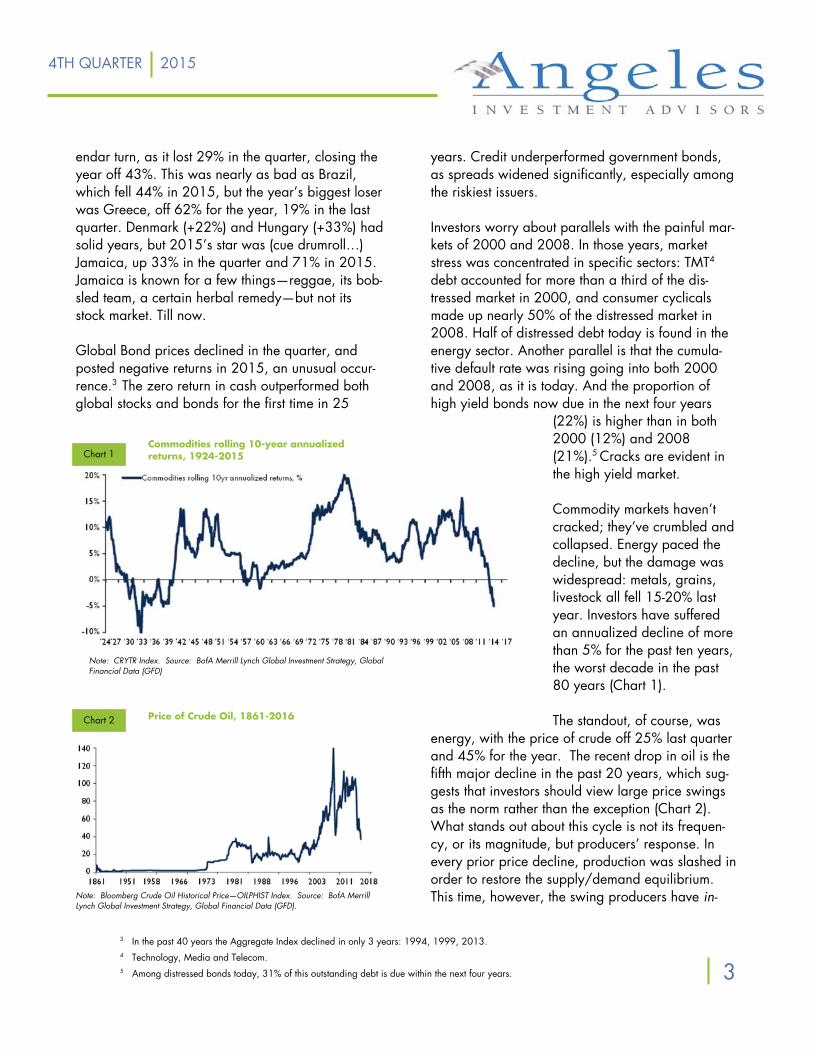
endar turn, as it lost 29% in the quarter, closing the year off 43%. This was nearly as bad as Brazil, which fell 44% in 2015, but the year’s biggest loser was Greece, off 62% for the year, 19% in the last quarter. Denmark (+22%) and Hungary (+33%) had solid years, but 2015’s star was (cue drumroll…) Jamaica, up 33% in the quarter and 71% in 2015. Jamaica is known for a few things—reggae, its bob-sled team, a certain herbal remedy—but not its stock market. Till now. Global Bond prices declined in the quarter, and posted negative returns in 2015, an unusual occur-rence.3 The zero return in cash outperformed both global stocks and bonds for the first time in 25
years. Credit underperformed government bonds, as spreads widened significantly, especially among the riskiest issuers. Investors worry about parallels with the painful mar-kets of 2000 and 2008. In those years, market stress was concentrated in specific sectors: TMT4
debt accounted for more than a third of the dis-tressed market in 2000, and consumer cyclicals made up nearly 50% of the distressed market in 2008. Half of distressed debt today is found in the energy sector. Another parallel is that the cumula-tive default rate was rising going into both 2000 and 2008, as it is today. And the proportion of high yield bonds now due in the next four years
(22%) is higher than in both 2000 (12%) and 2008 (21%).5 Cracks are evident in the high yield market. Commodity markets haven’t cracked; they’ve crumbled and collapsed. Energy paced the decline, but the damage was widespread: metals, grains, livestock all fell 15-20% last year. Investors have suffered an annualized decline of more than 5% for the past ten years, the worst decade in the past 80 years (Chart 1). The standout, of course, was
energy, with the price of crude off 25% last quarter and 45% for the year. The recent drop in oil is the fifth major decline in the past 20 years, which sug-gests that investors should view large price swings as the norm rather than the exception (Chart 2). What stands out about this cycle is not its frequen-cy, or its magnitude, but producers’ response. In every prior price decline, production was slashed in order to restore the supply/demand equilibrium. This time, however, the swing producers have in-
3 In the past 40 years the Aggregate Index declined in only 3 years: 1994, 1999, 2013. 4 Technology, Media and Telecom. 5 Among distressed bonds today, 31% of this outstanding debt is due within the next four years.
Chart 1 Commodities rolling 10-year annualized returns, 1924-2015
Chart 2 Price of Crude Oil, 1861-2016
Note: CRYTR Index. Source: BofA Merrill Lynch Global Investment Strategy, Global Financial Data (GFD)
Note: Bloomberg Crude Oil Historical Price—OILPHIST Index. Source: BofA Merrill Lynch Global Investment Strategy, Global Financial Data (GFD).
4TH QUARTER 2015
3
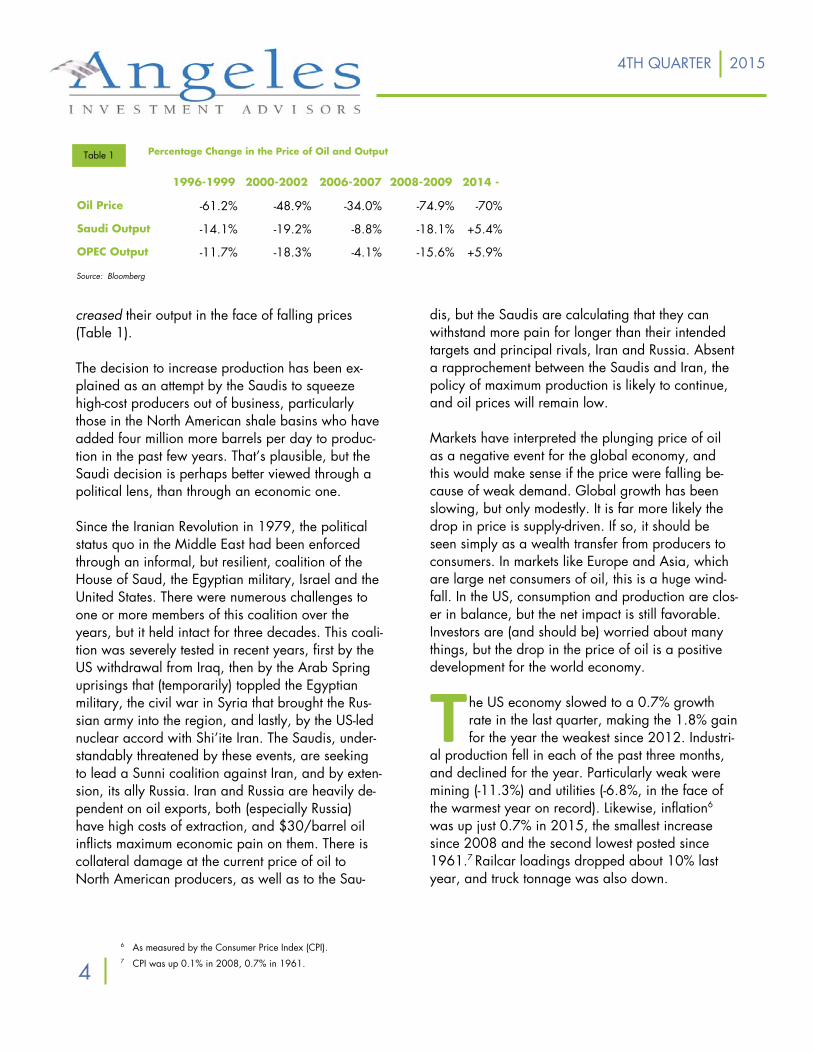
creased their output in the face of falling prices (Table 1). The decision to increase production has been ex-plained as an attempt by the Saudis to squeeze high-cost producers out of business, particularly those in the North American shale basins who have added four million more barrels per day to produc-tion in the past few years. That’s plausible, but the Saudi decision is perhaps better viewed through a political lens, than through an economic one. Since the Iranian Revolution in 1979, the political status quo in the Middle East had been enforced through an informal, but resilient, coalition of the House of Saud, the Egyptian military, Israel and the United States. There were numerous challenges to one or more members of this coalition over the years, but it held intact for three decades. This coali-tion was severely tested in recent years, first by the US withdrawal from Iraq, then by the Arab Spring uprisings that (temporarily) toppled the Egyptian military, the civil war in Syria that brought the Rus-sian army into the region, and lastly, by the US-led nuclear accord with Shi’ite Iran. The Saudis, under-standably threatened by these events, are seeking to lead a Sunni coalition against Iran, and by exten-sion, its ally Russia. Iran and Russia are heavily de-pendent on oil exports, both (especially Russia) have high costs of extraction, and $30/barrel oil inflicts maximum economic pain on them. There is collateral damage at the current price of oil to North American producers, as well as to the Sau-
dis, but the Saudis are calculating that they can withstand more pain for longer than their intended targets and principal rivals, Iran and Russia. Absent a rapprochement between the Saudis and Iran, the policy of maximum production is likely to continue, and oil prices will remain low. Markets have interpreted the plunging price of oil as a negative event for the global economy, and this would make sense if the price were falling be-cause of weak demand. Global growth has been slowing, but only modestly. It is far more likely the drop in price is supply-driven. If so, it should be seen simply as a wealth transfer from producers to consumers. In markets like Europe and Asia, which are large net consumers of oil, this is a huge wind-fall. In the US, consumption and production are clos-er in balance, but the net impact is still favorable. Investors are (and should be) worried about many things, but the drop in the price of oil is a positive development for the world economy.
T he US economy slowed to a 0.7% growth rate in the last quarter, making the 1.8% gain for the year the weakest since 2012. Industri-
al production fell in each of the past three months, and declined for the year. Particularly weak were mining (-11.3%) and utilities (-6.8%, in the face of the warmest year on record). Likewise, inflation6
was up just 0.7% in 2015, the smallest increase since 2008 and the second lowest posted since 1961.7 Railcar loadings dropped about 10% last year, and truck tonnage was also down.
6 As measured by the Consumer Price Index (CPI). 7 CPI was up 0.1% in 2008, 0.7% in 1961.
Table 1 Percentage Change in the Price of Oil and Output
Source: Bloomberg
1996-1999 2000-2002 2006-2007 2008-2009 2014 -
Oil Price -61.2% -48.9% -34.0% -74.9% -70%
Saudi Output -14.1% -19.2% -8.8% -18.1% +5.4%
OPEC Output -11.7% -18.3% -4.1% -15.6% +5.9%
4TH QUARTER 2015
4
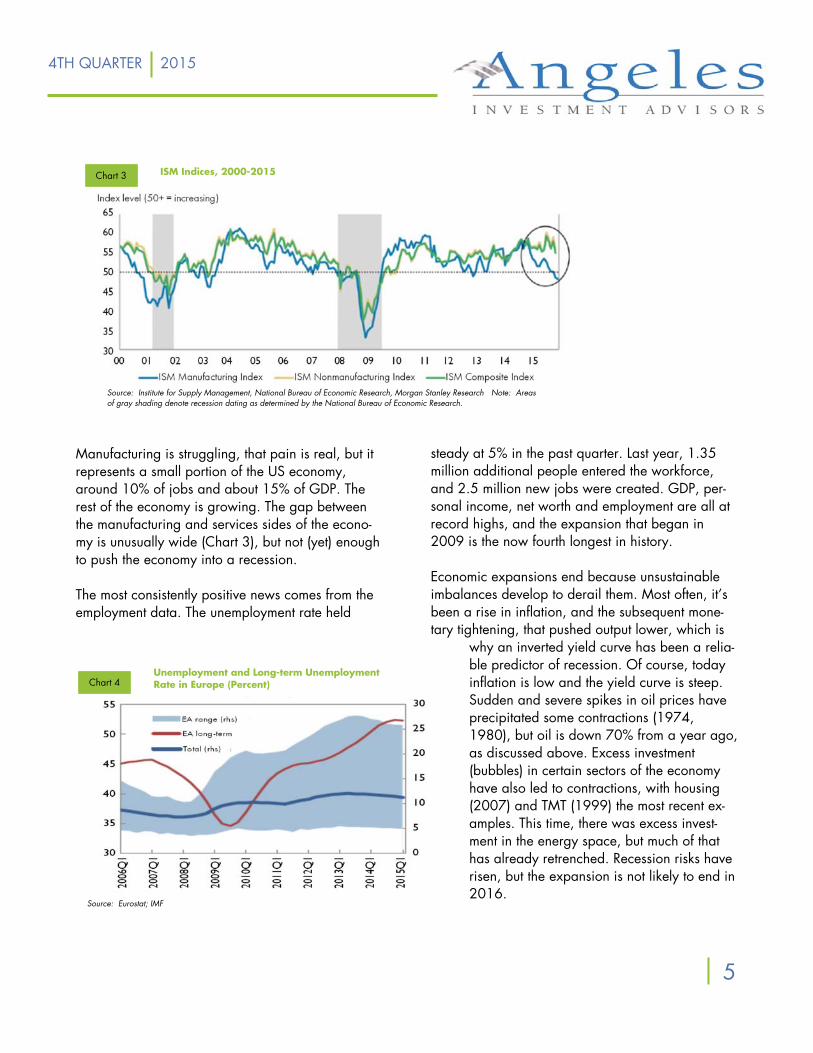
Manufacturing is struggling, that pain is real, but it represents a small portion of the US economy, around 10% of jobs and about 15% of GDP. The rest of the economy is growing. The gap between the manufacturing and services sides of the econo-my is unusually wide (Chart 3), but not (yet) enough to push the economy into a recession. The most consistently positive news comes from the employment data. The unemployment rate held
steady at 5% in the past quarter. Last year, 1.35 million additional people entered the workforce, and 2.5 million new jobs were created. GDP, per-sonal income, net worth and employment are all at record highs, and the expansion that began in 2009 is the now fourth longest in history. Economic expansions end because unsustainable imbalances develop to derail them. Most often, it’s been a rise in inflation, and the subsequent mone-tary tightening, that pushed output lower, which is
why an inverted yield curve has been a relia-ble predictor of recession. Of course, today inflation is low and the yield curve is steep. Sudden and severe spikes in oil prices have precipitated some contractions (1974, 1980), but oil is down 70% from a year ago, as discussed above. Excess investment (bubbles) in certain sectors of the economy have also led to contractions, with housing (2007) and TMT (1999) the most recent ex-amples. This time, there was excess invest-ment in the energy space, but much of that has already retrenched. Recession risks have risen, but the expansion is not likely to end in 2016.
Chart 3 ISM Indices, 2000-2015
Chart 4
Source: Institute for Supply Management, National Bureau of Economic Research, Morgan Stanley Research Note: Areas of gray shading denote recession dating as determined by the National Bureau of Economic Research.
Unemployment and Long-term Unemployment Rate in Europe (Percent)
Source: Eurostat; IMF
4TH QUARTER 2015
5
C hina now looms large among investor wor-ries. Partly, there is a question of confidence, and partly, China is encountering some invio-
lable laws of economics that could inhibit its ability to manage events. Confidence matters, and for two decades, China earned investors’ praise for growing into the world’s second largest economy while safely navigating through two major crises. China sailed through the Asian collapse of 1997-98, where countries such as Thailand and Indonesia saw rapid outflows of capi-tal and currency depreciation of 80-90%. China kept its currency peg to the US dollar, maintained a current account surplus, and built up foreign re-serves. In the 2008 global financial crisis, China was also able to protect its currency and maintain its growth. But a series of policy blunders over the past year has shaken investor confidence. Officials first encouraged ordinary citizens to buy into the stock market, which subsequently doubled
8 As of 1 February, skyBET quotes 9/4 odds of Britain leaving, 4/11 odds of staying. Step right up and place your bet.
C onditions are not as favorable in the rest of the world. In Europe, the unemployment rate is 10.4%, half of whom have been out of
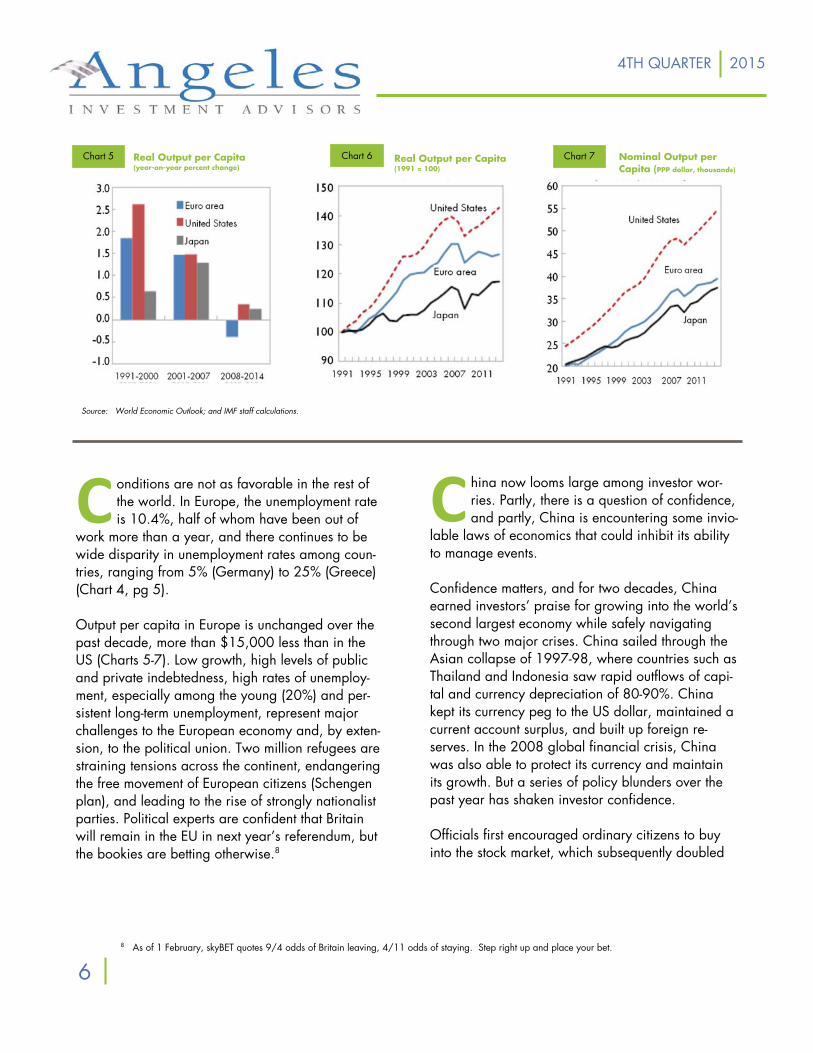
work more than a year, and there continues to be wide disparity in unemployment rates among coun-tries, ranging from 5% (Germany) to 25% (Greece) (Chart 4, pg 5). Output per capita in Europe is unchanged over the past decade, more than $15,000 less than in the US (Charts 5-7). Low growth, high levels of public and private indebtedness, high rates of unemploy-ment, especially among the young (20%) and per-sistent long-term unemployment, represent major challenges to the European economy and, by exten-sion, to the political union. Two million refugees are straining tensions across the continent, endangering the free movement of European citizens (Schengen plan), and leading to the rise of strongly nationalist parties. Political experts are confident that Britain will remain in the EU in next year’s referendum, but the bookies are betting otherwise.8
Real Output per Capita (year-on-year percent change)
Chart 5
Source: World Economic Outlook; and IMF staff calculations.
Chart 7 Nominal Output per Capita (PPP dollar, thousands)
Chart 6 Real Output per Capita (1991 = 100)
4TH QUARTER 2015
6
in price. Then, six months ago, seeing the bubble that had formed, tried to restrict investments, which sent the market tumbling. In August, they announced an unexpected devaluation, which rattled global markets. To squelch stock market volatility, circuit breakers were instituted at the beginning of this year, which turned out to be a disaster. On 7 Janu-ary, the stock market opened at 930am, fell 5% by 942am, which prompted a 15-minute halt. The mar-ket re-opened at 957am, promptly fell another 2%, which closed the market for the day at 959am. That same day, the yuan fell 1% in ten minutes, unprece-dented for a pegged currency. The circuit breakers acted to increase selling by investors wanting to get out before trading was halted. Having the precise opposite effect of controlling volatility, they were subsequently abandoned. These attempts to drive stock prices up, then down, then hold them steady would be comical if not for being indicative of a mindset that believes market forces should and can be managed according to the omniscience of an omnipotent bureaucracy. This disease afflicts most governments to varying de-grees, but it is endemic, by definition, to centrally-planned economies. There are, alas, limits to what officials can control. Economists speak of the impossible trinity: a country cannot simultaneously control the value of its currency, pursue an independent monetary policy and have a free flow of capital. One or two of these is possible, but not all three. It’s not a question of belief, it’s a law of mathematics. China seems to be a recalcitrant student, not (yet) will-ing to accept this logic. China skirted through the global finan-cial crisis of 2008 partly through a
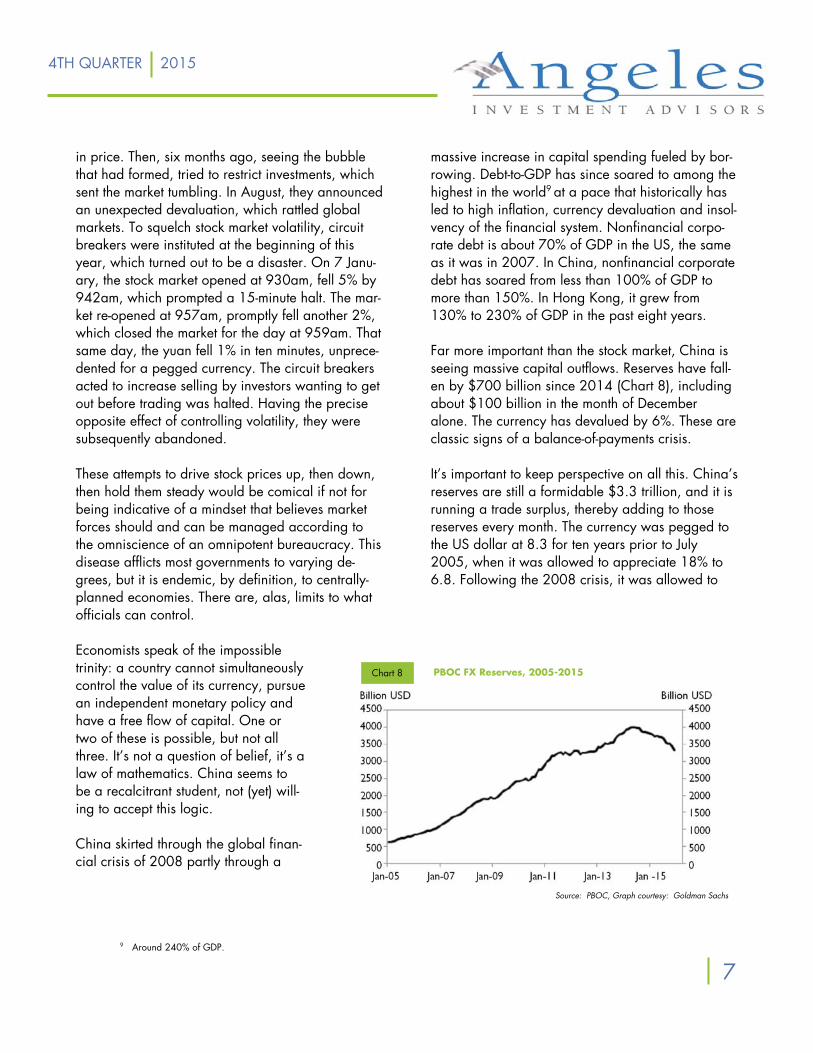
massive increase in capital spending fueled by bor-rowing. Debt-to-GDP has since soared to among the highest in the world9 at a pace that historically has led to high inflation, currency devaluation and insol-vency of the financial system. Nonfinancial corpo-rate debt is about 70% of GDP in the US, the same as it was in 2007. In China, nonfinancial corporate debt has soared from less than 100% of GDP to more than 150%. In Hong Kong, it grew from 130% to 230% of GDP in the past eight years. Far more important than the stock market, China is seeing massive capital outflows. Reserves have fall-en by $700 billion since 2014 (Chart 8), including about $100 billion in the month of December alone. The currency has devalued by 6%. These are classic signs of a balance-of-payments crisis. It’s important to keep perspective on all this. China’s reserves are still a formidable $3.3 trillion, and it is running a trade surplus, thereby adding to those reserves every month. The currency was pegged to the US dollar at 8.3 for ten years prior to July 2005, when it was allowed to appreciate 18% to 6.8. Following the 2008 crisis, it was allowed to
9 Around 240% of GDP.
PBOC FX Reserves, 2005-2015
Source: PBOC, Graph courtesy: Goldman Sachs
Chart 8
4TH QUARTER 2015
7
shift the economy in favor of the consum-er. A weaker yuan negatively impacts its closest trading partners, pressuring them to devalue as well. China could choose to protect the price of its currency, but in the face of strong capi-tal outflows, this will mean spending its reserves. As its economy slows, looser monetary policy works against maintain-ing the currency’s value, thus possibly inhibiting flexibility on interest rates. Cap-ital controls could be imposed, but this violates the policy of greater global inte-gration for the yuan, as promised to the IMF last year. The impossible trinity is a fact: no country can control its currency
and interest rates while also allowing the free flow of capital. Something has to give, and China has yet to acknowledge this fact. China is not (yet) in a crisis, and has many potent weapons it can deploy to defend its policies. But investor confidence has been shaken, partly be-cause of miscues, and partly because history is re-plete with attempts to defend a currency and man-
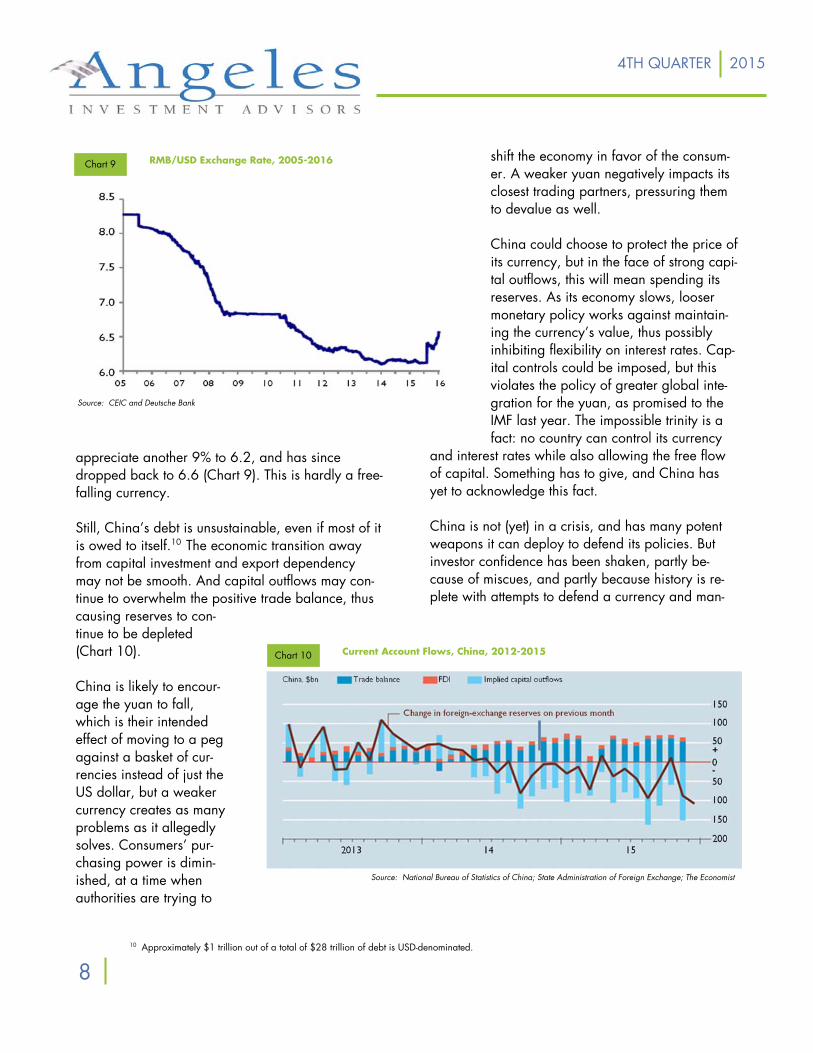
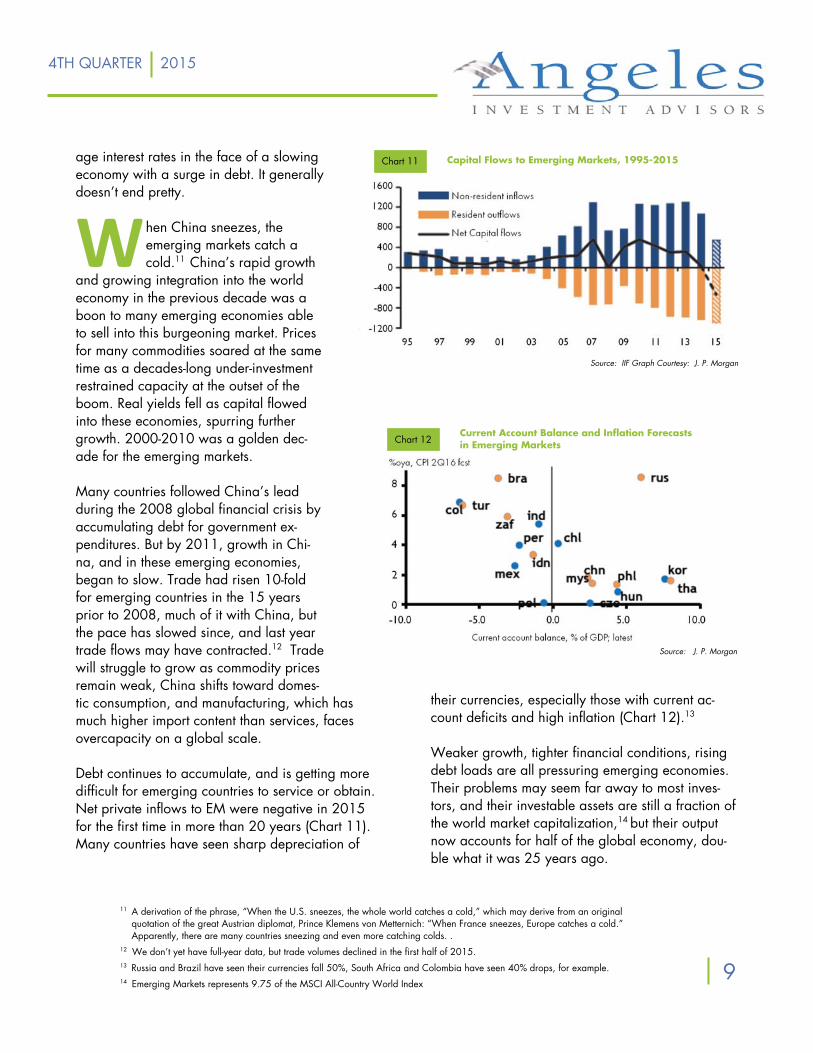
appreciate another 9% to 6.2, and has since dropped back to 6.6 (Chart 9). This is hardly a free-falling currency. Still, China’s debt is unsustainable, even if most of it is owed to itself.10 The economic transition away from capital investment and export dependency may not be smooth. And capital outflows may con-tinue to overwhelm the positive trade balance, thus causing reserves to con-tinue to be depleted (Chart 10). China is likely to encour-age the yuan to fall, which is their intended effect of moving to a peg against a basket of cur-rencies instead of just the US dollar, but a weaker currency creates as many problems as it allegedly solves. Consumers’ pur-chasing power is dimin-ished, at a time when authorities are trying to
Source: National Bureau of Statistics of China; State Administration of Foreign Exchange; The Economist
Source: CEIC and Deutsche Bank
RMB/USD Exchange Rate, 2005-2016 Chart 9
Chart 10 Current Account Flows, China, 2012-2015
5
10 Approximately $1 trillion out of a total of $28 trillion of debt is USD-denominated.
4TH QUARTER 2015
8
11 A derivation of the phrase, “When the U.S. sneezes, the whole world catches a cold,” which may derive from an original quotation of the great Austrian diplomat, Prince Klemens von Metternich: “When France sneezes, Europe catches a cold.” Apparently, there are many countries sneezing and even more catching colds. .
12 We don’t yet have full-year data, but trade volumes declined in the first half of 2015. 13 Russia and Brazil have seen their currencies fall 50%, South Africa and Colombia have seen 40% drops, for example. 14 Emerging Markets represents 9.75 of the MSCI All-Country World Index
age interest rates in the face of a slowing economy with a surge in debt. It generally doesn’t end pretty.
W hen China sneezes, the emerging markets catch a cold.11 China’s rapid growth
and growing integration into the world economy in the previous decade was a boon to many emerging economies able to sell into this burgeoning market. Prices for many commodities soared at the same time as a decades-long under-investment restrained capacity at the outset of the boom. Real yields fell as capital flowed into these economies, spurring further growth. 2000-2010 was a golden dec-ade for the emerging markets. Many countries followed China’s lead during the 2008 global financial crisis by accumulating debt for government ex-penditures. But by 2011, growth in Chi-na, and in these emerging economies, began to slow. Trade had risen 10-fold for emerging countries in the 15 years prior to 2008, much of it with China, but the pace has slowed since, and last year trade flows may have contracted.12 Trade will struggle to grow as commodity prices remain weak, China shifts toward domes-tic consumption, and manufacturing, which has much higher import content than services, faces overcapacity on a global scale. Debt continues to accumulate, and is getting more difficult for emerging countries to service or obtain. Net private inflows to EM were negative in 2015 for the first time in more than 20 years (Chart 11). Many countries have seen sharp depreciation of
their currencies, especially those with current ac-count deficits and high inflation (Chart 12).13 Weaker growth, tighter financial conditions, rising debt loads are all pressuring emerging economies. Their problems may seem far away to most inves-tors, and their investable assets are still a fraction of the world market capitalization,14 but their output now accounts for half of the global economy, dou-ble what it was 25 years ago.
Chart 11
Capital Flows to Emerging Markets, 1995-2015
Chart 12 Current Account Balance and Inflation Forecasts in Emerging Markets
Source: J. P. Morgan
Source: IIF Graph Courtesy: J. P. Morgan
4TH QUARTER 2015
9
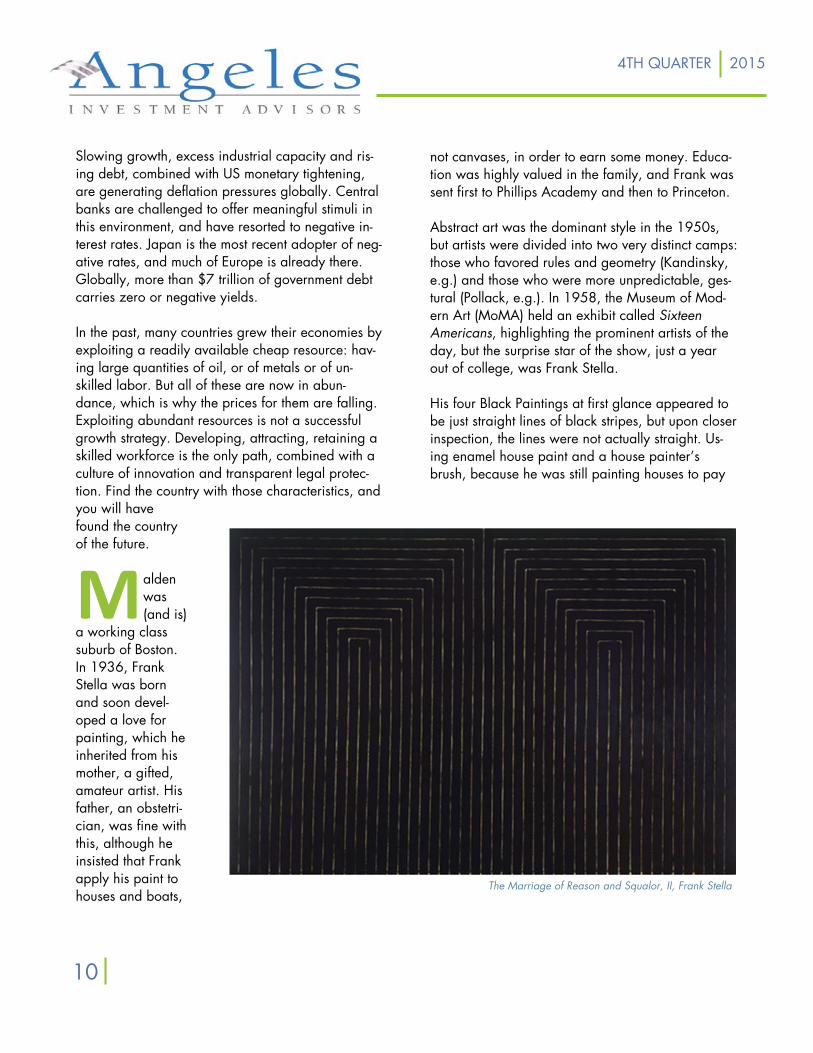
not canvases, in order to earn some money. Educa-tion was highly valued in the family, and Frank was sent first to Phillips Academy and then to Princeton. Abstract art was the dominant style in the 1950s, but artists were divided into two very distinct camps: those who favored rules and geometry (Kandinsky, e.g.) and those who were more unpredictable, ges-tural (Pollack, e.g.). In 1958, the Museum of Mod-ern Art (MoMA) held an exhibit called Sixteen Americans, highlighting the prominent artists of the day, but the surprise star of the show, just a year out of college, was Frank Stella. His four Black Paintings at first glance appeared to be just straight lines of black stripes, but upon closer inspection, the lines were not actually straight. Us-ing enamel house paint and a house painter’s brush, because he was still painting houses to pay
Slowing growth, excess industrial capacity and ris-ing debt, combined with US monetary tightening, are generating deflation pressures globally. Central banks are challenged to offer meaningful stimuli in this environment, and have resorted to negative in-terest rates. Japan is the most recent adopter of neg-ative rates, and much of Europe is already there. Globally, more than $7 trillion of government debt carries zero or negative yields. In the past, many countries grew their economies by exploiting a readily available cheap resource: hav-ing large quantities of oil, or of metals or of un-skilled labor. But all of these are now in abun-dance, which is why the prices for them are falling. Exploiting abundant resources is not a successful growth strategy. Developing, attracting, retaining a skilled workforce is the only path, combined with a culture of innovation and transparent legal protec-tion. Find the country with those characteristics, and you will have found the country of the future.
M alden was (and is)
a working class suburb of Boston. In 1936, Frank Stella was born and soon devel-oped a love for painting, which he inherited from his mother, a gifted, amateur artist. His father, an obstetri-cian, was fine with this, although he insisted that Frank apply his paint to houses and boats,
The Marriage of Reason and Squalor, II, Frank Stella
4TH QUARTER 2015
10
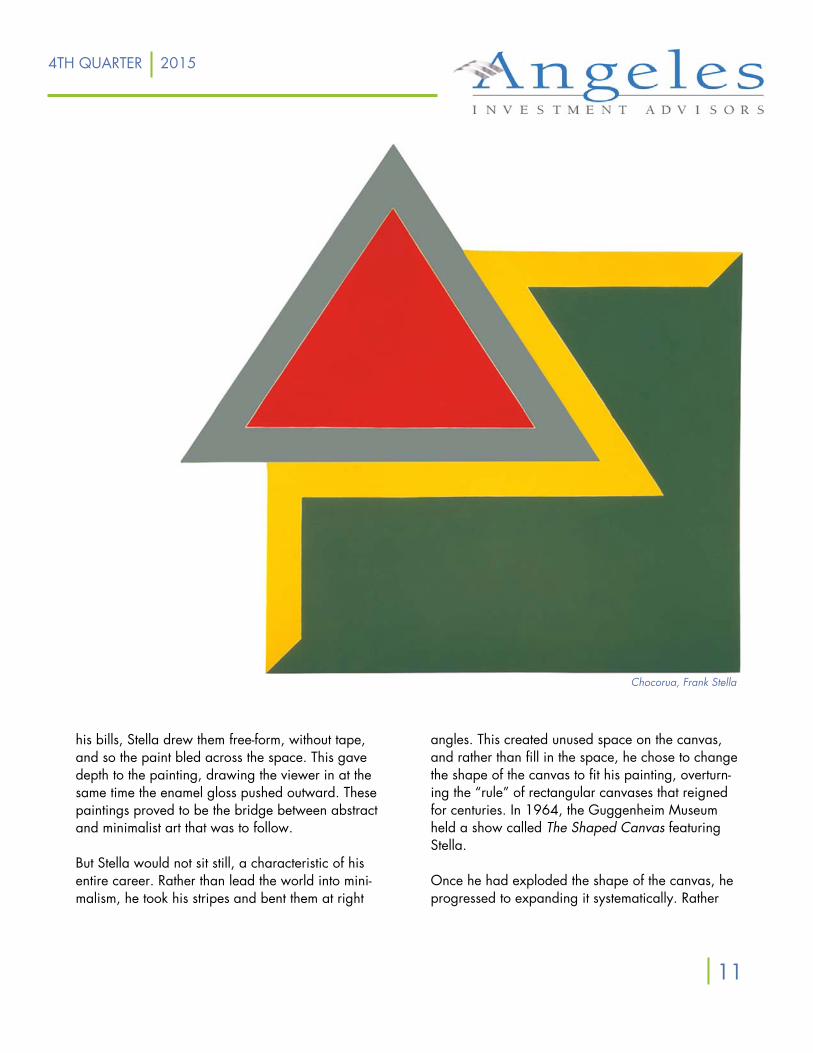
his bills, Stella drew them free-form, without tape, and so the paint bled across the space. This gave depth to the painting, drawing the viewer in at the same time the enamel gloss pushed outward. These paintings proved to be the bridge between abstract and minimalist art that was to follow. But Stella would not sit still, a characteristic of his entire career. Rather than lead the world into mini-malism, he took his stripes and bent them at right
Chocorua, Frank Stella
angles. This created unused space on the canvas, and rather than fill in the space, he chose to change the shape of the canvas to fit his painting, overturn-ing the “rule” of rectangular canvases that reigned for centuries. In 1964, the Guggenheim Museum held a show called The Shaped Canvas featuring Stella. Once he had exploded the shape of the canvas, he progressed to expanding it systematically. Rather
4TH QUARTER 2015
11
4TH QUARTER 2015
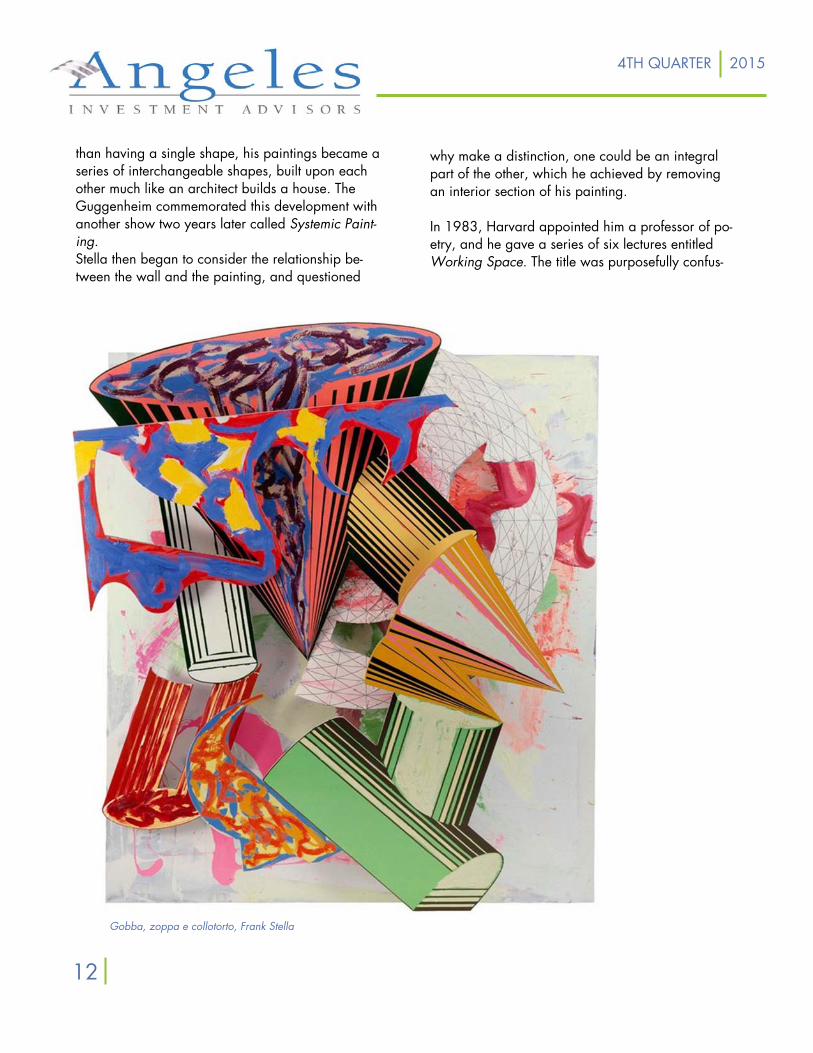
Gobba, zoppa e collotorto, Frank Stella
why make a distinction, one could be an integral part of the other, which he achieved by removing an interior section of his painting. In 1983, Harvard appointed him a professor of po-etry, and he gave a series of six lectures entitled Working Space. The title was purposefully confus-
than having a single shape, his paintings became a series of interchangeable shapes, built upon each other much like an architect builds a house. The Guggenheim commemorated this development with another show two years later called Systemic Paint-ing. Stella then began to consider the relationship be-tween the wall and the painting, and questioned
12
15 And he is still going strong.
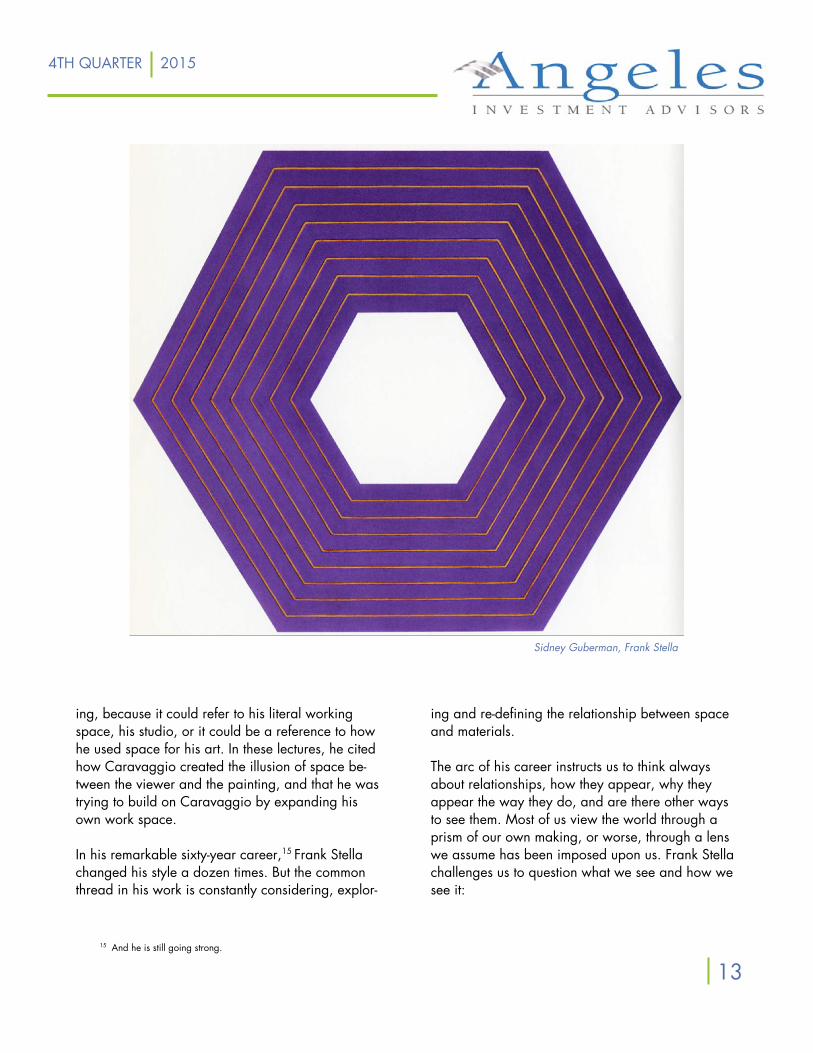
Sidney Guberman, Frank Stella
4TH QUARTER 2015
ing, because it could refer to his literal working space, his studio, or it could be a reference to how he used space for his art. In these lectures, he cited how Caravaggio created the illusion of space be-tween the viewer and the painting, and that he was trying to build on Caravaggio by expanding his own work space. In his remarkable sixty-year career,15 Frank Stella changed his style a dozen times. But the common thread in his work is constantly considering, explor-
ing and re-defining the relationship between space and materials. The arc of his career instructs us to think always about relationships, how they appear, why they appear the way they do, and are there other ways to see them. Most of us view the world through a prism of our own making, or worse, through a lens we assume has been imposed upon us. Frank Stella challenges us to question what we see and how we see it:
13

The Michael Kohlhaas Curtain, Frank Stella
The essence of freedom…is something that is able to over-come its boundaries. The question is not only to be able to
define things, but to have the boundaries be felt in the proper way they are defining, but not limiting.
Das Erdbeben in Chili, Frank Stella
4TH QUARTER 2015
14
Founded in 2001, Angeles Investment Advisors LLC provides investment advice to select ins tu ons and high net worth families and individuals.
Michael A. Rosen Principal & Chief Investment Officer FEBRUARY 2016
This report is not an offer to sell or solicitation to buy any security. This is intended for the gen-eral information of the clients of Angeles Investment Advisors. It does not consider the invest-ment objectives, financial situation or needs of individual investors. Before acting on any advice or recommendation in this material, a client must consider its suitability and seek professional advice, if necessary. The material contained herein is based on information we believe to be reliable, but we do not represent that it is accurate, and it should not be relied on as such. Opinions expressed are our current opinions as of the date written only, and may change with-out notification. We, along with any affiliates, officers, directors or employees, may, from time to time, have positions, long or short, in, and buy and sell, any securities or derivatives men-tioned herein. No part of this material may be copied or duplicated in any form by any means and may not be redistributed without the consent of Angeles Investment Advisors, LLC.
Please follow the Angeles Blog by Michael Rosen at blog.angelesadvisors.com CONNECT WITH US
If you would like to receive a copy of our Form ADV Part 2A free of charge, please email Steve Smetana at [email protected], or call 310.393.6300.
LinkedIn Twitter Facebook Google+