Embed Size (px)
Citation preview
HARP: HPV Assessment of Risk Profile
Susan Sotardi
Mentor: Dr. Mark H. Einstein, MD, MSDepartment of Obstetrics & Gynecology and Women’s Health
Division of Gynecologic OncologyAlbert Einstein College of Medicine and
Montefiore Medical Center
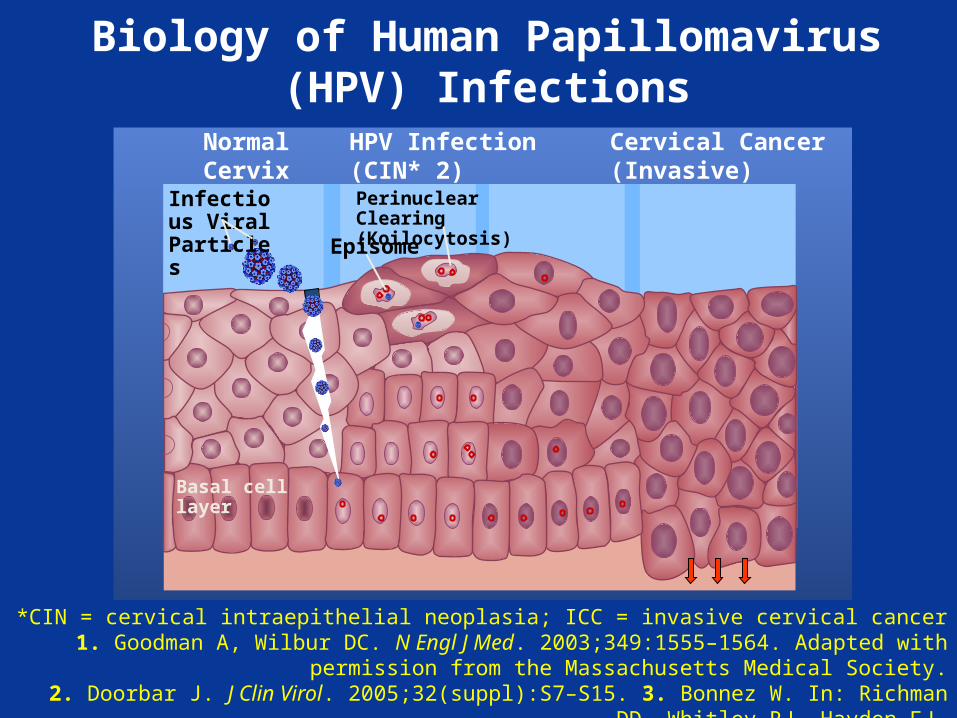
*CIN = cervical intraepithelial neoplasia; ICC = invasive cervical cancer 1. Goodman A, Wilbur DC. N Engl J Med. 2003;349:1555–1564. Adapted with permission from the Massachusetts Medical Society.
2. Doorbar J. J Clin Virol. 2005;32(suppl):S7–S15. 3. Bonnez W. In: Richman DD, Whitley RJ, Hayden FJ,eds. Washington, DC: American Society for Microbiology Press; 2002:557–596.
Biology of Human Papillomavirus (HPV) Infections
Normal Cervix
HPV Infection (CIN* 2) (CIN* 3)
Cervical Cancer (Invasive)
Infectious Viral Particles Episome
Perinuclear Clearing (Koilocytosis)
Basal cell layer
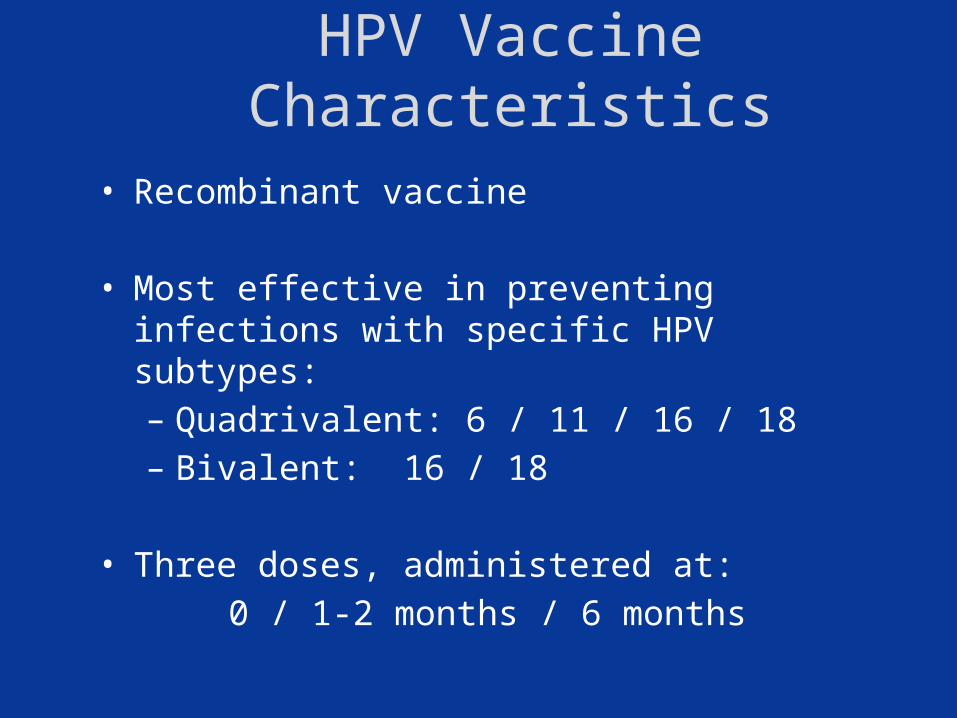
HPV Vaccine Characteristics
• Recombinant vaccine
• Most effective in preventing infections with specific HPV subtypes:– Quadrivalent: 6 / 11 / 16 / 18– Bivalent: 16 / 18
• Three doses, administered at: 0 / 1-2 months / 6 months
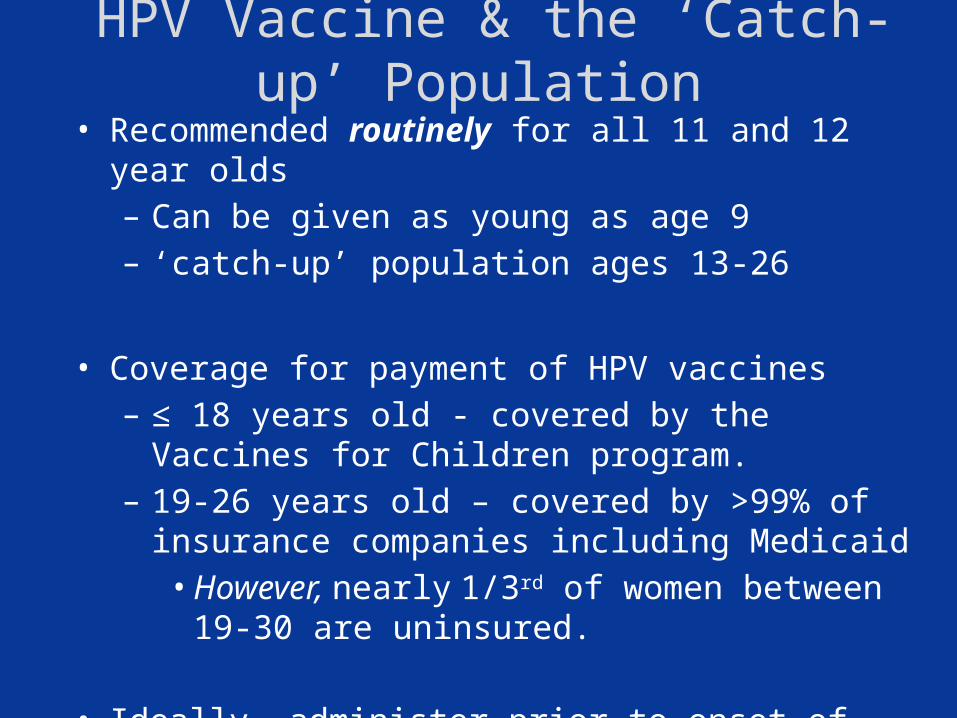
HPV Vaccine & the ‘Catch-up’ Population• Recommended routinely for all 11 and 12 year olds
– Can be given as young as age 9– ‘catch-up’ population ages 13-26
• Coverage for payment of HPV vaccines– ≤ 18 years old - covered by the Vaccines for Children
program. – 19-26 years old – covered by >99% of insurance
companies including Medicaid• However, nearly 1/3rd of women between 19-30 are
uninsured.
• Ideally, administer prior to onset of sexual activity
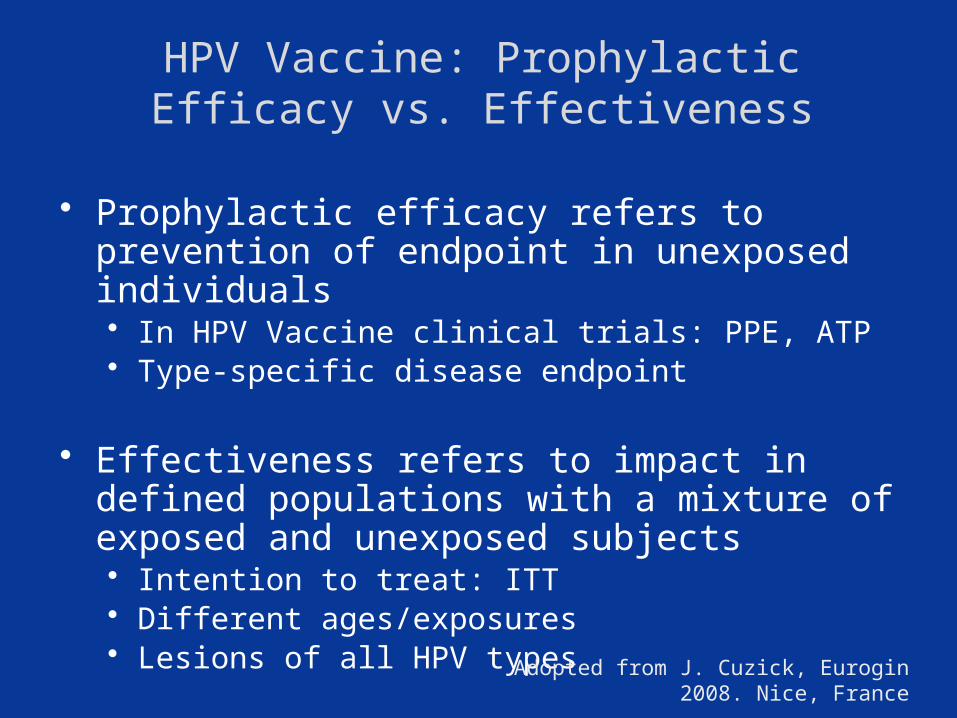
HPV Vaccine: Prophylactic Efficacy vs. Effectiveness
• Prophylactic efficacy refers to prevention of endpoint in unexposed individuals• In HPV Vaccine clinical trials: PPE, ATP• Type-specific disease endpoint
• Effectiveness refers to impact in defined populations with a mixture of exposed and unexposed subjects• Intention to treat: ITT• Different ages/exposures• Lesions of all HPV types
Adopted from J. Cuzick, Eurogin 2008. Nice, France
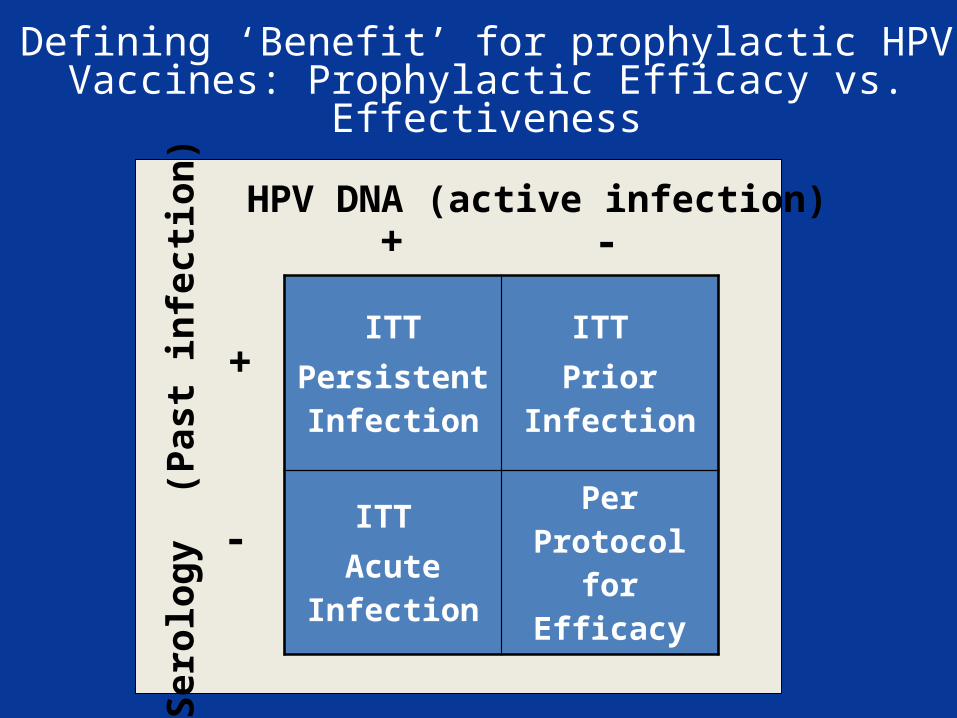
Defining ‘Benefit’ for prophylactic HPV Vaccines: Prophylactic Efficacy vs. Effectiveness
ITTPersistent Infection
ITT Prior
Infection
ITT Acute
Infection
Per Protocol
for Efficacy
+
+
-
-Se
rolo
gy (
Past
infe
ction
)HPV DNA (active infection)
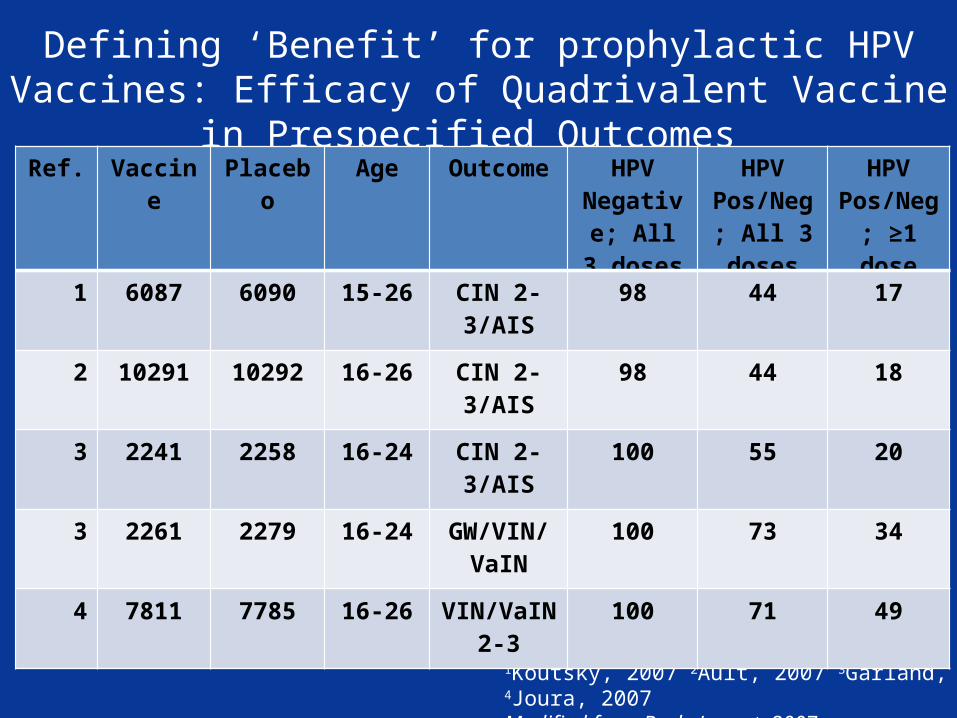
Defining ‘Benefit’ for prophylactic HPV Vaccines: Efficacy of Quadrivalent Vaccine in Prespecified Outcomes
1Koutsky, 2007 2Ault, 2007 3Garland, 2007 4Joura, 2007Modified from Burk, Lancet, 2007
Ref. Vaccine Placebo Age Outcome HPV Negative;
All 3 doses
HPV Pos/Neg;
All 3 doses
HPV Pos/Neg; ≥1 dose
1 6087 6090 15-26 CIN 2-3/AIS 98 44 17
2 10291 10292 16-26 CIN 2-3/AIS 98 44 18
3 2241 2258 16-24 CIN 2-3/AIS 100 55 20
3 2261 2279 16-24 GW/VIN/VaIN
100 73 34
4 7811 7785 16-26 VIN/VaIN 2-3
100 71 49
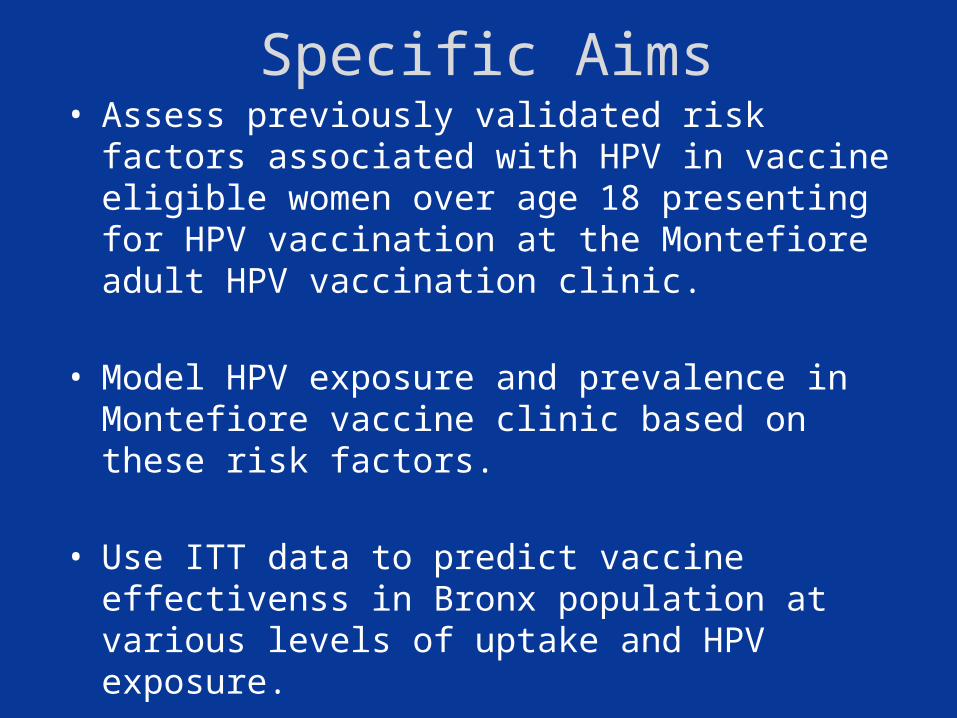
Specific Aims• Assess previously validated risk factors associated with
HPV in vaccine eligible women over age 18 presenting for HPV vaccination at the Montefiore adult HPV vaccination clinic.
• Model HPV exposure and prevalence in Montefiore vaccine clinic based on these risk factors.
• Use ITT data to predict vaccine effectivenss in Bronx population at various levels of uptake and HPV exposure.
• End Goal: Create a model that predicts benefit derived from vaccination for individual patient inputs.
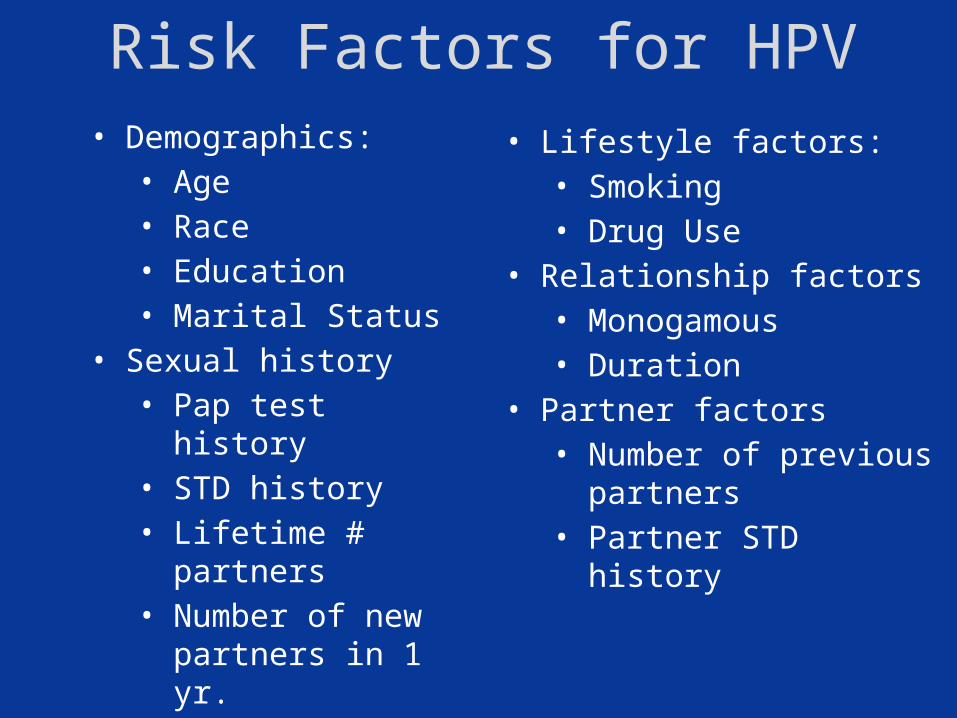
Risk Factors for HPV• Demographics:
• Age• Race• Education• Marital Status
• Sexual history• Pap test history• STD history• Lifetime # partners• Number of new
partners in 1 yr.• Pregnancy • Contraception
• Lifestyle factors:• Smoking• Drug Use
• Relationship factors• Monogamous• Duration
• Partner factors• Number of previous
partners• Partner STD history
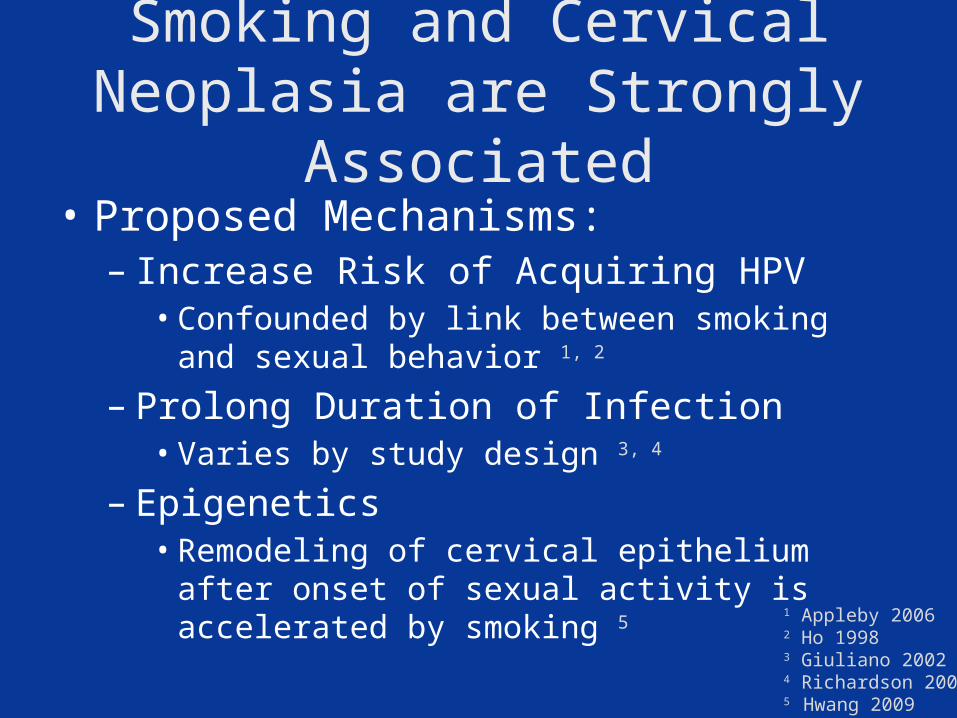
Smoking and Cervical Neoplasia are Strongly Associated
• Proposed Mechanisms:– Increase Risk of Acquiring HPV
• Confounded by link between smoking and sexual behavior 1, 2
– Prolong Duration of Infection• Varies by study design 3, 4
– Epigenetics• Remodeling of cervical epithelium after onset of sexual
activity is accelerated by smoking 51 Appleby 20062 Ho 19983 Giuliano 20024 Richardson 20055 Hwang 2009
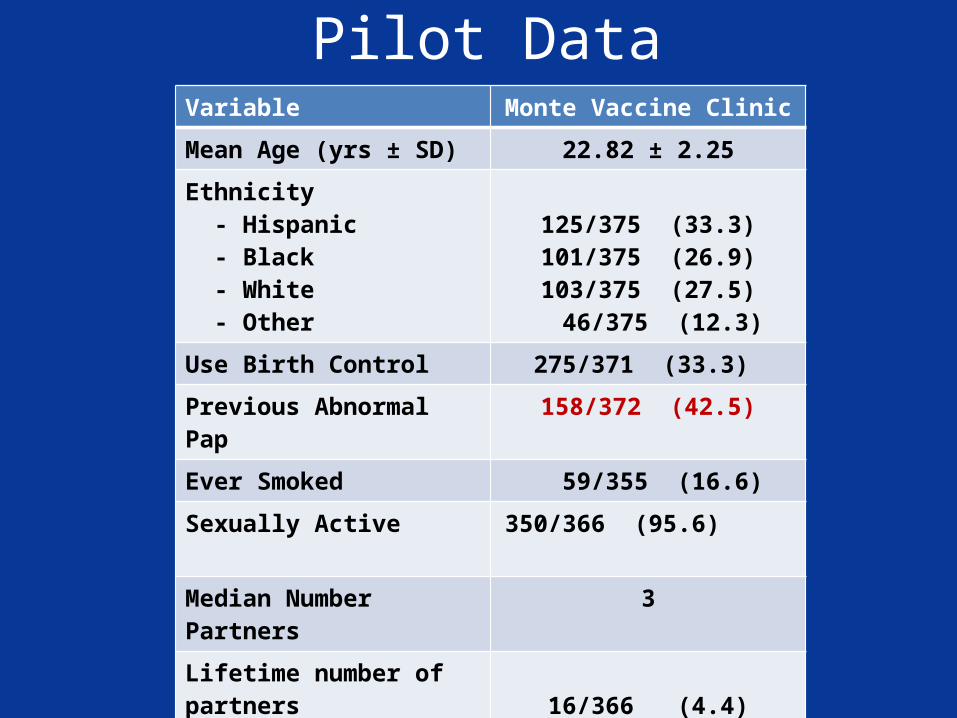
Pilot DataVariable Monte Vaccine Clinic
Mean Age (yrs ± SD) 22.82 ± 2.25
Ethnicity - Hispanic - Black - White - Other
125/375 (33.3)101/375 (26.9)103/375 (27.5) 46/375 (12.3)
Use Birth Control 275/371 (33.3)
Previous Abnormal Pap 158/372 (42.5)
Ever Smoked 59/355 (16.6)
Sexually Active 350/366 (95.6)
Median Number Partners 3
Lifetime number of partners - None - 1-2 - 3-4 - >5
16/366 (4.4)62/366 (16.9)
174/366 (47.5)114/366 (31.2)
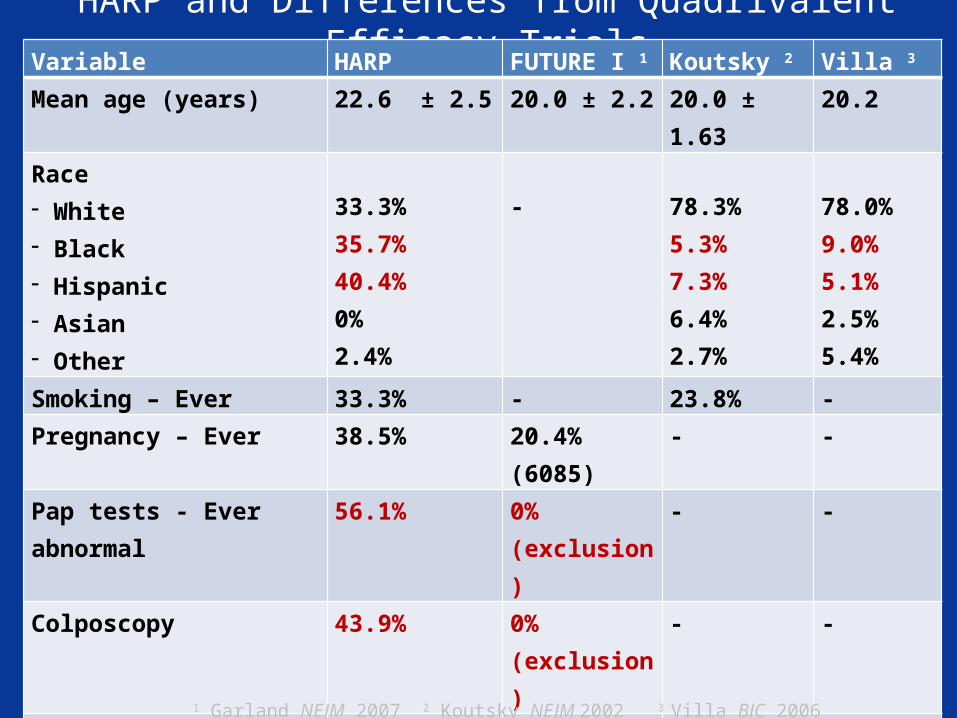
HARP and Differences from Quadrivalent Efficacy TrialsVariable HARP FUTURE I 1 Koutsky 2 Villa 3
Mean age (years) 22.6 ± 2.5 20.0 ± 2.2 20.0 ± 1.63 20.2 Race- White- Black- Hispanic- Asian- Other
33.3%35.7%40.4%0%2.4%
- 78.3%5.3%7.3%6.4%2.7%
78.0%9.0%5.1%2.5%5.4%
Smoking – Ever 33.3% - 23.8% -Pregnancy – Ever 38.5% 20.4% (6085) - -Pap tests - Ever abnormal 56.1% 0% (exclusion) - -Colposcopy 43.9% 0% (exclusion) - -Surgical treatment 7.1% 0% (exclusion) - -Mean age at first intercourse 16.6 ± 3.0 16.6 ± 1.9 - -Lifetime number of sexual partners
5.5 (Median)7.6 ±8.8 (Mean)
2 (Median)2.1 (Mean)
0: 4.9%1: 28.4%2: 22.5%3: 18.0%4: 13.7%5: 12.5%
-
1 Garland NEJM 2007 2 Koutsky NEJM 2002 3 Villa BJC 2006
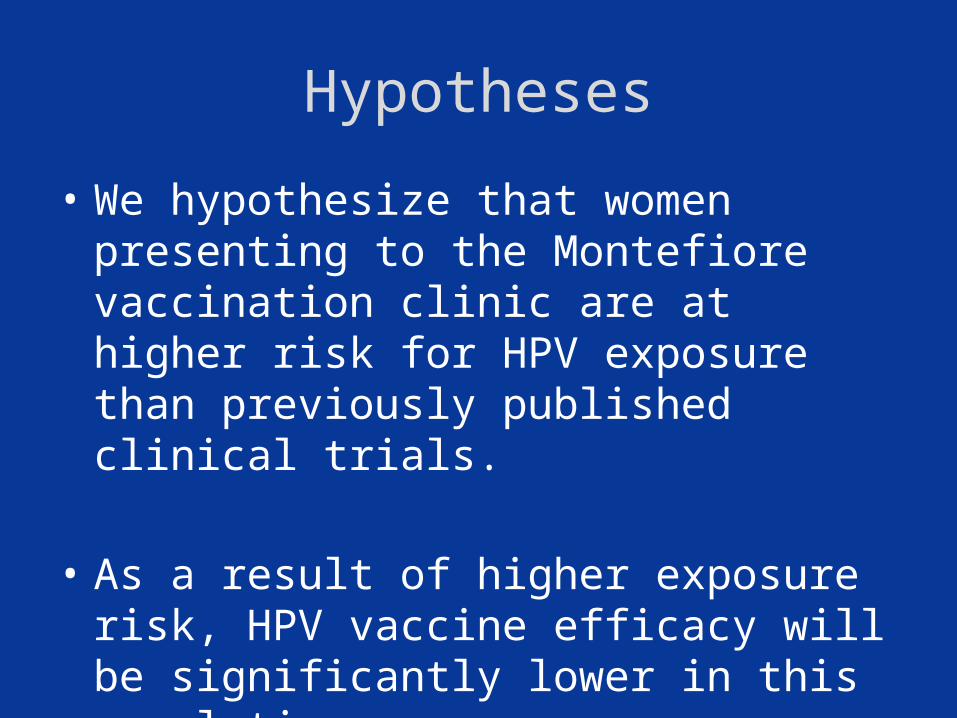
Hypotheses
• We hypothesize that women presenting to the Montefiore vaccination clinic are at higher risk for HPV exposure than previously published clinical trials.
• As a result of higher exposure risk, HPV vaccine efficacy will be significantly lower in this population.
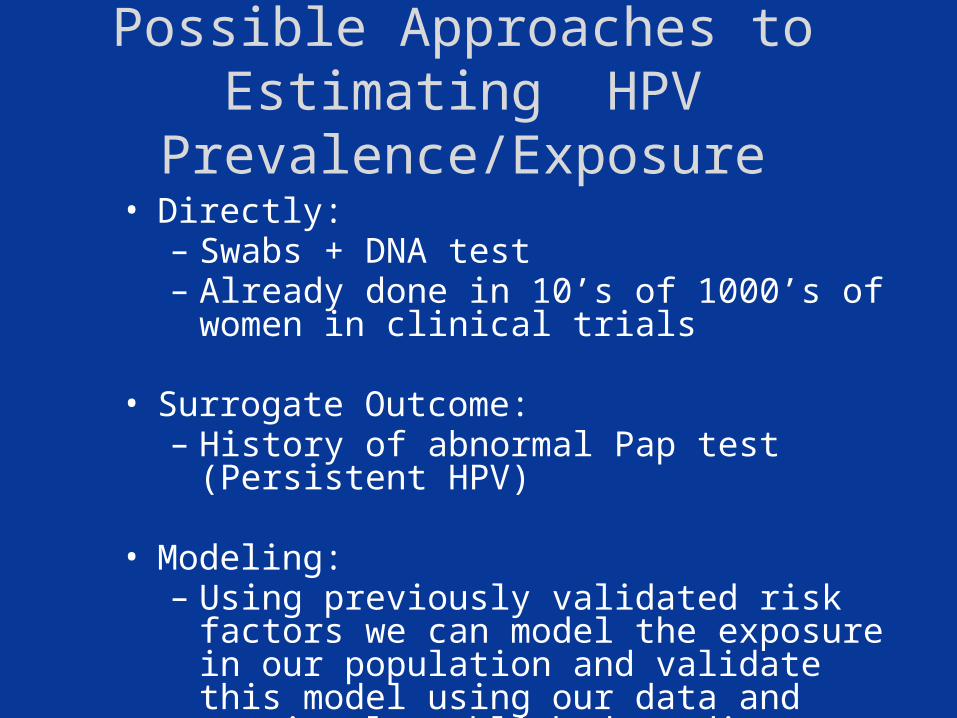
Possible Approaches to Estimating HPV Prevalence/Exposure
• Directly: – Swabs + DNA test– Already done in 10’s of 1000’s of women in
clinical trials
• Surrogate Outcome: – History of abnormal Pap test (Persistent HPV)
• Modeling: – Using previously validated risk factors we can
model the exposure in our population and validate this model using our data and previously published studies.
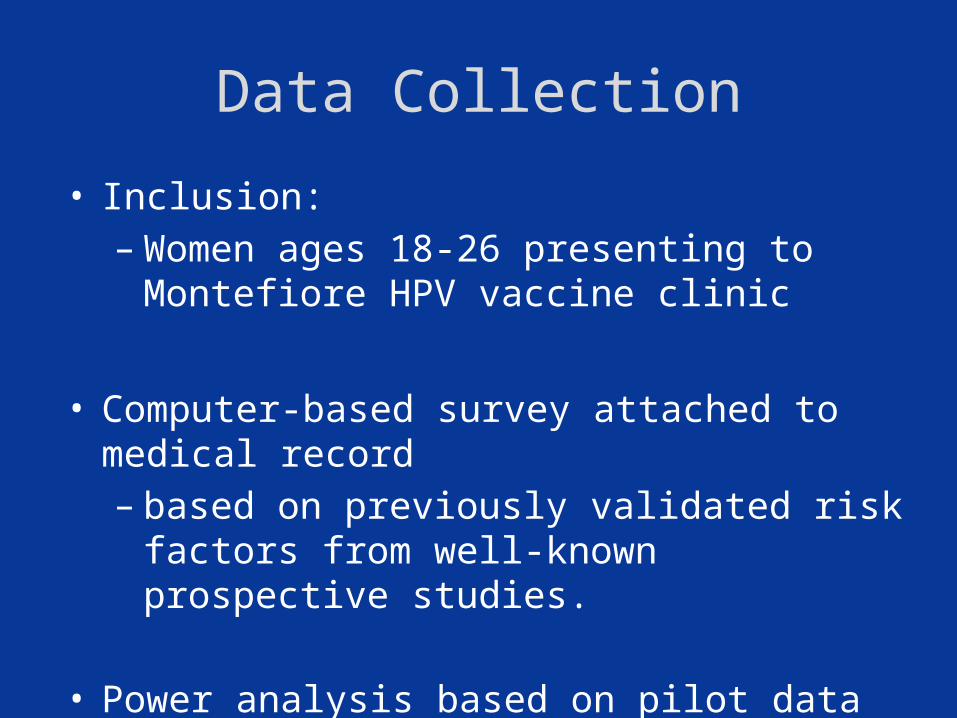
Data Collection
• Inclusion:– Women ages 18-26 presenting to Montefiore HPV
vaccine clinic
• Computer-based survey attached to medical record– based on previously validated risk factors from
well-known prospective studies.
• Power analysis based on pilot data– Plan to recruit until 150 surveys completed.
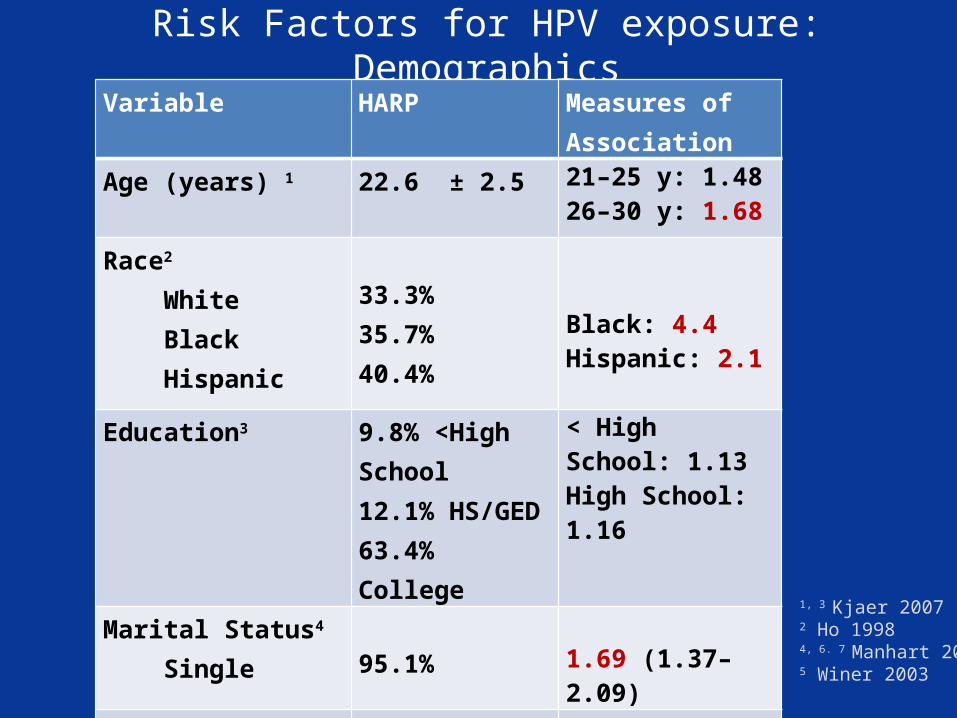
Risk Factors for HPV exposure: DemographicsVariable HARP Measures of
Association
Age (years) 1 22.6 ± 2.5 21–25 y: 1.4826–30 y: 1.68
Race2
White Black Hispanic
33.3%35.7%40.4%
Black: 4.4Hispanic: 2.1
Education3 9.8% <High School12.1% HS/GED63.4% College
< High School: 1.13High School: 1.16
Marital Status4
Single 95.1% 1.69 (1.37–2.09)
Smoking – Now5 50% 1.5 (1.0-2.3)
Smoking – More than 100 cigarettes 6
33.3% 1.17 (1.00–1.37)
Drug Use - Ever7 58.5% 1.24 (1.03–1.50)1, 3 Kjaer 20072 Ho 19984, 6. 7 Manhart 20065 Winer 2003
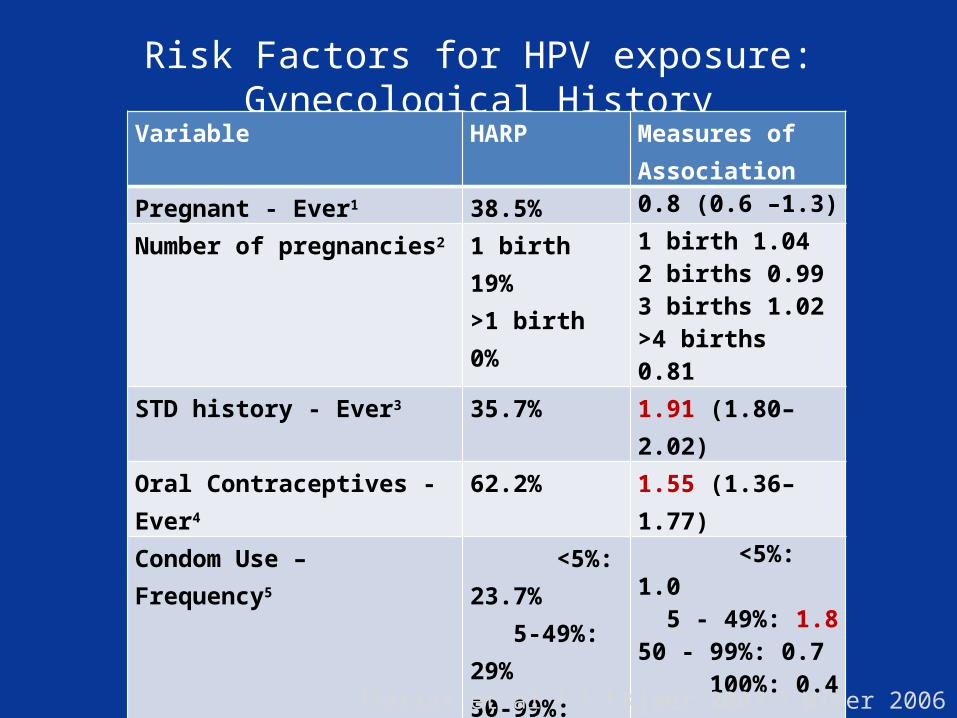
Risk Factors for HPV exposure: Gynecological HistoryVariable HARP Measures of
AssociationPregnant - Ever1 38.5% 0.8 (0.6 –1.3)
Number of pregnancies2 1 birth 19%>1 birth 0%
1 birth 1.04 2 births 0.993 births 1.02 >4 births 0.81
STD history - Ever3 35.7% 1.91 (1.80–2.02)
Oral Contraceptives - Ever4 62.2% 1.55 (1.36–1.77)
Condom Use – Frequency5 <5%: 23.7% 5-49%: 29% 50-99%: 28.9% 100%: 15.8%
<5%: 1.0 5 - 49%: 1.850 - 99%: 0.7 100%: 0.4
Condom Use – Ever sex without condom (in past year) 6
74.4% 1.44 (1.27–1.63)
1Sarias et al 2, 3, 4 Kjaer 2007 5 Winer 2006 6Kjaer 2007
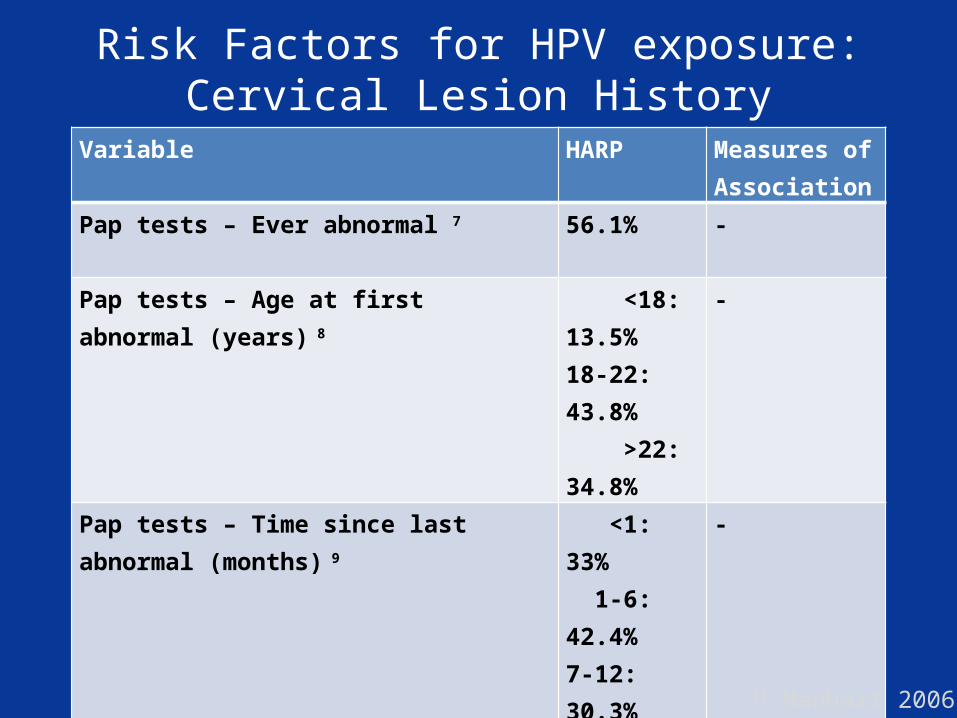
Risk Factors for HPV exposure:Cervical Lesion History
Variable HARP Measures of Association
Pap tests – Ever abnormal 7 56.1% -
Pap tests – Age at first abnormal (years) 8 <18: 13.5%18-22: 43.8% >22: 34.8%
-
Pap tests – Time since last abnormal (months) 9 <1: 33% 1-6: 42.4%7-12: 30.3% >12: 9.1%
-
Colposcopy – Ever10 43.9% -
Surgical treatment of cervical lesion – Ever11 7.1% 2.05 (1.56-2.68)
11 Manhart 2006
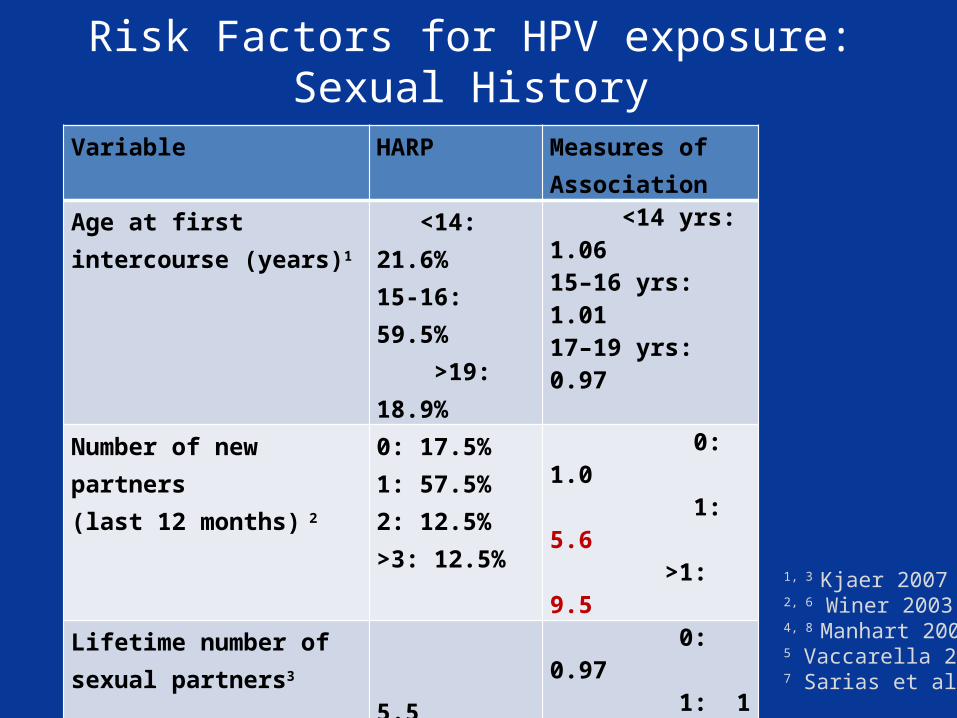
Risk Factors for HPV exposure: Sexual History
Variable HARP Measures of Association
Age at first intercourse (years)1
<14: 21.6%15-16: 59.5% >19: 18.9%
<14 yrs: 1.0615–16 yrs: 1.01 17–19 yrs: 0.97
Number of new partners (last 12 months) 2
0: 17.5%1: 57.5%2: 12.5%>3: 12.5%
0: 1.0 1: 5.6 >1: 9.5
Lifetime number of sexual partners3
5.5 (Median)7.6 ±8.8 (Mean)
0: 0.97 1: 1 2–4: 2.60 5–9: 4.9810–14: 6.96 >15: 9.45
Time partner was known prior to sexual involvement (mo) 4
31.5% <1 mo: 1.351, 3 Kjaer 20072, 6 Winer 20034, 8 Manhart 20065 Vaccarella 20067 Sarias et al.
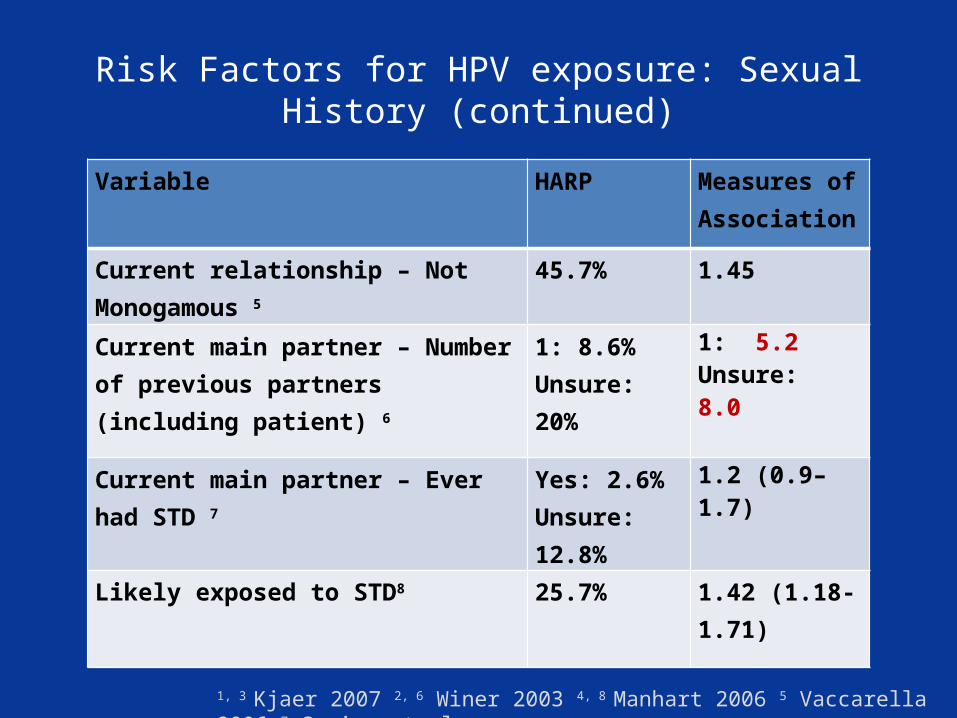
Variable HARP Measures of Association
Current relationship – Not Monogamous 5 45.7% 1.45
Current main partner – Number of previous partners (including patient) 6
1: 8.6%Unsure: 20%
1: 5.2Unsure: 8.0
Current main partner – Ever had STD 7 Yes: 2.6%Unsure: 12.8%
1.2 (0.9–1.7)
Likely exposed to STD8 25.7% 1.42 (1.18- 1.71)
Risk Factors for HPV exposure: Sexual History (continued)
1, 3 Kjaer 2007 2, 6 Winer 2003 4, 8 Manhart 2006 5 Vaccarella 2006 7 Sarias et al.
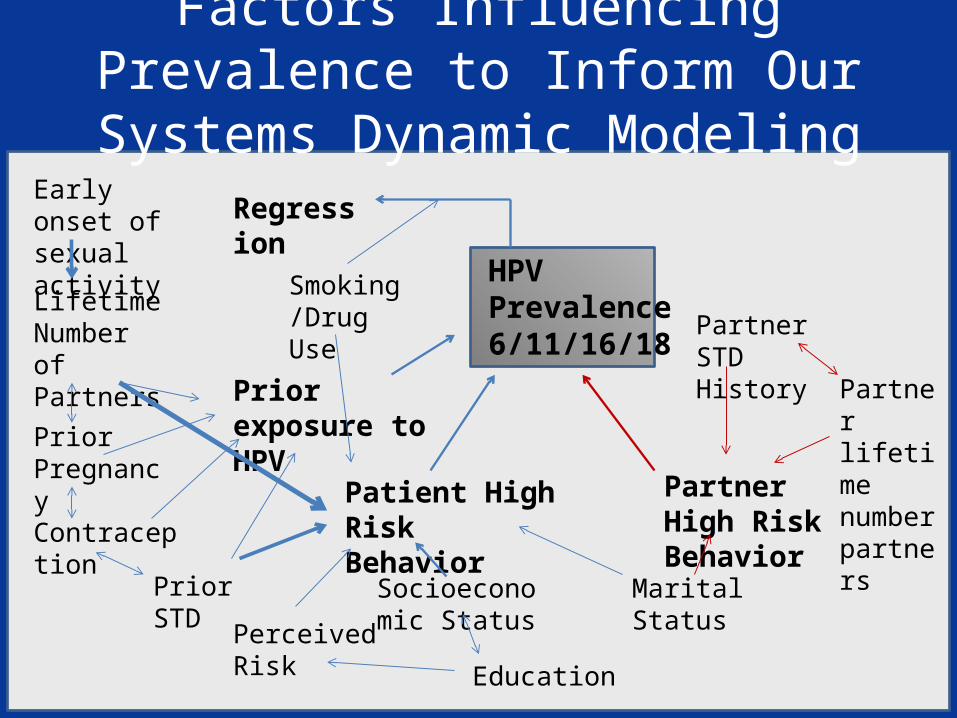
Systems Dynamic Modeling of HPV Risk Factors and Prevalence
System Dynamics Models (SDM) simulate incidence and prevalence of disease within a population.
System Dynamics is a mathematical modeling methodology that can be used to represent associations between known risk factors and HPV exposure, over time.
Key issue: What data do you have to inform the model?Published clinical trials, Registries, Key informants (experts), results of studies (such as our clinic survey)
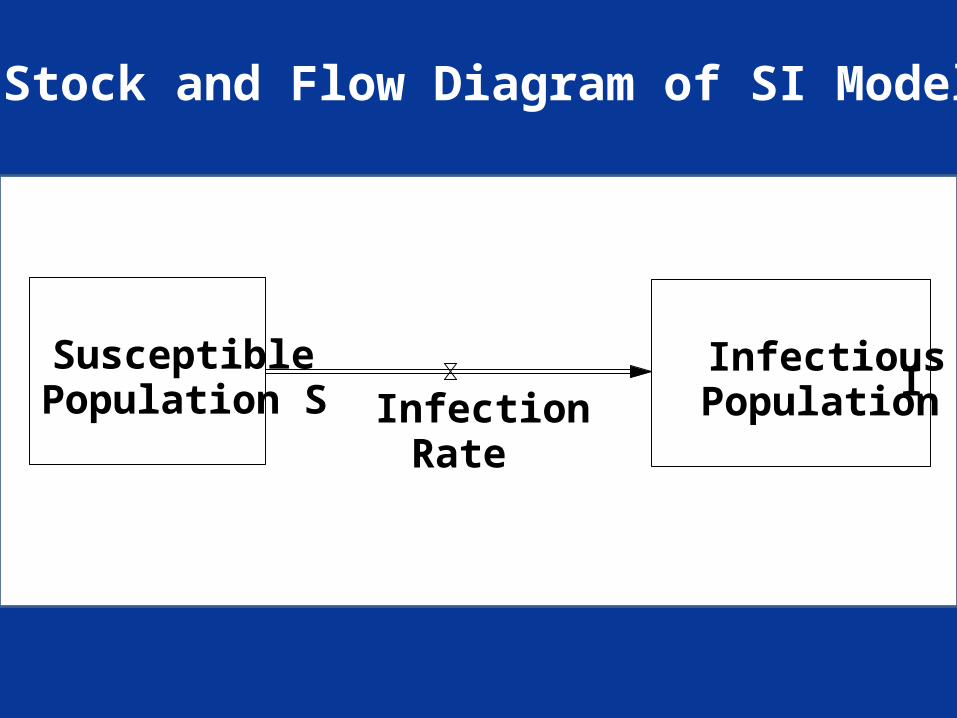
SusceptiblePopulation S
InfectiousPopulationInfection
Rate
Stock and Flow Diagram of SI Model
I
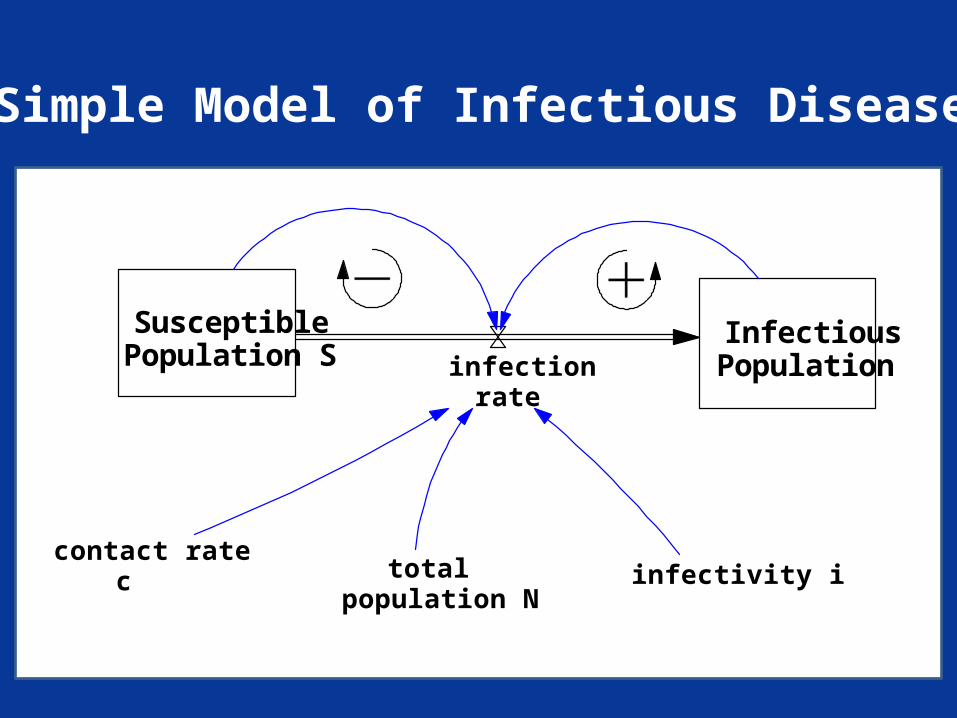
Simple Model of Infectious Disease
SusceptiblePopulation S
InfectiousPopulationinfection
rate
contact ratec total
population Ninfectivity i
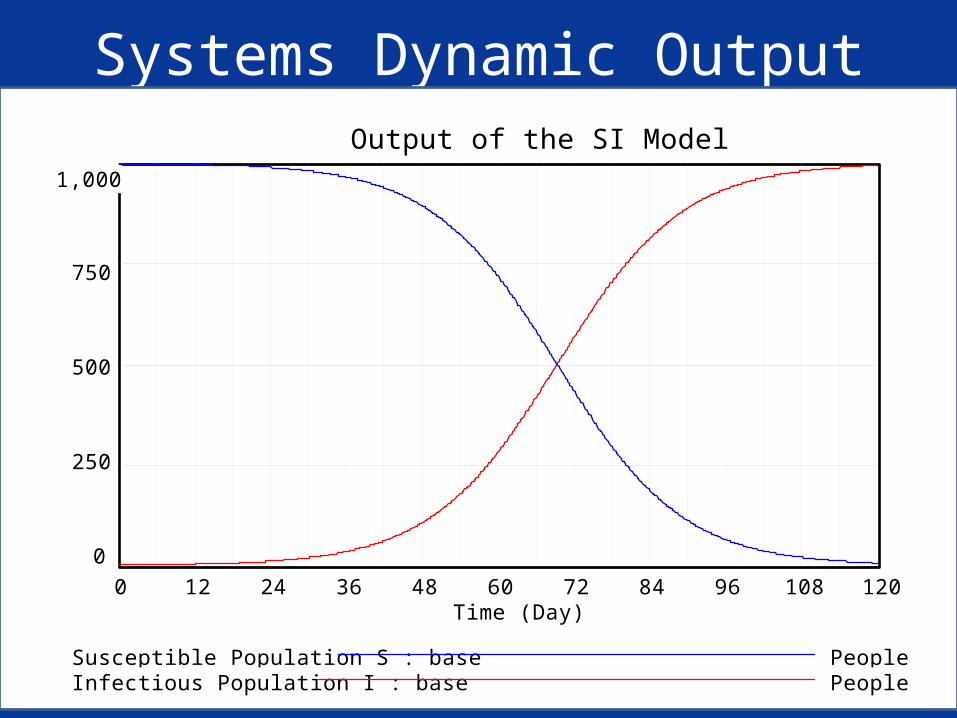
Systems Dynamic OutputOutput of the SI Model
1,000
750
500
250
0
0 12 24 36 48 60 72 84 96 108 120Time (Day)
Susceptible Population S : base PeopleInfectious Population I : base People
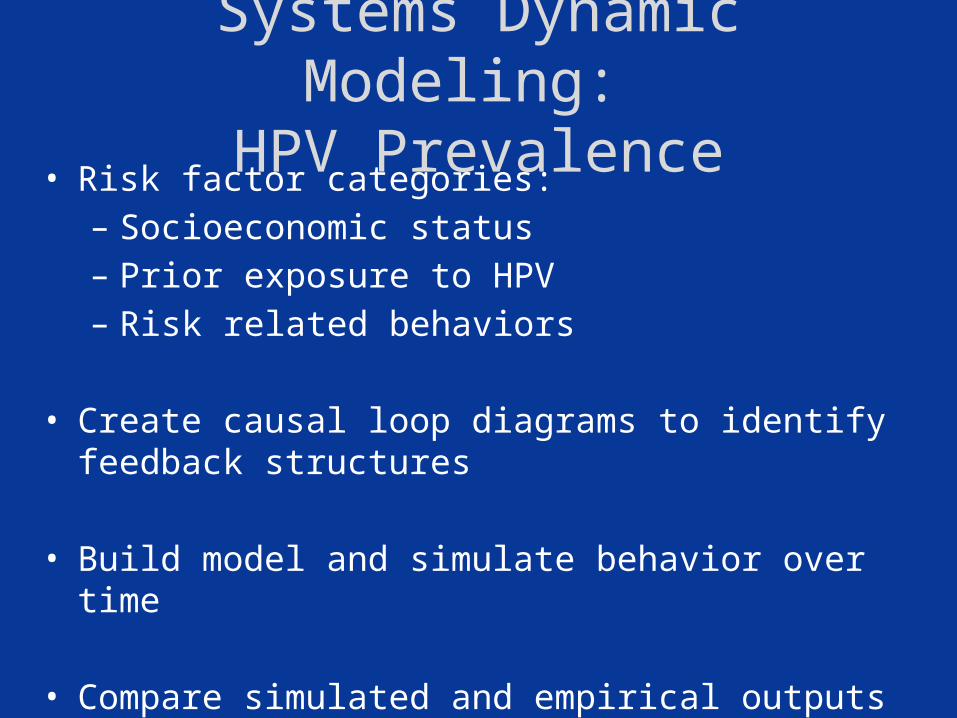
Systems Dynamic Modeling: HPV Prevalence
• Risk factor categories: – Socioeconomic status– Prior exposure to HPV– Risk related behaviors
• Create causal loop diagrams to identify feedback structures
• Build model and simulate behavior over time
• Compare simulated and empirical outputs to determine if base model effectively reproduces trends in HPV prevalence
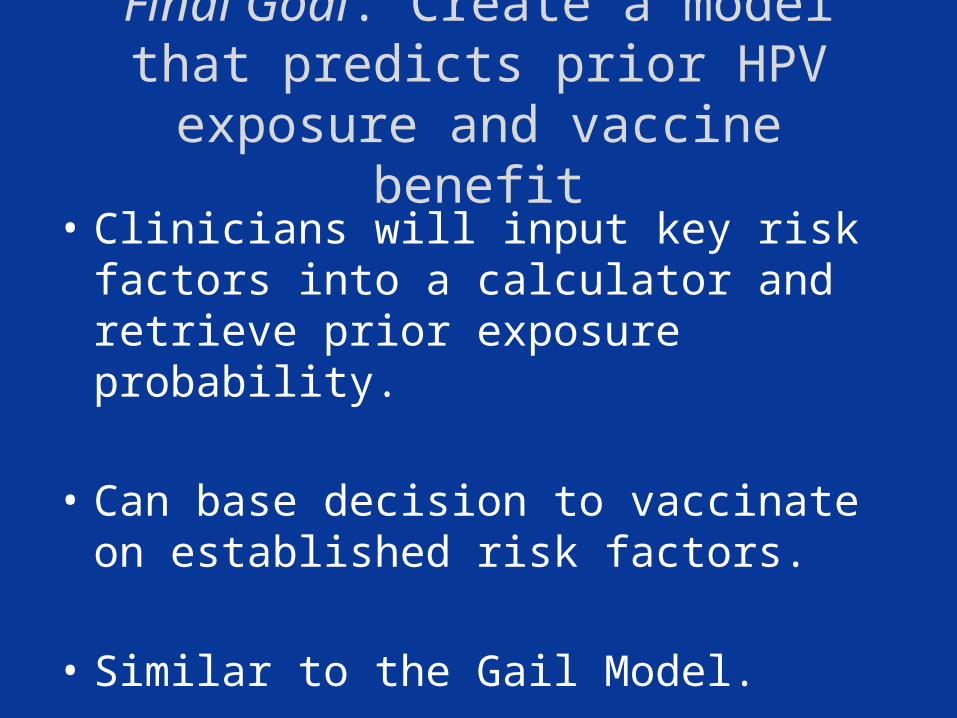
Final Goal: Create a model that predicts prior HPV exposure and vaccine benefit
• Clinicians will input key risk factors into a calculator and retrieve prior exposure probability.
• Can base decision to vaccinate on established risk factors.
• Similar to the Gail Model.
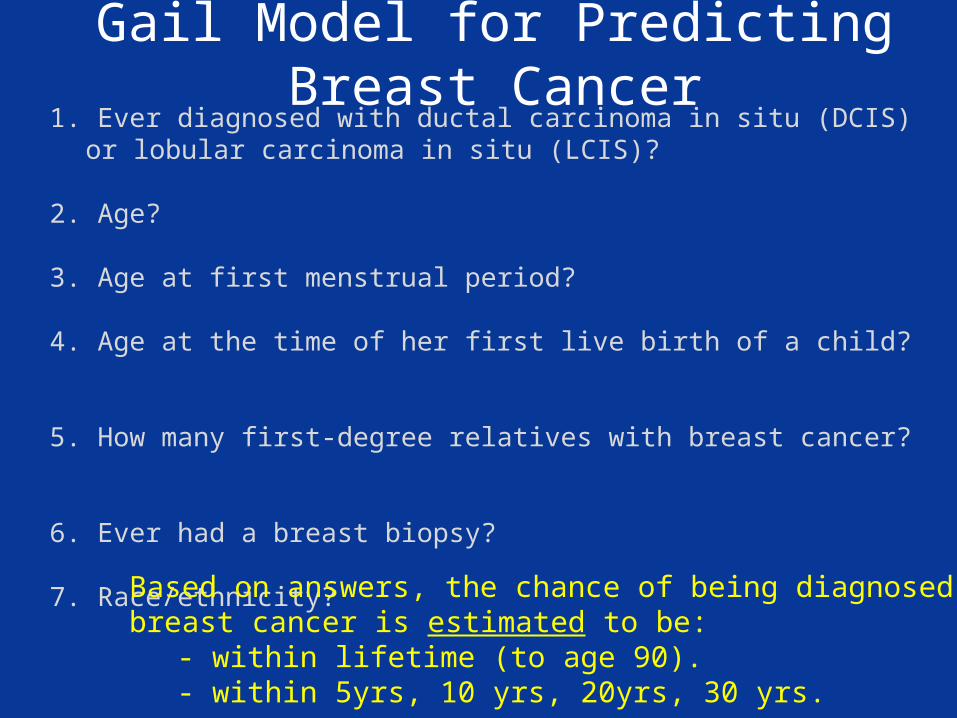
1. Ever diagnosed with ductal carcinoma in situ (DCIS) or lobular carcinoma in situ (LCIS)?
2. Age?
3. Age at first menstrual period?
4. Age at the time of her first live birth of a child?
5. How many first-degree relatives with breast cancer?
6. Ever had a breast biopsy?
7. Race/ethnicity?
Gail Model for Predicting Breast Cancer
Based on answers, the chance of being diagnosed with breast cancer is estimated to be:
- within lifetime (to age 90).- within 5yrs, 10 yrs, 20yrs, 30 yrs.
Thank you!
– Dr. Mark Einstein– Dr. Nicolas Schlecht– Dr. David Lounsbury– Dr. Hayley Thompson– Dr. Clyde Schechter
– Montefiore vaccine clinic staff
Factors Influencing Prevalence to Inform Our Systems Dynamic Modeling
HPV Prevalence6/11/16/18
Patient High Risk Behavior
Prior exposure to HPV
Early onset of sexual activity
Perceived Risk
Partner High Risk Behavior
Partner STD History
Partner lifetime number partners
Marital Status
Lifetime Number of Partners
Smoking/Drug Use
Regression
Education
Prior STD Socioeconomic Status
Prior Pregnancy
Contraception
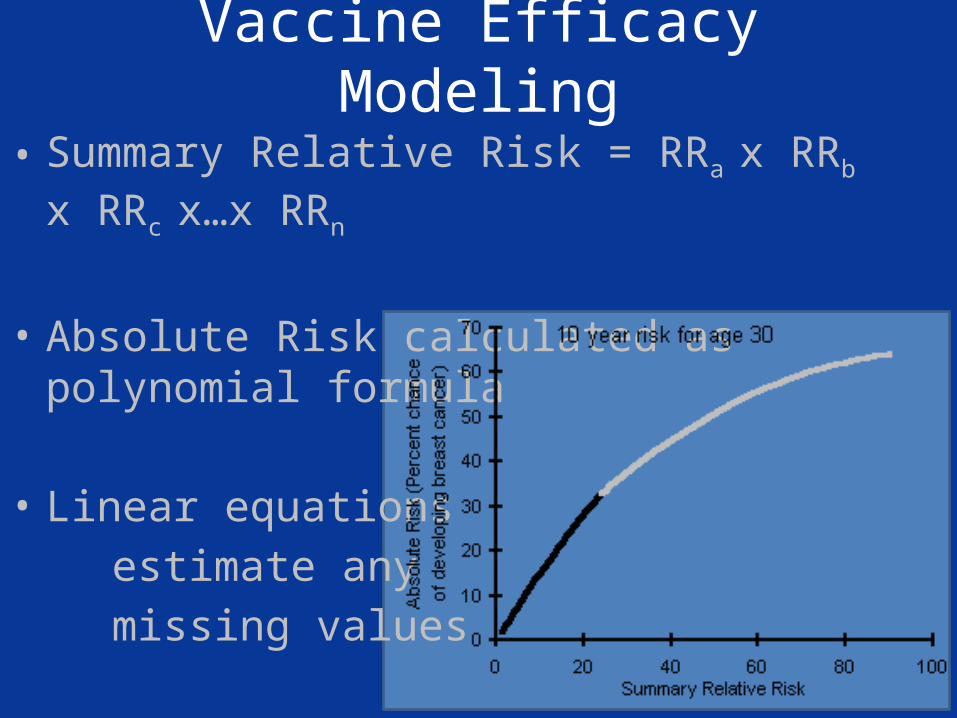
Vaccine Efficacy Modeling
• Summary Relative Risk = RRa x RRb x RRc x…x RRn
• Absolute Risk calculated as polynomial formula
• Linear equations estimate any missing values
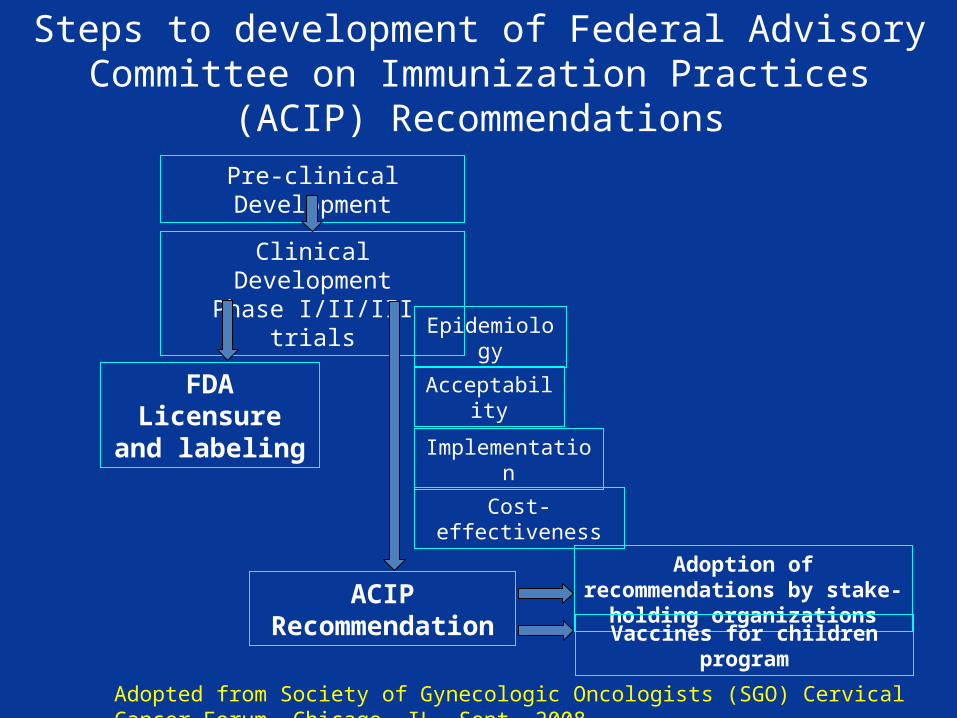
Steps to development of Federal Advisory Committee on Immunization Practices (ACIP) Recommendations
Pre-clinical Development
Clinical DevelopmentPhase I/II/III trials
FDA Licensure and labeling
Epidemiology
Acceptability
Implementation
Cost-effectiveness
ACIP Recommendation
Adoption of recommendations by stake-holding organizations
Vaccines for children program
Adopted from Society of Gynecologic Oncologists (SGO) Cervical Cancer Forum, Chicago, IL, Sept. 2008
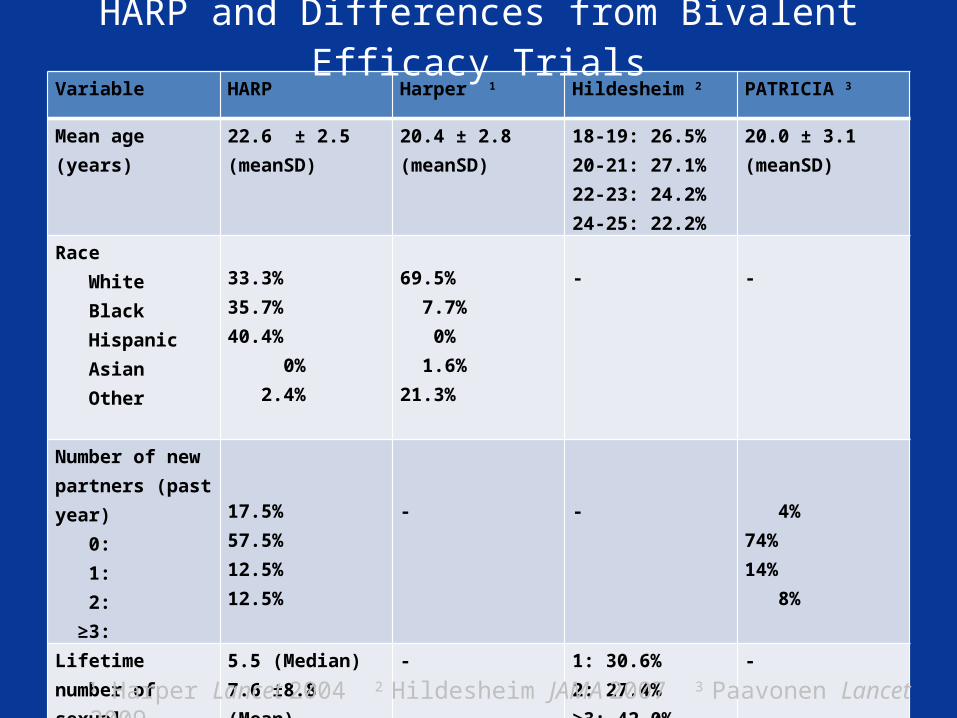
Variable HARP Harper 1 Hildesheim 2 PATRICIA 3
Mean age (years) 22.6 ± 2.5(meanSD)
20.4 ± 2.8(meanSD)
18-19: 26.5%20-21: 27.1%22-23: 24.2%24-25: 22.2%
20.0 ± 3.1(meanSD)
Race White Black Hispanic Asian Other
33.3%35.7%40.4% 0% 2.4%
69.5% 7.7% 0% 1.6%21.3%
- -
Number of new partners (past year) 0: 1: 2: ≥3:
17.5%57.5%12.5%12.5%
- - 4%74%14% 8%
Lifetime number of sexual partners
5.5 (Median)7.6 ±8.8 (Mean)
- 1: 30.6%2: 27.4%≥3: 42.0%
-
HARP and Differences from Bivalent Efficacy Trials
1 Harper Lancet 2004 2 Hildesheim JAMA 2007 3 Paavonen Lancet 2009
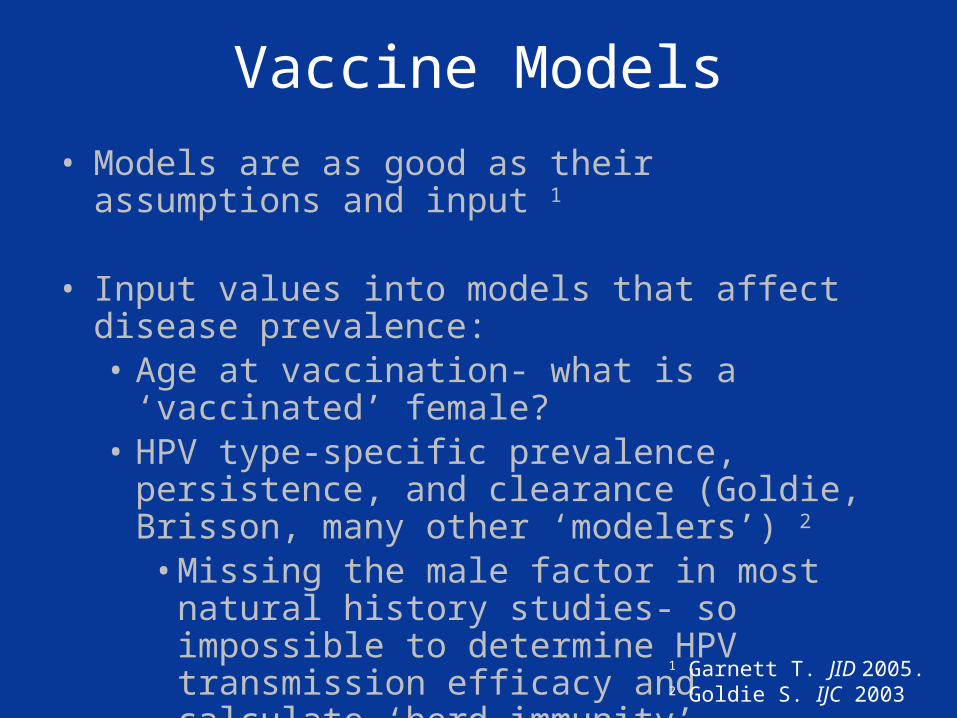
Vaccine Models
• Models are as good as their assumptions and input 1
• Input values into models that affect disease prevalence:• Age at vaccination- what is a ‘vaccinated’ female?• HPV type-specific prevalence, persistence, and
clearance (Goldie, Brisson, many other ‘modelers’) 2
• Missing the male factor in most natural history studies- so impossible to determine HPV transmission efficacy and calculate ‘herd immunity’
1 Garnett T. JID 2005.2 Goldie S. IJC 2003
Decade(s)
Years
Months
LSIL
HSIL
ICCICC
HSIL
LSIL
ASCUSASCUS
LSIL
HSIL
ICC
Potential reduction due to 16/18 and 6/11
ICC
LSIL
HSIL
~20% ~35%
ICC
HSIL ~50% ~60%
ICCICCICCICC ~70%
Potential Impact of the Quadrivalent HPV Vaccine
~20% ~35%
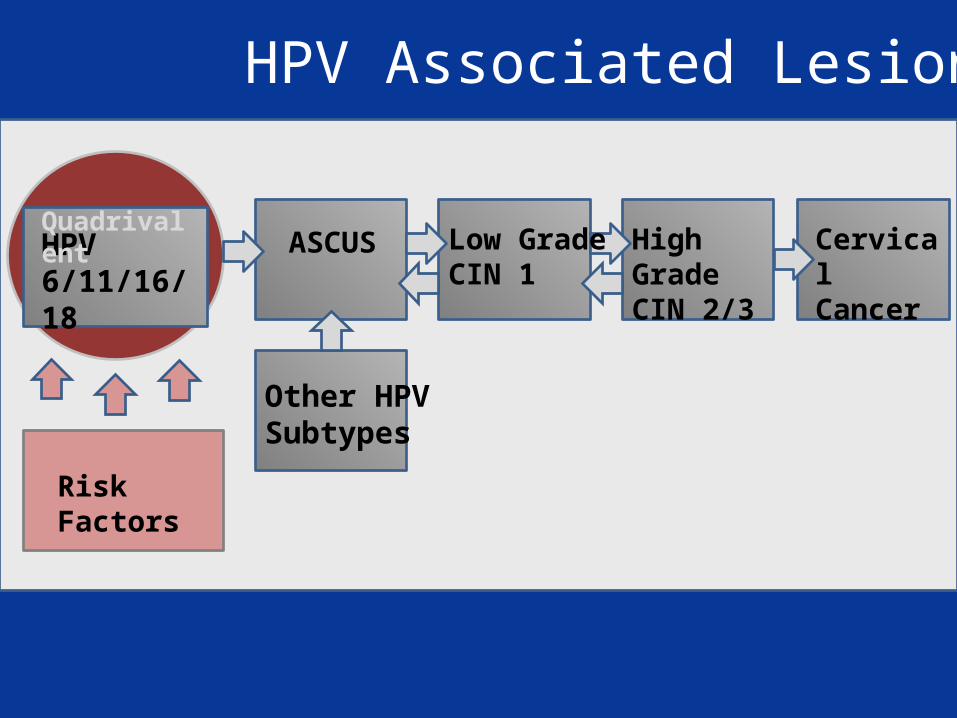
HPV Associated Lesions
HPV 6/11/16/18
Other HPV Subtypes
Cervical Cancer
High Grade CIN 2/3
Low Grade CIN 1
Quadrivalent
ASCUS
Risk Factors