Embed Size (px)
Citation preview

HARNESSING STRENGTHSBUILDING
TRUST
A N N U A L R E P O R T 2 0 1 6

06Chairman’s Message
04Financial
Highlights
08Board ofDirectors
17Financial
Statements
15Sustainability
Report
CorporateInformation
02Corporate
Profile
03BusinessStrategy
10Geographic
Presence
12CEO’s
Message
Proxy Form
C O N T E N T S

PEC ANNUAL REPORT 2016
01
Since 1982, PEC has built up a strong track record for executing and delivering projects safely, precisely and efficiently. Our established processes and methodologies, together with the Group’s proven capabilities in engineering and project management, as well as our strategic network of fabrication facilities in Asia and the Middle East, have positioned us well to secure opportunities.
We will harness these strengths to overcome the challenges ahead, while continuing to deliver quality work based on the highest service standards to build and retain the trust of our clients.
HARNESSING STRENGTHSBUILDING
TRUST
PEC ANNUAL REPORT 2016
02
Established in 1982, PEC Ltd. (PEC) has grown into a recognised plant and terminal engineering specialist with fabrication facilities spread across the world – helmed by a strong management team with decades of experience in their individual fields. Today, PEC serves four main sectors: oil & gas, petrochemicals, oil & chemical terminals and pharmaceuticals. PEC’s reputation for being a reliable and trusted provider of engineering solutions has won over a growing number of clients in the industries it serves, including prominent MNCs that have been with the Group since 1982. Over the years, these relationships have allowed PEC to establish a firm foothold in Asia and the Middle East, where it continues to expand its presence.
One of PEC’s core businesses is project works, under which it provides engineering, procurement & construction (EPC), EPC project management and project management consultancy services. Providing plant maintenance services, including plant turnarounds and upgrading, makes up its other core business, where it offers clients all the advantages of a ‘onestop’ service. Its specialty services cover engineering, mechanical, piping, structural, tankage, electrical & instrumentation, heat treatment,
testing & isolation, painting & blasting, scaffolding, insulation & refractories, fireproofing and hydrojetting.
With its established processes and methodologies, PEC aims to be the engineering specialist of choice for customers. To better meet client needs, it is constantly enhancing and expanding its capabilities through acquisitions and technological upgrading.
An experienced and knowledgeable workforce is one of the cornerstones of PEC’s success. Furthermore, the Group has one of the best safety records in the industry. Armed with a large and growing fleet comprising about several thousand pieces of engineering equipment, PEC can cross-deploy its resources quickly and effectively, giving it the flexibility to respond promptly to customer needs and compete confidently for contract work.
C O R P O R AT E P R O F I L E
OIL & GAS PETROCHEMICAL
OIL & CHEMICAL TERMINAL PHARMACEUTICAL
PEC ANNUAL REPORT 2016
03
B U S I N E S S S T R AT E G Y
P E C ’ S F I V E - P R O N G S T R AT E G YCONTINUES TO SET IT APART FROM OTHER INDUSTRY PLAYERS WHILE ENABLING IT TO STEADILY PUSH FORWARD PLANS TO EXPLORE NEW
MARKETS AND WIDEN ITS REVENUE BASE
Strengthen Our Global FootprintWe have made much headway since our first expansion outside Singapore in the early 1990s. Today, we have an established network of engineering facilities, serving our clients in nine countries and we are still looking to grow and deepen our global footprint through opportunities with new as well as existing clients.
Keep a Balanced Revenue StreamRecognising the importance of steady revenue flows, we have taken pains to strike a satisfactory balance between income contributions from our engineering, procurement & construction (EPC) projects and those from our maintenance services division. Our unique ability to synergise and leverage on these two core businesses has proved invaluable in maintaining a balanced revenue stream.
Add To Niche Capabilities And ProductsWe actively pursue opportunities to add to our core capabilities by seeking out partners that offer specialised services and products that will provide us with a unique edge. Through strategic investments or joint ventures, we are able to acquire niche capabilities and products that help to extend our customer base and gain inroads into new markets.
Deepen Existing Engineering CapabilitiesWe continually enhance our operational efficiencies by deploying state-of-the-art proprietary software platforms that optimise our executive information system (EIS) and procurement, engineering, construction & maintenance management (PECMmt) infrastructure. Augmenting our existing engineering
capabilities sharpens our competitive edge, by enabling us to offer customers the most cost-effective solutions in terms of concept, design and management.
Explore Adjacent IndustriesArmed with a thorough understanding of the process industries and a sturdy network of strategic business alliances, we continue to explore fresh channels into adjacent industries such as the energy-related and upstream oil & gas sectors. The Group is well-equipped to capture growth in these areas, where energy demand is expected to continue to rise in the mid to long term.
PEC ANNUAL REPORT 2016
04
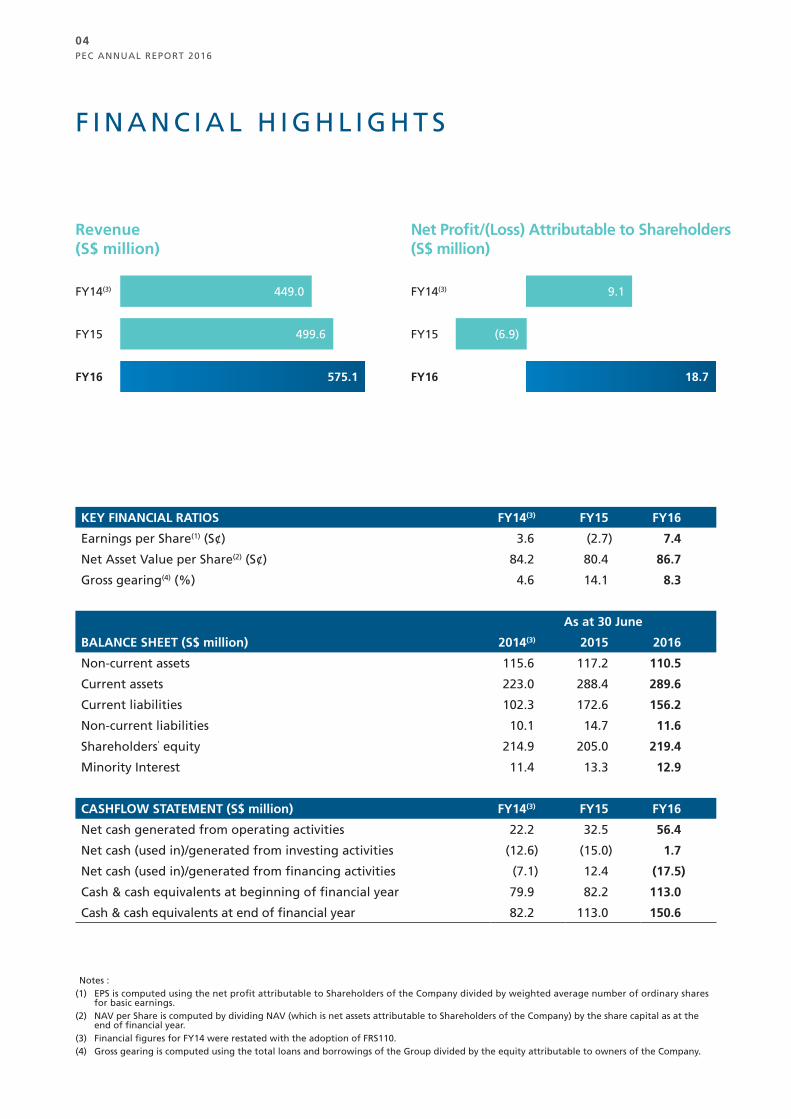
F I N A N C I A L H I G H L I G H T S
KEY FINANCIAL RATIOS FY14(3) FY15 FY16
Earnings per Share(1) (S¢) 3.6 (2.7) 7.4
Net Asset Value per Share(2) (S¢) 84.2 80.4 86.7
Gross gearing(4) (%) 4.6 14.1 8.3
As at 30 June
BALANCE SHEET (S$ million) 2014(3) 2015 2016
Non-current assets 115.6 117.2 110.5
Current assets 223.0 288.4 289.6
Current liabilities 102.3 172.6 156.2
Non-current liabilities 10.1 14.7 11.6
Shareholders' equity 214.9 205.0 219.4
Minority Interest 11.4 13.3 12.9
CASHFLOW STATEMENT (S$ million) FY14(3) FY15 FY16
Net cash generated from operating activities 22.2 32.5 56.4
Net cash (used in)/generated from investing activities (12.6) (15.0) 1.7
Net cash (used in)/generated from financing activities (7.1) 12.4 (17.5)
Cash & cash equivalents at beginning of financial year 79.9 82.2 113.0
Cash & cash equivalents at end of financial year 82.2 113.0 150.6
Notes :(1) EPS is computed using the net profit attributable to Shareholders of the Company divided by weighted average number of ordinary shares
for basic earnings. (2) NAV per Share is computed by dividing NAV (which is net assets attributable to Shareholders of the Company) by the share capital as at the
end of financial year.(3) Financial figures for FY14 were restated with the adoption of FRS110.(4) Gross gearing is computed using the total loans and borrowings of the Group divided by the equity attributable to owners of the Company.
Revenue (S$ million)
Net Profit/(Loss) Attributable to Shareholders (S$ million)
FY14(3) FY14(3)
FY15 FY15
FY16 FY16575.1
449.0 9.1
499.6 (6.9)
18.7

PEC ANNUAL REPORT 2016
05
ENHANCING CAPABILITIES EXTENDINGREACH We will continue to enhance our capabilities by growing our pool of multi-skilled labour and process engineering expertise to extend our reach to new market segments.
S$18.7m
Net ProfitAttributable to
Shareholders

PEC ANNUAL REPORT 2016
06
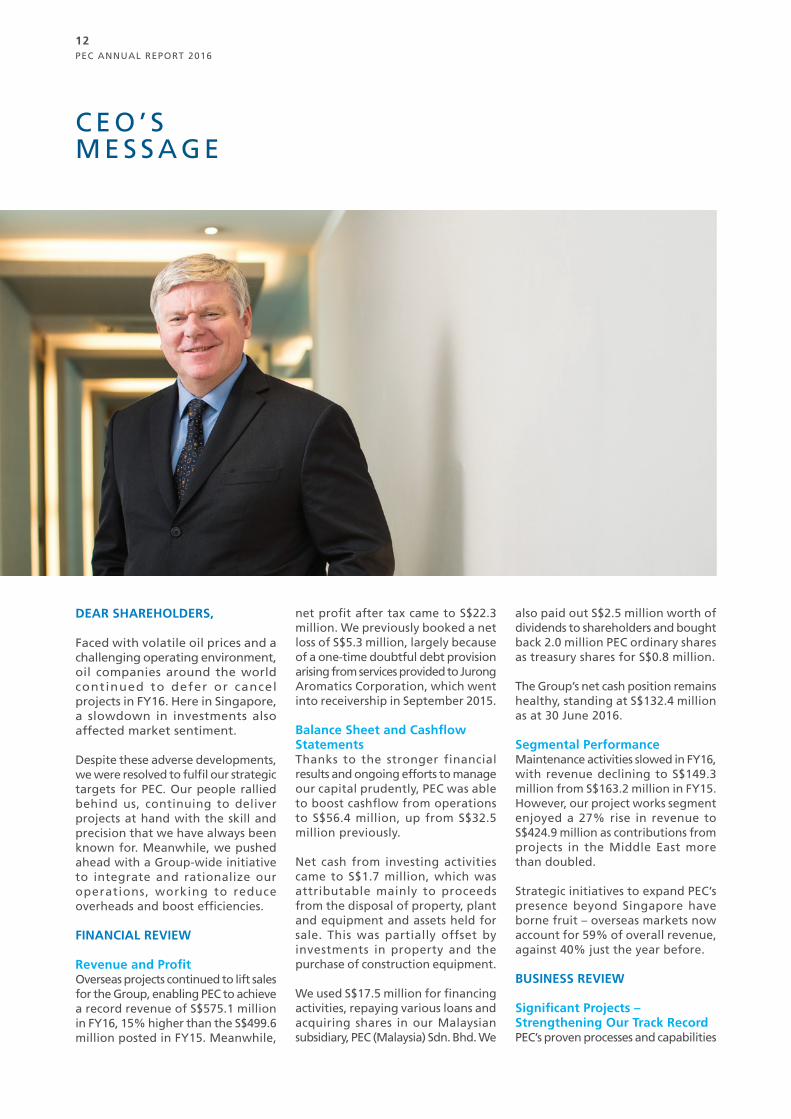
DEAR SHAREHOLDERS,
Over the past year, operating conditions have remained challenging in the oil and gas (O&G) industry. However we met the challenges head on, intensifying our efforts to build a diversified earnings base as we move into key new overseas markets.
These initiatives continue to gain ground, with overseas project works helping to boost Group revenue to a record S$575.1 million for the financial year ended 30 June 2016 (FY16). We also achieved a turnaround in profits with a net profit after tax of S$22.3 million.
Net cashflow from operations rose from S$32.5 million to S$56.4 million in FY16, and the Group’s balance sheet remains healthy. We continued
to actively manage our capital, even as we kicked off our very first share buyback programme, purchasing 2.0 million PEC ordinary shares at an average price of 40.5 S¢ over the year.
Operationally, efforts to review and optimise workflows and processes as well as consolidating our operations have enabled us to achieve further gains in efficiency and productivity. These steps, added to ongoing initiatives to enhance the Group’s engineering capabilities and facilities, will allow us to strengthen our presence in targeted markets.
Our strategy to position PEC near customers and their markets in order to grow with them and meet their needs more effectively has taken us well beyond our own shores. Today,
our network of engineering design and fabrication centres spans nine countries, enabling us to respond expeditiously. The latest addition is in India, where we have acquired a majority stake in a local engineering consultancy firm.
HARNESSING STRENGTHS, BUILDING TRUSTIn the past six years, we have seen our target markets in Asia and the Middle East move steadily to the forefront. While their increasing contributions have broadened the Group’s revenue base, we have also been able to capitalize on our successes here, harnessing these strengths to build trust in the PEC brand overseas.
The brand equity we have earned as a trusted provider of reliable and cost effective integrated engineering solutions rests on our people and our processes, so we continue to invest heavily in both. These moves have made it possible for PEC to take on challenging new areas such as liquefied petroleum gas (LPG) and liquefied natural gas (LNG).
C H A I R M A N ’ SM E S S A G E
Our strategy to position PEC near customers and their markets in order to grow with them and meet their needs more effectively has taken us well beyond our own shores.
PEC ANNUAL REPORT 2016
07
One strategic initiative we rolled out was a training scheme in Singapore that will allow us to offer clients a multi-skilled workforce to cater to their maintenance needs. This Multi-Skill Incentive Programme will equip each worker with a diverse array of skills geared towards strengthening our competitive edge.
During the year, PEC had the opportunity to take on a multi-disciplinary project for an existing process plant owned by one of the world’s largest independent oil companies in Singapore. Our project team showed both expertise and versatility, taking on tasks that ranged from mechanical and structural works to blasting and scaffolding to electrical and instrumentation. Their ability to successfully manage such a varied job scope while meeting strict deadlines has added significantly to our track record.
This commitment to maintaining the highest standards has also helped us achieve other milestones this year. At Fujairah in the United Arab Emirates, we executed EPC works for three key storage terminals, simultaneously with a total capacity of nearly 1.5 million m3. The scale of the projects was a first for PEC – one in particular was both technically challenging
and fast-tracked, with completion required within 14 months. Our team met the deadline, executing the project to levels that readily met the client’s expectations.
For the coming year, our main focus will be on executing existing EPC projects and turnaround maintenance works safely, on time and meeting industry standards – PEC trademarks that we will continue to build on as we expand our orderbook in targeted markets. In this uncertain environment, we will remain focused and play to our strengths to ride out the headwinds ahead.
We expect the coming months to be even tougher for the O&G sector, with oil prices likely to remain low over the near to medium term, which have prompted oil companies to cancel or delay capital-intensive projects. In addition, rising costs will continue to be a challenge while competition is set to intensify further. Even so, we will persist with efforts to seek out new opportunities for PEC.
PROPOSED DIVIDENDIn view of the Group’s improved performance, the Board has proposed a final tax-exempt, one-tier dividend of 2.0 S¢, as well as a special dividend of 1.0 S¢ per ordinary share, bringing
the total dividend to 3.0 S¢ per ordinary share for FY16. If approved by shareholders at the Annual General Meeting to be held on 27 October 2016, the total payout will come to S$7.6 million.
ACKNOWLEDGMENTS AND APPRECIATIONOn behalf of the Board, I would like to thank both staff and management for their unflagging efforts to establish PEC as the preferred partner for key clients, creating a trusted brand that continues to inspire confidence. To our shareholders and business partners, we deeply appreciate your strong faith in us. To all our stakeholders, let me say that your unwavering support through difficult times has anchored our determination to press ahead as we test new markets and push the limits.
We have come a long way since we made our first foray outside Singapore in the 1990s. Today, our name already spells reliability, quality and innovation to a host of clients around the region. With your continued support, we will take PEC even further, on a journey that will distinguish the Group as the engineering specialist of choice across Asia and beyond.
EDNA KO POH THIMExecutive Chairman
Today, our name already spells reliability, quality and innovation to a host of clients around the region.
PEC ANNUAL REPORT 2016
08
B O A R D O F D I R E C T O R S
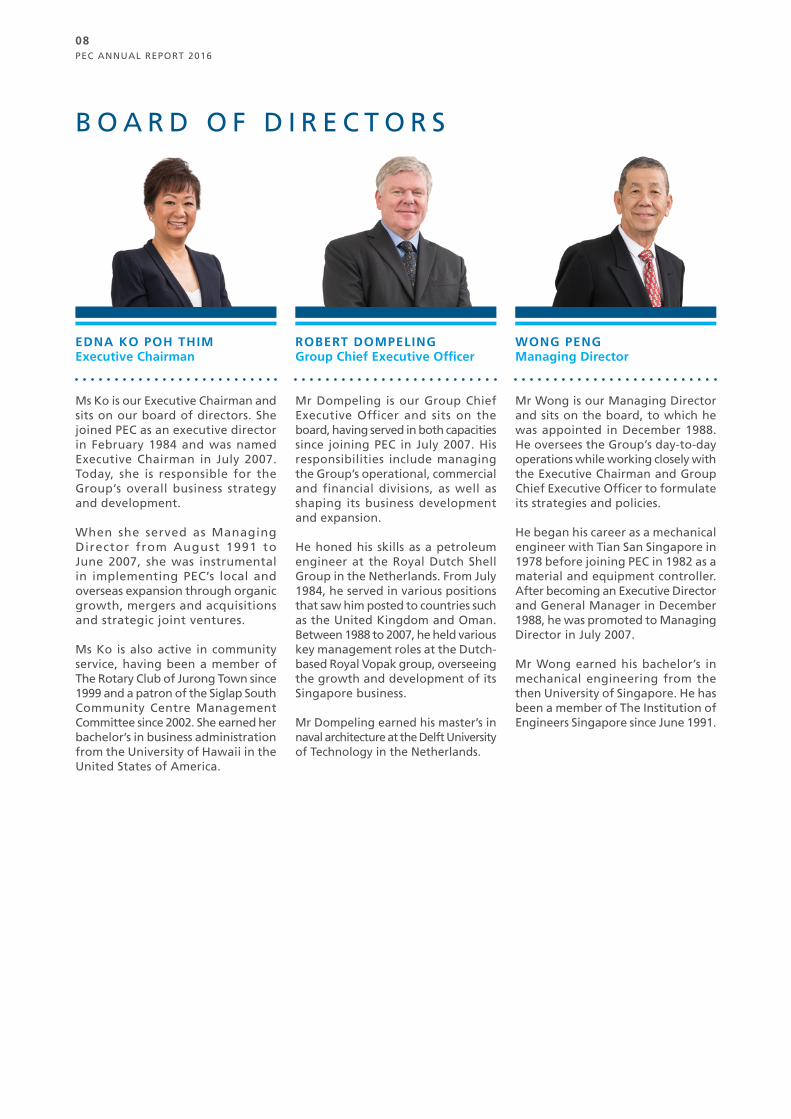
EDNA KO POH THIMExecutive Chairman
Ms Ko is our Executive Chairman and sits on our board of directors. She joined PEC as an executive director in February 1984 and was named Executive Chairman in July 2007. Today, she is responsible for the Group’s overall business strategy and development.
When she served as Managing Director from August 1991 to June 2007, she was instrumental in implementing PEC’s local and overseas expansion through organic growth, mergers and acquisitions and strategic joint ventures.
Ms Ko is also active in community service, having been a member of The Rotary Club of Jurong Town since 1999 and a patron of the Siglap South Community Centre Management Committee since 2002. She earned her bachelor’s in business administration from the University of Hawaii in the United States of America.
ROBERT DOMPELINGGroup Chief Executive Officer
Mr Dompeling is our Group Chief Executive Officer and sits on the board, having served in both capacities since joining PEC in July 2007. His responsibilities include managing the Group’s operational, commercial and financial divisions, as well as shaping its business development and expansion.
He honed his skills as a petroleum engineer at the Royal Dutch Shell Group in the Netherlands. From July 1984, he served in various positions that saw him posted to countries such as the United Kingdom and Oman. Between 1988 to 2007, he held various key management roles at the Dutch-based Royal Vopak group, overseeing the growth and development of its Singapore business.
Mr Dompeling earned his master’s in naval architecture at the Delft University of Technology in the Netherlands.
WONG PENGManaging Director
Mr Wong is our Managing Director and sits on the board, to which he was appointed in December 1988. He oversees the Group’s day-to-day operations while working closely with the Executive Chairman and Group Chief Executive Officer to formulate its strategies and policies.
He began his career as a mechanical engineer with Tian San Singapore in 1978 before joining PEC in 1982 as a material and equipment controller. After becoming an Executive Director and General Manager in December 1988, he was promoted to Managing Director in July 2007.
Mr Wong earned his bachelor’s in mechanical engineering from the then University of Singapore. He has been a member of The Institution of Engineers Singapore since June 1991.
PEC ANNUAL REPORT 2016
09
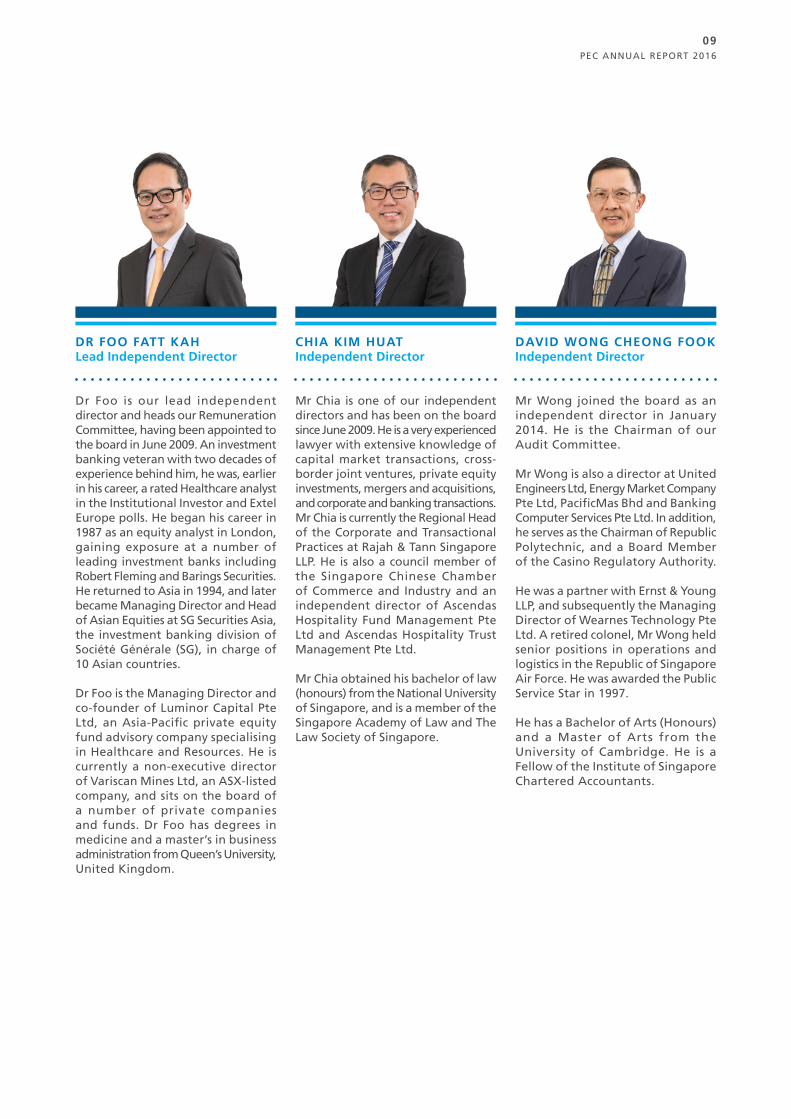
DR FOO FATT KAHLead Independent Director
Dr Foo is our lead independent director and heads our Remuneration Committee, having been appointed to the board in June 2009. An investment banking veteran with two decades of experience behind him, he was, earlier in his career, a rated Healthcare analyst in the Institutional Investor and Extel Europe polls. He began his career in 1987 as an equity analyst in London, gaining exposure at a number of leading investment banks including Robert Fleming and Barings Securities. He returned to Asia in 1994, and later became Managing Director and Head of Asian Equities at SG Securities Asia, the investment banking division of Société Générale (SG), in charge of 10 Asian countries.
Dr Foo is the Managing Director and co-founder of Luminor Capital Pte Ltd, an Asia-Pacific private equity fund advisory company specialising in Healthcare and Resources. He is currently a non-executive director of Variscan Mines Ltd, an ASX-listed company, and sits on the board of a number of private companies and funds. Dr Foo has degrees in medicine and a master’s in business administration from Queen’s University, United Kingdom.
CHIA KIM HUATIndependent Director
Mr Chia is one of our independent directors and has been on the board since June 2009. He is a very experienced lawyer with extensive knowledge of capital market transactions, cross-border joint ventures, private equity investments, mergers and acquisitions, and corporate and banking transactions. Mr Chia is currently the Regional Head of the Corporate and Transactional Practices at Rajah & Tann Singapore LLP. He is also a council member of the Singapore Chinese Chamber of Commerce and Industry and an independent director of Ascendas Hospitality Fund Management Pte Ltd and Ascendas Hospitality Trust Management Pte Ltd.
Mr Chia obtained his bachelor of law (honours) from the National University of Singapore, and is a member of the Singapore Academy of Law and The Law Society of Singapore.
DAVID WONG CHEONG FOOKIndependent Director
Mr Wong joined the board as an independent director in January 2014. He is the Chairman of our Audit Committee.
Mr Wong is also a director at United Engineers Ltd, Energy Market Company Pte Ltd, PacificMas Bhd and Banking Computer Services Pte Ltd. In addition, he serves as the Chairman of Republic Polytechnic, and a Board Member of the Casino Regulatory Authority.
He was a partner with Ernst & Young LLP, and subsequently the Managing Director of Wearnes Technology Pte Ltd. A retired colonel, Mr Wong held senior positions in operations and logistics in the Republic of Singapore Air Force. He was awarded the Public Service Star in 1997.
He has a Bachelor of Arts (Honours) and a Master of Arts from the University of Cambridge. He is a Fellow of the Institute of Singapore Chartered Accountants.

PEC ANNUAL REPORT 2016
10
G E O G R A P H I C P R E S E N C E
Our established and strategically located network of engineering facilities spans two regions, reaching and serving clients in nine countries.
ASIA
Sturdily rooted in Asia, the Group has built a significant presence in Singapore, China, India, Indonesia, Malaysia, Myanmar, Thailand and Vietnam.
MIDDLE EAST
Our existing operations in the United Arab Emirates give us a strong springboard for growth in the Middle East region.
INDONESIA
MYANMAR
INDIA
CHINA
VIETNAMTHAILAND
MALAYSIASINGAPORE
UAE
PEC Projects PEC Fabrication & MaintenanceFacilities/Support
PEC Fabrication & MaintenanceFacilities/Support
PEC Projects

PEC ANNUAL REPORT 2016
11
STRENGTHENING PARTNERSHIPS
SECURING OPPORTUNITIESWe will strengthen our relationships with partners in targeted markets in Asia and the Middle East to grow our repeat customer base
and secure opportunities.
S$575.1mRevenue
PEC ANNUAL REPORT 2016
12
DEAR SHAREHOLDERS,
Faced with volatile oil prices and a challenging operating environment, oil companies around the world continued to defer or cancel projects in FY16. Here in Singapore, a slowdown in investments also affected market sentiment.
Despite these adverse developments, we were resolved to fulfil our strategic targets for PEC. Our people rallied behind us, continuing to deliver projects at hand with the skill and precision that we have always been known for. Meanwhile, we pushed ahead with a Group-wide initiative to integrate and rationalize our operations, working to reduce overheads and boost efficiencies.
FINANCIAL REVIEW
Revenue and ProfitOverseas projects continued to lift sales for the Group, enabling PEC to achieve a record revenue of S$575.1 million in FY16, 15% higher than the S$499.6 million posted in FY15. Meanwhile,
net profit after tax came to S$22.3 million. We previously booked a net loss of S$5.3 million, largely because of a one-time doubtful debt provision arising from services provided to Jurong Aromatics Corporation, which went into receivership in September 2015.
Balance Sheet and Cashflow StatementsThanks to the stronger financial results and ongoing efforts to manage our capital prudently, PEC was able to boost cashflow from operations to S$56.4 million, up from S$32.5 million previously.
Net cash from investing activities came to S$1.7 million, which was attributable mainly to proceeds from the disposal of property, plant and equipment and assets held for sale. This was partially offset by investments in property and the purchase of construction equipment.
We used S$17.5 million for financing activities, repaying various loans and acquiring shares in our Malaysian subsidiary, PEC (Malaysia) Sdn. Bhd. We
also paid out S$2.5 million worth of dividends to shareholders and bought back 2.0 million PEC ordinary shares as treasury shares for S$0.8 million.
The Group’s net cash position remains healthy, standing at S$132.4 million as at 30 June 2016.
Segmental PerformanceMaintenance activities slowed in FY16, with revenue declining to S$149.3 million from S$163.2 million in FY15. However, our project works segment enjoyed a 27% rise in revenue to S$424.9 million as contributions from projects in the Middle East more than doubled.
Strategic initiatives to expand PEC’s presence beyond Singapore have borne fruit – overseas markets now account for 59% of overall revenue, against 40% just the year before.
BUSINESS REVIEW
Significant Projects – Strengthening Our Track RecordPEC’s proven processes and capabilities
C E O ’ S M E S S A G E

PEC ANNUAL REPORT 2016
13
have been pivotal in helping us retain key clients and win over new ones. In addition, efforts to grow our network of engineering offices and facilities have enabled us to be near our clients, making it possible to accelerate project delivery without sacrificing quality or service.
That is why we are steadily drawing in clients in target markets – clients who have every confidence we can deliver what they need, even when the projects are fast-tracked and highly complex or technically challenging. This track record will be invaluable as we continue to broaden our footprint abroad.
(a) SingaporeOver the year, PEC completed a multi-disciplinary EPC project for an existing plant owned by a top MNC client. Tapping on our experience,
while fully exploiting our extensive range of integrated solutions, we were able to take on the work and readily meet all the requirements despite the tight deadlines. Our successful execution of the project has demonstrated to clients that we have the skills and resources to manage the diverse scope and complexities of such jobs.
Another milestone saw us deliver our first liquefied petroleum gas (LPG) contract – a technically demanding project for Southeast Asia’s first independent LPG facility, located on Jurong Island. The project required us to construct double-walled cryogenic tanks and related facilities that could withstand extremely low temperatures for the propane storage facility.
(b) MalaysiaPEC made further inroads into the
cryogenic market segment when it took part in a project for one of the world’s largest production facilities for liquefied natural gas (LNG), located at Bintulu in Sarawak.
During the course of the project, we were asked to extend our work scope for the plant. The client’s faith in our ability to tackle the expanded and varied scope of the work reaffirms that PEC is recognised not only for its technical capabilities but also for its capacity to adapt swiftly to customer needs with practical and relevant solutions.
(c) Middle EastDuring the year, we continued to build on PEC’s reputation around the region, adding significantly to our brand equity when we successfully completed two major engineering, procurement and construction (EPC)

PEC ANNUAL REPORT 2016
14
contracts at Fujairah in the United Arab Emirates.
One of these projects involved the construction of five crude oil storage tanks with a capacity of about 480,000 m3 and a pipeline connection to the new VLCC (very large crude carrier) jetty at the Port of Fujairah. For the second project, we developed several large crude and fuel oil tanks with a combined capacity of about 450,000 m3 for a leading refinery within an extremely short timeframe. Such jobs usually take 18-24 months, but we were able to complete the project in 14 months despite the technical challenges.
While constructing these two storage facilities, PEC was also providing EPC works for another terminal – a new oil and gas distribution and trading terminal with a storage capacity of about 500,000 m3. In essence, we were simultaneously creating close to 1.5 million m3 worth of storage capacity and related facilities, underlining the Group’s robust processes and engineering capabilities.
Expanding Our PresenceAs part of our strategy to position PEC near clients and their markets, we have been steadily growing our network of engineering design and fabrication centres. In our latest step to expand these facilities, we added India to the fold, bolstering our ability to quickly mobilise resources and improve response time.
Investing in Our PeopleTo increase our competitive advantage, we kicked off the Multi-Skill Incentive Programme to equip our workers, particularly those in Singapore, with multiple skills. This upgrading scheme will allow PEC to offer fully integrated services to clients around the world.
Staff will undergo courses that are run by certified trainers and will include a final assessment. Some of the modules will be led by in-house trainers certified by Singapore’s Ministry of Manpower to conduct such training.
Looking Ahead The sector outlook is expected to remain difficult over the near to medium term, but we will press on with efforts to carve out new revenue streams in new markets by drawing on our strengths and making the most of our assets. These efforts will see us continue to deepen our capabilities while seeking out opportunities across Asia and the Middle East. Already, we are making progress by leveraging our existing network of engineering facilities to add to our track record overseas, and by building on our relationships with key clients and partners.
ROBERT DOMPELINGGroup Chief Executive Officer
PEC ANNUAL REPORT 2016
15
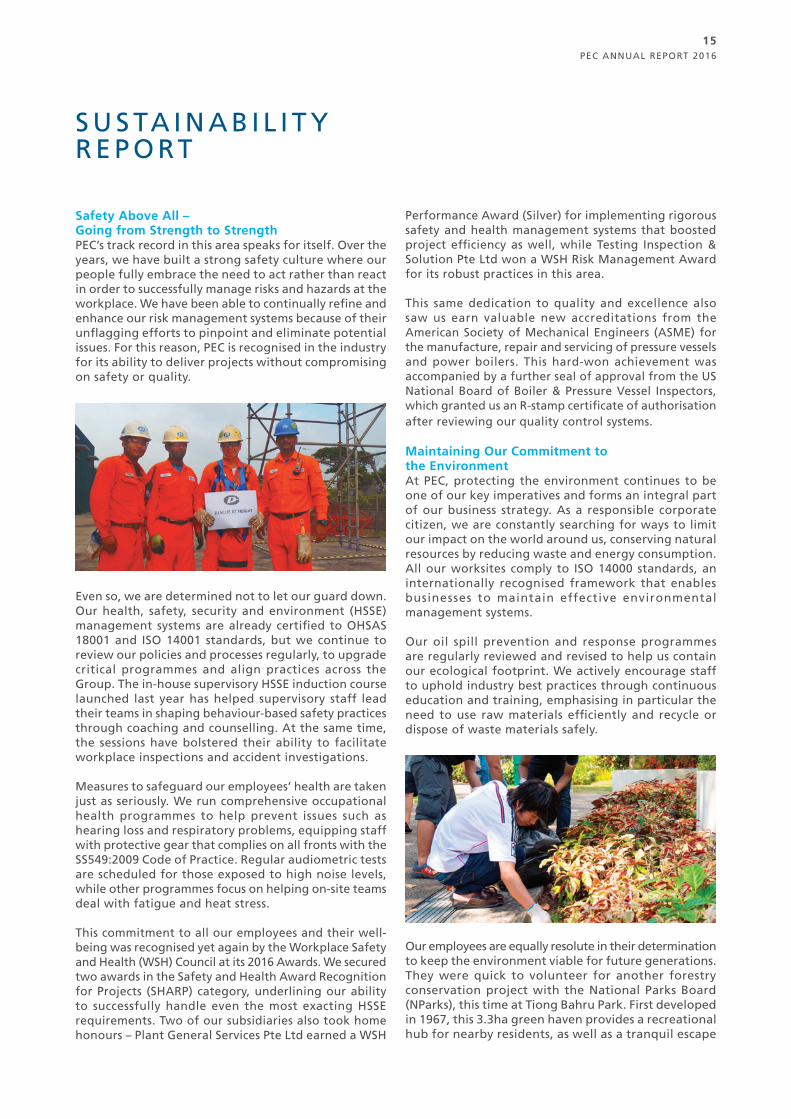
Safety Above All – Going from Strength to StrengthPEC’s track record in this area speaks for itself. Over the years, we have built a strong safety culture where our people fully embrace the need to act rather than react in order to successfully manage risks and hazards at the workplace. We have been able to continually refine and enhance our risk management systems because of their unflagging efforts to pinpoint and eliminate potential issues. For this reason, PEC is recognised in the industry for its ability to deliver projects without compromising on safety or quality.
Even so, we are determined not to let our guard down. Our health, safety, security and environment (HSSE) management systems are already certified to OHSAS 18001 and ISO 14001 standards, but we continue to review our policies and processes regularly, to upgrade critical programmes and align practices across the Group. The in-house supervisory HSSE induction course launched last year has helped supervisory staff lead their teams in shaping behaviour-based safety practices through coaching and counselling. At the same time, the sessions have bolstered their ability to facilitate workplace inspections and accident investigations.
Measures to safeguard our employees’ health are taken just as seriously. We run comprehensive occupational health programmes to help prevent issues such as hearing loss and respiratory problems, equipping staff with protective gear that complies on all fronts with the SS549:2009 Code of Practice. Regular audiometric tests are scheduled for those exposed to high noise levels, while other programmes focus on helping on-site teams deal with fatigue and heat stress.
This commitment to all our employees and their well-being was recognised yet again by the Workplace Safety and Health (WSH) Council at its 2016 Awards. We secured two awards in the Safety and Health Award Recognition for Projects (SHARP) category, underlining our ability to successfully handle even the most exacting HSSE requirements. Two of our subsidiaries also took home honours – Plant General Services Pte Ltd earned a WSH
Performance Award (Silver) for implementing rigorous safety and health management systems that boosted project efficiency as well, while Testing Inspection & Solution Pte Ltd won a WSH Risk Management Award for its robust practices in this area.
This same dedication to quality and excellence also saw us earn valuable new accreditations from the American Society of Mechanical Engineers (ASME) for the manufacture, repair and servicing of pressure vessels and power boilers. This hard-won achievement was accompanied by a further seal of approval from the US National Board of Boiler & Pressure Vessel Inspectors, which granted us an R-stamp certificate of authorisation after reviewing our quality control systems.
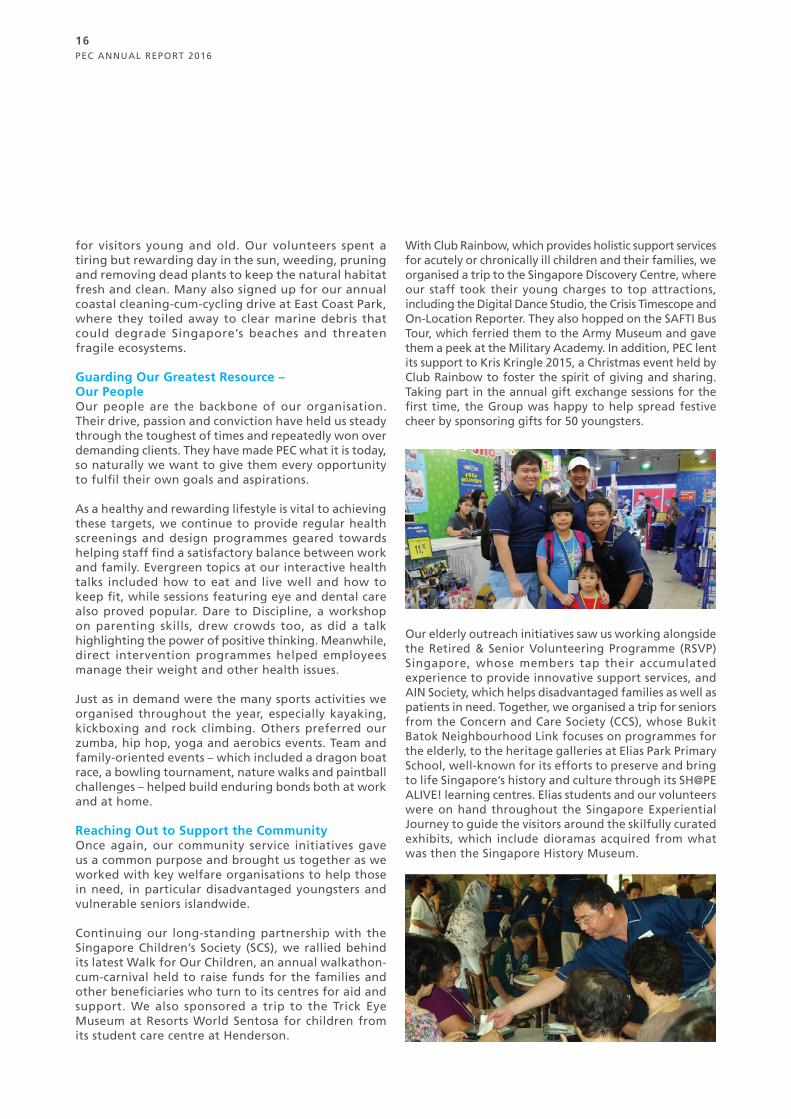
Maintaining Our Commitment to the EnvironmentAt PEC, protecting the environment continues to be one of our key imperatives and forms an integral part of our business strategy. As a responsible corporate citizen, we are constantly searching for ways to limit our impact on the world around us, conserving natural resources by reducing waste and energy consumption. All our worksites comply to ISO 14000 standards, an internationally recognised framework that enables businesses to maintain effective environmental management systems.
Our oil spill prevention and response programmes are regularly reviewed and revised to help us contain our ecological footprint. We actively encourage staff to uphold industry best practices through continuous education and training, emphasising in particular the need to use raw materials efficiently and recycle or dispose of waste materials safely.
Our employees are equally resolute in their determination to keep the environment viable for future generations. They were quick to volunteer for another forestry conservation project with the National Parks Board (NParks), this time at Tiong Bahru Park. First developed in 1967, this 3.3ha green haven provides a recreational hub for nearby residents, as well as a tranquil escape
S U S TA I N A B I L I T Y R E P O RT
PEC ANNUAL REPORT 2016
16
for visitors young and old. Our volunteers spent a tiring but rewarding day in the sun, weeding, pruning and removing dead plants to keep the natural habitat fresh and clean. Many also signed up for our annual coastal cleaning-cum-cycling drive at East Coast Park, where they toiled away to clear marine debris that could degrade Singapore’s beaches and threaten fragile ecosystems.
Guarding Our Greatest Resource – Our PeopleOur people are the backbone of our organisation. Their drive, passion and conviction have held us steady through the toughest of times and repeatedly won over demanding clients. They have made PEC what it is today, so naturally we want to give them every opportunity to fulfil their own goals and aspirations.
As a healthy and rewarding lifestyle is vital to achieving these targets, we continue to provide regular health screenings and design programmes geared towards helping staff find a satisfactory balance between work and family. Evergreen topics at our interactive health talks included how to eat and live well and how to keep fit, while sessions featuring eye and dental care also proved popular. Dare to Discipline, a workshop on parenting skills, drew crowds too, as did a talk highlighting the power of positive thinking. Meanwhile, direct intervention programmes helped employees manage their weight and other health issues.
Just as in demand were the many sports activities we organised throughout the year, especially kayaking, kickboxing and rock climbing. Others preferred our zumba, hip hop, yoga and aerobics events. Team and family-oriented events – which included a dragon boat race, a bowling tournament, nature walks and paintball challenges – helped build enduring bonds both at work and at home. Reaching Out to Support the CommunityOnce again, our community service initiatives gave us a common purpose and brought us together as we worked with key welfare organisations to help those in need, in particular disadvantaged youngsters and vulnerable seniors islandwide.
Continuing our long-standing partnership with the Singapore Children’s Society (SCS), we rallied behind its latest Walk for Our Children, an annual walkathon-cum-carnival held to raise funds for the families and other beneficiaries who turn to its centres for aid and support. We also sponsored a trip to the Trick Eye Museum at Resorts World Sentosa for children from its student care centre at Henderson.
With Club Rainbow, which provides holistic support services for acutely or chronically ill children and their families, we organised a trip to the Singapore Discovery Centre, where our staff took their young charges to top attractions, including the Digital Dance Studio, the Crisis Timescope and On-Location Reporter. They also hopped on the SAFTI Bus Tour, which ferried them to the Army Museum and gave them a peek at the Military Academy. In addition, PEC lent its support to Kris Kringle 2015, a Christmas event held by Club Rainbow to foster the spirit of giving and sharing. Taking part in the annual gift exchange sessions for the first time, the Group was happy to help spread festive cheer by sponsoring gifts for 50 youngsters.
Our elderly outreach initiatives saw us working alongside the Retired & Senior Volunteering Programme (RSVP) Singapore, whose members tap their accumulated experience to provide innovative support services, and AIN Society, which helps disadvantaged families as well as patients in need. Together, we organised a trip for seniors from the Concern and Care Society (CCS), whose Bukit Batok Neighbourhood Link focuses on programmes for the elderly, to the heritage galleries at Elias Park Primary School, well-known for its efforts to preserve and bring to life Singapore’s history and culture through its SH@PE ALIVE! learning centres. Elias students and our volunteers were on hand throughout the Singapore Experiential Journey to guide the visitors around the skilfully curated exhibits, which include dioramas acquired from what was then the Singapore History Museum.
F I N A N C E
18 Corporate Governance Report
34 Directors’ Statement
39 Independent Auditor’s Report
40 Consolidated Statement of
Comprehensive Income
41 Balance Sheets
43 Consolidated Statement of Changes in Equity45 Consolidated Cash Flow Statement47 Notes to the Financial Statements121 Statistics of Shareholdings123 Notice of Annual General Meeting
Proxy Form
Corporate Information
PEC ANNUAL REPORT 2016
18
C O R P O R AT E G O V E R N A N C E R E P O R T
PEC Ltd. (the “Company”) is committed to achieving and maintaining a high standard of corporate governance within the Company and its subsidiaries (the “Group”). The Group firmly believes that good corporate governance establishes and cultivates a legal and ethical environment that is essential to the sustainability of the Group’s business and performance, which helps to preserve and enhance shareholders interests.
This report sets out the corporate governance framework and practices of the Company with reference to the specific principles and guidelines of the Code of Corporate Governance 2012 (the “Code”).
This report should be read in totality, instead of being read separately under each principle of the Code.
(A) BOARD MATTERS
Board’s Conduct of its Affairs
Principle 1: Every company should be headed by an effective Board to lead and control the company. The Board is collectively responsible for the long-term success of the company. The Board works with Management to achieve this objective and Management remains accountable to the Board.
Role of the Board of Directors (the “Board”)
The Board is collectively responsible for the stewardship of the Group and is primarily responsible for the preservation and enhancement of long-term value and returns for the shareholders. The Board oversees the Management of the business and affairs of the Group, provides overall strategy and directions, monitors the performance of its Management team and reviews the financial results of the Group. In addition, the Board is directly responsible for decision making in respect of the following matters:
• approve the business strategies including significant acquisitions and disposals of subsidiaries or assets and liabilities;
• approve the annual budgets, major funding proposals, significant capital expenditures and investment and divestment proposals;
• approve the release of the Group’s quarterly and full year financial results and interested person transactions;
• oversee the processes for risk management, financial reporting and compliance and evaluate the adequacy of internal controls, as may be recommended by the Audit Committee;
• review the performance of the Management, approve the nominees to the Board and the appointment of key management personnel, as may be recommended by the Nominating Committee;
• review and endorse the framework of remuneration for the Board and key management personnel, as may be recommended by the Remuneration Committee; and
• review and endorse corporate policies in keeping with good corporate governance and business practices.
The Board provides shareholders with balanced and comprehensible assessments of the Group’s performance and prospects on a quarterly basis.
PEC ANNUAL REPORT 2016
19
C O R P O R AT E G O V E R N A N C E R E P O R T
To effectively discharge its responsibilities in the interest of the Group, the Board has established and delegated certain functions to its various Board Committees namely, the Audit Committee (“AC”), the Nominating Committee (“NC”) and the Remuneration Committee (“RC”). These Board Committees function within their respective terms of reference (“TORs”) and operating procedures which are reviewed on a regular basis.
All Directors exercise due diligence and independent judgment in making decisions objectively in the best interest of the Group. All the Board Committees are actively engaged and contribute in ensuring good corporate governance in the Company and within the Group.
Board Meetings and Meetings of Board Committees
The Board meets on a quarterly basis and where warranted by particular circumstances. Board meetings dates are normally fixed by the Directors well in advance. Meetings of the Board and Board Committees meetings may be conducted by way of telephone and video conferencing if necessary.
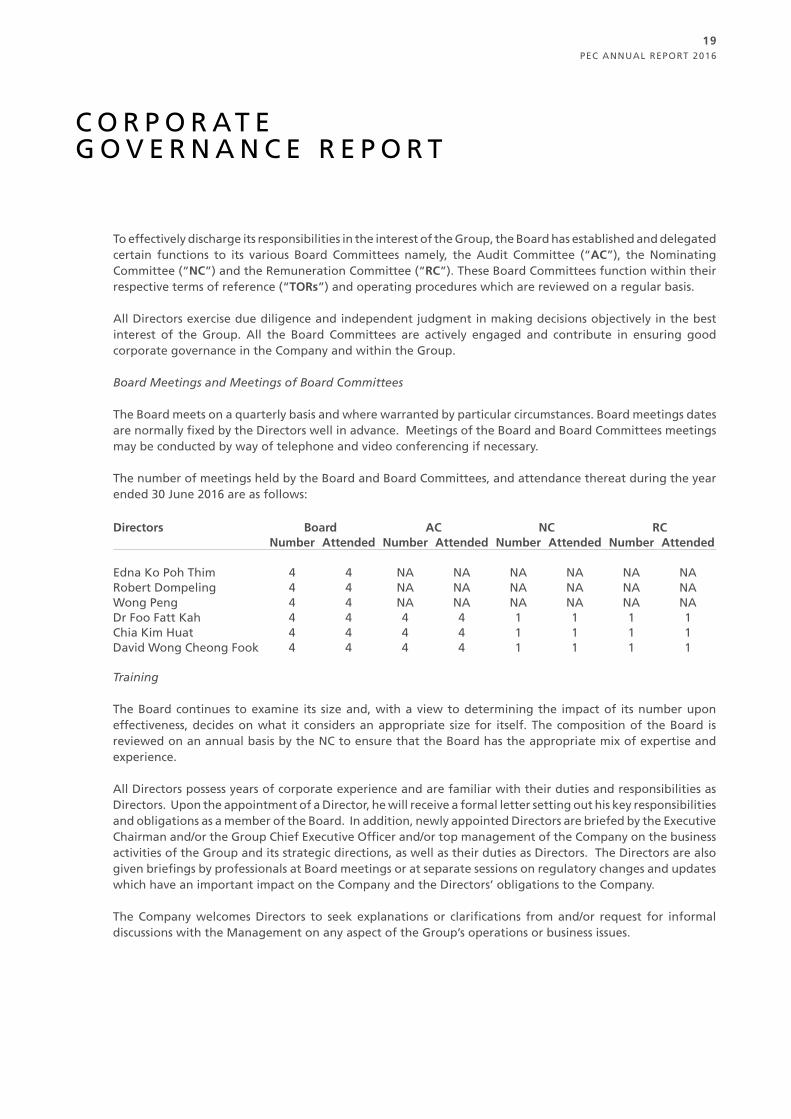
The number of meetings held by the Board and Board Committees, and attendance thereat during the year ended 30 June 2016 are as follows:
Directors Board AC NC RCNumber Attended Number Attended Number Attended Number Attended
Edna Ko Poh Thim 4 4 NA NA NA NA NA NARobert Dompeling 4 4 NA NA NA NA NA NAWong Peng 4 4 NA NA NA NA NA NADr Foo Fatt Kah 4 4 4 4 1 1 1 1Chia Kim Huat 4 4 4 4 1 1 1 1David Wong Cheong Fook 4 4 4 4 1 1 1 1
Training
The Board continues to examine its size and, with a view to determining the impact of its number upon effectiveness, decides on what it considers an appropriate size for itself. The composition of the Board is reviewed on an annual basis by the NC to ensure that the Board has the appropriate mix of expertise and experience.
All Directors possess years of corporate experience and are familiar with their duties and responsibilities as Directors. Upon the appointment of a Director, he will receive a formal letter setting out his key responsibilities and obligations as a member of the Board. In addition, newly appointed Directors are briefed by the Executive Chairman and/or the Group Chief Executive Officer and/or top management of the Company on the business activities of the Group and its strategic directions, as well as their duties as Directors. The Directors are also given briefings by professionals at Board meetings or at separate sessions on regulatory changes and updates which have an important impact on the Company and the Directors’ obligations to the Company.
The Company welcomes Directors to seek explanations or clarifications from and/or request for informal discussions with the Management on any aspect of the Group’s operations or business issues.
PEC ANNUAL REPORT 2016
20
C O R P O R AT E G O V E R N A N C E R E P O R T
The Company is responsible for arranging and funding the training for new and existing Directors. Directors are provided with updates in relevant areas such as new laws and regulations, Directors’ duties and responsibilities, corporate governance, changes in financial reporting standards and issues which have a direct impact on financial statements. The scope of such continuous updates also extends to include overview and developments in industry trends, governance practices and regulatory requirements pertaining to the business. Where necessary, a first-time Director who has no prior experience as a Director of a listed company will be provided with training in areas such as accounting, legal and industry-specific knowledge as appropriate.
Board Composition and Guidance
Principle 2: There should be a strong and independent element on the Board, which is able to exercise objective judgment on corporate affairs independently, in particular, from Management and 10% shareholders. No individual or small group of individuals should be allowed to dominate the Board’s decision making.
The Board comprises six (6) Directors, of whom three (3) are Non-Executive and Independent Directors. The list of Directors is as follows:
Executive Directors
Edna Ko Poh Thim (Executive Chairman)Robert Dompeling (Group Chief Executive Officer)Wong Peng (Managing Director)
Non-Executive and Independent Directors
Dr Foo Fatt Kah (Lead Independent Director)Chia Kim Huat (Independent Director)David Wong Cheong Fook (Independent Director)
The size and composition of the Board are reviewed on an annual basis by the NC to ensure that the size of the Board is optimal to facilitate effective deliberation and decision making. The NC is of the view that the current Board size of six (6) Directors of which three (3) are Independent Directors, is appropriate and effective, taking into account the nature and scope of the Company’s operations and the requirements of its business.
As a group, the current Board comprises Directors with diverse expertise and core competencies in areas such as accounting, legal, business and management, finance and risk management. The Directors’ objective judgment on corporate affairs and their collective experience and in-depth knowledge allow for the effective exchange of ideas and perspectives.
Independence of Directors
The NC reviews the independence of each Director on an annual basis based on the Code’s definition of what constitutes an Independent Director. The NC is of the view that the three (3) Independent Directors (representing more than one-third of the Board) are independent and that there is a strong and independent element on the Board, which enables the Board to exercise objective judgment on corporate matters independently, in particular, from the Management. No individual or small group of individuals dominate the Board’s decision making process.
PEC ANNUAL REPORT 2016
21
C O R P O R AT E G O V E R N A N C E R E P O R T
Upon taking into account the NC’s view, the Board considers all the Independent Directors of the Company to be independent in character and judgment and that there are no relationships which are likely to affect or could appear to affect the Directors’ judgment. The Code requires the independence of any Director who has served on the Board for more than nine years to be rigorously reviewed. There are no Independent Directors who have served the Board for more than nine years.
The Independent Directors communicate regularly to discuss issues such as the Group’s financial performance, corporate governance initiatives, Board processes, succession planning as well as leadership development and the remuneration of the Executive Directors.
Where necessary, the Company co-ordinates informal meetings for Independent Directors without the presence of the Management to review matters such as Board effectiveness and Management’s performance.
Chairman and Chief Executive Officer
Principle 3: There should be a clear division of responsibilities between the leadership of the Board and the executives responsible for managing the company’s business. No one individual should represent a considerable concentration of power.
The Chairman of the Board and the Group Chief Executive Officer (“CEO”) are separate individuals. The Chairman of the Board is Ms Edna Ko Poh Thim who is the spouse of Mr Robert Dompeling, the Group CEO of the Company. As the Executive Chairman, Ms Ko is responsible, among others, for the overall business strategy and development of the Group, the exercise of control over the quantity and quality aspects, as well as the timely flow of information between the Management and the Board. Ms Ko also sets the agendas for Board meetings and is actively involved in ensuring and promoting compliance with the Group’s corporate governance guidelines.
Ms Ko is assisted by the Group CEO, Mr Robert Dompeling, who with the Management comprising each subsidiary’s general managers and key senior managers, are responsible for the operational, commercial and financial management as well as charting the business development and expansion of the Group.
There is also a balance of power and authority in view that the Board Committees are chaired by the Independent Directors. The Board has appointed Dr. Foo Fatt Kah as the Lead Independent Director to be available to shareholders where they have concerns, and to coordinate any meetings among the Independent Directors.
All major decisions made by the Executive Chairman and Group CEO are reviewed by the AC. The NC reviews their performance and appointment periodically, whilst the RC reviews their remuneration packages periodically. As such, the Board believes that there are adequate safeguards in place to ensure that no one individual represents a considerable concentration of power. The separation of roles and clear division of responsibilities between the Executive Chairman and the Group CEO ensures a balance of power and increased accountability.
PEC ANNUAL REPORT 2016
22
C O R P O R AT E G O V E R N A N C E R E P O R T
Board Membership
Principle 4: There should be a formal and transparent process for the appointment and re-appointment of directors to the Board.
The NC comprises of entirely Non-Executive and Independent Directors:
Chia Kim Huat (Chairman) Dr Foo Fatt Kah David Wong Cheong Fook
The primary functions of the NC in accordance with its TORs are as follows, amongst others:
• to identify candidates and review all nominations for the appointment or re-appointment of members of the Board and the Group CEO, and to determine the selection criteria;
• to ensure that all Board appointees undergo an appropriate induction programme;
• to regularly review the Board structure, size, composition and balance, and make recommendations to the Board with regard to any adjustments that are deemed necessary and to review board succession plans;
• to identify gaps in the mix of skills, experience and other qualities required in an effective Board and to nominate or recommend suitable candidates to fill these gaps;
• to decide whether a Director is able to and has been adequately carrying out his duties as a Director of the Company, particularly where the Director has multiple board representations;
• to review and determine the independence of each Director annually;
• to decide how the Board’s, Board Committees’ and Directors’ performance are to be evaluated and to propose objective performance criteria for the Board’s approval; and
• to assess the effectiveness of the Board as a whole and the contribution by each individual Director to the effectiveness of the Board on an annual basis.
For the year under review, the NC held one (1) meeting.
As a matter of corporate governance, the Directors submit themselves for re-nomination and re-election at regular intervals. Under the Company’s Constitution, each Director shall retire from office at least once every three (3) years and a retiring Director shall be eligible for re-election. In reviewing and recommending to the Board on the re-nomination and re-election of existing Directors, the NC takes into consideration the Directors’ competencies, commitments, contribution and performance at Board meetings, including attendance, preparedness, participation and candour.
Each member of the NC abstains from making any recommendations and/or participating in any deliberation of the NC and from voting on any resolution, in respect of the assessment of his own performance or re-nomination as a Director of the Company.
PEC ANNUAL REPORT 2016
23
C O R P O R AT E G O V E R N A N C E R E P O R T
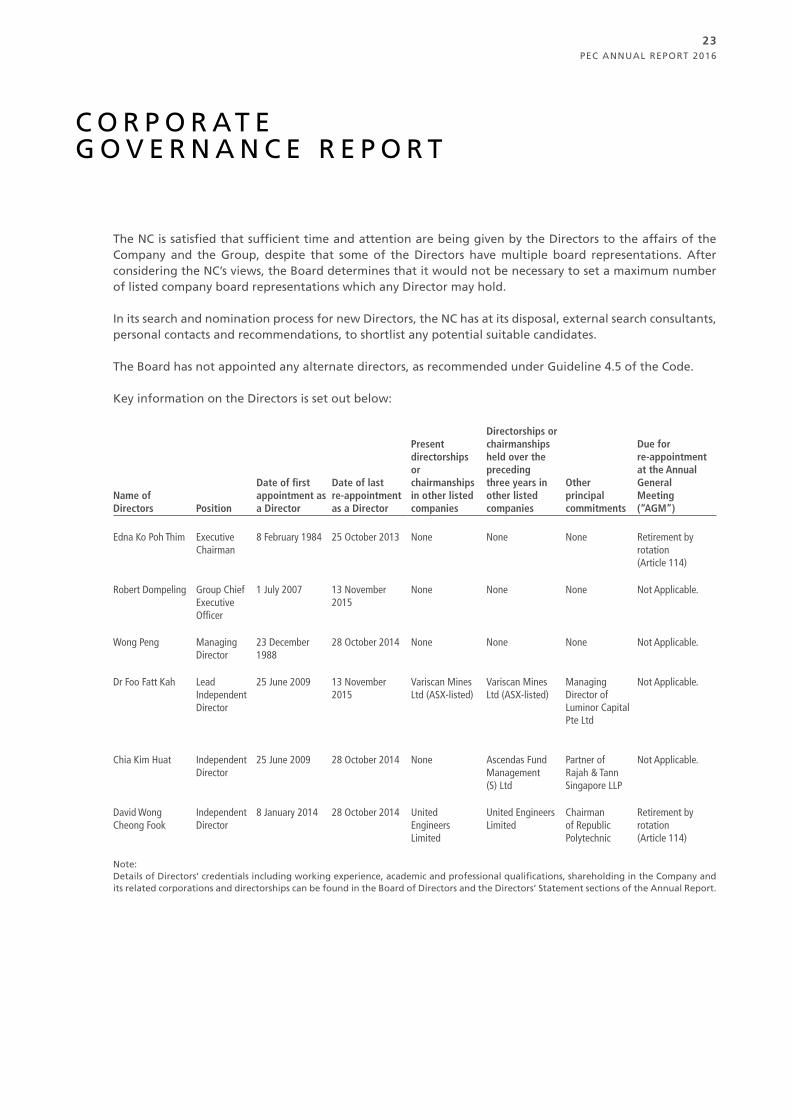
The NC is satisfied that sufficient time and attention are being given by the Directors to the affairs of the Company and the Group, despite that some of the Directors have multiple board representations. After considering the NC’s views, the Board determines that it would not be necessary to set a maximum number of listed company board representations which any Director may hold.
In its search and nomination process for new Directors, the NC has at its disposal, external search consultants, personal contacts and recommendations, to shortlist any potential suitable candidates.
The Board has not appointed any alternate directors, as recommended under Guideline 4.5 of the Code.
Key information on the Directors is set out below:
Name of Directors Position
Date of first appointment as a Director
Date of last re-appointment as a Director
Present directorships or chairmanships in other listed companies
Directorships or chairmanships held over the preceding three years in other listed companies
Other principal commitments
Due for re-appointment at the Annual General Meeting (“AGM”)
Edna Ko Poh Thim Executive Chairman
8 February 1984 25 October 2013 None None None Retirement by rotation (Article 114)
Robert Dompeling Group ChiefExecutive Officer
1 July 2007 13 November 2015
None None None Not Applicable.
Wong Peng Managing Director
23 December 1988
28 October 2014 None None None Not Applicable.
Dr Foo Fatt Kah Lead Independent Director
25 June 2009 13 November 2015
Variscan Mines Ltd (ASX-listed)
Variscan Mines Ltd (ASX-listed)
Managing Director of Luminor Capital Pte Ltd
Not Applicable.
Chia Kim Huat Independent Director
25 June 2009 28 October 2014 None Ascendas Fund Management (S) Ltd
Partner of Rajah & TannSingapore LLP
Not Applicable.
David Wong Cheong Fook
Independent Director
8 January 2014 28 October 2014 United Engineers Limited
United Engineers Limited
Chairman of Republic Polytechnic
Retirement by rotation (Article 114)
Note: Details of Directors’ credentials including working experience, academic and professional qualifications, shareholding in the Company and its related corporations and directorships can be found in the Board of Directors and the Directors’ Statement sections of the Annual Report.
PEC ANNUAL REPORT 2016
24
C O R P O R AT E G O V E R N A N C E R E P O R T
Board Performance
Principle 5: There should be a formal annual assessment of the effectiveness of the Board as a whole and its board committees and the contribution by each director to the effectiveness of the Board.
The NC reviews the Board’s performance evaluation criteria and proposes to the Board a set of objective performance criteria that allow for comparison with industry peers and address how long-term shareholder value is enhanced. Based on the recommendations of the NC, the Board has established processes for assessing the effectiveness of the Board as a whole, its Board Committees and the contribution by each individual Director to the effectiveness of the Board.
The performance criteria for the Board evaluation takes into account the size and composition of the Board and the Board Committees, the Board’s access to information, Board processes, Board accountability, Board performance in relation to discharging its principal functions and fiduciary duties, communication with the Management and standards of conduct of the Directors.
In the course of the year, the NC had conducted the assessment via a questionnaire which is completed by each Director. The Directors’ responses were then consolidated into a summary report which was discussed at the NC meeting with a view to implementing certain recommendations to further enhance the effectiveness of the Board. Each Director also completed a self-assessment form to assess each Director’s contributions to the Board’s effectiveness.
The Chairman would act on the results of the performance evaluation, and, in consultation with the NC, propose where appropriate, new members to be appointed to the Board or seek the resignation of Directors.
Access to Information
Principle 6: In order to fulfil their responsibilities, directors should be provided with complete, adequate and timely information prior to board meetings and on an on-going basis so as to enable them to make informed decisions to discharge their duties and responsibilities.
To assist the Board in fulfilling its responsibilities, the Management provides the Board with a management report containing complete, adequate and timely information prior to the Board meetings. All Directors have separate and independent access to the Management, including the Company Secretary at all times.
The Company Secretary and/or his representative attends all scheduled meetings of the Company and prepares the minutes of meetings. He is responsible for, among other things, ensuring that Board procedures are observed and that applicable rules and regulations are complied with.
The appointment and the removal of the Company Secretary are subject to the Board’s approval.
Changes to regulations are closely monitored by the Management and where such changes have an important bearing on the Company or the Directors’ disclosure obligations, the Directors are briefed during Board meetings.
The Directors and the Chairmen of the respective Board Committees, whether as a group or individually, are able to seek independent professional advice as and when necessary in furtherance of their duties, at the Company’s expense. The appointment of such professional advisors is subject to approval by the Board.
PEC ANNUAL REPORT 2016
25
C O R P O R AT E G O V E R N A N C E R E P O R T
(B) REMUNERATION MATTERS
Procedures for Developing Remuneration Policies
Principle 7: There should be a formal and transparent procedure for developing policy on executive remuneration and for fixing the remuneration packages of individual directors. No director should be involved in deciding his own remuneration.
The RC comprises of entirely Non-Executive and Independent Directors:
Dr Foo Fatt Kah (Chairman)Chia Kim HuatDavid Wong Cheong Fook
The members of the RC are equipped with many years of corporate experience and are knowledgeable in the field of executive compensation. The RC has access to expert professional advice on remuneration matters as and when necessary.
The responsibilities of the RC in accordance with its TORs include the following, amongst others:
• to review Directors’ fees to ensure that such fees are at acceptable competitive levels;
• to review and advise the Board on the terms of appointment and remuneration of its members, the Group CEO, key management personnel, senior management of the Group and all managerial staff who are related to any of the Directors or the Group CEO or substantial shareholders;
• to review the terms of the employment arrangements with the Management so as to develop consistent group wide employment practices subject to regional differences;
• to recommend to the Board in consultation with senior management and the Chairman of the Board, any long term incentive scheme; and
• to review and approve any proposals or recommendations relating to senior management’s remuneration.
The RC reviews the remuneration framework which covers all aspects of remuneration including but not limited to Directors’ fees, salaries, allowances, bonuses, share-based incentives and awards, and benefits-in-kind. The RC also reviews the Group’s obligations arising in the event of termination of the Executive Directors’ and key management personnel’s contracts of service, to ensure that such contracts of service contain fair and reasonable termination clauses which are not overly generous.
No Director is involved in determining his own remuneration.
For the year under review, the RC held one (1) meeting.
PEC ANNUAL REPORT 2016
26
C O R P O R AT E G O V E R N A N C E R E P O R T
Level and Mix of Remuneration
Principle 8: The level and structure of remuneration should be aligned with the long-term interest and risk policies of the company, and should be appropriate to attract, retain and motivate (a) the directors to provide good stewardship of the company, and (b) key management personnel to successfully manage the company. However, companies should avoid paying more than is necessary for this purpose.
In determining remuneration packages, the RC takes into consideration the prevailing economic situation, the pay and employment conditions within the industry and in comparable companies. As part of its review, the RC ensures that the performance-related component of remuneration forms a significant portion of the total remuneration package of Executive Directors and is designed to align the Directors’ interests with those of shareholders and link rewards to corporate and individual performance. The RC also reviews all matters concerning the remuneration of Non-Executive Directors to ensure that the remuneration commensurate with the contribution and responsibilities of such Directors. The Company submits the quantum of Directors’ fees of each year to the shareholders for approval at each AGM.
Non-Executive Directors have no service contracts. The Executive Directors have service contracts and they do not receive Directors’ fees for the year under review. In setting the remuneration packages of the Executive Directors, the Company takes into account the performance of the Group and that of the Executive Directors.
The Company adopted an employee share plan known as “PEC Performance Share Plan” (the “Plan”) on 25 October 2013 as a long term incentive plan for Executive Directors and employees of the Group whose services are vital to the Group’s well-being and success. It is administered by a committee consisting of all the Board Members. As at to-date, awards in respect of up to 7,792,208 shares have been granted under the Plan. Details of the Plan are set out in the Directors’ Statement on pages 35 to 37.
Disclosure on Remuneration
Principle 9: Each company should provide clear disclosure of its remuneration policies, level and mix of remuneration, and the procedure for setting remuneration, in the company’s Annual Report. It should provide disclosure in relation to its remuneration policies to enable investors to understand the link between remuneration paid to directors and key management personnel, and performance.
The annual reviews of the compensation are carried out by the RC to ensure that the remuneration of the Executive Directors and key management personnel commensurate with their performance and that of the Company, giving due regard to the financial and commercial health and business needs of the Group. The performance of the Group CEO (together with other key management personnel) is reviewed periodically by the RC and the Board.
The Independent Directors receive Directors’ fees in accordance with their level of contributions, taking into account factors such as effort and time spent, as well as the responsibilities and obligations of the Directors. The Company recognises the need to pay competitive fees to attract, motivate and retain Directors without being excessive and thereby maximise shareholders’ value. Directors’ fees are recommended by the Board for approval at the Company’s AGM.
Executive Directors do not receive Directors’ fees but are remunerated as members of the Management. Their remuneration package comprises a basic salary component and a variable component which is the annual bonus, based on the performance of the Group as a whole and their individual performance. Service contracts for Executive Directors, are for a fixed appointment period and do not contain onerous removal clauses.
The Company has an employee share plan in place.
PEC ANNUAL REPORT 2016
27
C O R P O R AT E G O V E R N A N C E R E P O R T
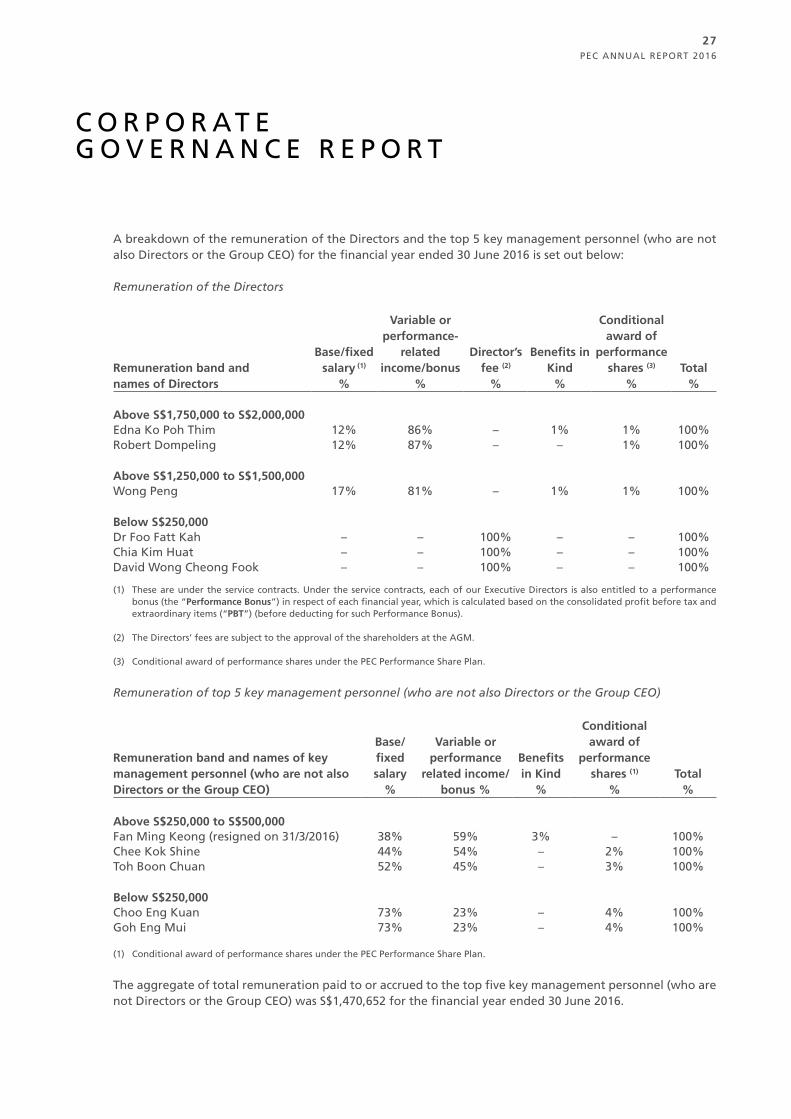
A breakdown of the remuneration of the Directors and the top 5 key management personnel (who are not also Directors or the Group CEO) for the financial year ended 30 June 2016 is set out below:
Remuneration of the Directors
Remuneration band and names of Directors
Base/fixed salary (1)
%
Variable or performance-
related income/bonus
%
Director’s fee (2)
%
Benefits in Kind
%
Conditional award of
performance shares (3)
%Total
%
Above S$1,750,000 to S$2,000,000Edna Ko Poh Thim 12% 86% – 1% 1% 100%Robert Dompeling 12% 87% – – 1% 100%
Above S$1,250,000 to S$1,500,000Wong Peng 17% 81% – 1% 1% 100%
Below S$250,000Dr Foo Fatt Kah – – 100% – – 100%Chia Kim Huat – – 100% – – 100%David Wong Cheong Fook – – 100% – – 100%
(1) These are under the service contracts. Under the service contracts, each of our Executive Directors is also entitled to a performance bonus (the “Performance Bonus”) in respect of each financial year, which is calculated based on the consolidated profit before tax and extraordinary items (“PBT”) (before deducting for such Performance Bonus).
(2) The Directors’ fees are subject to the approval of the shareholders at the AGM.
(3) Conditional award of performance shares under the PEC Performance Share Plan.
Remuneration of top 5 key management personnel (who are not also Directors or the Group CEO)
Remuneration band and names of key management personnel (who are not also Directors or the Group CEO)
Base/fixed salary
%
Variable or performance
related income/bonus %
Benefits in Kind
%
Conditional award of
performance shares (1)
%Total
%
Above S$250,000 to S$500,000Fan Ming Keong (resigned on 31/3/2016) 38% 59% 3% – 100%Chee Kok Shine 44% 54% – 2% 100%Toh Boon Chuan 52% 45% – 3% 100%
Below S$250,000Choo Eng Kuan 73% 23% – 4% 100%Goh Eng Mui 73% 23% – 4% 100%
(1) Conditional award of performance shares under the PEC Performance Share Plan.
The aggregate of total remuneration paid to or accrued to the top five key management personnel (who are not Directors or the Group CEO) was S$1,470,652 for the financial year ended 30 June 2016.

PEC ANNUAL REPORT 2016
28
C O R P O R AT E G O V E R N A N C E R E P O R T
There are no employees of the Group who are immediate family members of a Director or the Group CEO and whose remuneration exceeds S$50,000 during the financial year ended 30 June 2016.
To preserve confidentiality on the remuneration policies of the Company, the Board is of the view that it is in the best interest of the Company not to fully disclose the exact remuneration of each Director and key management personnel in the Annual Report.
(C) ACCOUNTABILITY AND AUDIT
Accountability
Principle 10: The Board should present a balanced and understandable assessment of the company’s performance, position and prospects.
The Board endeavors to ensure that the annual audited financial statements and quarterly announcements of the Group’s results present a balanced and understandable assessment of the Group’s performance, position and prospects. The Board embraces openness and transparency in the conduct of the Company’s affairs, whilst preserving the commercial interests of the Company. Financials and other price sensitive information are disseminated to shareholders through announcements via SGXNET.
The Board takes steps to ensure compliance with legislative and regulatory requirements.
The Management provides the Board with management accounts of the Group’s performance, position and prospect on a regular basis, and as the Board may require from time to time, to enable the Board to make a balanced and informed assessment of the Company’s position.
Risk Management and Internal Controls
Principle 11: The Board is responsible for the governance of risk. The Board should ensure that Management maintains a sound system of risk management and internal controls to safeguard shareholders’ interests and the company’s assets, and should determine the nature and extent of the significant risks which the Board is willing to take in achieving its strategic objectives.
The Board oversees the risk governance in the Company and is responsible for ensuring that the Management maintains a sound system of risk management and internal controls to safeguard shareholders’ interests and the assets of the Group. The Board and the AC, with the assistance of the internal auditors, have reviewed the adequacy of the Group’s internal controls, including financial, operational and compliance risks, as well as the Group’s information technology controls and risk management systems.
The Company’s internal auditors conduct an annual review on the adequacy and effectiveness of the Group’s material internal controls, including financial, operational, compliance and information technology controls, and risk management. This review is conducted by the Company’s internal auditors who presented their findings to the AC. As part of the external audit plan, the external auditors also review certain key accounting controls relating to financial reporting, covering only selected financial cycles and highlight material findings, if any, to the AC. The AC reviews the findings of both the internal and external auditors and the effectiveness of the actions taken by the Management on the recommendations made by the internal and external auditors in this respect.
PEC ANNUAL REPORT 2016
29
C O R P O R AT E G O V E R N A N C E R E P O R T
The Board has received written assurance from the Group CEO and the Director Finance that:
(a) the financial records of the Group have been properly maintained and the financial statements for the financial year ended 30 June 2016 give a true and fair view of the Group’s operations and finances; and
(b) the risk management and internal control systems in place within the Group are adequate and effective in addressing the material risks in the Group in its current business environment including material financial, operational, compliance and information technology risks.
The Group CEO and the Director Finance have obtained similar assurance from the business and corporate executive heads in the Group.
The Board notes that the system of internal controls provides reasonable, but not absolute, assurance that the Group will not be adversely affected by any event that could be reasonably foreseen as it strives to achieve its business objectives.
The Board and the AC wish to highlight that no system of internal controls can provide absolute assurance against the occurrence of material errors, poor judgment in decision-making, human error, losses, fraud or other irregularities.
Based on the reviews conducted by the Management and the internal auditor throughout the financial year, the statutory audit conducted by the external auditor, as well as the assurance from Executive Chairman and Director Finance, the Board with the concurrence of the AC, is of the opinion that the Group’s internal controls, addressing financial, operational and compliance risks, as well as the Group’s information technology control and risk management systems were adequate as at 30 June 2016.
The Board is considering setting up a risk management team to assist the Board in overseeing the governance of risk in the Group to ensure that Management maintains a sound system of risk management and internal controls to safeguard shareholders’ interests and the Group’s assets. Financial risks relating to the Group are set out in Note 41 to the financial statements of this annual report on pages 110 to 115.
Audit Committee
Principle 12: The Board should establish an Audit Committee with written terms of reference which clearly set out its authority and duties.
The AC comprises entirely Non-Executive and Independent Directors:
David Wong Cheong Fook (Chairman)Dr Foo Fatt Kah Chia Kim Huat
The AC, inter alia, oversees the quality and integrity of the accounting, auditing, internal controls and financial practices of the Group.
The Board is of the view that the AC members are appropriately qualified in that they have recent and relevant accounting or related financial management expertise and experience to discharge their responsibilities.
The AC comprises members who are experienced in finance, legal and business fields.
PEC ANNUAL REPORT 2016
30
C O R P O R AT E G O V E R N A N C E R E P O R T
The role of the AC is to assist the Board with discharging its responsibility to safeguard the Company’s assets, maintain adequate accounting records and develop and maintain effective systems of internal controls.
For the year under review, the AC held four (4) meetings with the Management and the external auditors, three (3) of which the internal auditors were present to discuss and review the following matters in accordance with its TORs, amongst others:
• the audit plans of the external and internal auditors of the Company, and their reports arising from the audit;
• the adequacy of the assistance and co-operation given by the Company’s Management to the external and internal auditors;
• the financial statements of the Company and the consolidated financial statements of the Group;
• the quarterly and annual announcements of the results of the Group before submission to the Board for approval;
• the adequacy and effectiveness of the Group’s internal controls addressing financial, operational, compliance and information technology risks and in respect of the management, business and service systems and practices;
• the adequacy and effectiveness of the Group’s internal audit function;
• the cost effectiveness, independence and objectivity of the external auditors;
• the approval of compensation to the external auditors;
• the nature and extent of non-audit services provided by the external auditors;
• the recommendation to the Board for the appointment or re-appointment of the external auditors of the Company;
• to report actions and minutes of the AC to the Board with such recommendations as the AC considers appropriate; and
• interested person transactions to ensure that the current procedures for monitoring of interested party transactions have been complied with.
In performing its functions, the AC:
• met once with the external auditors and internal auditors, without the presence of the Company’s Management, and reviewed the overall scope of the external audit, the internal audit and the assistance given by the Management to the auditors;
• has explicit authority to investigate any matter relating to the Group’s accounting, auditing, internal controls and financial practices brought to its attention with full access to records, resources and personnel to enable it to discharge its function properly; and
• has full access to and cooperation of the Management and full discretion to invite any Director or key management personnel to attend its meetings.
PEC ANNUAL REPORT 2016
31
C O R P O R AT E G O V E R N A N C E R E P O R T
The external and internal auditors have unrestricted access to the AC.
The AC has undertaken a review of the services, scope, independence and objectivity of the external auditors. Messrs Ernst & Young LLP, the external auditors of the Company, has confirmed that they are a public accounting firm registered with the Accounting & Corporate Regulatory Authority and has provided a confirmation of their independence to the AC. Having assessed the external auditors based on factors such as performance and quality of their audit partners and auditing team, their overall qualification and their independence status, the AC is satisfied that Rule 712 of the Listing Manual has been complied with and has recommended to the Board, the nomination of the external auditors for re-appointment at the forthcoming AGM. The Company has also complied with Rule 715 and Rule 716 of the Listing Manual in relation to its auditing firms.
The AC has undertaken a review of all the non-audit services provided by the external auditors during the year under review and is satisfied that such services would not, in the AC’s opinion, affect the independence of the external auditors. Details of the fees paid to the external auditors for the financial year ended 30 June 2016 are disclosed under Note 7 on page 67 of the Annual Report. The AC has recommended to the Board the re-appointment of Ernst & Young LLP as the external auditors of the Company at the forthcoming AGM.
The Company has in place a whistle-blowing policy endorsed by the AC, by which staff of the Group may, in confidence, raise concerns about possible improprieties in matters of financial reporting or other matters with the AC. The objective for such arrangement is to ensure independent investigation of such matters and the appropriate follow-up action.
Internal Audit
Principle 13: The company should establish an effective internal audit function that is adequately resourced and independent of the activities it audits.
The Group’s internal audit function is outsourced to Wensen Consulting Asia (S) Pte. Ltd. (“Wensen”), a professional accounting firm. Wensen assists the Group to review the adequacy of internal controls in its financial and operational systems and to provide recommendations to strengthen any weaknesses in its internal controls. Wensen reports to the AC on audit matters and reports administratively to the Executive Directors. The AC also reviews and approves the annual internal audit plans and resources to ensure that Wensen has the necessary resources to adequately perform its functions.
(D) COMMUNICATION WITH SHAREHOLDERS
Shareholder Rights
Principle 14: Companies should treat all shareholders fairly and equitably, and should recognise, protect and facilitate the exercise of shareholders’ rights, and continually review and update such governance arrangements.
The Company recognises the importance of maintaining transparency and accountability to its shareholders. The Board ensures that all the Company’s shareholders are treated equitably and the rights of all investors, including non-controlling shareholders, are protected.
The Company is committed to providing shareholders with adequate, timely and sufficient information pertaining to changes in the Group’s business which could have a material impact on the Company’s share price.
PEC ANNUAL REPORT 2016
32
C O R P O R AT E G O V E R N A N C E R E P O R T
The Company strongly encourages shareholder participation during the AGM which will be held in a convenient location in Singapore. Shareholders are able to proactively engage the Board and the Management on the Group’s business activities, financial performance and other business related matters.
Communication with Shareholders
Principle 15: Companies should actively engage their shareholders and put in place an investor relations policy to promote regular, effective and fair communication with shareholders.
The Company believes that a high standard of disclosure is key to raising the level of corporate governance. Quarterly results are published through the SGXNET, news releases and the Company’s website. All information of the Company’s new initiatives will first be disseminated via SGXNET followed by a news release, which is also available on the website.
The Company does not practise selective disclosure. Price sensitive information is publicly released and results and annual reports are announced or issued within the mandatory period and are available on the Company’s website. All shareholders of the Company receive the annual report and notice of AGM. The notice of AGM is also advertised in the newspapers.
The Company does not have a fixed dividend policy. The form, frequency and amount of dividends will depend on the Company’s earnings, general financial condition, results of operations, capital requirements, cash flow, general business condition, development plans and other factors as the Directors may deem appropriate. Notwithstanding the foregoing, any pay-out of dividends would be clearly communicated to shareholders via announcements released on SGXNET.
Conduct of Shareholder Meetings
Principle 16: Company should encourage greater shareholder participation at general meetings of shareholders, and allow shareholders the opportunity to communicate their views on various matters affecting the company.
The Company welcomes the views and/or comments of the shareholders on matters concerning the Company and encourages shareholders’ participation at AGMs. The chairmen of the AC, the NC and the RC of the Company will be present at the general meetings to answer questions from the shareholders. The external auditors will also be present to assist the Directors in addressing any relevant queries by shareholders.
Each item of special business included in the notice of the meeting is accompanied, where appropriate, by an explanation for the proposed resolution. Separate resolutions are proposed for substantially separate issues at the meeting.
The Company does not implement absentia voting methods such as voting via mail, e-mail or fax until security, integrity and other pertinent issues are satisfactorily resolved.
The Company Secretary, with the assistance of his representative, prepares minutes of shareholders’ meetings, which incorporates substantial comments or queries from shareholders and responses from the Board and the Management. These minutes are available to shareholders upon their request.

PEC ANNUAL REPORT 2016
33
C O R P O R AT E G O V E R N A N C E R E P O R T
(E) DEALINGS IN SECURITIES
The Company has issued a guideline on share dealings to its Directors and officers (including employees with access to price sensitive information on the Company’s shares) of the Group which sets out the code of conduct on transactions in the Company’s shares by these persons, the implications of insider trading and general guidance on such dealings.
In line with Rule 1207(19) of the Listing Manual, the Company issues a notification to its Directors and officers of the Company informing them that they should not deal in the securities of the Company during the periods commencing one month before the announcement of the Company’s full-year results and two weeks before the Company’s quarterly results until after the announcement. They are also discouraged from dealing in the Company’s shares on short term considerations.
The Board confirms that for the financial year ended 30 June 2016, the Company has complied with Rule 1207(19) of the Listing Manual.
(F) INTERESTED PERSON TRANSACTIONS
The aggregate value of the interested person transactions carried out during the financial year ended 30 June 2016 is as follows:
Name of Interested person
Aggregate value of all interested person transactions during the financial period under review (excluding transactions less
than $100,000 and transactions conducted under Shareholders’ Mandate pursuant to Rule 920)
Aggregate value of all interested person
transactions conducted under Shareholders’
Mandate pursuant to Rule 920 (excluding transactions
less than $100,000)S$’000 S$’000
Tian San Company (Pte.) Limited 254 NA
(G) MATERIAL CONTRACTS
Except as disclosed in Note 38 (Related Party Transactions) of the notes to the financial statements, there were no other material contracts of the Company and its subsidiaries involving the interests of the Group CEO or each Director or controlling shareholder, either still subsisting at the end of the financial year or if not then subsisting, entered into since the end of the previous financial year.
PEC ANNUAL REPORT 2016
34
The directors are pleased to present their statement to the members together with the audited consolidated financial statements of PEC Ltd. (the “Company”) and its subsidiaries (collectively, the “Group”) and the balance sheet of the Company for the financial year ended 30 June 2016.
OPINION OF THE DIRECTORS
In the opinion of the directors,
(i) the consolidated financial statements of the Group and the balance sheet of the Company are drawn up so as to give a true and fair view of the financial position of the Group and of the Company as at 30 June 2016 and the financial performance, changes in equity and cash flows of the Group for the year ended on that date, and
(ii) at the date of this statement, there are reasonable grounds to believe that the Company will be able to pay its debts as and when they fall due.
DIRECTORS
The directors of the Company in office at the date of this report are:
Edna Ko Poh Thim Robert Dompeling Wong PengDr Foo Fatt KahChia Kim HuatDavid Wong Cheong Fook
ARRANGEMENTS TO ENABLE DIRECTORS TO ACQUIRE SHARES AND DEBENTURES
Except as described below, neither at the end of nor at any time during the financial year was the Company a party to any arrangement whose objects are, or one of whose objects is, to enable the directors of the Company to acquire benefits by means of the acquisition of shares or debentures of the Company or any other body corporate.
D I R E C T O R S ’ S T AT E M E N T
PEC ANNUAL REPORT 2016
35
DIRECTORS’ INTERESTS IN SHARES AND DEBENTURES
The following directors, who held office at the end of the financial year, had, according to the register of directors’ shareholdings, required to be kept under section 164 of the Singapore Companies Act, Chapter 50, an interest in shares of the Company and related corporations (other than wholly-owned subsidiaries) as stated below:
Direct interest Deemed interest
Name of directorAt the beginning of financial year
At the end of financial year
At the beginning of financial year
At the end of financial year
Ordinary shares of the CompanyEdna Ko Poh Thim* 34,950,000 34,950,000 85,750,000 85,750,000Robert Dompeling* 670,000 670,000 – –Wong Peng* 4,975,000 4,975,000 – –Chia Kim Huat 50,000 50,000 – –David Wong Cheong Fook 20,000 20,000 – –
* The Executive Directors were granted conditional award of performance shares of up to 282,212 each under the PEC Performance Share Plan.
There was no change in any of the above-mentioned interests in the Company between the end of the financial year and 21 July 2016.
Except as disclosed in this report, no other director who held office at the end of the financial year had interests in shares, share options, warrants or debentures of the Company, or of related corporations, either at the beginning of the financial year or at the end of the financial year.
By virtue of Ms. Edna Ko’s interest of not less than 20% of the issued share capital of the Company, she is deemed to have an interest in the shares of all subsidiaries of the Company.
PEC PERFORMANCE SHARE PLAN (THE “PLAN”)
(Unless otherwise defined herein capitalised terms shall have the meanings ascribed in the circular to shareholders dated 9 October 2013).
The Plan was approved at an Extraordinary General Meeting (“EGM”) held on 25 October 2013, for granting awards to eligible full-time employees and Executive Directors. The Plan replaced the PEC Employee Share Option Scheme which had been terminated at the same EGM.
Principal Terms of the Plan
Eligibility
The following persons shall be eligible to participate in the Plan subject to the absolute sole discretion of the Committee:
(a) full time employees who are confirmed in their employment with the Company or any subsidiary as at 30 June of the financial year prior to the Award Date and have been with the Company or its subsidiary for at least twelve (12) Months or such shorter period as the Committee may determine on or prior to the Award Date; and
(b) Executive Directors,
D I R E C T O R S ’ S T AT E M E N T
PEC ANNUAL REPORT 2016
36
PEC PERFORMANCE SHARE PLAN (THE “PLAN”) (CONT’D)
Principal Terms of the Plan (cont’d)
provided always that any of the aforesaid persons:
(i) have attained the age of twenty-one (21) years on or before the Award Date; and
(ii) are not undischarged bankrupts.
Subject to the separate approval by independent Shareholders for their participation in the Plan, Controlling Shareholders and their Associates within the above categories are eligible to participate in the Plan.
Awards
Awards represent the right of a Participant to receive fully paid Shares, free of charge, upon the satisfaction of the prescribed Performance Conditions within the Performance Period. Participants will be granted an Award, under which Shares will be Vested and Released at the end of the Performance Period once the Committee is, at its sole discretion, satisfied that the Performance Conditions have been achieved.
Grant of Awards
Under the rules of the Plan, there are no fixed periods for the grant of Awards. As such, offers for the Awards may be made at any time from time to time at the discretion of the Committee. In considering an award to be granted to a Participant, the Committee may take into account, inter alia, the Participant’s rank, job performance, seniority, creativity, innovativeness, entrepreneurship, potential for future development, length of service, contribution to the success and development of the Group and if applicable, the extent of effort and resourcefulness required to achieve the Performance Conditions within the Performance Period.
Vesting of Awards
Awards will typically vest only after the satisfactory completion of the Performance Conditions within the Performance Period. No minimum vesting periods are prescribed under the Plan, and the length of the vesting period(s) in respect of each Award will be determined by the Committee on a case-by-case basis.
Size of the Plan
The aggregate number of Shares to be delivered pursuant to the Vesting of the Awards on any date, when added to the number of Shares issued and issuable in respect of such other Shares issued and/or issuable under such other share-based incentive schemes of the Company, shall not exceed fifteen per cent (15%) of the total issued share capital excluding treasury shares of the Company on the day preceding the relevant Award Date.
The aggregate number of Shares available to eligible Controlling Shareholders and their Associates under the Plan shall not exceed twenty five per cent (25%) of the Shares available under the Plan. In addition, the aggregate number of Shares available to each Controlling Shareholder or his Associates shall not exceed ten per cent (10%) of the Shares available under the Plan.
D I R E C T O R S ’ S T AT E M E N T
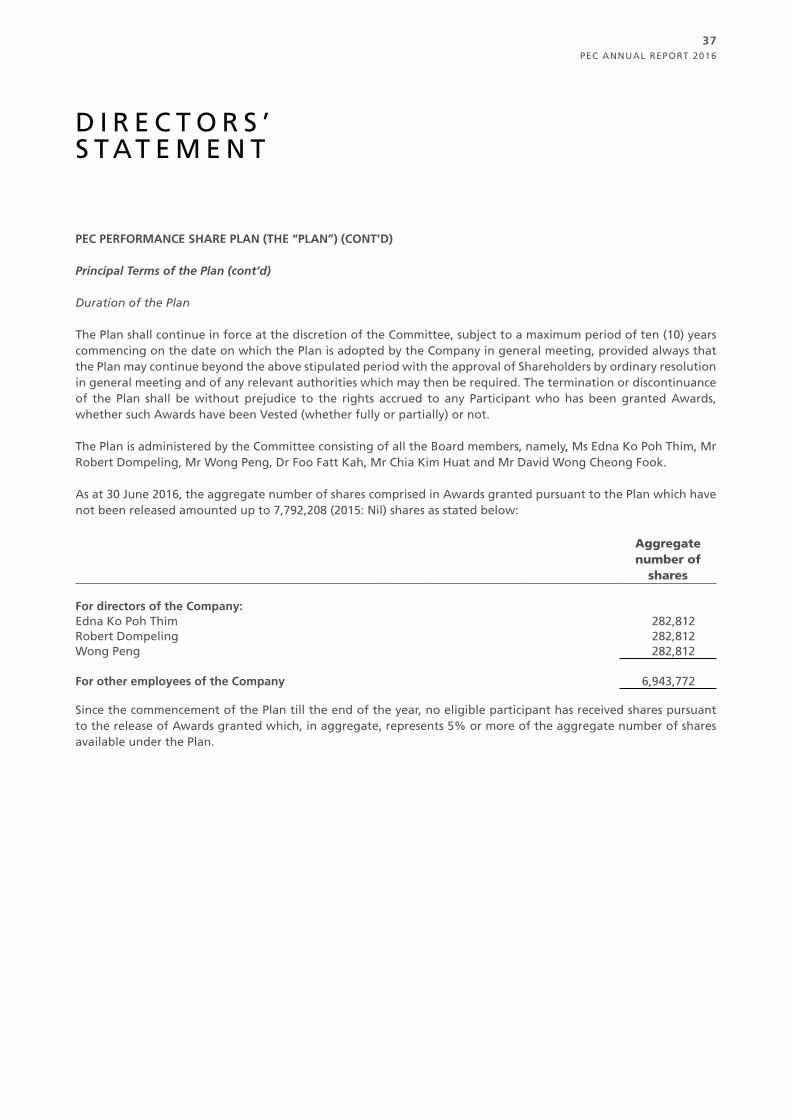
PEC ANNUAL REPORT 2016
37
PEC PERFORMANCE SHARE PLAN (THE “PLAN”) (CONT’D)
Principal Terms of the Plan (cont’d)
Duration of the Plan
The Plan shall continue in force at the discretion of the Committee, subject to a maximum period of ten (10) years commencing on the date on which the Plan is adopted by the Company in general meeting, provided always that the Plan may continue beyond the above stipulated period with the approval of Shareholders by ordinary resolution in general meeting and of any relevant authorities which may then be required. The termination or discontinuance of the Plan shall be without prejudice to the rights accrued to any Participant who has been granted Awards, whether such Awards have been Vested (whether fully or partially) or not.
The Plan is administered by the Committee consisting of all the Board members, namely, Ms Edna Ko Poh Thim, Mr Robert Dompeling, Mr Wong Peng, Dr Foo Fatt Kah, Mr Chia Kim Huat and Mr David Wong Cheong Fook.
As at 30 June 2016, the aggregate number of shares comprised in Awards granted pursuant to the Plan which have not been released amounted up to 7,792,208 (2015: Nil) shares as stated below:
Aggregate number of
shares
For directors of the Company:Edna Ko Poh Thim 282,812Robert Dompeling 282,812Wong Peng 282,812
For other employees of the Company 6,943,772
Since the commencement of the Plan till the end of the year, no eligible participant has received shares pursuant to the release of Awards granted which, in aggregate, represents 5% or more of the aggregate number of shares available under the Plan.
D I R E C T O R S ’ S T AT E M E N T
PEC ANNUAL REPORT 2016
38
AUDIT COMMITTEE
The Audit Committee comprises entirely non-executive independent directors, namely, Mr David Wong Cheong Fook (Chairman), Mr Chia Kim Huat and Dr Foo Fatt Kah. The Audit Committee has performed the primary functions in accordance with section 201B (5) of the Singapore Companies Act, Chapter 50, details of which appeared in the Corporate Governance Report.
AUDITOR
Ernst & Young LLP have expressed their willingness to accept re-appointment as auditor.
On behalf of the board of directors,
Edna Ko Poh ThimDirector
Wong PengDirector
Singapore23 September 2016
D I R E C T O R S ’ S T AT E M E N T
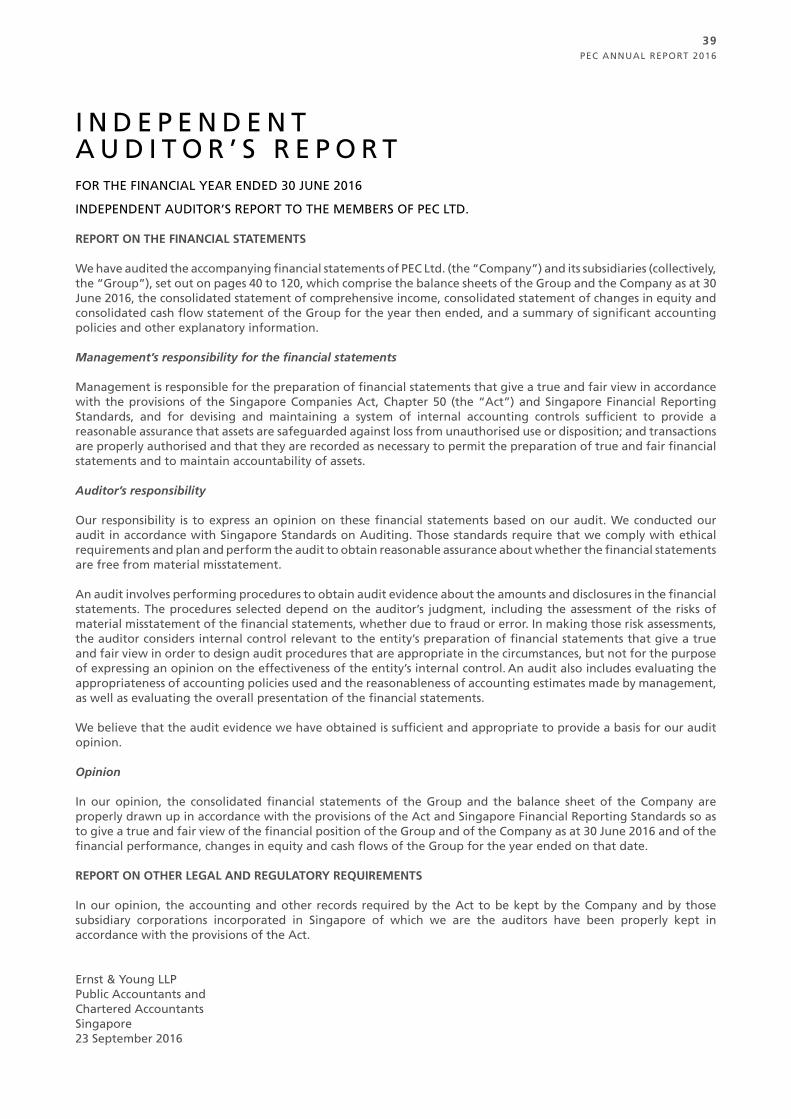
PEC ANNUAL REPORT 2016
39
REPORT ON THE FINANCIAL STATEMENTS
We have audited the accompanying financial statements of PEC Ltd. (the “Company”) and its subsidiaries (collectively, the “Group”), set out on pages 40 to 120, which comprise the balance sheets of the Group and the Company as at 30 June 2016, the consolidated statement of comprehensive income, consolidated statement of changes in equity and consolidated cash flow statement of the Group for the year then ended, and a summary of significant accounting policies and other explanatory information.
Management’s responsibility for the financial statements
Management is responsible for the preparation of financial statements that give a true and fair view in accordance with the provisions of the Singapore Companies Act, Chapter 50 (the “Act”) and Singapore Financial Reporting Standards, and for devising and maintaining a system of internal accounting controls sufficient to provide a reasonable assurance that assets are safeguarded against loss from unauthorised use or disposition; and transactions are properly authorised and that they are recorded as necessary to permit the preparation of true and fair financial statements and to maintain accountability of assets.
Auditor’s responsibility
Our responsibility is to express an opinion on these financial statements based on our audit. We conducted our audit in accordance with Singapore Standards on Auditing. Those standards require that we comply with ethical requirements and plan and perform the audit to obtain reasonable assurance about whether the financial statements are free from material misstatement.
An audit involves performing procedures to obtain audit evidence about the amounts and disclosures in the financial statements. The procedures selected depend on the auditor’s judgment, including the assessment of the risks of material misstatement of the financial statements, whether due to fraud or error. In making those risk assessments, the auditor considers internal control relevant to the entity’s preparation of financial statements that give a true and fair view in order to design audit procedures that are appropriate in the circumstances, but not for the purpose of expressing an opinion on the effectiveness of the entity’s internal control. An audit also includes evaluating the appropriateness of accounting policies used and the reasonableness of accounting estimates made by management, as well as evaluating the overall presentation of the financial statements.
We believe that the audit evidence we have obtained is sufficient and appropriate to provide a basis for our audit opinion.
Opinion
In our opinion, the consolidated financial statements of the Group and the balance sheet of the Company are properly drawn up in accordance with the provisions of the Act and Singapore Financial Reporting Standards so as to give a true and fair view of the financial position of the Group and of the Company as at 30 June 2016 and of the financial performance, changes in equity and cash flows of the Group for the year ended on that date.
REPORT ON OTHER LEGAL AND REGULATORY REQUIREMENTS
In our opinion, the accounting and other records required by the Act to be kept by the Company and by those subsidiary corporations incorporated in Singapore of which we are the auditors have been properly kept in accordance with the provisions of the Act.
Ernst & Young LLPPublic Accountants andChartered AccountantsSingapore23 September 2016
I N D E P E N D E N T A U D I T O R ’ S R E P O R T FOR THE FINANCIAL YEAR ENDED 30 JUNE 2016
INDEPENDENT AUDITOR’S REPORT TO THE MEMBERS OF PEC LTD.
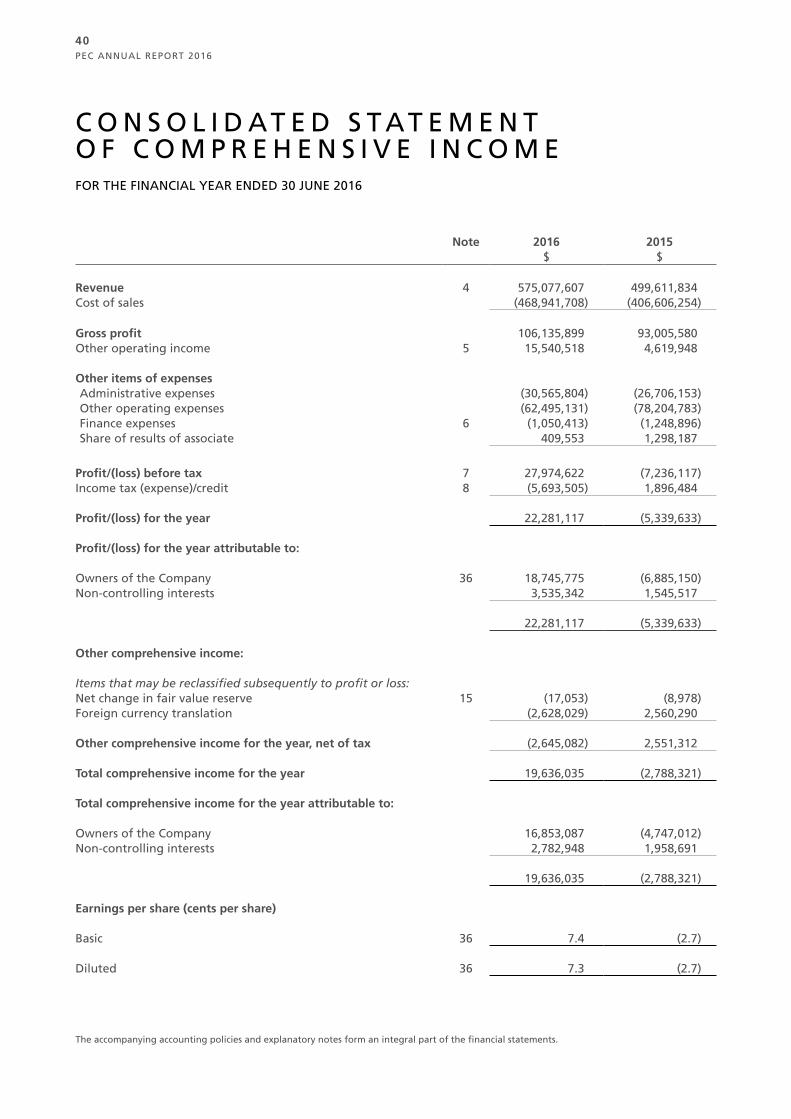
PEC ANNUAL REPORT 2016
40
Note 2016 2015$ $
Revenue 4 575,077,607 499,611,834Cost of sales (468,941,708) (406,606,254)
Gross profit 106,135,899 93,005,580Other operating income 5 15,540,518 4,619,948
Other items of expensesAdministrative expenses (30,565,804) (26,706,153)Other operating expenses (62,495,131) (78,204,783)Finance expenses 6 (1,050,413) (1,248,896)Share of results of associate 409,553 1,298,187
Profit/(loss) before tax 7 27,974,622 (7,236,117)Income tax (expense)/credit 8 (5,693,505) 1,896,484
Profit/(loss) for the year 22,281,117 (5,339,633)
Profit/(loss) for the year attributable to:
Owners of the Company 36 18,745,775 (6,885,150)Non-controlling interests 3,535,342 1,545,517
22,281,117 (5,339,633)
Other comprehensive income:
Items that may be reclassified subsequently to profit or loss: Net change in fair value reserve 15 (17,053) (8,978)Foreign currency translation (2,628,029) 2,560,290
Other comprehensive income for the year, net of tax (2,645,082) 2,551,312
Total comprehensive income for the year 19,636,035 (2,788,321)
Total comprehensive income for the year attributable to:
Owners of the Company 16,853,087 (4,747,012)Non-controlling interests 2,782,948 1,958,691
19,636,035 (2,788,321)
Earnings per share (cents per share)
Basic 36 7.4 (2.7)
Diluted 36 7.3 (2.7)
The accompanying accounting policies and explanatory notes form an integral part of the financial statements.
C O N S O L I D AT E D S T AT E M E N T O F C O M P R E H E N S I V E I N C O M EFOR THE FINANCIAL YEAR ENDED 30 JUNE 2016
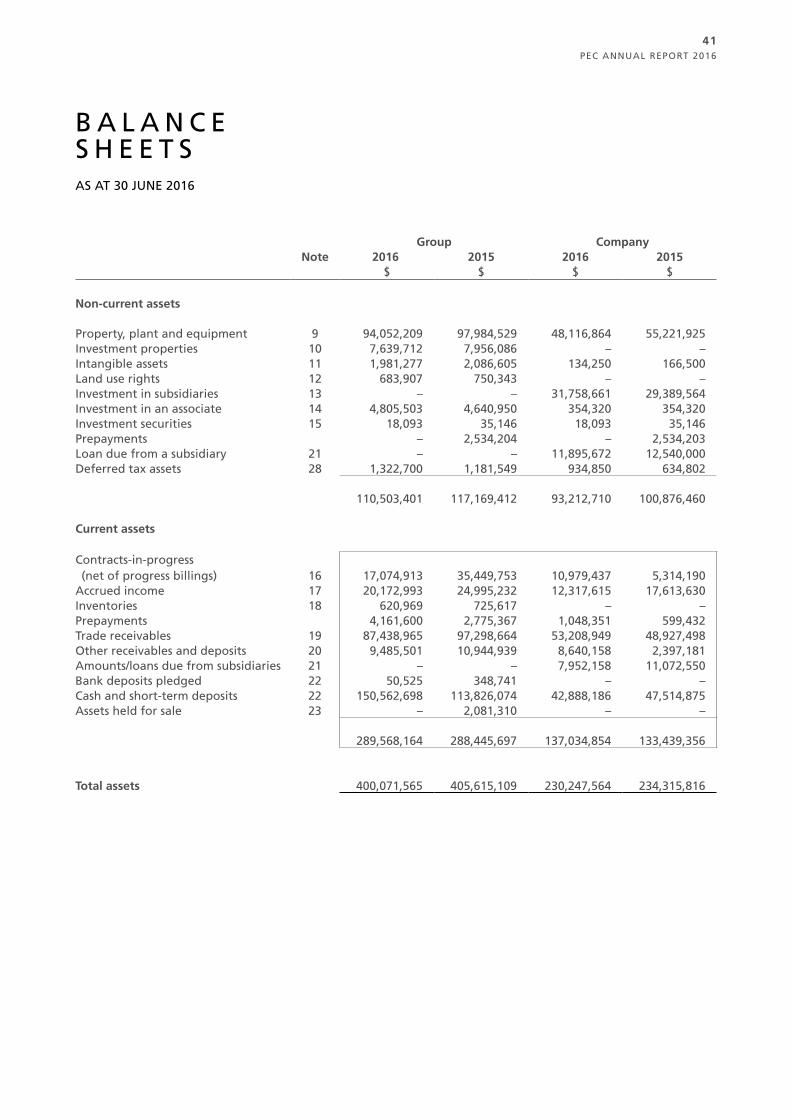
PEC ANNUAL REPORT 2016
41
Group CompanyNote 2016 2015 2016 2015
$ $ $ $
Non-current assets
Property, plant and equipment 9 94,052,209 97,984,529 48,116,864 55,221,925Investment properties 10 7,639,712 7,956,086 – –Intangible assets 11 1,981,277 2,086,605 134,250 166,500Land use rights 12 683,907 750,343 – –Investment in subsidiaries 13 – – 31,758,661 29,389,564Investment in an associate 14 4,805,503 4,640,950 354,320 354,320Investment securities 15 18,093 35,146 18,093 35,146Prepayments – 2,534,204 – 2,534,203Loan due from a subsidiary 21 – – 11,895,672 12,540,000Deferred tax assets 28 1,322,700 1,181,549 934,850 634,802
110,503,401 117,169,412 93,212,710 100,876,460
Current assets
Contracts-in-progress (net of progress billings) 16 17,074,913 35,449,753 10,979,437 5,314,190
Accrued income 17 20,172,993 24,995,232 12,317,615 17,613,630Inventories 18 620,969 725,617 – –Prepayments 4,161,600 2,775,367 1,048,351 599,432Trade receivables 19 87,438,965 97,298,664 53,208,949 48,927,498Other receivables and deposits 20 9,485,501 10,944,939 8,640,158 2,397,181Amounts/loans due from subsidiaries 21 – – 7,952,158 11,072,550Bank deposits pledged 22 50,525 348,741 – –Cash and short-term deposits 22 150,562,698 113,826,074 42,888,186 47,514,875Assets held for sale 23 – 2,081,310 – –
289,568,164 288,445,697 137,034,854 133,439,356
Total assets 400,071,565 405,615,109 230,247,564 234,315,816
B A L A N C E S H E E T SAS AT 30 JUNE 2016
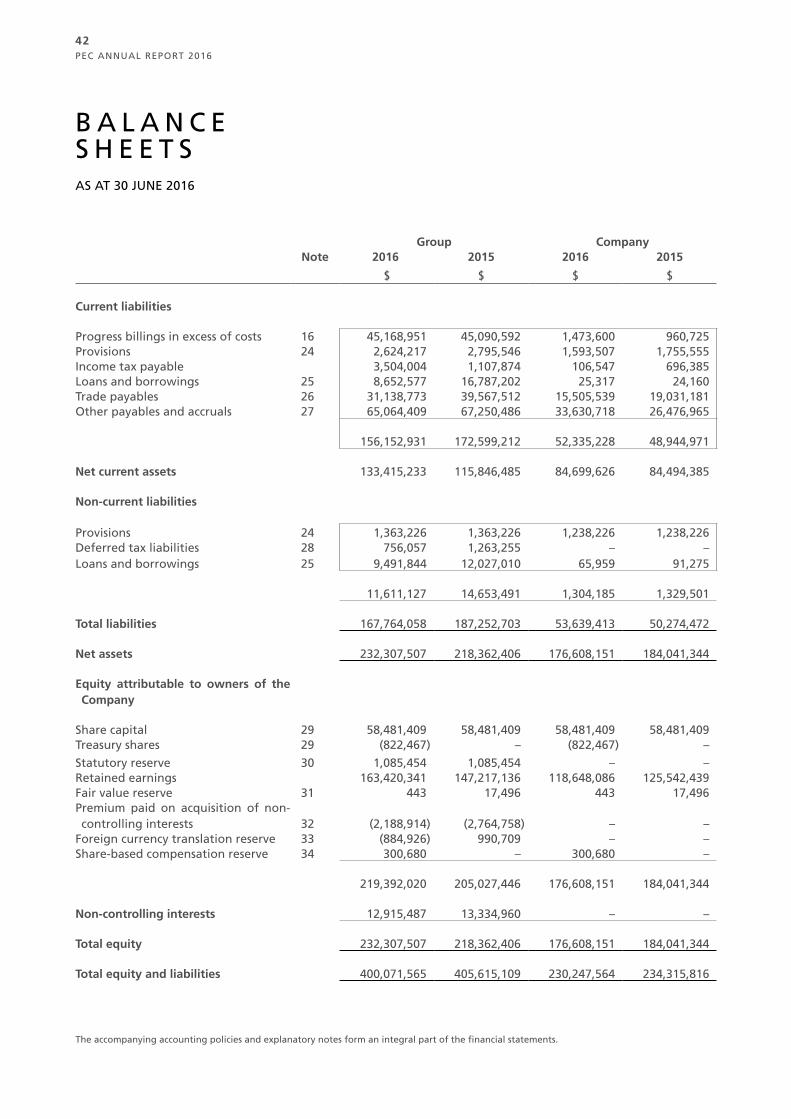
PEC ANNUAL REPORT 2016
42
Group CompanyNote 2016 2015 2016 2015
$ $ $ $
Current liabilities
Progress billings in excess of costs 16 45,168,951 45,090,592 1,473,600 960,725Provisions 24 2,624,217 2,795,546 1,593,507 1,755,555Income tax payable 3,504,004 1,107,874 106,547 696,385Loans and borrowings 25 8,652,577 16,787,202 25,317 24,160Trade payables 26 31,138,773 39,567,512 15,505,539 19,031,181Other payables and accruals 27 65,064,409 67,250,486 33,630,718 26,476,965
156,152,931 172,599,212 52,335,228 48,944,971
Net current assets 133,415,233 115,846,485 84,699,626 84,494,385
Non-current liabilities
Provisions 24 1,363,226 1,363,226 1,238,226 1,238,226Deferred tax liabilities 28 756,057 1,263,255 – –Loans and borrowings 25 9,491,844 12,027,010 65,959 91,275
11,611,127 14,653,491 1,304,185 1,329,501
Total liabilities 167,764,058 187,252,703 53,639,413 50,274,472
Net assets 232,307,507 218,362,406 176,608,151 184,041,344
Equity attributable to owners of the Company
Share capital 29 58,481,409 58,481,409 58,481,409 58,481,409Treasury shares 29 (822,467) – (822,467) –Statutory reserve 30 1,085,454 1,085,454 – –Retained earnings 163,420,341 147,217,136 118,648,086 125,542,439Fair value reserve 31 443 17,496 443 17,496Premium paid on acquisition of non-controlling interests 32 (2,188,914) (2,764,758) – –
Foreign currency translation reserve 33 (884,926) 990,709 – –Share-based compensation reserve 34 300,680 – 300,680 –
219,392,020 205,027,446 176,608,151 184,041,344
Non-controlling interests 12,915,487 13,334,960 – –
Total equity 232,307,507 218,362,406 176,608,151 184,041,344
Total equity and liabilities 400,071,565 405,615,109 230,247,564 234,315,816
The accompanying accounting policies and explanatory notes form an integral part of the financial statements.
B A L A N C E S H E E T SAS AT 30 JUNE 2016
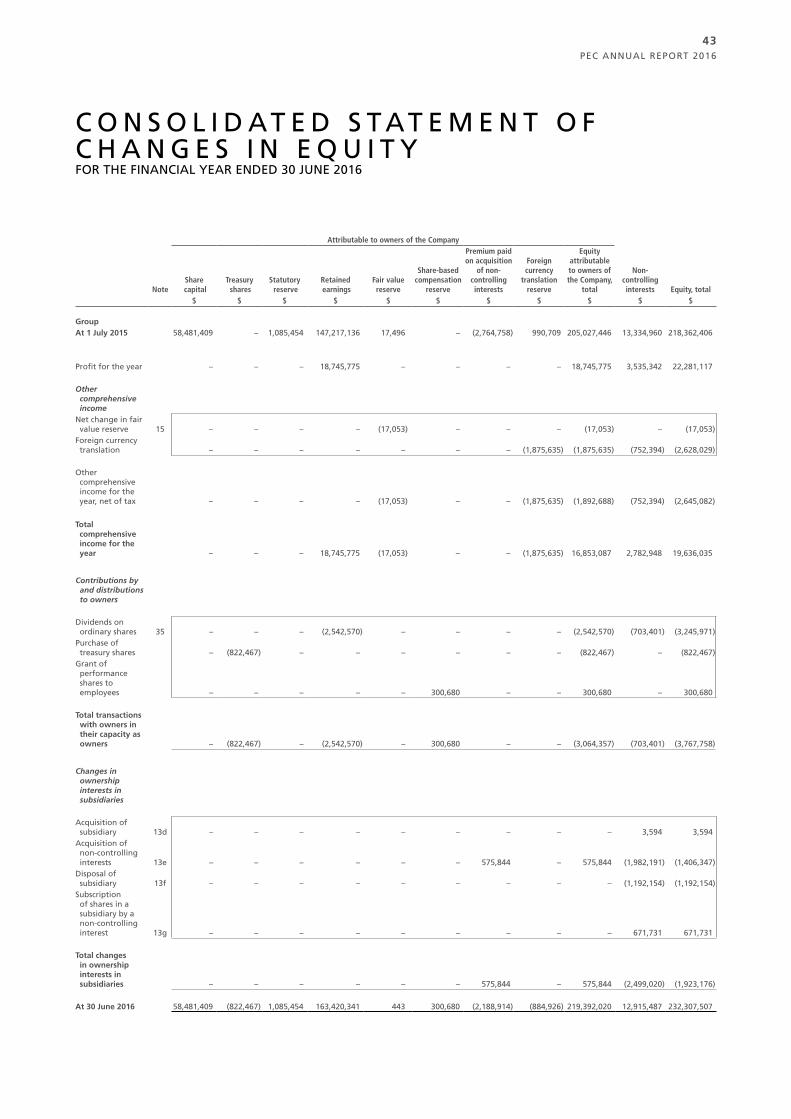
PEC ANNUAL REPORT 2016
43
Attributable to owners of the Company
NoteShare
capitalTreasury shares
Statutory reserve
Retained earnings
Fair value reserve
Share-based compensation
reserve
Premium paid on acquisition
of non-controlling interests
Foreign currency
translation reserve
Equity attributable to owners of the Company,
total
Non-controlling interests Equity, total
$ $ $ $ $ $ $ $ $ $ $
GroupAt 1 July 2015 58,481,409 – 1,085,454 147,217,136 17,496 – (2,764,758) 990,709 205,027,446 13,334,960 218,362,406
Profit for the year – – – 18,745,775 – – – – 18,745,775 3,535,342 22,281,117
Other comprehensive income
Net change in fair value reserve 15 – – – – (17,053) – – – (17,053) – (17,053)
Foreign currency translation – – – – – – – (1,875,635) (1,875,635) (752,394) (2,628,029)
Other comprehensive income for the year, net of tax – – – – (17,053) – – (1,875,635) (1,892,688) (752,394) (2,645,082)
Total comprehensive income for the year – – – 18,745,775 (17,053) – – (1,875,635) 16,853,087 2,782,948 19,636,035
Contributions by and distributions to owners
Dividends on ordinary shares 35 – – – (2,542,570) – – – – (2,542,570) (703,401) (3,245,971)
Purchase of treasury shares – (822,467) – – – – – – (822,467) – (822,467)
Grant of performance shares to employees – – – – – 300,680 – – 300,680 – 300,680
Total transactions with owners in their capacity as owners – (822,467) – (2,542,570) – 300,680 – – (3,064,357) (703,401) (3,767,758)
Changes in ownership interests in subsidiaries
Acquisition of subsidiary 13d – – – – – – – – – 3,594 3,594
Acquisition of non-controlling interests 13e – – – – – – 575,844 – 575,844 (1,982,191) (1,406,347)
Disposal of subsidiary 13f – – – – – – – – – (1,192,154) (1,192,154)
Subscription of shares in a subsidiary by a non-controlling interest 13g – – – – – – – – – 671,731 671,731
Total changes in ownership interests in subsidiaries – – – – – – 575,844 – 575,844 (2,499,020) (1,923,176)
At 30 June 2016 58,481,409 (822,467) 1,085,454 163,420,341 443 300,680 (2,188,914) (884,926) 219,392,020 12,915,487 232,307,507
C O N S O L I D AT E D S T AT E M E N T O F C H A N G E S I N E Q U I T YFOR THE FINANCIAL YEAR ENDED 30 JUNE 2016
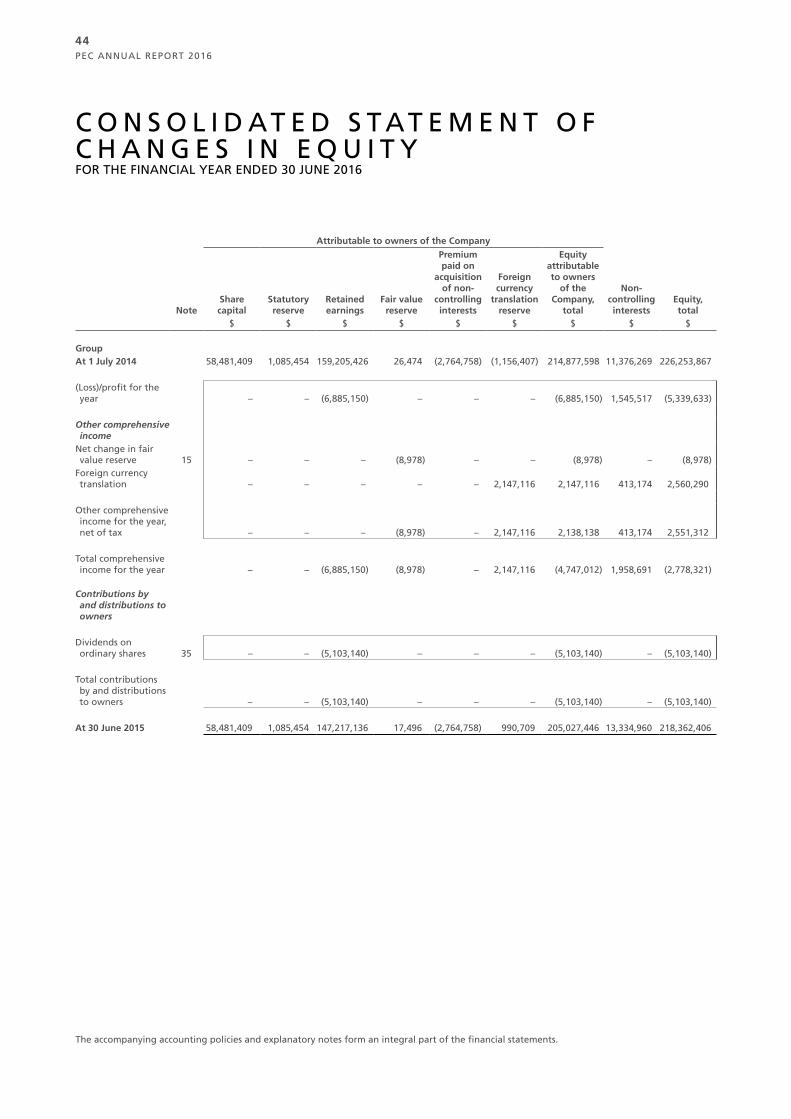
PEC ANNUAL REPORT 2016
44
Attributable to owners of the Company
NoteShare capital
Statutory reserve
Retained earnings
Fair value reserve
Premium paid on
acquisition of non-
controlling interests
Foreign currency
translation reserve
Equity attributable to owners
of the Company,
total
Non-controlling interests
Equity, total
$ $ $ $ $ $ $ $ $
GroupAt 1 July 2014 58,481,409 1,085,454 159,205,426 26,474 (2,764,758) (1,156,407) 214,877,598 11,376,269 226,253,867
(Loss)/profit for the year – – (6,885,150) – – – (6,885,150) 1,545,517 (5,339,633)
Other comprehensive income
Net change in fair value reserve 15 – – – (8,978) – – (8,978) – (8,978)
Foreign currency translation – – – – – 2,147,116 2,147,116 413,174 2,560,290
Other comprehensive income for the year, net of tax – – – (8,978) – 2,147,116 2,138,138 413,174 2,551,312
Total comprehensive income for the year – – (6,885,150) (8,978) – 2,147,116 (4,747,012) 1,958,691 (2,778,321)
Contributions by and distributions to owners
Dividends on ordinary shares 35 – – (5,103,140) – – – (5,103,140) – (5,103,140)
Total contributions by and distributions to owners – – (5,103,140) – – – (5,103,140) – (5,103,140)
At 30 June 2015 58,481,409 1,085,454 147,217,136 17,496 (2,764,758) 990,709 205,027,446 13,334,960 218,362,406
C O N S O L I D AT E D S T AT E M E N T O F C H A N G E S I N E Q U I T YFOR THE FINANCIAL YEAR ENDED 30 JUNE 2016
The accompanying accounting policies and explanatory notes form an integral part of the financial statements.
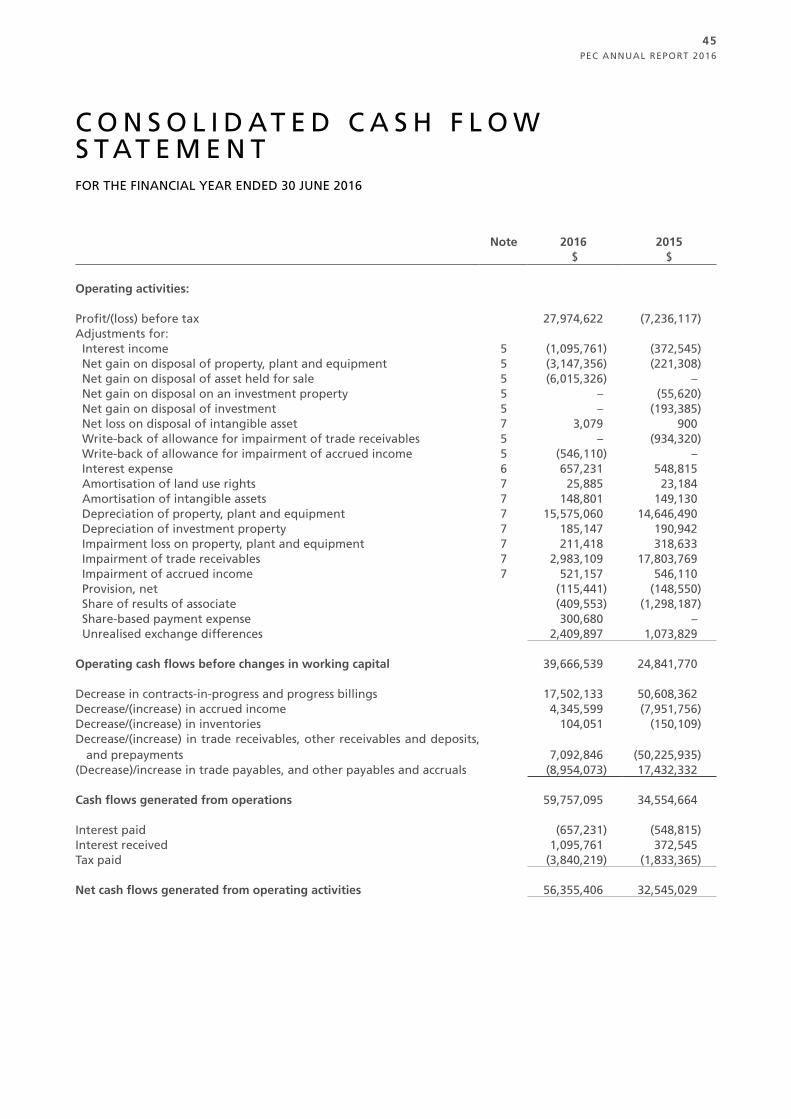
PEC ANNUAL REPORT 2016
45
Note 2016 2015$ $
Operating activities:
Profit/(loss) before tax 27,974,622 (7,236,117)Adjustments for: Interest income 5 (1,095,761) (372,545) Net gain on disposal of property, plant and equipment 5 (3,147,356) (221,308) Net gain on disposal of asset held for sale 5 (6,015,326) – Net gain on disposal on an investment property 5 – (55,620) Net gain on disposal of investment 5 – (193,385) Net loss on disposal of intangible asset 7 3,079 900 Write-back of allowance for impairment of trade receivables 5 – (934,320) Write-back of allowance for impairment of accrued income 5 (546,110) – Interest expense 6 657,231 548,815 Amortisation of land use rights 7 25,885 23,184 Amortisation of intangible assets 7 148,801 149,130 Depreciation of property, plant and equipment 7 15,575,060 14,646,490 Depreciation of investment property 7 185,147 190,942 Impairment loss on property, plant and equipment 7 211,418 318,633 Impairment of trade receivables 7 2,983,109 17,803,769 Impairment of accrued income 7 521,157 546,110 Provision, net (115,441) (148,550) Share of results of associate (409,553) (1,298,187) Share-based payment expense 300,680 – Unrealised exchange differences 2,409,897 1,073,829
Operating cash flows before changes in working capital 39,666,539 24,841,770
Decrease in contracts-in-progress and progress billings 17,502,133 50,608,362Decrease/(increase) in accrued income 4,345,599 (7,951,756)Decrease/(increase) in inventories 104,051 (150,109)Decrease/(increase) in trade receivables, other receivables and deposits,
and prepayments 7,092,846 (50,225,935)(Decrease)/increase in trade payables, and other payables and accruals (8,954,073) 17,432,332
Cash flows generated from operations 59,757,095 34,554,664
Interest paid (657,231) (548,815)Interest received 1,095,761 372,545Tax paid (3,840,219) (1,833,365)
Net cash flows generated from operating activities 56,355,406 32,545,029
C O N S O L I D AT E D C A S H F L O W S T AT E M E N TFOR THE FINANCIAL YEAR ENDED 30 JUNE 2016
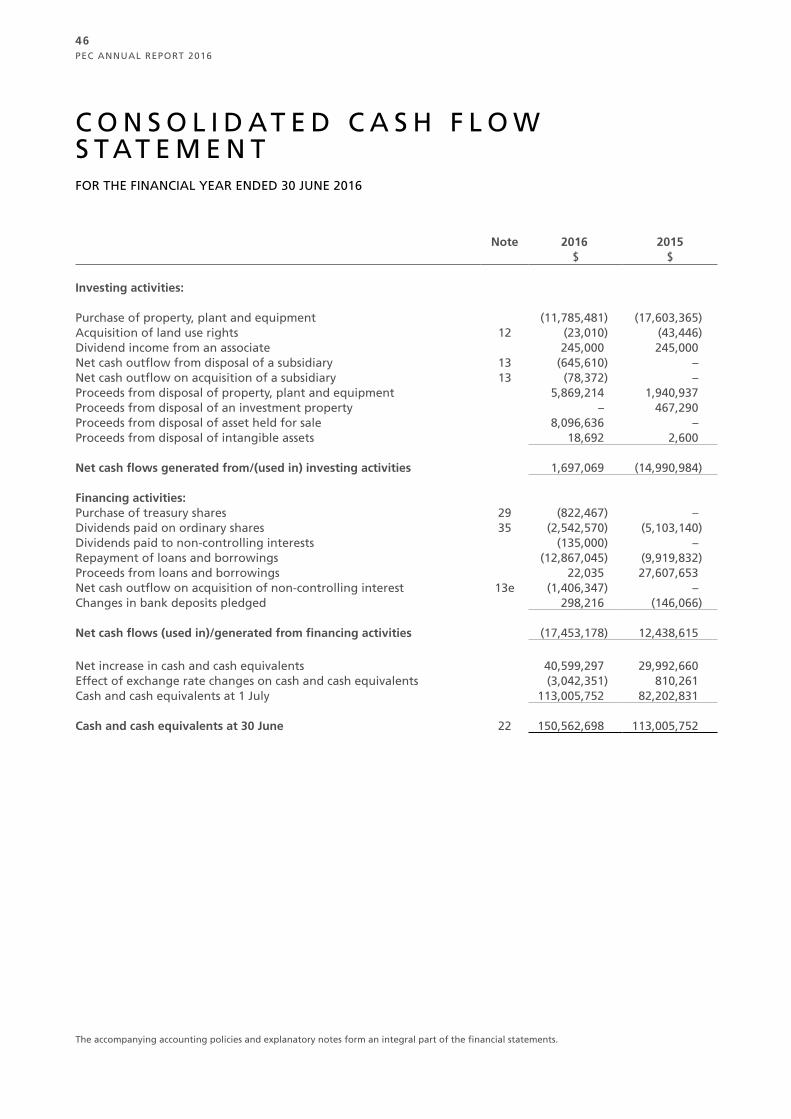
PEC ANNUAL REPORT 2016
46
Note 2016 2015$ $
Investing activities:
Purchase of property, plant and equipment (11,785,481) (17,603,365)Acquisition of land use rights 12 (23,010) (43,446)Dividend income from an associate 245,000 245,000Net cash outflow from disposal of a subsidiary 13 (645,610) –Net cash outflow on acquisition of a subsidiary 13 (78,372) –Proceeds from disposal of property, plant and equipment 5,869,214 1,940,937Proceeds from disposal of an investment property – 467,290Proceeds from disposal of asset held for sale 8,096,636 –Proceeds from disposal of intangible assets 18,692 2,600
Net cash flows generated from/(used in) investing activities 1,697,069 (14,990,984)
Financing activities:Purchase of treasury shares 29 (822,467) –Dividends paid on ordinary shares 35 (2,542,570) (5,103,140)Dividends paid to non-controlling interests (135,000) –Repayment of loans and borrowings (12,867,045) (9,919,832)Proceeds from loans and borrowings 22,035 27,607,653Net cash outflow on acquisition of non-controlling interest 13e (1,406,347) –Changes in bank deposits pledged 298,216 (146,066)
Net cash flows (used in)/generated from financing activities (17,453,178) 12,438,615
Net increase in cash and cash equivalents 40,599,297 29,992,660Effect of exchange rate changes on cash and cash equivalents (3,042,351) 810,261Cash and cash equivalents at 1 July 113,005,752 82,202,831
Cash and cash equivalents at 30 June 22 150,562,698 113,005,752
The accompanying accounting policies and explanatory notes form an integral part of the financial statements.
C O N S O L I D AT E D C A S H F L O W S T AT E M E N TFOR THE FINANCIAL YEAR ENDED 30 JUNE 2016
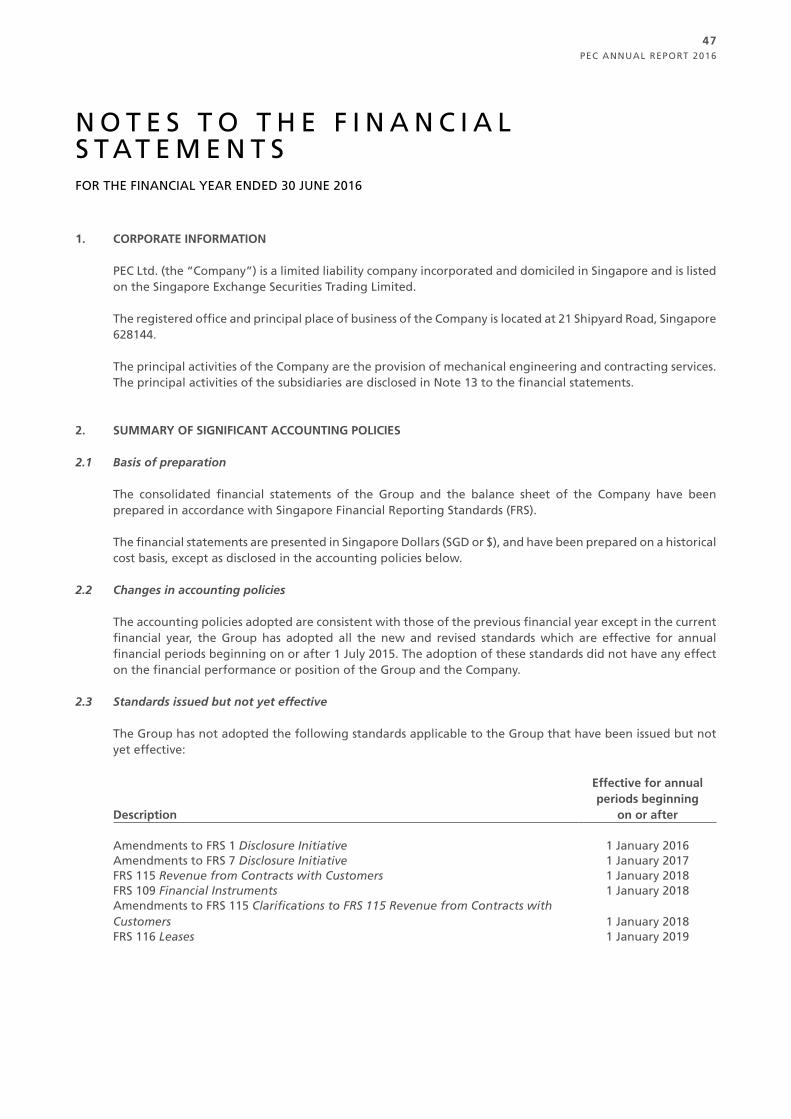
PEC ANNUAL REPORT 2016
47
N O T E S T O T H E F I N A N C I A L S T AT E M E N T SFOR THE FINANCIAL YEAR ENDED 30 JUNE 2016
1. CORPORATE INFORMATION
PEC Ltd. (the “Company”) is a limited liability company incorporated and domiciled in Singapore and is listed on the Singapore Exchange Securities Trading Limited.
The registered office and principal place of business of the Company is located at 21 Shipyard Road, Singapore 628144.
The principal activities of the Company are the provision of mechanical engineering and contracting services. The principal activities of the subsidiaries are disclosed in Note 13 to the financial statements.
2. SUMMARY OF SIGNIFICANT ACCOUNTING POLICIES
2.1 Basis of preparation
The consolidated financial statements of the Group and the balance sheet of the Company have been prepared in accordance with Singapore Financial Reporting Standards (FRS).
The financial statements are presented in Singapore Dollars (SGD or $), and have been prepared on a historical cost basis, except as disclosed in the accounting policies below.
2.2 Changes in accounting policies
The accounting policies adopted are consistent with those of the previous financial year except in the current financial year, the Group has adopted all the new and revised standards which are effective for annual financial periods beginning on or after 1 July 2015. The adoption of these standards did not have any effect on the financial performance or position of the Group and the Company.
2.3 Standards issued but not yet effective
The Group has not adopted the following standards applicable to the Group that have been issued but not yet effective:
Description
Effective for annual periods beginning
on or after
Amendments to FRS 1 Disclosure Initiative 1 January 2016Amendments to FRS 7 Disclosure Initiative 1 January 2017FRS 115 Revenue from Contracts with Customers 1 January 2018 FRS 109 Financial Instruments 1 January 2018Amendments to FRS 115 Clarifications to FRS 115 Revenue from Contracts with Customers 1 January 2018FRS 116 Leases 1 January 2019
PEC ANNUAL REPORT 2016
48
N O T E S T O T H E F I N A N C I A L S T AT E M E N T SFOR THE FINANCIAL YEAR ENDED 30 JUNE 2016
2. SUMMARY OF SIGNIFICANT ACCOUNTING POLICIES (CONT’D)
2.3 Standards issued but not yet effective (cont’d)
Except for FRS 109, FRS 115 and FRS 116, the directors expect that the adoption of the other standards above will have no material impact on the financial statements in the period of initial application. The nature of the impending changes in accounting policy on adoption of FRS 109, FRS 115 and FRS 116 are described below.
FRS 109 Financial Instruments
FRS 109 introduces new requirements for classification and measurement of financial assets, impairment of financial assets and hedge accounting. Financial assets are classified according to their contractual cash flow characteristics and the business model under which they are held. The impairment requirements in FRS 109 are based on an expected credit loss model and replace the FRS 39 incurred loss model. Adopting the expected credit losses requirements will require the Group to make changes to its current systems and processes.
FRS 109 is effective for annual periods beginning on or after 1 January 2018 with early application permitted. Retrospective application is required, but comparative information is not compulsory. The Group is currently assessing the impact of FRS 109 and plans to adopt the standard on the required effective date.
FRS 115 Revenue from Contracts with Customers
FRS 115 establishes a five-step model that will apply to revenue arising from contracts with customers. Under FRS 115, revenue is recognised at an amount that reflects the consideration which an entity expects to be entitled in exchange for transferring goods or services to a customer. The principles in FRS 115 provide a more structured approach to measuring and recognising revenue when the promised goods and services are transferred to the customer i.e. when performance obligations are satisfied.
Key issues for the Group include identifying performance obligations, accounting for contract modifications, applying the constraint to variable consideration, evaluating significant financing components, measuring progress toward satisfaction of a performance obligation, recognising contract cost assets and addressing disclosure requirements.
Either a full or modified retrospective application is required for annual periods beginning on or after 1 January 2018 with early adoption permitted. The Group is currently assessing the impact of FRS 115 and plans to adopt the new standard on the required effective date.
FRS 116 Leases
FRS 116 requires lessees to recognise for most leases, a liability to pay rentals with a corresponding asset, and recognise interest expense and depreciation separately. The new standard is effective for annual periods beginning on or after 1 January 2019.
The Group is currently assessing the impact of the new standard and plans to adopt the new standard on the required effective date.

PEC ANNUAL REPORT 2016
49
N O T E S T O T H E F I N A N C I A L S T AT E M E N T SFOR THE FINANCIAL YEAR ENDED 30 JUNE 2016
2. SUMMARY OF SIGNIFICANT ACCOUNTING POLICIES (CONT’D)
2.4 Basis of consolidation and business combinations
(a) Basis of consolidation
The consolidated financial statements comprise the financial statements of the Company and its subsidiaries as at the end of the reporting period. The financial statements of the subsidiaries used in the preparation of the consolidated financial statements are prepared for the same reporting date as the Company. Consistent accounting policies are applied to like transactions and events in similar circumstances.
All intra-group balances, income and expenses and unrealised gains and losses resulting from intra-group transactions and dividends are eliminated in full.
Subsidiaries are consolidated from the date of acquisition, being the date on which the Group obtains control, and continue to be consolidated until the date that such control ceases.
Losses within a subsidiary are attributed to the non-controlling interests even if that results in a deficit balance.
A change in the ownership interest of a subsidiary, without a loss of control, is accounted for as an equity transaction. If the Group loses control over a subsidiary, it:
– De-recognises the assets (including goodwill) and liabilities of the subsidiary at their carrying amounts at the date when control is lost;
– De-recognises the carrying amount of any non-controlling interests;– De-recognises the cumulative translation differences recorded in equity;– Recognises the fair value of the consideration received;– Recognises the fair value of any investment retained;– Recognises any surplus or deficit in profit or loss;– Re-classifies the Group’s share of components previously recognised in other comprehensive
income to profit or loss or retained earnings, as appropriate.
(b) Business combinations and goodwill
Business combinations are accounted for by applying the acquisition method. Identifiable assets acquired and liabilities assumed in a business combination are measured initially at their fair values at the acquisition date. Acquisition-related costs are recognised as expenses in the periods in which the costs are incurred and the services are received.
Any contingent consideration to be transferred by the acquirer will be recognised at fair value at the acquisition date. Subsequent changes to the fair value of the contingent consideration which is deemed to be an asset or liability, will be recognised in profit or loss.
The Group elects for each individual business combination, whether non-controlling interest in the acquiree (if any), that are present ownership interests and entitle their holders to a proportionate share of net assets in the event of liquidation, is recognised on the acquisition date at fair value, or at the non-controlling interest’s proportionate share of the acquiree’s identifiable net assets. Other components of non-controlling interests are measured at their acquisition date fair value, unless another measurement basis is required by another FRS.
PEC ANNUAL REPORT 2016
50
N O T E S T O T H E F I N A N C I A L S T AT E M E N T SFOR THE FINANCIAL YEAR ENDED 30 JUNE 2016
2. SUMMARY OF SIGNIFICANT ACCOUNTING POLICIES (CONT’D)
2.4 Basis of consolidation and business combinations (cont’d)
(b) Business combinations and goodwill (cont’d)
Any excess of the sum of the fair value of the consideration transferred in the business combination, the amount of non-controlling interest in the acquiree (if any), and the fair value of the Group’s previously held equity interest in the acquiree (if any), over the net fair value of the acquiree’s identifiable assets and liabilities is recorded as goodwill. The accounting policy for goodwill is set out in Note 2.9. In instances where the latter amount exceeds the former, the excess is recognised as gain on bargain purchase in profit or loss on acquisition date.
Goodwill is initially measured at cost. Following initial recognition, goodwill is measured at cost less any accumulated impairment losses.
For the purpose of impairment testing, goodwill acquired in a business combination is, from the acquisition date, allocated to the Group’s cash-generating units that are expected to benefit from the synergies of the combination, irrespective of whether other assets or liabilities of the acquiree are assigned to those units.
The cash-generating units to which goodwill have been allocated is tested for impairment annually and whenever there is an indication that the cash-generating unit may be impaired. Impairment is determined for goodwill by assessing the recoverable amount of each cash-generating unit (or group of cash-generating units) to which the goodwill relates.
2.5 Transactions with non-controlling interests
Non-controlling interests represent the equity in subsidiaries not attributable, directly or indirectly, to owners of the Company.
Changes in the Company’s ownership interest in a subsidiary that do not result in a loss of control are accounted for as equity transactions. In such circumstances, the carrying amounts of the controlling and non-controlling interests are adjusted to reflect the changes in their relative interests in the subsidiary. Any difference between the amount by which the non-controlling interests is adjusted and the fair value of the consideration paid or received is recognised directly in equity and attributed to owners of the Company.
2.6 Foreign currency
The financial statements are presented in Singapore Dollars, which is also the Company’s functional currency. Each entity in the Group determines its own functional currency and items included in the financial statements of each entity are measured using that functional currency.
(a) Transactions and balances
Transactions in foreign currencies are measured in the respective functional currencies of the Company and its subsidiaries and are recorded on initial recognition in the functional currencies at exchange rates approximating those ruling at the transaction dates. Monetary assets and liabilities denominated in foreign currencies are translated at the rate of exchange ruling at the end of the reporting period. Non-monetary items that are measured in terms of historical cost in a foreign currency are translated using the exchange rates as at the dates of the initial transactions. Non-monetary items measured at fair value in a foreign currency are translated using the exchange rates at the date when the fair value was measured.
PEC ANNUAL REPORT 2016
51
N O T E S T O T H E F I N A N C I A L S T AT E M E N T SFOR THE FINANCIAL YEAR ENDED 30 JUNE 2016
2. SUMMARY OF SIGNIFICANT ACCOUNTING POLICIES (CONT’D)
2.6 Foreign currency (cont’d)
(a) Transactions and balances (cont’d)
Exchange differences arising on the settlement of monetary items or on translating monetary items at the end of the reporting period are recognised in profit or loss.
(b) Consolidated financial statements
For consolidation purpose, the assets and liabilities of foreign operations are translated into SGD at the rate of exchange ruling at the end of the reporting period and their profit or loss are translated at the exchange rates prevailing at the date of the transactions. The exchange differences arising on the translation are recognised in other comprehensive income. On disposal of a foreign operation, the component of other comprehensive income relating to that particular foreign operation is recognised in profit or loss.
2.7 Property, plant and equipment
All items of property, plant and equipment are initially recorded at cost. Subsequent to recognition, property, plant and equipment are measured at cost less accumulated depreciation and any accumulated impairment losses.
Depreciation is computed on a straight-line basis over the estimated useful lives of the assets as follows:
Leasehold land and buildings – 14 to 50 yearsPlant machinery and site equipment – 3 to 15 yearsMotor vehicles – 4 to 10 yearsOffice equipment, furniture and fittings, and renovation – 3 to 10 years
Assets under construction included in property, plant and equipment are not depreciated as these assets are not yet available for use.
The carrying values of property, plant and equipment are reviewed for impairment when events or changes in circumstances indicate that the carrying value may not be recoverable.
The residual value, useful life and depreciation method are reviewed at each financial year-end, and adjusted prospectively, if appropriate.
An item of property, plant and equipment is derecognised upon disposal or when no future economic benefits are expected from its use or disposal. Any gain or loss arising on de-recognition of the asset is included in profit or loss in the financial year the asset is derecognised.
PEC ANNUAL REPORT 2016
52
N O T E S T O T H E F I N A N C I A L S T AT E M E N T SFOR THE FINANCIAL YEAR ENDED 30 JUNE 2016
2. SUMMARY OF SIGNIFICANT ACCOUNTING POLICIES (CONT’D)
2.8 Investment properties
Investment properties are properties that are either owned by the Group or leased under a finance lease that are held to earn rentals or for capital appreciation, or both, rather than for use in the production or supply of goods or services, or for administrative purposes, or in the ordinary course of business.
Investment properties are initially measured at cost, including transaction cost. Subsequent to initial recognition, investment properties are measured at cost less accumulated depreciation and any accumulated impairment losses.
Depreciation is computed on a straight-line basis over the shorter of its estimated useful life or remaining lease term of 40 to 84 years.
Investment properties are derecognised when either they have been disposed of or when the investment properties are permanently withdrawn from use and no future economic benefit is expected from its disposal. Any gains or losses on the retirement or disposal of an investment property are recognised in profit or loss in the year of retirement or disposal.
2.9 Intangible assets
Intangible assets acquired separately are measured initially at cost. Following initial recognition, intangible assets are carried at cost less accumulated amortisation and any accumulated impairment losses. Internally generated intangible assets, excluding capitalised development costs, are not capitalised and expenditure is reflected in profit or loss in the year in which the expenditure is incurred.
The useful lives of intangible assets are assessed as either finite or indefinite.
(a) Intangible assets with finite useful lives are amortised over the estimated useful lives and assessed for impairment whenever there is an indication that the intangible asset may be impaired. The amortisation period and the amortisation method are reviewed at least at each financial year-end. Changes in the expected useful life or the expected pattern of consumption of future economic benefits embodied in the asset is accounted for by changing the amortisation period or method, as appropriate, and are treated as changes in accounting estimates.
(i) Club membership
The club membership is amortised on a straight-line basis over its finite useful life of 10 years.
(ii) Licence
The licence was acquired separately and is amortised on a straight-line basis over its finite useful life of 5 years.
PEC ANNUAL REPORT 2016
53
N O T E S T O T H E F I N A N C I A L S T AT E M E N T SFOR THE FINANCIAL YEAR ENDED 30 JUNE 2016
2. SUMMARY OF SIGNIFICANT ACCOUNTING POLICIES (CONT’D)
2.9 Intangible assets (cont’d)
(b) Intangible assets with indefinite useful lives or not yet available for use are tested for impairment annually, or more frequently if the events and circumstances indicates that the carrying value may be impaired either individually or at the cash-generating unit level. Such intangible assets are not amortised. Subsequent to initial recognition, the intangible assets are measured at cost less accumulated impairment losses. The useful life of an intangible asset with an indefinite useful life is reviewed annually to determine whether the useful life assessment continues to be supportable. If not, the change in useful life from indefinite to finite is made on a prospective basis.
Goodwill
Goodwill that arises upon the acquisition of subsidiary is included in intangible assets. Impairment losses are reviewed at the end of each reporting period and adjusted if appropriate.
Gains or losses arising from de-recognition of an intangible asset are measured as the difference between the net disposal proceeds and the carrying amount of the asset and are recognised in profit or loss when the asset is derecognised.
2.10 Land use rights
Land use rights are initially measured at cost. Following initial recognition, land use rights are measured at cost less accumulated amortisation. Amortisation is charged to profit or loss on a straight-line basis over the period of the lease term, which ranges between 48 to 69 years.
2.11 Non-current assets held for sale
Non-current assets classified as held for sale are measured at the lower of their carrying amount and fair value less costs to sell. Non-current assets are classified as held for sale if their carrying amounts will be recovered principally through a sale transaction rather than through continuing use.
Property, plant and equipment and investment properties once classified as held for sale are not depreciated or amortised.
2.12 Subsidiaries
A subsidiary is an investee that is controlled by the Group. The Group controls an investee when it is exposed, or has rights, to variable returns from its involvement with the investee and has the ability to affect those returns through its power over the investee.
In the Company’s separate financial statements, investments in subsidiaries are accounted for at cost less any impairment losses.
PEC ANNUAL REPORT 2016
54
N O T E S T O T H E F I N A N C I A L S T AT E M E N T SFOR THE FINANCIAL YEAR ENDED 30 JUNE 2016
2. SUMMARY OF SIGNIFICANT ACCOUNTING POLICIES (CONT’D)
2.13 Associate
An associate is an entity over which the Group has the power to participate in the financial and operating policy decisions of the investee but does not have control or joint control of those policies.
The Group account for its investments in associate using the equity method from the date on which it becomes an associate.
On acquisition of the investment, any excess of the cost of the investment over the Group’s share of the net fair value of the investee’s identifiable assets and liabilities is accounted as goodwill and is included in the carrying amount of the investment. Any excess of the Group’s share of the net fair value of the investee’s identifiable assets and liabilities over the cost of the investment is included as income in the determination of the entity’s share of the associate’s profit or loss in the period in which the investment is acquired.
Under the equity method, the investment in associate is carried in the balance sheet at cost plus post-acquisition changes in the Group’s share of net assets of the associate. The profit or loss reflects the share of results of the operations of the associate. Distributions received from associate reduce the carrying amount of the investment. Where there has been a change recognised in other comprehensive income by the associate, the Group recognises its share of such changes in other comprehensive income. Unrealised gains and losses resulting from transactions between the Group and associate are eliminated to the extent of the interest in the associate.
When the Group’s share of losses in an associate equals or exceeds its interest in the associate, the Group does not recognise further losses, unless it has incurred obligations or made payments on behalf of the associate.
After application of the equity method, the Group determines whether it is necessary to recognise an additional impairment loss on the Group’s investment in associate. The Group determines at the end of each reporting period whether there is any objective evidence that the investment in the associate is impaired. If this is the case, the Group calculates the amount of impairment as the difference between the recoverable amount of the associate and its carrying value and recognises the amount in profit or loss.
The most recent available audited financial statement of the associated company is used by the Group in applying the equity method. Where the date of the audited financial statement used is not co-teminus with those of the Group, the share of results is arrived at from the last audited financial statement available and unaudited management financial statement to the end of the financial year. Where necessary, adjustments are made to bring the accounting policies in line with those of the Group.
Investment in an associate is accounted for at cost less any impairment losses.
2.14 Impairment of non-financial assets
The Group assesses at each reporting date whether there is an indication that an asset may be impaired. If any such indication exists, or when annual impairment testing for an asset is required, the Group makes an estimate of the asset’s recoverable amount.
An asset’s recoverable amount is the higher of an asset’s or cash-generating unit’s fair value less costs of disposal and its value in use and is determined for an individual asset, unless the asset does not generate cash inflows that are largely independent of those from other assets or groups of assets. Where the carrying amount of an asset or cash-generating unit exceeds its recoverable amount, the asset is considered impaired and is written down to its recoverable amount.
PEC ANNUAL REPORT 2016
55
N O T E S T O T H E F I N A N C I A L S T AT E M E N T SFOR THE FINANCIAL YEAR ENDED 30 JUNE 2016
2. SUMMARY OF SIGNIFICANT ACCOUNTING POLICIES (CONT’D)
2.14 Impairment of non-financial assets (cont’d)
Impairment losses are recognised in profit or loss.
A previously recognised impairment loss is reversed only if there has been a change in the estimates used to determine the asset’s recoverable amount since the last impairment loss was recognised. If that is the case, the carrying amount of the asset is increased to its recoverable amount. That increase cannot exceed the carrying amount that would have been determined, net of depreciation, had no impairment loss been recognised previously. Such reversal is recognised in profit or loss.
2.15 Construction contracts
Contract work-in-progress in the balance sheet comprises actual costs and profits recognised less provision for anticipated losses and progress billings and customers advances received.
Contract revenue and contract costs are recognised as revenue and expenses respectively by reference to the stage of completion of the contract activity at the end of the reporting period (the percentage of completion method), when the outcome of a construction contract can be estimated reliably.
The outcome of a construction contract can be estimated reliably when: (i) total contract revenue can be measured reliably; (ii) it is probable that the economic benefits associated with the contract will flow to the entity; (iii) the costs to complete the contract and the stage of completion can be measured reliably; and (iv) the contract costs attributable to the contract can be clearly identified and measured reliably so that actual contract costs incurred can be compared with prior estimates.
When the outcome of a construction contract cannot be estimated reliably (principally during early stages of a contract), contract revenue is recognised only to the extent of contract costs incurred that are likely to be recoverable and contract costs are recognised as expense in the period in which they are incurred.
An expected loss on the construction contract is recognised as an expense immediately when it is probable that total contract costs will exceed total contract revenue.
In applying the percentage of completion method, revenue recognised corresponds to the total contract revenue (as defined below) multiplied by the actual completion rate based on the proportion of total contract costs (as defined below) incurred to date to the estimated total budgeted costs.
Contract revenue – Contract revenue corresponds to the initial amount of revenue agreed in the contract and any variations in contract work, claims and incentive payments to the extent that it is probable that they will result in revenue, and they can be reliably measured.
Contract costs – Contract costs include costs that relate directly to the specific contract and costs that are attributable to contract activity in general and can be allocated to the contract. Costs that relate directly to a specific contract comprise: site labour costs (including site supervision); costs of materials used in construction; depreciation of equipment used on the contract; cost of design, and technical assistance that is directly related to the contract.
PEC ANNUAL REPORT 2016
56
N O T E S T O T H E F I N A N C I A L S T AT E M E N T SFOR THE FINANCIAL YEAR ENDED 30 JUNE 2016
2. SUMMARY OF SIGNIFICANT ACCOUNTING POLICIES (CONT’D)
2.16 Inventories
Inventories are stated at the lower of cost and net realisable value. Costs incurred in bringing the inventories to their present location and conditions are accounted on a weighted average basis.
Where necessary, allowance is provided for damaged, obsolete and slow moving items to adjust the carrying value of inventories to the lower of cost and net realisable value.
Net realisable value is the estimated selling price in the ordinary course of business, less estimated costs of completion and the estimated costs necessary to make the sale.
2.17 Financial instruments
(a) Financial assets
Initial recognition and measurement
Financial assets are recognised when, and only when, the Group becomes a party to the contractual provisions of the financial instrument. The Group determines the classification of its financial assets at initial recognition.
When financial assets are recognised initially, they are measured at fair value, plus, in the case of financial assets not at fair value through profit or loss, directly attributable transaction costs.
Subsequent measurement
The subsequent measurement of financial assets depends on their classification as follows:
(i) Loans and receivables
Non-derivative financial assets with fixed or determinable payments that are not quoted in an active market are classified as loans and receivables. Subsequent to initial recognition, loans and receivables are measured at amortised cost using the effective interest method, less impairment. Gains and losses are recognised in profit or loss when the loans and receivables are derecognised or impaired, and through the amortisation process.
(ii) Available-for-sale financial assets
Available-for-sale financial assets include equity securities. Equity investments classified as available-for-sale are those, which are neither classified as held for trading nor designated at fair value through profit or loss.
After initial recognition, available-for-sale financial assets are subsequently measured at fair value. Any gains or losses from changes in fair value of the financial assets are recognised in other comprehensive income, except that impairment losses, foreign exchange gains and losses on monetary instruments and interest calculated using effective interest method are recognised in profit or loss. The cumulative gain or loss previously recognised in other comprehensive income is reclassified from equity to profit or loss as a reclassification adjustment when the financial asset is derecognised.

PEC ANNUAL REPORT 2016
57
N O T E S T O T H E F I N A N C I A L S T AT E M E N T SFOR THE FINANCIAL YEAR ENDED 30 JUNE 2016
2. SUMMARY OF SIGNIFICANT ACCOUNTING POLICIES (CONT’D)
2.17 Financial instruments (cont’d)
(a) Financial assets (cont’d)
(ii) Available-for-sale financial assets (cont’d)
Investments in equity instruments whose fair value cannot be reliably measured are measured at cost less any impairment loss.
De-recognition
A financial asset is derecognised where the contractual right to receive cash flows from the asset has expired. On de-recognition of a financial asset in its entirety, the difference between the carrying amount and the sum of the consideration received and any cumulative gain or loss that had been recognised in other comprehensive income is recognised in profit or loss.
(b) Financial liabilities
Initial recognition and measurement
Financial liabilities are recognised when, and only when, the Group becomes a party to the contractual provisions of the financial instrument. The Group determines the classification of its financial liabilities at initial recognition.
All financial liabilities are recognised initially at fair value plus in the case of financial liabilities not at fair value through profit or loss, directly attributable transaction costs.
Subsequent measurement
After initial recognition, financial liabilities that are not carried at fair value through profit or loss are subsequently measured at amortised cost using the effective interest rate method. Gains and losses are recognised in profit or loss when the liabilities are derecognised, and through the amortisation process.
De-recognition
A financial liability is derecognised when the obligation under the liability is discharged or cancelled or expires. When an existing financial liability is replaced by another from the same lender on substantially different terms, or the terms of an existing liability are substantially modified, such an exchange or modification is treated as a de-recognition of the original liability and the recognition of a new liability, and the difference in the respective carrying amounts is recognised in profit or loss.
PEC ANNUAL REPORT 2016
58
N O T E S T O T H E F I N A N C I A L S T AT E M E N T SFOR THE FINANCIAL YEAR ENDED 30 JUNE 2016
2. SUMMARY OF SIGNIFICANT ACCOUNTING POLICIES (CONT’D)
2.18 Impairment of financial assets
The Group assesses at each end of the reporting period whether there is any objective evidence that a financial asset is impaired.
(a) Financial assets carried at amortised cost
For financial assets carried at amortised cost, the Group first assesses whether objective evidence of impairment exists individually for financial assets that are individually significant, or collectively for financial assets that are not individually significant. If the Group determines that no objective evidence of impairment exists for an individually assessed financial asset, whether significant or not, it includes the asset in a group of financial assets with similar credit risk characteristics and collectively assesses them for impairment. Assets that are individually assessed for impairment and for which an impairment loss is, or continues to be recognised are not included in a collective assessment of impairment.
If there is objective evidence that an impairment loss on financial assets carried at amortised cost has been incurred, the amount of the loss is measured as the difference between the asset’s carrying amount and the present value of estimated future cash flows discounted at the financial asset’s original effective interest rate. If a loan has a variable interest rate, the discount rate for measuring any impairment loss is the current effective interest rate. The carrying amount of the asset is reduced through the use of an allowance account. The impairment loss is recognised in profit or loss.
When the asset becomes uncollectible, the carrying amount of impaired financial assets is reduced directly or if an amount was charged to the allowance account, the amounts charged to the allowance account are written off against the carrying value of the financial asset.
To determine whether there is objective evidence that an impairment loss on financial assets has been incurred, the Group considers factors such as the probability of insolvency or significant financial difficulties of the debtor and default or significant delay in payments.
If in a subsequent period, the amount of the impairment loss decreases and the decrease can be related objectively to an event occurring after the impairment was recognised, the previously recognised impairment loss is reversed to the extent that the carrying amount of the asset does not exceed its amortised cost at the reversal date. The amount of reversal is recognised in profit or loss.
(b) Available-for-sale financial assets
In the case of equity investments classified as available-for-sale, objective evidence of impairment include (i) significant financial difficulty of the issuer or obligor; (ii) information about significant changes with an adverse effect that have taken place in the technological, market, economic or legal environment in which the issuer operates, and indicates that the cost of the investment in equity instrument may not be recovered; and (iii) a significant or prolonged decline in the fair value of the investment below its costs. ‘Significant’ is to be evaluated against the original cost of the investment and ‘prolonged’ against the period in which the fair value has been below its original cost.
If an available-for-sale financial asset is impaired, an amount comprising the difference between its acquisition cost (net of any principal repayment and amortisation) and its current fair value, less any impairment loss previously recognised in profit or loss, is transferred from other comprehensive income and recognised in profit or loss. Reversals of impairment losses in respect of equity instruments are not recognised in profit or loss; increase in their fair value after impairment are recognised directly in other comprehensive income.
PEC ANNUAL REPORT 2016
59
N O T E S T O T H E F I N A N C I A L S T AT E M E N T SFOR THE FINANCIAL YEAR ENDED 30 JUNE 2016
2. SUMMARY OF SIGNIFICANT ACCOUNTING POLICIES (CONT’D)
2.19 Cash and short-term deposits
Cash and short-term deposits comprise cash at bank and on hand, and fixed deposits, which are subject to an insignificant risk of changes in value. These also include bank overdrafts, which form an integral part of the Group’s cash management.
2.20 Provisions
Provisions are recognised when the Group has a present obligation (legal or constructive) as a result of a past event, it is probable that an outflow of resources embodying economic benefits will be required to settle the obligation and the amount of the obligation can be estimated reliably.
Provisions are reviewed at the end of each reporting period and adjusted to reflect the current best estimate. If it is no longer probable that an outflow of economic resources will be required to settle the obligation, the provision is reversed. If the effect of the time value of money is material, provisions are discounted using a current pre tax rate that reflects, where appropriate, the risks specific to the liability. When discounting is used, the increase in the provision due to the passage of time is recognised as a finance cost.
2.21 Borrowing costs
Borrowing costs are capitalised as part of the cost of a qualifying asset if they are directly attributable to the acquisition, construction or production of that asset. Capitalisation of borrowing costs commences when the activities to prepare the asset for its intended use or sale are in progress and the expenditures and borrowing costs are incurred. Borrowing costs are capitalised until the assets are substantially completed for their intended use or sale. All other borrowing costs are expensed in the period they occur. Borrowing costs consist of interest and other costs that an entity incurs in connection with the borrowing of funds.
2.22 Employee benefits
(a) Defined contribution plans
The Group participates in the national pension schemes as defined by the laws of the countries in which it has operations. In particular, the Singapore companies in the Group make contributions to the Central Provident Fund scheme in Singapore, a defined contribution pension scheme. Contributions to defined contribution pension schemes are recognised as an expense in the period in which the related service is performed.
(b) Employee leave entitlement
Employee entitlements to annual leave are recognised as a liability when they accrue to employees. The undiscounted liability for leave expected to be settled wholly before twelve months after the end of the reporting period is recognised for services rendered by employees up to the end of the reporting period.
(c) Equity compensation plans
Employees of the Group receive remuneration in the form of share awards as consideration for services rendered.
PEC ANNUAL REPORT 2016
60
N O T E S T O T H E F I N A N C I A L S T AT E M E N T SFOR THE FINANCIAL YEAR ENDED 30 JUNE 2016
2. SUMMARY OF SIGNIFICANT ACCOUNTING POLICIES (CONT’D)
2.22 Employees benefits (cont’d)
(c) Equity compensation plans (cont’d)
The Company has implemented Performance Share Plan for the award of fully paid ordinary shares to eligible full-time employees and Executive Directors, after pre-determined performance and service conditions are accomplished.
The cost of equity-settled transactions with employees is measured by reference to the fair value at the date on which the share awards are granted.
This cost is recognised in profit or loss as share-based compensation expenses, with a corresponding increase in the share-based compensation reserve, over the vesting period. The cumulative expense recognised at each reporting date until the vesting date reflects the extent to which the vesting period has expired and the Group’s best estimate of the number of awards that will ultimately vest. The charge or credit to profit or loss for a period represents the movement in cumulative expenses recognised as at the beginning and end of that period.
No expense is recognised for awards that do not ultimately vest.
The share-based compensation reserve is transferred to retained earnings upon cancellation or expiry of the awards. When the awards are released, the share-based compensation reserve is transferred to share capital if new shares are issued to settle the awards, or to treasury shares if awards are satisfied by the re-issuance of treasury shares.
2.23 Leases
(a) As lessee
Finance leases, which transfer to the Group substantially all the risks and rewards incidental to ownership of the leased item, are capitalised at the inception of the lease at the fair value of the leased asset or, if lower, at the present value of the minimum lease payments. Any initial direct costs are also added to the amount capitalised. Lease payments are apportioned between the finance charges and reduction of the lease liability so as to achieve a constant rate of interest on the remaining balance of the liability. Finance charges are charged to profit or loss. Contingent rents, if any, are charged as expenses in the periods in which they are incurred.
Capitalised leased assets are depreciated over the shorter of the estimated useful life of the asset and the lease term, if there is no reasonable certainty that the Group will obtain ownership by the end of the lease term.
Operating lease payments are recognised as an expense in profit or loss on a straight-line basis over the lease term. The aggregate benefit of incentives provided by the lessor is recognised as a reduction of rental expense over the lease term on a straight-line basis.
PEC ANNUAL REPORT 2016
61
N O T E S T O T H E F I N A N C I A L S T AT E M E N T SFOR THE FINANCIAL YEAR ENDED 30 JUNE 2016
2. SUMMARY OF SIGNIFICANT ACCOUNTING POLICIES (CONT’D)
2.23 Leases (cont’d)
(b) As lessor
Leases where the Group retains substantially all the risks and rewards of ownership of the asset are classified as operating leases. Initial direct costs incurred in negotiating an operating lease are added to the carrying amount of the leased asset and recognised over the lease term on the same basis as rental income. The accounting policy for rental income is set out in Note 2.24 (e). Contingent rents are recognised as revenue in the period in which they are earned.
2.24 Revenue
Revenue is recognised to the extent that it is probable that the economic benefits will flow to the Group and the revenue can be reliably measured, regardless of when the payment is made. Revenue is measured at the fair value of consideration received or receivable, taking into account contractually defined terms of payment and excluding taxes or duty.
(a) Contract revenue
Contract revenue is recognised by reference to the stage of completion of the contract activity at the end of the reporting period (the percentage of completion method). The accounting policy for construction contracts is set out in Note 2.15.
(b) Revenue from maintenance services
Revenue from maintenance services rendered is recognised by reference to the stage of completion of the maintenance contract. The stage of completion is determined by the proportion of costs incurred to date to the estimated total costs of the transaction.
(c) Rendering of services
Revenue from services rendered is recognised upon delivery of services and acceptance by customers.
(d) Sale of goods
Revenue from sale of goods is recognised upon the transfer of significant risk and rewards of ownership of the goods to the customer, usually on delivery of goods. Revenue is not recognised to the extent where there are significant uncertainties regarding recovery of the consideration due, associated costs or the possible return of goods.
(e) Rental income
Rental income arising from operating leases on investment properties and equipment are accounted for on a straight-line basis over the lease term.
(f) Interest income
Interest income is recognised using the effective interest method.
(g) Dividend income
Dividend is recognised when the Group’s right to receive the payment is established.

PEC ANNUAL REPORT 2016
62
N O T E S T O T H E F I N A N C I A L S T AT E M E N T SFOR THE FINANCIAL YEAR ENDED 30 JUNE 2016
2. SUMMARY OF SIGNIFICANT ACCOUNTING POLICIES (CONT’D)
2.25 Government grants
Government grant shall be recognised in profit or loss on a systematic basis over the periods in which the entity recognises as expenses the related costs for which the grants are intended to compensate. Grants related to income may be presented as a credit in profit or loss, either separately or under a general heading such as “Other income”. Alternatively, they are deducted in reporting the related expenses.
2.26 Taxes
(a) Current income tax
Current income tax assets and liabilities for the current and prior periods are measured at the amount expected to be recovered from or paid to the taxation authorities. The tax rates and tax laws used to compute the amount are those that are enacted or substantively enacted at the end of the reporting period, in the countries where the Group operates and generates taxable income.
Current income taxes are recognised in profit or loss except to the extent that the tax relates to items recognised outside profit or loss, either in other comprehensive income or directly in equity. Management periodically evaluates positions taken in the tax returns with respect to situations in which applicable tax regulations are subject to interpretation and establishes provisions where appropriate.
(b) Deferred tax
Deferred tax is provided using the liability method on temporary differences at the end of the reporting period between the tax bases of assets and liabilities and their carrying amounts for financial reporting purposes.
Deferred tax liabilities are recognised for all temporary differences, except:
• Where the deferred tax liability arises from the initial recognition of goodwill or of an asset or liability in a transaction that is not a business combination and, at the time of the transaction, affects neither the accounting profit nor taxable profit or loss; and
• In respect of taxable temporary differences associated with investment in subsidiaries and associate, where the timing of the reversal of the temporary differences can be controlled by the Group and it is probable that the temporary differences will not reverse in the foreseeable future.
Deferred tax assets are recognised for all deductible temporary differences, the carry forward of unused tax credits and unused tax losses, to the extent that it is probable that taxable profit will be available against which the deductible temporary differences, and the carry forward of unused tax credits and unused tax losses can be utilised except:
• Where the deferred tax asset relating to the deductible temporary difference arises from the initial recognition of an asset or liability in a transaction that is not a business combination and, at the time of the transaction, affects neither the accounting profit nor taxable profit or loss; and
PEC ANNUAL REPORT 2016
63
N O T E S T O T H E F I N A N C I A L S T AT E M E N T SFOR THE FINANCIAL YEAR ENDED 30 JUNE 2016
2. SUMMARY OF SIGNIFICANT ACCOUNTING POLICIES (CONT’D)
2.26 Taxes (cont’d)
(b) Deferred tax (cont’d)
• In respect of deductible temporary differences associated with investment in subsidiaries and associate, deferred tax assets are recognised only to the extent that it is probable that the temporary differences will reverse in the foreseeable future and taxable profit will be available against which the temporary differences can be utilised.
The carrying amount of deferred tax assets is reviewed at the end of each reporting period and reduced to the extent that it is no longer probable that sufficient taxable profit will be available to allow all or part of the deferred tax asset to be utilised. Unrecognised deferred tax assets are reassessed at the end of each reporting period and are recognised to the extent that it has become probable that future taxable profit will allow the deferred tax asset to be recovered.
Deferred tax assets and liabilities are measured at the tax rates that are expected to apply in the financial year when the asset is realised or the liability is settled, based on tax rates (and tax laws) that have been enacted or substantively enacted at the end of each reporting period.
Deferred tax relating to items recognised outside profit or loss is recognised outside profit or loss. Deferred tax items are recognised in correlation to the underlying transaction either in other comprehensive income or directly in equity and deferred tax arising from a business combination is adjusted against goodwill on acquisition.
(c) Sales tax
Revenues, expenses and assets are recognised net of the amount of sales tax except:
• Where the sales tax incurred on a purchase of assets or services is not recoverable from the taxation authority, in which case the sales tax is recognised as part of the cost of acquisition of the asset or as part of the expense item as applicable; and
• Receivables and payables that are stated with the amount of sales tax included.
2.27 Share capital and share issuance expenses
Proceeds from issuance of ordinary shares are recognised as share capital in equity. Incremental costs directly attributable to the issuance of ordinary shares are deducted against share capital.
2.28 Treasury shares
The Group’s own equity instruments, which are reacquired (treasury shares) are recognised at cost and deducted from equity. No gain or loss is recognised in profit or loss on the purchase, sale, issue or cancellation of the Group’s own equity instruments. Any difference between the carrying amount of treasury shares and the consideration received, if reissued, is recognised directly in equity. Voting rights related to treasury shares are nullified for the Group and no dividends are allocated to them respectively.

PEC ANNUAL REPORT 2016
64
N O T E S T O T H E F I N A N C I A L S T AT E M E N T SFOR THE FINANCIAL YEAR ENDED 30 JUNE 2016
2. SUMMARY OF SIGNIFICANT ACCOUNTING POLICIES (CONT’D)
2.29 Contingencies
A contingent liability is:
(a) a possible obligation that arises from past events and whose existence will be confirmed only by the occurrence or non-occurrence of one or more uncertain future events not wholly within the control of the Group; or
(b) a present obligation that arises from past events but is not recognised because:
(i) It is not probable that an outflow of resources embodying economic benefits will be required to settle the obligation; or
(ii) The amount of the obligation cannot be measured with sufficient reliability.
A contingent asset is a possible asset that arises from past events and whose existence will be confirmed only by the occurrence or non-occurrence of one or more uncertain future events not wholly within the control of the Group.
Contingent liabilities and assets are not recognised on the balance sheet of the Group, except for contingent liabilities assumed in a business combination that are present obligations and which the fair values can be reliably determined.
3. KEY ACCOUNTING ESTIMATES, ASSUMPTIONS AND JUDGMENTS
The preparation of the Group’s consolidated financial statements requires management to make judgments, estimates and assumptions that affect the reported amounts of revenues, expenses, assets and liabilities, and the disclosure of contingent liabilities at the end of each reporting period. Uncertainty about these assumptions and estimates could result in outcomes that could require a material adjustment to the carrying amount of the asset or liability affected in the future periods.
3.1 Judgments made in applying accounting policies
In the process of applying the Group’s accounting policies, management has not made any significant judgments, which have a significant effect on the carrying amounts of assets and liabilities recognised in the financial statements within the next financial period.

PEC ANNUAL REPORT 2016
65
N O T E S T O T H E F I N A N C I A L S T AT E M E N T SFOR THE FINANCIAL YEAR ENDED 30 JUNE 2016
3. KEY ACCOUNTING ESTIMATES, ASSUMPTIONS AND JUDGMENTS (CONT’D)
3.2 Key sources of estimation uncertainty
The key assumptions concerning the future and other key sources of estimation uncertainty at the end of the reporting period are discussed below. The Group based its assumptions and estimates on parameters available when the financial statements were prepared. Existing circumstances and assumptions about future developments, however, may change due to market changes or circumstances arising beyond the control of the Group. Such changes are reflected in the assumptions when they occur.
Recognition of construction revenue
The Group recognises contract revenue by reference to the stage of completion of the contract activity at the end of each reporting period, when the outcome of a construction contract can be estimated reliably. The stage of completion is measured by reference to the proportion that contract costs incurred for work performed to date bear to the estimated total contract costs. Significant assumptions are required in determining the total contract costs and the recoverable amount of variation works that affect the stage of completion and the amount of revenue recognised. In making these judgments, management has relied on past experience and knowledge of the project managers. The carrying amounts of assets and liabilities arising from construction contracts at the end of each reporting period are disclosed in Note 16.
If the estimated total contract cost of major projects had been 10% higher/lower than management’s estimate, the carrying amount of the net assets arising from major construction contracts would have been approximately $17,300,000 (2015: $19,800,000) lower and $20,700,000 (2015: $20,200,000) higher respectively.
4. REVENUE
Group2016 2015
$ $
Contract revenue 424,892,761 335,622,489Revenue from maintenance services 149,263,861 163,034,287Rendering of services 443,318 371,406Sale of goods 205,471 169,817Rental of equipment 16,111 146,560Rental income from investment property (residential) 256,085 267,275
575,077,607 499,611,834
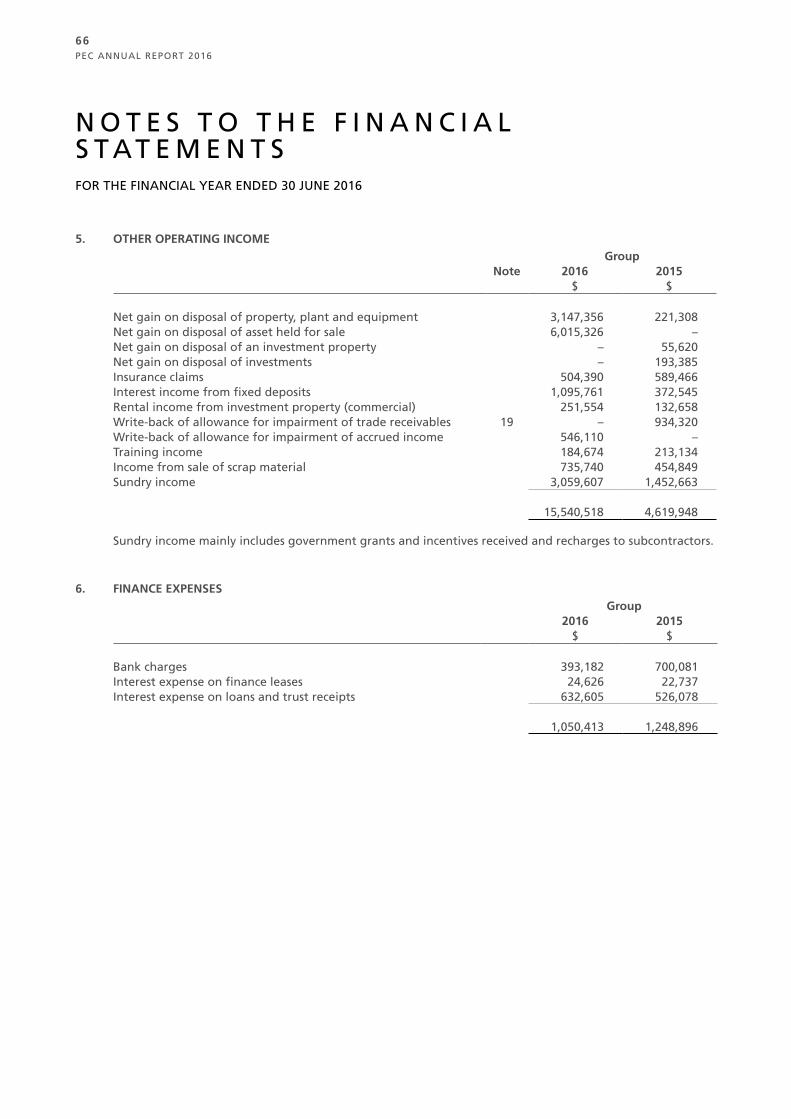
PEC ANNUAL REPORT 2016
66
N O T E S T O T H E F I N A N C I A L S T AT E M E N T SFOR THE FINANCIAL YEAR ENDED 30 JUNE 2016
5. OTHER OPERATING INCOMEGroup
Note 2016 2015$ $
Net gain on disposal of property, plant and equipment 3,147,356 221,308Net gain on disposal of asset held for sale 6,015,326 –Net gain on disposal of an investment property – 55,620Net gain on disposal of investments – 193,385Insurance claims 504,390 589,466Interest income from fixed deposits 1,095,761 372,545Rental income from investment property (commercial) 251,554 132,658Write-back of allowance for impairment of trade receivables 19 – 934,320Write-back of allowance for impairment of accrued income 546,110 –Training income 184,674 213,134Income from sale of scrap material 735,740 454,849Sundry income 3,059,607 1,452,663
15,540,518 4,619,948
Sundry income mainly includes government grants and incentives received and recharges to subcontractors.
6. FINANCE EXPENSESGroup
2016 2015$ $
Bank charges 393,182 700,081Interest expense on finance leases 24,626 22,737Interest expense on loans and trust receipts 632,605 526,078
1,050,413 1,248,896
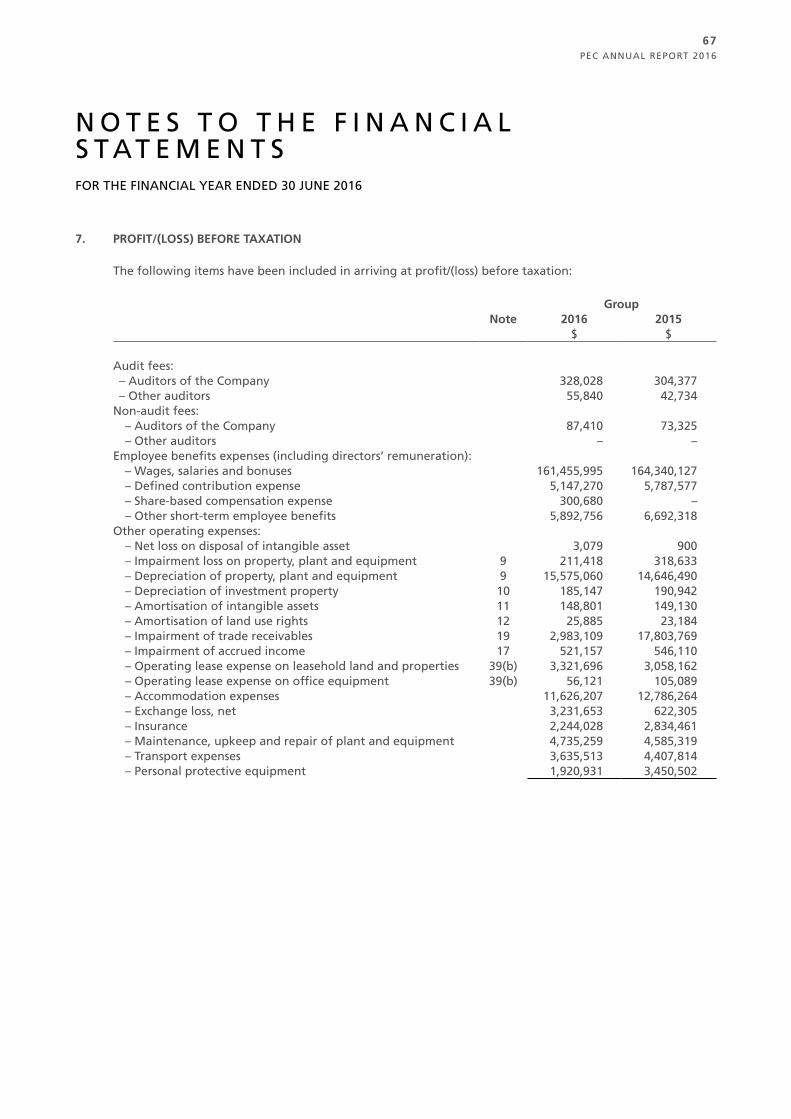
PEC ANNUAL REPORT 2016
67
N O T E S T O T H E F I N A N C I A L S T AT E M E N T SFOR THE FINANCIAL YEAR ENDED 30 JUNE 2016
7. PROFIT/(LOSS) BEFORE TAXATION
The following items have been included in arriving at profit/(loss) before taxation:
GroupNote 2016 2015
$ $
Audit fees: – Auditors of the Company 328,028 304,377– Other auditors 55,840 42,734
Non-audit fees:– Auditors of the Company 87,410 73,325– Other auditors – –
Employee benefits expenses (including directors’ remuneration):– Wages, salaries and bonuses 161,455,995 164,340,127– Defined contribution expense 5,147,270 5,787,577– Share-based compensation expense 300,680 –– Other short-term employee benefits 5,892,756 6,692,318
Other operating expenses:– Net loss on disposal of intangible asset 3,079 900– Impairment loss on property, plant and equipment 9 211,418 318,633– Depreciation of property, plant and equipment 9 15,575,060 14,646,490– Depreciation of investment property 10 185,147 190,942– Amortisation of intangible assets 11 148,801 149,130– Amortisation of land use rights 12 25,885 23,184– Impairment of trade receivables 19 2,983,109 17,803,769– Impairment of accrued income 17 521,157 546,110– Operating lease expense on leasehold land and properties 39(b) 3,321,696 3,058,162– Operating lease expense on office equipment 39(b) 56,121 105,089– Accommodation expenses 11,626,207 12,786,264– Exchange loss, net 3,231,653 622,305– Insurance 2,244,028 2,834,461– Maintenance, upkeep and repair of plant and equipment 4,735,259 4,585,319– Transport expenses 3,635,513 4,407,814– Personal protective equipment 1,920,931 3,450,502
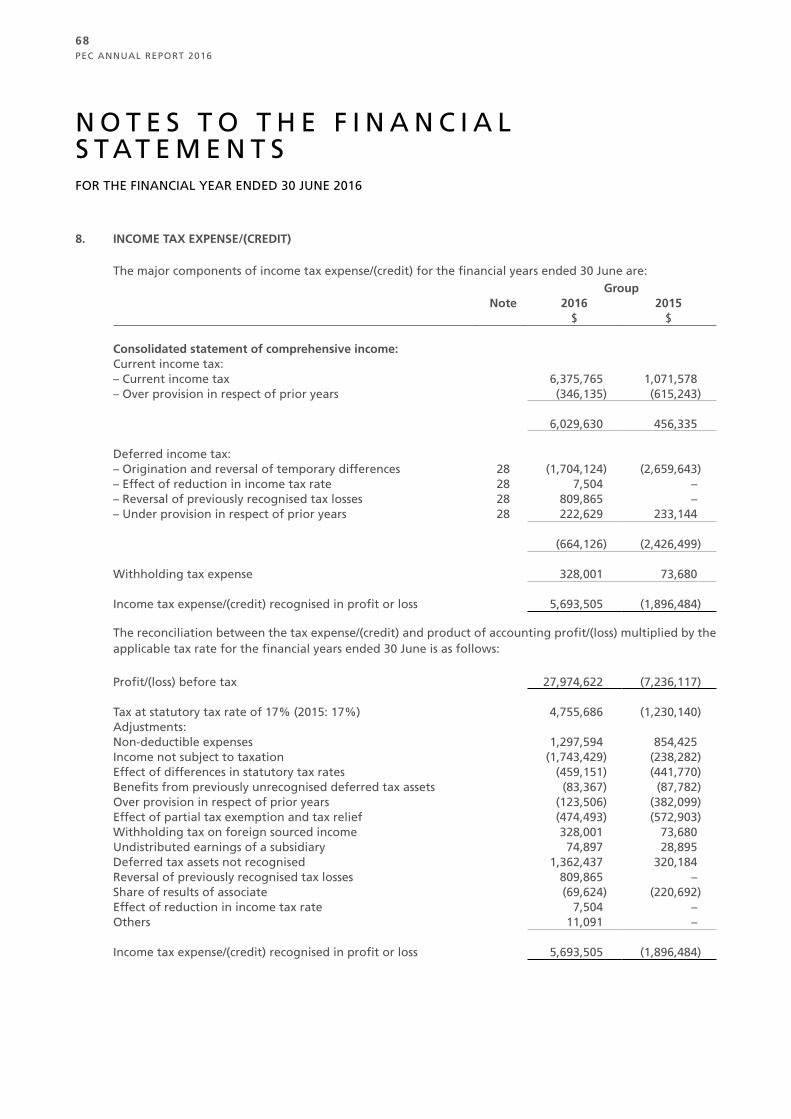
PEC ANNUAL REPORT 2016
68
N O T E S T O T H E F I N A N C I A L S T AT E M E N T SFOR THE FINANCIAL YEAR ENDED 30 JUNE 2016
8. INCOME TAX EXPENSE/(CREDIT)
The major components of income tax expense/(credit) for the financial years ended 30 June are:Group
Note 2016 2015$ $
Consolidated statement of comprehensive income:Current income tax:– Current income tax 6,375,765 1,071,578– Over provision in respect of prior years (346,135) (615,243)
6,029,630 456,335
Deferred income tax:– Origination and reversal of temporary differences 28 (1,704,124) (2,659,643)– Effect of reduction in income tax rate 28 7,504 –– Reversal of previously recognised tax losses 28 809,865 –– Under provision in respect of prior years 28 222,629 233,144
(664,126) (2,426,499)
Withholding tax expense 328,001 73,680
Income tax expense/(credit) recognised in profit or loss 5,693,505 (1,896,484)
The reconciliation between the tax expense/(credit) and product of accounting profit/(loss) multiplied by the applicable tax rate for the financial years ended 30 June is as follows:
Profit/(loss) before tax 27,974,622 (7,236,117)
Tax at statutory tax rate of 17% (2015: 17%) 4,755,686 (1,230,140)Adjustments:Non-deductible expenses 1,297,594 854,425Income not subject to taxation (1,743,429) (238,282)Effect of differences in statutory tax rates (459,151) (441,770)Benefits from previously unrecognised deferred tax assets (83,367) (87,782)Over provision in respect of prior years (123,506) (382,099)Effect of partial tax exemption and tax relief (474,493) (572,903)Withholding tax on foreign sourced income 328,001 73,680Undistributed earnings of a subsidiary 74,897 28,895Deferred tax assets not recognised 1,362,437 320,184Reversal of previously recognised tax losses 809,865 –Share of results of associate (69,624) (220,692)Effect of reduction in income tax rate 7,504 –Others 11,091 –
Income tax expense/(credit) recognised in profit or loss 5,693,505 (1,896,484)
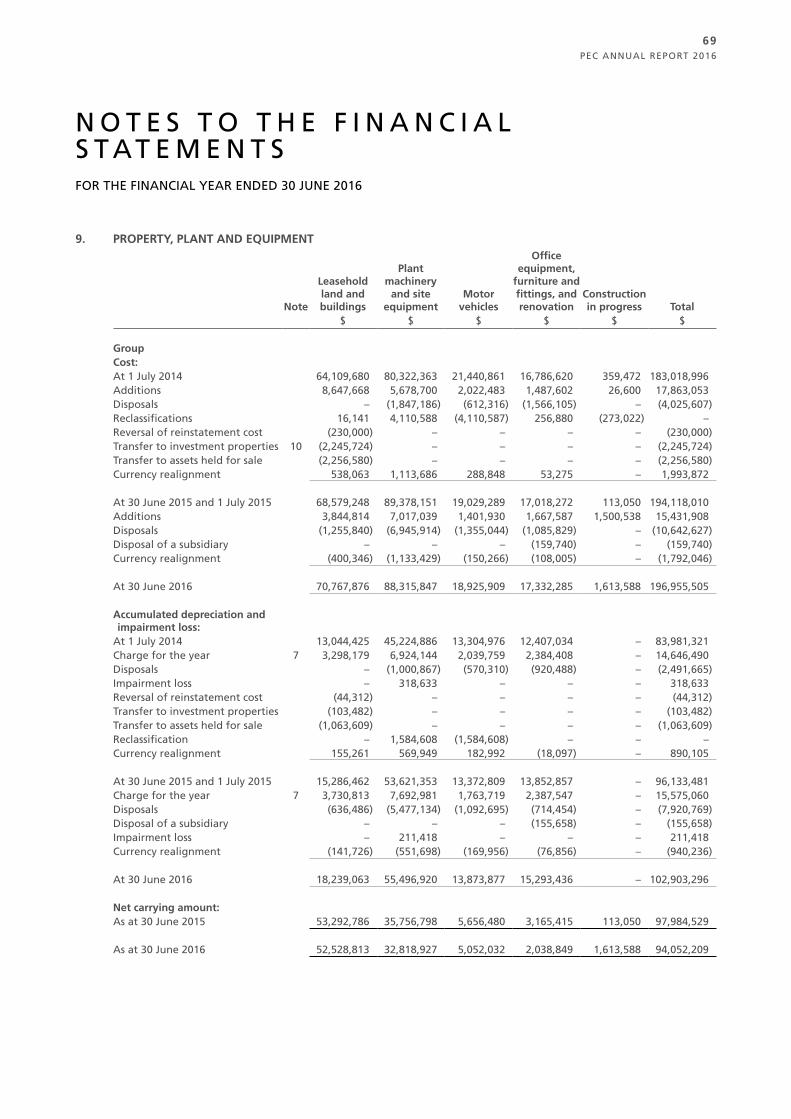
PEC ANNUAL REPORT 2016
69
N O T E S T O T H E F I N A N C I A L S T AT E M E N T SFOR THE FINANCIAL YEAR ENDED 30 JUNE 2016
9. PROPERTY, PLANT AND EQUIPMENT
Note
Leasehold land and buildings
Plant machinery
and site equipment
Motor vehicles
Office equipment,
furniture and fittings, and renovation
Construction in progress Total
$ $ $ $ $ $
GroupCost:At 1 July 2014 64,109,680 80,322,363 21,440,861 16,786,620 359,472 183,018,996Additions 8,647,668 5,678,700 2,022,483 1,487,602 26,600 17,863,053Disposals – (1,847,186) (612,316) (1,566,105) – (4,025,607)Reclassifications 16,141 4,110,588 (4,110,587) 256,880 (273,022) –Reversal of reinstatement cost (230,000) – – – – (230,000)Transfer to investment properties 10 (2,245,724) – – – – (2,245,724)Transfer to assets held for sale (2,256,580) – – – – (2,256,580)Currency realignment 538,063 1,113,686 288,848 53,275 – 1,993,872
At 30 June 2015 and 1 July 2015 68,579,248 89,378,151 19,029,289 17,018,272 113,050 194,118,010Additions 3,844,814 7,017,039 1,401,930 1,667,587 1,500,538 15,431,908Disposals (1,255,840) (6,945,914) (1,355,044) (1,085,829) – (10,642,627) Disposal of a subsidiary – – – (159,740) – (159,740)Currency realignment (400,346) (1,133,429) (150,266) (108,005) – (1,792,046)
At 30 June 2016 70,767,876 88,315,847 18,925,909 17,332,285 1,613,588 196,955,505
Accumulated depreciation and impairment loss:
At 1 July 2014 13,044,425 45,224,886 13,304,976 12,407,034 – 83,981,321Charge for the year 7 3,298,179 6,924,144 2,039,759 2,384,408 – 14,646,490Disposals – (1,000,867) (570,310) (920,488) – (2,491,665)Impairment loss – 318,633 – – – 318,633Reversal of reinstatement cost (44,312) – – – – (44,312)Transfer to investment properties (103,482) – – – – (103,482)Transfer to assets held for sale (1,063,609) – – – – (1,063,609)Reclassification – 1,584,608 (1,584,608) – – –Currency realignment 155,261 569,949 182,992 (18,097) – 890,105
At 30 June 2015 and 1 July 2015 15,286,462 53,621,353 13,372,809 13,852,857 – 96,133,481Charge for the year 7 3,730,813 7,692,981 1,763,719 2,387,547 – 15,575,060Disposals (636,486) (5,477,134) (1,092,695) (714,454) – (7,920,769)Disposal of a subsidiary – – – (155,658) – (155,658)Impairment loss – 211,418 – – – 211,418Currency realignment (141,726) (551,698) (169,956) (76,856) – (940,236)
At 30 June 2016 18,239,063 55,496,920 13,873,877 15,293,436 – 102,903,296
Net carrying amount:As at 30 June 2015 53,292,786 35,756,798 5,656,480 3,165,415 113,050 97,984,529
As at 30 June 2016 52,528,813 32,818,927 5,052,032 2,038,849 1,613,588 94,052,209
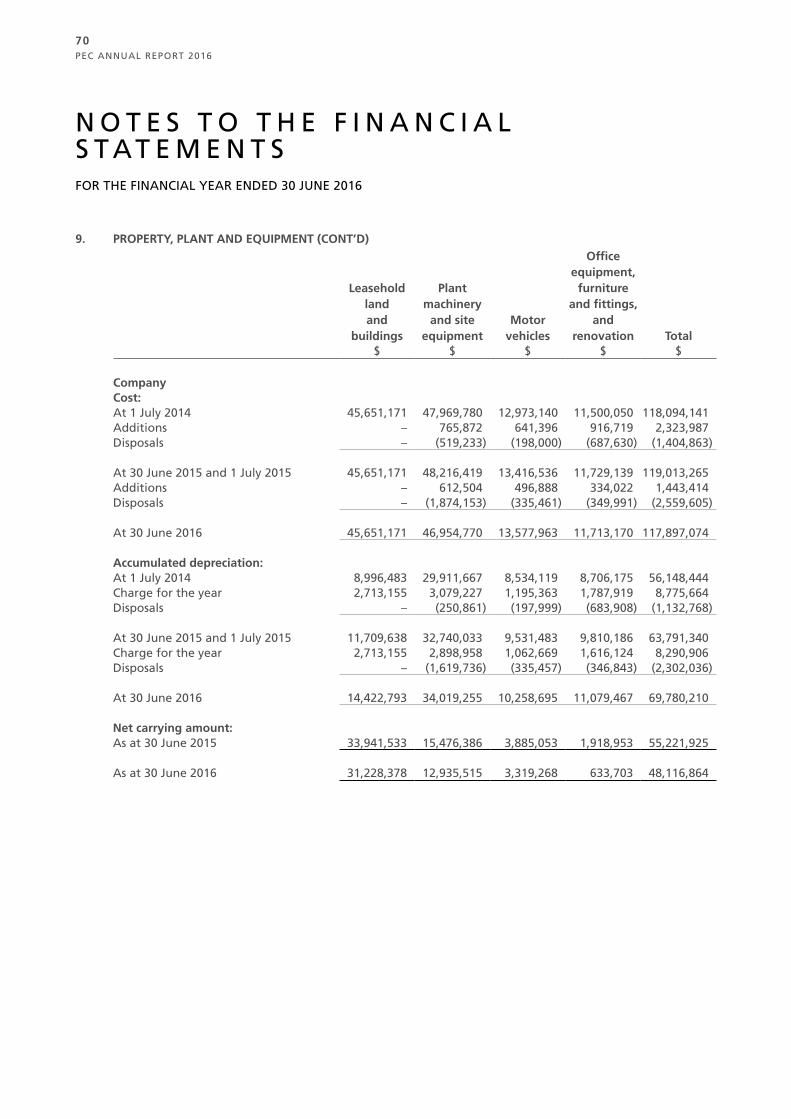
PEC ANNUAL REPORT 2016
70
N O T E S T O T H E F I N A N C I A L S T AT E M E N T SFOR THE FINANCIAL YEAR ENDED 30 JUNE 2016
9. PROPERTY, PLANT AND EQUIPMENT (CONT’D)
Leasehold land and
buildings
Plant machinery
and site equipment
Motor vehicles
Office equipment,
furniture and fittings,
and renovation Total
$ $ $ $ $
CompanyCost: At 1 July 2014 45,651,171 47,969,780 12,973,140 11,500,050 118,094,141Additions – 765,872 641,396 916,719 2,323,987Disposals – (519,233) (198,000) (687,630) (1,404,863)
At 30 June 2015 and 1 July 2015 45,651,171 48,216,419 13,416,536 11,729,139 119,013,265Additions – 612,504 496,888 334,022 1,443,414Disposals – (1,874,153) (335,461) (349,991) (2,559,605)
At 30 June 2016 45,651,171 46,954,770 13,577,963 11,713,170 117,897,074
Accumulated depreciation:At 1 July 2014 8,996,483 29,911,667 8,534,119 8,706,175 56,148,444Charge for the year 2,713,155 3,079,227 1,195,363 1,787,919 8,775,664Disposals – (250,861) (197,999) (683,908) (1,132,768)
At 30 June 2015 and 1 July 2015 11,709,638 32,740,033 9,531,483 9,810,186 63,791,340Charge for the year 2,713,155 2,898,958 1,062,669 1,616,124 8,290,906Disposals – (1,619,736) (335,457) (346,843) (2,302,036)
At 30 June 2016 14,422,793 34,019,255 10,258,695 11,079,467 69,780,210
Net carrying amount:As at 30 June 2015 33,941,533 15,476,386 3,885,053 1,918,953 55,221,925
As at 30 June 2016 31,228,378 12,935,515 3,319,268 633,703 48,116,864

PEC ANNUAL REPORT 2016
71
N O T E S T O T H E F I N A N C I A L S T AT E M E N T SFOR THE FINANCIAL YEAR ENDED 30 JUNE 2016
9. PROPERTY, PLANT AND EQUIPMENT (CONT’D)
Assets held under finance leases
During the current financial year, the Group acquired motor vehicles, plant machinery, site equipment and leasehold land and buildings with cost of $3,644,550 (2015: $259,688) by means of finance leases. The net cash outflow on acquisition of property, plant and equipment amounted to $11,785,481 (2015: $17,603,365).
As at 30 June 2016, carrying amount of motor vehicles, plant machinery and site equipment, office equipment and leasehold land and buildings held under finance leases were $593,014 (2015: $459,765), $Nil (2015: $35,387), $6,170 (2015: $6,439) and $3,366,805 (2015: $Nil) respectively.
Leased assets are pledged as security for the related finance lease liabilities.
Assets pledged as security
In addition to assets held under finance leases, certain of the Group’s leasehold land and building with a carrying amount of $8,152,416 (2015: $9,012,454) are mortgaged to secure one of the Group’s bank loan (Note 25).
Impairment of assets
During the current financial year, a subsidiary of the Group within the project works segment, carried out a review of the recoverable amount of its site equipment as the subsidiary was making losses. An impairment loss of $211,418 (2015: $318,633), representing the write-down of these equipment to the recoverable amount was recognised in “Other operating expenses” line item in profit or loss for the financial year ended 30 June 2016. The recoverable amount was based on the estimated fair value less costs to sell.
Transfer to investment properties
In the previous financial year, the Group transferred a leasehold property to investment property upon the commencement of operating leases to external parties.

PEC ANNUAL REPORT 2016
72
N O T E S T O T H E F I N A N C I A L S T AT E M E N T SFOR THE FINANCIAL YEAR ENDED 30 JUNE 2016
10. INVESTMENT PROPERTIESGroup
Note 2016 2015$ $
Balance sheet
Cost:
At 1 July 8,356,194 7,435,870Disposals – (419,710)Transfer from property, plant and equipment 9 – 2,245,724Transfer to assets held for sale 23 – (905,690)Currency realignment (140,249) –
At 30 June 8,215,945 8,356,194
Accumulated depreciation:
At 1 July 400,108 142,450Charge for the year 7 185,147 190,942Disposals – (8,040)Transfer from property, plant and equipment 9 – 103,482Transfer to assets held for sale 23 – (17,351)Currency realignment (9,022) (11,375)
At 30 June 576,233 400,108
Net carrying amount:
At 30 June 7,639,712 7,956,086
Income statement
Rental income from investment properties:– Minimum lease payments 507,639 399,933
Direct operating expenses (including repairs and maintenance) arising from:
– Rental generating property 490,050 325,411
The Group has no contractual obligations to purchase, construct or develop investment property or for repairs, maintenance or enhancements.
Fair value of the investment properties amounted to $8,742,000 (2015: $9,256,000) by reference to comparable market transactions that consider recent sale of similar properties that have been transacted in the open market.
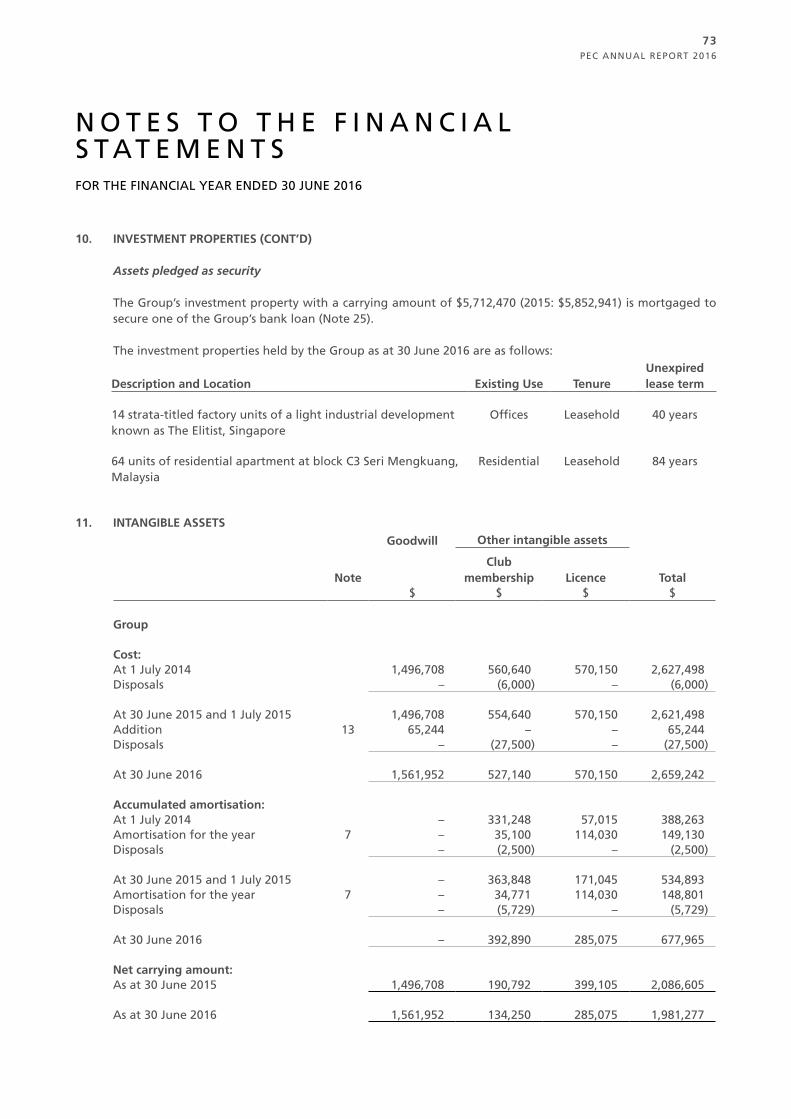
PEC ANNUAL REPORT 2016
73
N O T E S T O T H E F I N A N C I A L S T AT E M E N T SFOR THE FINANCIAL YEAR ENDED 30 JUNE 2016
10. INVESTMENT PROPERTIES (CONT’D)
Assets pledged as security
The Group’s investment property with a carrying amount of $5,712,470 (2015: $5,852,941) is mortgaged to secure one of the Group’s bank loan (Note 25).
The investment properties held by the Group as at 30 June 2016 are as follows:
Description and Location Existing Use TenureUnexpired lease term
14 strata-titled factory units of a light industrial development known as The Elitist, Singapore
Offices Leasehold 40 years
64 units of residential apartment at block C3 Seri Mengkuang, Malaysia
Residential Leasehold 84 years
11. INTANGIBLE ASSETSGoodwill Other intangible assets
NoteClub
membership Licence Total$ $ $ $
Group
Cost:At 1 July 2014 1,496,708 560,640 570,150 2,627,498Disposals – (6,000) – (6,000)
At 30 June 2015 and 1 July 2015 1,496,708 554,640 570,150 2,621,498Addition 13 65,244 – – 65,244Disposals – (27,500) – (27,500)
At 30 June 2016 1,561,952 527,140 570,150 2,659,242
Accumulated amortisation:At 1 July 2014 – 331,248 57,015 388,263Amortisation for the year 7 – 35,100 114,030 149,130Disposals – (2,500) – (2,500)
At 30 June 2015 and 1 July 2015 – 363,848 171,045 534,893Amortisation for the year 7 – 34,771 114,030 148,801Disposals – (5,729) – (5,729)
At 30 June 2016 – 392,890 285,075 677,965
Net carrying amount:As at 30 June 2015 1,496,708 190,792 399,105 2,086,605
As at 30 June 2016 1,561,952 134,250 285,075 1,981,277
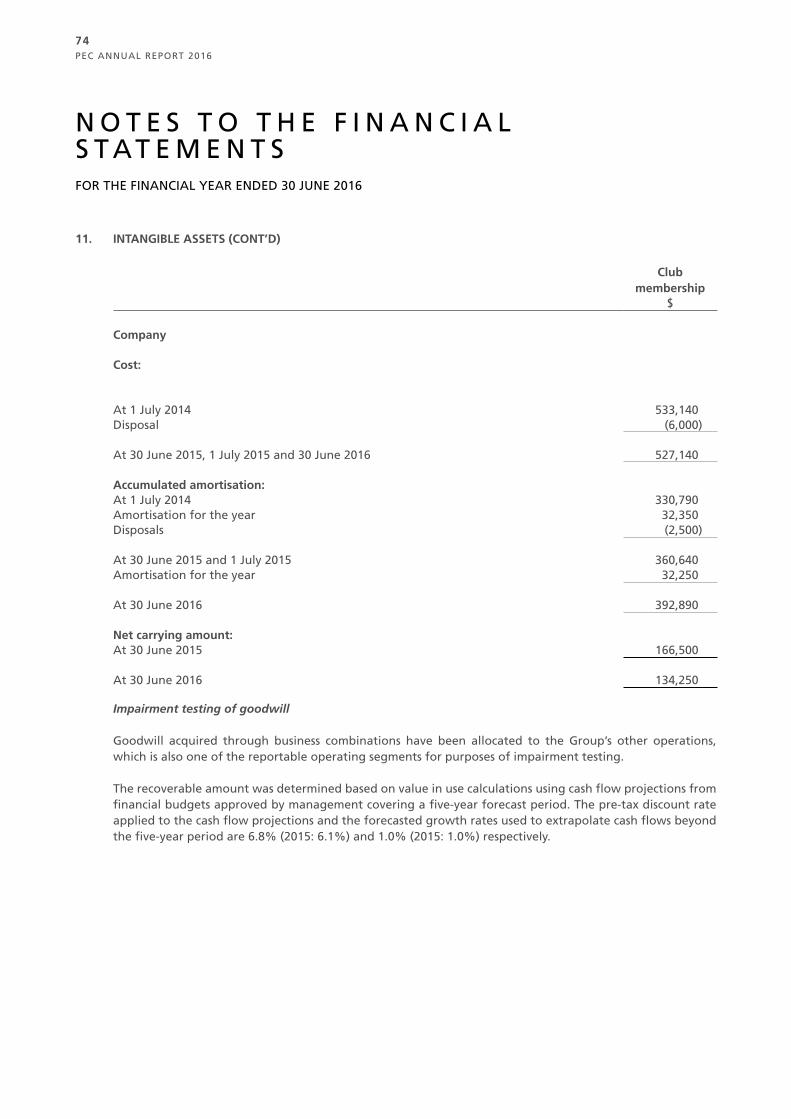
PEC ANNUAL REPORT 2016
74
N O T E S T O T H E F I N A N C I A L S T AT E M E N T SFOR THE FINANCIAL YEAR ENDED 30 JUNE 2016
11. INTANGIBLE ASSETS (CONT’D)
Club membership
$
Company
Cost:
At 1 July 2014 533,140Disposal (6,000)
At 30 June 2015, 1 July 2015 and 30 June 2016 527,140
Accumulated amortisation:At 1 July 2014 330,790Amortisation for the year 32,350Disposals (2,500)
At 30 June 2015 and 1 July 2015 360,640Amortisation for the year 32,250
At 30 June 2016 392,890
Net carrying amount:At 30 June 2015 166,500
At 30 June 2016 134,250
Impairment testing of goodwill
Goodwill acquired through business combinations have been allocated to the Group’s other operations, which is also one of the reportable operating segments for purposes of impairment testing.
The recoverable amount was determined based on value in use calculations using cash flow projections from financial budgets approved by management covering a five-year forecast period. The pre-tax discount rate applied to the cash flow projections and the forecasted growth rates used to extrapolate cash flows beyond the five-year period are 6.8% (2015: 6.1%) and 1.0% (2015: 1.0%) respectively.
PEC ANNUAL REPORT 2016
75
N O T E S T O T H E F I N A N C I A L S T AT E M E N T SFOR THE FINANCIAL YEAR ENDED 30 JUNE 2016
11. INTANGIBLE ASSETS (CONT’D)
Key assumptions used in the value in use calculations
The calculations of value in use for the cash-generating units are most sensitive to the following assumptions:
Growth rates – The forecasted growth rates are based on past performance and its expectation of business developments.
Pre-tax discount rates – Discount rates represents the current market assessment of the risks specific to each cash-generating unit, regarding the time value of money and individual risks of the underlying assets which have not been incorporated in the cash flow estimates. The discount rate calculation is based on the specific circumstances of the Group and its operating segments and derived from its weighted average cost of capital (“WACC”). The WACC takes into account both debt and equity. The cost of equity is derived from the expected return on investment by the Group’s investors. The cost of debt is based on the interest bearing borrowings the Group is obliged to service. Specific risk is incorporated by applying individual beta factors, which are evaluated annually based on publicly available market data.
Sensitivity to changes in assumptions
With regards to the assessment of value in use for goodwill, management believes that no reasonably possible changes in any of the above key assumptions would cause the carrying value of the unit to materially exceed its recoverable amount.
Impairment loss recognised
No impairment loss was recognised in the current financial year in respect of the goodwill attributed to a cash-generating unit.
Other intangible assets
Other intangible assets pertain to licence fee and transferable club memberships. Licence pertains to the right to service and use certain specific equipment. Club memberships are registered in the name of directors and senior managers and are held in trust for the Company. The amortisation expense is included in “Other operating expense” line item in profit or loss. Other intangible assets have a remaining tenure of 3 to 5 years (2015: 4 to 9 years).
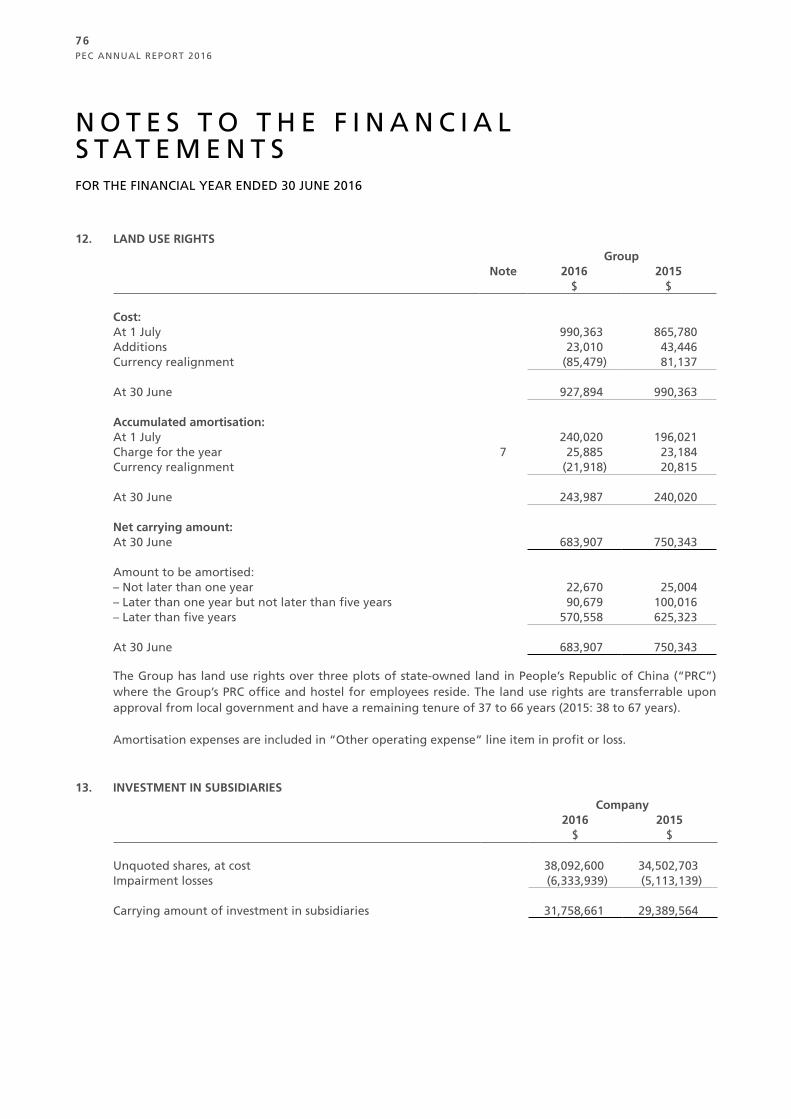
PEC ANNUAL REPORT 2016
76
N O T E S T O T H E F I N A N C I A L S T AT E M E N T SFOR THE FINANCIAL YEAR ENDED 30 JUNE 2016
12. LAND USE RIGHTSGroup
Note 2016 2015$ $
Cost:At 1 July 990,363 865,780Additions 23,010 43,446Currency realignment (85,479) 81,137
At 30 June 927,894 990,363
Accumulated amortisation:At 1 July 240,020 196,021Charge for the year 7 25,885 23,184Currency realignment (21,918) 20,815
At 30 June 243,987 240,020
Net carrying amount:At 30 June 683,907 750,343
Amount to be amortised:– Not later than one year 22,670 25,004– Later than one year but not later than five years 90,679 100,016– Later than five years 570,558 625,323
At 30 June 683,907 750,343
The Group has land use rights over three plots of state-owned land in People’s Republic of China (“PRC”) where the Group’s PRC office and hostel for employees reside. The land use rights are transferrable upon approval from local government and have a remaining tenure of 37 to 66 years (2015: 38 to 67 years).
Amortisation expenses are included in “Other operating expense” line item in profit or loss.
13. INVESTMENT IN SUBSIDIARIESCompany
2016 2015$ $
Unquoted shares, at cost 38,092,600 34,502,703Impairment losses (6,333,939) (5,113,139)
Carrying amount of investment in subsidiaries 31,758,661 29,389,564
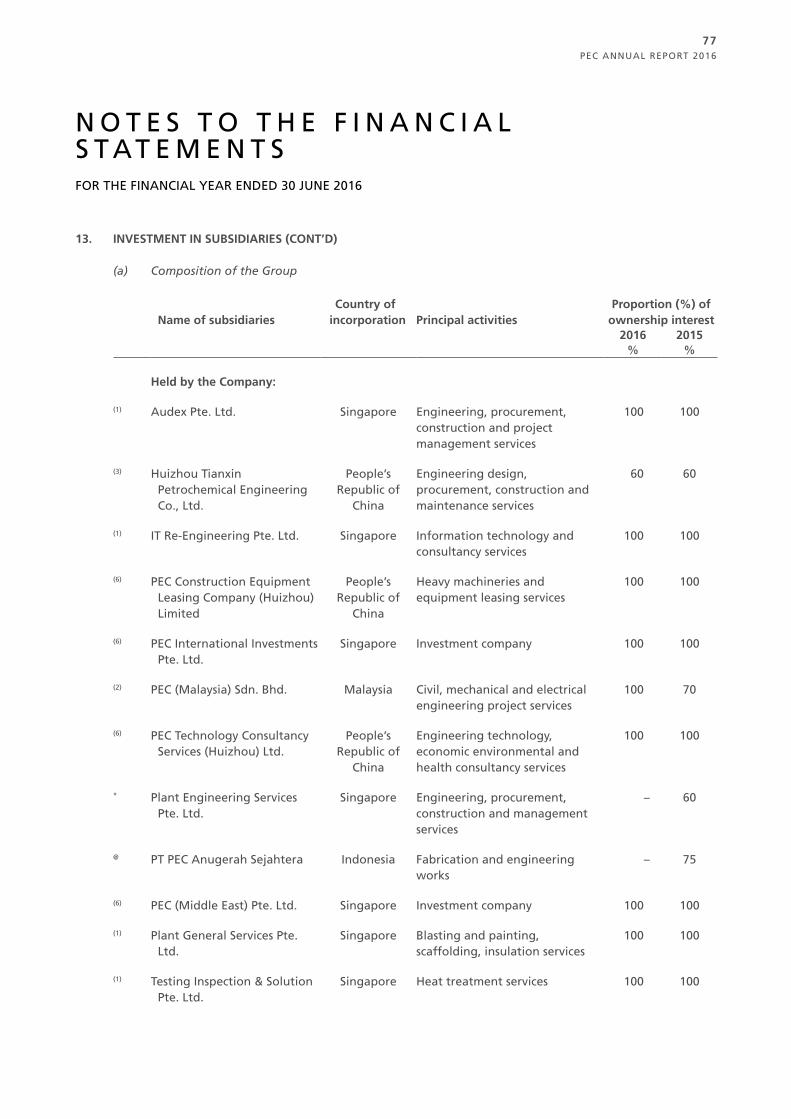
PEC ANNUAL REPORT 2016
77
N O T E S T O T H E F I N A N C I A L S T AT E M E N T SFOR THE FINANCIAL YEAR ENDED 30 JUNE 2016
13. INVESTMENT IN SUBSIDIARIES (CONT’D)
(a) Composition of the Group
Name of subsidiaries Country of
incorporation Principal activitiesProportion (%) of
ownership interest2016 2015
% %
Held by the Company:
(1) Audex Pte. Ltd. Singapore Engineering, procurement, construction and project management services
100 100
(3) Huizhou Tianxin Petrochemical Engineering Co., Ltd.
People’s Republic of
China
Engineering design, procurement, construction and maintenance services
60 60
(1) IT Re-Engineering Pte. Ltd. Singapore Information technology and consultancy services
100 100
(6) PEC Construction Equipment Leasing Company (Huizhou) Limited
People’s Republic of
China
Heavy machineries and equipment leasing services
100 100
(6) PEC International Investments Pte. Ltd.
Singapore Investment company 100 100
(2) PEC (Malaysia) Sdn. Bhd. Malaysia Civil, mechanical and electrical engineering project services
100 70
(6) PEC Technology Consultancy Services (Huizhou) Ltd.
People’s Republic of
China
Engineering technology, economic environmental and health consultancy services
100 100
* Plant Engineering Services Pte. Ltd.
Singapore Engineering, procurement, construction and management services
– 60
@ PT PEC Anugerah Sejahtera Indonesia Fabrication and engineering works
– 75
(6) PEC (Middle East) Pte. Ltd. Singapore Investment company 100 100
(1) Plant General Services Pte. Ltd.
Singapore Blasting and painting, scaffolding, insulation services
100 100
(1) Testing Inspection & Solution Pte. Ltd.
Singapore Heat treatment services 100 100
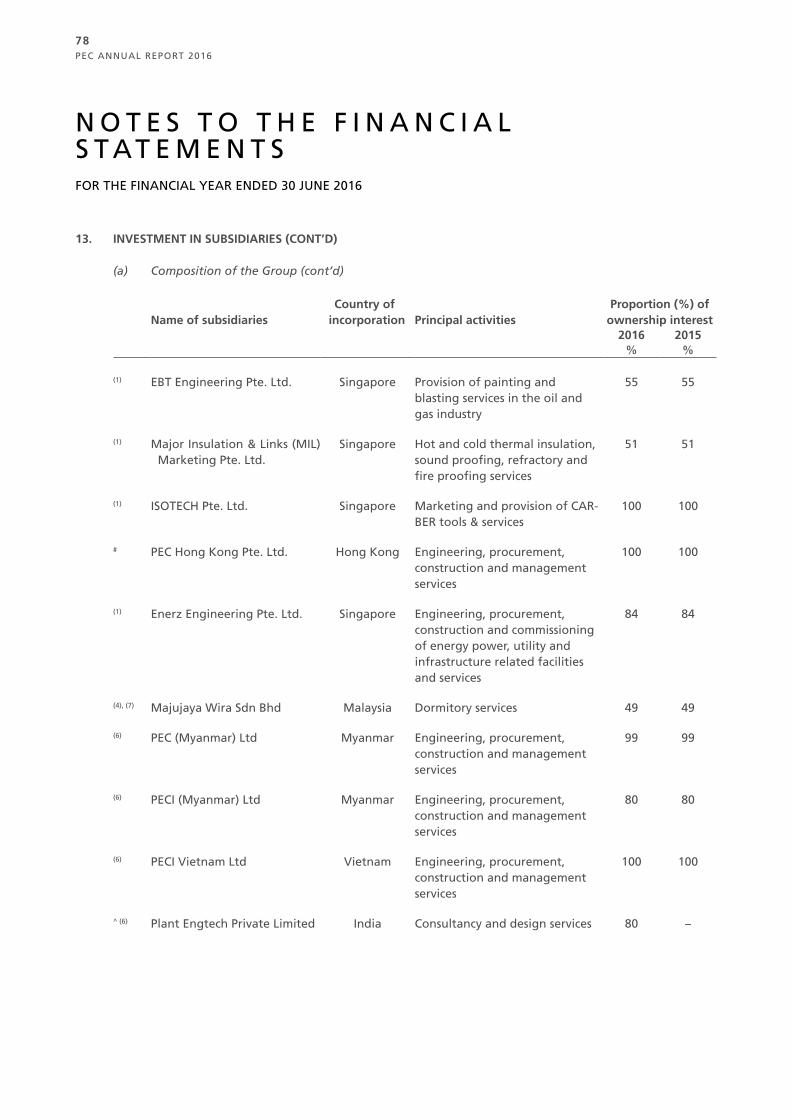
PEC ANNUAL REPORT 2016
78
N O T E S T O T H E F I N A N C I A L S T AT E M E N T SFOR THE FINANCIAL YEAR ENDED 30 JUNE 2016
13. INVESTMENT IN SUBSIDIARIES (CONT’D)
(a) Composition of the Group (cont’d)
Name of subsidiaries Country of
incorporation Principal activitiesProportion (%) of
ownership interest 2016 2015
% %
(1) EBT Engineering Pte. Ltd. Singapore Provision of painting and blasting services in the oil and gas industry
55 55
(1) Major Insulation & Links (MIL) Marketing Pte. Ltd.
Singapore Hot and cold thermal insulation, sound proofing, refractory and fire proofing services
51 51
(1) ISOTECH Pte. Ltd. Singapore Marketing and provision of CAR-BER tools & services
100 100
# PEC Hong Kong Pte. Ltd. Hong Kong Engineering, procurement, construction and management services
100 100
(1) Enerz Engineering Pte. Ltd. Singapore Engineering, procurement, construction and commissioning of energy power, utility and infrastructure related facilities and services
84 84
(4), (7) Majujaya Wira Sdn Bhd Malaysia Dormitory services 49 49
(6) PEC (Myanmar) Ltd Myanmar Engineering, procurement, construction and management services
99 99
(6) PECI (Myanmar) Ltd Myanmar Engineering, procurement, construction and management services
80 80
(6) PECI Vietnam Ltd Vietnam Engineering, procurement, construction and management services
100 100
^ (6) Plant Engtech Private Limited India Consultancy and design services 80 –
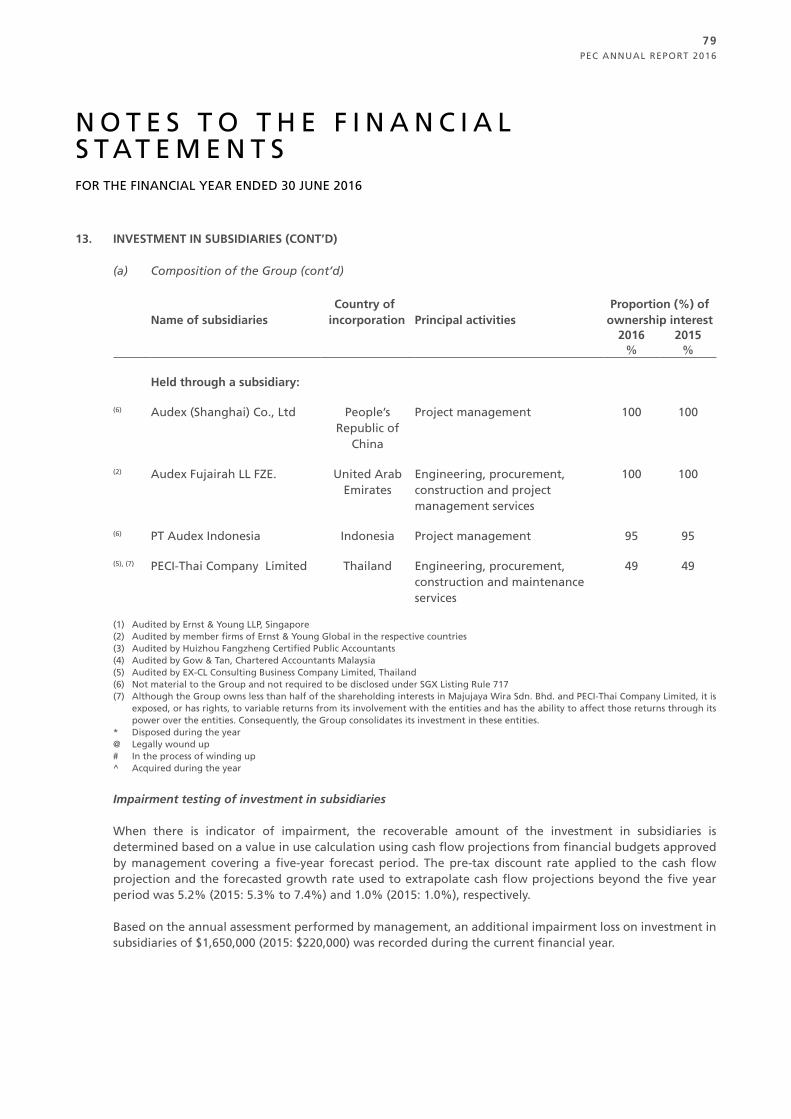
PEC ANNUAL REPORT 2016
79
N O T E S T O T H E F I N A N C I A L S T AT E M E N T SFOR THE FINANCIAL YEAR ENDED 30 JUNE 2016
13. INVESTMENT IN SUBSIDIARIES (CONT’D)
(a) Composition of the Group (cont’d)
Name of subsidiaries Country of
incorporation Principal activitiesProportion (%) of
ownership interest 2016 2015
% %
Held through a subsidiary:
(6) Audex (Shanghai) Co., Ltd People’s Republic of
China
Project management 100 100
(2) Audex Fujairah LL FZE. United Arab Emirates
Engineering, procurement, construction and project management services
100 100
(6) PT Audex Indonesia Indonesia Project management 95 95
(5), (7) PECI-Thai Company Limited Thailand Engineering, procurement, construction and maintenance services
49 49
(1) Audited by Ernst & Young LLP, Singapore(2) Audited by member firms of Ernst & Young Global in the respective countries(3) Audited by Huizhou Fangzheng Certified Public Accountants(4) Audited by Gow & Tan, Chartered Accountants Malaysia (5) Audited by EX-CL Consulting Business Company Limited, Thailand(6) Not material to the Group and not required to be disclosed under SGX Listing Rule 717(7) Although the Group owns less than half of the shareholding interests in Majujaya Wira Sdn. Bhd. and PECI-Thai Company Limited, it is
exposed, or has rights, to variable returns from its involvement with the entities and has the ability to affect those returns through its power over the entities. Consequently, the Group consolidates its investment in these entities.
* Disposed during the year@ Legally wound up# In the process of winding up^ Acquired during the year
Impairment testing of investment in subsidiaries
When there is indicator of impairment, the recoverable amount of the investment in subsidiaries is determined based on a value in use calculation using cash flow projections from financial budgets approved by management covering a five-year forecast period. The pre-tax discount rate applied to the cash flow projection and the forecasted growth rate used to extrapolate cash flow projections beyond the five year period was 5.2% (2015: 5.3% to 7.4%) and 1.0% (2015: 1.0%), respectively.
Based on the annual assessment performed by management, an additional impairment loss on investment in subsidiaries of $1,650,000 (2015: $220,000) was recorded during the current financial year.
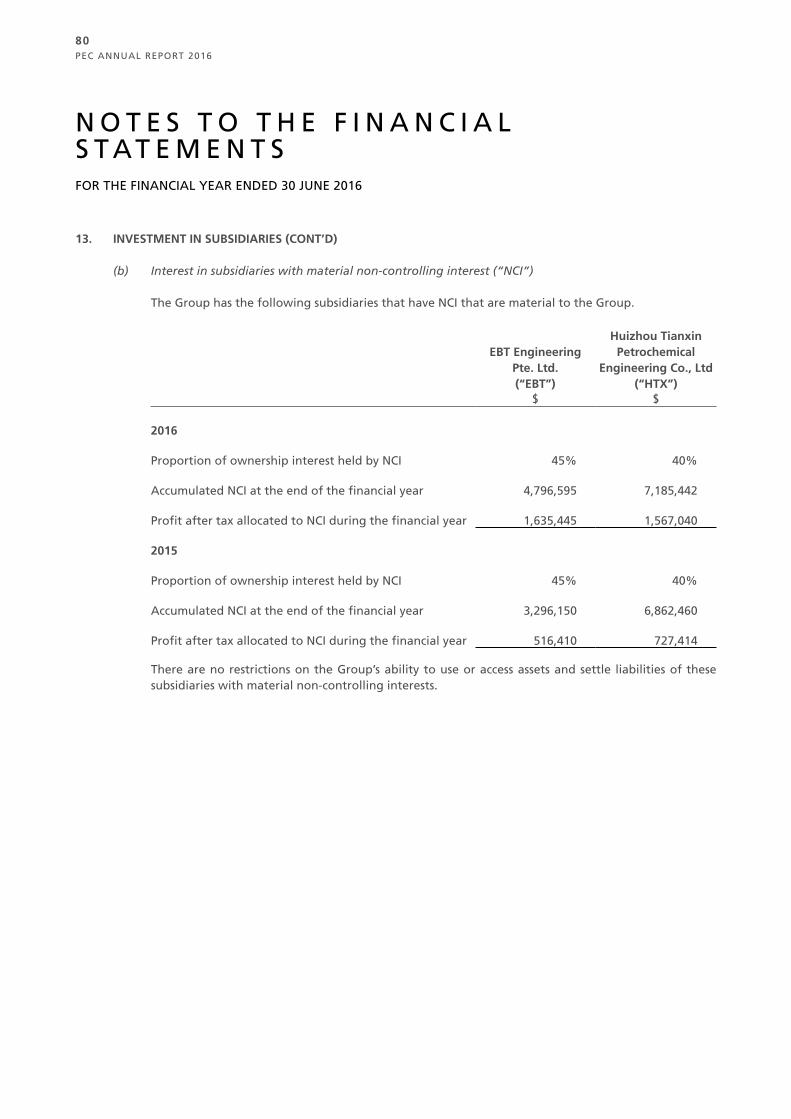
PEC ANNUAL REPORT 2016
80
N O T E S T O T H E F I N A N C I A L S T AT E M E N T SFOR THE FINANCIAL YEAR ENDED 30 JUNE 2016
13. INVESTMENT IN SUBSIDIARIES (CONT’D)
(b) Interest in subsidiaries with material non-controlling interest (“NCI”)
The Group has the following subsidiaries that have NCI that are material to the Group.
EBT Engineering Pte. Ltd. (“EBT”)
Huizhou Tianxin Petrochemical
Engineering Co., Ltd (“HTX”)
$ $
2016
Proportion of ownership interest held by NCI 45% 40%
Accumulated NCI at the end of the financial year 4,796,595 7,185,442
Profit after tax allocated to NCI during the financial year 1,635,445 1,567,040
2015
Proportion of ownership interest held by NCI 45% 40%
Accumulated NCI at the end of the financial year 3,296,150 6,862,460
Profit after tax allocated to NCI during the financial year 516,410 727,414
There are no restrictions on the Group’s ability to use or access assets and settle liabilities of these subsidiaries with material non-controlling interests.

PEC ANNUAL REPORT 2016
81
N O T E S T O T H E F I N A N C I A L S T AT E M E N T SFOR THE FINANCIAL YEAR ENDED 30 JUNE 2016
13. INVESTMENT IN SUBSIDIARIES (CONT’D)
(c) Summarised financial information about subsidiaries with material NCI
Summarised financial information including goodwill on acquisition and consolidation adjustments but before intercompany eliminations of subsidiaries with material non-controlling interests are as follows:
EBT HTX2016 2015 2016 2015
$ $ $ $
Summarised balance sheets
Non-current assets 11,659,844 10,867,853 9,292,154 8,649,897Current assets 6,779,330 6,026,311 15,615,271 13,211,774Non-current liabilities (5,789,448) (7,182,110) – –Current liabilities (1,990,626) (2,387,277) (6,943,820) (4,705,521)
Net assets 10,659,100 7,324,777 17,963,605 17,156,150
Summarised statement of comprehensive income
Revenue 9,277,863 9,489,568 30,687,485 20,793,280Profit for the year 3,634,323 1,147,567 3,917,602 1,818,535Other comprehensive income – – (1,689,145) 1,353,217
Total comprehensive income 3,634,323 1,147,567 2,228,457 3,171,752
Other summarised information
Dividends paid to NCI (135,000) – (568,401) –
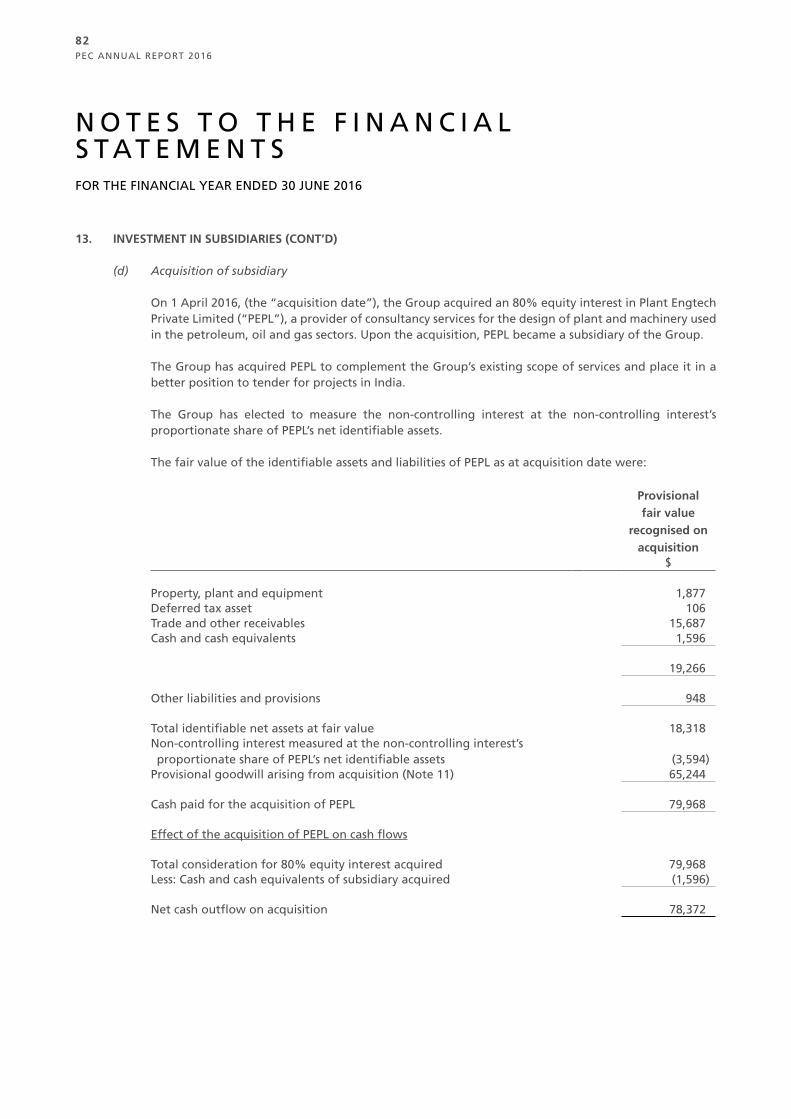
PEC ANNUAL REPORT 2016
82
N O T E S T O T H E F I N A N C I A L S T AT E M E N T SFOR THE FINANCIAL YEAR ENDED 30 JUNE 2016
13. INVESTMENT IN SUBSIDIARIES (CONT’D)
(d) Acquisition of subsidiary
On 1 April 2016, (the “acquisition date”), the Group acquired an 80% equity interest in Plant Engtech Private Limited (“PEPL”), a provider of consultancy services for the design of plant and machinery used in the petroleum, oil and gas sectors. Upon the acquisition, PEPL became a subsidiary of the Group.
The Group has acquired PEPL to complement the Group’s existing scope of services and place it in a better position to tender for projects in India.
The Group has elected to measure the non-controlling interest at the non-controlling interest’s proportionate share of PEPL’s net identifiable assets.
The fair value of the identifiable assets and liabilities of PEPL as at acquisition date were:
Provisional fair value
recognised on acquisition
$
Property, plant and equipment 1,877Deferred tax asset 106Trade and other receivables 15,687Cash and cash equivalents 1,596
19,266
Other liabilities and provisions 948
Total identifiable net assets at fair value 18,318Non-controlling interest measured at the non-controlling interest’s proportionate share of PEPL’s net identifiable assets (3,594)
Provisional goodwill arising from acquisition (Note 11) 65,244
Cash paid for the acquisition of PEPL 79,968
Effect of the acquisition of PEPL on cash flows
Total consideration for 80% equity interest acquired 79,968Less: Cash and cash equivalents of subsidiary acquired (1,596)
Net cash outflow on acquisition 78,372
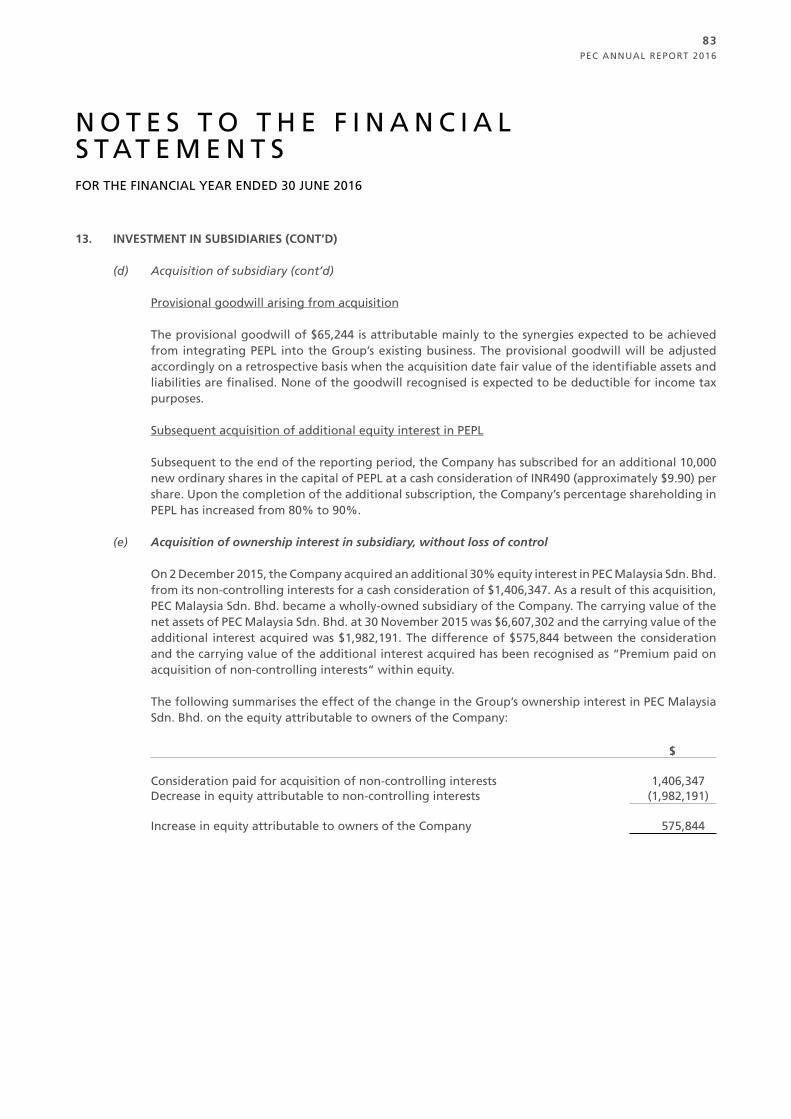
PEC ANNUAL REPORT 2016
83
N O T E S T O T H E F I N A N C I A L S T AT E M E N T SFOR THE FINANCIAL YEAR ENDED 30 JUNE 2016
13. INVESTMENT IN SUBSIDIARIES (CONT’D)
(d) Acquisition of subsidiary (cont’d) Provisional goodwill arising from acquisition
The provisional goodwill of $65,244 is attributable mainly to the synergies expected to be achieved from integrating PEPL into the Group’s existing business. The provisional goodwill will be adjusted accordingly on a retrospective basis when the acquisition date fair value of the identifiable assets and liabilities are finalised. None of the goodwill recognised is expected to be deductible for income tax purposes.
Subsequent acquisition of additional equity interest in PEPL
Subsequent to the end of the reporting period, the Company has subscribed for an additional 10,000 new ordinary shares in the capital of PEPL at a cash consideration of INR490 (approximately $9.90) per share. Upon the completion of the additional subscription, the Company’s percentage shareholding in PEPL has increased from 80% to 90%.
(e) Acquisition of ownership interest in subsidiary, without loss of control
On 2 December 2015, the Company acquired an additional 30% equity interest in PEC Malaysia Sdn. Bhd. from its non-controlling interests for a cash consideration of $1,406,347. As a result of this acquisition, PEC Malaysia Sdn. Bhd. became a wholly-owned subsidiary of the Company. The carrying value of the net assets of PEC Malaysia Sdn. Bhd. at 30 November 2015 was $6,607,302 and the carrying value of the additional interest acquired was $1,982,191. The difference of $575,844 between the consideration and the carrying value of the additional interest acquired has been recognised as “Premium paid on acquisition of non-controlling interests“ within equity.
The following summarises the effect of the change in the Group’s ownership interest in PEC Malaysia Sdn. Bhd. on the equity attributable to owners of the Company:
$
Consideration paid for acquisition of non-controlling interests 1,406,347Decrease in equity attributable to non-controlling interests (1,982,191)
Increase in equity attributable to owners of the Company 575,844
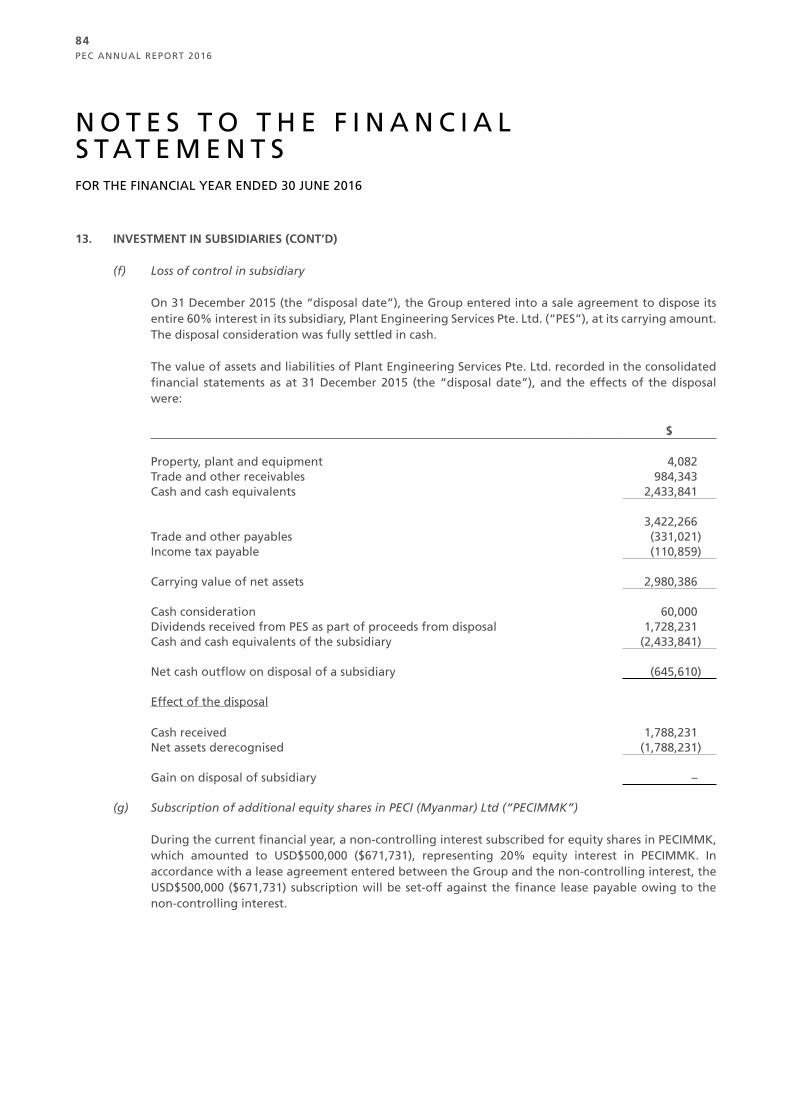
PEC ANNUAL REPORT 2016
84
N O T E S T O T H E F I N A N C I A L S T AT E M E N T SFOR THE FINANCIAL YEAR ENDED 30 JUNE 2016
13. INVESTMENT IN SUBSIDIARIES (CONT’D)
(f) Loss of control in subsidiary
On 31 December 2015 (the “disposal date”), the Group entered into a sale agreement to dispose its entire 60% interest in its subsidiary, Plant Engineering Services Pte. Ltd. (“PES”), at its carrying amount. The disposal consideration was fully settled in cash.
The value of assets and liabilities of Plant Engineering Services Pte. Ltd. recorded in the consolidated financial statements as at 31 December 2015 (the “disposal date”), and the effects of the disposal were:
$
Property, plant and equipment 4,082Trade and other receivables 984,343Cash and cash equivalents 2,433,841
3,422,266Trade and other payables (331,021)Income tax payable (110,859)
Carrying value of net assets 2,980,386
Cash consideration 60,000Dividends received from PES as part of proceeds from disposal 1,728,231Cash and cash equivalents of the subsidiary (2,433,841)
Net cash outflow on disposal of a subsidiary (645,610)
Effect of the disposal
Cash received 1,788,231Net assets derecognised (1,788,231)
Gain on disposal of subsidiary –
(g) Subscription of additional equity shares in PECI (Myanmar) Ltd (“PECIMMK”)
During the current financial year, a non-controlling interest subscribed for equity shares in PECIMMK, which amounted to USD$500,000 ($671,731), representing 20% equity interest in PECIMMK. In accordance with a lease agreement entered between the Group and the non-controlling interest, the USD$500,000 ($671,731) subscription will be set-off against the finance lease payable owing to the non-controlling interest.
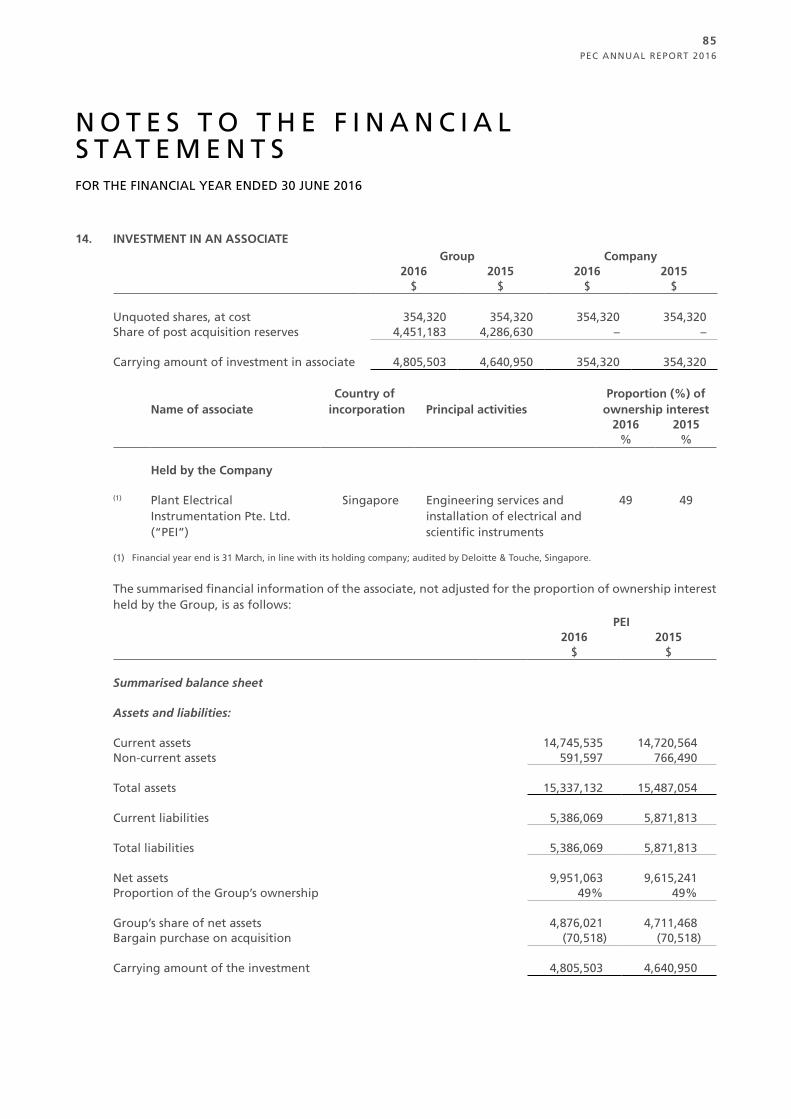
PEC ANNUAL REPORT 2016
85
N O T E S T O T H E F I N A N C I A L S T AT E M E N T SFOR THE FINANCIAL YEAR ENDED 30 JUNE 2016
14. INVESTMENT IN AN ASSOCIATEGroup Company
2016 2015 2016 2015$ $ $ $
Unquoted shares, at cost 354,320 354,320 354,320 354,320Share of post acquisition reserves 4,451,183 4,286,630 – –
Carrying amount of investment in associate 4,805,503 4,640,950 354,320 354,320
Name of associateCountry of
incorporation Principal activitiesProportion (%) of
ownership interest 2016 2015
% %
Held by the Company
(1) Plant Electrical Instrumentation Pte. Ltd. (“PEI”)
Singapore Engineering services and installation of electrical and scientific instruments
49 49
(1) Financial year end is 31 March, in line with its holding company; audited by Deloitte & Touche, Singapore.
The summarised financial information of the associate, not adjusted for the proportion of ownership interest held by the Group, is as follows:
PEI2016 2015
$ $
Summarised balance sheet
Assets and liabilities:
Current assets 14,745,535 14,720,564Non-current assets 591,597 766,490
Total assets 15,337,132 15,487,054
Current liabilities 5,386,069 5,871,813
Total liabilities 5,386,069 5,871,813
Net assets 9,951,063 9,615,241Proportion of the Group’s ownership 49% 49%
Group’s share of net assets 4,876,021 4,711,468Bargain purchase on acquisition (70,518) (70,518)
Carrying amount of the investment 4,805,503 4,640,950
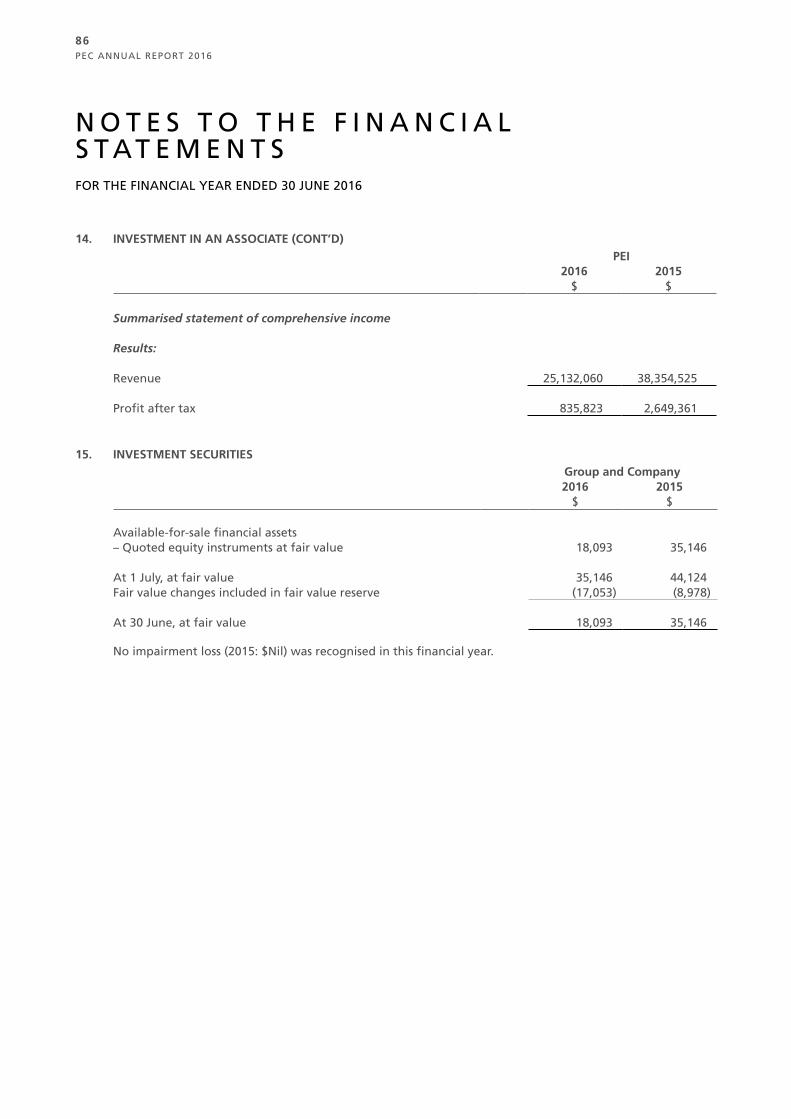
PEC ANNUAL REPORT 2016
86
N O T E S T O T H E F I N A N C I A L S T AT E M E N T SFOR THE FINANCIAL YEAR ENDED 30 JUNE 2016
14. INVESTMENT IN AN ASSOCIATE (CONT’D)PEI
2016 2015$ $
Summarised statement of comprehensive income
Results:
Revenue 25,132,060 38,354,525
Profit after tax 835,823 2,649,361
15. INVESTMENT SECURITIESGroup and Company2016 2015
$ $
Available-for-sale financial assets– Quoted equity instruments at fair value 18,093 35,146
At 1 July, at fair value 35,146 44,124Fair value changes included in fair value reserve (17,053) (8,978)
At 30 June, at fair value 18,093 35,146
No impairment loss (2015: $Nil) was recognised in this financial year.
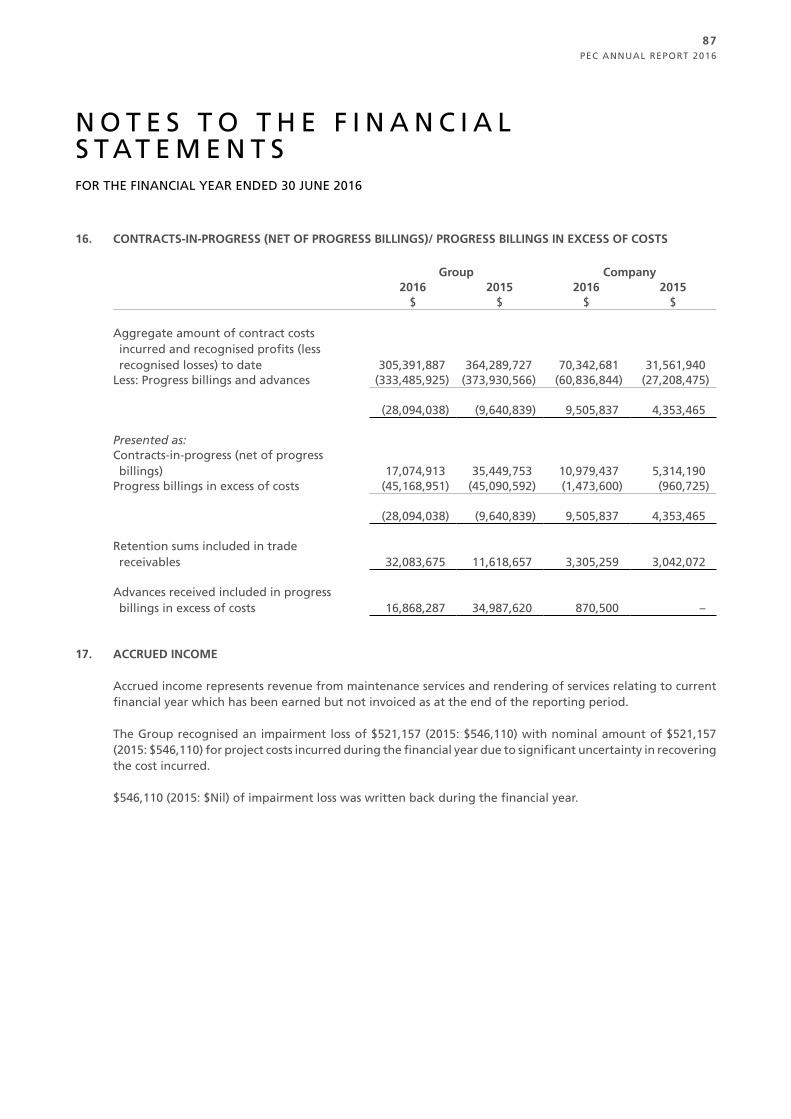
PEC ANNUAL REPORT 2016
87
N O T E S T O T H E F I N A N C I A L S T AT E M E N T SFOR THE FINANCIAL YEAR ENDED 30 JUNE 2016
16. CONTRACTS-IN-PROGRESS (NET OF PROGRESS BILLINGS)/ PROGRESS BILLINGS IN EXCESS OF COSTS
Group Company2016 2015 2016 2015
$ $ $ $
Aggregate amount of contract costs incurred and recognised profits (less recognised losses) to date 305,391,887 364,289,727 70,342,681 31,561,940
Less: Progress billings and advances (333,485,925) (373,930,566) (60,836,844) (27,208,475)
(28,094,038) (9,640,839) 9,505,837 4,353,465
Presented as:Contracts-in-progress (net of progress billings) 17,074,913 35,449,753 10,979,437 5,314,190
Progress billings in excess of costs (45,168,951) (45,090,592) (1,473,600) (960,725)
(28,094,038) (9,640,839) 9,505,837 4,353,465
Retention sums included in trade receivables 32,083,675 11,618,657 3,305,259 3,042,072
Advances received included in progress billings in excess of costs 16,868,287 34,987,620 870,500 –
17. ACCRUED INCOME
Accrued income represents revenue from maintenance services and rendering of services relating to current financial year which has been earned but not invoiced as at the end of the reporting period.
The Group recognised an impairment loss of $521,157 (2015: $546,110) with nominal amount of $521,157 (2015: $546,110) for project costs incurred during the financial year due to significant uncertainty in recovering the cost incurred.
$546,110 (2015: $Nil) of impairment loss was written back during the financial year.
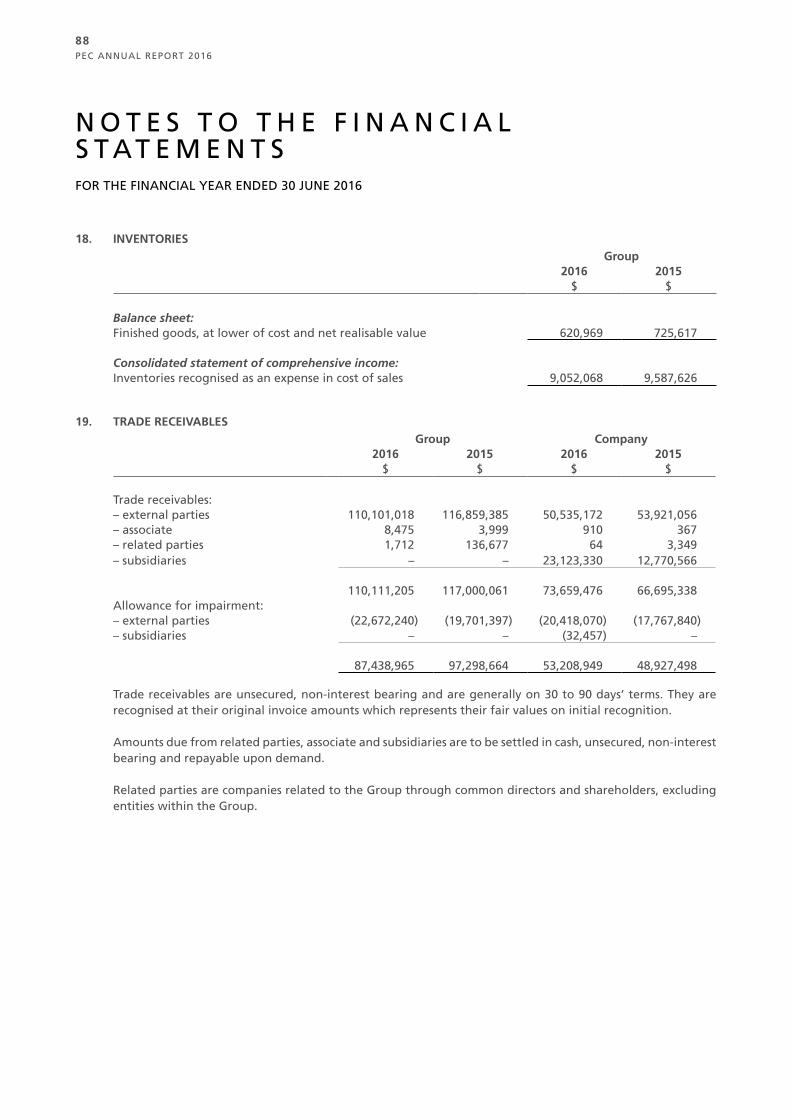
PEC ANNUAL REPORT 2016
88
N O T E S T O T H E F I N A N C I A L S T AT E M E N T SFOR THE FINANCIAL YEAR ENDED 30 JUNE 2016
18. INVENTORIESGroup
2016 2015$ $
Balance sheet:Finished goods, at lower of cost and net realisable value 620,969 725,617
Consolidated statement of comprehensive income:Inventories recognised as an expense in cost of sales 9,052,068 9,587,626
19. TRADE RECEIVABLESGroup Company
2016 2015 2016 2015$ $ $ $
Trade receivables: – external parties 110,101,018 116,859,385 50,535,172 53,921,056– associate 8,475 3,999 910 367– related parties 1,712 136,677 64 3,349– subsidiaries – – 23,123,330 12,770,566
110,111,205 117,000,061 73,659,476 66,695,338Allowance for impairment:– external parties (22,672,240) (19,701,397) (20,418,070) (17,767,840)– subsidiaries – – (32,457) –
87,438,965 97,298,664 53,208,949 48,927,498
Trade receivables are unsecured, non-interest bearing and are generally on 30 to 90 days’ terms. They are recognised at their original invoice amounts which represents their fair values on initial recognition.
Amounts due from related parties, associate and subsidiaries are to be settled in cash, unsecured, non-interest bearing and repayable upon demand.
Related parties are companies related to the Group through common directors and shareholders, excluding entities within the Group.
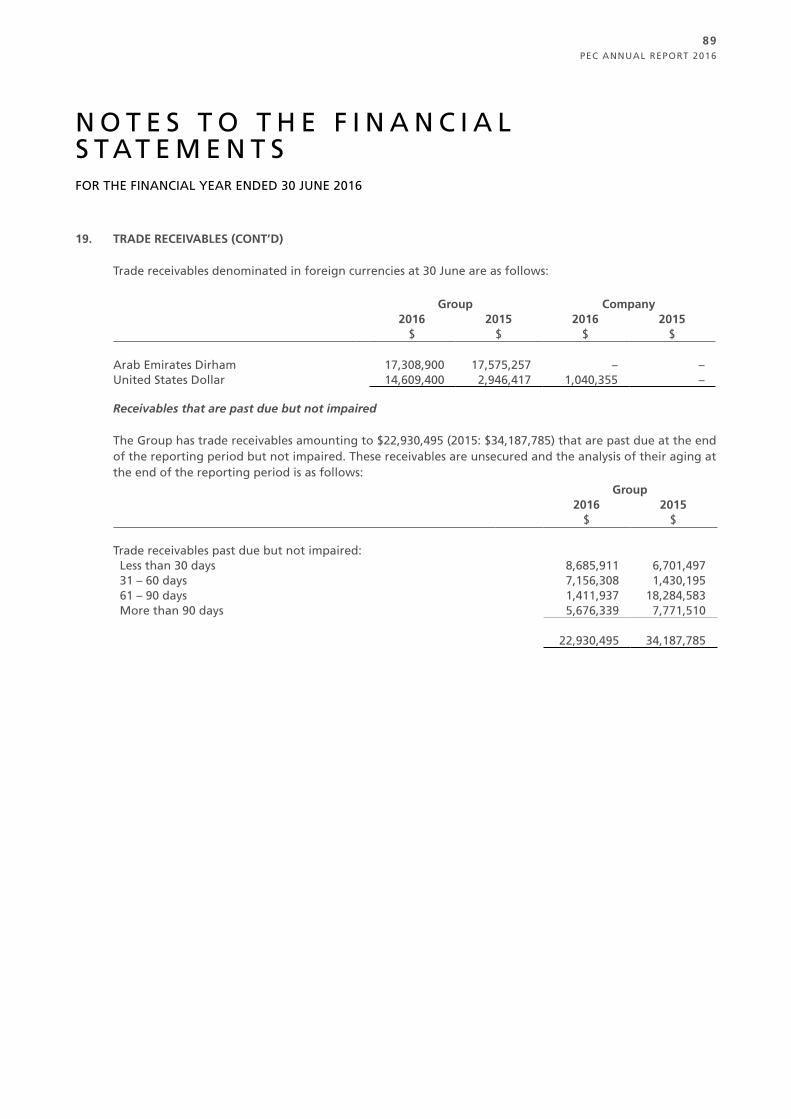
PEC ANNUAL REPORT 2016
89
N O T E S T O T H E F I N A N C I A L S T AT E M E N T SFOR THE FINANCIAL YEAR ENDED 30 JUNE 2016
19. TRADE RECEIVABLES (CONT’D)
Trade receivables denominated in foreign currencies at 30 June are as follows:
Group Company2016 2015 2016 2015
$ $ $ $
Arab Emirates Dirham 17,308,900 17,575,257 – –United States Dollar 14,609,400 2,946,417 1,040,355 –
Receivables that are past due but not impaired
The Group has trade receivables amounting to $22,930,495 (2015: $34,187,785) that are past due at the end of the reporting period but not impaired. These receivables are unsecured and the analysis of their aging at the end of the reporting period is as follows:
Group2016 2015
$ $
Trade receivables past due but not impaired: Less than 30 days 8,685,911 6,701,497 31 – 60 days 7,156,308 1,430,195 61 – 90 days 1,411,937 18,284,583 More than 90 days 5,676,339 7,771,510
22,930,495 34,187,785
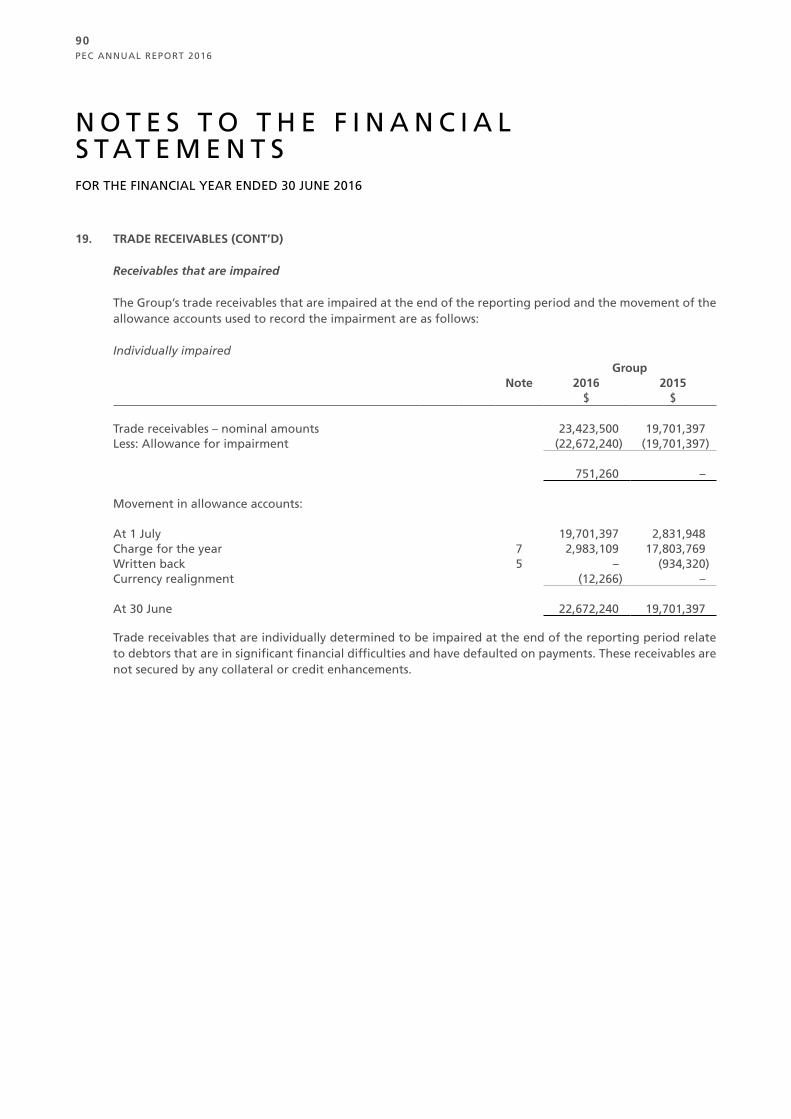
PEC ANNUAL REPORT 2016
90
N O T E S T O T H E F I N A N C I A L S T AT E M E N T SFOR THE FINANCIAL YEAR ENDED 30 JUNE 2016
19. TRADE RECEIVABLES (CONT’D)
Receivables that are impaired
The Group’s trade receivables that are impaired at the end of the reporting period and the movement of the allowance accounts used to record the impairment are as follows:
Individually impairedGroup
Note 2016 2015$ $
Trade receivables – nominal amounts 23,423,500 19,701,397Less: Allowance for impairment (22,672,240) (19,701,397)
751,260 –
Movement in allowance accounts:
At 1 July 19,701,397 2,831,948Charge for the year 7 2,983,109 17,803,769Written back 5 – (934,320)Currency realignment (12,266) –
At 30 June 22,672,240 19,701,397
Trade receivables that are individually determined to be impaired at the end of the reporting period relate to debtors that are in significant financial difficulties and have defaulted on payments. These receivables are not secured by any collateral or credit enhancements.
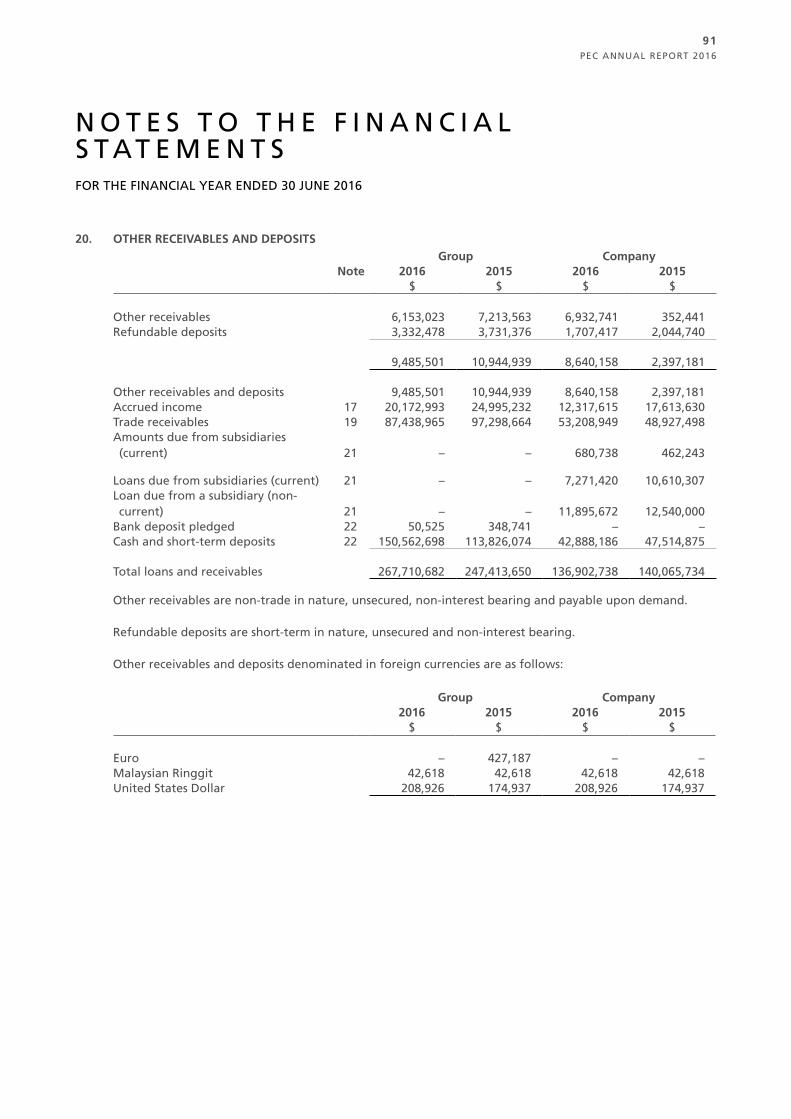
PEC ANNUAL REPORT 2016
91
N O T E S T O T H E F I N A N C I A L S T AT E M E N T SFOR THE FINANCIAL YEAR ENDED 30 JUNE 2016
20. OTHER RECEIVABLES AND DEPOSITSGroup Company
Note 2016 2015 2016 2015$ $ $ $
Other receivables 6,153,023 7,213,563 6,932,741 352,441Refundable deposits 3,332,478 3,731,376 1,707,417 2,044,740
9,485,501 10,944,939 8,640,158 2,397,181
Other receivables and deposits 9,485,501 10,944,939 8,640,158 2,397,181Accrued income 17 20,172,993 24,995,232 12,317,615 17,613,630Trade receivables 19 87,438,965 97,298,664 53,208,949 48,927,498Amounts due from subsidiaries (current) 21 – – 680,738 462,243
Loans due from subsidiaries (current) 21 – – 7,271,420 10,610,307Loan due from a subsidiary (non-current) 21 – – 11,895,672 12,540,000
Bank deposit pledged 22 50,525 348,741 – –Cash and short-term deposits 22 150,562,698 113,826,074 42,888,186 47,514,875
Total loans and receivables 267,710,682 247,413,650 136,902,738 140,065,734
Other receivables are non-trade in nature, unsecured, non-interest bearing and payable upon demand.
Refundable deposits are short-term in nature, unsecured and non-interest bearing.
Other receivables and deposits denominated in foreign currencies are as follows:
Group Company2016 2015 2016 2015
$ $ $ $
Euro – 427,187 – –Malaysian Ringgit 42,618 42,618 42,618 42,618United States Dollar 208,926 174,937 208,926 174,937
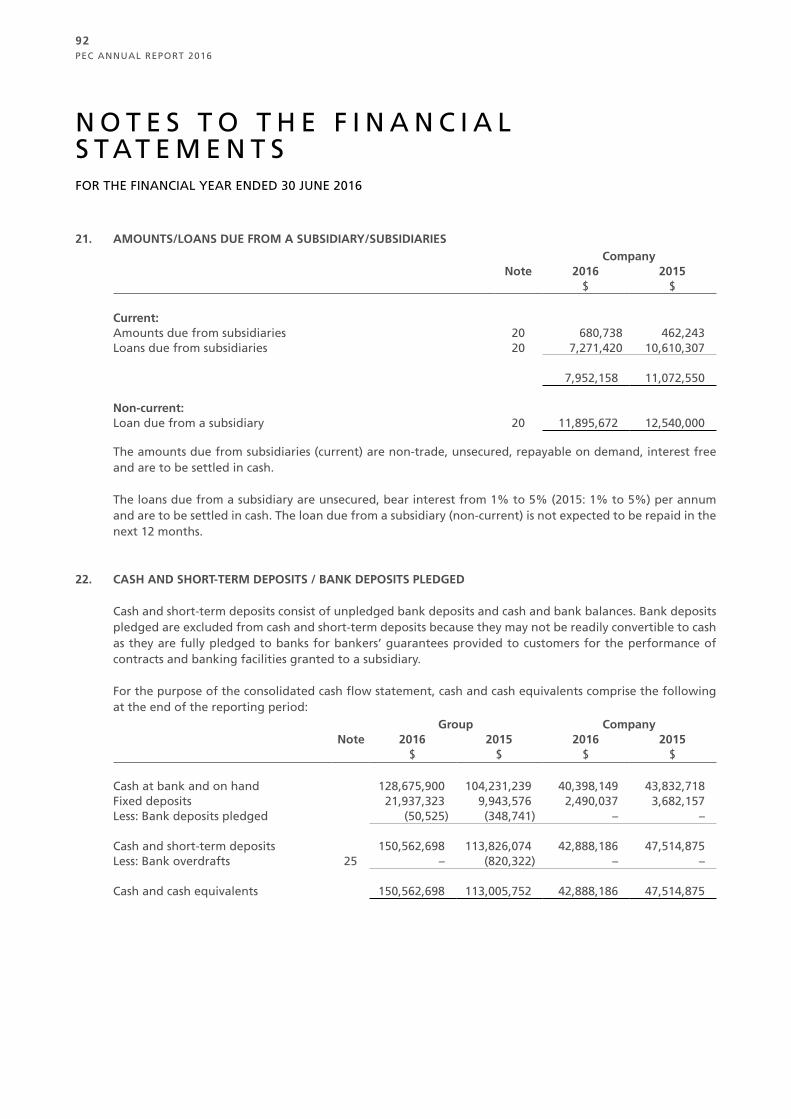
PEC ANNUAL REPORT 2016
92
N O T E S T O T H E F I N A N C I A L S T AT E M E N T SFOR THE FINANCIAL YEAR ENDED 30 JUNE 2016
21. AMOUNTS/LOANS DUE FROM A SUBSIDIARY/SUBSIDIARIESCompany
Note 2016 2015$ $
Current:Amounts due from subsidiaries 20 680,738 462,243Loans due from subsidiaries 20 7,271,420 10,610,307
7,952,158 11,072,550
Non-current:Loan due from a subsidiary 20 11,895,672 12,540,000
The amounts due from subsidiaries (current) are non-trade, unsecured, repayable on demand, interest free and are to be settled in cash.
The loans due from a subsidiary are unsecured, bear interest from 1% to 5% (2015: 1% to 5%) per annum and are to be settled in cash. The loan due from a subsidiary (non-current) is not expected to be repaid in the next 12 months.
22. CASH AND SHORT-TERM DEPOSITS / BANK DEPOSITS PLEDGED
Cash and short-term deposits consist of unpledged bank deposits and cash and bank balances. Bank deposits pledged are excluded from cash and short-term deposits because they may not be readily convertible to cash as they are fully pledged to banks for bankers’ guarantees provided to customers for the performance of contracts and banking facilities granted to a subsidiary.
For the purpose of the consolidated cash flow statement, cash and cash equivalents comprise the following at the end of the reporting period:
Group CompanyNote 2016 2015 2016 2015
$ $ $ $
Cash at bank and on hand 128,675,900 104,231,239 40,398,149 43,832,718Fixed deposits 21,937,323 9,943,576 2,490,037 3,682,157Less: Bank deposits pledged (50,525) (348,741) – –
Cash and short-term deposits 150,562,698 113,826,074 42,888,186 47,514,875Less: Bank overdrafts 25 – (820,322) – –
Cash and cash equivalents 150,562,698 113,005,752 42,888,186 47,514,875
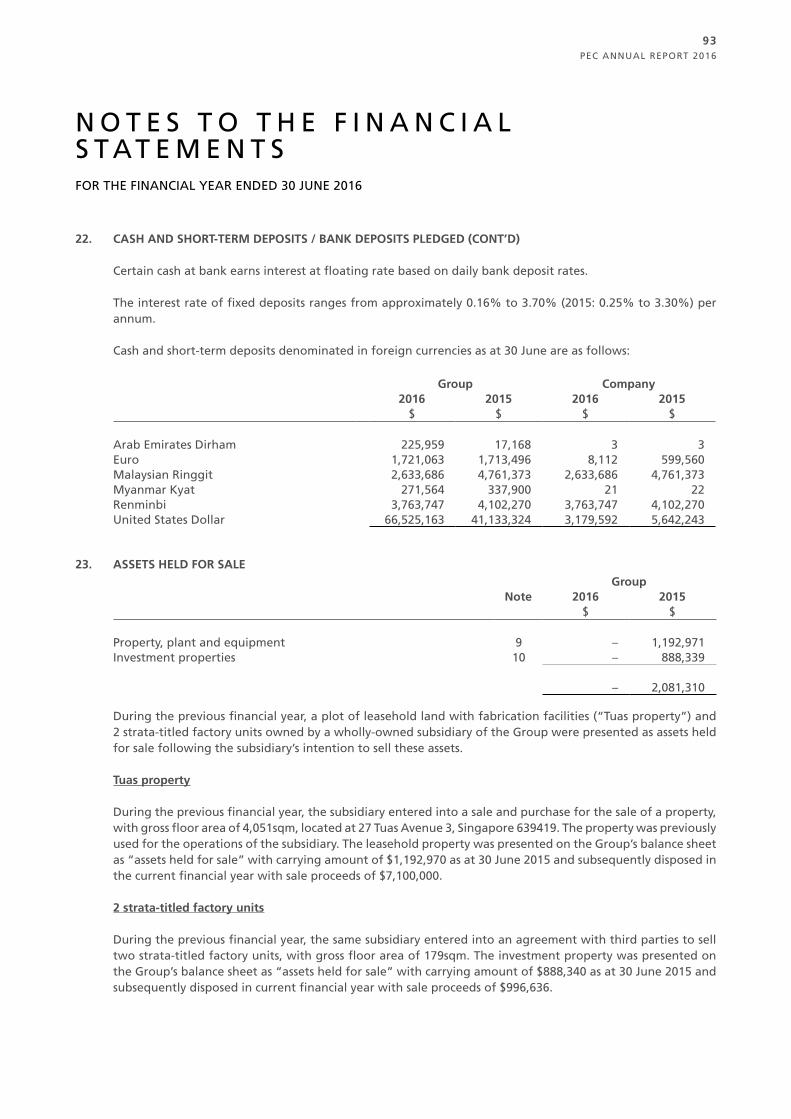
PEC ANNUAL REPORT 2016
93
N O T E S T O T H E F I N A N C I A L S T AT E M E N T SFOR THE FINANCIAL YEAR ENDED 30 JUNE 2016
22. CASH AND SHORT-TERM DEPOSITS / BANK DEPOSITS PLEDGED (CONT’D)
Certain cash at bank earns interest at floating rate based on daily bank deposit rates.
The interest rate of fixed deposits ranges from approximately 0.16% to 3.70% (2015: 0.25% to 3.30%) per annum.
Cash and short-term deposits denominated in foreign currencies as at 30 June are as follows:
Group Company2016 2015 2016 2015
$ $ $ $
Arab Emirates Dirham 225,959 17,168 3 3Euro 1,721,063 1,713,496 8,112 599,560Malaysian Ringgit 2,633,686 4,761,373 2,633,686 4,761,373Myanmar Kyat 271,564 337,900 21 22Renminbi 3,763,747 4,102,270 3,763,747 4,102,270United States Dollar 66,525,163 41,133,324 3,179,592 5,642,243
23. ASSETS HELD FOR SALEGroup
Note 2016 2015$ $
Property, plant and equipment 9 – 1,192,971Investment properties 10 – 888,339
– 2,081,310
During the previous financial year, a plot of leasehold land with fabrication facilities (“Tuas property”) and 2 strata-titled factory units owned by a wholly-owned subsidiary of the Group were presented as assets held for sale following the subsidiary’s intention to sell these assets.
Tuas property
During the previous financial year, the subsidiary entered into a sale and purchase for the sale of a property, with gross floor area of 4,051sqm, located at 27 Tuas Avenue 3, Singapore 639419. The property was previously used for the operations of the subsidiary. The leasehold property was presented on the Group’s balance sheet as “assets held for sale” with carrying amount of $1,192,970 as at 30 June 2015 and subsequently disposed in the current financial year with sale proceeds of $7,100,000.
2 strata-titled factory units
During the previous financial year, the same subsidiary entered into an agreement with third parties to sell two strata-titled factory units, with gross floor area of 179sqm. The investment property was presented on the Group’s balance sheet as “assets held for sale” with carrying amount of $888,340 as at 30 June 2015 and subsequently disposed in current financial year with sale proceeds of $996,636.
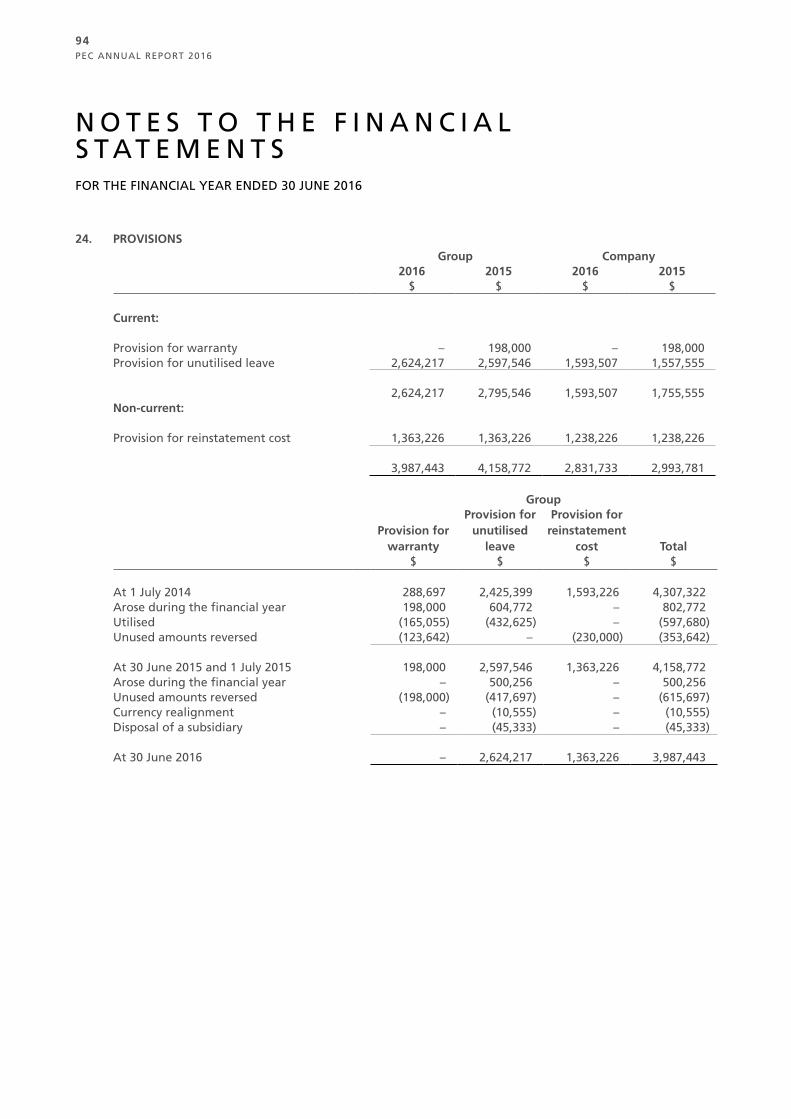
PEC ANNUAL REPORT 2016
94
N O T E S T O T H E F I N A N C I A L S T AT E M E N T SFOR THE FINANCIAL YEAR ENDED 30 JUNE 2016
24. PROVISIONSGroup Company
2016 2015 2016 2015$ $ $ $
Current:
Provision for warranty – 198,000 – 198,000Provision for unutilised leave 2,624,217 2,597,546 1,593,507 1,557,555
2,624,217 2,795,546 1,593,507 1,755,555Non-current:
Provision for reinstatement cost 1,363,226 1,363,226 1,238,226 1,238,226
3,987,443 4,158,772 2,831,733 2,993,781
Group
Provision for warranty
Provision for unutilised
leave
Provision for reinstatement
cost Total$ $ $ $
At 1 July 2014 288,697 2,425,399 1,593,226 4,307,322Arose during the financial year 198,000 604,772 – 802,772Utilised (165,055) (432,625) – (597,680)Unused amounts reversed (123,642) – (230,000) (353,642)
At 30 June 2015 and 1 July 2015 198,000 2,597,546 1,363,226 4,158,772Arose during the financial year – 500,256 – 500,256Unused amounts reversed (198,000) (417,697) – (615,697)Currency realignment – (10,555) – (10,555)Disposal of a subsidiary – (45,333) – (45,333)
At 30 June 2016 – 2,624,217 1,363,226 3,987,443

PEC ANNUAL REPORT 2016
95
N O T E S T O T H E F I N A N C I A L S T AT E M E N T SFOR THE FINANCIAL YEAR ENDED 30 JUNE 2016
25. LOANS AND BORROWINGSGroup Company
Maturity Note 2016 2015 2016 2015$ $ $ $
Current:
Bank loan 1 2016-2017 399,045 399,045 – –Bank loan 2 2016-2017 224,885 471,760 – –Bank loan 3 On demand 5,089,429 8,256,762 – –Trust receipts On demand – 6,679,979 – –Bank overdrafts On demand 22 – 820,322 – –Obligations under finance leases 2016-2017 2,939,218 159,334 25,317 24,160
8,652,577 16,787,202 25,317 24,160
Non-current:
Bank loan 1 2017-2029 3,543,774 4,586,006 – –Bank loan 2 2017-2035 5,668,232 7,098,747 – –Obligations under finance leases 2017-2020 279,838 342,257 65,959 91,275
9,491,844 12,027,010 65,959 91,275
Total loans and borrowings 27 18,144,421 28,814,212 91,276 115,435
Bank Loan 1
This loan is denominated in SGD, bears interest of 1.10% to 1.50% + cost of funds (2015: 1.10% to 1.50% + cost of funds) per annum and is secured by a legal mortgage of an investment property (Note 10) and its rental proceeds.
Bank Loan 2
This loan is denominated in SGD, bears floating interest of 2.98% to 5.25% (2015: 2.68% to 4.50%) per annum and is secured by a legal mortgage over a factory building, a personal guarantee, and a corporate guarantee (Note 9).
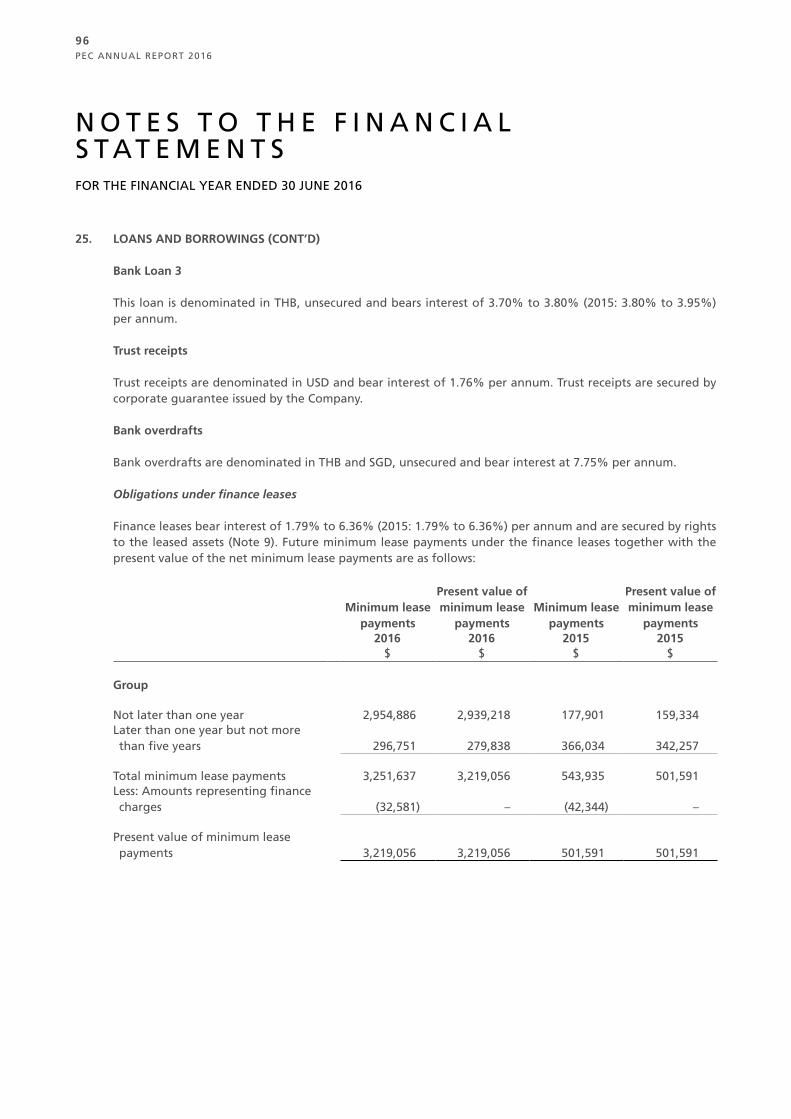
PEC ANNUAL REPORT 2016
96
N O T E S T O T H E F I N A N C I A L S T AT E M E N T SFOR THE FINANCIAL YEAR ENDED 30 JUNE 2016
25. LOANS AND BORROWINGS (CONT’D)
Bank Loan 3
This loan is denominated in THB, unsecured and bears interest of 3.70% to 3.80% (2015: 3.80% to 3.95%) per annum.
Trust receipts
Trust receipts are denominated in USD and bear interest of 1.76% per annum. Trust receipts are secured by corporate guarantee issued by the Company.
Bank overdrafts
Bank overdrafts are denominated in THB and SGD, unsecured and bear interest at 7.75% per annum.
Obligations under finance leases
Finance leases bear interest of 1.79% to 6.36% (2015: 1.79% to 6.36%) per annum and are secured by rights to the leased assets (Note 9). Future minimum lease payments under the finance leases together with the present value of the net minimum lease payments are as follows:
Minimum lease payments
Present value of minimum lease
paymentsMinimum lease
payments
Present value of minimum lease
payments2016 2016 2015 2015
$ $ $ $
Group
Not later than one year 2,954,886 2,939,218 177,901 159,334Later than one year but not more than five years 296,751 279,838 366,034 342,257
Total minimum lease payments 3,251,637 3,219,056 543,935 501,591Less: Amounts representing finance charges (32,581) – (42,344) –
Present value of minimum lease payments 3,219,056 3,219,056 501,591 501,591

PEC ANNUAL REPORT 2016
97
N O T E S T O T H E F I N A N C I A L S T AT E M E N T SFOR THE FINANCIAL YEAR ENDED 30 JUNE 2016
25. LOANS AND BORROWINGS (CONT’D)
Minimum lease payments
Present value of minimum lease
paymentsMinimum lease
payments
Present value of minimum lease
payments2016 2016 2015 2015
$ $ $ $
Company
Not later than one year 28,740 25,317 28,740 24,160Later than one year but not more than five years 69,455 65,959 98,194 91,275
Total minimum lease payments 98,195 91,276 126,934 115,435Less: Amounts representing finance charges (6,919) – (11,499) –
Present value of minimum lease payments 91,276 91,276 115,435 115,435
26. TRADE PAYABLESGroup Company
Note 2016 2015 2016 2015$ $ $ $
Trade payables:– external parties 28,160,651 34,025,216 9,225,487 9,709,552– associate 734,652 994,520 674,184 994,520– related parties 53,688 46,349 40,463 37,532– subsidiaries – – 3,203,101 4,046,061
27 28,948,991 35,066,085 13,143,235 14,787,665Net GST payables 2,189,782 4,501,427 2,362,304 4,243,516
31,138,773 39,567,512 15,505,539 19,031,181
Trade payables are unsecured, non-interest bearing and are normally settled on 60-day terms.
Amounts due to related parties, associate and subsidiaries are to be settled in cash, unsecured, non-interest bearing and repayable on demand.
Related parties are companies related to the Group through common directors and shareholders, excluding entities within the Group.
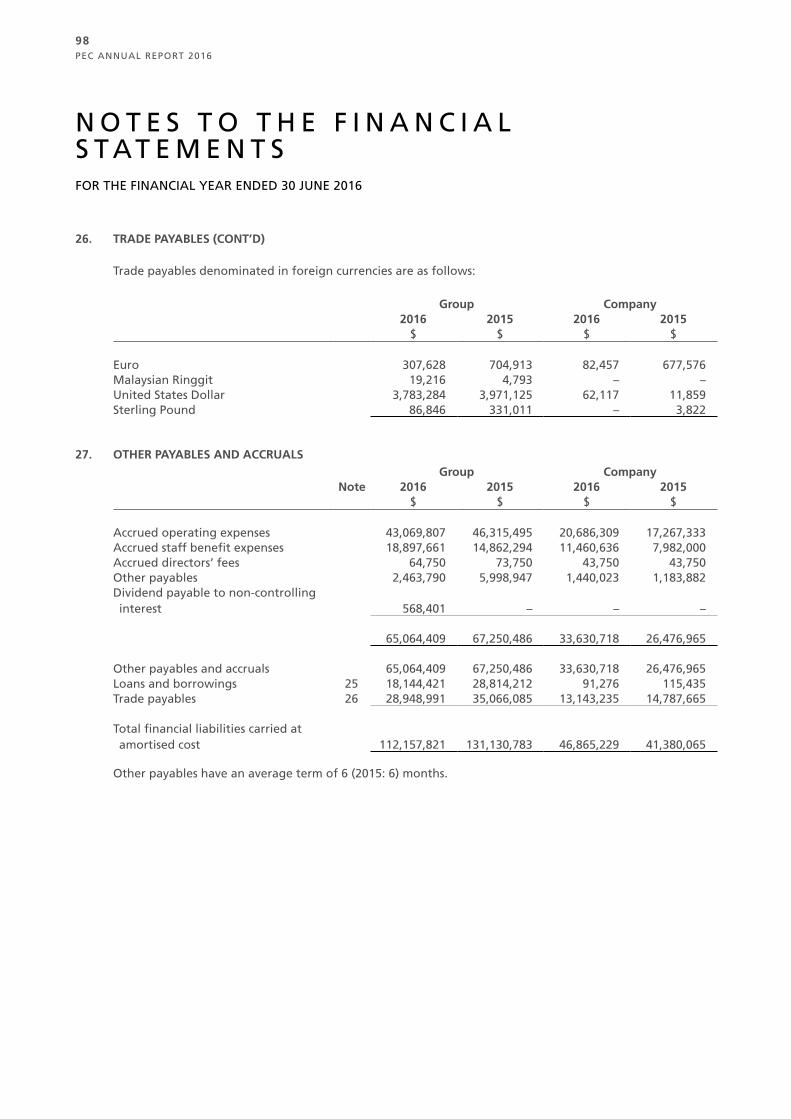
PEC ANNUAL REPORT 2016
98
N O T E S T O T H E F I N A N C I A L S T AT E M E N T SFOR THE FINANCIAL YEAR ENDED 30 JUNE 2016
26. TRADE PAYABLES (CONT’D)
Trade payables denominated in foreign currencies are as follows:
Group Company2016 2015 2016 2015
$ $ $ $
Euro 307,628 704,913 82,457 677,576Malaysian Ringgit 19,216 4,793 – –United States Dollar 3,783,284 3,971,125 62,117 11,859Sterling Pound 86,846 331,011 – 3,822
27. OTHER PAYABLES AND ACCRUALSGroup Company
Note 2016 2015 2016 2015$ $ $ $
Accrued operating expenses 43,069,807 46,315,495 20,686,309 17,267,333Accrued staff benefit expenses 18,897,661 14,862,294 11,460,636 7,982,000Accrued directors’ fees 64,750 73,750 43,750 43,750Other payables 2,463,790 5,998,947 1,440,023 1,183,882Dividend payable to non-controlling interest 568,401 – – –
65,064,409 67,250,486 33,630,718 26,476,965
Other payables and accruals 65,064,409 67,250,486 33,630,718 26,476,965Loans and borrowings 25 18,144,421 28,814,212 91,276 115,435Trade payables 26 28,948,991 35,066,085 13,143,235 14,787,665
Total financial liabilities carried at amortised cost 112,157,821 131,130,783 46,865,229 41,380,065
Other payables have an average term of 6 (2015: 6) months.
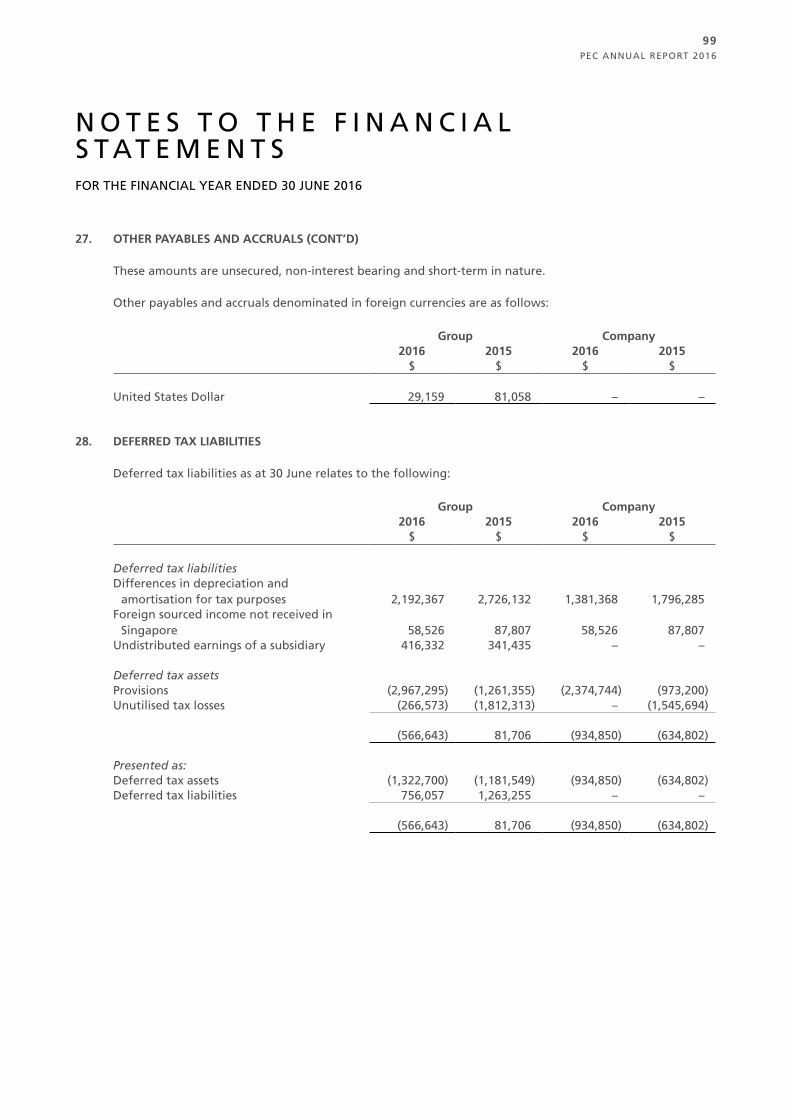
PEC ANNUAL REPORT 2016
99
N O T E S T O T H E F I N A N C I A L S T AT E M E N T SFOR THE FINANCIAL YEAR ENDED 30 JUNE 2016
27. OTHER PAYABLES AND ACCRUALS (CONT’D)
These amounts are unsecured, non-interest bearing and short-term in nature.
Other payables and accruals denominated in foreign currencies are as follows:
Group Company2016 2015 2016 2015
$ $ $ $
United States Dollar 29,159 81,058 – –
28. DEFERRED TAX LIABILITIES
Deferred tax liabilities as at 30 June relates to the following:
Group Company2016 2015 2016 2015
$ $ $ $
Deferred tax liabilitiesDifferences in depreciation and
amortisation for tax purposes 2,192,367 2,726,132 1,381,368 1,796,285Foreign sourced income not received in
Singapore 58,526 87,807 58,526 87,807Undistributed earnings of a subsidiary 416,332 341,435 – –
Deferred tax assetsProvisions (2,967,295) (1,261,355) (2,374,744) (973,200)Unutilised tax losses (266,573) (1,812,313) – (1,545,694)
(566,643) 81,706 (934,850) (634,802)
Presented as:Deferred tax assets (1,322,700) (1,181,549) (934,850) (634,802)Deferred tax liabilities 756,057 1,263,255 – –
(566,643) 81,706 (934,850) (634,802)
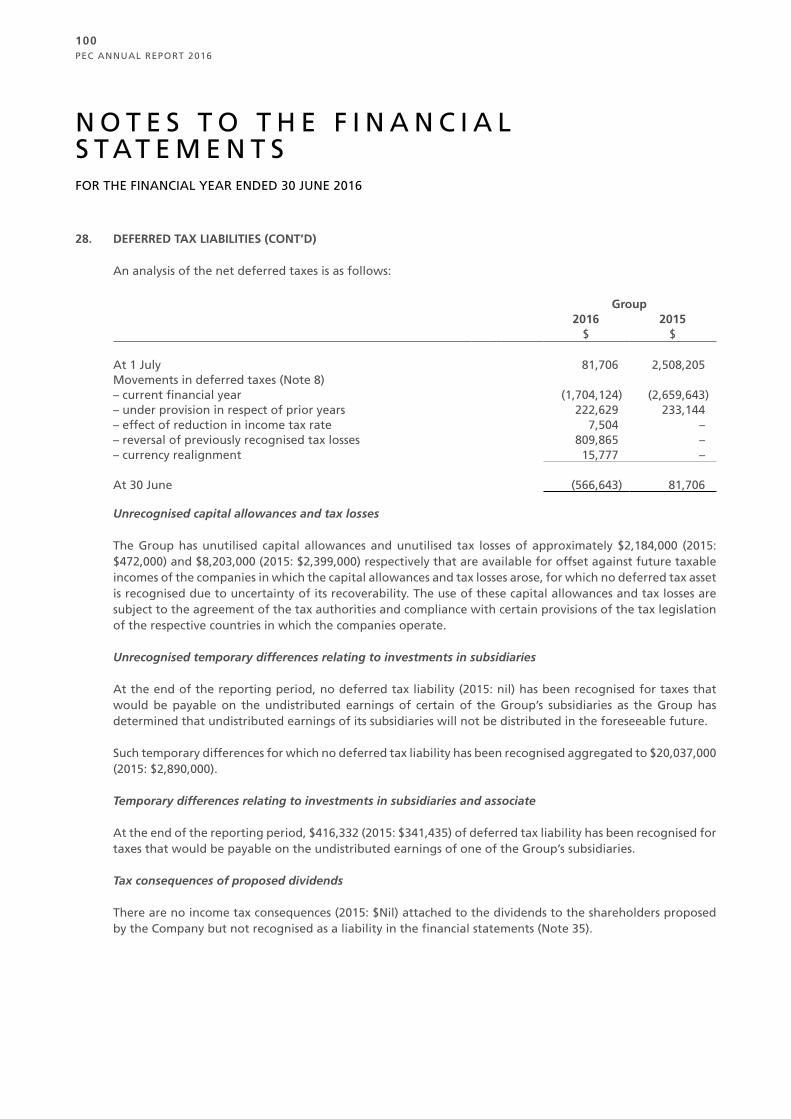
PEC ANNUAL REPORT 2016
100
N O T E S T O T H E F I N A N C I A L S T AT E M E N T SFOR THE FINANCIAL YEAR ENDED 30 JUNE 2016
28. DEFERRED TAX LIABILITIES (CONT’D)
An analysis of the net deferred taxes is as follows:
Group2016 2015
$ $
At 1 July 81,706 2,508,205Movements in deferred taxes (Note 8)– current financial year (1,704,124) (2,659,643)– under provision in respect of prior years 222,629 233,144– effect of reduction in income tax rate 7,504 –– reversal of previously recognised tax losses 809,865 –– currency realignment 15,777 –
At 30 June (566,643) 81,706
Unrecognised capital allowances and tax losses
The Group has unutilised capital allowances and unutilised tax losses of approximately $2,184,000 (2015: $472,000) and $8,203,000 (2015: $2,399,000) respectively that are available for offset against future taxable incomes of the companies in which the capital allowances and tax losses arose, for which no deferred tax asset is recognised due to uncertainty of its recoverability. The use of these capital allowances and tax losses are subject to the agreement of the tax authorities and compliance with certain provisions of the tax legislation of the respective countries in which the companies operate.
Unrecognised temporary differences relating to investments in subsidiaries
At the end of the reporting period, no deferred tax liability (2015: nil) has been recognised for taxes that would be payable on the undistributed earnings of certain of the Group’s subsidiaries as the Group has determined that undistributed earnings of its subsidiaries will not be distributed in the foreseeable future.
Such temporary differences for which no deferred tax liability has been recognised aggregated to $20,037,000 (2015: $2,890,000). Temporary differences relating to investments in subsidiaries and associate
At the end of the reporting period, $416,332 (2015: $341,435) of deferred tax liability has been recognised for taxes that would be payable on the undistributed earnings of one of the Group’s subsidiaries. Tax consequences of proposed dividends
There are no income tax consequences (2015: $Nil) attached to the dividends to the shareholders proposed by the Company but not recognised as a liability in the financial statements (Note 35).
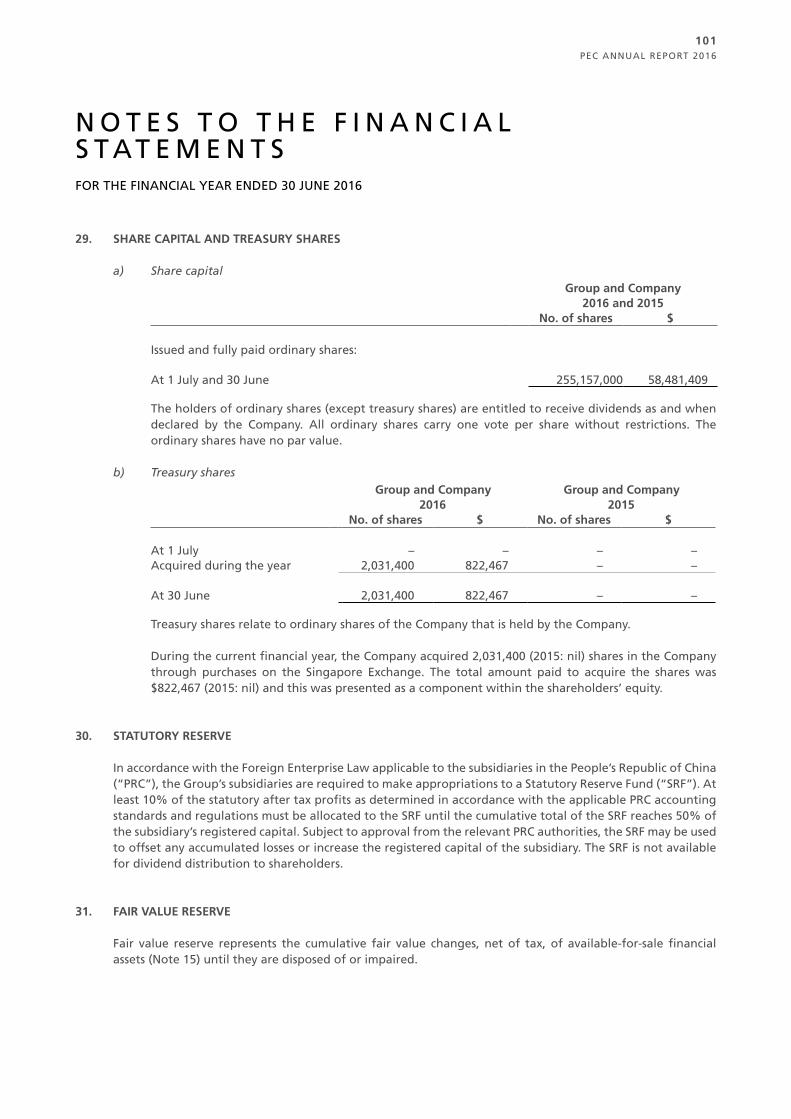
PEC ANNUAL REPORT 2016
101
N O T E S T O T H E F I N A N C I A L S T AT E M E N T SFOR THE FINANCIAL YEAR ENDED 30 JUNE 2016
29. SHARE CAPITAL AND TREASURY SHARES
a) Share capitalGroup and Company
2016 and 2015No. of shares $
Issued and fully paid ordinary shares:
At 1 July and 30 June 255,157,000 58,481,409
The holders of ordinary shares (except treasury shares) are entitled to receive dividends as and when declared by the Company. All ordinary shares carry one vote per share without restrictions. The ordinary shares have no par value.
b) Treasury sharesGroup and Company Group and Company
2016 2015No. of shares $ No. of shares $
At 1 July – – – –Acquired during the year 2,031,400 822,467 – –
At 30 June 2,031,400 822,467 – –
Treasury shares relate to ordinary shares of the Company that is held by the Company.
During the current financial year, the Company acquired 2,031,400 (2015: nil) shares in the Company through purchases on the Singapore Exchange. The total amount paid to acquire the shares was $822,467 (2015: nil) and this was presented as a component within the shareholders’ equity.
30. STATUTORY RESERVE
In accordance with the Foreign Enterprise Law applicable to the subsidiaries in the People’s Republic of China (“PRC”), the Group’s subsidiaries are required to make appropriations to a Statutory Reserve Fund (“SRF”). At least 10% of the statutory after tax profits as determined in accordance with the applicable PRC accounting standards and regulations must be allocated to the SRF until the cumulative total of the SRF reaches 50% of the subsidiary’s registered capital. Subject to approval from the relevant PRC authorities, the SRF may be used to offset any accumulated losses or increase the registered capital of the subsidiary. The SRF is not available for dividend distribution to shareholders.
31. FAIR VALUE RESERVE
Fair value reserve represents the cumulative fair value changes, net of tax, of available-for-sale financial assets (Note 15) until they are disposed of or impaired.
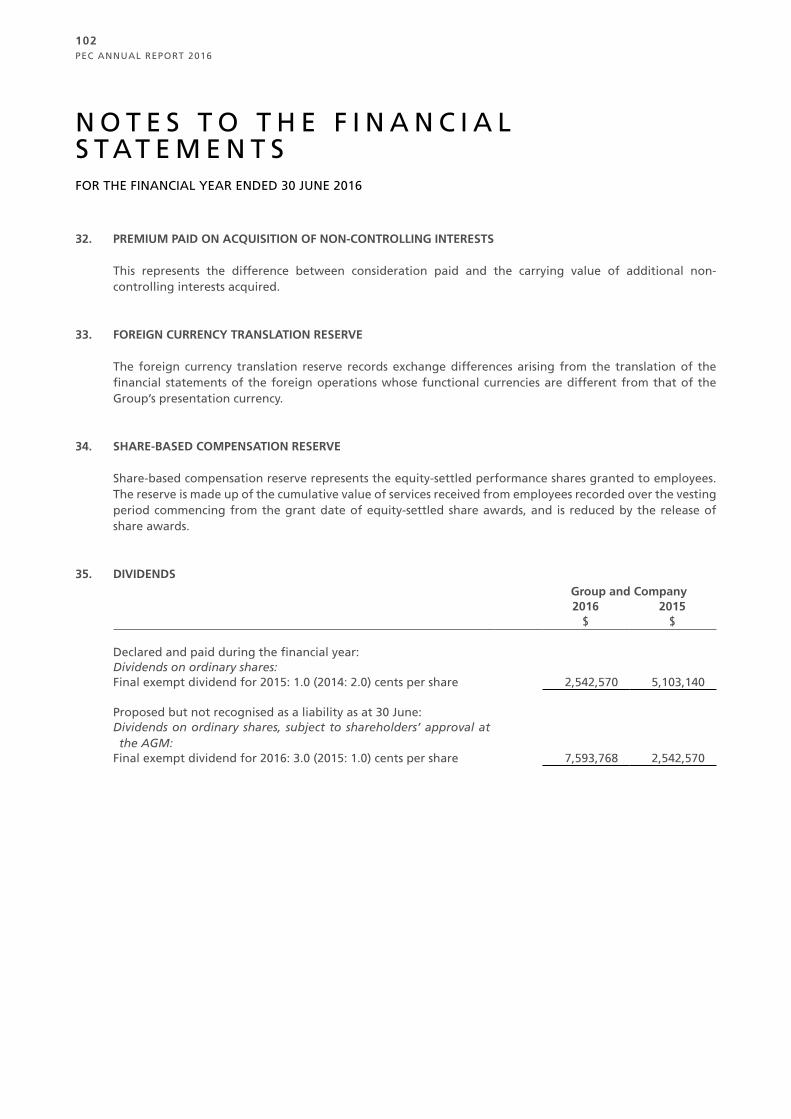
PEC ANNUAL REPORT 2016
102
N O T E S T O T H E F I N A N C I A L S T AT E M E N T SFOR THE FINANCIAL YEAR ENDED 30 JUNE 2016
32. PREMIUM PAID ON ACQUISITION OF NON-CONTROLLING INTERESTS
This represents the difference between consideration paid and the carrying value of additional non-controlling interests acquired.
33. FOREIGN CURRENCY TRANSLATION RESERVE
The foreign currency translation reserve records exchange differences arising from the translation of the financial statements of the foreign operations whose functional currencies are different from that of the Group’s presentation currency.
34. SHARE-BASED COMPENSATION RESERVE
Share-based compensation reserve represents the equity-settled performance shares granted to employees. The reserve is made up of the cumulative value of services received from employees recorded over the vesting period commencing from the grant date of equity-settled share awards, and is reduced by the release of share awards.
35. DIVIDENDSGroup and Company2016 2015
$ $
Declared and paid during the financial year:Dividends on ordinary shares:Final exempt dividend for 2015: 1.0 (2014: 2.0) cents per share 2,542,570 5,103,140
Proposed but not recognised as a liability as at 30 June:Dividends on ordinary shares, subject to shareholders’ approval at the AGM:
Final exempt dividend for 2016: 3.0 (2015: 1.0) cents per share 7,593,768 2,542,570

PEC ANNUAL REPORT 2016
103
N O T E S T O T H E F I N A N C I A L S T AT E M E N T SFOR THE FINANCIAL YEAR ENDED 30 JUNE 2016
36. EARNINGS PER SHARE
Basic earnings per share amounts are calculated by dividing the profit/(loss) for the year, net of tax, attributable to owners of the Company by the weighted average number of ordinary shares outstanding during the year.
Diluted earnings per share amounts are calculated by dividing the profit from operations, net of tax, attributable to owners of the Company by the weighted average number of ordinary shares outstanding during the year plus the weighted average number of ordinary shares that would be issued on the conversion of all the dilutive potential ordinary shares into ordinary shares.
The following table reflects the statement of comprehensive income and share data used in the computation of basic and diluted earnings per share for the financial years ended 30 June:
Group2016 2015
$ $
Profit/(loss) for the year attributable to owners of the Company 18,745,775 (6,885,150)
Weighted average number of ordinary shares for basic earnings per share computation* 253,740,086 255,157,000
Effect of dilution:– Performance Share Plan 3,730,501 –
Weighted average number of ordinary shares for diluted earnings per share computation* 257,470,587 255,157,000
Earnings per share (cents per share)– Basic 7.4 (2.7)
– Diluted 7.3 (2.7)
* The weighted average number of shares takes into account the weighted average effect of treasury shares transactions during the year.

PEC ANNUAL REPORT 2016
104
N O T E S T O T H E F I N A N C I A L S T AT E M E N T SFOR THE FINANCIAL YEAR ENDED 30 JUNE 2016
37. SHARE-BASED COMPENSATION
PEC Performance share plan (“PSP”)
The PSP was approved at an Extraordinary General Meeting (“EGM”) held on 25 October 2013, for granting awards to eligible full-time employees and Executive Directors. Details of the PSP are disclosed in the Directors’ Statement.
On 15 February 2016, awards were granted by the Company to qualifying employees pursuant to the Plan in respect of up to 7,792,208 shares of the Company. Under the Plan, a specified number of shares will be vested and released by the Committee in accordance with the release schedule to the participants subject to the achievement of certain pre-determined performance conditions. The vesting period is 3 years and the release schedule is as follows:
(a) 40% of the shares will be vested on the first anniversary of grant date;(b) 30% of the shares will be vested on the second anniversary of grant date; and(c) 30% of the shares will be vested on the third anniversary of grant date.
Fair value of PSP
The fair value of services received in return for shares awarded is measured by reference to the fair value of shares granted each year under the plan. The estimate of the fair value of services received is measured based on a prospective Monte Carlo simulation model, which involves projection of future outcomes using statistical distributions of key random variables including share price and volatility of returns.
The following table lists the key inputs to the model used for the year ended 30 June 2016:
2016
Dividend yield (%) 3.50Expected volatility (%) 48.74Risk free interest rate (% p.a.) 1.43Share price at date of grant ($) 0.39
Based on the Monte Carlo simulation model, the estimated fair value at date of grant for each share granted is $0.37.
For the current financial year, the Group has recognised a share-based compensation expense of $300,680 (2015: $Nil) based on the fair values determined on grant date and estimation of share award that will ultimately vest in profit or loss.
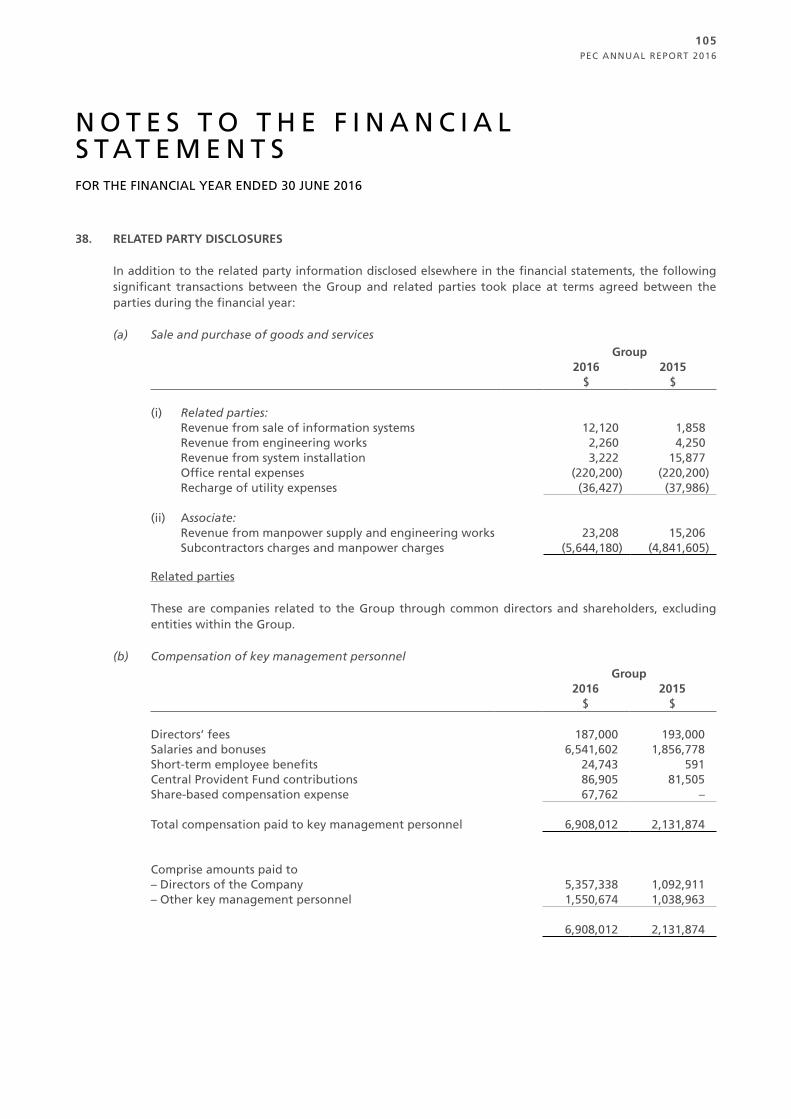
PEC ANNUAL REPORT 2016
105
N O T E S T O T H E F I N A N C I A L S T AT E M E N T SFOR THE FINANCIAL YEAR ENDED 30 JUNE 2016
38. RELATED PARTY DISCLOSURES
In addition to the related party information disclosed elsewhere in the financial statements, the following significant transactions between the Group and related parties took place at terms agreed between the parties during the financial year:
(a) Sale and purchase of goods and servicesGroup
2016 2015$ $
(i) Related parties: Revenue from sale of information systems 12,120 1,858 Revenue from engineering works 2,260 4,250 Revenue from system installation 3,222 15,877 Office rental expenses (220,200) (220,200) Recharge of utility expenses (36,427) (37,986)
(ii) Associate: Revenue from manpower supply and engineering works 23,208 15,206 Subcontractors charges and manpower charges (5,644,180) (4,841,605)
Related parties
These are companies related to the Group through common directors and shareholders, excluding entities within the Group.
(b) Compensation of key management personnelGroup
2016 2015$ $
Directors’ fees 187,000 193,000Salaries and bonuses 6,541,602 1,856,778Short-term employee benefits 24,743 591Central Provident Fund contributions 86,905 81,505Share-based compensation expense 67,762 –
Total compensation paid to key management personnel 6,908,012 2,131,874
Comprise amounts paid to – Directors of the Company 5,357,338 1,092,911– Other key management personnel 1,550,674 1,038,963
6,908,012 2,131,874
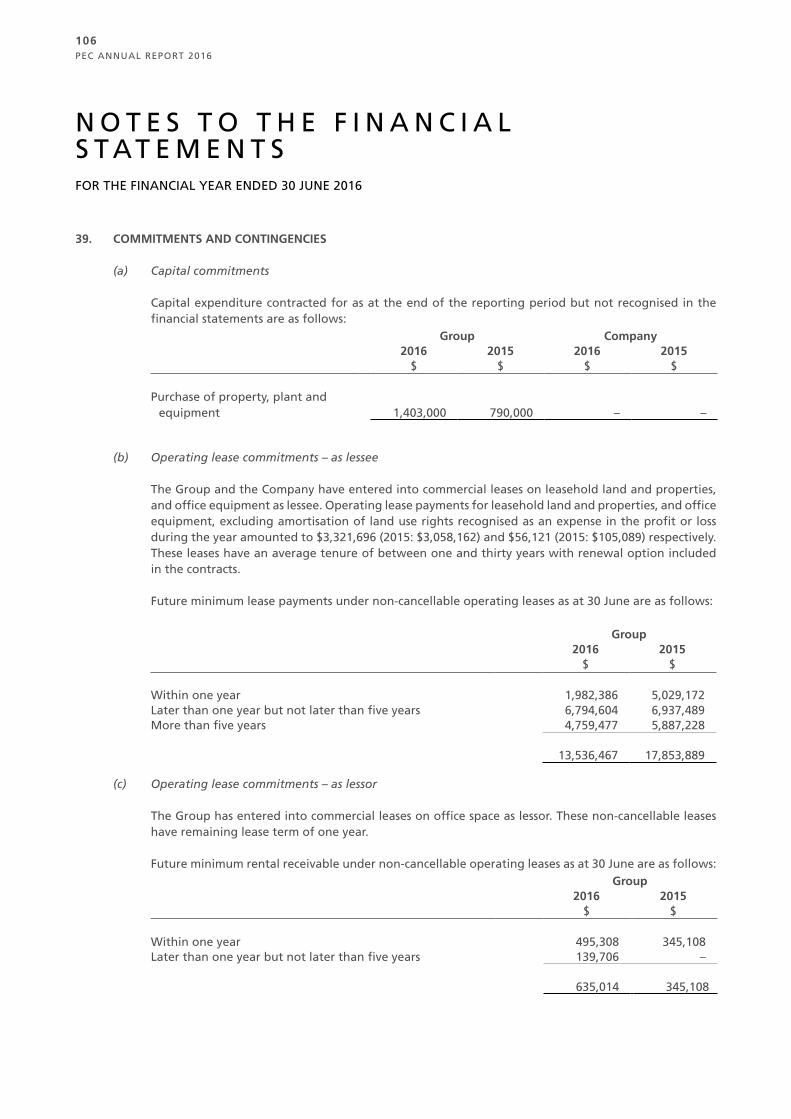
PEC ANNUAL REPORT 2016
106
N O T E S T O T H E F I N A N C I A L S T AT E M E N T SFOR THE FINANCIAL YEAR ENDED 30 JUNE 2016
39. COMMITMENTS AND CONTINGENCIES
(a) Capital commitments
Capital expenditure contracted for as at the end of the reporting period but not recognised in the financial statements are as follows:
Group Company2016 2015 2016 2015
$ $ $ $
Purchase of property, plant and equipment 1,403,000 790,000 – –
(b) Operating lease commitments – as lessee
The Group and the Company have entered into commercial leases on leasehold land and properties, and office equipment as lessee. Operating lease payments for leasehold land and properties, and office equipment, excluding amortisation of land use rights recognised as an expense in the profit or loss during the year amounted to $3,321,696 (2015: $3,058,162) and $56,121 (2015: $105,089) respectively. These leases have an average tenure of between one and thirty years with renewal option included in the contracts.
Future minimum lease payments under non-cancellable operating leases as at 30 June are as follows:
Group2016 2015
$ $
Within one year 1,982,386 5,029,172Later than one year but not later than five years 6,794,604 6,937,489More than five years 4,759,477 5,887,228
13,536,467 17,853,889
(c) Operating lease commitments – as lessor
The Group has entered into commercial leases on office space as lessor. These non-cancellable leases have remaining lease term of one year.
Future minimum rental receivable under non-cancellable operating leases as at 30 June are as follows:Group
2016 2015$ $
Within one year 495,308 345,108Later than one year but not later than five years 139,706 –
635,014 345,108
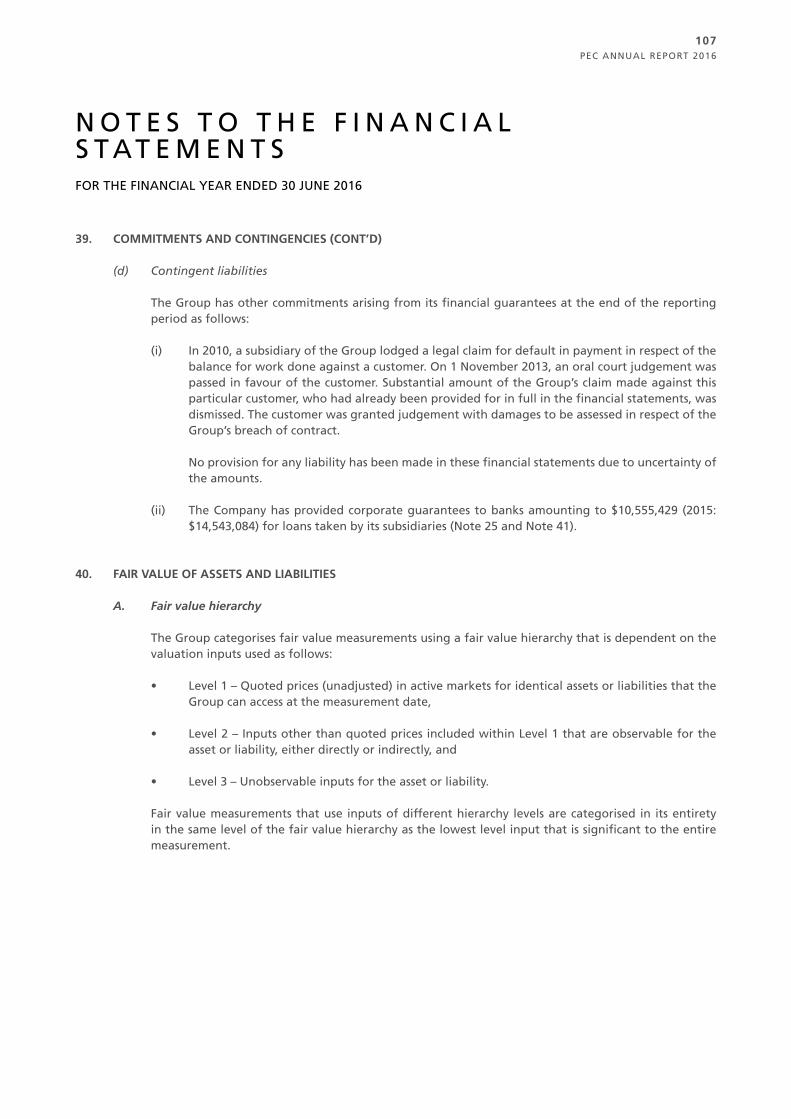
PEC ANNUAL REPORT 2016
107
N O T E S T O T H E F I N A N C I A L S T AT E M E N T SFOR THE FINANCIAL YEAR ENDED 30 JUNE 2016
39. COMMITMENTS AND CONTINGENCIES (CONT’D)
(d) Contingent liabilities
The Group has other commitments arising from its financial guarantees at the end of the reporting period as follows:
(i) In 2010, a subsidiary of the Group lodged a legal claim for default in payment in respect of the balance for work done against a customer. On 1 November 2013, an oral court judgement was passed in favour of the customer. Substantial amount of the Group’s claim made against this particular customer, who had already been provided for in full in the financial statements, was dismissed. The customer was granted judgement with damages to be assessed in respect of the Group’s breach of contract.
No provision for any liability has been made in these financial statements due to uncertainty of the amounts.
(ii) The Company has provided corporate guarantees to banks amounting to $10,555,429 (2015: $14,543,084) for loans taken by its subsidiaries (Note 25 and Note 41).
40. FAIR VALUE OF ASSETS AND LIABILITIES
A. Fair value hierarchy
The Group categorises fair value measurements using a fair value hierarchy that is dependent on the valuation inputs used as follows:
• Level 1 – Quoted prices (unadjusted) in active markets for identical assets or liabilities that the Group can access at the measurement date,
• Level 2 – Inputs other than quoted prices included within Level 1 that are observable for the asset or liability, either directly or indirectly, and
• Level 3 – Unobservable inputs for the asset or liability.
Fair value measurements that use inputs of different hierarchy levels are categorised in its entirety in the same level of the fair value hierarchy as the lowest level input that is significant to the entire measurement.
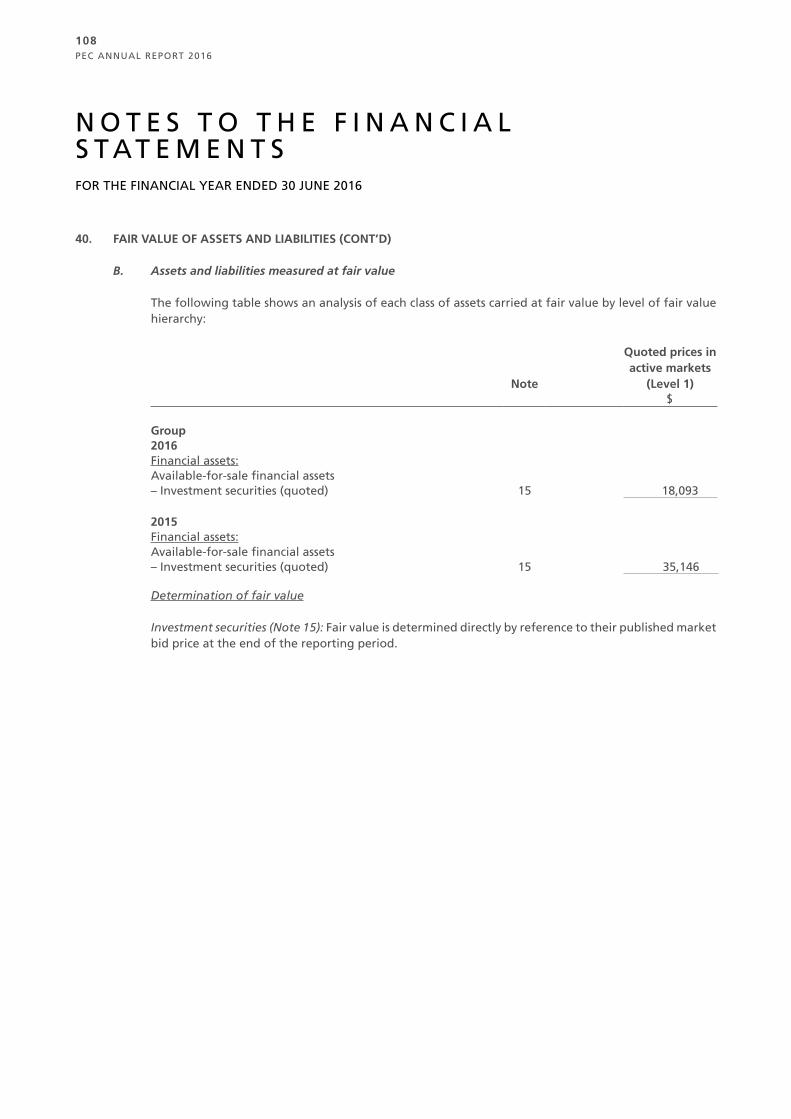
PEC ANNUAL REPORT 2016
108
N O T E S T O T H E F I N A N C I A L S T AT E M E N T SFOR THE FINANCIAL YEAR ENDED 30 JUNE 2016
40. FAIR VALUE OF ASSETS AND LIABILITIES (CONT’D)
B. Assets and liabilities measured at fair value
The following table shows an analysis of each class of assets carried at fair value by level of fair value hierarchy:
Note
Quoted prices in active markets
(Level 1)$
Group2016Financial assets: Available-for-sale financial assets– Investment securities (quoted) 15 18,093
2015Financial assets: Available-for-sale financial assets– Investment securities (quoted) 15 35,146
Determination of fair value
Investment securities (Note 15): Fair value is determined directly by reference to their published market bid price at the end of the reporting period.
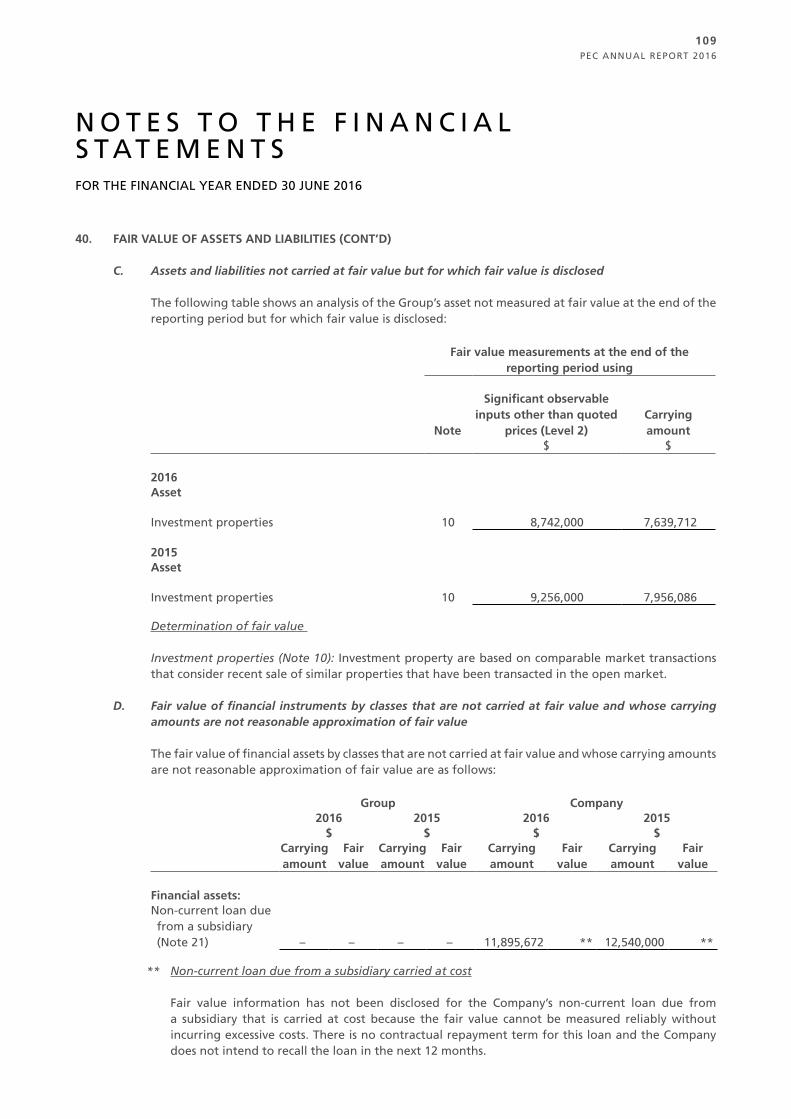
PEC ANNUAL REPORT 2016
109
N O T E S T O T H E F I N A N C I A L S T AT E M E N T SFOR THE FINANCIAL YEAR ENDED 30 JUNE 2016
40. FAIR VALUE OF ASSETS AND LIABILITIES (CONT’D)
C. Assets and liabilities not carried at fair value but for which fair value is disclosed
The following table shows an analysis of the Group’s asset not measured at fair value at the end of the reporting period but for which fair value is disclosed:
Fair value measurements at the end of the reporting period using
Note
Significant observable inputs other than quoted
prices (Level 2)Carrying amount
$ $
2016Asset
Investment properties 10 8,742,000 7,639,712
2015Asset
Investment properties 10 9,256,000 7,956,086
Determination of fair value
Investment properties (Note 10): Investment property are based on comparable market transactions that consider recent sale of similar properties that have been transacted in the open market.
D. Fair value of financial instruments by classes that are not carried at fair value and whose carrying amounts are not reasonable approximation of fair value
The fair value of financial assets by classes that are not carried at fair value and whose carrying amounts are not reasonable approximation of fair value are as follows:
Group Company2016 2015 2016 2015
$ $ $ $Carryingamount
Fairvalue
Carryingamount
Fairvalue
Carryingamount
Fairvalue
Carryingamount
Fairvalue
Financial assets:Non-current loan due from a subsidiary
(Note 21) – – – – 11,895,672 ** 12,540,000 **
** Non-current loan due from a subsidiary carried at cost
Fair value information has not been disclosed for the Company’s non-current loan due from a subsidiary that is carried at cost because the fair value cannot be measured reliably without incurring excessive costs. There is no contractual repayment term for this loan and the Company does not intend to recall the loan in the next 12 months.
PEC ANNUAL REPORT 2016
110
N O T E S T O T H E F I N A N C I A L S T AT E M E N T SFOR THE FINANCIAL YEAR ENDED 30 JUNE 2016
41. FINANCIAL RISK MANAGEMENT OBJECTIVES AND POLICIES
The Group and the Company are exposed to financial risks arising from its operations and the use of financial instruments. The key financial risks include credit risk, liquidity risk and foreign currency risk. The board of directors reviews and agrees policies and procedures for the management of these risks, which are executed by the Finance Director. The Audit Committee provides independent oversight of the effectiveness of the risk management process. It is, and has been throughout the current and previous financial year, the Group’s policy that no trading in derivatives for speculative purposes shall be undertaken, except for the use of hedging instruments where appropriate and cost-efficient. The Group and the Company do not apply hedge accounting.
The following sections provide details regarding the Group’s and Company’s exposure to the above-mentioned financial risks and the objectives, policies and processes for the management of these risks.
There has been no change to the Group’s exposure to these financial risks or the manner in which it manages and measures the risks.
(a) Credit risk
Credit risk is the risk of loss that may arise on outstanding financial instruments should a counterparty default on its obligations. The Group’s and the Company’s exposure to credit risk arises primarily from trade and other receivables. For other financial assets (including available for sale investments, bank deposits pledged, and cash and short-term deposits), the Group and the Company minimise credit risk by dealing exclusively with high credit rating counterparties.
The Group’s objective is to seek continual revenue growth while minimising losses incurred due to increased credit risk exposure. The Group trades only with recognised and creditworthy third parties. It is the Group’s practice that all new customers who wish to trade on credit terms are subject to credit verification procedures. In addition, receivable balances are monitored on an ongoing basis with the result that the Group’s exposure to bad debts is not significant.
Excessive risk concentration
Concentrations arise when a number of counterparties are engaged in similar business activities, or activities in the same geographical region, or have economic features that would cause their ability to meet contractual obligations to be similarly affected by changes in economic, political or other conditions. Concentrations indicate the relative sensitivity of the Group’s performance to developments affecting a particular industry.
The Group monitors its risk concentration to avoid excessive concentrations of risk exposure.
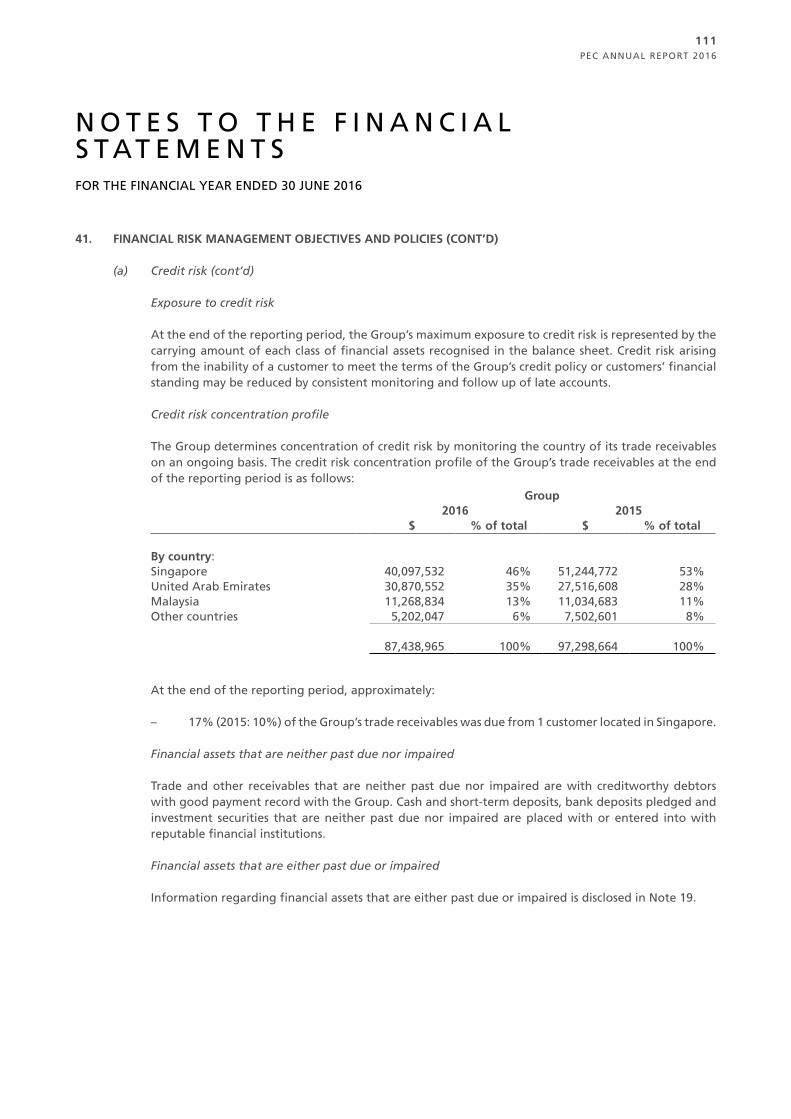
PEC ANNUAL REPORT 2016
111
N O T E S T O T H E F I N A N C I A L S T AT E M E N T SFOR THE FINANCIAL YEAR ENDED 30 JUNE 2016
41. FINANCIAL RISK MANAGEMENT OBJECTIVES AND POLICIES (CONT’D)
(a) Credit risk (cont’d)
Exposure to credit risk
At the end of the reporting period, the Group’s maximum exposure to credit risk is represented by the carrying amount of each class of financial assets recognised in the balance sheet. Credit risk arising from the inability of a customer to meet the terms of the Group’s credit policy or customers’ financial standing may be reduced by consistent monitoring and follow up of late accounts.
Credit risk concentration profile
The Group determines concentration of credit risk by monitoring the country of its trade receivables on an ongoing basis. The credit risk concentration profile of the Group’s trade receivables at the end of the reporting period is as follows:
Group2016 2015
$ % of total $ % of total
By country:Singapore 40,097,532 46% 51,244,772 53%United Arab Emirates 30,870,552 35% 27,516,608 28%Malaysia 11,268,834 13% 11,034,683 11%Other countries 5,202,047 6% 7,502,601 8%
87,438,965 100% 97,298,664 100%
At the end of the reporting period, approximately:
– 17% (2015: 10%) of the Group’s trade receivables was due from 1 customer located in Singapore.
Financial assets that are neither past due nor impaired
Trade and other receivables that are neither past due nor impaired are with creditworthy debtors with good payment record with the Group. Cash and short-term deposits, bank deposits pledged and investment securities that are neither past due nor impaired are placed with or entered into with reputable financial institutions.
Financial assets that are either past due or impaired
Information regarding financial assets that are either past due or impaired is disclosed in Note 19.

PEC ANNUAL REPORT 2016
112
N O T E S T O T H E F I N A N C I A L S T AT E M E N T SFOR THE FINANCIAL YEAR ENDED 30 JUNE 2016
41. FINANCIAL RISK MANAGEMENT OBJECTIVES AND POLICIES (CONT’D)
(b) Liquidity risk
Liquidity risk is the risk that the Group or the Company will encounter difficulty in meeting financial obligations due to shortage of funds. The Group’s and the Company’s objective is to maintain a balance between continuity of funding and flexibility through the use of stand-by credit facilities.
The Group and Company manages its liquidity risk by maintaining sufficient cash and marketable securities to enable them to meet their normal operating commitments. At the end of the reporting period, approximately 47.7% (2015: 58.3%) of the Group’s loans and borrowings will mature in less than one year based on the carrying amount reflected in the financial statements.
The Group assessed the concentration of risk with respect to refinancing its debts and concluded it to be low. The Group has assessed that its access to sources of funding is sufficiently available.
Analysis of financial instruments by remaining contractual maturities
The table below summarises the maturity profile of the Group’s and the Company’s financial assets and liabilities at the end of the reporting period based on contractual undiscounted repayment obligations.
1 year or less Over 1 year Total$ $ $
Group2016
Financial assets
Trade receivables 87,438,965 – 87,438,965Other receivables and deposits 9,485,501 – 9,485,501Accrued income 20,172,993 – 20,172,993Bank deposits pledged 50,525 – 50,525Cash and short-term deposits 150,562,698 – 150,562,698
Total undiscounted financial assets 267,710,682 – 267,710,682
Financial liabilities
Trade payables 28,948,991 – 28,948,991Other payables and accruals 65,064,409 – 65,064,409Loans and borrowings 8,975,903 12,903,408 21,879,311
Total undiscounted financial liabilities 102,989,303 12,903,408 115,892,711
Total net undiscounted financial assets/(liabilities) 164,721,379 (12,903,408) 151,817,971
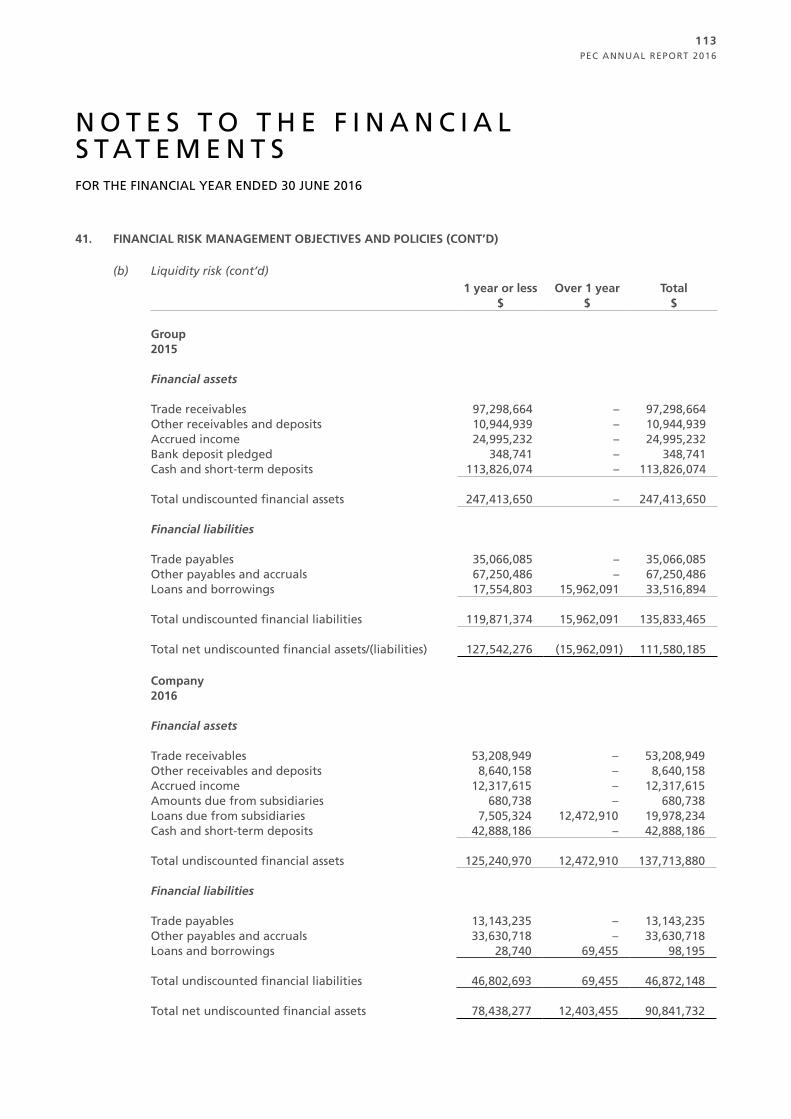
PEC ANNUAL REPORT 2016
113
N O T E S T O T H E F I N A N C I A L S T AT E M E N T SFOR THE FINANCIAL YEAR ENDED 30 JUNE 2016
41. FINANCIAL RISK MANAGEMENT OBJECTIVES AND POLICIES (CONT’D)
(b) Liquidity risk (cont’d)1 year or less Over 1 year Total
$ $ $
Group2015
Financial assets
Trade receivables 97,298,664 – 97,298,664Other receivables and deposits 10,944,939 – 10,944,939Accrued income 24,995,232 – 24,995,232Bank deposit pledged 348,741 – 348,741Cash and short-term deposits 113,826,074 – 113,826,074
Total undiscounted financial assets 247,413,650 – 247,413,650
Financial liabilities
Trade payables 35,066,085 – 35,066,085Other payables and accruals 67,250,486 – 67,250,486Loans and borrowings 17,554,803 15,962,091 33,516,894
Total undiscounted financial liabilities 119,871,374 15,962,091 135,833,465
Total net undiscounted financial assets/(liabilities) 127,542,276 (15,962,091) 111,580,185
Company2016
Financial assets
Trade receivables 53,208,949 – 53,208,949Other receivables and deposits 8,640,158 – 8,640,158Accrued income 12,317,615 – 12,317,615Amounts due from subsidiaries 680,738 – 680,738Loans due from subsidiaries 7,505,324 12,472,910 19,978,234Cash and short-term deposits 42,888,186 – 42,888,186
Total undiscounted financial assets 125,240,970 12,472,910 137,713,880
Financial liabilities
Trade payables 13,143,235 – 13,143,235Other payables and accruals 33,630,718 – 33,630,718Loans and borrowings 28,740 69,455 98,195
Total undiscounted financial liabilities 46,802,693 69,455 46,872,148
Total net undiscounted financial assets 78,438,277 12,403,455 90,841,732
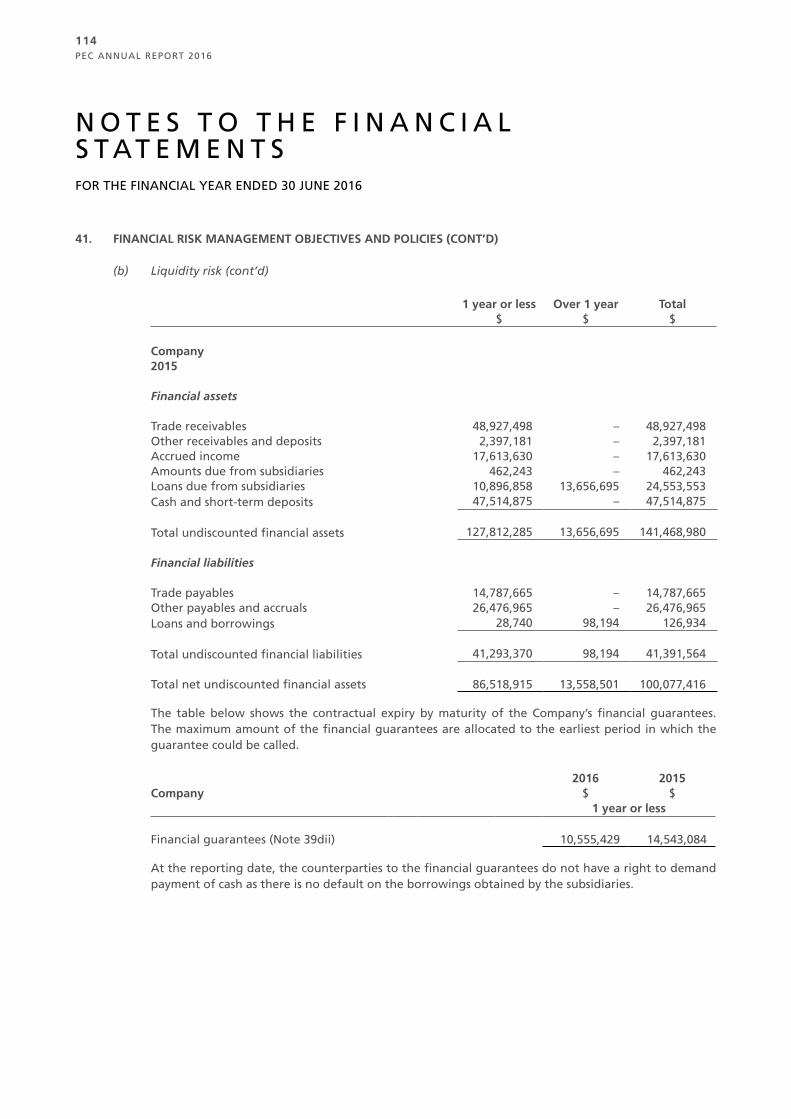
PEC ANNUAL REPORT 2016
114
N O T E S T O T H E F I N A N C I A L S T AT E M E N T SFOR THE FINANCIAL YEAR ENDED 30 JUNE 2016
41. FINANCIAL RISK MANAGEMENT OBJECTIVES AND POLICIES (CONT’D)
(b) Liquidity risk (cont’d)
1 year or less Over 1 year Total$ $ $
Company2015
Financial assets
Trade receivables 48,927,498 – 48,927,498Other receivables and deposits 2,397,181 – 2,397,181Accrued income 17,613,630 – 17,613,630Amounts due from subsidiaries 462,243 – 462,243Loans due from subsidiaries 10,896,858 13,656,695 24,553,553Cash and short-term deposits 47,514,875 – 47,514,875
Total undiscounted financial assets 127,812,285 13,656,695 141,468,980
Financial liabilities
Trade payables 14,787,665 – 14,787,665Other payables and accruals 26,476,965 – 26,476,965Loans and borrowings 28,740 98,194 126,934
Total undiscounted financial liabilities 41,293,370 98,194 41,391,564
Total net undiscounted financial assets 86,518,915 13,558,501 100,077,416
The table below shows the contractual expiry by maturity of the Company’s financial guarantees. The maximum amount of the financial guarantees are allocated to the earliest period in which the guarantee could be called.
2016 2015Company $ $
1 year or less
Financial guarantees (Note 39dii) 10,555,429 14,543,084
At the reporting date, the counterparties to the financial guarantees do not have a right to demand payment of cash as there is no default on the borrowings obtained by the subsidiaries.
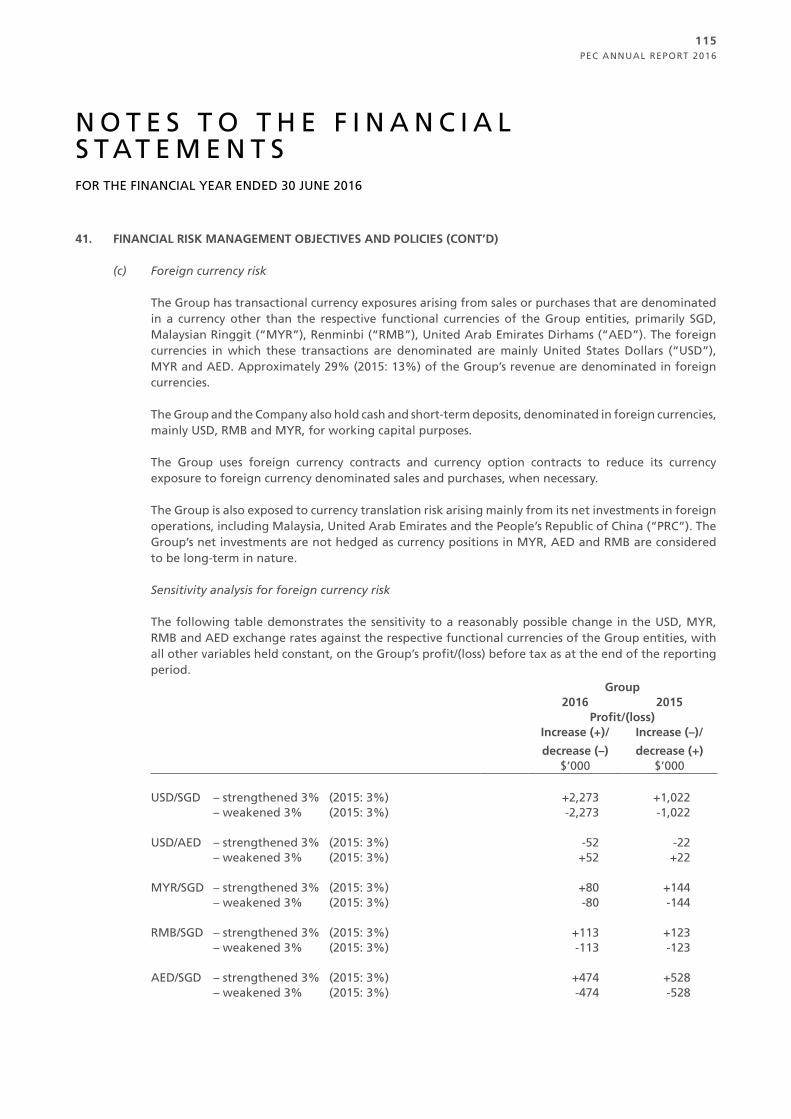
PEC ANNUAL REPORT 2016
115
N O T E S T O T H E F I N A N C I A L S T AT E M E N T SFOR THE FINANCIAL YEAR ENDED 30 JUNE 2016
41. FINANCIAL RISK MANAGEMENT OBJECTIVES AND POLICIES (CONT’D)
(c) Foreign currency risk
The Group has transactional currency exposures arising from sales or purchases that are denominated in a currency other than the respective functional currencies of the Group entities, primarily SGD, Malaysian Ringgit (“MYR”), Renminbi (“RMB”), United Arab Emirates Dirhams (“AED”). The foreign currencies in which these transactions are denominated are mainly United States Dollars (“USD”), MYR and AED. Approximately 29% (2015: 13%) of the Group’s revenue are denominated in foreign currencies.
The Group and the Company also hold cash and short-term deposits, denominated in foreign currencies, mainly USD, RMB and MYR, for working capital purposes.
The Group uses foreign currency contracts and currency option contracts to reduce its currency exposure to foreign currency denominated sales and purchases, when necessary.
The Group is also exposed to currency translation risk arising mainly from its net investments in foreign operations, including Malaysia, United Arab Emirates and the People’s Republic of China (“PRC”). The Group’s net investments are not hedged as currency positions in MYR, AED and RMB are considered to be long-term in nature.
Sensitivity analysis for foreign currency risk
The following table demonstrates the sensitivity to a reasonably possible change in the USD, MYR, RMB and AED exchange rates against the respective functional currencies of the Group entities, with all other variables held constant, on the Group’s profit/(loss) before tax as at the end of the reporting period.
Group2016 2015
Profit/(loss)Increase (+)/decrease (–)
Increase (–)/decrease (+)
$’000 $’000
USD/SGD – strengthened 3% (2015: 3%) +2,273 +1,022 – weakened 3% (2015: 3%) -2,273 -1,022
USD/AED – strengthened 3% (2015: 3%) -52 -22 – weakened 3% (2015: 3%) +52 +22
MYR/SGD – strengthened 3% (2015: 3%) +80 +144 – weakened 3% (2015: 3%) -80 -144
RMB/SGD – strengthened 3% (2015: 3%) +113 +123 – weakened 3% (2015: 3%) -113 -123
AED/SGD – strengthened 3% (2015: 3%) +474 +528 – weakened 3% (2015: 3%) -474 -528
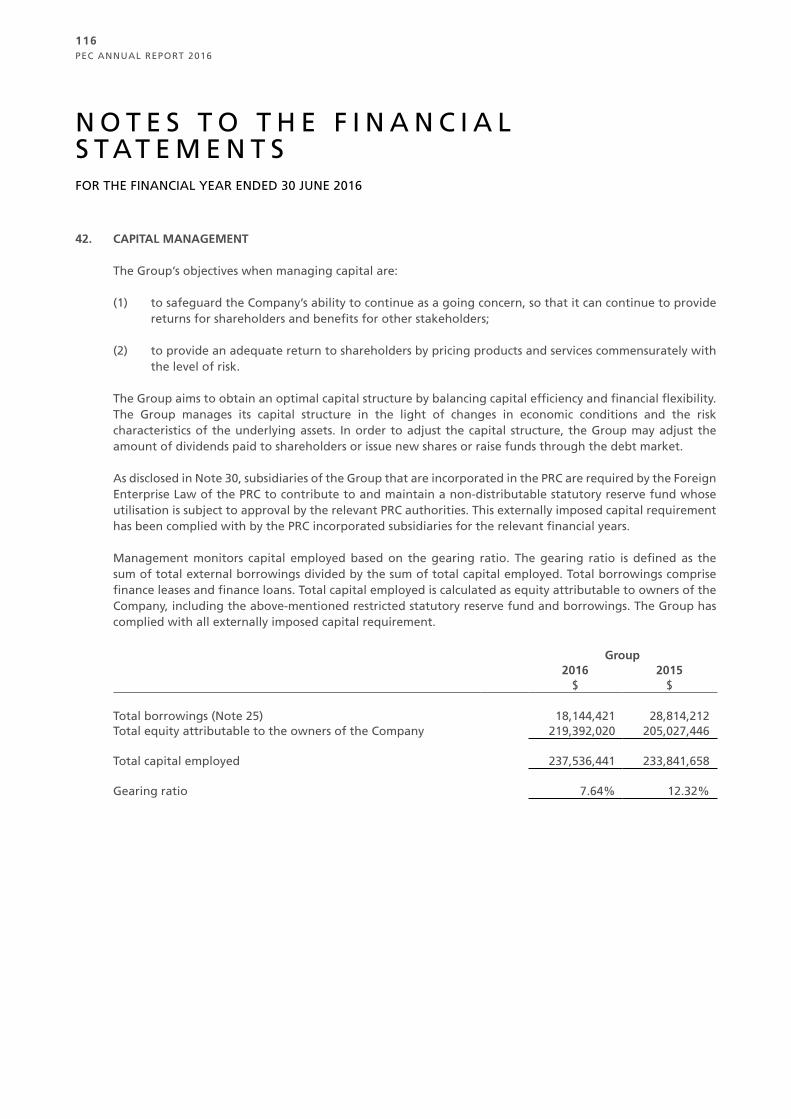
PEC ANNUAL REPORT 2016
116
N O T E S T O T H E F I N A N C I A L S T AT E M E N T SFOR THE FINANCIAL YEAR ENDED 30 JUNE 2016
42. CAPITAL MANAGEMENT
The Group’s objectives when managing capital are:
(1) to safeguard the Company’s ability to continue as a going concern, so that it can continue to provide returns for shareholders and benefits for other stakeholders;
(2) to provide an adequate return to shareholders by pricing products and services commensurately with the level of risk.
The Group aims to obtain an optimal capital structure by balancing capital efficiency and financial flexibility. The Group manages its capital structure in the light of changes in economic conditions and the risk characteristics of the underlying assets. In order to adjust the capital structure, the Group may adjust the amount of dividends paid to shareholders or issue new shares or raise funds through the debt market.
As disclosed in Note 30, subsidiaries of the Group that are incorporated in the PRC are required by the Foreign Enterprise Law of the PRC to contribute to and maintain a non-distributable statutory reserve fund whose utilisation is subject to approval by the relevant PRC authorities. This externally imposed capital requirement has been complied with by the PRC incorporated subsidiaries for the relevant financial years.
Management monitors capital employed based on the gearing ratio. The gearing ratio is defined as the sum of total external borrowings divided by the sum of total capital employed. Total borrowings comprise finance leases and finance loans. Total capital employed is calculated as equity attributable to owners of the Company, including the above-mentioned restricted statutory reserve fund and borrowings. The Group has complied with all externally imposed capital requirement.
Group2016 2015
$ $
Total borrowings (Note 25) 18,144,421 28,814,212Total equity attributable to the owners of the Company 219,392,020 205,027,446
Total capital employed 237,536,441 233,841,658
Gearing ratio 7.64% 12.32%
PEC ANNUAL REPORT 2016
117
N O T E S T O T H E F I N A N C I A L S T AT E M E N T SFOR THE FINANCIAL YEAR ENDED 30 JUNE 2016
43. SEGMENT INFORMATION
For management purposes, the Group is organised into business units as the Group’s risks and rates of return are affected predominantly by differences in the services and projects carried out. The operating businesses are organised and managed separately according to the nature of the projects and services carried out, with each segment representing a strategic business unit that offers different services and serves different markets. The Group has three reportable segments as follows:
i. The project works segment relates to provision of engineering, procurement and construction services for certain aspects of plant projects, such as tankage and/or piping work, procurement to the oil and gas, petro-chemical, pharmaceutical and oil and chemical terminal industries.
ii. The plant maintenance and related services segment relates to a full discipline of maintenance services provided to the oil and gas, petrochemical, pharmaceutical and oil and chemical terminal industries, usually for a fixed three to five year term, under which various maintenance services and their relevant rates would be itemised.
iii. The other operations segment relates to services provided through the Company’s subsidiaries whereby heat treatment, information technology services/products and construction equipment leasing services are provided. It also relates to construction equipment leasing services provided by the Group.
Except as indicated above, no operating segments have been aggregated to form the above reportable business segments.
Management monitors the operating results of its business units separately for the purpose of making decisions about resource allocation and performance assessment. Segment performance is evaluated based on operating profit or loss which in certain respects, as explained in the table below, is measured differently from operating profit or loss in the consolidated financial statements. Group financing (including finance costs) and income taxes are managed on a group basis and are not allocated to operating segments.
Allocation basis and transfer pricing
Segment results include items directly attributable to a segment as well as those that can be allocated on a reasonable basis.
Transfer prices between operating segments are on an arm’s length basis in a manner similar to transactions with third parties. Segment revenue, expenses and results include transfers between business segments. These transfers are eliminated on consolidation.

PEC ANNUAL REPORT 2016
118
N O T E S T O T H E F I N A N C I A L S T AT E M E N T SFOR THE FINANCIAL YEAR ENDED 30 JUNE 2016
43. SEGMENT INFORMATION (CONT’D)
(a) Business segments
Project works
Plant main-tenance
and related services
Other operations Eliminations Total
$ $ $ $ $
2016Revenue 424,892,761 149,291,449 893,397 – 575,077,607Inter-segment sales 22,877,826 1,424,634 2,150,090 (26,452,550) –
Total revenue 447,770,587 150,716,083 3,043,487 (26,452,550) 575,077,607
Results:Segment results 72,328,678 33,576,946 230,275 – 106,135,899
Unallocated expenses and income, net (59,511,711)
Interest income 1,095,761Depreciation and
amortisation (5,398,362) (1,866,937) (353,492) – (7,618,791)Unallocated depreciation
and amortisation (8,316,102)Impairment loss on property,
plant and equipment (211,418) – – – (211,418)(Impairment)/write-back of
accrued income, net (138,474) 163,427 – – 24,953Impairment of trade
receivables – (2,857,375) (125,734) – (2,983,109)Finance costs (1,050,413)Share of results of associate – – 409,553 – 409,553
Profit before tax 27,974,622Income tax expense (5,693,505)
Profit for the year 22,281,117
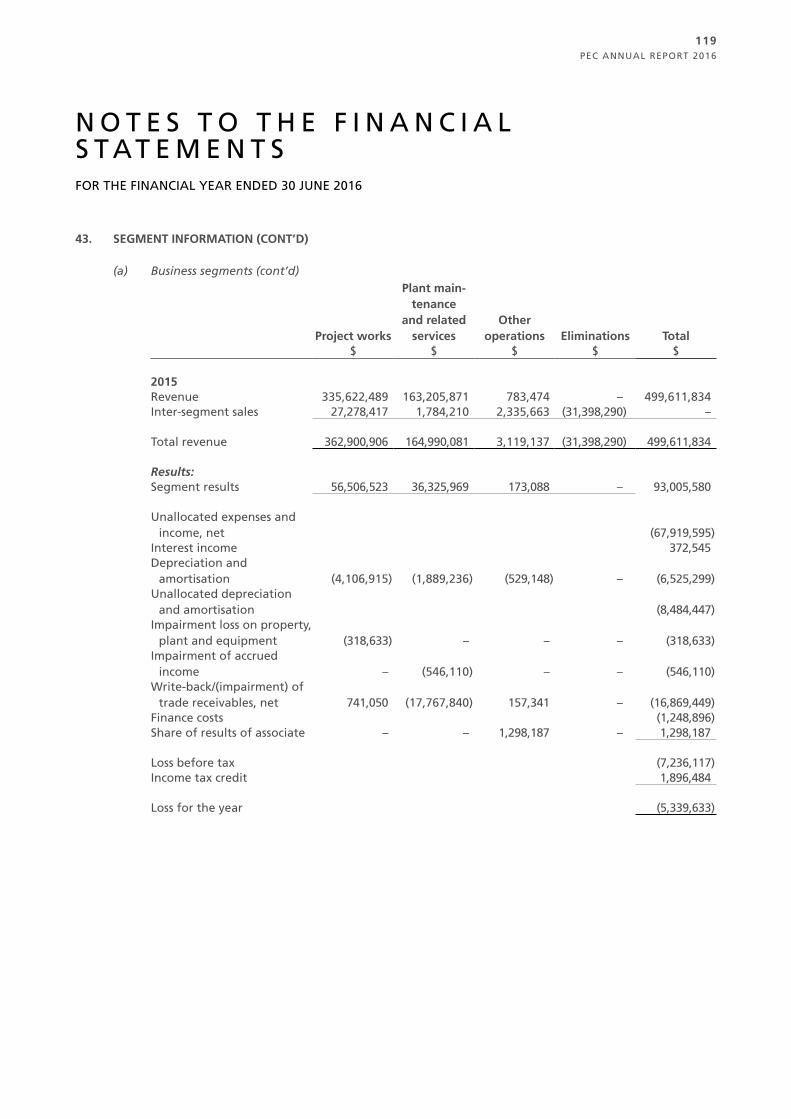
PEC ANNUAL REPORT 2016
119
N O T E S T O T H E F I N A N C I A L S T AT E M E N T SFOR THE FINANCIAL YEAR ENDED 30 JUNE 2016
43. SEGMENT INFORMATION (CONT’D)
(a) Business segments (cont’d)
Project works
Plant main-tenance
and related services
Other operations Eliminations Total
$ $ $ $ $
2015 Revenue 335,622,489 163,205,871 783,474 – 499,611,834Inter-segment sales 27,278,417 1,784,210 2,335,663 (31,398,290) –
Total revenue 362,900,906 164,990,081 3,119,137 (31,398,290) 499,611,834
Results:Segment results 56,506,523 36,325,969 173,088 – 93,005,580
Unallocated expenses and income, net (67,919,595)
Interest income 372,545Depreciation and
amortisation (4,106,915) (1,889,236) (529,148) – (6,525,299)Unallocated depreciation
and amortisation (8,484,447)Impairment loss on property,
plant and equipment (318,633) – – – (318,633)Impairment of accrued
income – (546,110) – – (546,110)Write-back/(impairment) of
trade receivables, net 741,050 (17,767,840) 157,341 – (16,869,449)Finance costs (1,248,896)Share of results of associate – – 1,298,187 – 1,298,187
Loss before tax (7,236,117)Income tax credit 1,896,484
Loss for the year (5,339,633)
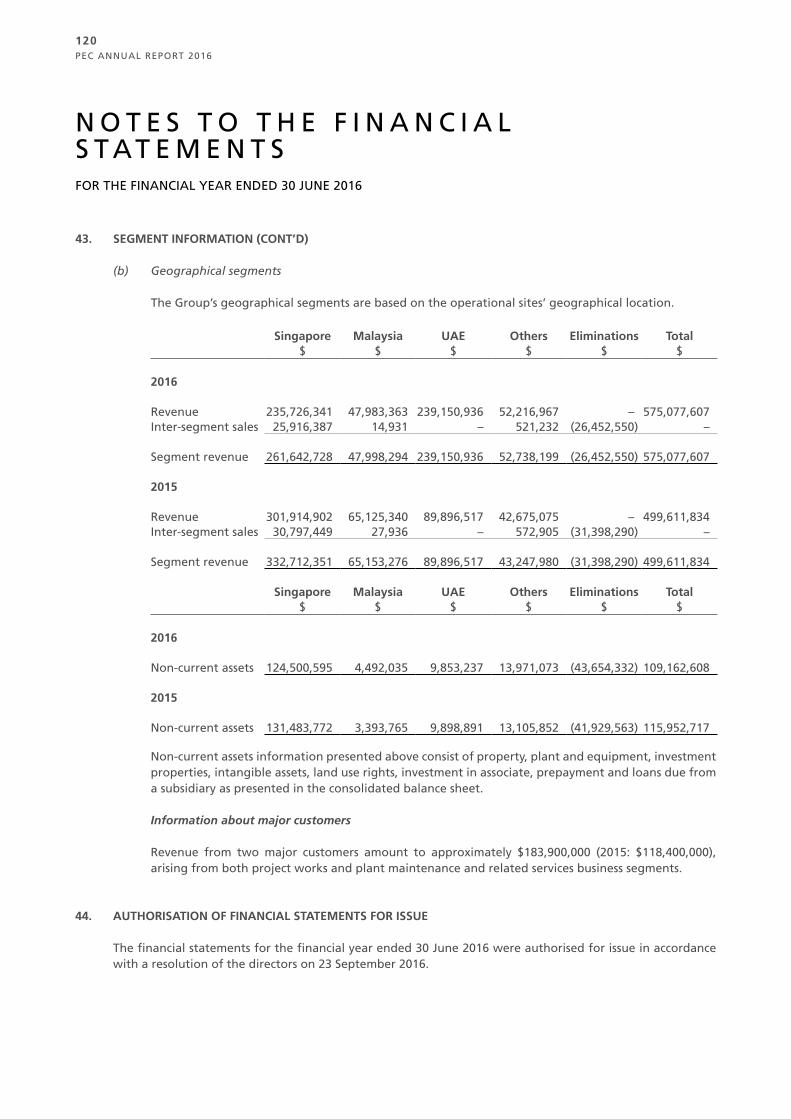
PEC ANNUAL REPORT 2016
120
N O T E S T O T H E F I N A N C I A L S T AT E M E N T SFOR THE FINANCIAL YEAR ENDED 30 JUNE 2016
43. SEGMENT INFORMATION (CONT’D)
(b) Geographical segments
The Group’s geographical segments are based on the operational sites’ geographical location.
Singapore Malaysia UAE Others Eliminations Total$ $ $ $ $ $
2016
Revenue 235,726,341 47,983,363 239,150,936 52,216,967 – 575,077,607Inter-segment sales 25,916,387 14,931 – 521,232 (26,452,550) –
Segment revenue 261,642,728 47,998,294 239,150,936 52,738,199 (26,452,550) 575,077,607
2015
Revenue 301,914,902 65,125,340 89,896,517 42,675,075 – 499,611,834Inter-segment sales 30,797,449 27,936 – 572,905 (31,398,290) –
Segment revenue 332,712,351 65,153,276 89,896,517 43,247,980 (31,398,290) 499,611,834
Singapore Malaysia UAE Others Eliminations Total$ $ $ $ $ $
2016
Non-current assets 124,500,595 4,492,035 9,853,237 13,971,073 (43,654,332) 109,162,608
2015
Non-current assets 131,483,772 3,393,765 9,898,891 13,105,852 (41,929,563) 115,952,717
Non-current assets information presented above consist of property, plant and equipment, investment properties, intangible assets, land use rights, investment in associate, prepayment and loans due from a subsidiary as presented in the consolidated balance sheet.
Information about major customers
Revenue from two major customers amount to approximately $183,900,000 (2015: $118,400,000), arising from both project works and plant maintenance and related services business segments.
44. AUTHORISATION OF FINANCIAL STATEMENTS FOR ISSUE
The financial statements for the financial year ended 30 June 2016 were authorised for issue in accordance with a resolution of the directors on 23 September 2016.
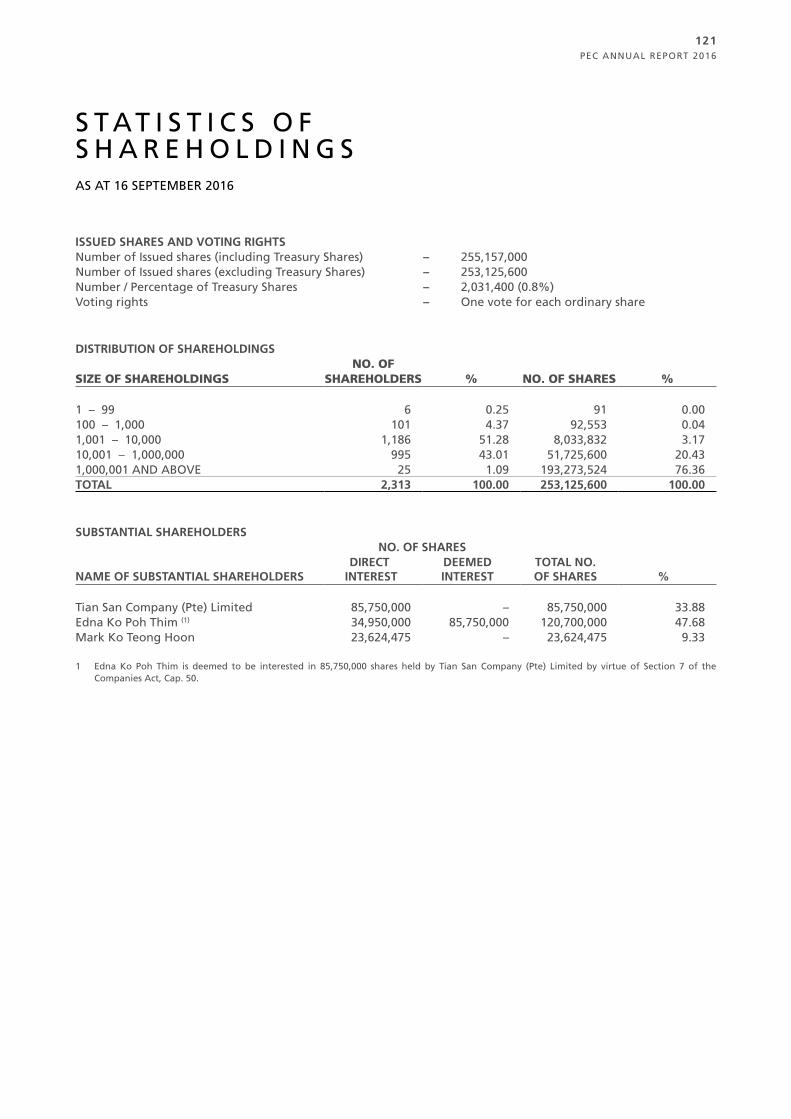
PEC ANNUAL REPORT 2016
121
ISSUED SHARES AND VOTING RIGHTS Number of Issued shares (including Treasury Shares) – 255,157,000Number of Issued shares (excluding Treasury Shares) – 253,125,600Number / Percentage of Treasury Shares – 2,031,400 (0.8%) Voting rights – One vote for each ordinary share
DISTRIBUTION OF SHAREHOLDINGSNO. OF
SIZE OF SHAREHOLDINGS SHAREHOLDERS % NO. OF SHARES %
1 – 99 6 0.25 91 0.00100 – 1,000 101 4.37 92,553 0.041,001 – 10,000 1,186 51.28 8,033,832 3.1710,001 – 1,000,000 995 43.01 51,725,600 20.431,000,001 AND ABOVE 25 1.09 193,273,524 76.36TOTAL 2,313 100.00 253,125,600 100.00
SUBSTANTIAL SHAREHOLDERS NO. OF SHARES
NAME OF SUBSTANTIAL SHAREHOLDERS DIRECT
INTEREST DEEMED INTEREST
TOTAL NO. OF SHARES %
Tian San Company (Pte) Limited 85,750,000 – 85,750,000 33.88Edna Ko Poh Thim (1) 34,950,000 85,750,000 120,700,000 47.68Mark Ko Teong Hoon 23,624,475 – 23,624,475 9.33
1 Edna Ko Poh Thim is deemed to be interested in 85,750,000 shares held by Tian San Company (Pte) Limited by virtue of Section 7 of the Companies Act, Cap. 50.
S T AT I S T I C S O F S H A R E H O L D I N G S AS AT 16 SEPTEMBER 2016
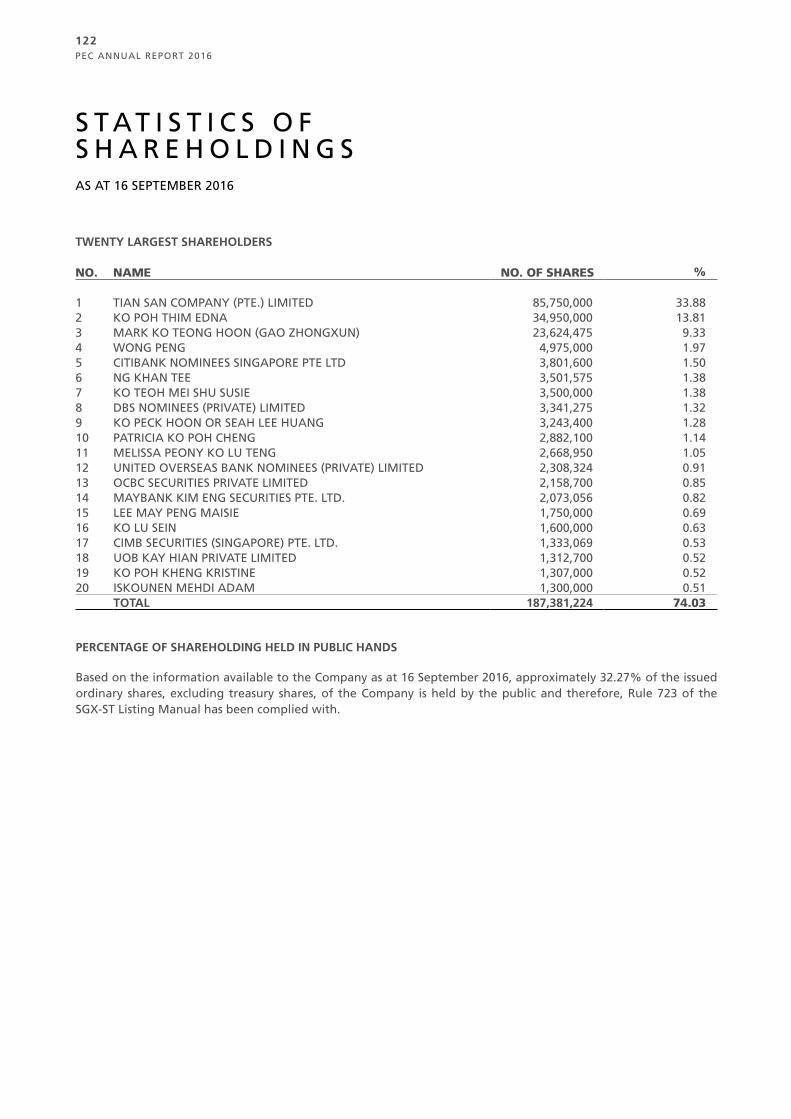
PEC ANNUAL REPORT 2016
122
TWENTY LARGEST SHAREHOLDERS
NO. NAME NO. OF SHARES %
1 TIAN SAN COMPANY (PTE.) LIMITED 85,750,000 33.882 KO POH THIM EDNA 34,950,000 13.813 MARK KO TEONG HOON (GAO ZHONGXUN) 23,624,475 9.334 WONG PENG 4,975,000 1.975 CITIBANK NOMINEES SINGAPORE PTE LTD 3,801,600 1.506 NG KHAN TEE 3,501,575 1.387 KO TEOH MEI SHU SUSIE 3,500,000 1.388 DBS NOMINEES (PRIVATE) LIMITED 3,341,275 1.329 KO PECK HOON OR SEAH LEE HUANG 3,243,400 1.2810 PATRICIA KO POH CHENG 2,882,100 1.1411 MELISSA PEONY KO LU TENG 2,668,950 1.0512 UNITED OVERSEAS BANK NOMINEES (PRIVATE) LIMITED 2,308,324 0.9113 OCBC SECURITIES PRIVATE LIMITED 2,158,700 0.8514 MAYBANK KIM ENG SECURITIES PTE. LTD. 2,073,056 0.8215 LEE MAY PENG MAISIE 1,750,000 0.6916 KO LU SEIN 1,600,000 0.6317 CIMB SECURITIES (SINGAPORE) PTE. LTD. 1,333,069 0.5318 UOB KAY HIAN PRIVATE LIMITED 1,312,700 0.5219 KO POH KHENG KRISTINE 1,307,000 0.5220 ISKOUNEN MEHDI ADAM 1,300,000 0.51
TOTAL 187,381,224 74.03
PERCENTAGE OF SHAREHOLDING HELD IN PUBLIC HANDS
Based on the information available to the Company as at 16 September 2016, approximately 32.27% of the issued ordinary shares, excluding treasury shares, of the Company is held by the public and therefore, Rule 723 of the SGX-ST Listing Manual has been complied with.
S T AT I S T I C S O F S H A R E H O L D I N G S AS AT 16 SEPTEMBER 2016
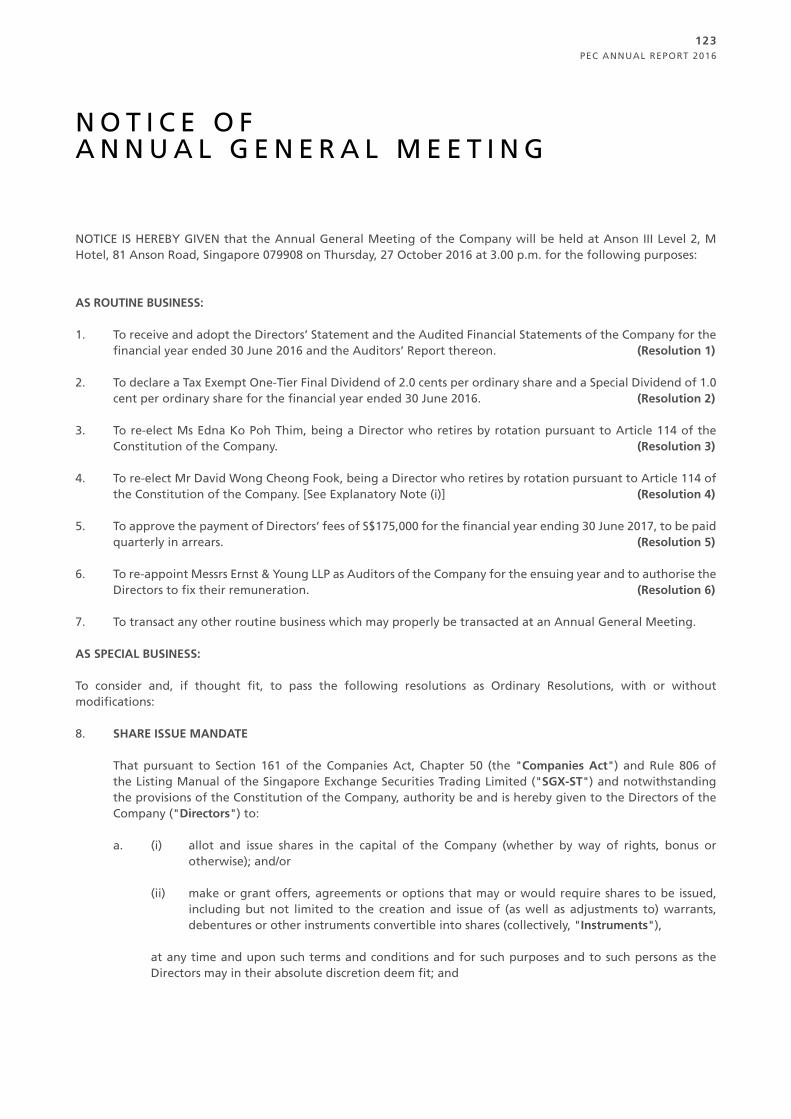
PEC ANNUAL REPORT 2016
123
N O T I C E O F A N N U A L G E N E R A L M E E T I N G
NOTICE IS HEREBY GIVEN that the Annual General Meeting of the Company will be held at Anson III Level 2, M Hotel, 81 Anson Road, Singapore 079908 on Thursday, 27 October 2016 at 3.00 p.m. for the following purposes:
AS ROUTINE BUSINESS:
1. To receive and adopt the Directors’ Statement and the Audited Financial Statements of the Company for the financial year ended 30 June 2016 and the Auditors’ Report thereon. (Resolution 1)
2. To declare a Tax Exempt One-Tier Final Dividend of 2.0 cents per ordinary share and a Special Dividend of 1.0 cent per ordinary share for the financial year ended 30 June 2016. (Resolution 2)
3. To re-elect Ms Edna Ko Poh Thim, being a Director who retires by rotation pursuant to Article 114 of the
Constitution of the Company. (Resolution 3) 4. To re-elect Mr David Wong Cheong Fook, being a Director who retires by rotation pursuant to Article 114 of
the Constitution of the Company. [See Explanatory Note (i)] (Resolution 4)
5. To approve the payment of Directors’ fees of S$175,000 for the financial year ending 30 June 2017, to be paid quarterly in arrears. (Resolution 5)
6. To re-appoint Messrs Ernst & Young LLP as Auditors of the Company for the ensuing year and to authorise the Directors to fix their remuneration. (Resolution 6)
7. To transact any other routine business which may properly be transacted at an Annual General Meeting.
AS SPECIAL BUSINESS:
To consider and, if thought fit, to pass the following resolutions as Ordinary Resolutions, with or without modifications:
8. SHARE ISSUE MANDATE
That pursuant to Section 161 of the Companies Act, Chapter 50 (the "Companies Act") and Rule 806 of the Listing Manual of the Singapore Exchange Securities Trading Limited ("SGX-ST") and notwithstanding the provisions of the Constitution of the Company, authority be and is hereby given to the Directors of the Company ("Directors") to:
a. (i) allot and issue shares in the capital of the Company (whether by way of rights, bonus or otherwise); and/or
(ii) make or grant offers, agreements or options that may or would require shares to be issued, including but not limited to the creation and issue of (as well as adjustments to) warrants, debentures or other instruments convertible into shares (collectively, "Instruments"),
at any time and upon such terms and conditions and for such purposes and to such persons as the Directors may in their absolute discretion deem fit; and
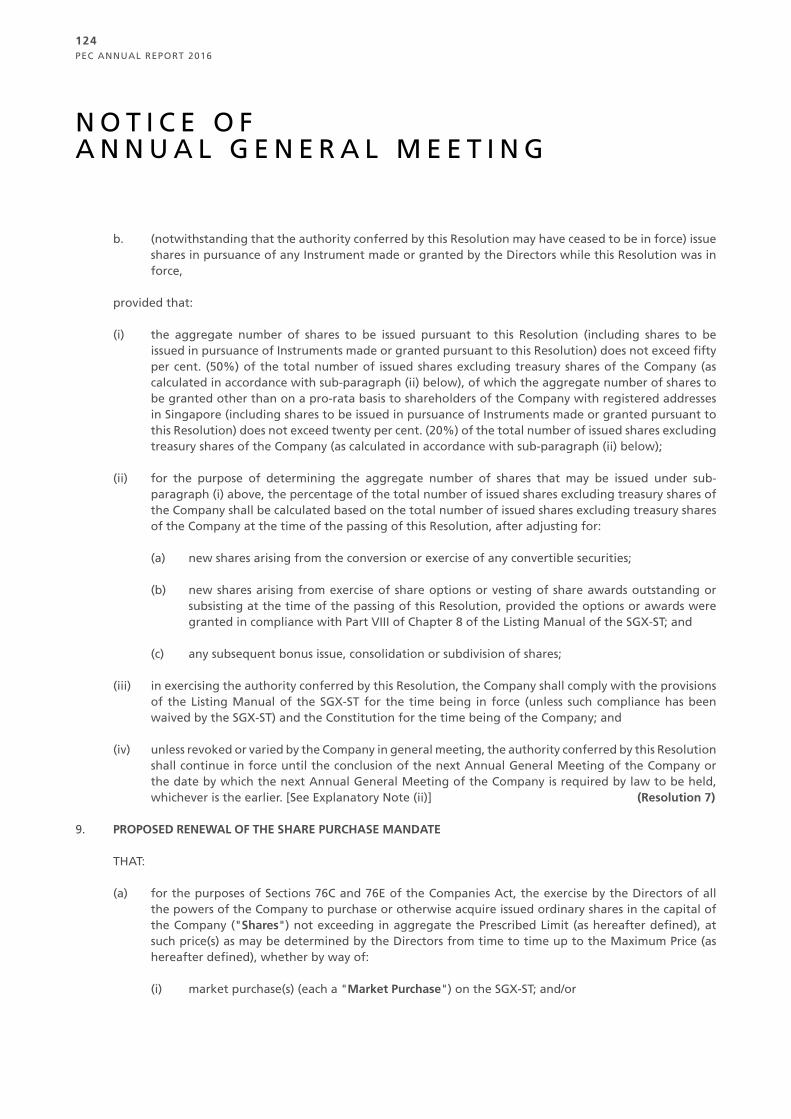
PEC ANNUAL REPORT 2016
124
b. (notwithstanding that the authority conferred by this Resolution may have ceased to be in force) issue shares in pursuance of any Instrument made or granted by the Directors while this Resolution was in force,
provided that:
(i) the aggregate number of shares to be issued pursuant to this Resolution (including shares to be issued in pursuance of Instruments made or granted pursuant to this Resolution) does not exceed fifty per cent. (50%) of the total number of issued shares excluding treasury shares of the Company (as calculated in accordance with sub-paragraph (ii) below), of which the aggregate number of shares to be granted other than on a pro-rata basis to shareholders of the Company with registered addresses in Singapore (including shares to be issued in pursuance of Instruments made or granted pursuant to this Resolution) does not exceed twenty per cent. (20%) of the total number of issued shares excluding treasury shares of the Company (as calculated in accordance with sub-paragraph (ii) below);
(ii) for the purpose of determining the aggregate number of shares that may be issued under sub-paragraph (i) above, the percentage of the total number of issued shares excluding treasury shares of the Company shall be calculated based on the total number of issued shares excluding treasury shares of the Company at the time of the passing of this Resolution, after adjusting for:
(a) new shares arising from the conversion or exercise of any convertible securities;
(b) new shares arising from exercise of share options or vesting of share awards outstanding or subsisting at the time of the passing of this Resolution, provided the options or awards were granted in compliance with Part VIII of Chapter 8 of the Listing Manual of the SGX-ST; and
(c) any subsequent bonus issue, consolidation or subdivision of shares;
(iii) in exercising the authority conferred by this Resolution, the Company shall comply with the provisions of the Listing Manual of the SGX-ST for the time being in force (unless such compliance has been waived by the SGX-ST) and the Constitution for the time being of the Company; and
(iv) unless revoked or varied by the Company in general meeting, the authority conferred by this Resolution shall continue in force until the conclusion of the next Annual General Meeting of the Company or the date by which the next Annual General Meeting of the Company is required by law to be held, whichever is the earlier. [See Explanatory Note (ii)] (Resolution 7)
9. PROPOSED RENEWAL OF THE SHARE PURCHASE MANDATE
THAT:
(a) for the purposes of Sections 76C and 76E of the Companies Act, the exercise by the Directors of all the powers of the Company to purchase or otherwise acquire issued ordinary shares in the capital of the Company ("Shares") not exceeding in aggregate the Prescribed Limit (as hereafter defined), at such price(s) as may be determined by the Directors from time to time up to the Maximum Price (as hereafter defined), whether by way of:
(i) market purchase(s) (each a "Market Purchase") on the SGX-ST; and/or
N O T I C E O F A N N U A L G E N E R A L M E E T I N G
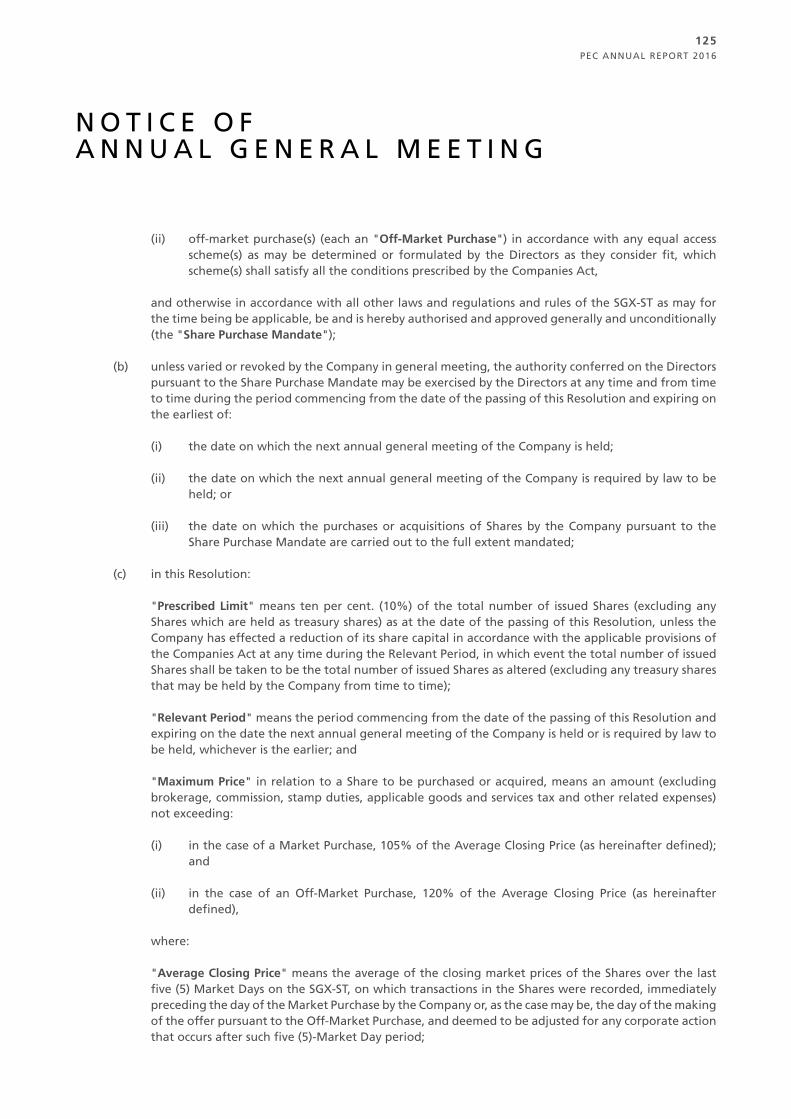
PEC ANNUAL REPORT 2016
125
(ii) off-market purchase(s) (each an "Off-Market Purchase") in accordance with any equal access scheme(s) as may be determined or formulated by the Directors as they consider fit, which scheme(s) shall satisfy all the conditions prescribed by the Companies Act,
and otherwise in accordance with all other laws and regulations and rules of the SGX-ST as may for the time being be applicable, be and is hereby authorised and approved generally and unconditionally (the "Share Purchase Mandate");
(b) unless varied or revoked by the Company in general meeting, the authority conferred on the Directors pursuant to the Share Purchase Mandate may be exercised by the Directors at any time and from time to time during the period commencing from the date of the passing of this Resolution and expiring on the earliest of:
(i) the date on which the next annual general meeting of the Company is held;
(ii) the date on which the next annual general meeting of the Company is required by law to be held; or
(iii) the date on which the purchases or acquisitions of Shares by the Company pursuant to the Share Purchase Mandate are carried out to the full extent mandated;
(c) in this Resolution:
"Prescribed Limit" means ten per cent. (10%) of the total number of issued Shares (excluding any Shares which are held as treasury shares) as at the date of the passing of this Resolution, unless the Company has effected a reduction of its share capital in accordance with the applicable provisions of the Companies Act at any time during the Relevant Period, in which event the total number of issued Shares shall be taken to be the total number of issued Shares as altered (excluding any treasury shares that may be held by the Company from time to time);
"Relevant Period" means the period commencing from the date of the passing of this Resolution and expiring on the date the next annual general meeting of the Company is held or is required by law to be held, whichever is the earlier; and
"Maximum Price" in relation to a Share to be purchased or acquired, means an amount (excluding brokerage, commission, stamp duties, applicable goods and services tax and other related expenses) not exceeding:
(i) in the case of a Market Purchase, 105% of the Average Closing Price (as hereinafter defined); and
(ii) in the case of an Off-Market Purchase, 120% of the Average Closing Price (as hereinafter defined),
where:
"Average Closing Price" means the average of the closing market prices of the Shares over the last five (5) Market Days on the SGX-ST, on which transactions in the Shares were recorded, immediately preceding the day of the Market Purchase by the Company or, as the case may be, the day of the making of the offer pursuant to the Off-Market Purchase, and deemed to be adjusted for any corporate action that occurs after such five (5)-Market Day period;
N O T I C E O F A N N U A L G E N E R A L M E E T I N G
PEC ANNUAL REPORT 2016
126
"day of the making of the offer" means the day on which the Company announces its intention to make an offer for the purchase or acquisition of Shares from Shareholders stating the purchase price (which shall not be more than the Maximum Price calculated on the foregoing basis) for each Share and the relevant terms of the equal access scheme for effecting the Off-Market Purchase; and
"Market Day" means a day on which the SGX-ST is open for trading in securities;
(d) the Directors or any of them be and are hereby authorised to deal with the Shares purchased or acquired by the Company pursuant to the Share Purchase Mandate in any manner as they think fit, which is permissible under the Companies Act; and
(e) the Directors or any of them be and are hereby authorised to complete and do all such acts and things (including executing such documents as may be required) as they may consider expedient or necessary to give effect to the transactions contemplated by this Resolution.
[See Explanatory Note (iii)] (Resolution 8)
10. AUTHORITY TO GRANT AWARDS AND ALLOT AND ISSUE SHARES UNDER THE PEC PERFORMANCE SHARE PLAN
That the Directors of the Company be and are hereby authorised to:
(a) grant awards ("Awards") in accordance with the provisions of the PEC Performance Share Plan (the "Plan"); and
(b) pursuant to Section 161 of the Companies Act, allot and issue from time to time such number of fully paid-up shares in the capital of the Company as may be required to be allotted and issued pursuant to the vesting of Awards granted under the Plan,
provided always that the aggregate number of shares to be delivered pursuant to the vesting of Awards granted or to be granted under the Plan, when added to the number of shares issued and/or issuable under such other share-based incentive schemes of the Company, shall not exceed fifteen per cent. (15%) of the total number of issued shares of the Company (excluding treasury shares) on the day preceding the relevant award date. [See Explanatory Note (iv)] (Resolution 9)
By Order of the Board
Abdul Jabbar Bin Karam DinJoint Company Secretary
Singapore, 11 October 2016
N O T I C E O F A N N U A L G E N E R A L M E E T I N G
PEC ANNUAL REPORT 2016
127
NOTES:
1. Save as provided in the Constitution, a member (other than a Relevant Intermediary*) entitled to attend and vote at the Annual General Meeting is entitled to appoint not more than two proxies to attend and vote in his stead. A proxy need not be a member of the Company.
2. A Relevant Intermediary* may appoint more than two proxies, but each proxy must be appointed to exercise the rights attached to a different share or shares held by him (which number or class of shares shall be specified).
3. The instrument appointing a proxy must be deposited at the Registered Office of the Company at 21 Shipyard Road, Singapore 628144, not less than 48 hours before the time appointed for holding the Annual General Meeting.
* A Relevant Intermediary is:
(a) a banking corporation licensed under the Banking Act (Cap. 19) or a wholly-owned subsidiary of such a banking corporation, whose business includes the provision of nominee services and who holds shares in that capacity; or
(b) a person holding a capital markets services licence to provide custodial services for securities under the Securities and Futures Act (Cap. 289) and who holds shares in that capacity; or
(c) the Central Provident Fund Board established by the Central Provident Fund Act (Cap. 36), in respect of shares purchased under the subsidiary legislation made under that Act providing for the making of investments from the contributions and interest standing to the credit of members of the Central Provident Fund, if the Board holds those shares in the capacity of an intermediary pursuant to or in accordance with that subsidiary legislation.
EXPLANATORY NOTES:
(i) Resolution 4 is to re-elect Mr David Wong Cheong Fook as a Director of the Company. Mr Wong, upon re-election as a Director of the Company, will remain as the Chairman of the Audit Committee and a member of the Nominating Committee and the Remuneration Committee. Mr Wong is an Independent Director.
(ii) Resolution 7 proposed in item 8. above, if passed, is to empower the Directors to allot and issue shares in the capital of the Company and/or Instruments (as defined above). The aggregate number of shares to be issued pursuant to Resolution 7 (including shares to be issued in pursuance of Instruments made or granted pursuant to this Resolution) shall not exceed fifty per cent. (50%) of the total number of issued shares excluding treasury shares of the Company, with a sub-limit of twenty per cent. (20%) for shares issued other than on a pro rata basis (including shares to be issued in pursuance of Instruments made or granted pursuant to this Resolution) to shareholders with registered addresses in Singapore. For the purpose of determining the aggregate number of shares that may be issued, the percentage of the total number of issued shares excluding treasury shares of the Company will be calculated based on the total number of issued shares excluding treasury shares of the Company at the time of the passing of Resolution 7, after adjusting for (i) new shares arising from the conversion or exercise of any convertible securities; (ii) new shares arising from exercise of share options or vesting of share awards outstanding or subsisting at the time of the passing of Resolution 7, provided the options or awards were granted in compliance with Part VIII of Chapter 8 of the Listing Manual of the SGX-ST; and (iii) any subsequent bonus issue, consolidation or subdivision of shares.
N O T I C E O F A N N U A L G E N E R A L M E E T I N G

PEC ANNUAL REPORT 2016
128
(iii) Resolution 8 proposed in item 9. above, if passed, will empower the Directors to exercise all powers of the Company to purchase or otherwise acquire (whether by way of market purchases or off-market purchases) Shares on the terms of the Share Purchase Mandate as set out in the letter to shareholders of the Company dated 11 October 2016 (the "Letter").
The Company intends to use internal sources of funds or external borrowings or a combination of both to finance its purchase or acquisitions of Shares pursuant to the Share Purchase Mandate. It is not possible for the Company to realistically calculate or quantify the impact of purchases or acquisitions of Shares that may be made pursuant to the Share Purchase Mandate on the net tangible asset value and earnings per Share as the resultant effect would depend on, inter alia, the aggregate number of Shares purchased or acquired, whether the purchase or acquisition is made out of capital or profits, the purchase prices paid for such Shares, the amount (if any) borrowed by the Company to fund the purchases or acquisitions, and whether the Shares purchased or acquired are cancelled or held as treasury shares.
An illustration of the financial effects of the purchase or acquisition of Shares by the Company pursuant to the Share Purchase Mandate based on the audited financial statements of the Group for the financial year ended 30 June 2016 is set out in paragraph 2.7 of the Letter.
(iv) Resolution 9 proposed in item 10. above, if passed, is to authorise the Directors to (a) offer and grant Awards in accordance with the provisions of the Plan and (b) pursuant to Section 161 of the Companies Act, to allot and issue shares in the capital of the Company pursuant to the vesting of Awards granted under the Plan, provided that the aggregate number of shares to be delivered pursuant to the vesting of Awards granted or to be granted under the Plan, when added to the number of shares issued and/or issuable in respect of such other share-based incentive schemes of the Company shall not exceed fifteen per cent. (15%) of the total number of issued shares of the Company (excluding treasury shares) on the day preceding the relevant award date. As at the Latest Practicable Date, (a) apart from the Plan, there are no other share-based incentive schemes of the Company in force; and (b) Awards in respect of up to 7,792,208 shares were granted on 15 February 2016 under the Plan.
PERSONAL DATA PRIVACY:
By submitting an instrument appointing a proxy(ies) and/or representative(s) to attend, speak and vote at the Annual General Meeting and/or any adjournment thereof, a member of the Company: (i) consents to the collection, use and disclosure of the member’s personal data by the Company (or its agents) for the purpose of the processing and administration by the Company (or its agents) of proxies and representatives appointed for the Annual General Meeting (including any adjournment thereof) and the preparation and compilation of the attendance lists, minutes and other documents relating to the Annual General Meeting (including any adjournment thereof), and in order for the Company (or its agents) to comply with any applicable laws, listing rules, regulations and/or guidelines (collectively, the “Purposes”); (ii) warrants that where the member discloses the personal data of the member’s proxy(ies) and/or representative(s) to the Company (or its agents), the member has obtained the prior consent of such proxy(ies) and/or representative(s) for the collection, use and disclosure by the Company (or its agents) of the personal data of such proxy(ies) and/or representative(s) for the Purposes; and (iii) agrees that the member will indemnify the Company in respect of any penalties, liabilities, claims, demands, losses and damages as a result of the member’s breach of warranty.
N O T I C E O F A N N U A L G E N E R A L M E E T I N G

PEC LTD.(Incorporated in Singapore)(Registration No. 198200079M)
P R O X Y F O R M(Please see notes overleaf before completing this Form)
I/We, (Name) (NRIC/ Passport Number/ Company Regn. No.)
of (Address)
being a member/members of PEC LTD. (the “Company”), hereby appoint:
Name NRIC/Passport No. Proportion of ShareholdingsNo. of Shares %
Address
and/or failing him/her (delete as appropriate)
Name NRIC/Passport No. Proportion of ShareholdingsNo. of Shares %
Address
or failing him/her the Chairman of the Meeting as my/our proxy/proxies to attend and vote for me/us on my/our behalf at the Annual General Meeting ("AGM") of the Company to be held at Anson III Level 2, M Hotel, 81 Anson Road, Singapore 079908 on Thursday, 27 October 2016 at 3.00 p.m. and at any adjournment thereof.
The proxy/proxies shall vote on the Resolutions set out in the notice of the AGM in accordance with my/our directions as indicated hereunder. Where no such direction is given, the proxy/proxies may vote or abstain from voting at his/their discretion, on any matter at the AGM or at any adjournment thereof.
No. Resolutions relating to: For AgainstROUTINE BUSINESS
1 Adoption of Directors’ Statement and the Audited Financial Statements for the financial year ended 30 June 2016 (Resolution 1)
2 Approval of Tax Exempt One-Tier Final Dividend and a Special Dividend (Resolution 2)3 Re-election of Ms Edna Ko Poh Thim as a Director (Resolution 3)4 Re-election of Mr David Wong Cheong Fook as a Director (Resolution 4)5 Approval of Directors’ fees amounting to S$175,000 for the financial year ending 30 June
2017, to be paid quarterly in arrears (Resolution 5)6 Re-appointment of Messrs Ernst & Young LLP as Auditors (Resolution 6)7 Any other business
SPECIAL BUSINESS8 Authority for Directors to allot and issue new shares pursuant to Section 161 of the
Companies Act, Chapter 50 (Resolution 7)9 Renewal of Share Purchase Mandate (Resolution 8)
10. Authority for Directors to grant awards and allot and issue shares under the PEC Performance Share Plan (Resolution 9)
* If you wish to exercise all your votes "For" or "Against", please indicate with a tick (ü) within the box provided. Alternatively, please indicate the
number of votes as appropriate.
Dated this _____________ day of _______________ 2016Total Number of Shares held in:CDP RegisterRegister of Members
_________________________________________Signature(s) of member(s) or Common Seal of Corporate Shareholder
IMPORTANT: PLEASE READ NOTES OVERLEAF.
IMPORTANT:1. An investor who holds shares under the Central Provident
Fund Investment Scheme ("CPF Investor") may attend and cast his vote(s) at the Meeting in person. A CPF Investor who is unable to attend the Meeting but would like to vote, may in-form his CPF Approved Nominees to appoint the Chairman of the Meeting to act as his proxy, in which case, the CPF Investor shall be precluded from attending the Meeting.
2. This Proxy Form is not valid for use by CPF investors and shall be ineffective for all intents and purposes if used or purported to be used by them.
Notes:
1. Please insert the total number of shares held by you. If you have shares entered against your name in the Depository Register (as defined in Section 81SF of the Securities and Futures Act, Chapter 289 of Singapore), you should insert that number of shares. If you have shares registered in your name in the Register of Members of the Company, you should insert that number of shares. If you have shares entered against your name in the Depository Register and shares registered in your name in the Register of Members, you should insert the aggregate number of shares. If no number is inserted, this form of proxy will be deemed to relate to all the shares held by you.
2. A member of the Company (other than a Relevant Intermediary*), entitled to attend and vote at a meeting of the Company is entitled to appoint up to two proxies to attend and vote in his stead. A proxy need not be a member of the Company.
3. The instrument appointing a proxy or proxies must be deposited at the Company's Registered Office at 21 Shipyard Road, Singapore 628144 not less than 48 hours before the time set for the Meeting.
4. Where a member (other than a Relevant Intermediary*) appoints two proxies, the appointments shall be invalid unless he specifies the proportion of his shareholding (expressed as a percentage of the whole) to be represented by each proxy.
5. A Relevant Intermediary* may appoint more than two proxies, but each proxy must be appointed to exercise the rights attached to a different share or shares held by him (which number or class of shares shall be specified).
6. Subject to note 9, completion and return of this instrument appointing a proxy shall not preclude a member from attending and voting at the Meeting. Any appointment of a proxy or proxies shall be deemed to be revoked if a member attends the Meeting in person, and in such event, the Company reserves the right to refuse to admit any person or persons appointed under the instrument of proxy to the Meeting.
7. The instrument appointing a proxy or proxies must be under the hand of the appointor or of his attorney duly authorised in writing. Where the instrument appointing a proxy or proxies is executed by a corporation, it must be executed under its common seal or under the hand of its officer or attorney duly authorised. Where an instrument appointing a proxy or proxies is signed on behalf of the appointor by an attorney, the power of attorney (or other authority) or a duly certified copy thereof must (failing previous registration with the Company) be lodged with the instrument of proxy, failing which the instrument may be treated as invalid.
8. A corporation which is a member may authorise by resolution of its directors or other governing body such person as it thinks fit to act as its representative at the Meeting, in accordance with Section 179 of the Companies Act, Cap. 50 and the person so authorised shall upon production of a copy of such resolution certified by a director of the corporation to be a true copy, be entitled to exercise the powers on behalf of the corporation so represented as the corporation could exercise in person if it were an individual.
9. An investor who hold shares under the Central Provident Fund Investment Scheme ("CPF Investor") may attend and cast his vote(s) at the Meeting in person. A CPF Investor who is unable to attend the Meeting but would like to vote, may inform his CPF Approved Nominees to appoint the Chairman of the Meeting to act as his proxy, in which case, the CPF Investor shall be precluded from attending the Meeting.
* A Relevant Intermediary is:
(a) a banking corporation licensed under the Banking Act (Cap. 19) or a wholly-owned subsidiary of such a banking corporation, whose business includes the provision of nominee services and who holds shares in that capacity; or
(b) a person holding a capital markets services licence to provide custodial services for securities under the Securities and Futures Act (Cap. 289) and who holds shares in that capacity; or
(c) the Central Provident Fund Board established by the Central Provident Fund Act (Cap. 36), in respect of shares purchased under the subsidiary legislation made under that Act providing for the making of investments from the contributions and interest standing to the credit of members of the Central Provident Fund, if the Board holds those shares in the capacity of an intermediary pursuant to or in accordance with that subsidiary legislation.
General:
The Company shall be entitled to reject the instrument appointing a proxy or proxies if it is incomplete, improperly completed or illegible or where the true intentions of the appointor are not ascertainable from the instructions of the appointor specified in the instrument appointing a proxy or proxies. In addition, in the case of shares entered in the Depository Register, the Company may reject any instrument appointing a proxy or proxies lodged if the member, being the appointor, is not shown to have shares entered against his name in the Depository Register as at 72 hours before the time appointed for holding the Annual General Meeting, as certified by The Central Depository (Pte) Limited to the Company.
Personal Data Privacy:
By submitting an instrument appointing a proxy(ies) and/or representative(s), the member accepts and agrees to the personal data privacy terms set out in the Notice of Annual General Meeting dated 11 October 2016.
PEC LTD.21 Shipyard RoadSingapore 628144
AFFIXPOSTAGE
STAMP
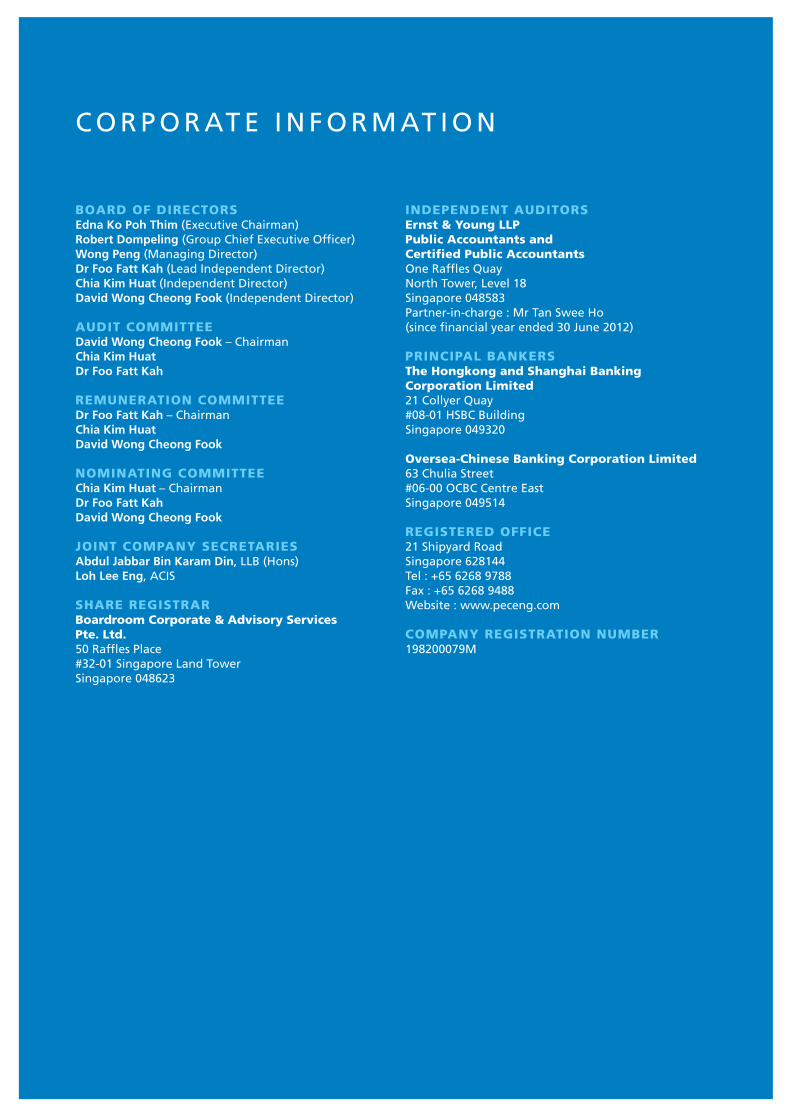
PEC ANNUAL REPORT 2016
6
BOARD OF DIRECTORSEdna Ko Poh Thim (Executive Chairman)Robert Dompeling (Group Chief Executive Officer)Wong Peng (Managing Director)Dr Foo Fatt Kah (Lead Independent Director)Chia Kim Huat (Independent Director)David Wong Cheong Fook (Independent Director)
AUDIT COMMITTEEDavid Wong Cheong Fook – ChairmanChia Kim HuatDr Foo Fatt Kah
REMUNERATION COMMITTEEDr Foo Fatt Kah – ChairmanChia Kim HuatDavid Wong Cheong Fook
NOMINATING COMMITTEEChia Kim Huat – ChairmanDr Foo Fatt KahDavid Wong Cheong Fook
JOINT COMPANY SECRETARIESAbdul Jabbar Bin Karam Din, LLB (Hons)Loh Lee Eng, ACIS
SHARE REGISTRARBoardroom Corporate & Advisory Services Pte. Ltd.50 Raffles Place#32-01 Singapore Land TowerSingapore 048623
INDEPENDENT AUDITORSErnst & Young LLPPublic Accountants andCertified Public AccountantsOne Raffles QuayNorth Tower, Level 18Singapore 048583Partner-in-charge : Mr Tan Swee Ho(since financial year ended 30 June 2012)
PRINCIPAL BANKERSThe Hongkong and Shanghai BankingCorporation Limited21 Collyer Quay#08-01 HSBC BuildingSingapore 049320
Oversea-Chinese Banking Corporation Limited63 Chulia Street#06-00 OCBC Centre EastSingapore 049514
REGISTERED OFFICE21 Shipyard RoadSingapore 628144Tel : +65 6268 9788Fax : +65 6268 9488Website : www.peceng.com
COMPANY REGISTRATION NUMBER198200079M
C O R P O R AT E I N F O R M AT I O N

(Co. Registration No.:198200079M)
21 Shipyard Road,Singapore 628144T +65 6268 9788F +65 6268 9488
Investor enquiries:[email protected]
Website:www.peceng.com