Embed Size (px)
Citation preview
Research
Contributors
Andrew Innes, CFA
Head of EMEA
Global Research & Design
Jingwen Shi, PhD, FRM
Senior Analyst
Global Research & Design
Rupert Watts, CFA, CAIA
Senior Director
Strategy Indices
Harnessing Multi-Factor Strategies Close to the Core EXECUTIVE SUMMARY
Factors that outperform over time are also prone to extended periods of
underperformance, which are difficult to time. For investors seeking
exposure to factor risk premia but with greater diversification and reduced
cyclicality, multi-factor strategies may be more suitable than single factors.
Accordingly, S&P DJI presents a new series of multi-factor indices,
collectively known as the S&P QVM Top 90% Indices, covering the U.S.
large-cap, mid-cap, and small-cap universes (S&P 500®, S&P MidCap
400®, and S&P SmallCap 600®, respectively). In this paper, we analyze the
indices’ methodology and performance characteristics. Multi-factor scores
are based on the average of three separate factors: quality, value, and
momentum (QVM). This new index series encompasses a high proportion
of the universe, whereas existing multi-factor indices are typically more
concentrated.
Different multi-factor strategies produce different outcomes and positioning.
Construction matters. These new indices select constituents in the top 90%
of the universe, ranked by their multi-factor score and weighted by float-
adjusted market capitalization (subject to constraints).
The indices generated moderate outperformance by removing the lowest-
ranked decile of stocks. This plus float-adjusted market cap weighting
allows the indices to retain many of the core features of the benchmark. In
summary, the key historical performance characteristics of the S&P QVM
Top 90% Indices include:
• Moderate outperformance versus the benchmark;
• Low tracking error;
• Low turnover;
• Low active share; and
• Sector weights consistent with the benchmark.
INTRODUCTION
With the rising adoption of factor indices, the traditional boundaries
between passive and active investing have become increasingly blurred.
For decades, institutional investors constructed portfolios from a
combination of market-cap-weighted index funds and active funds. Now,
Harnessing Multi-Factors Close to the Core October 2021
RESEARCH | Factors 2
For use with institutions only, not for use with retail investors
factor-based investing straddles these two approaches and enables
institutional and retail investors alike to implement active strategies through
passive vehicles.
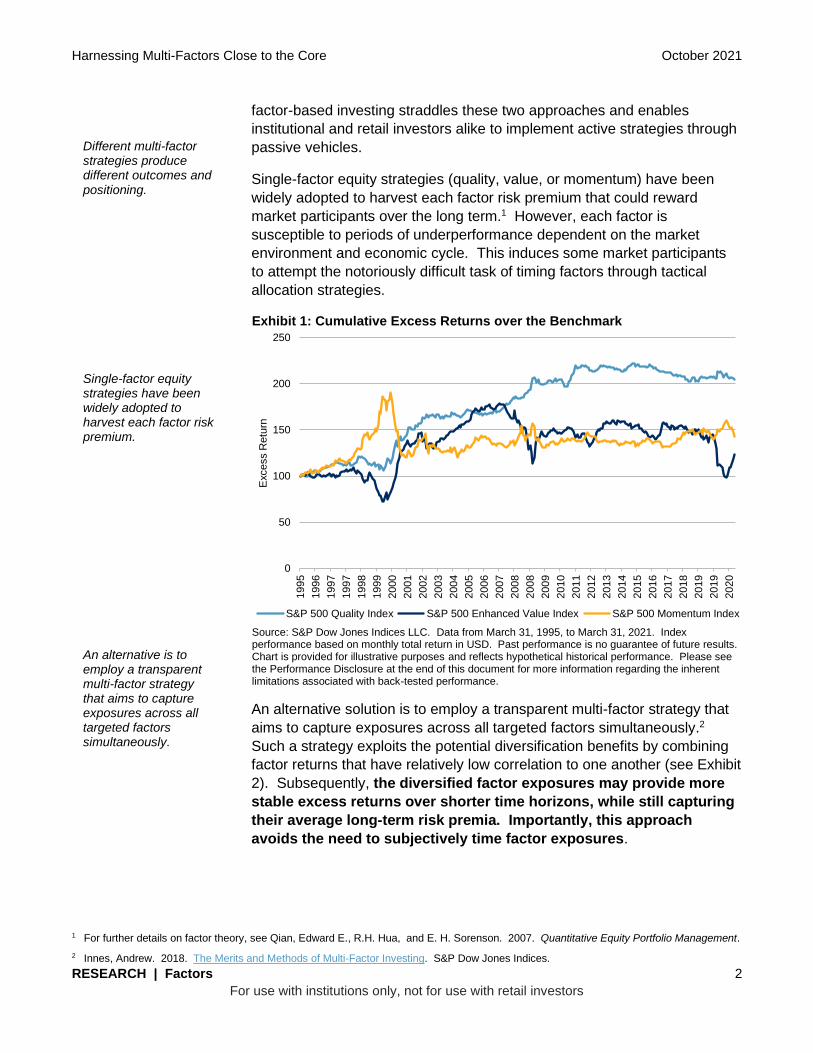
Single-factor equity strategies (quality, value, or momentum) have been
widely adopted to harvest each factor risk premium that could reward
market participants over the long term.1 However, each factor is
susceptible to periods of underperformance dependent on the market
environment and economic cycle. This induces some market participants
to attempt the notoriously difficult task of timing factors through tactical
allocation strategies.
Exhibit 1: Cumulative Excess Returns over the Benchmark
Source: S&P Dow Jones Indices LLC. Data from March 31, 1995, to March 31, 2021. Index performance based on monthly total return in USD. Past performance is no guarantee of future results. Chart is provided for illustrative purposes and reflects hypothetical historical performance. Please see the Performance Disclosure at the end of this document for more information regarding the inherent limitations associated with back-tested performance.
An alternative solution is to employ a transparent multi-factor strategy that
aims to capture exposures across all targeted factors simultaneously.2
Such a strategy exploits the potential diversification benefits by combining
factor returns that have relatively low correlation to one another (see Exhibit
2). Subsequently, the diversified factor exposures may provide more
stable excess returns over shorter time horizons, while still capturing
their average long-term risk premia. Importantly, this approach
avoids the need to subjectively time factor exposures.
1 For further details on factor theory, see Qian, Edward E., R.H. Hua, and E. H. Sorenson. 2007. Quantitative Equity Portfolio Management.
2 Innes, Andrew. 2018. The Merits and Methods of Multi-Factor Investing. S&P Dow Jones Indices.
0
50
100
150
200
250
1995
1996
1997
1997
1998
1999
2000
2001
2002
2003
2004
2005
2006
2007
2008
2008
2009
2010
2011
2012
2013
2014
2015
2016
2017
2018
2019
2019
2020
Excess R
etu
rn
S&P 500 Quality Index S&P 500 Enhanced Value Index S&P 500 Momentum Index
Different multi-factor strategies produce different outcomes and positioning. Single-factor equity strategies have been widely adopted to harvest each factor risk premium. An alternative is to employ a transparent multi-factor strategy that aims to capture exposures across all targeted factors simultaneously.
Harnessing Multi-Factors Close to the Core October 2021
RESEARCH | Factors 3
For use with institutions only, not for use with retail investors
Exhibit 2: Correlation of Excess Returns of S&P Quality, S&P Enhanced Value, and S&P Momentum Indices to Their Respective Benchmarks
CORRELATION QUALITY VALUE MOMEMTUM
S&P 500
Quality 1.00 -0.06 -0.12
Value - 1.00 -0.49
Momentum - - 1.00
S&P MIDCAP 400
Quality 1.00 -0.04 0.01
Value 1.00 -0.63
Momentum - - 1.00
S&P SMALLCAP 600
Quality 1.00 -0.25 0.19
Value - 1.00 -0.53
Momentum - - 1.00
Source: S&P Dow Jones Indices LLC. Data from March 31, 1995, to March 31, 2021. Index performance based on monthly total return in USD. Past performance is no guarantee of future results. Table is provided for illustrative purposes and reflects hypothetical historical performance. Please see the Performance Disclosure at the end of this document for more information regarding the inherent limitations associated with back-tested performance.
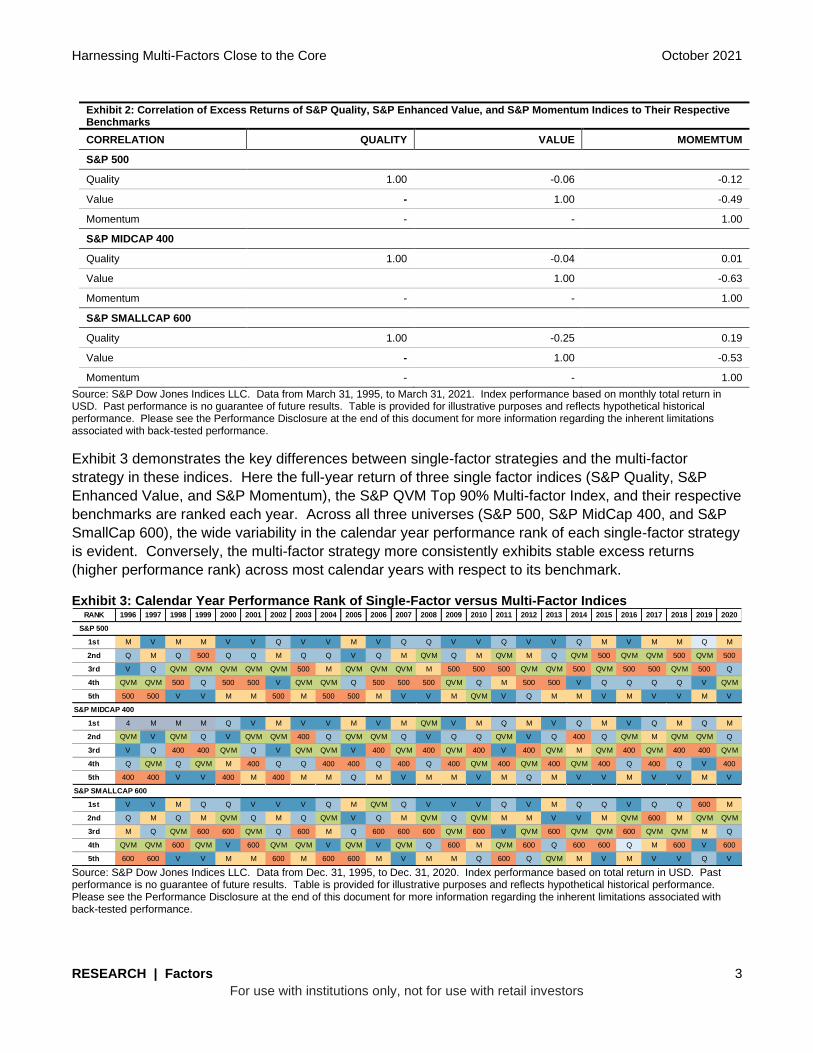
Exhibit 3 demonstrates the key differences between single-factor strategies and the multi-factor
strategy in these indices. Here the full-year return of three single factor indices (S&P Quality, S&P
Enhanced Value, and S&P Momentum), the S&P QVM Top 90% Multi-factor Index, and their respective
benchmarks are ranked each year. Across all three universes (S&P 500, S&P MidCap 400, and S&P
SmallCap 600), the wide variability in the calendar year performance rank of each single-factor strategy
is evident. Conversely, the multi-factor strategy more consistently exhibits stable excess returns
(higher performance rank) across most calendar years with respect to its benchmark.
Exhibit 3: Calendar Year Performance Rank of Single-Factor versus Multi-Factor Indices
Source: S&P Dow Jones Indices LLC. Data from Dec. 31, 1995, to Dec. 31, 2020. Index performance based on total return in USD. Past performance is no guarantee of future results. Table is provided for illustrative purposes and reflects hypothetical historical performance. Please see the Performance Disclosure at the end of this document for more information regarding the inherent limitations associated with back-tested performance.
RANK 1996 1997 1998 1999 2000 2001 2002 2003 2004 2005 2006 2007 2008 2009 2010 2011 2012 2013 2014 2015 2016 2017 2018 2019 2020
S&P 500
1st M V M M V V Q V V M V Q Q V V Q V V Q M V M M Q M
2nd Q M Q 500 Q Q M Q Q V Q M QVM Q M QVM M Q QVM 500 QVM QVM 500 QVM 500
3rd V Q QVM QVM QVM QVM QVM 500 M QVM QVM QVM M 500 500 500 QVM QVM 500 QVM 500 500 QVM 500 Q
4th QVM QVM 500 Q 500 500 V QVM QVM Q 500 500 500 QVM Q M 500 500 V Q Q Q Q V QVM
5th 500 500 V V M M 500 M 500 500 M V V M QVM V Q M M V M V V M V
1st 4 M M M Q V M V V M V M QVM V M Q M V Q M V Q M Q M
2nd QVM V QVM Q V QVM QVM 400 Q QVM QVM Q V Q Q QVM V Q 400 Q QVM M QVM QVM Q
3rd V Q 400 400 QVM Q V QVM QVM V 400 QVM 400 QVM 400 V 400 QVM M QVM 400 QVM 400 400 QVM
4th Q QVM Q QVM M 400 Q Q 400 400 Q 400 Q 400 QVM 400 QVM 400 QVM 400 Q 400 Q V 400
5th 400 400 V V 400 M 400 M M Q M V M M V M Q M V V M V V M V
1st V V M Q Q V V V Q M QVM Q V V V Q V M Q Q V Q Q 600 M
2nd Q M Q M QVM Q M Q QVM V Q M QVM Q QVM M M V V M QVM 600 M QVM QVM
3rd M Q QVM 600 600 QVM Q 600 M Q 600 600 600 QVM 600 V QVM 600 QVM QVM 600 QVM QVM M Q
4th QVM QVM 600 QVM V 600 QVM QVM V QVM V QVM Q 600 M QVM 600 Q 600 600 Q M 600 V 600
5th 600 600 V V M M 600 M 600 600 M V M M Q 600 Q QVM M V M V V Q V
S&P MIDCAP 400
S&P SMALLCAP 600
Harnessing Multi-Factors Close to the Core October 2021
RESEARCH | Factors 4
For use with institutions only, not for use with retail investors
Exploiting the Complementary Nature of Quality, Value, and
Momentum
Best practices dictate that factor combinations should always have an
economic rationale. Quality, value, and momentum tend to have
complementary reactions to different phases of the business cycle. The
quality factor is designed to capture the indicators of higher-quality
financials in companies.3 It is often classified as a defensive factor, as it
tends to outperform when the economy slows, implying that the earnings of
high-quality stocks may be less vulnerable to a slowdown.4 The value
factor strives to identify companies that are undervalued by the market
compared with their intrinsic value and peers.5 It is characterized as pro-
cyclical, which makes sense given that buying cheap, risky stocks is done
with more confidence in a low-risk economy with strong growth prospects.6
The momentum factor is based on the notion that stocks that have recently
performed well on a relative basis will continue performing well in the near
term.7 It tends to benefit from continued trends and often pairs particularly
well with value.8
This multi-factor combination is further justified if the aggregate strategy is
viewed in terms of a single synthetic stock with the attributes of all three
factors simultaneously. An inexpensive stock is generally desirable, if it
does not represent a value trap. Requiring that the stock has momentum
may help avoid such traps and suggests that the market has become
increasingly optimistic about the company’s prospects. Therefore, the
combination of value and momentum implies a stock with rising prospects
that can be picked up while still at a relatively low multiple.
Additionally, narrowing the search to ensure the same company is of the
highest quality can further reduce the value trap risk and indicate better
growth prospects. High return on equity, a low accrual ratio, and a strong
balance sheet with low leverage all indicate a company with an adequate
margin of safety that is capable of meeting competitive challenges.
3 Ung, Daniel, Priscilla Luk, and Xiaowei Kang. 2014. Quality: A Distinct Equity Factor? S&P Dow Jones Indices.
4 Novy-Marx, Robert. 2012. Quality Investing. University of Rochester Research Paper.
5 Fama, Eugene F. and Kenneth R. French. 1996. Multifactor Explanations of Asset Pricing Anomalies. Journal of Finance. 51, 55-84.
6 Zhang, Lu. 2002. The Value Premium. Simon School of Business Working Paper No. FR 02-19
7 Carhart, Mark M. 2012. On Persistence in Mutual Fund Performance. Journal of Finance 52: 57-82.
8 Asness, Clifford S., Tobias J. Moskowitz, and Lasse H. Pedersen. 2012. Value and Momentum Everywhere. Chicago Booth Research Paper No. 12-53.
Quality, value, and momentum tend to have complementary reactions to different phases of the business cycle. Quality is often classified as a defensive factor, while value is characterized as pro-cyclical, and momentum tends to benefit from continued trends.
Harnessing Multi-Factors Close to the Core October 2021
RESEARCH | Factors 5
For use with institutions only, not for use with retail investors
Retaining Characteristics of the Core Benchmark
The extent to which a multi-factor index deviates from its market-cap-
weighted benchmark can have a substantial impact on not only the returns
but also the investability of any index-linked product. On one hand, greater
deviations afford more opportunity to capture factor risk premia. On the
other, the turnover and liquidity of such strategies may be adversely
affected. Along with that comes the certainty of higher transaction costs in
pursuit of uncertain factor returns.
Clearly, there is a sweet spot at which the benchmark’s desirable
characteristics are preserved, while multi-factor exposures are also
modestly incorporated to achieve risk and return objectives. It is
precisely this balance that the S&P QVM Top 90% Indices seek to
strike. In doing so, the indices retain the necessary characteristics to be
considered suitable candidates for a portfolio’s core holding.
Finally, the market universe to which a multi-factor strategy is applied
matters. In general, the greater the opportunity set for selection, the higher
the potential for factor-based investing to be effective. Having the S&P
QVM Top 90% Indices available across the S&P 500, S&P MidCap 400,
and S&P SmallCap 600 provides an expansive universe that covers the
vast majority of U.S.-listed companies (with the added benefits of the
profitability criteria of these underlying indices). In addition, having distinct
indices for the large-, mid-, and small-cap spaces allows greater flexibility in
managing allocations across these size segments.
CONSTRUCTION APPROACH
The objective of the S&P Quality, Value & Momentum Top 90% Multi-factor
Indices9 is to pursue modest multi-factor exposure while limiting active risks
to retain the benefits of a core benchmark. To achieve this, a bottom-up
approach to stock selection evaluates stocks based on their combined
factor characteristics and removes the lowest decile. In contrast to a
conventional, highly active factor strategy, which typically selects only the
highest-scoring stocks, the emphasis of these indices is to avoid stocks
with the most extreme signals of financial distress or unsustainability.
9 For more information, please see the S&P Quality, Value & Momentum Top 90% Multi-factor Indices Methodology.
There is a sweet spot at which the benchmark’s desirable characteristics are preserved… …while multi-factor exposures are also modestly incorporated to achieve risk and return objectives. It is precisely this balance that the S&P QVM Top 90% Indices seek to strike.
Harnessing Multi-Factors Close to the Core October 2021
RESEARCH | Factors 6
For use with institutions only, not for use with retail investors
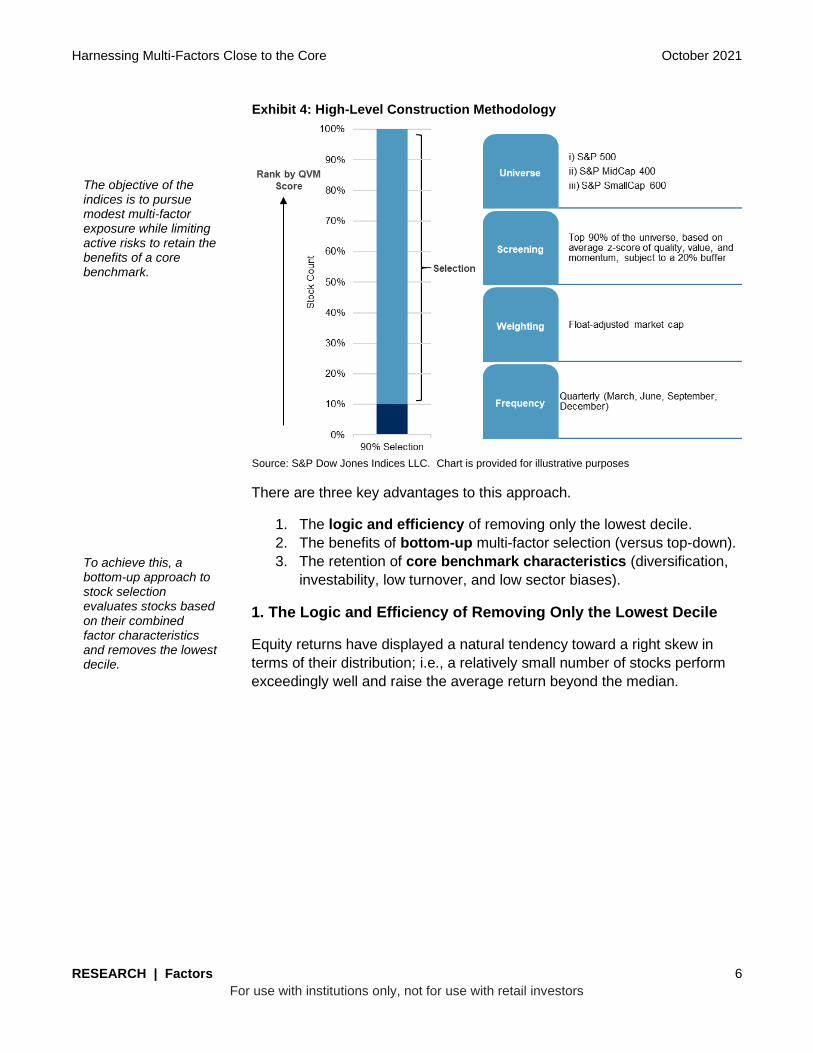
Exhibit 4: High-Level Construction Methodology
Source: S&P Dow Jones Indices LLC. Chart is provided for illustrative purposes
There are three key advantages to this approach.
1. The logic and efficiency of removing only the lowest decile.
2. The benefits of bottom-up multi-factor selection (versus top-down).
3. The retention of core benchmark characteristics (diversification,
investability, low turnover, and low sector biases).
1. The Logic and Efficiency of Removing Only the Lowest Decile
Equity returns have displayed a natural tendency toward a right skew in
terms of their distribution; i.e., a relatively small number of stocks perform
exceedingly well and raise the average return beyond the median.
The objective of the indices is to pursue modest multi-factor exposure while limiting active risks to retain the benefits of a core benchmark. To achieve this, a bottom-up approach to stock selection evaluates stocks based on their combined factor characteristics and removes the lowest decile.
Harnessing Multi-Factors Close to the Core October 2021
RESEARCH | Factors 7
For use with institutions only, not for use with retail investors
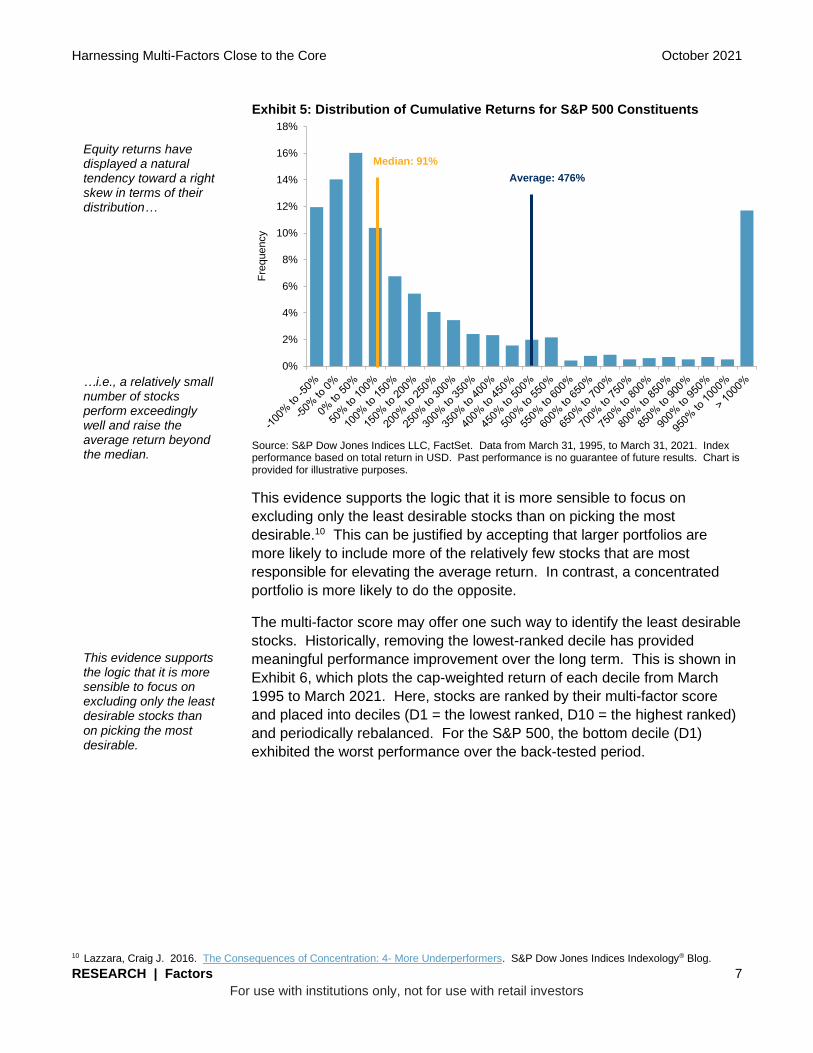
Exhibit 5: Distribution of Cumulative Returns for S&P 500 Constituents
Source: S&P Dow Jones Indices LLC, FactSet. Data from March 31, 1995, to March 31, 2021. Index performance based on total return in USD. Past performance is no guarantee of future results. Chart is provided for illustrative purposes.
This evidence supports the logic that it is more sensible to focus on
excluding only the least desirable stocks than on picking the most
desirable.10 This can be justified by accepting that larger portfolios are
more likely to include more of the relatively few stocks that are most
responsible for elevating the average return. In contrast, a concentrated
portfolio is more likely to do the opposite.
The multi-factor score may offer one such way to identify the least desirable
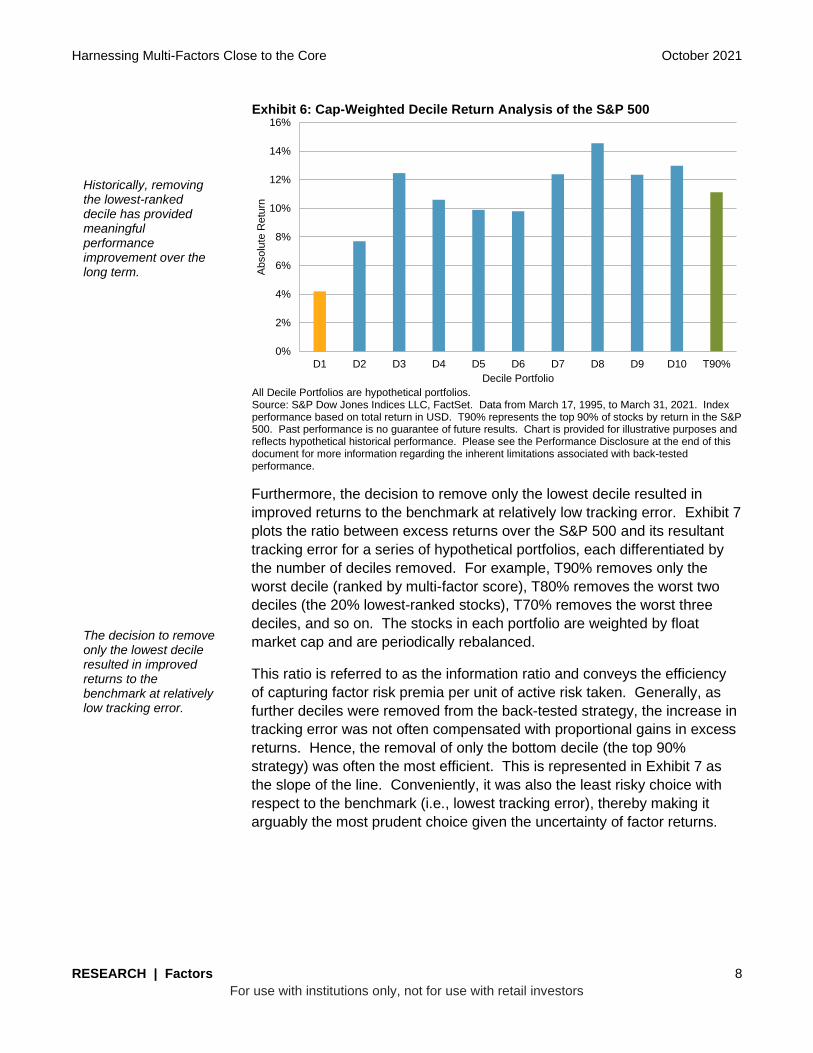
stocks. Historically, removing the lowest-ranked decile has provided
meaningful performance improvement over the long term. This is shown in
Exhibit 6, which plots the cap-weighted return of each decile from March
1995 to March 2021. Here, stocks are ranked by their multi-factor score
and placed into deciles (D1 = the lowest ranked, D10 = the highest ranked)
and periodically rebalanced. For the S&P 500, the bottom decile (D1)
exhibited the worst performance over the back-tested period.
10 Lazzara, Craig J. 2016. The Consequences of Concentration: 4- More Underperformers. S&P Dow Jones Indices Indexology® Blog.
0%
2%
4%
6%
8%
10%
12%
14%
16%
18%
Fre
quency
Equity returns have displayed a natural tendency toward a right skew in terms of their distribution… …i.e., a relatively small number of stocks perform exceedingly well and raise the average return beyond the median. This evidence supports the logic that it is more sensible to focus on excluding only the least desirable stocks than on picking the most desirable.
Median: 91%
Average: 476%
Harnessing Multi-Factors Close to the Core October 2021
RESEARCH | Factors 8
For use with institutions only, not for use with retail investors
Exhibit 6: Cap-Weighted Decile Return Analysis of the S&P 500
All Decile Portfolios are hypothetical portfolios. Source: S&P Dow Jones Indices LLC, FactSet. Data from March 17, 1995, to March 31, 2021. Index performance based on total return in USD. T90% represents the top 90% of stocks by return in the S&P 500. Past performance is no guarantee of future results. Chart is provided for illustrative purposes and reflects hypothetical historical performance. Please see the Performance Disclosure at the end of this document for more information regarding the inherent limitations associated with back-tested performance.
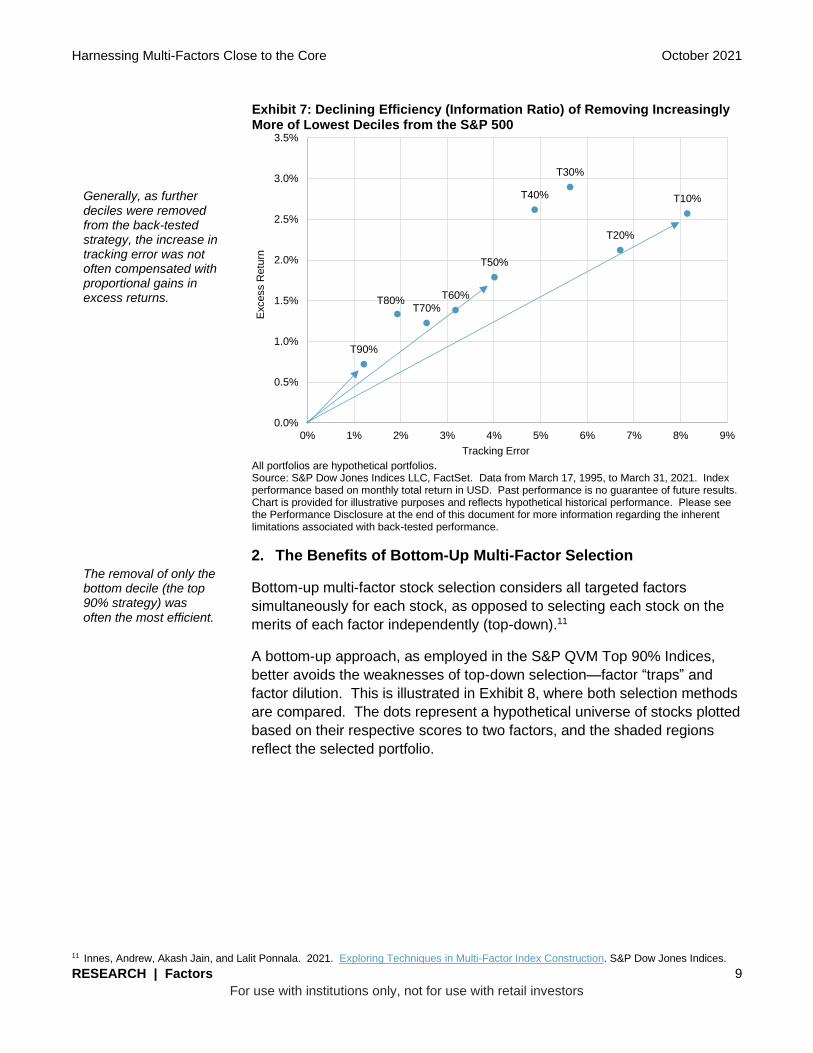
Furthermore, the decision to remove only the lowest decile resulted in
improved returns to the benchmark at relatively low tracking error. Exhibit 7
plots the ratio between excess returns over the S&P 500 and its resultant
tracking error for a series of hypothetical portfolios, each differentiated by
the number of deciles removed. For example, T90% removes only the
worst decile (ranked by multi-factor score), T80% removes the worst two
deciles (the 20% lowest-ranked stocks), T70% removes the worst three
deciles, and so on. The stocks in each portfolio are weighted by float
market cap and are periodically rebalanced.
This ratio is referred to as the information ratio and conveys the efficiency
of capturing factor risk premia per unit of active risk taken. Generally, as
further deciles were removed from the back-tested strategy, the increase in
tracking error was not often compensated with proportional gains in excess
returns. Hence, the removal of only the bottom decile (the top 90%
strategy) was often the most efficient. This is represented in Exhibit 7 as
the slope of the line. Conveniently, it was also the least risky choice with
respect to the benchmark (i.e., lowest tracking error), thereby making it
arguably the most prudent choice given the uncertainty of factor returns.
0%
2%
4%
6%
8%
10%
12%
14%
16%
D1 D2 D3 D4 D5 D6 D7 D8 D9 D10 T90%
Absolu
te R
etu
rn
Decile Portfolio
Historically, removing the lowest-ranked decile has provided meaningful performance improvement over the long term. The decision to remove only the lowest decile resulted in improved returns to the benchmark at relatively low tracking error.
Harnessing Multi-Factors Close to the Core October 2021
RESEARCH | Factors 9
For use with institutions only, not for use with retail investors
Exhibit 7: Declining Efficiency (Information Ratio) of Removing Increasingly More of Lowest Deciles from the S&P 500
All portfolios are hypothetical portfolios. Source: S&P Dow Jones Indices LLC, FactSet. Data from March 17, 1995, to March 31, 2021. Index performance based on monthly total return in USD. Past performance is no guarantee of future results. Chart is provided for illustrative purposes and reflects hypothetical historical performance. Please see the Performance Disclosure at the end of this document for more information regarding the inherent limitations associated with back-tested performance.
2. The Benefits of Bottom-Up Multi-Factor Selection
Bottom-up multi-factor stock selection considers all targeted factors
simultaneously for each stock, as opposed to selecting each stock on the
merits of each factor independently (top-down).11
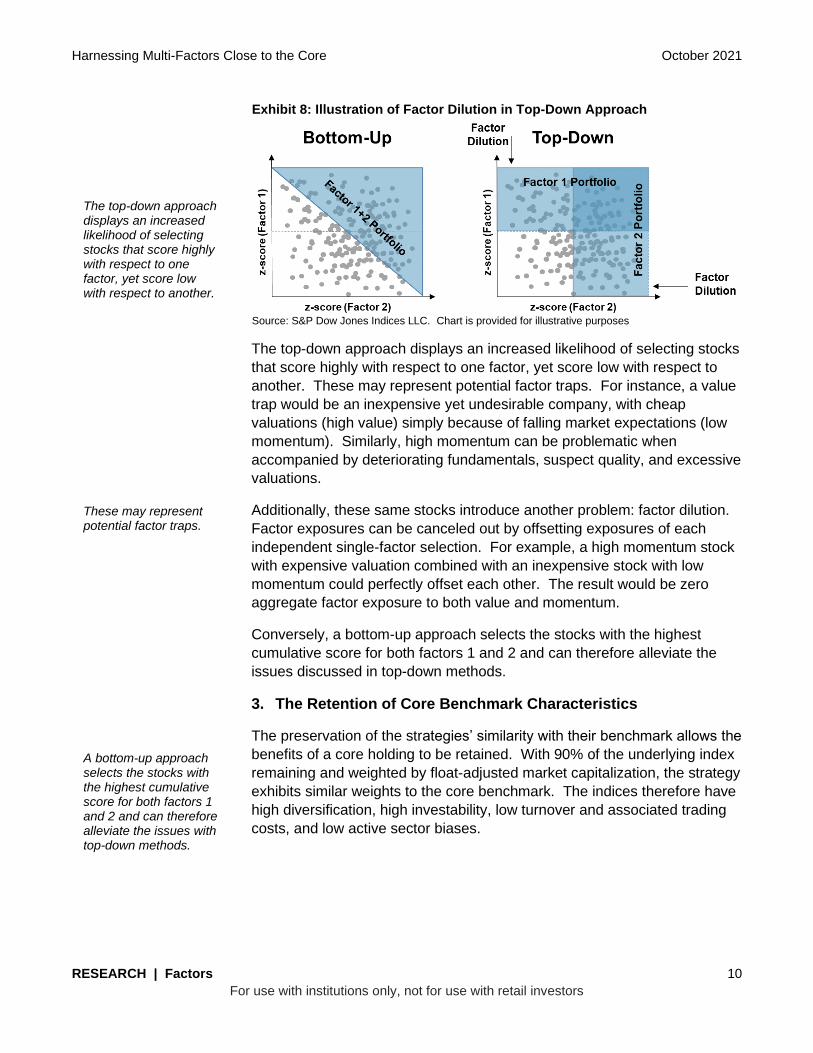
A bottom-up approach, as employed in the S&P QVM Top 90% Indices,
better avoids the weaknesses of top-down selection—factor “traps” and
factor dilution. This is illustrated in Exhibit 8, where both selection methods
are compared. The dots represent a hypothetical universe of stocks plotted
based on their respective scores to two factors, and the shaded regions
reflect the selected portfolio.
11 Innes, Andrew, Akash Jain, and Lalit Ponnala. 2021. Exploring Techniques in Multi-Factor Index Construction. S&P Dow Jones Indices.
T10%
T20%
T30%
T40%
T50%
T60%
T70%T80%
T90%
0.0%
0.5%
1.0%
1.5%
2.0%
2.5%
3.0%
3.5%
0% 1% 2% 3% 4% 5% 6% 7% 8% 9%
Excess R
etu
rn
Tracking Error
Generally, as further deciles were removed from the back-tested strategy, the increase in tracking error was not often compensated with proportional gains in excess returns. The removal of only the bottom decile (the top 90% strategy) was often the most efficient.
Harnessing Multi-Factors Close to the Core October 2021
RESEARCH | Factors 10
For use with institutions only, not for use with retail investors
Exhibit 8: Illustration of Factor Dilution in Top-Down Approach
Source: S&P Dow Jones Indices LLC. Chart is provided for illustrative purposes
The top-down approach displays an increased likelihood of selecting stocks
that score highly with respect to one factor, yet score low with respect to
another. These may represent potential factor traps. For instance, a value
trap would be an inexpensive yet undesirable company, with cheap
valuations (high value) simply because of falling market expectations (low
momentum). Similarly, high momentum can be problematic when
accompanied by deteriorating fundamentals, suspect quality, and excessive
valuations.
Additionally, these same stocks introduce another problem: factor dilution.
Factor exposures can be canceled out by offsetting exposures of each
independent single-factor selection. For example, a high momentum stock
with expensive valuation combined with an inexpensive stock with low
momentum could perfectly offset each other. The result would be zero
aggregate factor exposure to both value and momentum.
Conversely, a bottom-up approach selects the stocks with the highest
cumulative score for both factors 1 and 2 and can therefore alleviate the
issues discussed in top-down methods.
3. The Retention of Core Benchmark Characteristics
The preservation of the strategies’ similarity with their benchmark allows the
benefits of a core holding to be retained. With 90% of the underlying index
remaining and weighted by float-adjusted market capitalization, the strategy
exhibits similar weights to the core benchmark. The indices therefore have
high diversification, high investability, low turnover and associated trading
costs, and low active sector biases.
The top-down approach displays an increased likelihood of selecting stocks that score highly with respect to one factor, yet score low with respect to another. These may represent potential factor traps. A bottom-up approach selects the stocks with the highest cumulative score for both factors 1 and 2 and can therefore alleviate the issues with top-down methods.
Harnessing Multi-Factors Close to the Core October 2021
RESEARCH | Factors 11
For use with institutions only, not for use with retail investors
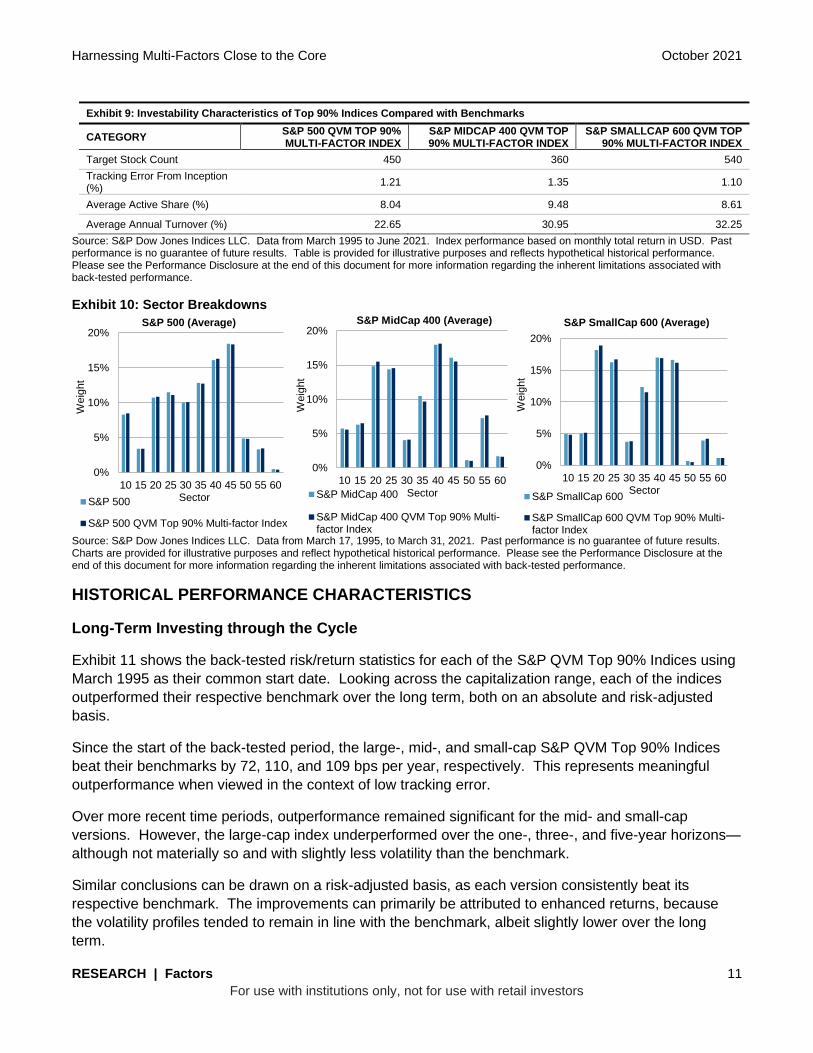
Exhibit 9: Investability Characteristics of Top 90% Indices Compared with Benchmarks
CATEGORY S&P 500 QVM TOP 90% MULTI-FACTOR INDEX
S&P MIDCAP 400 QVM TOP 90% MULTI-FACTOR INDEX
S&P SMALLCAP 600 QVM TOP 90% MULTI-FACTOR INDEX
Target Stock Count 450 360 540
Tracking Error From Inception (%)
1.21 1.35 1.10
Average Active Share (%) 8.04 9.48 8.61
Average Annual Turnover (%) 22.65 30.95 32.25
Source: S&P Dow Jones Indices LLC. Data from March 1995 to June 2021. Index performance based on monthly total return in USD. Past performance is no guarantee of future results. Table is provided for illustrative purposes and reflects hypothetical historical performance. Please see the Performance Disclosure at the end of this document for more information regarding the inherent limitations associated with back-tested performance.
Exhibit 10: Sector Breakdowns
Source: S&P Dow Jones Indices LLC. Data from March 17, 1995, to March 31, 2021. Past performance is no guarantee of future results. Charts are provided for illustrative purposes and reflect hypothetical historical performance. Please see the Performance Disclosure at the end of this document for more information regarding the inherent limitations associated with back-tested performance.
HISTORICAL PERFORMANCE CHARACTERISTICS
Long-Term Investing through the Cycle
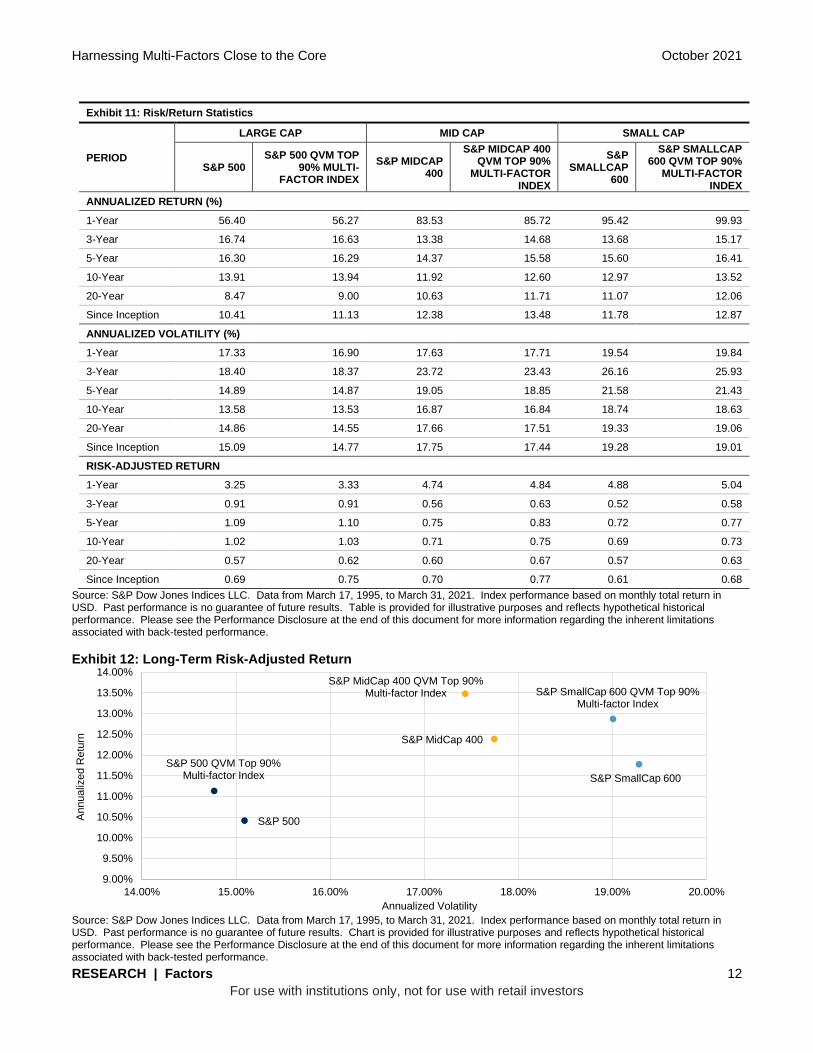
Exhibit 11 shows the back-tested risk/return statistics for each of the S&P QVM Top 90% Indices using
March 1995 as their common start date. Looking across the capitalization range, each of the indices
outperformed their respective benchmark over the long term, both on an absolute and risk-adjusted
basis.
Since the start of the back-tested period, the large-, mid-, and small-cap S&P QVM Top 90% Indices
beat their benchmarks by 72, 110, and 109 bps per year, respectively. This represents meaningful
outperformance when viewed in the context of low tracking error.
Over more recent time periods, outperformance remained significant for the mid- and small-cap
versions. However, the large-cap index underperformed over the one-, three-, and five-year horizons—
although not materially so and with slightly less volatility than the benchmark.
Similar conclusions can be drawn on a risk-adjusted basis, as each version consistently beat its
respective benchmark. The improvements can primarily be attributed to enhanced returns, because
the volatility profiles tended to remain in line with the benchmark, albeit slightly lower over the long
term.
0%
5%
10%
15%
20%
10 15 20 25 30 35 40 45 50 55 60
Weig
ht
Sector
S&P 500 (Average)
S&P 500
S&P 500 QVM Top 90% Multi-factor Index
0%
5%
10%
15%
20%
10 15 20 25 30 35 40 45 50 55 60
Weig
ht
Sector
S&P MidCap 400 (Average)
S&P MidCap 400
S&P MidCap 400 QVM Top 90% Multi-factor Index
0%
5%
10%
15%
20%
10 15 20 25 30 35 40 45 50 55 60
Weig
ht
Sector
S&P SmallCap 600 (Average)
S&P SmallCap 600
S&P SmallCap 600 QVM Top 90% Multi-factor Index
Harnessing Multi-Factors Close to the Core October 2021
RESEARCH | Factors 12
For use with institutions only, not for use with retail investors
Exhibit 11: Risk/Return Statistics
PERIOD
LARGE CAP MID CAP SMALL CAP
S&P 500 S&P 500 QVM TOP
90% MULTI-FACTOR INDEX
S&P MIDCAP 400
S&P MIDCAP 400 QVM TOP 90%
MULTI-FACTOR INDEX
S&P SMALLCAP
600
S&P SMALLCAP 600 QVM TOP 90%
MULTI-FACTOR INDEX
ANNUALIZED RETURN (%)
1-Year 56.40 56.27 83.53 85.72 95.42 99.93
3-Year 16.74 16.63 13.38 14.68 13.68 15.17
5-Year 16.30 16.29 14.37 15.58 15.60 16.41
10-Year 13.91 13.94 11.92 12.60 12.97 13.52
20-Year 8.47 9.00 10.63 11.71 11.07 12.06
Since Inception 10.41 11.13 12.38 13.48 11.78 12.87
ANNUALIZED VOLATILITY (%)
1-Year 17.33 16.90 17.63 17.71 19.54 19.84
3-Year 18.40 18.37 23.72 23.43 26.16 25.93
5-Year 14.89 14.87 19.05 18.85 21.58 21.43
10-Year 13.58 13.53 16.87 16.84 18.74 18.63
20-Year 14.86 14.55 17.66 17.51 19.33 19.06
Since Inception 15.09 14.77 17.75 17.44 19.28 19.01
RISK-ADJUSTED RETURN
1-Year 3.25 3.33 4.74 4.84 4.88 5.04
3-Year 0.91 0.91 0.56 0.63 0.52 0.58
5-Year 1.09 1.10 0.75 0.83 0.72 0.77
10-Year 1.02 1.03 0.71 0.75 0.69 0.73
20-Year 0.57 0.62 0.60 0.67 0.57 0.63
Since Inception 0.69 0.75 0.70 0.77 0.61 0.68
Source: S&P Dow Jones Indices LLC. Data from March 17, 1995, to March 31, 2021. Index performance based on monthly total return in USD. Past performance is no guarantee of future results. Table is provided for illustrative purposes and reflects hypothetical historical performance. Please see the Performance Disclosure at the end of this document for more information regarding the inherent limitations associated with back-tested performance.
Exhibit 12: Long-Term Risk-Adjusted Return
Source: S&P Dow Jones Indices LLC. Data from March 17, 1995, to March 31, 2021. Index performance based on monthly total return in USD. Past performance is no guarantee of future results. Chart is provided for illustrative purposes and reflects hypothetical historical performance. Please see the Performance Disclosure at the end of this document for more information regarding the inherent limitations associated with back-tested performance.
S&P 500
S&P 500 QVM Top 90% Multi-factor Index
S&P MidCap 400
S&P MidCap 400 QVM Top 90% Multi-factor Index
S&P SmallCap 600
S&P SmallCap 600 QVM Top 90% Multi-factor Index
9.00%
9.50%
10.00%
10.50%
11.00%
11.50%
12.00%
12.50%
13.00%
13.50%
14.00%
14.00% 15.00% 16.00% 17.00% 18.00% 19.00% 20.00%
Annualiz
ed R
etu
rn
Annualized Volatility
Harnessing Multi-Factors Close to the Core October 2021
RESEARCH | Factors 13
For use with institutions only, not for use with retail investors
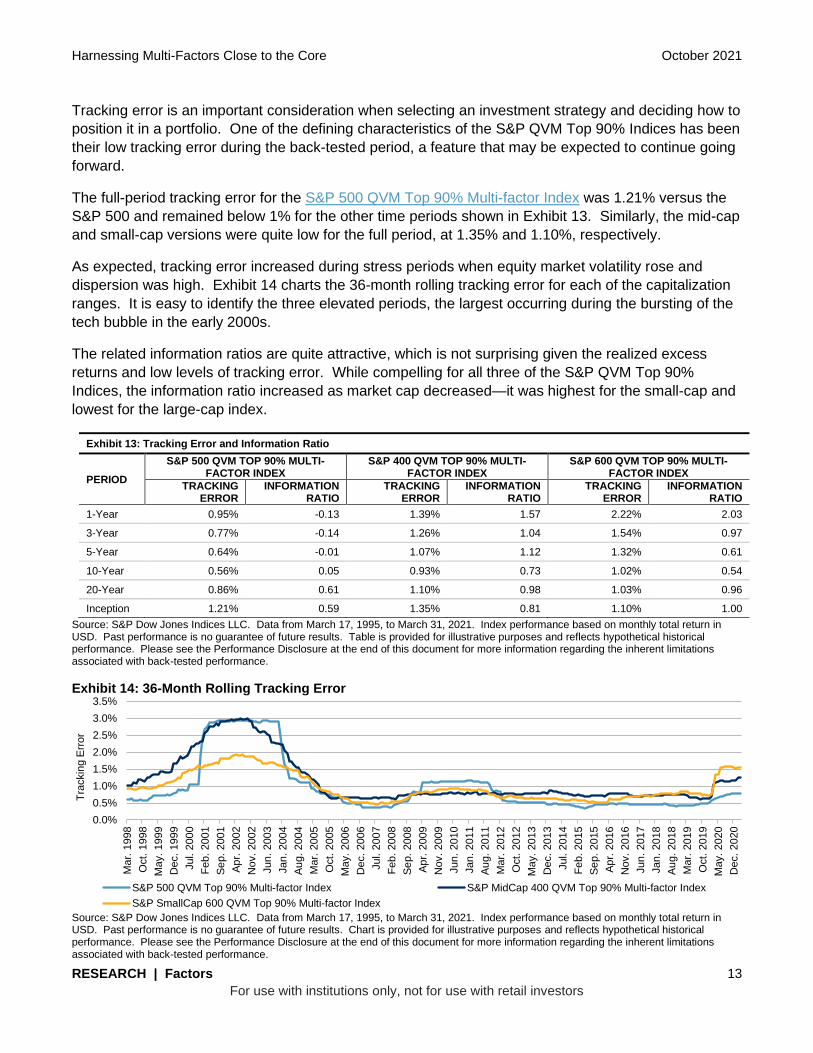
Tracking error is an important consideration when selecting an investment strategy and deciding how to
position it in a portfolio. One of the defining characteristics of the S&P QVM Top 90% Indices has been
their low tracking error during the back-tested period, a feature that may be expected to continue going
forward.
The full-period tracking error for the S&P 500 QVM Top 90% Multi-factor Index was 1.21% versus the
S&P 500 and remained below 1% for the other time periods shown in Exhibit 13. Similarly, the mid-cap
and small-cap versions were quite low for the full period, at 1.35% and 1.10%, respectively.
As expected, tracking error increased during stress periods when equity market volatility rose and
dispersion was high. Exhibit 14 charts the 36-month rolling tracking error for each of the capitalization
ranges. It is easy to identify the three elevated periods, the largest occurring during the bursting of the
tech bubble in the early 2000s.
The related information ratios are quite attractive, which is not surprising given the realized excess
returns and low levels of tracking error. While compelling for all three of the S&P QVM Top 90%
Indices, the information ratio increased as market cap decreased—it was highest for the small-cap and
lowest for the large-cap index.
Exhibit 13: Tracking Error and Information Ratio
PERIOD
S&P 500 QVM TOP 90% MULTI-FACTOR INDEX
S&P 400 QVM TOP 90% MULTI-FACTOR INDEX
S&P 600 QVM TOP 90% MULTI-FACTOR INDEX
TRACKING ERROR
INFORMATION RATIO
TRACKING ERROR
INFORMATION RATIO
TRACKING ERROR
INFORMATION RATIO
1-Year 0.95% -0.13 1.39% 1.57 2.22% 2.03
3-Year 0.77% -0.14 1.26% 1.04 1.54% 0.97
5-Year 0.64% -0.01 1.07% 1.12 1.32% 0.61
10-Year 0.56% 0.05 0.93% 0.73 1.02% 0.54
20-Year 0.86% 0.61 1.10% 0.98 1.03% 0.96
Inception 1.21% 0.59 1.35% 0.81 1.10% 1.00
Source: S&P Dow Jones Indices LLC. Data from March 17, 1995, to March 31, 2021. Index performance based on monthly total return in USD. Past performance is no guarantee of future results. Table is provided for illustrative purposes and reflects hypothetical historical performance. Please see the Performance Disclosure at the end of this document for more information regarding the inherent limitations associated with back-tested performance.
Exhibit 14: 36-Month Rolling Tracking Error
Source: S&P Dow Jones Indices LLC. Data from March 17, 1995, to March 31, 2021. Index performance based on monthly total return in USD. Past performance is no guarantee of future results. Chart is provided for illustrative purposes and reflects hypothetical historical performance. Please see the Performance Disclosure at the end of this document for more information regarding the inherent limitations associated with back-tested performance.
0.0%
0.5%
1.0%
1.5%
2.0%
2.5%
3.0%
3.5%
Ma
r. 1
998
Oct. 1
998
Ma
y. 1999
Dec. 1999
Jul. 2
00
0
Fe
b. 2001
Se
p. 2001
Ap
r. 2
002
Nov. 2002
Jun
. 2003
Jan
. 2004
Au
g. 2004
Ma
r. 2
005
Oct. 2
005
Ma
y. 2006
Dec. 2006
Jul. 2
00
7
Feb. 2008
Se
p. 2008
Ap
r. 2
009
Nov. 2009
Jun
. 2010
Jan
. 2011
Au
g. 2011
Ma
r. 2
012
Oct. 2
012
Ma
y. 2013
Dec. 2013
Jul. 2
01
4
Fe
b. 2015
Se
p. 2015
Ap
r. 2
016
Nov. 2016
Jun
. 2017
Jan
. 2018
Au
g. 2018
Ma
r. 2
019
Oct. 2
019
Ma
y. 2020
Dec. 2020
Tra
ckin
g E
rror
S&P 500 QVM Top 90% Multi-factor Index S&P MidCap 400 QVM Top 90% Multi-factor Index
S&P SmallCap 600 QVM Top 90% Multi-factor Index
Harnessing Multi-Factors Close to the Core October 2021
RESEARCH | Factors 14
For use with institutions only, not for use with retail investors
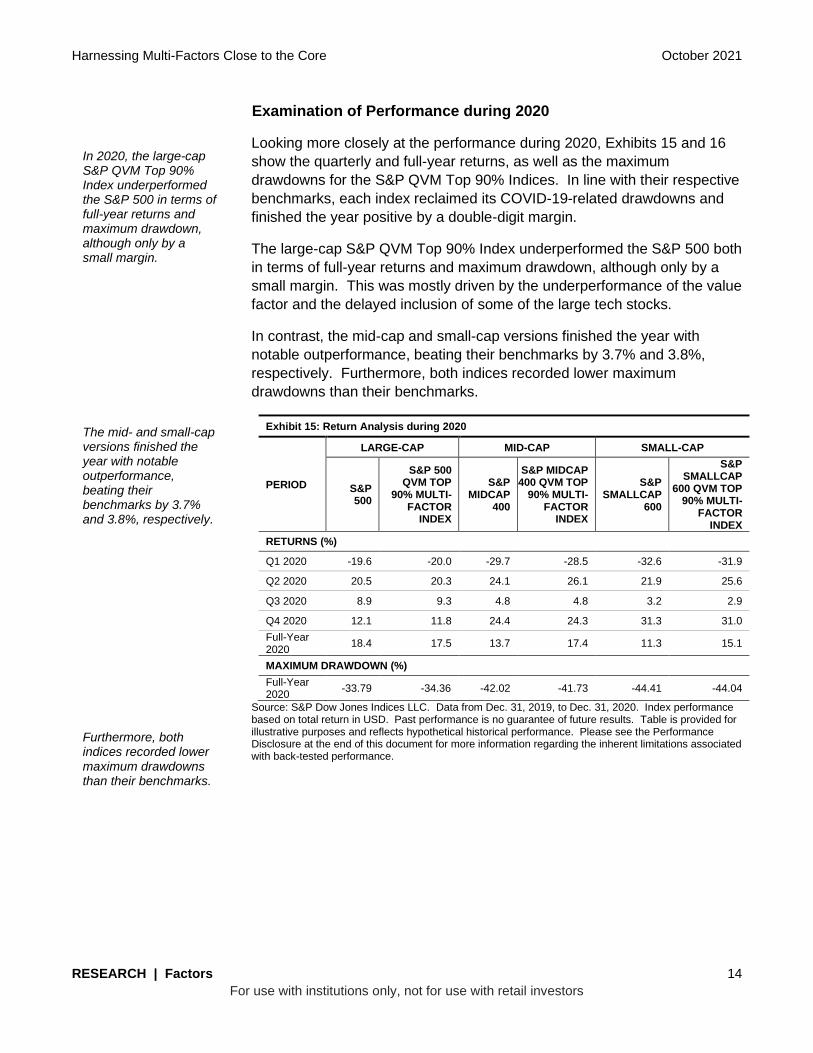
Examination of Performance during 2020
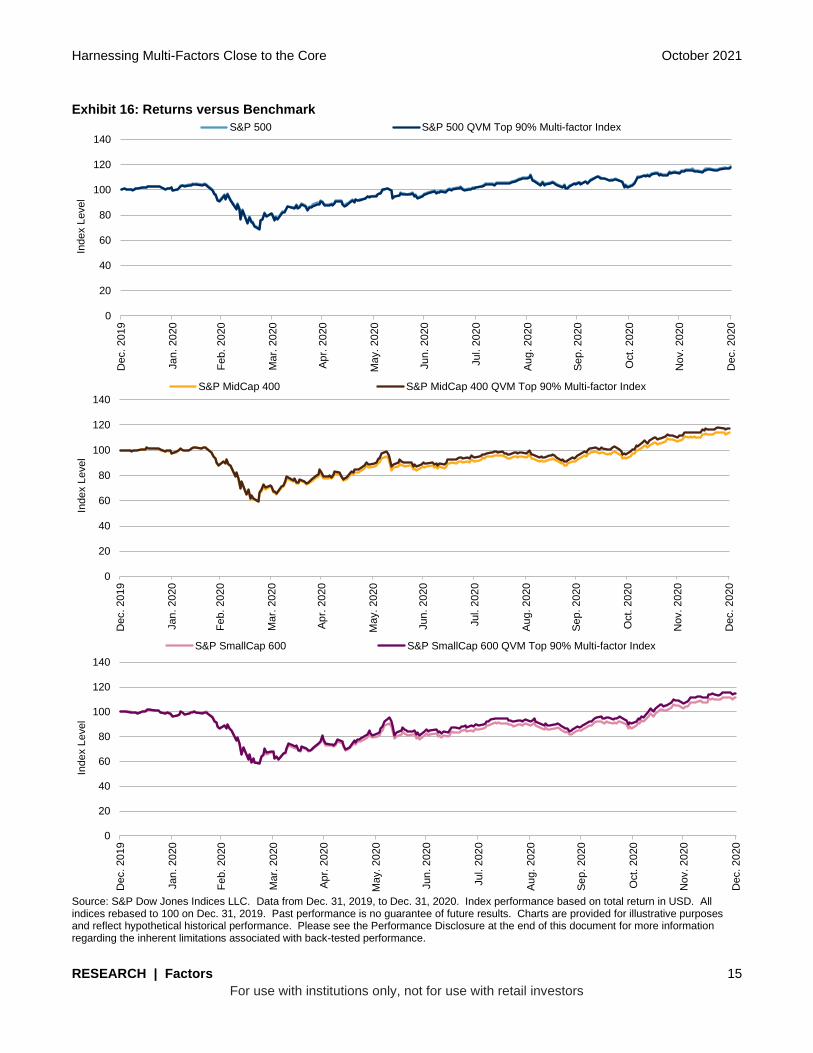
Looking more closely at the performance during 2020, Exhibits 15 and 16
show the quarterly and full-year returns, as well as the maximum
drawdowns for the S&P QVM Top 90% Indices. In line with their respective
benchmarks, each index reclaimed its COVID-19-related drawdowns and
finished the year positive by a double-digit margin.
The large-cap S&P QVM Top 90% Index underperformed the S&P 500 both
in terms of full-year returns and maximum drawdown, although only by a
small margin. This was mostly driven by the underperformance of the value
factor and the delayed inclusion of some of the large tech stocks.
In contrast, the mid-cap and small-cap versions finished the year with
notable outperformance, beating their benchmarks by 3.7% and 3.8%,
respectively. Furthermore, both indices recorded lower maximum
drawdowns than their benchmarks.
Exhibit 15: Return Analysis during 2020
PERIOD
LARGE-CAP MID-CAP SMALL-CAP
S&P 500
S&P 500 QVM TOP
90% MULTI-FACTOR
INDEX
S&P MIDCAP
400
S&P MIDCAP 400 QVM TOP
90% MULTI-FACTOR
INDEX
S&P SMALLCAP
600
S&P SMALLCAP
600 QVM TOP 90% MULTI-
FACTOR INDEX
RETURNS (%)
Q1 2020 -19.6 -20.0 -29.7 -28.5 -32.6 -31.9
Q2 2020 20.5 20.3 24.1 26.1 21.9 25.6
Q3 2020 8.9 9.3 4.8 4.8 3.2 2.9
Q4 2020 12.1 11.8 24.4 24.3 31.3 31.0
Full-Year 2020
18.4 17.5 13.7 17.4 11.3 15.1
MAXIMUM DRAWDOWN (%)
Full-Year 2020
-33.79 -34.36 -42.02 -41.73 -44.41 -44.04
Source: S&P Dow Jones Indices LLC. Data from Dec. 31, 2019, to Dec. 31, 2020. Index performance based on total return in USD. Past performance is no guarantee of future results. Table is provided for illustrative purposes and reflects hypothetical historical performance. Please see the Performance Disclosure at the end of this document for more information regarding the inherent limitations associated with back-tested performance.
In 2020, the large-cap S&P QVM Top 90% Index underperformed the S&P 500 in terms of full-year returns and maximum drawdown, although only by a small margin. The mid- and small-cap versions finished the year with notable outperformance, beating their benchmarks by 3.7% and 3.8%, respectively. Furthermore, both indices recorded lower maximum drawdowns than their benchmarks.
Harnessing Multi-Factors Close to the Core October 2021
RESEARCH | Factors 15
For use with institutions only, not for use with retail investors
Exhibit 16: Returns versus Benchmark
Source: S&P Dow Jones Indices LLC. Data from Dec. 31, 2019, to Dec. 31, 2020. Index performance based on total return in USD. All indices rebased to 100 on Dec. 31, 2019. Past performance is no guarantee of future results. Charts are provided for illustrative purposes and reflect hypothetical historical performance. Please see the Performance Disclosure at the end of this document for more information regarding the inherent limitations associated with back-tested performance.
0
20
40
60
80
100
120
140
Dec. 2019
Jan
. 2020
Fe
b. 2020
Ma
r. 2
020
Ap
r. 2
020
Ma
y. 2020
Jun
. 2020
Jul. 2
02
0
Au
g. 2020
Se
p. 2020
Oct. 2
020
Nov. 2020
Dec. 2020
Index L
evel
S&P 500 S&P 500 QVM Top 90% Multi-factor Index
0
20
40
60
80
100
120
140
Dec. 2019
Jan
. 2020
Fe
b. 2020
Ma
r. 2
020
Ap
r. 2
020
Ma
y. 2020
Jun
. 2020
Jul. 2
02
0
Au
g. 2020
Se
p. 2020
Oct. 2
020
Nov. 2020
Dec. 2020
Index L
evel
S&P MidCap 400 S&P MidCap 400 QVM Top 90% Multi-factor Index
0
20
40
60
80
100
120
140
Dec. 2019
Jan
. 2020
Fe
b. 2020
Mar.
2020
Ap
r. 2
020
Ma
y. 2020
Jun
. 2020
Jul. 2
02
0
Au
g. 2020
Se
p. 2020
Oct. 2
020
Nov. 2020
Dec. 2020
Index L
evel
S&P SmallCap 600 S&P SmallCap 600 QVM Top 90% Multi-factor Index
Harnessing Multi-Factors Close to the Core October 2021
RESEARCH | Factors 16
For use with institutions only, not for use with retail investors
CONCLUSION
In review, the S&P QVM Top 90% Indices remove constituents ranked in
the lowest decile of their respective universe and are weighted by float-
adjusted market capitalization. The constituents are ranked using a multi-
factor score, which is based on the average of three separate factors:
quality, value, and momentum.
These three factors have been shown to be complementary in terms of how
each one reacts to different phases of the business cycle. This was
evidenced by their low-to-negative historical correlation and the historical
ability of the multi-factor indices to offer more stable excess return patterns
than single-factor indices.
The analysis on skewed equity returns showed that it was more logical to
remove only the least desirable companies to improve the chances of
retaining the highest-performing companies. The lowest-ranked decile by
multi-factor score was shown to be an effective method of identifying these
least desirable companies due to the decile’s poor historical performance
and economic rationale. This ultimately led the S&P QVM Top 90% Indices
to display high factor efficiency by delivering moderate outperformance
versus the benchmark at relatively low levels of tracking error, as evidenced
by the realized information ratios.
Furthermore, using a bottom-up construction approach has been deemed
superior, since it selects constituents in the context of the overall portfolio
and reduces the probability of choosing those that rank extremely low on
one or more metrics.
Over the period analyzed, the indices’ tracking error, turnover, and active
share remained relatively low, and sector weights were largely in line with
the benchmark. This suggests that the S&P QVM Top 90% Indices may be
suitable for those seeking a multi-factor index that can be positioned as a
core holding.
Quality, value, and momentum have been shown to be complementary in terms of how each one reacts to different phases of the business cycle. The S&P QVM Top 90% Indices displayed high factor efficiency by delivering moderate outperformance versus the benchmark at relatively low levels of tracking error. The indices’ tracking error, turnover, and active share remained relatively low, and sector weights were largely in line with the benchmark.
Harnessing Multi-Factors Close to the Core October 2021
RESEARCH | Factors 17
For use with institutions only, not for use with retail investors
PERFORMANCE DISCLOSURE/BACK-TESTED DATA
The S&P MidCap 400 Quality Index, S&P MidCap 400 Enhanced Value Index, and S&P MidCap 400 Momentum Index were launched November 13, 2017. The S&P SmallCap 600 Quality Index was launched March 6, 2017. The S&P 500 Quality Index was launched July 8, 2014. The S&P 500 Momentum Index was launched November 18, 2014. The S&P 500 Enhanced Value Index was launched April 27, 2015. The S&P SmallCap 600 Enhanced Value was launched January 4, 2018. The S&P SmallCap 600 Momentum Index was launched January 4, 2018. The S&P 500 Quality, Value & Momentum Top 90% Multi-factor Index, S&P MidCap 400 Quality, Value & Momentum Top 90% Multi-factor Index, and S&P SmallCap 600 Quality, Value & Momentum Top 90% Multi-factor Index were launched April 5, 2021. All information presented prior to an index’s Launch Date is hypothetical (back-tested), not actual performance. The back-test calculations are based on the same methodology that was in effect on the index Launch Date. However, when creating back-tested history for periods of market anomalies or other periods that do not reflect the general current market environment, index methodology rules may be relaxed to capture a large enough universe of securities to simulate the target market the index is designed to measure or strategy the index is designed to capture. For example, market capitalization and liquidity thresholds may be reduced. Complete index methodology details are available at www.spglobal.com/spdji. Past performance of the Index is not an indication of future results. Back-tested performance reflects application of an index methodology and selection of index constituents with the benefit of hindsight and knowledge of factors that may have positively affected its performance, cannot account for all financial risk that may affect results and may be considered to reflect survivor/look ahead bias. Actual returns may differ significantly from, and be lower than, back-tested returns. Past performance is not an indication or guarantee of future results. Please refer to the methodology for the Index for more details about the index, including the manner in which it is rebalanced, the timing of such rebalancing, criteria for additions and deletions, as well as all index calculations. Back-tested performance is for use with institutions only; not for use with retail investors.
S&P Dow Jones Indices defines various dates to assist our clients in providing transparency. The First Value Date is the first day for which there is a calculated value (either live or back-tested) for a given index. The Base Date is the date at which the index is set to a fixed value for calculation purposes. The Launch Date designates the date when the values of an index are first considered live: index values provided for any date or time period prior to the index’s Launch Date are considered back-tested. S&P Dow Jones Indices defines the Launch Date as the date by which the values of an index are known to have been released to the public, for example via the company’s public webs ite or its data feed to external parties. For Dow Jones-branded indices introduced prior to May 31, 2013, the Launch Date (which prior to May 31, 2013, was termed “Date of introduction”) is set at a date upon which no further changes were permitted to be made to the index methodology, but that may have been prior to the Index’s public release date.
Typically, when S&P DJI creates back-tested index data, S&P DJI uses actual historical constituent-level data (e.g., historical price, market capitalization, and corporate action data) in its calculations. As ESG investing is still in early stages of development, certain datapoints used to calculate S&P DJI’s ESG indices may not be available for the entire desired period of back-tested history. The same data availability issue could be true for other indices as well. In cases when actual data is not available for all relevant historical periods, S&P DJI may employ a process of using “Backward Data Assumption” (or pulling back) of ESG data for the calculation of back-tested historical performance. “Backward Data Assumption” is a process that applies the earliest actual live data point available for an index constituent company to all prior historical instances in the index performance. For example, Backward Data Assumption inherently assumes that companies currently not involved in a specific business activity (also known as “product involvement”) were never involved historically and similarly also assumes that companies currently involved in a specific business activity were involved historically too. The Backward Data Assumption allows the hypothetical back-test to be extended over more historical years than would be feasible using only actual data. For more information on “Backward Data Assumption” please refer to the FAQ. The methodology and factsheets of any index that employs backward assumption in the back-tested history will explicitly state so. The methodology will include an Appendix with a table setting forth the specific data points and relevant time period for which backward projected data was used.
Index returns shown do not represent the results of actual trading of investable assets/securities. S&P Dow Jones Indices maintains the index and calculates the index levels and performance shown or discussed but does not manage actual assets. Index returns do not reflect payment of any sales charges or fees an investor may pay to purchase the securities underlying the Index or investment funds that are intended to track the performance of the Index. The imposition of these fees and charges would cause actual and back-tested performance of the securities/fund to be lower than the Index performance shown. As a simple example, if an index returned 10% on a US $100,000 investment for a 12-month period (or US $10,000) and an actual asset-based fee of 1.5% was imposed at the end of the period on the investment plus accrued interest (or US $1,650), the net return would be 8.35% (or US $8,350) for the year. Over a three-year period, an annual 1.5% fee taken at year end with an assumed 10% return per year would result in a cumulative gross return of 33.10%, a total fee of US $5,375, and a cumulative net return of 27.2% (or US $27,200).
Harnessing Multi-Factors Close to the Core October 2021
RESEARCH | Factors 18
For use with institutions only, not for use with retail investors
GENERAL DISCLAIMER
© 2021 S&P Dow Jones Indices. All rights reserved. S&P, S&P 500, S&P 500 LOW VOLATILITY INDEX, S&P 100, S&P COMPOSITE 1500, S&P 400, S&P MIDCAP 400, S&P 600, S&P SMALLCAP 600, S&P GIVI, GLOBAL TITANS, DIVIDEND ARISTOCRATS, S&P TARGET DATE INDICES, S&P PRISM, S&P STRIDE, GICS, SPIVA, SPDR and INDEXOLOGY are registered trademarks of S&P Global, Inc. (“S&P Global”) or its affiliates. DOW JONES, DJ, DJIA, THE DOW and DOW JONES INDUSTRIAL AVERAGE are registered trademarks of Dow Jones Trademark Holdings LLC (“Dow Jones”). These trademarks together with others have been licensed to S&P Dow Jones Indices LLC. Redistribution or reproduction in whole or in part are prohibited without written permission of S&P Dow Jones Indices LLC. This document does not constitute an offer of services in jurisdictions where S&P Dow Jones Indices LLC, S&P Global, Dow Jones or their respective affiliates (collectively “S&P Dow Jones Indices”) do not have the necessary licenses. Except for certain custom index calculation services, all information provided by S&P Dow Jones Indices is impersonal and not tailored to the needs of any person, entity or group of persons. S&P Dow Jones Indices receives compensation in connection with licensing its indices to third parties and providing custom calculation services. Past performance of an index is not an indication or guarantee of future results.
It is not possible to invest directly in an index. Exposure to an asset class represented by an index may be available through investable instruments based on that index. S&P Dow Jones Indices does not sponsor, endorse, sell, promote or manage any investment fund or other investment vehicle that is offered by third parties and that seeks to provide an investment return based on the performance of any index. S&P Dow Jones Indices makes no assurance that investment products based on the index will accurately track index performance or provide positive investment returns. S&P Dow Jones Indices LLC is not an investment advisor, and S&P Dow Jones Indices makes no representation regarding the advisability of investing in any such investment fund or other investment vehicle. A decision to invest in any such investment fund or other investment vehicle should not be made in reliance on any of the statements set forth in this document. Prospective investors are advised to make an investment in any such fund or other vehicle only after carefully considering the risks associated with investing in such funds, as detailed in an offering memorandum or similar document that is prepared by or on behalf of the issuer of the investment fund or other investment product or vehicle. S&P Dow Jones Indices LLC is not a tax advisor. A tax advisor should be consulted to evaluate the impact of any tax-exempt securities on portfolios and the tax consequences of making any particular investment decision. Inclusion of a security within an index is not a recommendation by S&P Dow Jones Indices to buy, sell, or hold such security, nor is it considered to be investment advice. Closing prices for S&P Dow Jones Indices’ US benchmark indices are calculated by S&P Dow Jones Indices based on the closing price of the individual constituents of the index as set by their primary exchange. Closing prices are received by S&P Dow Jones Indices from one of its third party vendors and verified by comparing them with prices from an alternative vendor. The vendors receive the closing price from the primary exchanges. Real-time intraday prices are calculated similarly without a second verification.
These materials have been prepared solely for informational purposes based upon information generally available to the public and from sources believed to be reliable. No content contained in these materials (including index data, ratings, credit-related analyses and data, research, valuations, model, software or other application or output therefrom) or any part thereof (“Content”) may be modified, reverse-engineered, reproduced or distributed in any form or by any means, or stored in a database or retrieval system, without the prior written permission of S&P Dow Jones Indices. The Content shall not be used for any unlawful or unauthorized purposes. S&P Dow Jones Indices and its third-party data providers and licensors (collectively “S&P Dow Jones Indices Parties”) do not guarantee the accuracy, completeness, timeliness or availability of the Content. S&P Dow Jones Indices Parties are not responsible for any errors or omissions, regardless of the cause, for the results obtained from the use of the Content. THE CONTENT IS PROVIDED ON AN “AS IS” BASIS. S&P DOW JONES INDICES PARTIES DISCLAIM ANY AND ALL EXPRESS OR IMPLIED WARRANTIES, INCLUDING, BUT NOT LIMITED TO, ANY WARRANTIES OF MERCHANTABILITY OR FITNESS FOR A PARTICULAR PURPOSE OR USE, FREEDOM FROM BUGS, SOFTWARE ERRORS OR DEFECTS, THAT THE CONTENT’S FUNCTIONING WILL BE UNINTERRUPTED OR THAT THE CONTENT WILL OPERATE WITH ANY SOFTWARE OR HARDWARE CONFIGURATION. In no event shall S&P Dow Jones Indices Parties be liable to any party for any direct, indirect, incidental, exemplary, compensatory, punitive, special or consequential damages, costs, expenses, legal fees, or losses (including, without limitation, lost income or lost profits and opportunity costs) in connection with any use of the Content even if advised of the possibility of such damages.
S&P Global keeps certain activities of its various divisions and business units separate from each other in order to preserve the independence and objectivity of their respective activities. As a result, certain divisions and business units of S&P Global may have information that is not available to other business units. S&P Global has established policies and procedures to maintain the confidentiality of certain non-public information received in connection with each analytical process.
In addition, S&P Dow Jones Indices provides a wide range of services to, or relating to, many organizations, including issuers of securities, investment advisers, broker-dealers, investment banks, other financial institutions and financial intermediaries, and accordingly may receive fees or other economic benefits from those organizations, including organizations whose securities or services they may recommend, rate, include in model portfolios, evaluate or otherwise address.
The Global Industry Classification Standard (GICS®) was developed by and is the exclusive property and a trademark of S&P and MSCI. Neither MSCI, S&P nor any other party involved in making or compiling any GICS classifications makes any express or implied warranties or representations with respect to such standard or classification (or the results to be obtained by the use thereof), and all such parties hereby expressly disclaim all warranties of originality, accuracy, completeness, merchantability or fitness for a particular purpose with respect to any of such standard or classification. Without limiting any of the foregoing, in no event shall MSCI, S&P, any of their affiliates or any third party involved in making or compiling any GICS classifications have any liability for any direct, indirect, special, punitive, consequential or any other damages (including lost profits) even if notified of the possibility of such damages.