Embed Size (px)
DESCRIPTION
Learn about some exciting ways analytics is being used to drive the positive impacts on student outcomes at the course and program level. This presenter will discuss PAR Framework research on the impacts of student success courses, attributes of successful community college to university transfer students, and how to identify key obstacle courses at the programmatic level. Best practices for leadership undertaking and leading analytics efforts will be highlighted, based on lessons learned though many years of deploying analytics and technology solutions in higher education.Participants will understand how analytics can be applied to identifying and addressing key obstacle courses in programs, review key leadership and cultural themes to make the use of analytics successful, and learn about the power of collaboration in researching and measuring the impacts of course outcomes. http://www.educause.edu/events/eli-2015-online-fall-focus-session-leadership-teaching-and-learning/2015/tbd-3
Citation preview
Harnessing Analytics To Drive and Measure Academic Outcomes
Is the Status Quo Acceptable?
Are we sure we understand the environment?
Do you specifically know what to change?
Can that change be supported with evidence?
Will the investment be worth the outcomes?
How will you know?
Analytics
Unique Perspective
Built by and for educators, PAR Framework is a non-profit provider of analytics-as-a-service, delivering actionable institutional-specific insight to more than 350 campuses.
Anonymized STUDENT level data
Openly published frameworks
2.3 million students
24+ million student courses
350+ unique campuses
One comprehensive dataset
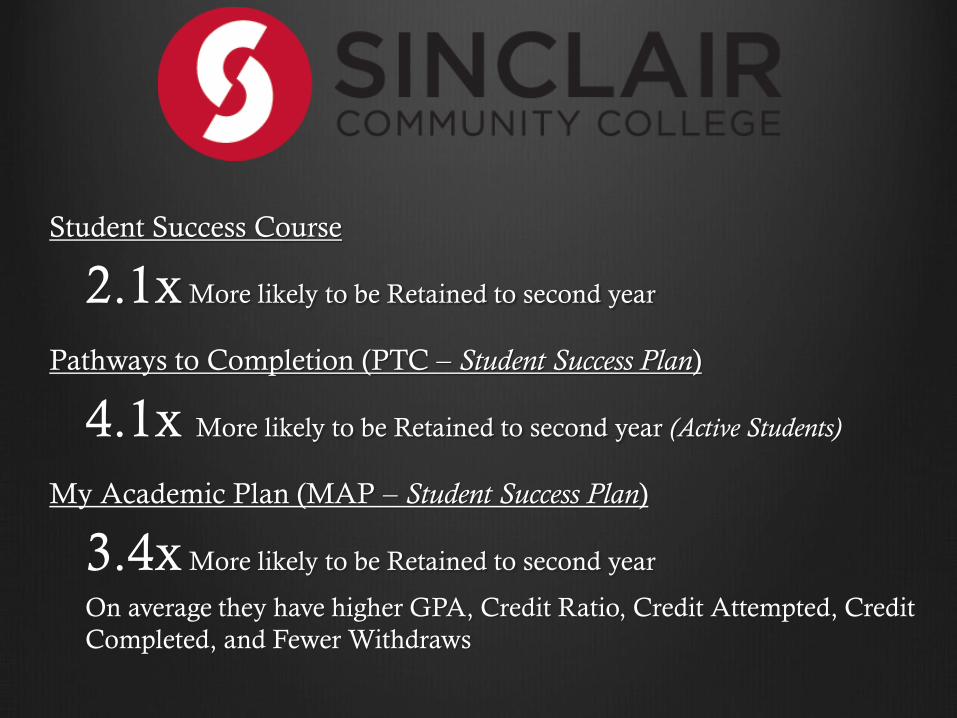
Student Success Course
2.1x More likely to be Retained to second year
Pathways to Completion (PTC – Student Success Plan)
4.1x More likely to be Retained to second year (Active Students)
My Academic Plan (MAP – Student Success Plan)
3.4x More likely to be Retained to second year
On average they have higher GPA, Credit Ratio, Credit Attempted, Credit
Completed, and Fewer Withdraws

“The beginning of wisdom is
a definition of terms” – attributed to Socrates
Analytics
Discovery and communication of
meaningful patterns in data
Raw Data
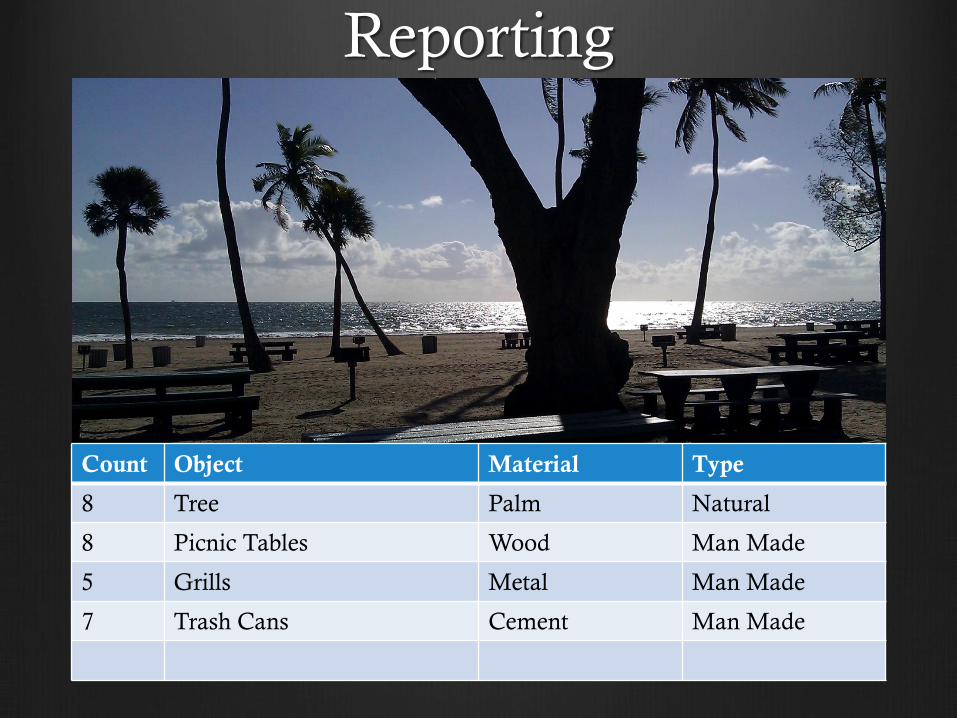
Reporting
Count Object Material Type
8 Tree Palm Natural
8 Picnic Tables Wood Man Made
5 Grills Metal Man Made
7 Trash Cans Cement Man Made
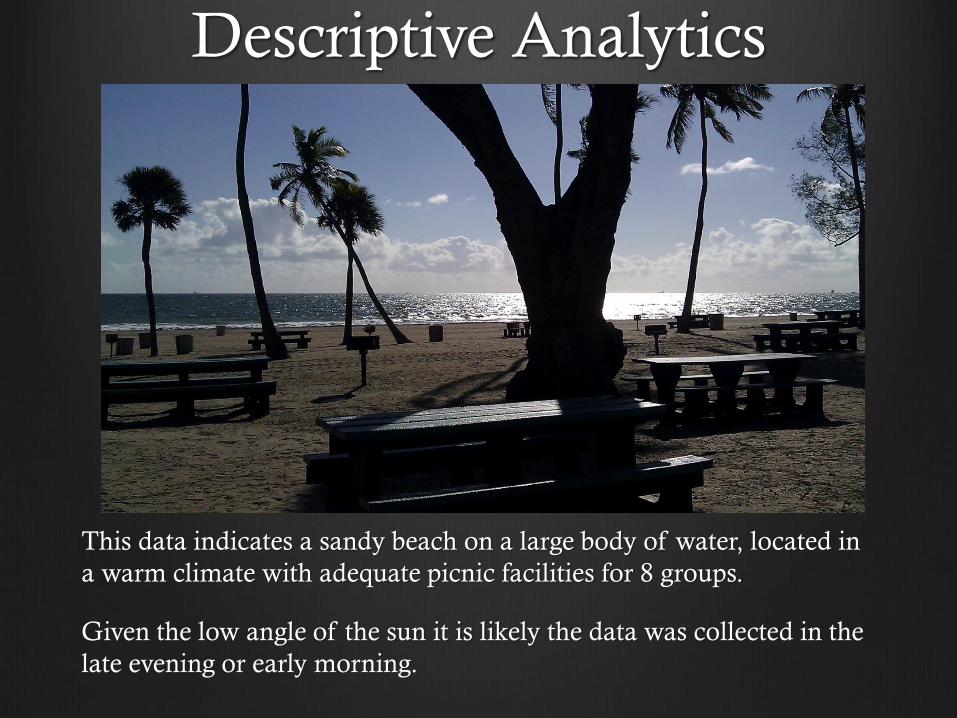
This data indicates a sandy beach on a large body of water, located in
a warm climate with adequate picnic facilities for 8 groups.
Given the low angle of the sun it is likely the data was collected in the
late evening or early morning.
Descriptive Analytics
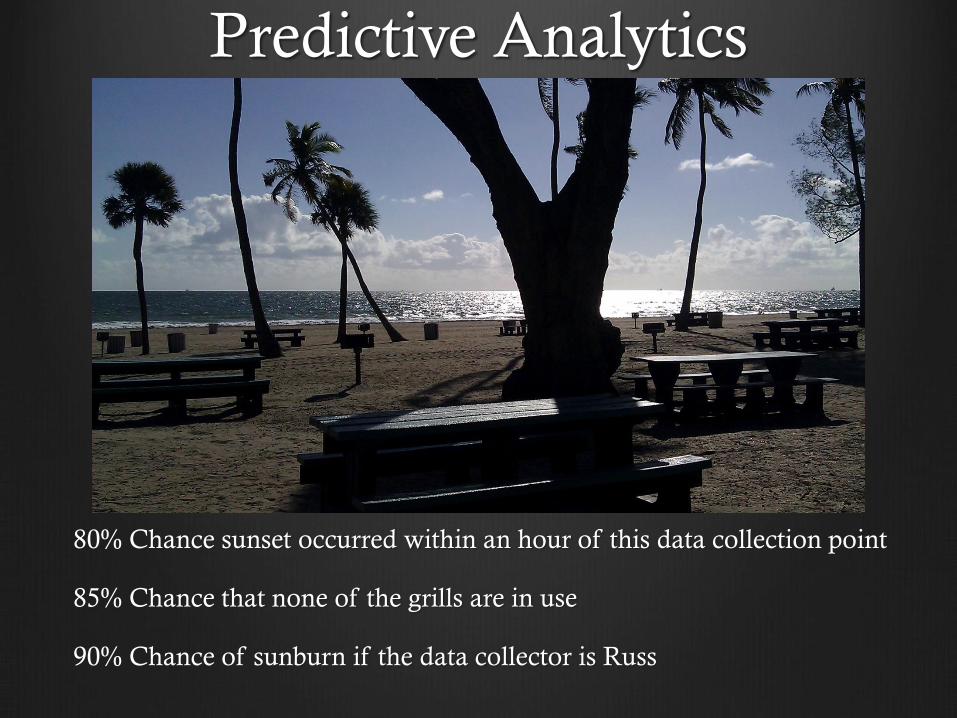
80% Chance sunset occurred within an hour of this data collection point
85% Chance that none of the grills are in use
90% Chance of sunburn if the data collector is Russ
Predictive Analytics
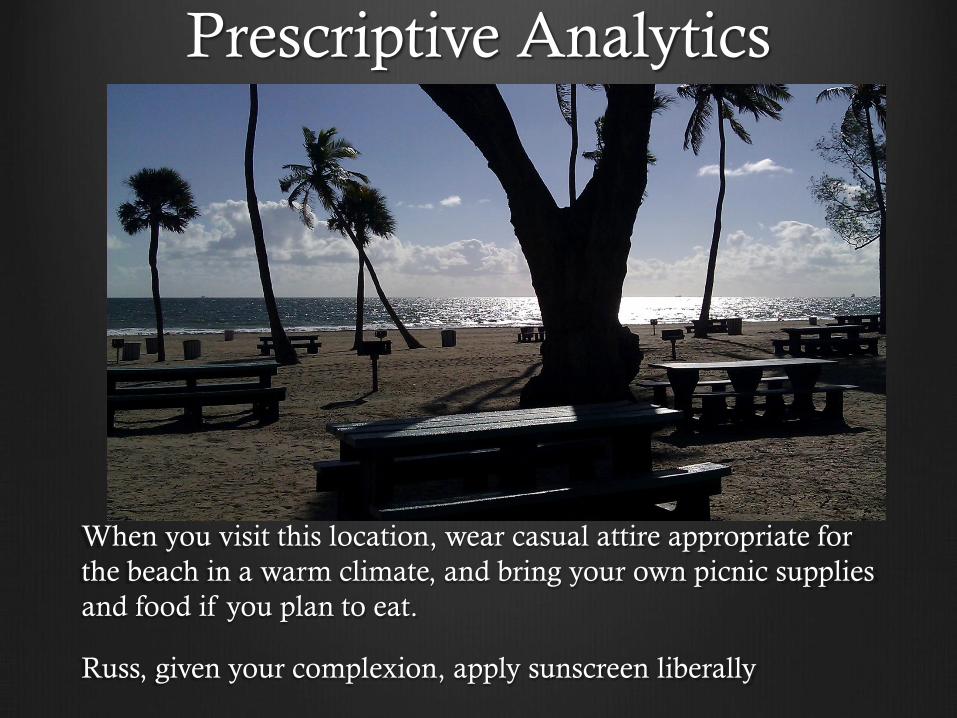
When you visit this location, wear casual attire appropriate for
the beach in a warm climate, and bring your own picnic supplies
and food if you plan to eat.
Russ, given your complexion, apply sunscreen liberally
Prescriptive Analytics
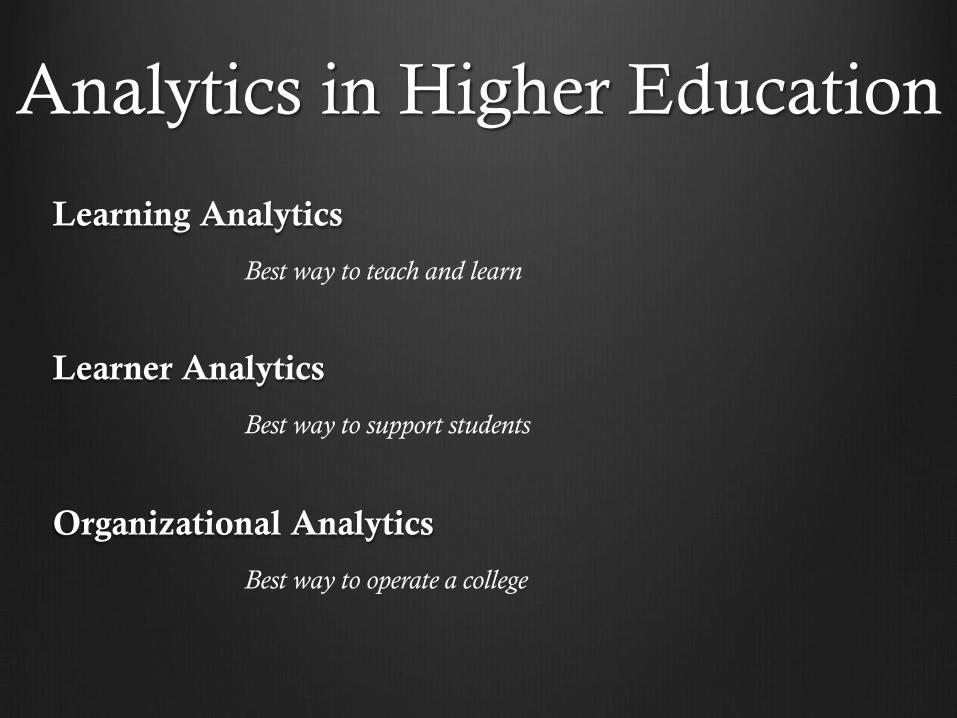
Analytics in Higher Education
Learning Analytics
Best way to teach and learn
Learner Analytics
Best way to support students
Organizational Analytics
Best way to operate a college
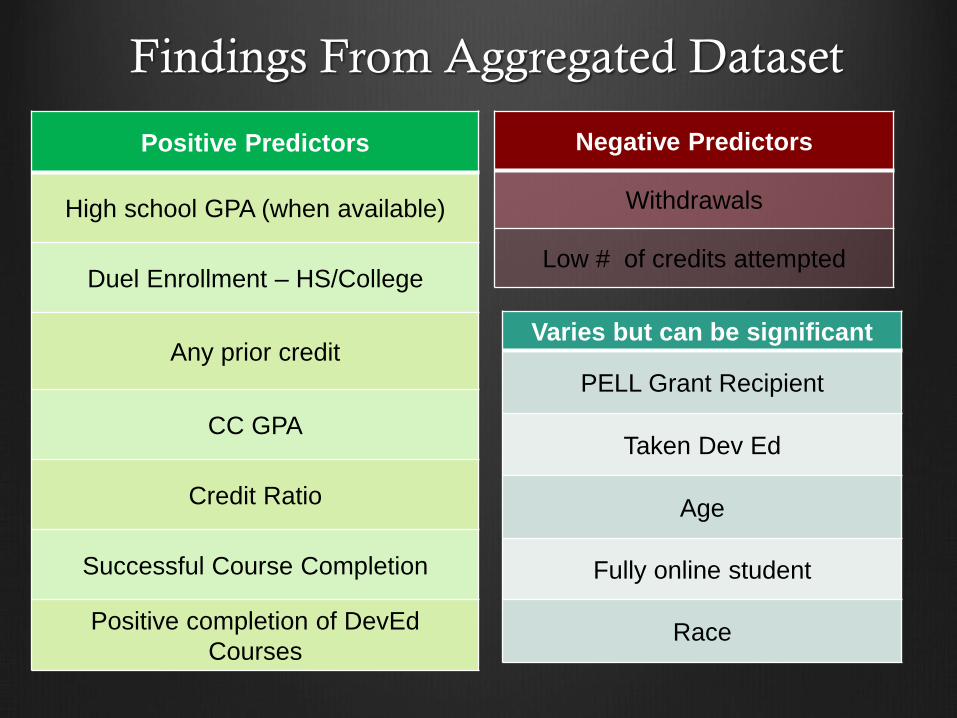
Findings From Aggregated Dataset
Positive Predictors
High school GPA (when available)
Duel Enrollment – HS/College
Any prior credit
CC GPA
Credit Ratio
Successful Course Completion
Positive completion of DevEd
Courses
Negative Predictors
Withdrawals
Low # of credits attempted
Varies but can be significant
PELL Grant Recipient
Taken Dev Ed
Age
Fully online student
Race
“Measure what is measurable,
and make measurable
what is not so.” – Galileo
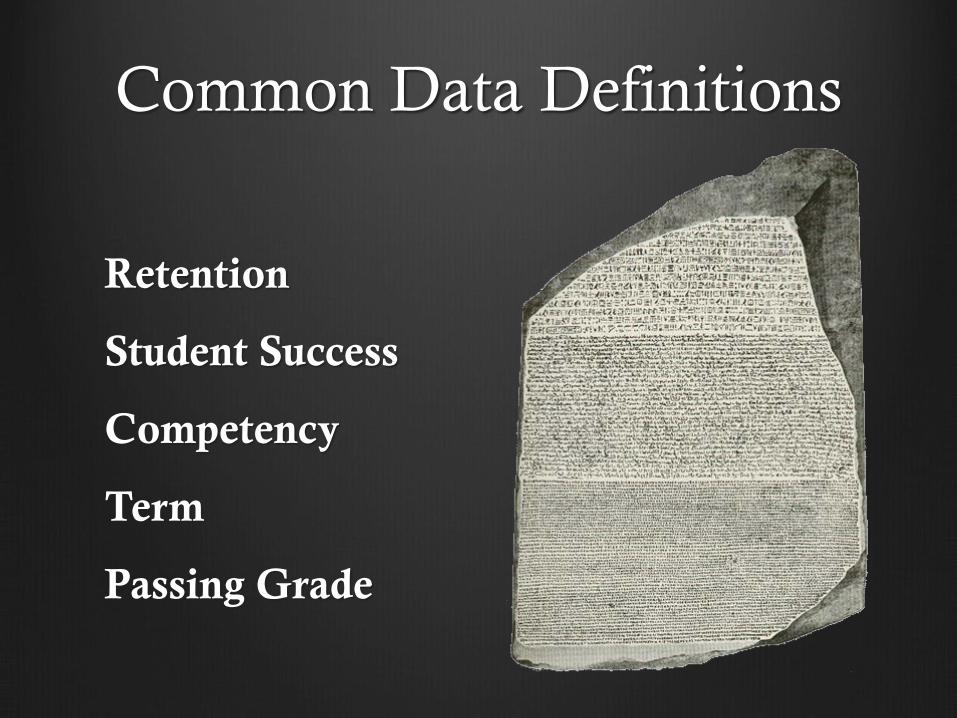
Common Data Definitions
Retention
Student Success
Competency
Term
Passing Grade
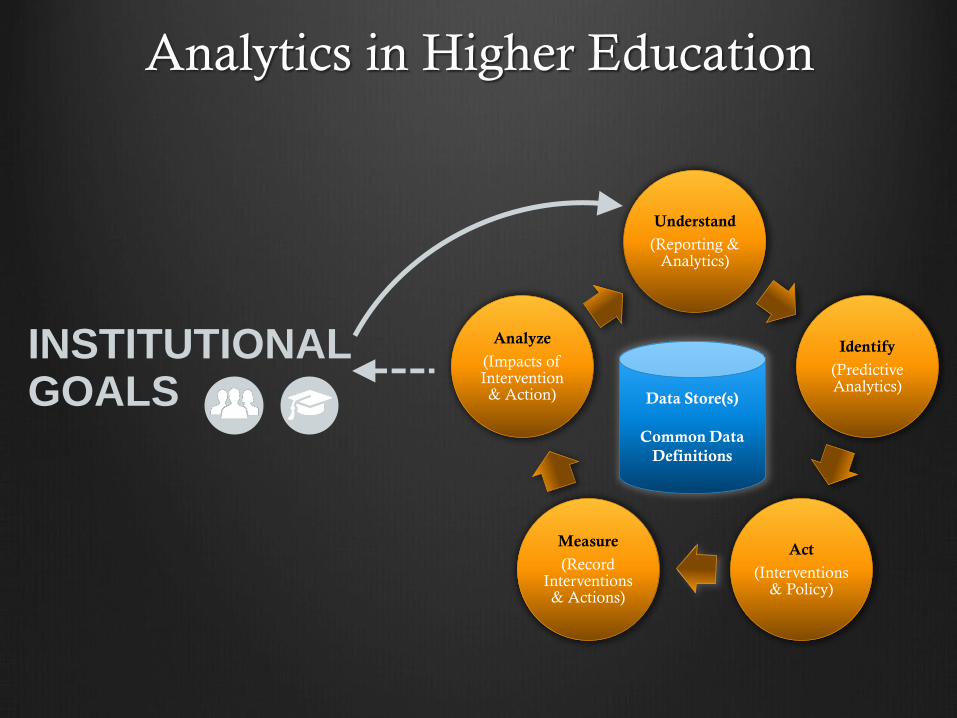
Analytics in Higher Education
Data Store(s)
Common Data
Definitions
Understand
(Reporting & Analytics)
Identify
(Predictive Analytics)
Act
(Interventions & Policy)
Measure
(Record Interventions & Actions)
Analyze
(Impacts of Intervention & Action)
INSTITUTIONAL GOALS
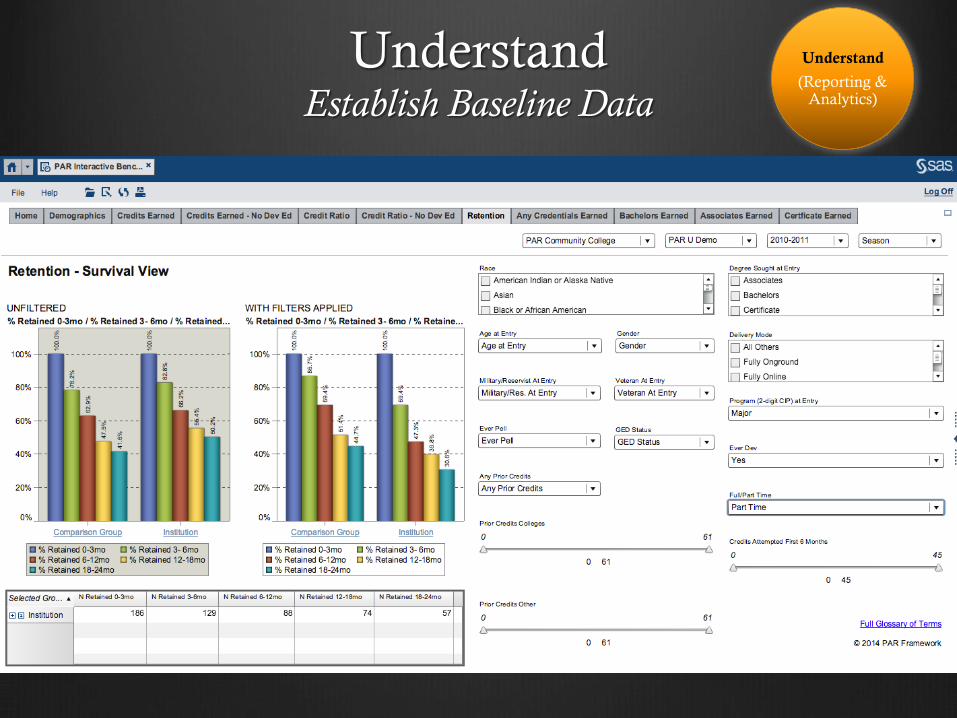
Understand Establish Baseline Data
Understand
(Reporting & Analytics)
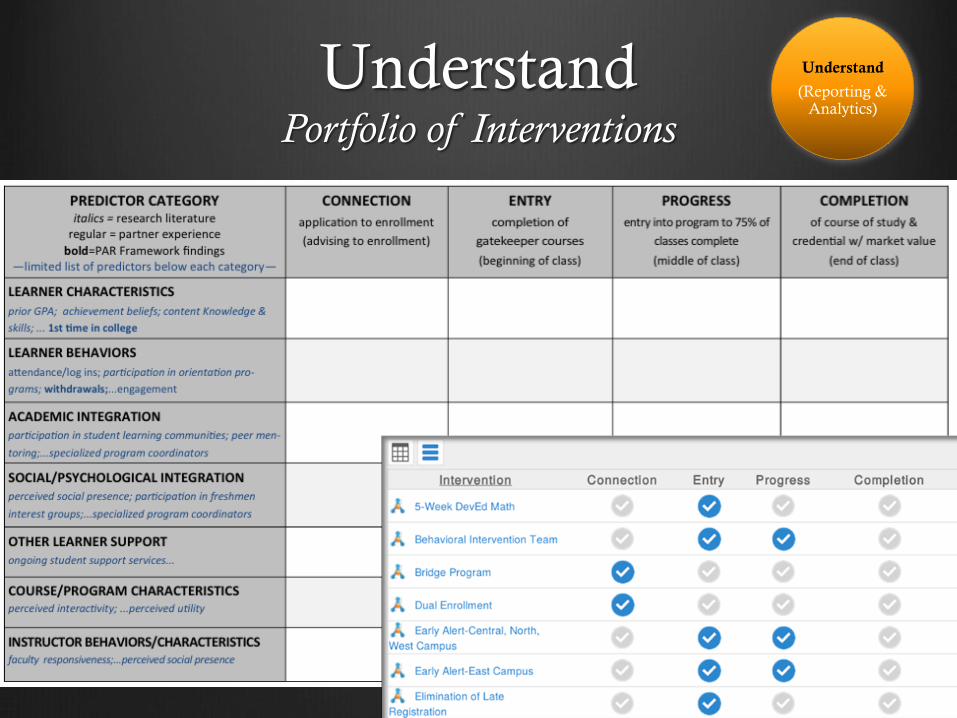
Understand Portfolio of Interventions
Understand
(Reporting & Analytics)
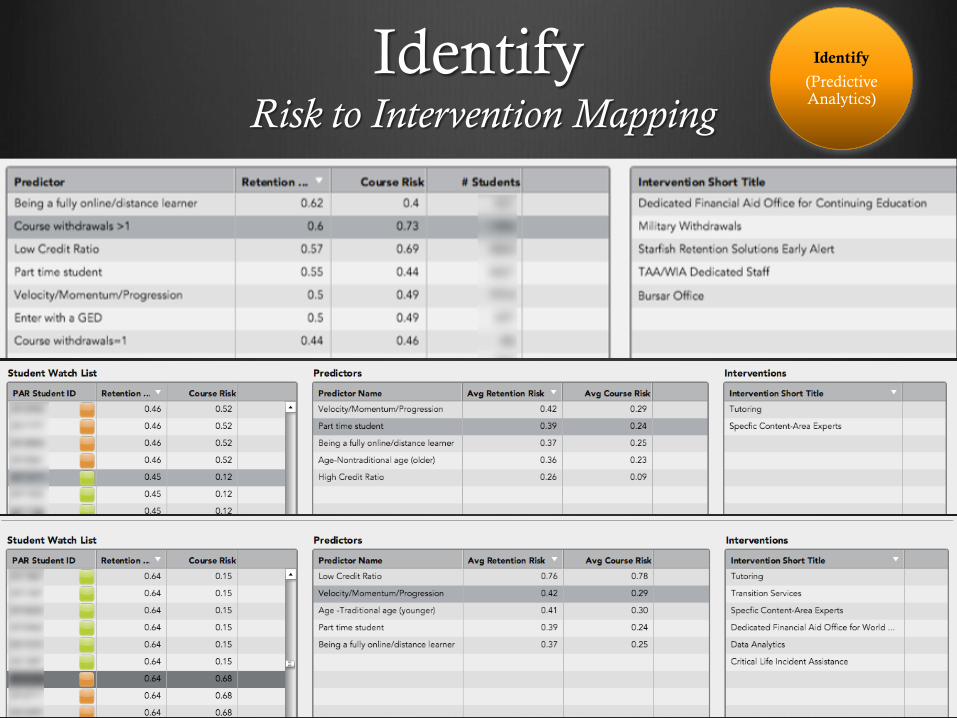
Identify Risk to Intervention Mapping
Identify
(Predictive Analytics)
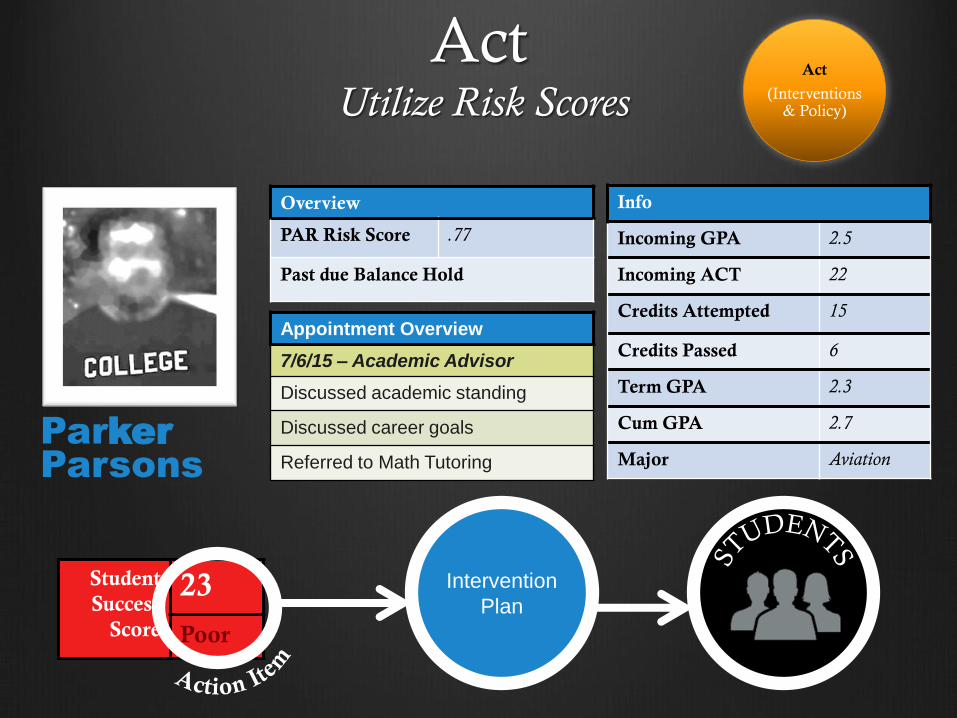
Parker
Parsons
Overview
PAR Risk Score .77
Past due Balance Hold
Info
Incoming GPA 2.5
Incoming ACT 22
Credits Attempted 15
Credits Passed 6
Term GPA 2.3
Cum GPA 2.7
Major Aviation
Student
Success
Score
23
Poor
Appointment Overview
7/6/15 – Academic Advisor
Discussed academic standing
Discussed career goals
Referred to Math Tutoring
Intervention
Plan
Act Utilize Risk Scores
Act
(Interventions & Policy)
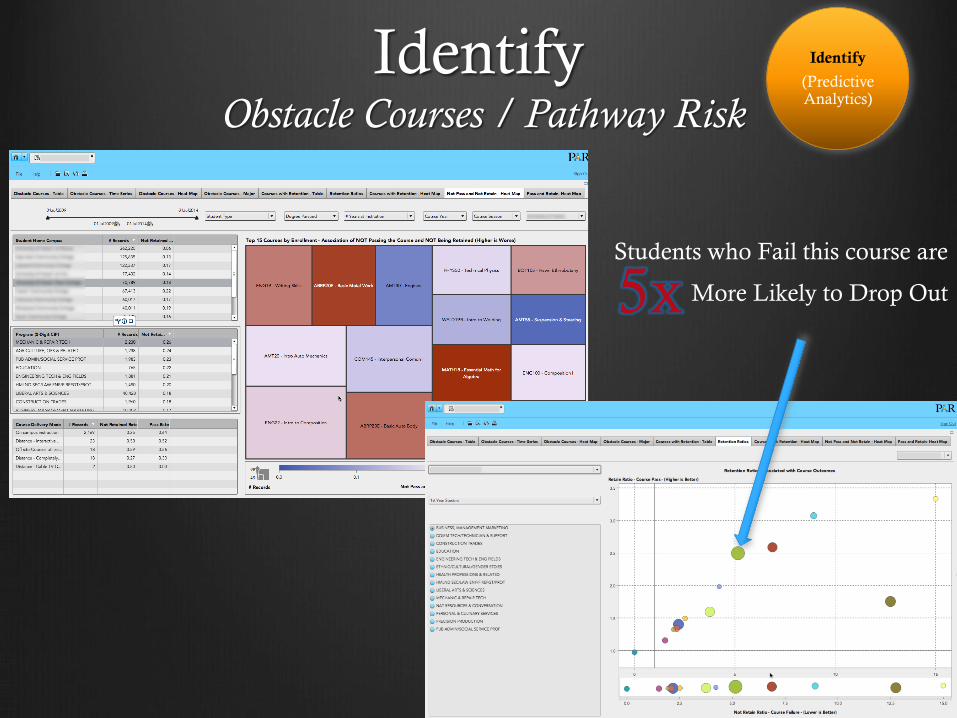
Identify Obstacle Courses / Pathway Risk
Students who Fail this course are
More Likely to Drop Out 5x
Identify
(Predictive Analytics)
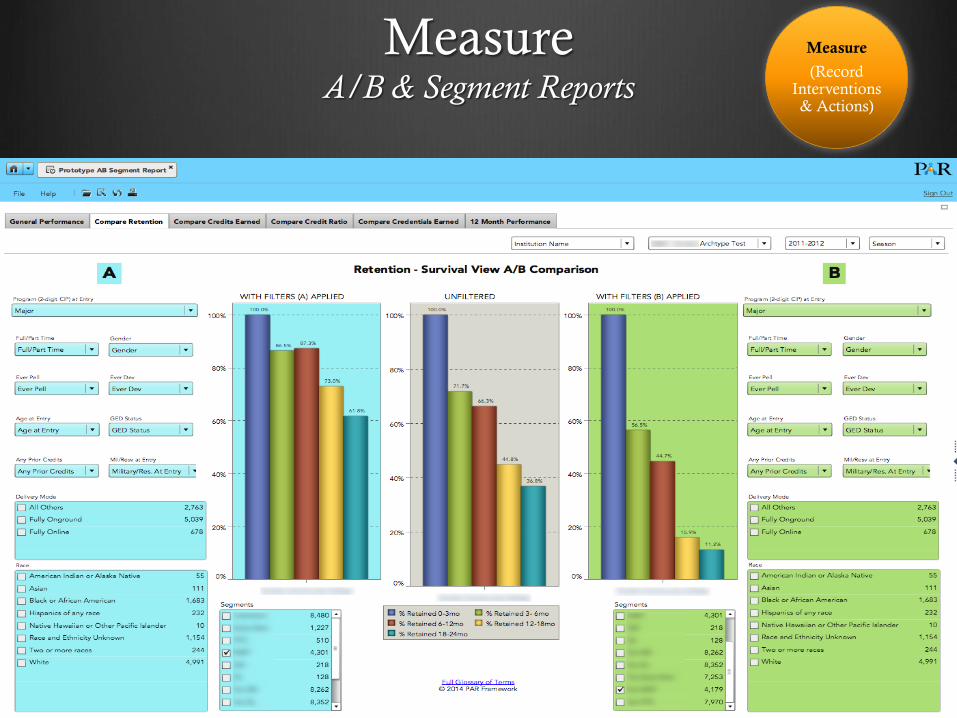
Measure A/B & Segment Reports
Measure
(Record Interventions & Actions)

“Computers are useless, they
can only give you answers ” – Picasso
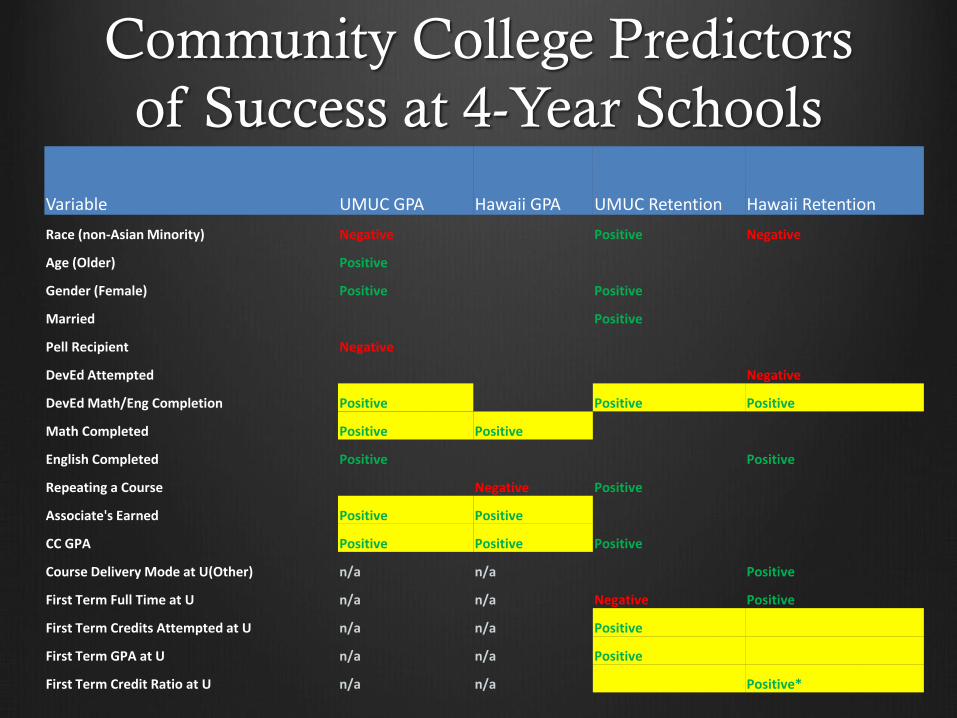
Community College Predictors
of Success at 4-Year Schools
Variable UMUC GPA Hawaii GPA UMUC Retention Hawaii Retention
Race (non-Asian Minority) Negative Positive Negative
Age (Older) Positive
Gender (Female) Positive Positive
Married Positive
Pell Recipient Negative
DevEd Attempted Negative
DevEd Math/Eng Completion Positive Positive Positive
Math Completed Positive Positive
English Completed Positive Positive
Repeating a Course Negative Positive
Associate's Earned Positive Positive
CC GPA Positive Positive Positive
Course Delivery Mode at U(Other) n/a n/a Positive
First Term Full Time at U n/a n/a Negative Positive
First Term Credits Attempted at U n/a n/a Positive
First Term GPA at U n/a n/a Positive
First Term Credit Ratio at U n/a n/a Positive*
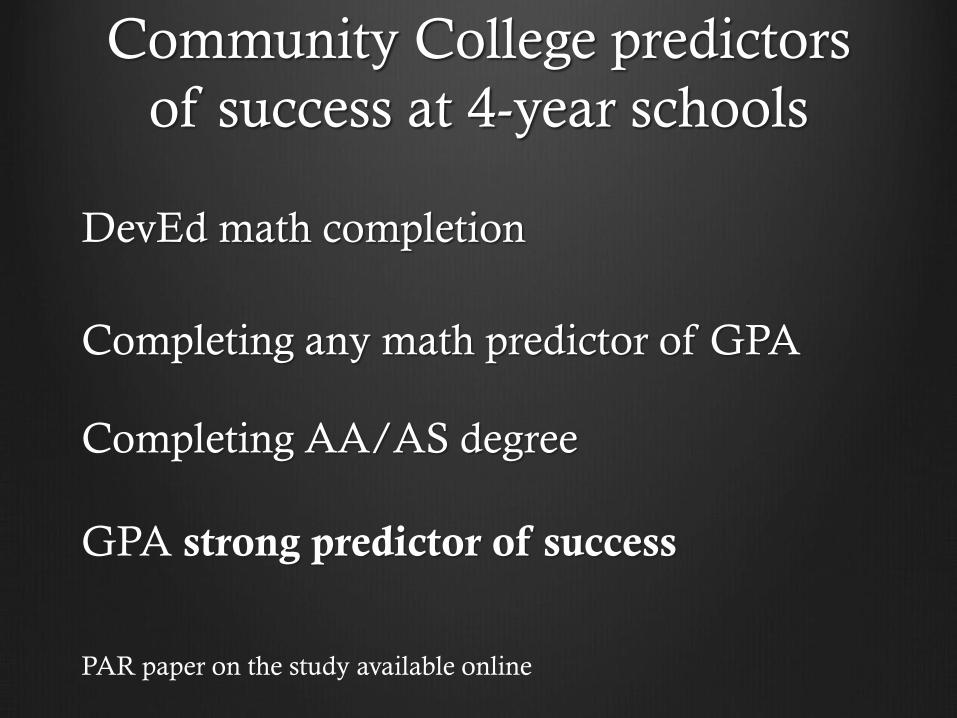
DevEd math completion
Completing any math predictor of GPA
Completing AA/AS degree
GPA strong predictor of success
PAR paper on the study available online
Community College predictors
of success at 4-year schools
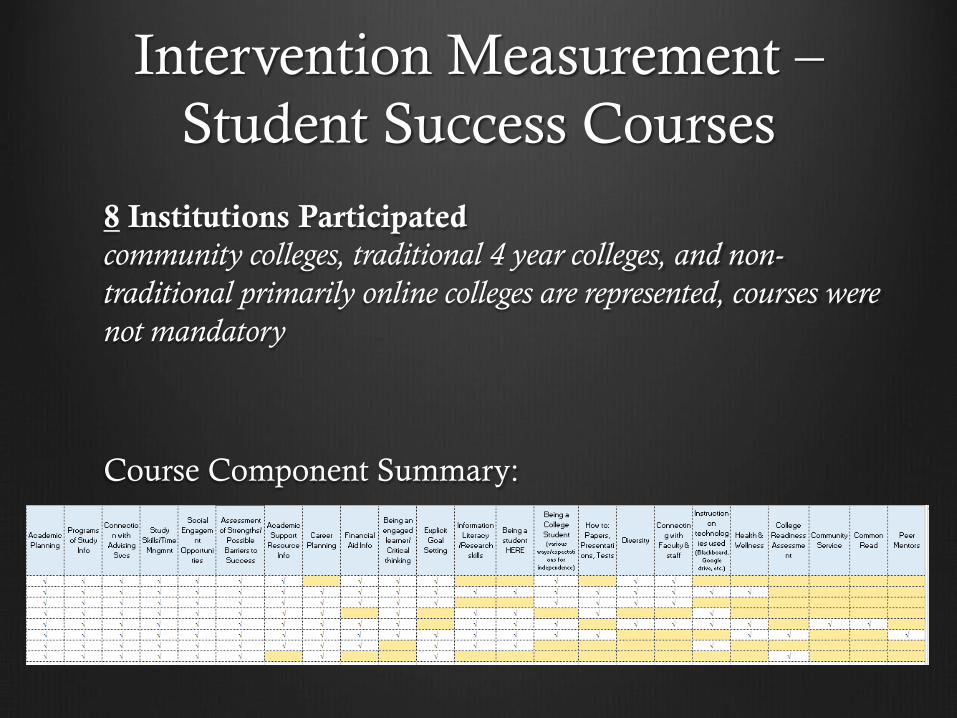
Intervention Measurement –
Student Success Courses
8 Institutions Participated
community colleges, traditional 4 year colleges, and non-
traditional primarily online colleges are represented, courses were
not mandatory
Course Component Summary:
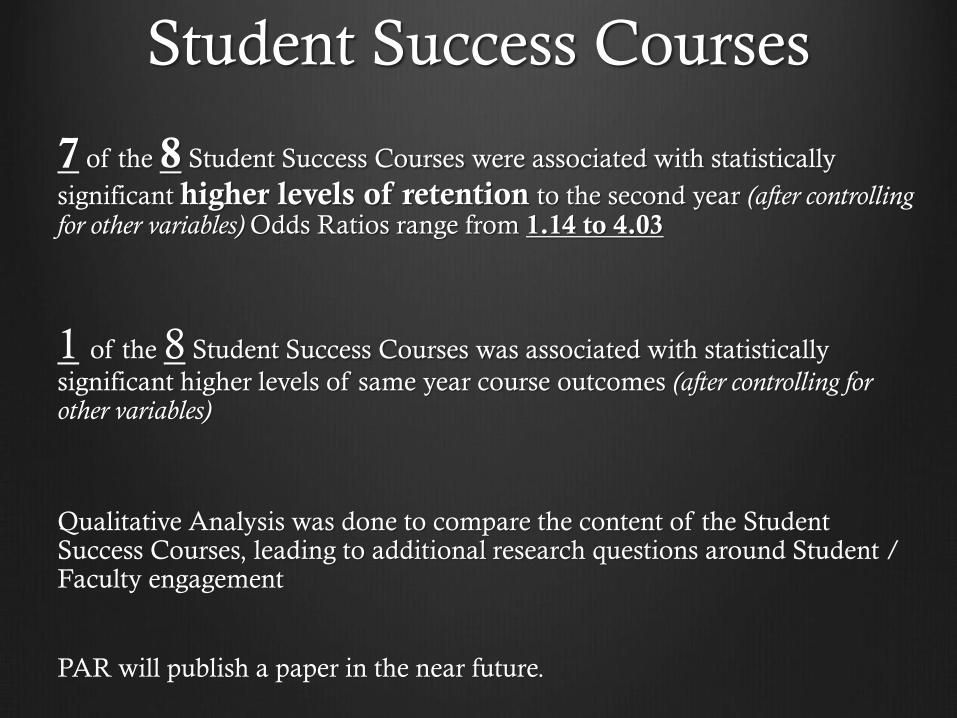
Student Success Courses
7 of the 8 Student Success Courses were associated with statistically
significant higher levels of retention to the second year (after controlling for other variables) Odds Ratios range from 1.14 to 4.03
1 of the 8 Student Success Courses was associated with statistically
significant higher levels of same year course outcomes (after controlling for other variables)
Qualitative Analysis was done to compare the content of the Student Success Courses, leading to additional research questions around Student / Faculty engagement
PAR will publish a paper in the near future.
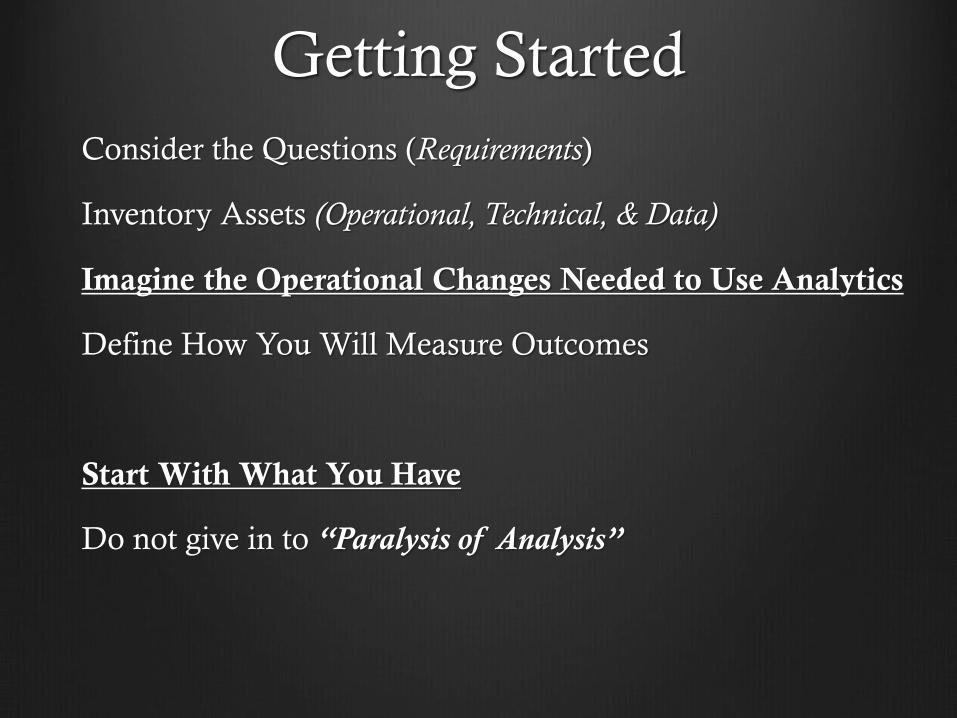
Getting Started
Consider the Questions (Requirements)
Inventory Assets (Operational, Technical, & Data)
Imagine the Operational Changes Needed to Use Analytics
Define How You Will Measure Outcomes
Start With What You Have
Do not give in to “Paralysis of Analysis”
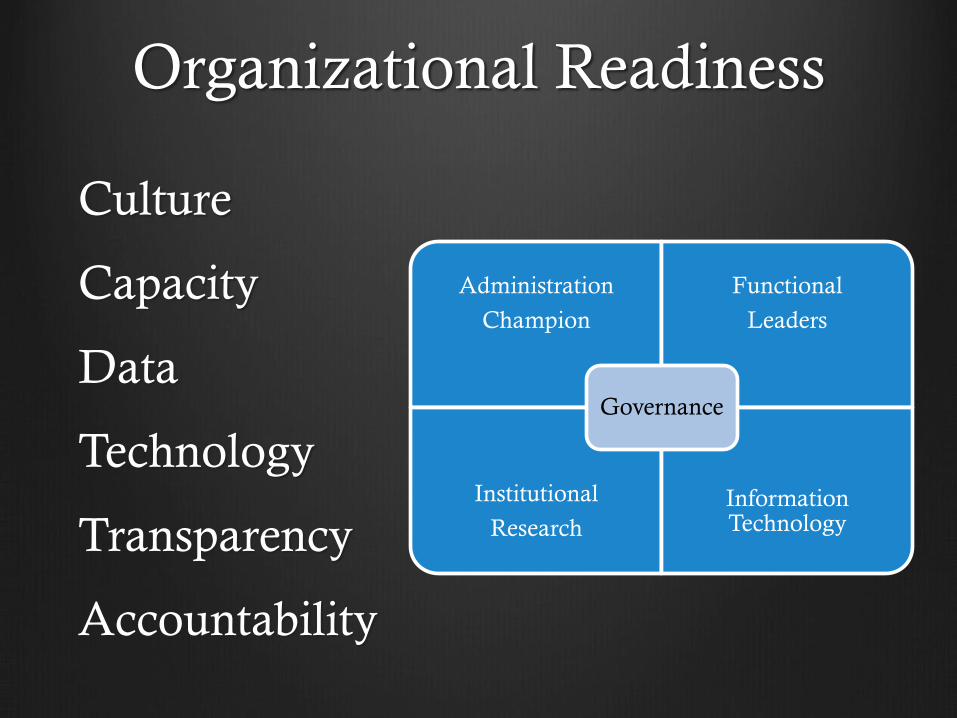
Organizational Readiness
Culture
Capacity
Data
Technology
Transparency
Accountability
Administration
Champion
Functional
Leaders
Institutional
Research
Information Technology
Governance
“Knowing is not enough;
we must apply.
Willing is not enough;
we must do.” – Goethe
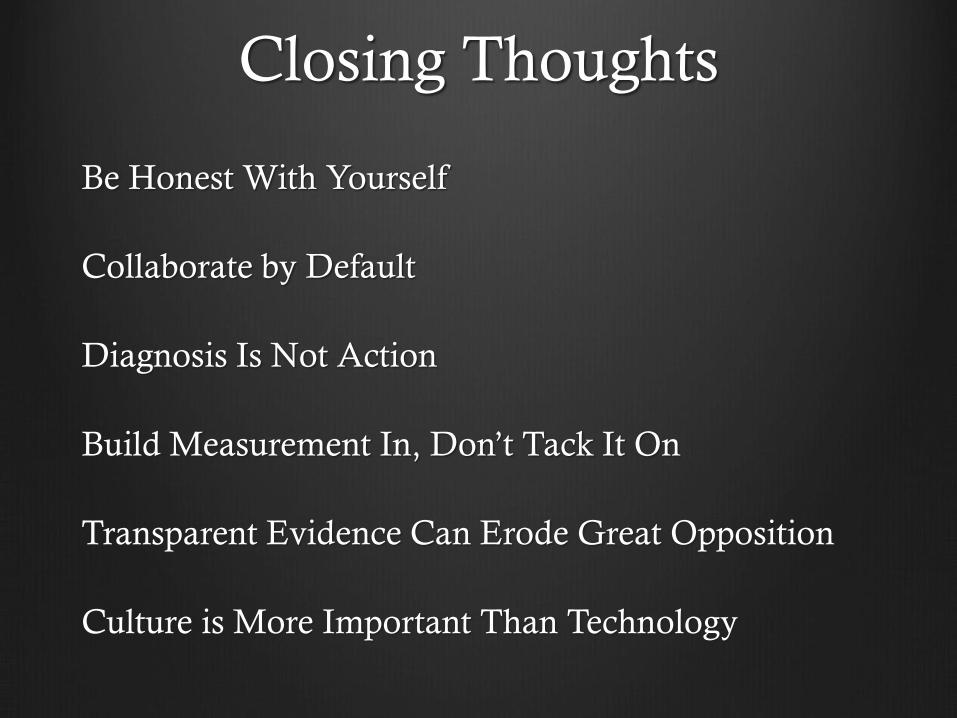
Closing Thoughts
Be Honest With Yourself
Collaborate by Default
Diagnosis Is Not Action
Build Measurement In, Don’t Tack It On
Transparent Evidence Can Erode Great Opposition
Culture is More Important Than Technology
Resources
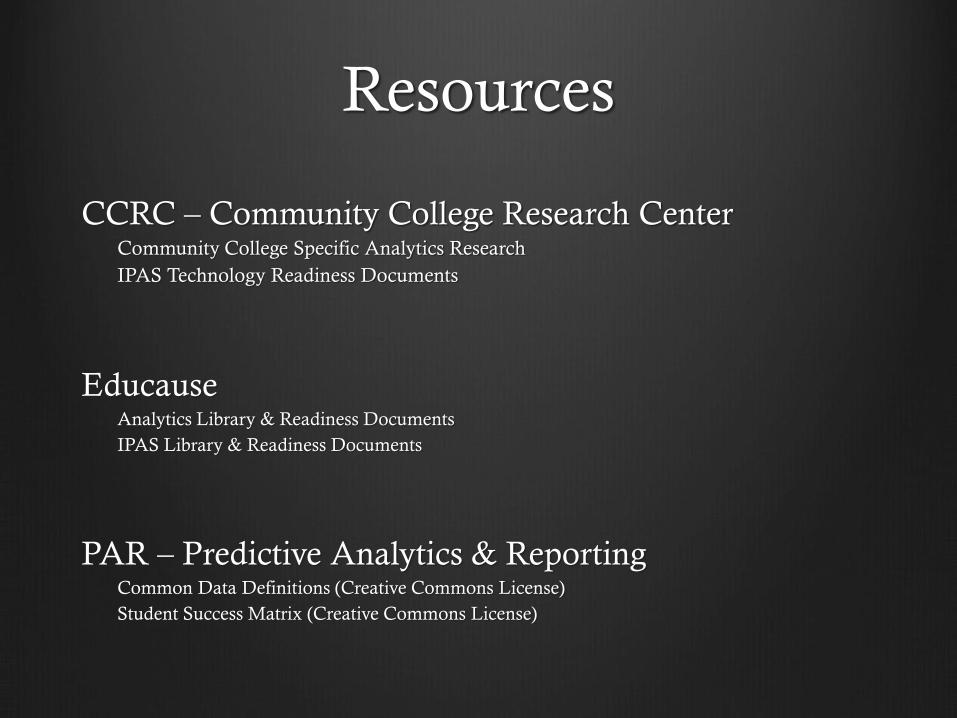
CCRC – Community College Research Center Community College Specific Analytics Research
IPAS Technology Readiness Documents
Educause Analytics Library & Readiness Documents
IPAS Library & Readiness Documents
PAR – Predictive Analytics & Reporting Common Data Definitions (Creative Commons License)
Student Success Matrix (Creative Commons License)