Embed Size (px)
DESCRIPTION
Harness The Power of Multiple Time Frame Analysis to Identify Support and Resistance Commonalities. By Christopher J. Terry. DOW THEORY. 1. Primary Trend 2. Secondary Trend 3. Minor Trend Dow Theory- “Technical Analysis of Stock Trends 7 th edition” - PowerPoint PPT Presentation
Citation preview

www.LBRgroup.com 1
Harness The Power of Multiple Time Frame Analysis to Identify Support and Resistance Commonalities
By
Christopher J. Terry
www.LBRgroup.com 2
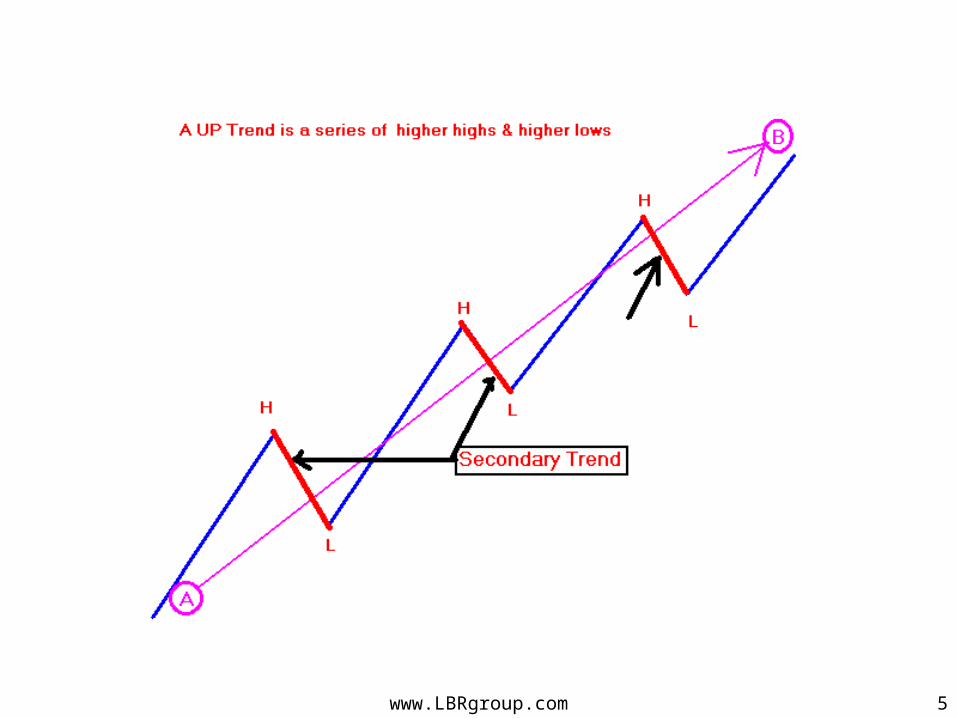
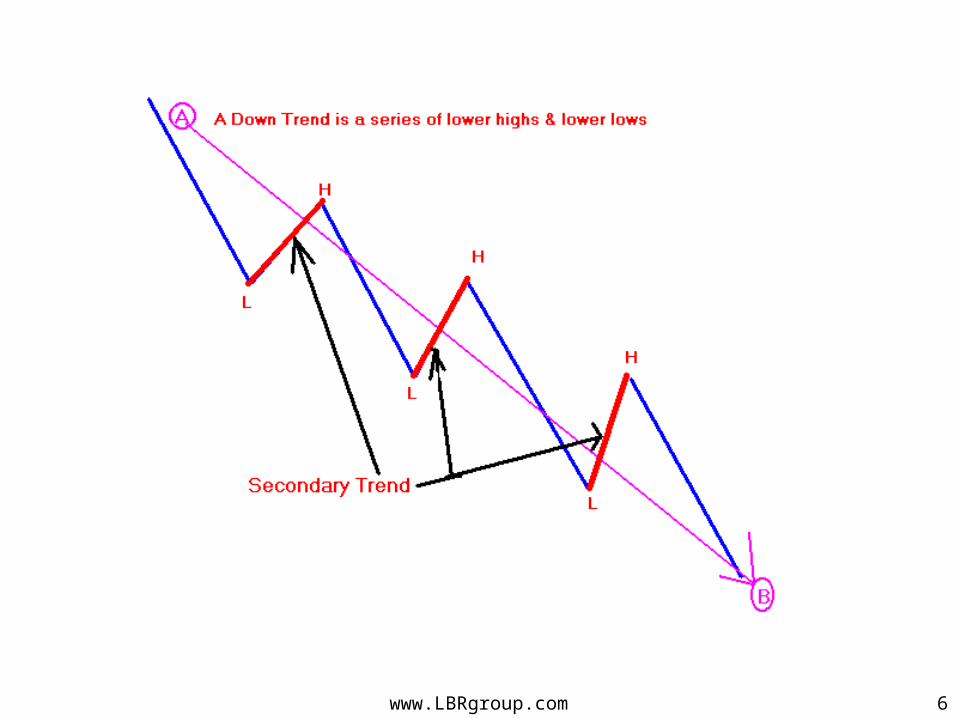
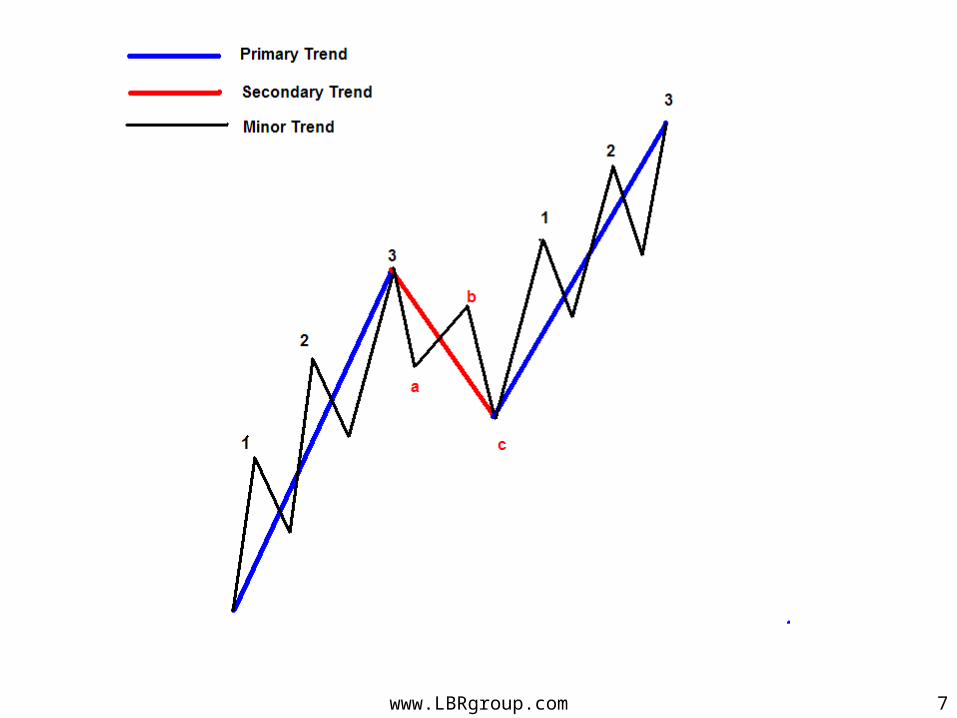
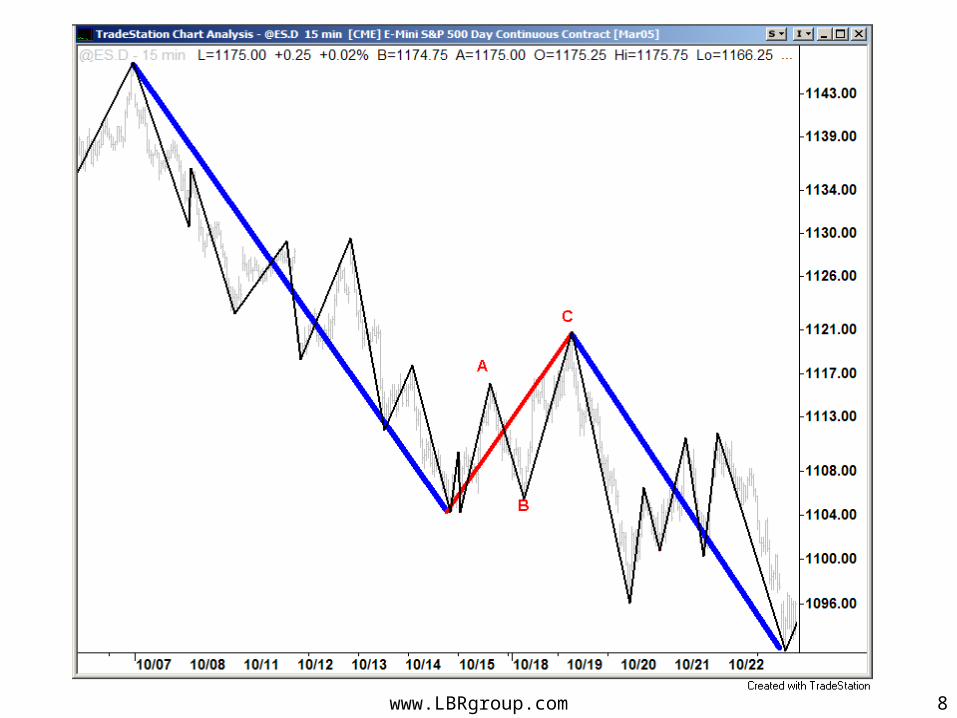
DOW THEORY
1. Primary Trend 2. Secondary Trend 3. Minor Trend
Dow Theory-“Technical Analysis of Stock Trends 7th edition” – Robert D. Edwards and John Magee
www.LBRgroup.com 3
www.LBRgroup.com 4
www.LBRgroup.com 5
www.LBRgroup.com 6
www.LBRgroup.com 7
www.LBRgroup.com 8
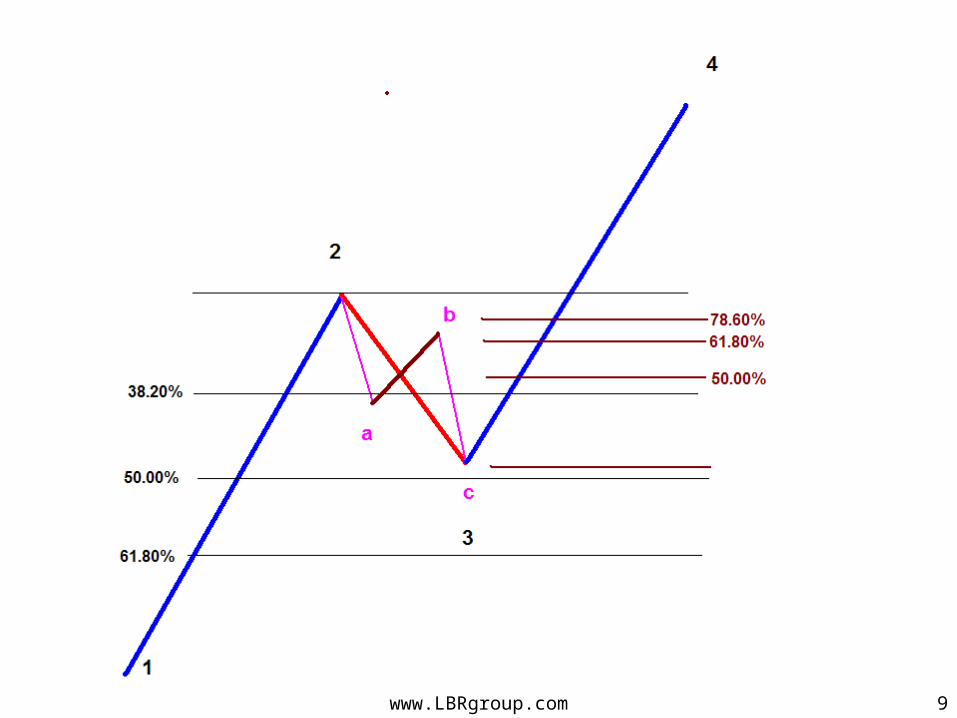
www.LBRgroup.com 9
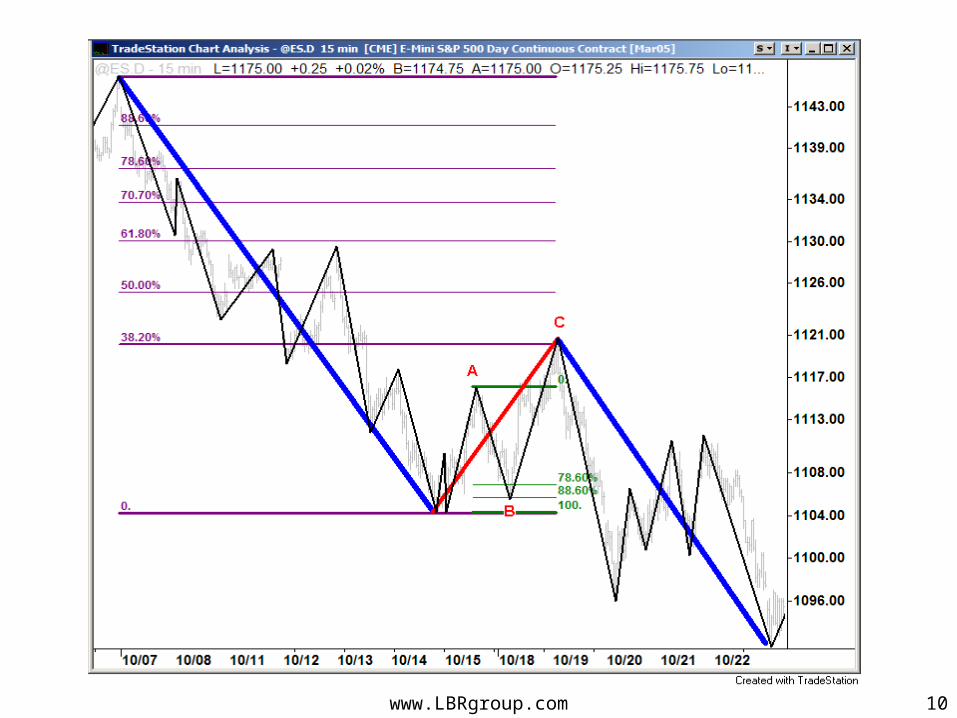
www.LBRgroup.com 10
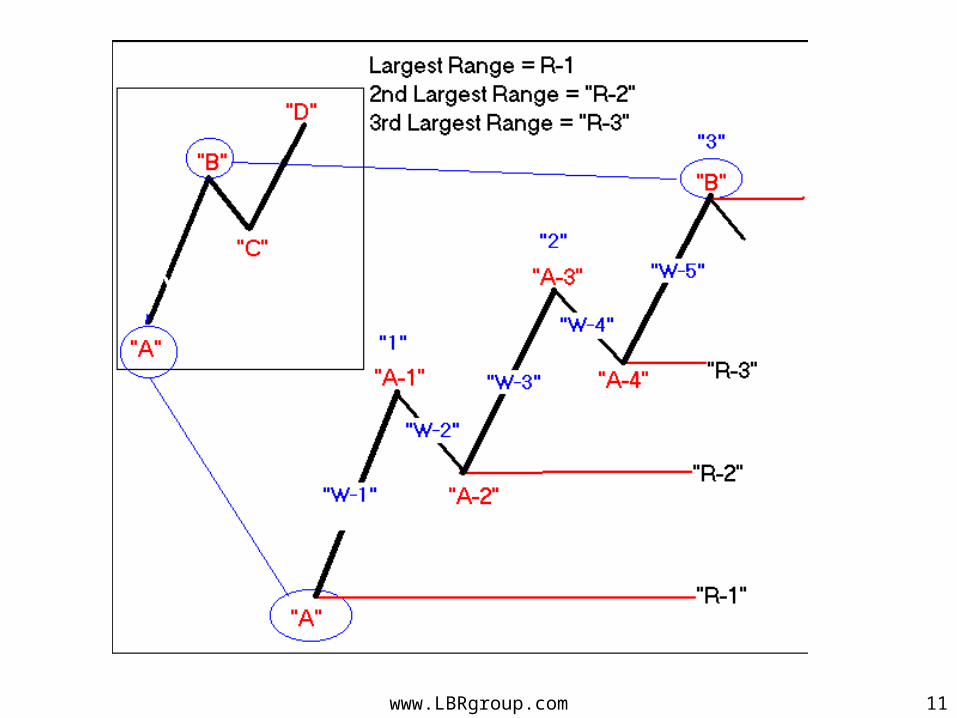
www.LBRgroup.com 11
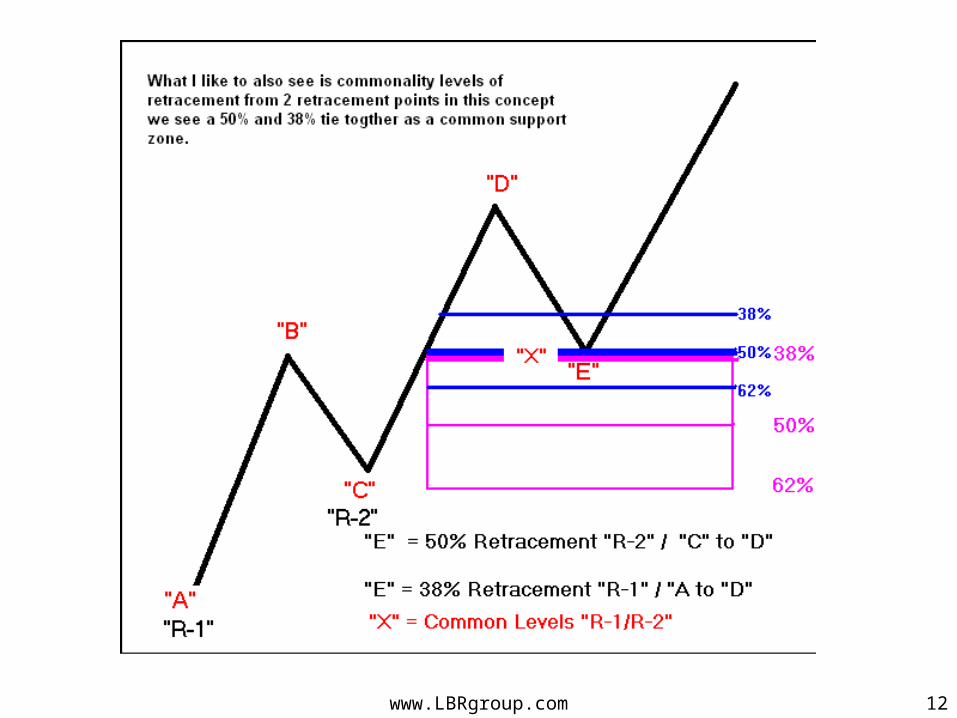
www.LBRgroup.com 12
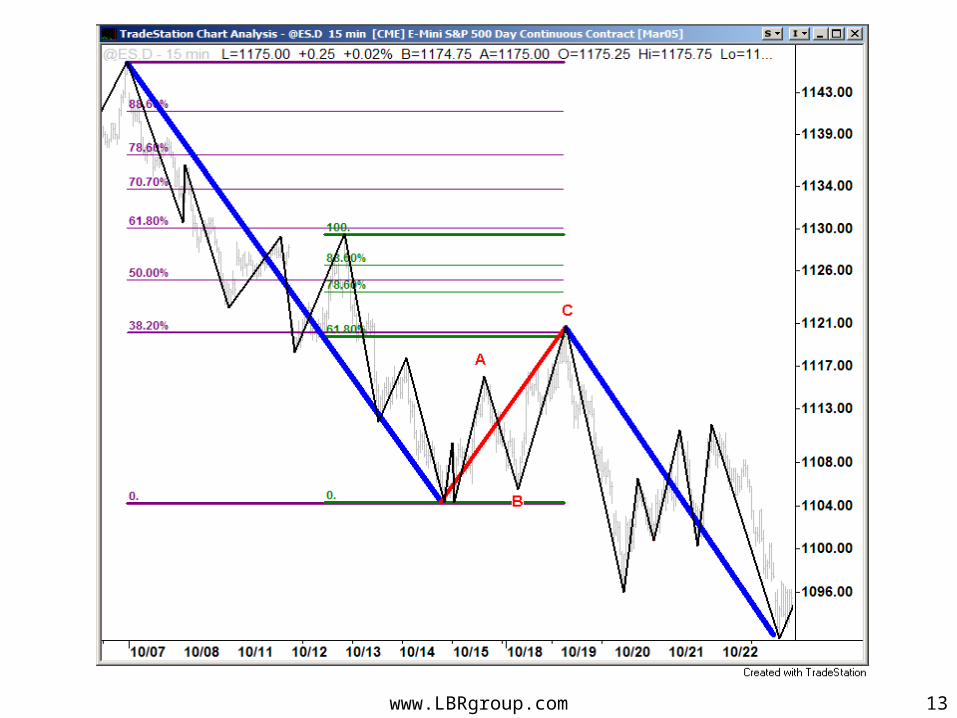
www.LBRgroup.com 13
www.LBRgroup.com 14
www.LBRgroup.com 15
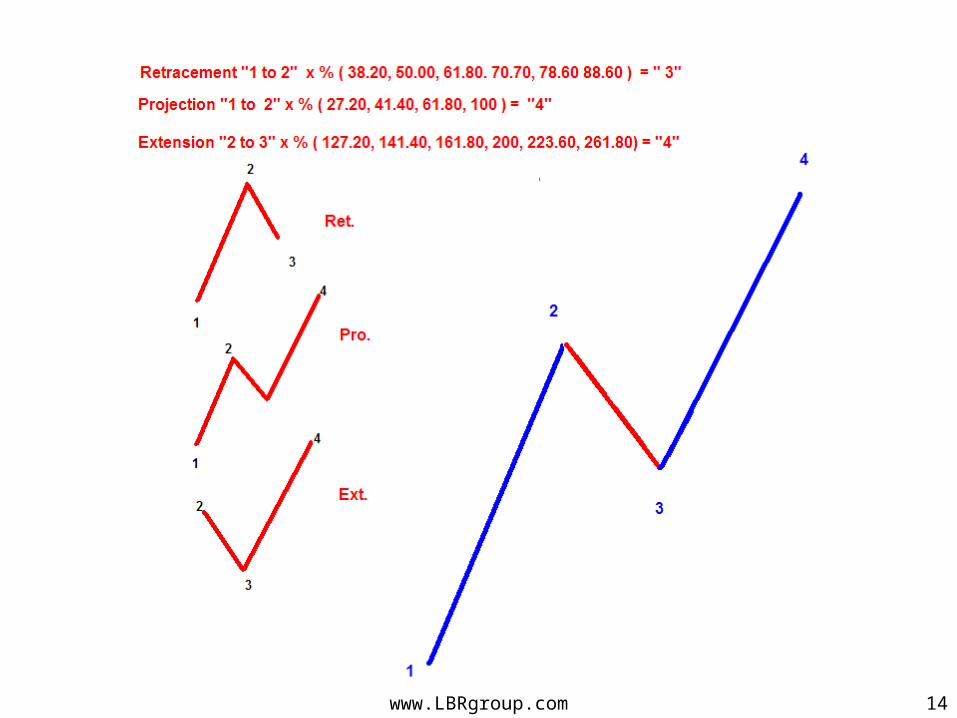
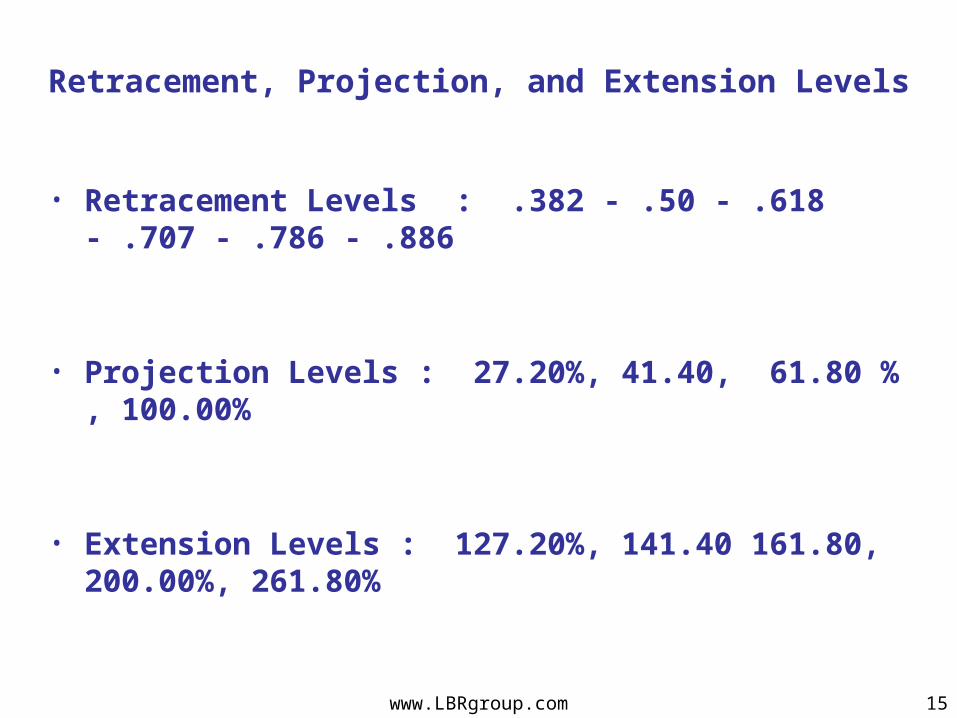
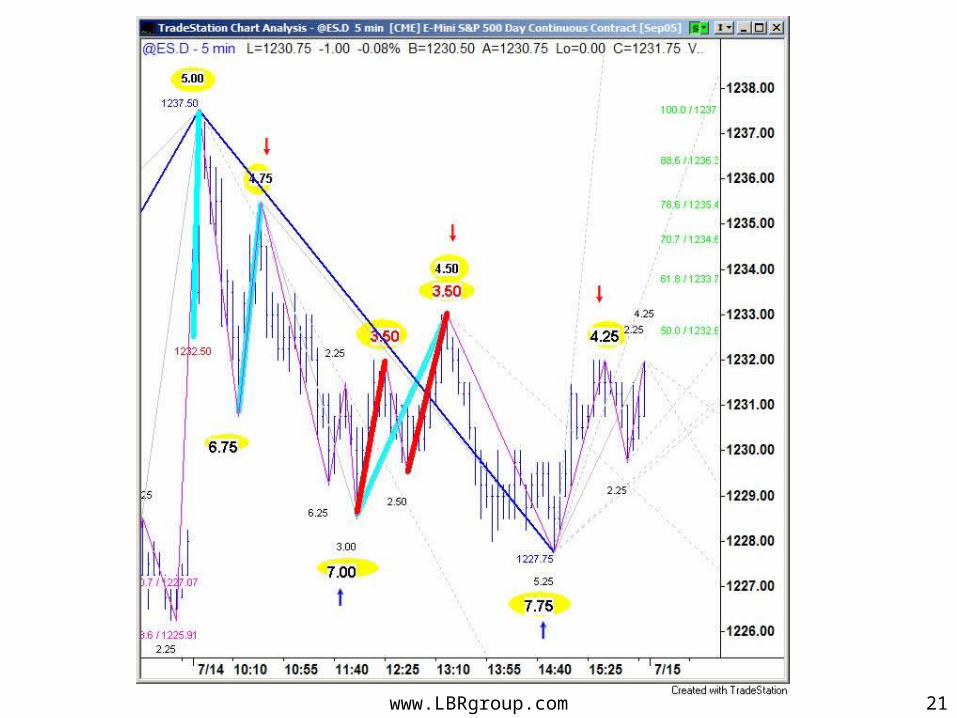
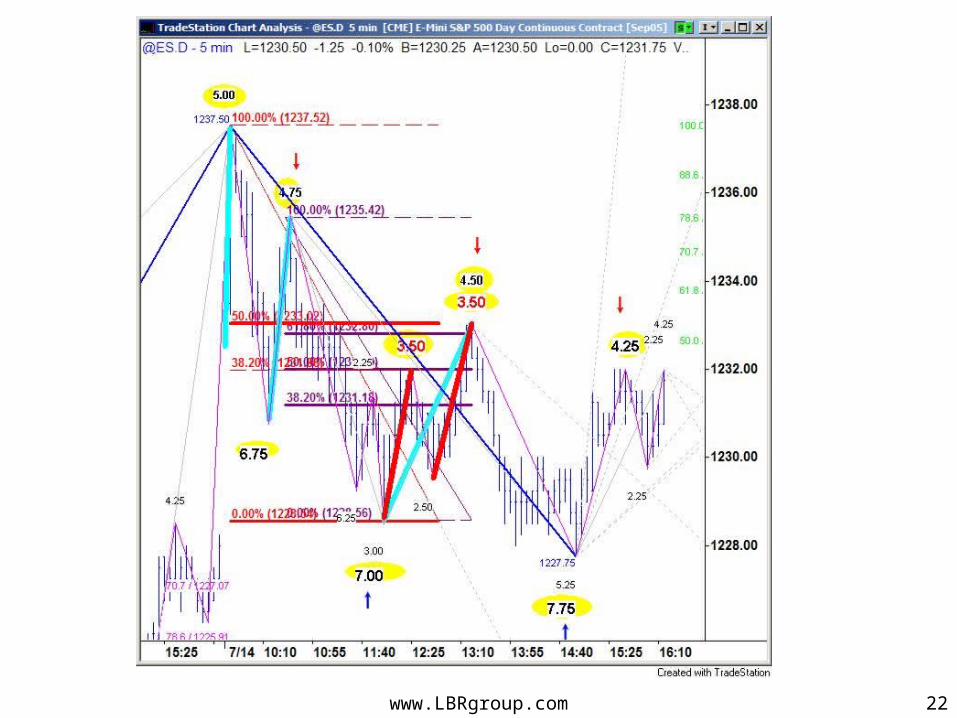
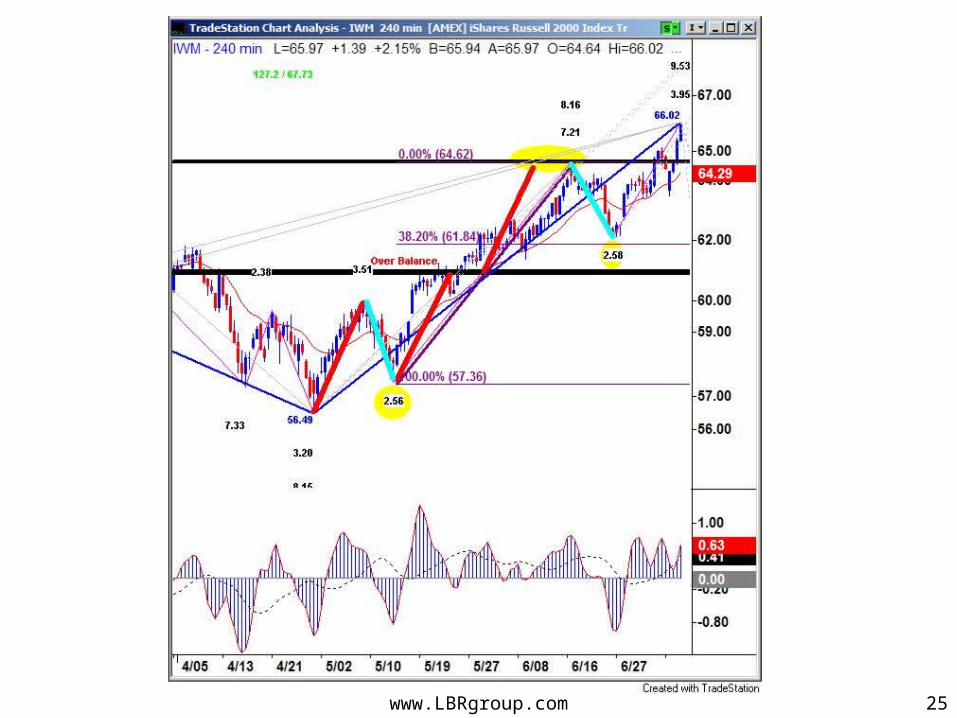
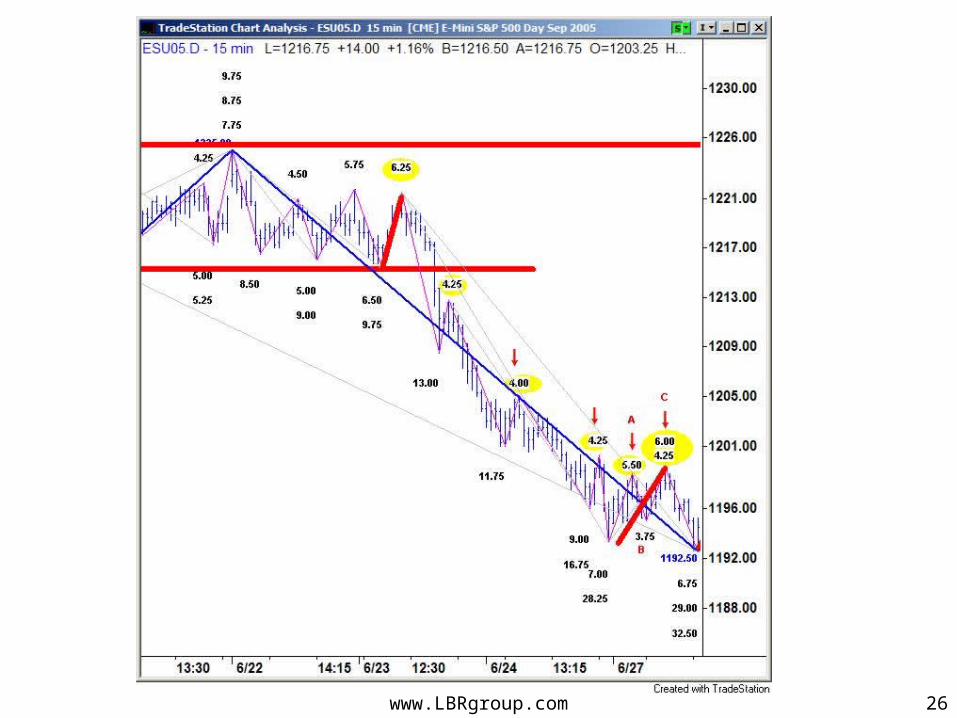
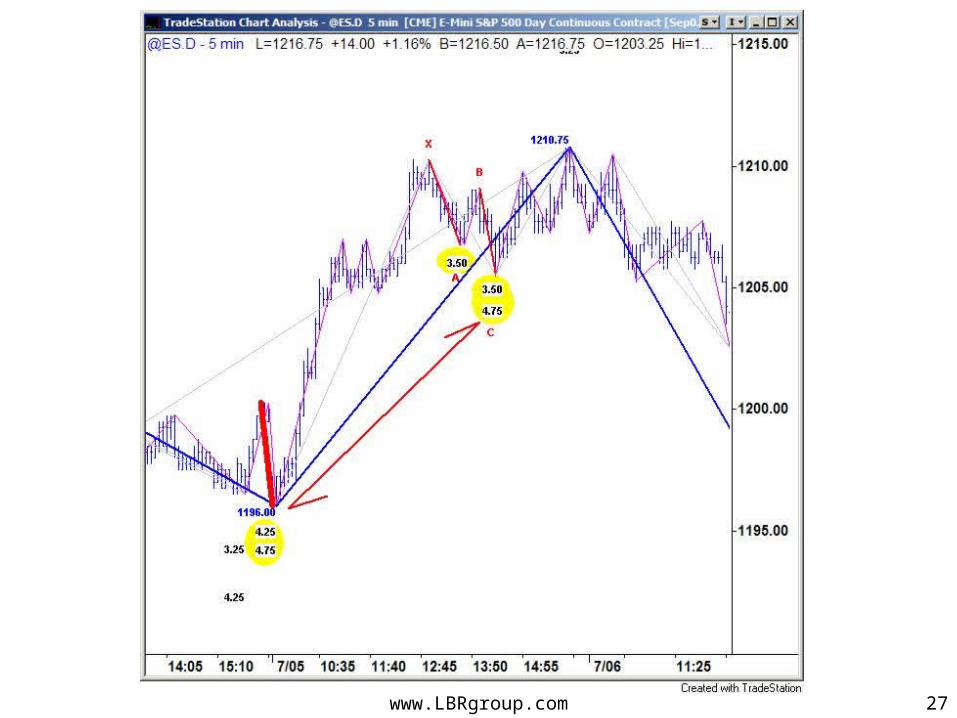
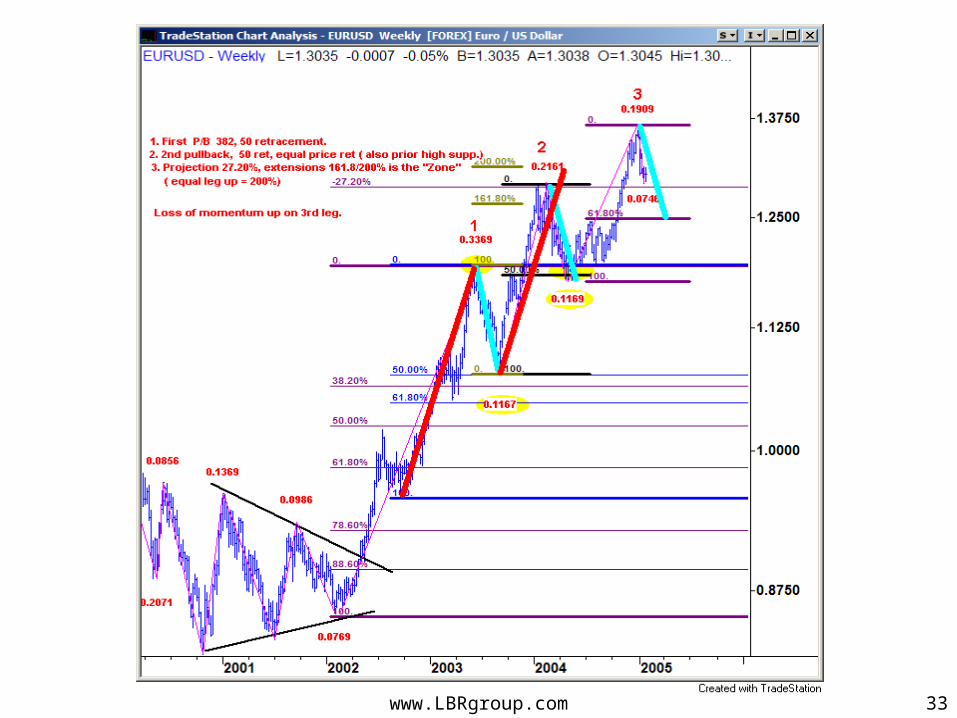
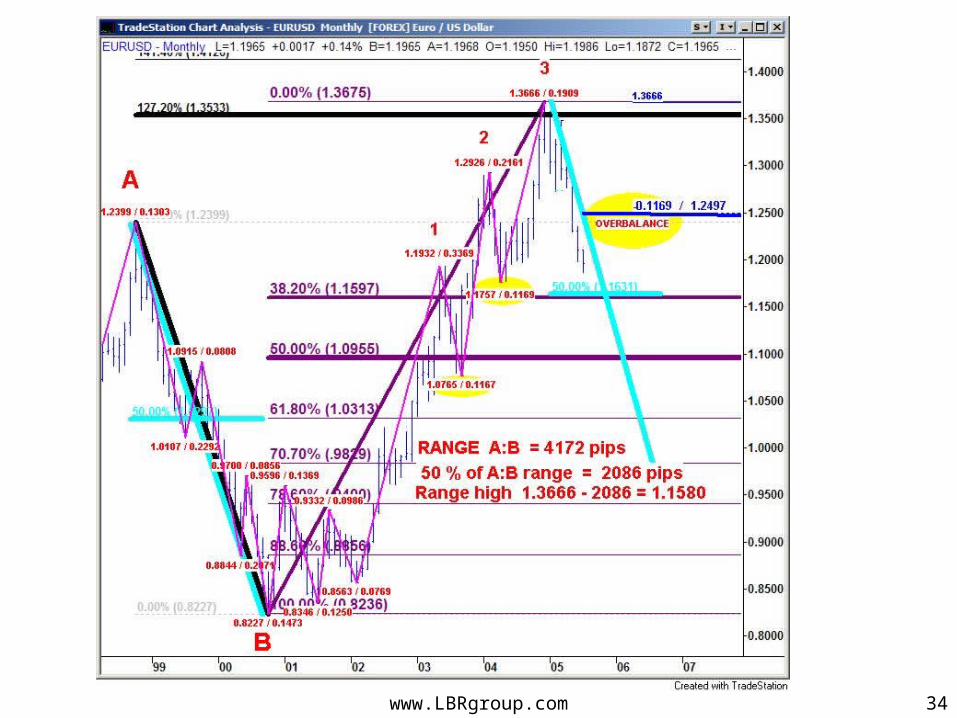
Retracement, Projection, and Extension Levels
• Retracement Levels : .382 - .50 - .618 - .707 - .786 - .886
• Projection Levels : 27.20%, 41.40, 61.80 % , 100.00%
• Extension Levels : 127.20%, 141.40 161.80, 200.00%, 261.80%
www.LBRgroup.com 16
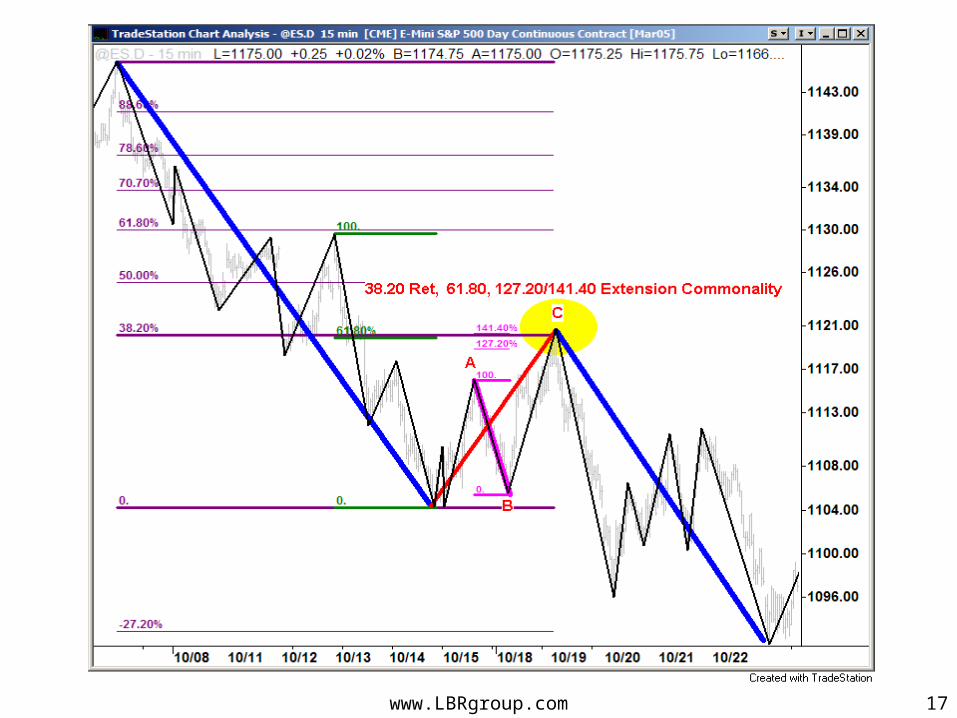
www.LBRgroup.com 17
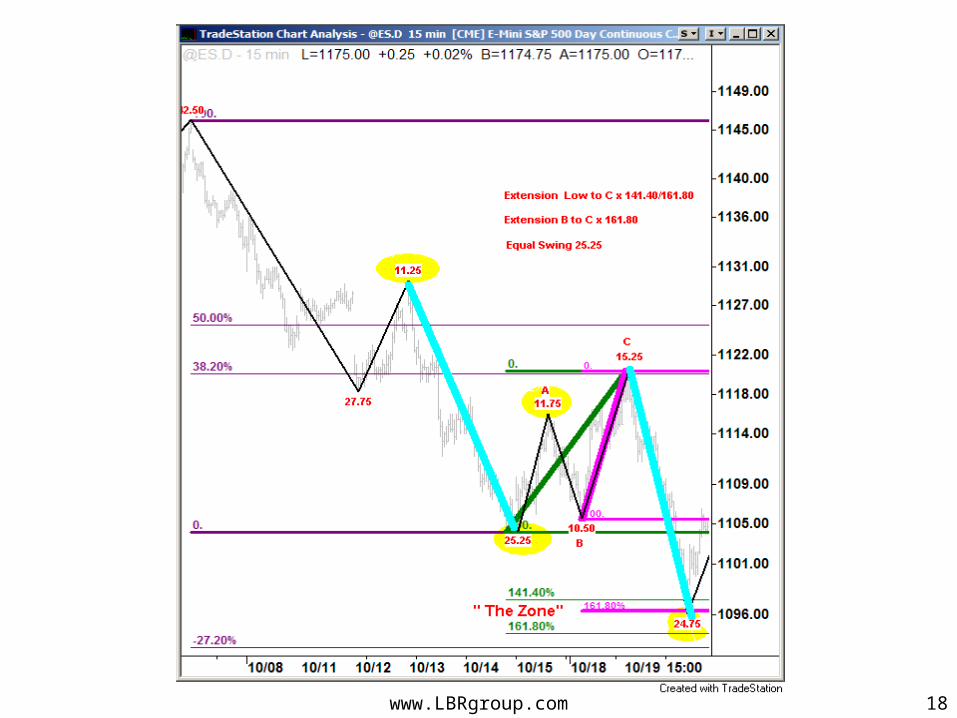
www.LBRgroup.com 18
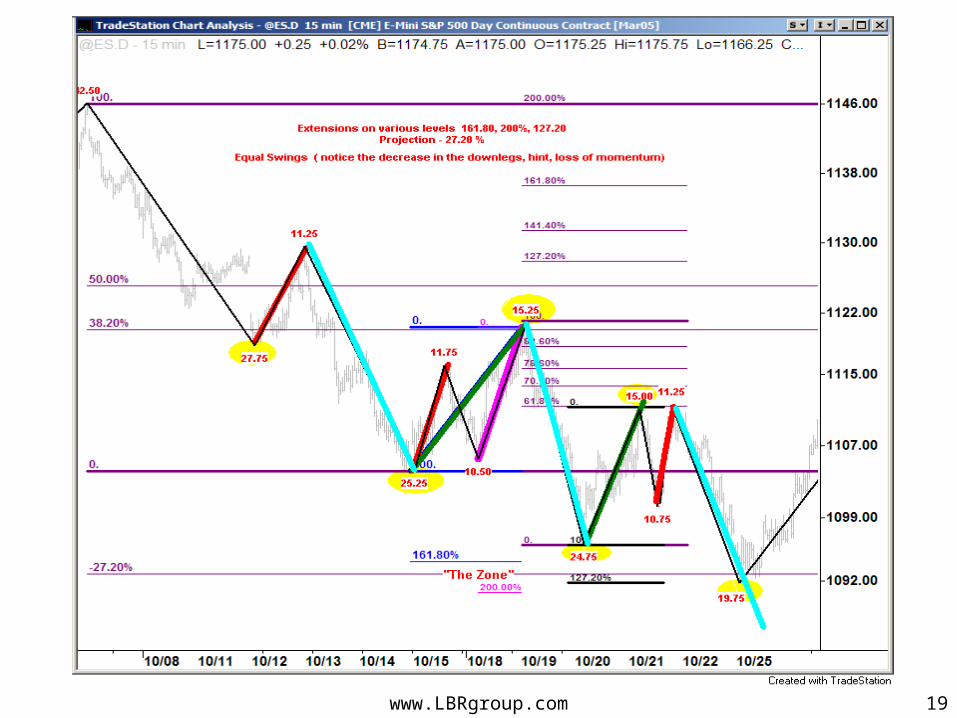
www.LBRgroup.com 19
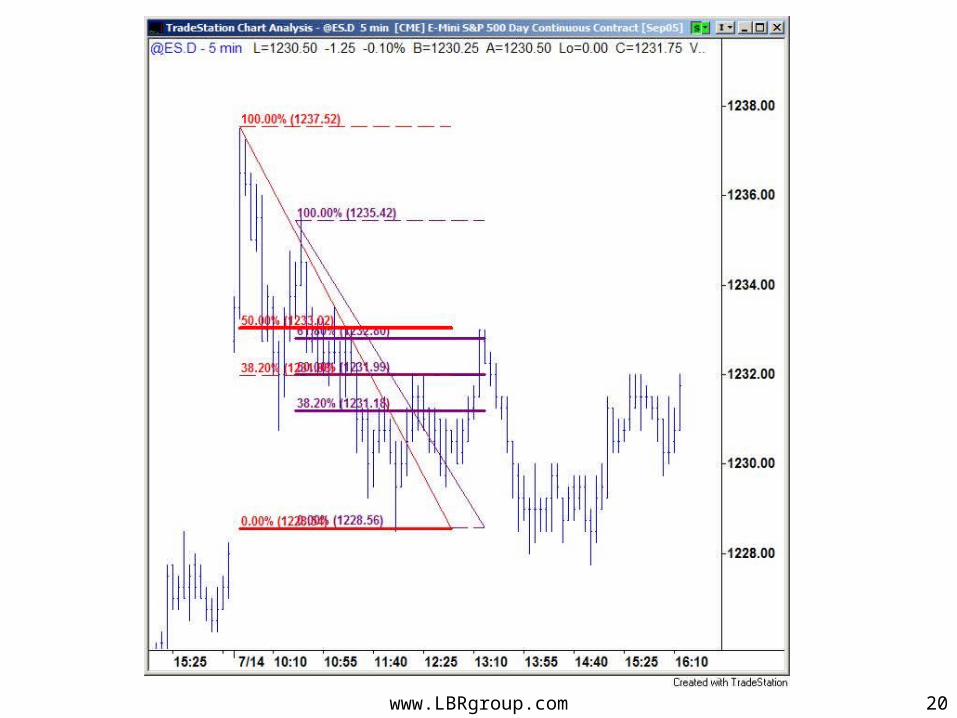
www.LBRgroup.com 20
www.LBRgroup.com 21
www.LBRgroup.com 22
www.LBRgroup.com 23
www.LBRgroup.com 24
www.LBRgroup.com 25
www.LBRgroup.com 26
www.LBRgroup.com 27
www.LBRgroup.com 28
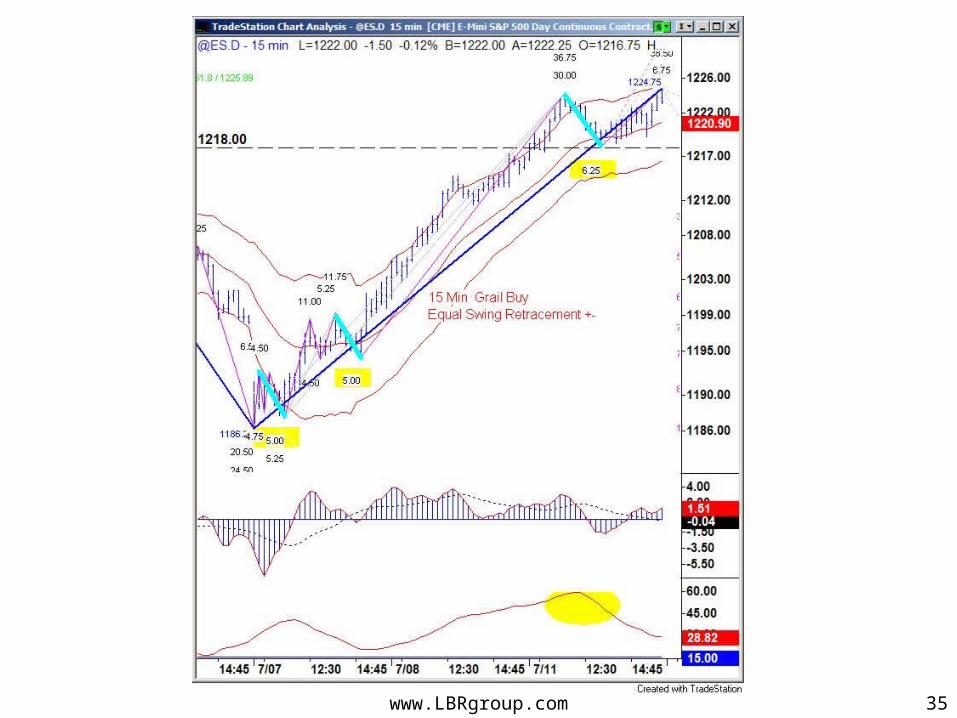
LBR Holy Grail Trade
• The 14 period ADX is above 30 and rising. This will identify a strongly trending market.
• Look for a retracement to the 20 period exponential moving average, the ADX will usually turn down on the retracement.
• Enter a buy or a sell when the price retraces to the 20 ema.
www.LBRgroup.com 29
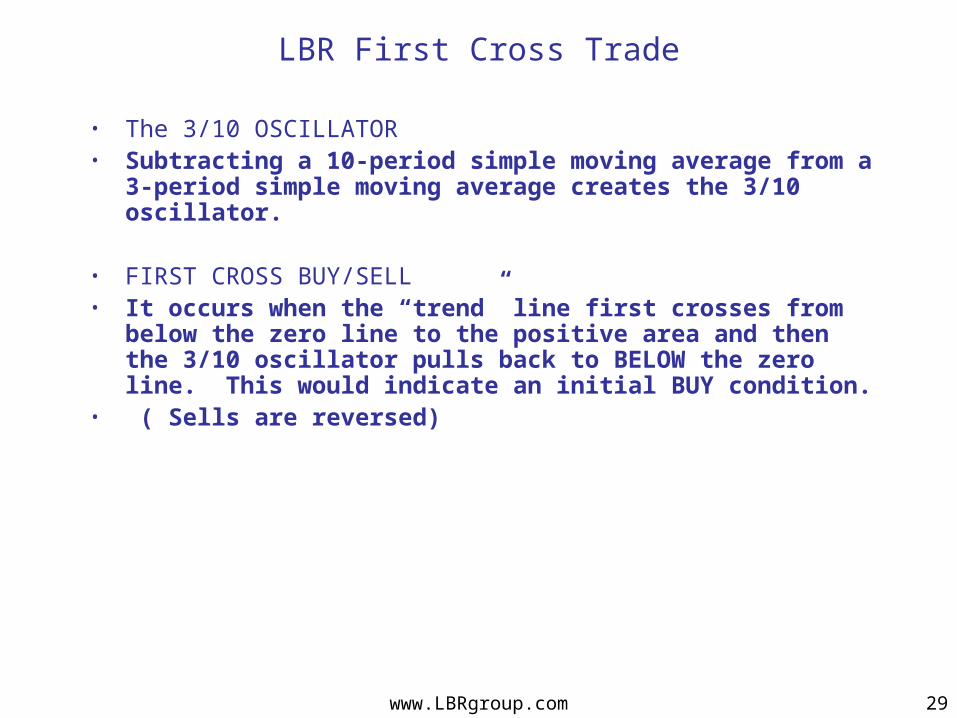
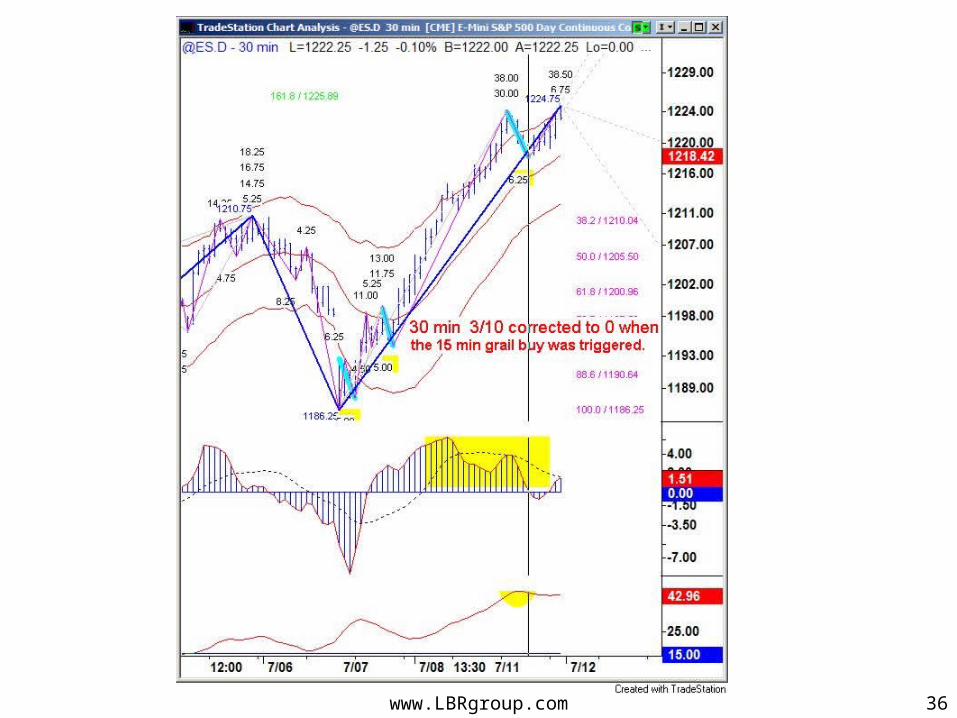
• The 3/10 OSCILLATOR • Subtracting a 10-period simple moving average from a
3-period simple moving average creates the 3/10 oscillator.
• FIRST CROSS BUY/SELL• It occurs when the “trend” line first crosses from
below the zero line to the positive area and then the 3/10 oscillator pulls back to BELOW the zero line. This would indicate an initial BUY condition.
• ( Sells are reversed)
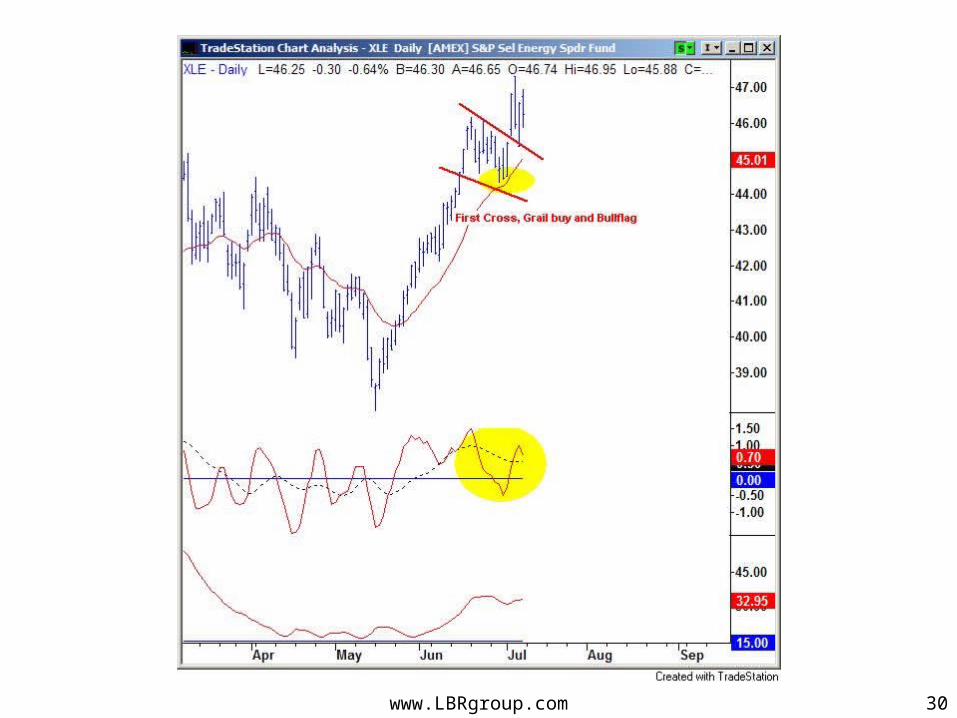
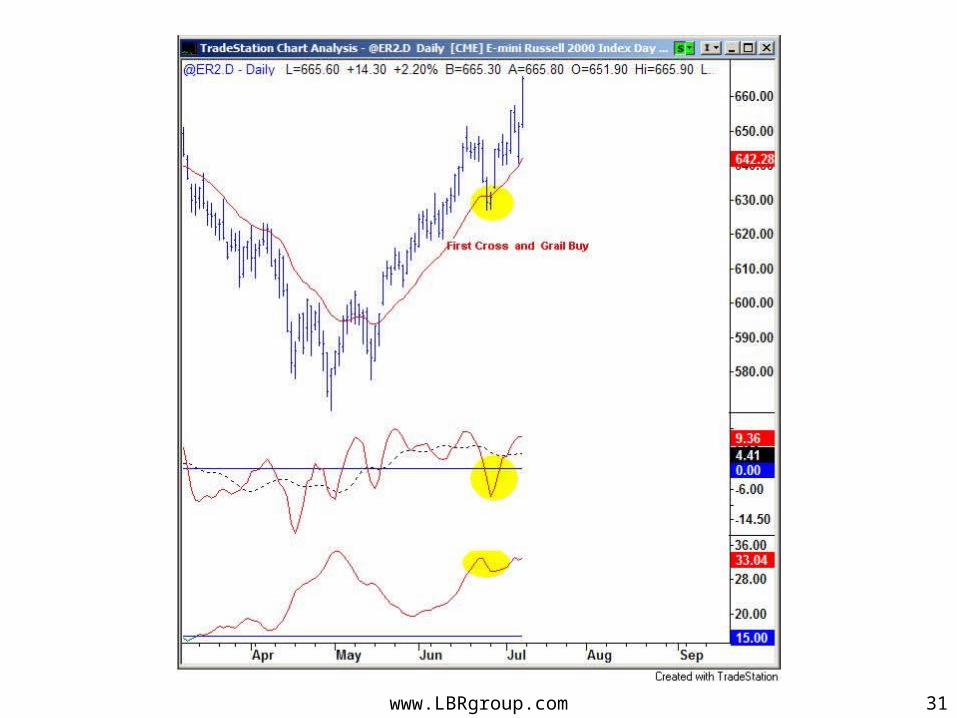
LBR First Cross Trade
www.LBRgroup.com 30
www.LBRgroup.com 31
www.LBRgroup.com 32
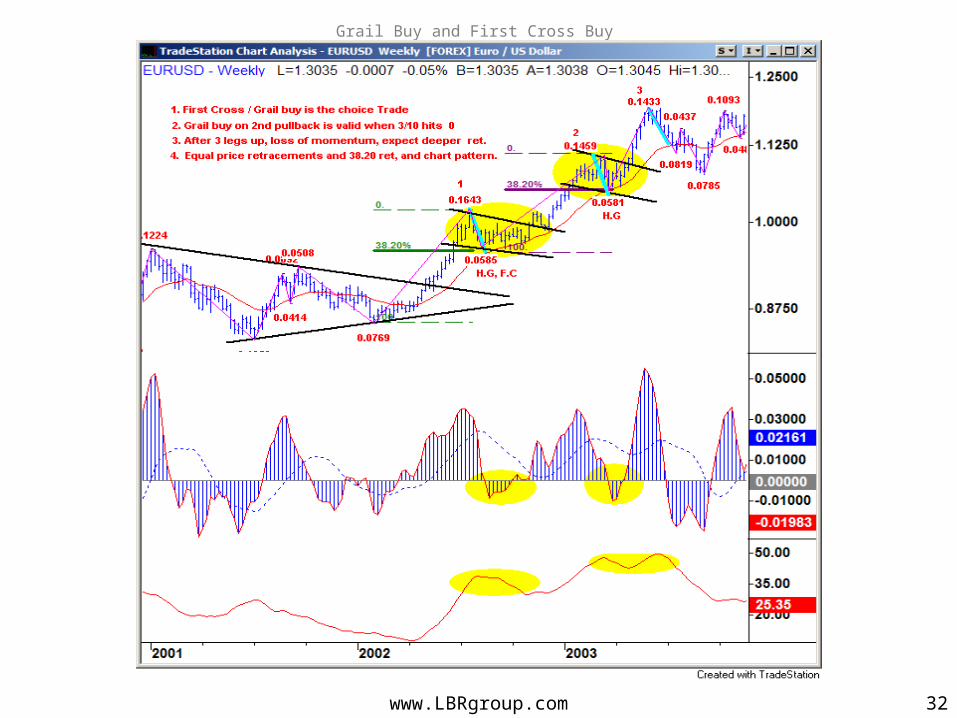
Grail Buy and First Cross Buy
www.LBRgroup.com 33
www.LBRgroup.com 34
www.LBRgroup.com 35
www.LBRgroup.com 36
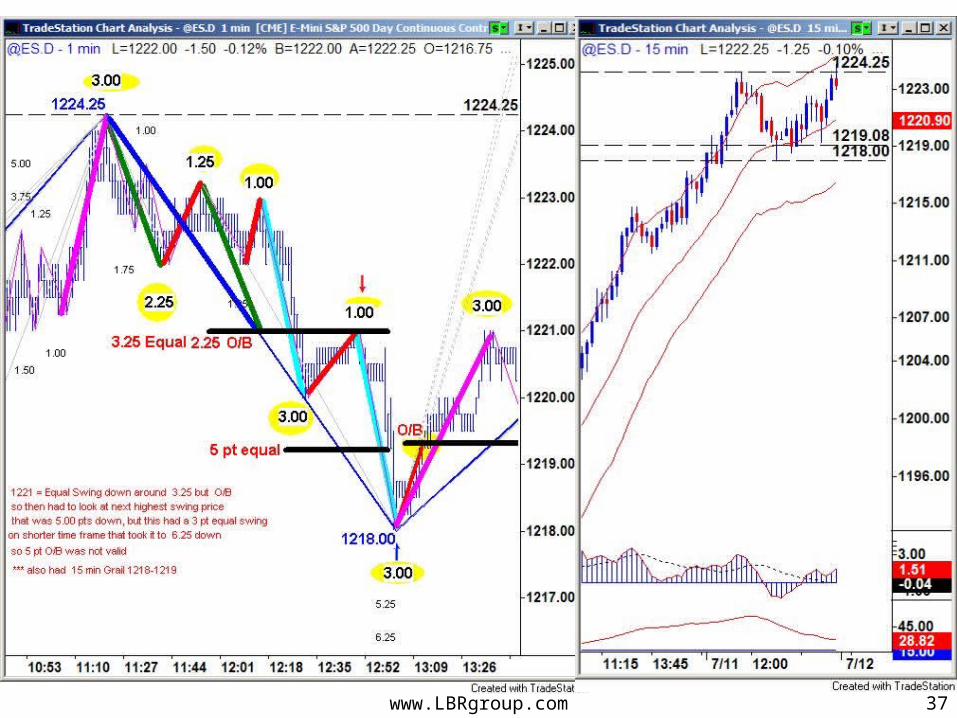
www.LBRgroup.com 37
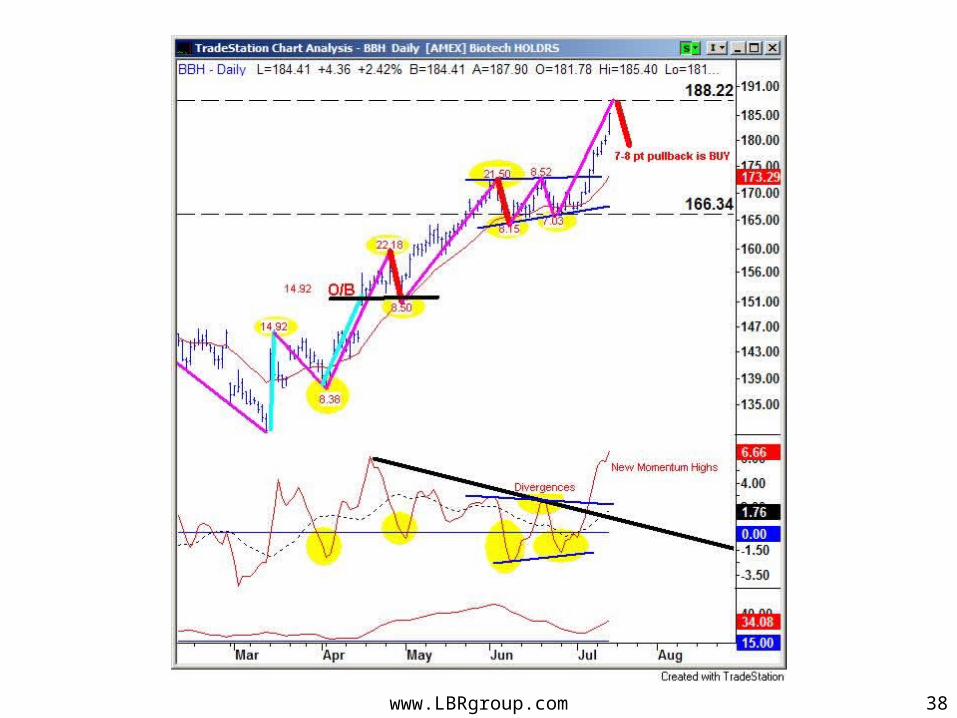
www.LBRgroup.com 38
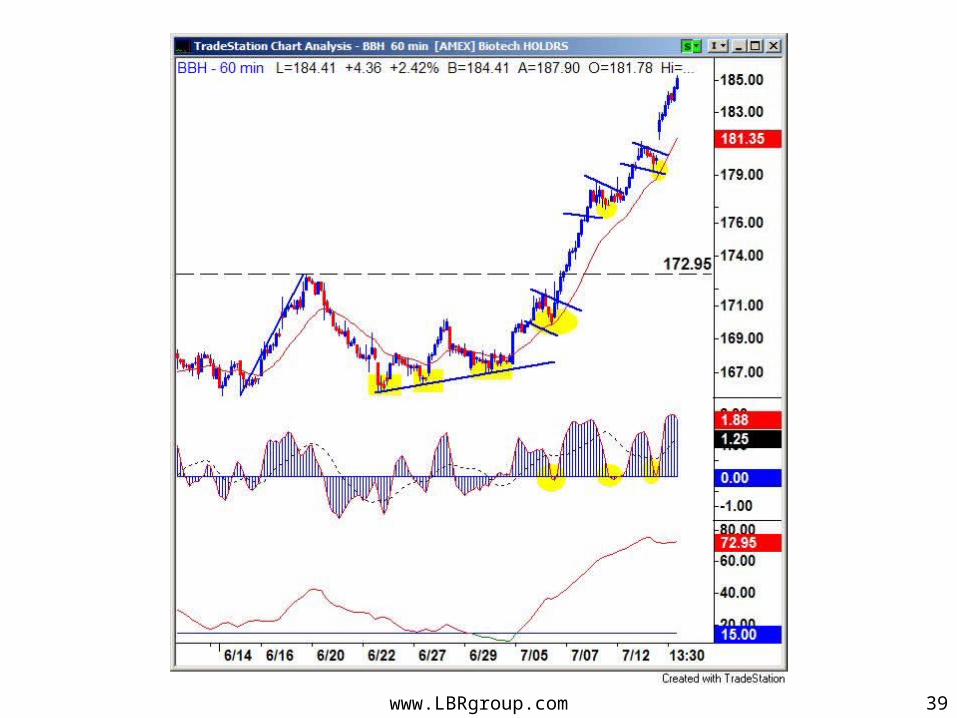
www.LBRgroup.com 39
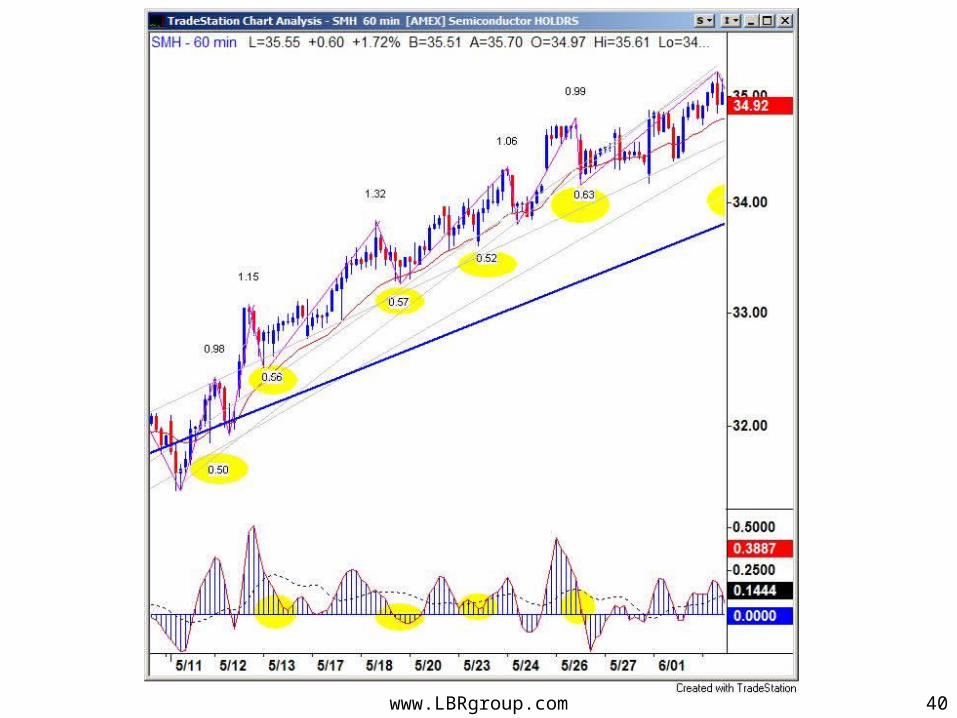
www.LBRgroup.com 40

www.LBRgroup.com 41
www.LBRgroup.com