Embed Size (px)
Citation preview

User’sManual Harmonic Measurement
Software (IEC 61000-3-2 Compliant)
IM 761922-06E6th Edition

Product RegistrationThank you for purchasing YOKOGAWA products.
YOKOGAWA provides registered users with a variety of information and services.Please allow us to serve you best by completing the product registration form accessible from our website.
http://tmi.yokogawa.com/
PIM 103-04E

iIM 761922-06E
Thank you for purchasing the Harmonic Measurement Software (Model 761922).This user’s manual describes the handling precautions, functions, and operating procedures of the Harmonic Measurement Software within the Harmonic/Flicker Measurement Software. To ensure correct use, please read this manual thoroughly before beginning operation.Keep this manual for quick reference in the event a question arises.For information about the handling precautions, functions, and operating procedures of WT3000 or WT3000E Precision Power Analyzer and the Voltage Fluctuation and Flicker Measurement Software as well as the handling and operating procedures for Windows, see the manuals for those products.
Notes• Thecontentsofthismanualaresubjecttochangewithoutpriornoticeasaresultof
continuing improvements to the instrument’s performance and functions. The figures given in this manual may differ from those that actually appear on your screen.
• Everyefforthasbeenmadeinthepreparationofthismanualtoensuretheaccuracyof its contents. However, should you have any questions or find any errors, please contact your nearest YOKOGAWA dealer.
• CopyingorreproducingalloranypartofthecontentsofthismanualwithoutYOKOGAWA’s permission is strictly prohibited.
• TheTCP/IPsoftwareofthisproductandthedocumentconcerningtheTCP/IPsoftware have been developed/created by YOKOGAWA based on the BSD Networking Software,Release1thathasbeenlicensedfromUniversityofCalifornia.
Trademarks• Microsoft,Windows,WindowsVista,Windows7,Windows8,Windows8.1,Windows
10,andExcelareeitherregisteredtrademarksortrademarksofMicrosoftCorporationin the United States and/or other countries.
• AdobeandAcrobatareeitherregisteredtrademarksortrademarksofAdobeSystemsIncorporated.
• Othercompanyandproductnamesareregisteredtrademarksortrademarksoftheirrespective holders.
• Forpurposesofthismanual,the®andTMsymbolsdonotaccompanytheirrespective registered trademark names or trademark names.
Revisions1st Edition: June 20092nd Edition October 20103rd Edition April 20124th Edition: June 20155th Edition: July 20166th Edition: October 2017
6th Edition : October 2017 (YMI)AllRightsReserved,Copyright©2009,YokogawaElectricCorporationAllRightsReserved,Copyright©2010,YokogawaTest&MeasurementCorporation

ii IM 761922-06E
Notes about Using This Software
Storing the CDKeeptheoriginalCDforthissoftwareinasafeplace.Tousethissoftware,installitonaPCharddisk,andrunitfromthePC.
Using the Software• DonotoperatetheWTwhileusingthissoftware.Doingsomaycauseerrors.• DisablethePC’sstandbymode.WhenaPCgoesintostandbymode,itmaystopthis
software’s operations.• ThissoftwarecanonlycontroloneWTatatime.Also,itcannotconnectmultiplePCs
to the same WT.• IfaconnectionerrordisruptstheconnectionbetweentheWTandthePC,turntheWT
OFF and then ON again.
iiiIM 761922-06E
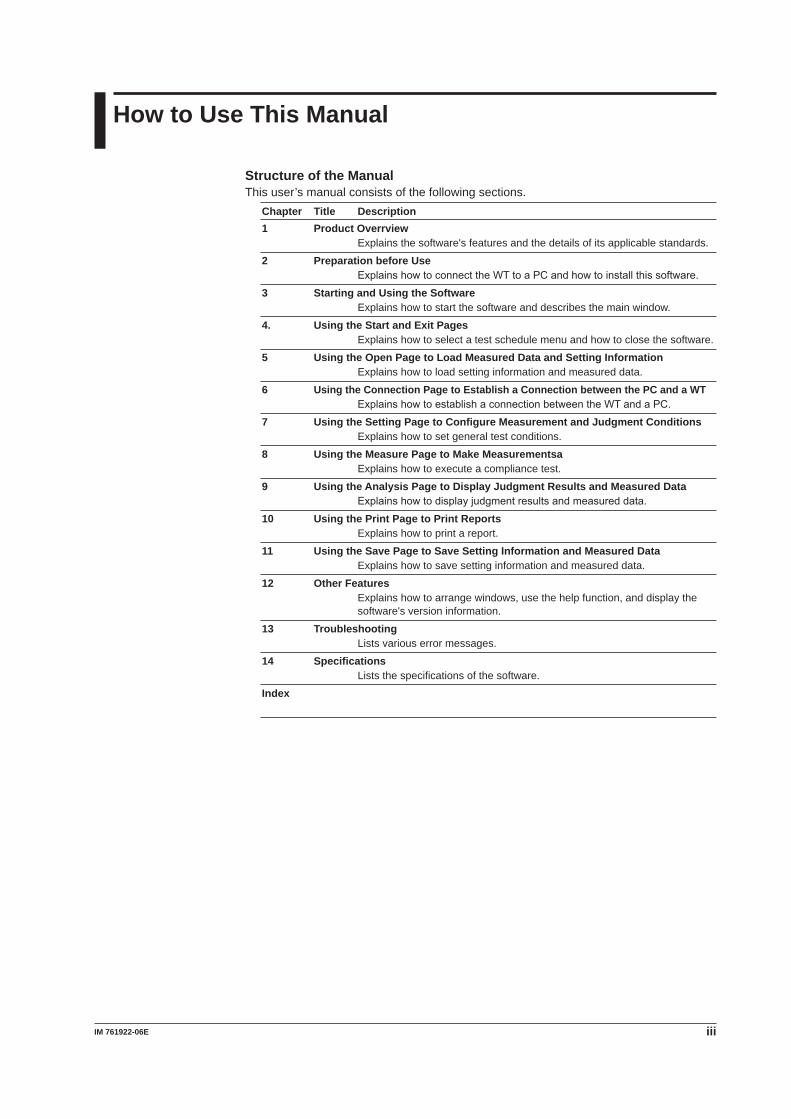
How to Use This Manual
Structure of the ManualThis user’s manual consists of the following sections.
Chapter Title Description1 Product Overrview Explains the software's features and the details of its applicable standards.
2 Preparation before Use ExplainshowtoconnecttheWTtoaPCandhowtoinstallthissoftware.
3 Starting and Using the Software Explains how to start the software and describes the main window.
4. Using the Start and Exit Pages Explains how to select a test schedule menu and how to close the software.
5 Using the Open Page to Load Measured Data and Setting Information Explains how to load setting information and measured data.
6 Using the Connection Page to Establish a Connection between the PC and a WT ExplainshowtoestablishaconnectionbetweentheWTandaPC.
7 Using the Setting Page to Configure Measurement and Judgment Conditions Explains how to set general test conditions.
8 Using the Measure Page to Make Measurementsa Explains how to execute a compliance test.
9 Using the Analysis Page to Display Judgment Results and Measured Data Explainshowtodisplayjudgmentresultsandmeasureddata.
10 Using the Print Page to Print Reports Explains how to print a report.
11 Using the Save Page to Save Setting Information and Measured Data Explains how to save setting information and measured data.
12 Other Features Explains how to arrange windows, use the help function, and display the
software's version information.
13 Troubleshooting Lists various error messages.
14 Specifications Lists the specifications of the software.
Index
iv IM 761922-06E
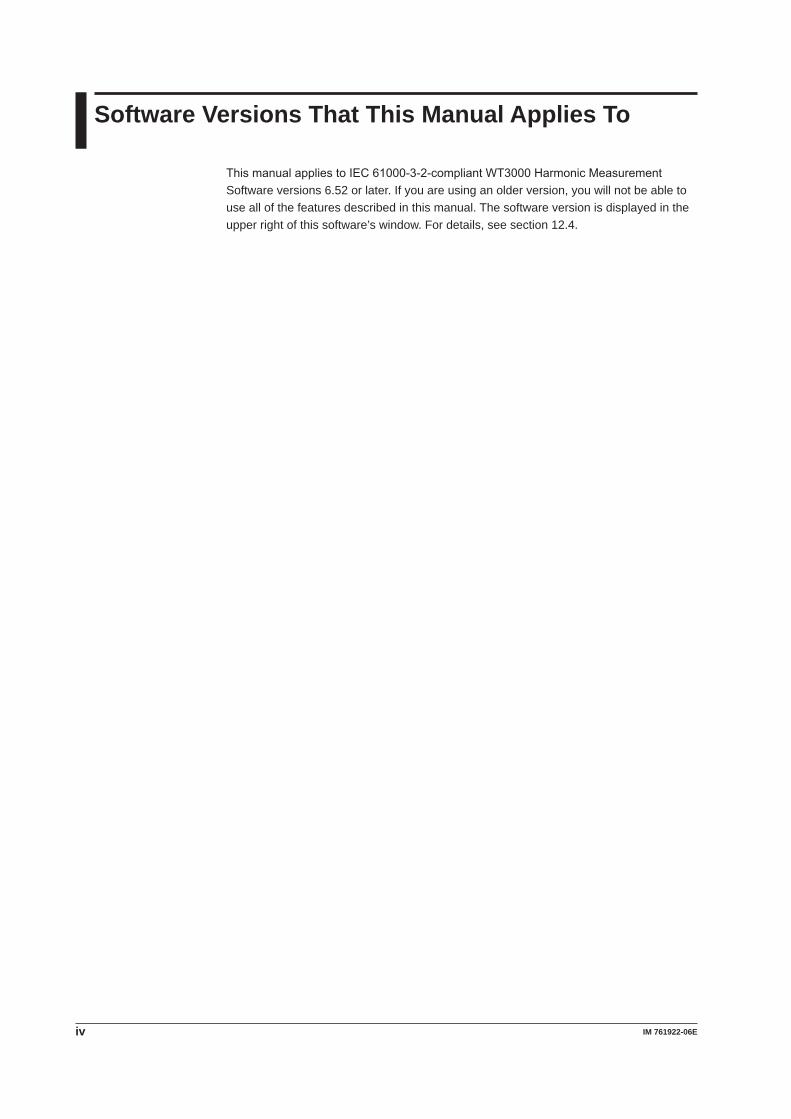
Software Versions That This Manual Applies To
ThismanualappliestoIEC61000-3-2-compliantWT3000HarmonicMeasurementSoftware versions 6.52 or later. If you are using an older version, you will not be able to use all of the features described in this manual. The software version is displayed in the upper right of this software’s window. For details, see section 12.4.

vIM 761922-06E
Terms and Conditions of the Software License
YokogawaElectricCorporationandYokogawaTest&MeasurementCorporation,aJapanesecorporation(hereinaftercalled“Yokogawa”),grantspermissiontousethisYokogawaSoftwareProgram(hereinaftercalledthe“LicensedSoftware”)totheLicenseeontheconditionsthattheLicenseeagreestothetermsandconditionsstipulatedin Article 1 hereof. You,astheLicensee(hereinaftercalled“Licensee”),shallagreetothefollowingtermsandconditionsforthesoftwarelicense(hereinaftercalledthe“Agreement”)basedon the use intended for the Licensed Software. Please note that Yokogawa grants the Licensee permission to use the Licensed Software under the terms and conditions herein and in no event shall Yokogawa intend to sell or transfer the Licensed Software to the Licensee.Licensed Software Name: Harmonic/Flicker Measurement Software (Model 761922)Number of License: 1
Article1(ScopeCoveredbytheseTermsandConditions)1.1 The terms and conditions stipulated herein shall be applied to any Licensee who purchases the Licensed Software on the condition that the Licensee consents to agree
to the terms and conditions stipulated herein.1.2The“LicensedSoftware”hereinshallmeanandincludeallapplicableprogramsanddocumentation,withoutlimitation,allproprietarytechnology,algorithms,andknow-
how such as a factor, invariant or process contained therein.
Article 2 (Grant of License)2.1 Yokogawa grants the Licensee, for the purpose of single use, non-exclusive and non-transferable license of the Licensed Software with the license fee separately
agreed upon by both parties. 2.2 The Licensee is, unless otherwise agreed in writing by Yokogawa, not entitled to copy, change, sell, distribute, transfer, or sublicense the Licensed Software.2.3 The Licensed Software shall not be copied in whole or in part except for keeping one (1) copy for back-up purposes. The Licensee shall secure or supervise the copy
of the Licensed Software by the Licensee itself with great, strict, and due care. 2.4 In no event shall the Licensee dump, reverse assemble, reverse compile, or reverse engineer the Licensed Software so that the Licensee may translate the Licensed
Software into other programs or change it into a man-readable form from the source code of the Licensed Software. Unless otherwise separately agreed by Yokogawa, Yokogawa shall not provide the Licensee the source code for the Licensed Software.
2.5 The Licensed Software and its related documentation shall be the proprietary property or trade secret of Yokogawa or a third party which grants Yokogawa the rights. In no event shall the Licensee be transferred, leased, sublicensed, or assigned any rights relating to the Licensed Software.
2.6 Yokogawa may use or add copy protection in or onto the Licensed Software. In no event shall the Licensee remove or attempt to remove such copy protection.2.7TheLicensedSoftwaremayincludeasoftwareprogramlicensedforre-usebyathirdparty(hereinaftercalled“ThirdPartySoftware”,whichmayincludeanysoftware
program from affiliates of Yokogawa made or coded by themselves.) In the case that Yokogawa is granted permission to sublicense to third parties by any licensors (sub-licensor) of the Third Party Software pursuant to different terms and conditions than those stipulated in this Agreement, the Licensee shall observe such terms and conditions of which Yokogawa notifies the Licensee in writing separately.
2.8InnoeventshalltheLicenseemodify,removeordeleteacopyrightnoticeofYokogawaanditslicensercontainedintheLicensedSoftware,includinganycopythereof.
Article 3 (Restriction of Specific Use)3.1 The Licensed Software shall not be intended specifically to be designed, developed, constructed, manufactured, distributed or maintained for the purpose of the
following events: a) Operation of any aviation, vessel, or support of those operations from the ground;, b) Operation of nuclear products and/or facilities;, c) Operation of nuclear weapons and/or chemical weapons and/or biological weapons; or d) Operation of medical instrumentation directly utilized for humankind or the human body.3.2 Even if the Licensee uses the Licensed Software for the purposes in the preceding Paragraph 3.1, Yokogawa has no liability to or responsibility for any demand or
damage arising out of the use or operations of the Licensed Software, and the Licensee agrees, on its own responsibility, to solve and settle the claims and damages and to defend, indemnify or hold Yokogawa totally harmless, from or against any liabilities, losses, damages and expenses (including fees for recalling the Products and reasonable attorney’s fees and court costs), or claims arising out of and related to the above-said claims and damages.
Article 4 (Warranty)4.1TheLicenseeshallagreethattheLicensedSoftwareshallbeprovidedtotheLicenseeonan“asis”basiswhendelivered.Ifdefect(s),suchasdamagetothemedium
of the Licensed Software, attributable to Yokogawa is found, Yokogawa agrees to replace, free of charge, any Licensed Software on condition that the defective Licensed Software shall be returned to Yokogawa’s specified authorized service facility within seven (7) days after opening the Package at the Licensee’s expense. As theLicensedSoftwareisprovidedtotheLicenseeonan“asis”basiswhendelivered,innoeventshallYokogawawarrantthatanyinformationonorintheLicensedSoftware, including without limitation, data on computer programs and program listings, be completely accurate, correct, reliable, or the most updated.
4.2 Notwithstanding the preceding Paragraph 4.1, when third party software is included in the Licensed Software, the warranty period and terms and conditions that apply shall be those established by the provider of the third party software.
4.3WhenYokogawadecidesinitsownjudgementthatitisnecessary,YokogawamayfromtimetotimeprovidetheLicenseewithRevisionupgradesandVersionupgradesseparatelyspecifiedbyYokogawa(hereinaftercalled“Updates”).
4.4 Notwithstanding the preceding Paragraph 4.3, in no event shall Yokogawa provide Updates where the Licensee or any third party conducted renovation or improvement of the Licensed Software.
4.5THEFOREGOINGWARRANTIESAREEXCLUSIVEAND INLIEUOFALLOTHERWARRANTIESOFQUALITYANDPERFORMANCE,WRITTEN,ORAL,ORIMPLIED,ANDALLOTHERWARRANTIESINCLUDINGANYIMPLIEDWARRANTIESOFMERCHANTABILITYORFITNESSFORAPARTICULARPURPOSEAREHEREBYDISCLAIMEDBYYOKOGAWAANDALLTHIRDPARTIESLICENSINGTHIRDPARTYSOFTWARETOYOKOGAWA.
4.6CorrectionofnonconformityinthemannerandfortheperiodoftimeprovidedaboveshallbetheLicensee’ssoleandexclusiveremedyforanyfailureofYokogawatocomply with its obligations and shall constitute fulfillment of all liabilities of Yokogawa and any third party licensing the Third Party Software to Yokogawa (including any liability for direct, indirect, special, incidental or consequential damages) whether in warranty, contract, tort (including negligence but excluding willful conduct or gross negligence by Yokogawa) or otherwise with respect to or arising out of the use of the Licensed Software.
Article 5 (Infringement)5.1Ifandwhenanythirdpartyshoulddemandinjunction,initiatealawsuit,ordemandcompensationfordamagesagainsttheLicenseeunderpatentright(includingutility
model right, design patent, and trade mark), copy right, and any other rights relating to any of the Licensed Software, the Licensee shall notify Yokogawa in writing to that effect without delay.
5.2 In the case of the preceding Paragraph 5.1, the Licensee shall assign to Yokogawa all of the rights to defend the Licensee and to negotiate with the claiming party. Furthermore, the Licensee shall provide Yokogawa with necessary information or any other assistance for Yokogawa’s defense and negotiation. If and when such a claimshouldbeattributabletoYokogawa,subjecttothewrittennoticetoYokogawastatedintheprecedingParagraph5.1,YokogawashalldefendtheLicenseeandnegotiatewiththeclaimingpartyatYokogawa’scostandexpenseandberesponsibleforthefinalsettlementorjudgmentgrantedtotheclaimingpartyintheprecedingParagraph 5.1.
5.3Whenanyassertionorallegationoftheinfringementofthethirdparty’srightsdefinedinParagraph5.1ismade,orwhenatYokogawa’sjudgmentthereispossibilityofsuch assertion or allegation, Yokogawa will, at its own discretion, take any of the following countermeasures at Yokogawa’s cost and expense.
a) To acquire the necessary right from a third party which has lawful ownership of the right so that the Licensee will be able to continue to use the Licensed Software; b) To replace the Licensed Software with an alternative one which avoids the infringement; or c) To remodel the Licensed Software so that the Licensed Software can avoid the infringement of such third party’s right.5.4 If and when Yokogawa fails to take either of the countermeasures as set forth in the preceding subparagraphs of Paragraph 5.3, Yokogawa shall indemnify the Licensee
only by paying back the price amount of the Licensed Software which Yokogawa has received from the Licensee. THE FOREGOING PARAGRAPHS STATE THE ENTIRELIABILITYOFYOKOGAWAANDANYTHIRDPARTYLICENSINGTHIRDPARTYSOFTWARETOYOKOGAWAWITHRESPECTTOINFRINGEMENTOFTHEINTELLECTUALPROPERTYRIGHTSINCLUDINGBUTNOTLIMITEDTO,PATENTANDCOPYRIGHT.
vi IM 761922-06E
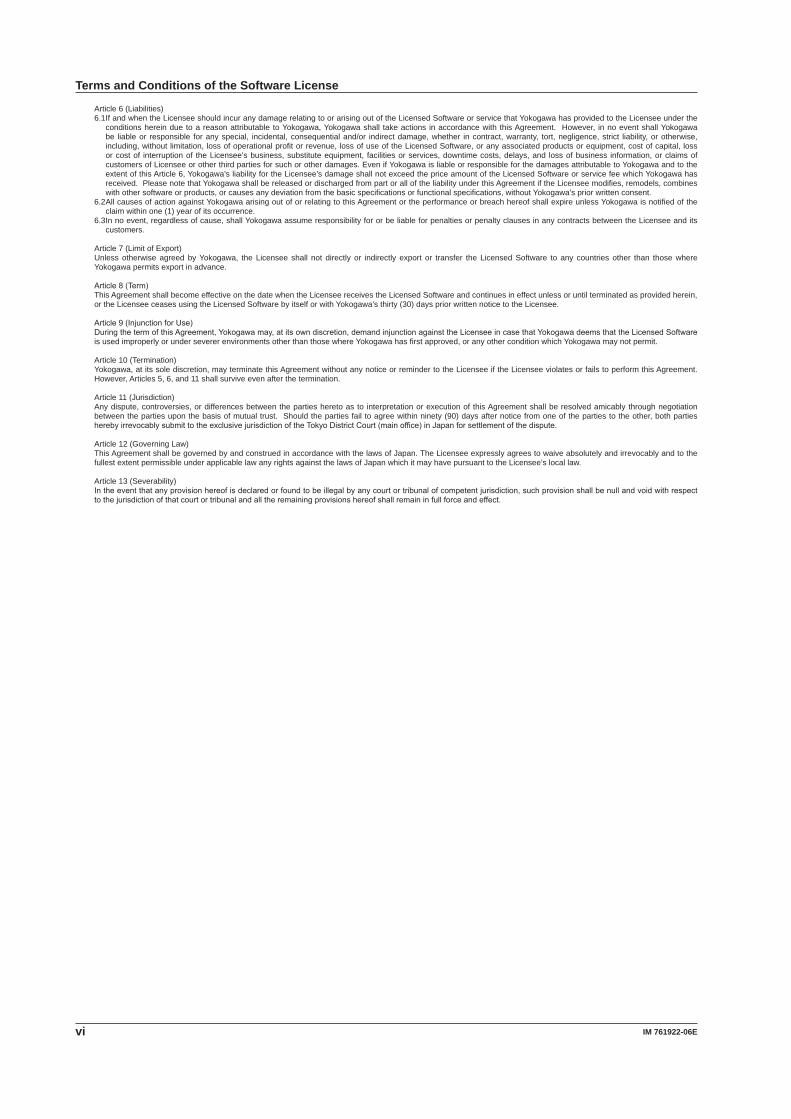
Article 6 (Liabilities)6.1 If and when the Licensee should incur any damage relating to or arising out of the Licensed Software or service that Yokogawa has provided to the Licensee under the
conditions herein due to a reason attributable to Yokogawa, Yokogawa shall take actions in accordance with this Agreement. However, in no event shall Yokogawa be liable or responsible for any special, incidental, consequential and/or indirect damage, whether in contract, warranty, tort, negligence, strict liability, or otherwise, including, without limitation, loss of operational profit or revenue, loss of use of the Licensed Software, or any associated products or equipment, cost of capital, loss or cost of interruption of the Licensee’s business, substitute equipment, facilities or services, downtime costs, delays, and loss of business information, or claims of customers of Licensee or other third parties for such or other damages. Even if Yokogawa is liable or responsible for the damages attributable to Yokogawa and to the extent of this Article 6, Yokogawa’s liability for the Licensee’s damage shall not exceed the price amount of the Licensed Software or service fee which Yokogawa has received. Please note that Yokogawa shall be released or discharged from part or all of the liability under this Agreement if the Licensee modifies, remodels, combines with other software or products, or causes any deviation from the basic specifications or functional specifications, without Yokogawa’s prior written consent.
6.2 All causes of action against Yokogawa arising out of or relating to this Agreement or the performance or breach hereof shall expire unless Yokogawa is notified of the claim within one (1) year of its occurrence.
6.3 In no event, regardless of cause, shall Yokogawa assume responsibility for or be liable for penalties or penalty clauses in any contracts between the Licensee and its customers.
Article 7 (Limit of Export)Unless otherwise agreed by Yokogawa, the Licensee shall not directly or indirectly export or transfer the Licensed Software to any countries other than those where Yokogawa permits export in advance.
Article8(Term)This Agreement shall become effective on the date when the Licensee receives the Licensed Software and continues in effect unless or until terminated as provided herein, or the Licensee ceases using the Licensed Software by itself or with Yokogawa’s thirty (30) days prior written notice to the Licensee.
Article9(InjunctionforUse)DuringthetermofthisAgreement,Yokogawamay,atitsowndiscretion,demandinjunctionagainsttheLicenseeincasethatYokogawadeemsthattheLicensedSoftwareis used improperly or under severer environments other than those where Yokogawa has first approved, or any other condition which Yokogawa may not permit.
Article 10 (Termination)Yokogawa, at its sole discretion, may terminate this Agreement without any notice or reminder to the Licensee if the Licensee violates or fails to perform this Agreement. However, Articles 5, 6, and 11 shall survive even after the termination.
Article 11 (Jurisdiction)Any dispute, controversies, or differences between the parties hereto as to interpretation or execution of this Agreement shall be resolved amicably through negotiation between the parties upon the basis of mutual trust. Should the parties fail to agree within ninety (90) days after notice from one of the parties to the other, both parties herebyirrevocablysubmittotheexclusivejurisdictionoftheTokyoDistrictCourt(mainoffice)inJapanforsettlementofthedispute.
Article 12 (Governing Law)This Agreement shall be governed by and construed in accordance with the laws of Japan. The Licensee expressly agrees to waive absolutely and irrevocably and to the fullest extent permissible under applicable law any rights against the laws of Japan which it may have pursuant to the Licensee’s local law.
Article 13 (Severability)Intheeventthatanyprovisionhereofisdeclaredorfoundtobeillegalbyanycourtortribunalofcompetentjurisdiction,suchprovisionshallbenullandvoidwithrespecttothejurisdictionofthatcourtortribunalandalltheremainingprovisionshereofshallremaininfullforceandeffect.
Terms and Conditions of the Software License
viiIM 761922-06E
3
2
1
4
5
6
7
8
9
10
11
12
13
14
Index
Contents
Notes about Using This Software ..................................................................................................... iiHow to Use This Manual .................................................................................................................. iiiSoftware Versions That This Manual Applies To .............................................................................. ivTermsandConditionsoftheSoftwareLicense.................................................................................v
Chapter 1 Product Overview1.1 Explanation of Functions .................................................................................................. 1-11.2 PCSystemRequirements ................................................................................................ 1-81.3 Applicable Standards ....................................................................................................... 1-91.4 Flow of Operation ........................................................................................................... 1-151.5 Terminology Related to Harmonics ................................................................................ 1-17
Chapter 2 Preparation before Use2.1 ConnectingtheWTandthePC ........................................................................................ 2-12.2 SettingtheGP-IBControl ................................................................................................. 2-32.3 SettingtheEthernetControl ............................................................................................. 2-52.4 Installing the Software ...................................................................................................... 2-7
Chapter 3 Starting and Using the Software3.1 Starting the Software ........................................................................................................ 3-13.2 Basic Operations .............................................................................................................. 3-3
Chapter 4 Using the Start and Exit Pages4.1 Selecting a Test Schedule Menu ...................................................................................... 4-14.2 ClosingtheSoftware ........................................................................................................ 4-6
Chapter 5 Using the Open Page to Load Setting Information and Measured Data5.1 Loading Setting Information and Measured Data ............................................................. 5-15.2 CheckingtheRepeatabilityoftheMeasuredData ........................................................... 5-5
Chapter 6 Using the Connection Page to Establish a Connection between the PC and a WT6.1 EstablishingaNewConnectionBetweenthePCandaWT ............................................ 6-16.2 UsingtheConnectionSettingsfromaLoadedFile .......................................................... 6-56.3 UsingtheSameConnectionSettingsasBefore .............................................................. 6-66.4 EndingaConnectionbySwitchingtoOfflineMode ......................................................... 6-7
Chapter 7 Using the Setting Page to Configure Measurement and Judgment Conditions7.1 SettingGeneralTestConditions ....................................................................................... 7-17.2 SettingtheWTMeasurementConditions ......................................................................... 7-77.3 SettingtheWTJudgmentConditions ............................................................................. 7-137.4 SettingtheOptionalConditions ...................................................................................... 7-23

viii IM 761922-06E
Contents
Chapter 8 Using the Measure Page to Make Measurements8.1 PreviewingHarmonicDataandWaveformData .............................................................. 8-18.2 SettingtheDisplayoftheTestPreview ............................................................................ 8-38.3 SettingtheDisplayoftheListPreview ............................................................................. 8-98.4 SettingtheDisplayoftheBarPreview ........................................................................... 8-108.5 SettingtheDisplayoftheWavePreview ........................................................................ 8-128.6 MakingSimpleUserDesignatedValueMeasurement ................................................... 8-158.7 MakingComplianceTest(HarmonicMeasurements) ..................................................... 8-178.8 MakingComplianceSimpleTest .................................................................................... 8-21
Chapter 9 Using the Analysis Page to Display Judgment Results and Measured Data9.1 Displaying a Graph of All Judgments ............................................................................... 9-19.2 DisplayingaListandGraphofHarmonicCurrentValues ................................................ 9-89.3 Displaying a Harmonic Bar Graph .................................................................................. 9-159.4 Displaying a List of Measured Harmonic Values ............................................................ 9-179.5 Displaying a Trend Graph ............................................................................................... 9-189.6 Displaying a Waveform Graph ........................................................................................ 9-229.7 DisplayingtheResultsofSimpleComplianceTests....................................................... 9-26
Chapter 10 Using the Print Page to Print Reports10.1 SettingaReport’sTitleandComments .......................................................................... 10-110.2 Setting the Print Mode, Print Language and Output Form ............................................. 10-410.3 Setting Print Details (Detail Setting) ............................................................................... 10-510.4 Printing ........................................................................................................................... 10-7
Chapter 11 Using the Save Page to Save Setting Information and Measured Data11.1 Saving Setting Information and Measured Data ..............................................................11-111.2 SavingMeasuredDatainCSVFormat ...........................................................................11-5
Chapter 12 Other Features12.1 CascadingWindows ....................................................................................................... 12-112.2 Tiling Windows ............................................................................................................... 12-212.3 Using the Help Function ................................................................................................. 12-312.4 Viewing Version Information ........................................................................................... 12-512.5 Setting the Displayed Language .................................................................................... 12-612.6 Editing the Displayed Language ..................................................................................... 12-7
Chapter 13 Troubleshooting13.1 Troubleshooting .............................................................................................................. 13-113.2 Error Messages .............................................................................................................. 13-2
Chapter 14 SpecificationsSpecifications .............................................................................................................................. 14-1
Index

1-1IM 761922-06E
Product Overview3
2
1
4
5
6
7
8
9
10
11
12
13
14
Index
1.1 Explanation of Functions
This software application (761922) measures the harmonics of electrical equipment accordingtotheIECStandard(seesection1.3foranoverview)andindicates/savestheresultsofjudgmentsmadeaccordingtothestandard.
Applicable Measurement InstrumentsThis software can be used with YOKOGAWA’s measurement instruments listed below.
Product ModelWT3000 760301, 760302, 760303, and 760304WT3000E WT3001E, WT3002E, WT3003E, and WT3004E
For information about the handling precautions, functions, and operating procedures of the WT3000 or WT3000E (hereinafter referred to as the WT), see the respective manuals.This user’s manual (IM761922-06E) describes the case when this software is used in combination with the WT3000.
Applicable StandardFor the applicable standards, see section 1.3.
Setting Up Test Schedule MenusYou can arrange the following steps as you like to create test schedule menus.
Start: Select and edit test schedule menus.
Open: Load measured data and WT setting information files.
Connection:ConfiguretheconnectionbetweenthePCandaWT.
Setting: Set compatibility and measurement conditions.
Measure: Measure voltage fluctuation and flicker.
Analysis: Display measured results as bar and trend graphs.
Print: Print screen images and reports.
Save: Save measured data and setting information files.
Exit:Closethesoftware.
Chapter 1 Product Overview
1-2 IM 761922-06E
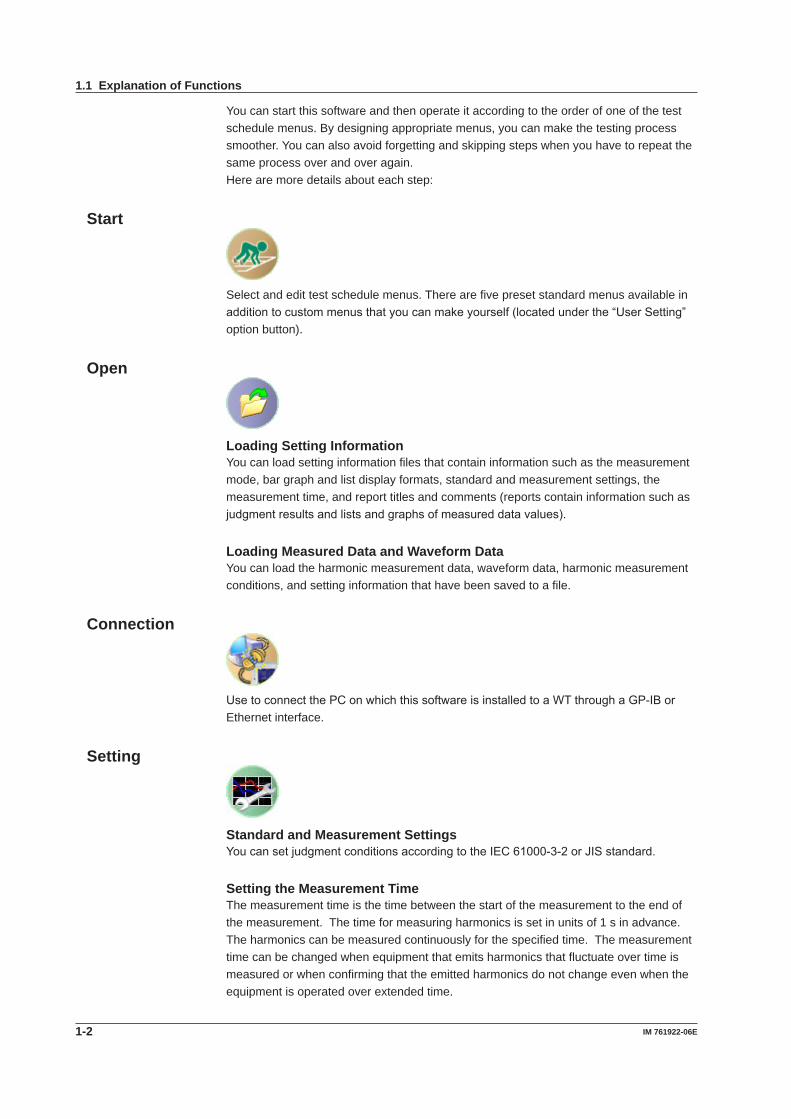
You can start this software and then operate it according to the order of one of the test schedule menus. By designing appropriate menus, you can make the testing process smoother. You can also avoid forgetting and skipping steps when you have to repeat the same process over and over again.Here are more details about each step:
Start
Select and edit test schedule menus. There are five preset standard menus available in additiontocustommenusthatyoucanmakeyourself(locatedunderthe“UserSetting”option button).
Open
Loading Setting InformationYou can load setting information files that contain information such as the measurement mode, bar graph and list display formats, standard and measurement settings, the measurement time, and report titles and comments (reports contain information such as judgmentresultsandlistsandgraphsofmeasureddatavalues).
Loading Measured Data and Waveform DataYou can load the harmonic measurement data, waveform data, harmonic measurement conditions, and setting information that have been saved to a file.
Connection
UsetoconnectthePConwhichthissoftwareisinstalledtoaWTthroughaGP-IBorEthernet interface.
Setting
Standard and Measurement SettingsYoucansetjudgmentconditionsaccordingtotheIEC61000-3-2orJISstandard.
Setting the Measurement TimeThe measurement time is the time between the start of the measurement to the end of the measurement. The time for measuring harmonics is set in units of 1 s in advance. The harmonics can be measured continuously for the specified time. The measurement time can be changed when equipment that emits harmonics that fluctuate over time is measured or when confirming that the emitted harmonics do not change even when the equipment is operated over extended time.
1.1 Explanation of Functions

1-3IM 761922-06E
Product Overview3
2
1
4
5
6
7
8
9
10
11
12
13
14
Index
Edition Settings for IEC 61000-4-7 or JIS C 61000-4-7JIS: Japanese Industrial StandardIEC61000-4-7orJISC61000-4-7specifiesrequirementsformeasurementinstruments.YoucansettheIECorJISeditionfromthefollowing.Thissettingaffectsthewindowfunction (measurement period) of the WT.
Editon No. of the IEC 61000-4-7
Editon No. of theJIS C 61000-4-7
Window Function of the WT3000 (Measurement Period)
50Hz 60HzEdition 1.0 2007 JA 16 cycles (320 ms) 16 cycles (267 ms)Edition 2.0 2007 10 cycles (200 ms) 12 cycles (200 ms)A1 of the Edition 2.0 ------ 10 cycles (200 ms) 12 cycles (200 ms)
For more details, see chapter 14.
Measure
There are two measurement modes that you can select from the Measure submenu: CompliancetestandTestpreview.Thesoftwareacquiresdifferenttypesofdataandperforms different operations for each measurement mode.
Compliance Test• When in On-Line Mode MeasurementandevaluationofharmonicsconformingtoIEC61000-3-2orJIScan
be made while making harmonic measurements on the WT
10 cycles (for 50 Hz)*12 cycles (for 60 Hz)*
of the fundamental frequency
10 cycles (for 50 Hz)*12 cycles (for 60 Hz)*
of the fundamental frequency
Measures the harmonics Measures the harmonics
Retrieves the measured dataon the PC and stores them asinstantaneous values
Retrieves the measured dataon the PC and stores them as thenext set of instantaneous values
Measures the harmonics using the measurement conditions entered according to the applicable standard
Measurement time
One set of harmonic measurement data (handled as instantaneous values by the software) consists of harmonic data measured every 200 ms (10 cycles for 50 Hz and 12 cycles for 60 Hz)*. The instantaneous values, the mean value, and the maximum value of the measured data retrieved within the measurement time (see next page) can be evaluated to determine whether they are within the limits of the standard.
* ForwhentheIEC61000-4-7editionissetto2.0or2.0A1.WhentheIEC61000-4-7edition is set to 1.0, the number of cycles is 16 (320 ms at 50 Hz or 267 ms at 60 Hz).
1.1 Explanation of Functions

1-4 IM 761922-06E
• When in Off-Line Mode Evaluation can be made on the loaded measurement data according to the method
complyingwithIEC61000-3-2orJIS.
Test PreviewYou can only select Test preview in online mode. As the WT measures the harmonic current, you can observe the harmonic fluctuations as they appear on a list and bar graphs of measured values. You can also observe the measured waveform.Unlike the compliance test, the harmonic preview is only for observing the state of a harmonic current. It does not determine whether or not a device conforms to certain standards. New data replaces old data. The software only retains the most recently acquired values.
• Test Preview, List Peview, Bar Preview
10 cycles (for 50 Hz)*12 cycles (for 60 Hz)*
of the fundamental frequency
10 cycles (for 50 Hz)*12 cycles (for 60 Hz)*
of the fundamental frequency
Measures theharmonics
Measures theharmonics
Measures the harmonics using the measurement conditions entered according to the applicable standard
Retrieves the measured data on the PC and displays a bar
Retrieves the measured data on the PC and displays a bar graph or numerical listThe previous measured data is updated and does not remain.
* ForwhentheIEC61000-4-7editionissetto2.0or2.0A1.WhentheIEC61000-4-7edition is set to 1.0, the number of cycles is 16 (320 ms at 50 Hz or 267 ms at 60 Hz).
• Waveform Preview
Approx. 2 cycles at thefundamental frequency
Samples thewaveform data
Approx. 2 cycles at thefundamental frequency
Samples thewaveform data
Retrieves the waveform data on the PC and displays the waveform
Retrieves the waveform data on the PC and displays the waveformThe previous waveform data is updated and does not remain.
1.1 Explanation of Functions

1-5IM 761922-06E
Product Overview3
2
1
4
5
6
7
8
9
10
11
12
13
14
Index
Starting/Stopping MeasurementsHarmonicmeasurementontheWTcanbestartedfromyourPCwheninOn-Linemode.The measurement cannot be started when in Off-Line mode.• Compliance Test AfteryoustartWTharmoniccurrentanalysisfromyourPC,thePCwillacquire
and save the values that the WT measures. All of the data that is acquired during the specified measurement time is saved. After the specified measurement time is reached,thePCwillautomaticallyendmeasurementanddataacquisition.YoucanalsostopdataacquisitionfromthePCbeforethemeasurementtimeisreached.
• Test Preview AfteryoustartWTharmoniccurrentanalysisfromyourPC,thePCwillacquirethe
values that the WT measures. New data replaces old data. The software only retains the most recently acquired data. Unlike the compliance test, the test preview is only for observing the state of a harmonic current. It do not determine whether or not a device conforms to certain standards.
Analysis
The result of the evaluation as to whether the harmonic current data up to order 40 is withinthelimitsofIEC61000-3-2orJISandthecorrespondingmeasureddatacanbedisplayed.
Display of the Evaluation Result within the Entire Measurement TimeEvaluation can be made as to whether all of the harmonic measurement data in the measurementtimearewithinthelimitsaccordingtothesettingsspecifiedin“SettingtheStandardandMeasurementEnvironment”(asdescribedearlier),andtheresultscanbedisplayed collectively.
List and Bar Graph Display of Harmonic CurrentA list and bar graphs of the harmonic measurement data and the standard limits can be displayed for each order. Moreover, the evaluation as to whether harmonic current data is within the limits can be displayed using different colors. The harmonic current data to be evaluated is the mean value, the maximum value, and instantaneous values (one set of harmonic measurement data) of the measured data within the measured time. Harmonic current can be displayed for each input element of the WT.
Bar Graph Display of Harmonic Voltage, Current, and Phase AngleYou can display the measured data for each harmonic in a bar graph. The software will display the instantaneous values in the bar graph (instantaneous values are the values that are acquired at each measurement of the harmonic current).
List Display of Harmonic Voltage, Current, and Phase AngleYou can display the measured data for each harmonic in a list. The software will display the instantaneous values in the list (instantaneous values are the values that are acquired at each measurement of the harmonic current).
1.1 Explanation of Functions

1-6 IM 761922-06E
Trend Graph Display of Harmonic MeasurementsFor each harmonic, you can use a trend graph to show how the harmonic measurement data fluctuates over time.
Waveform Display of Voltage and CurrentYou can display a waveform that is measured immediately after the measurement time finishes. The software will display approximately two waveform periods. You can click on an area to display a cursor and show the instantaneous values there.
Repeatability of Measured DataThe mean value in the harmonics measurement data saved to files can be compared, and the difference in the measured data can be displayed on a bar graph or numerical list for each order. This function can be used to evaluate whether the difference between data measured under the same measurement conditions when harmonics are measured using the same product or same product model is within ±5% of the limits (confirmation of repeatability).
File 1
Mean1
File 2
Mean2
File 3
Mean3
File N
MeanN
Mnmean Harmonic orders (2 to 40)
Mnmax
Mnmin
+5% line of the limits
–5% line of the limits
Mnmean = (Mean1 + Mean2 + Mean3 + ... + MeanN)/N (Mnmean: The value derived by summing the mean values of each file (Mean1,
Mean2, Mean3, ... MeanN) and dividing by the number of summed values (N). The value can be determined for each order.)
Mnmax = [Mean1, Mean2, Mean3, ..., MeanN]max (Mnmax: The maximum value among the mean values of each file. The value can be
determined for each order.) Mnmin = [Mean1, Mean2, Mean3, ..., MeanN]min (Mnmin: The minimum value among the mean values of each file. The value can be
determined for each order.)
Judgement of the +5% of the limit
Mnmax – MnmeanLimit × 100 < 5 [%]
Judgement of the -5% of the limit
Mnmin – MnmeanLimit × 100 > –5 [%]
Display of Simple Test Judgment ResultsJudgment can be made as to whether the measured data of the simple test is within limits,andtheresultsofthejudgmentcanbedisplayedcollectively.
1.1 Explanation of Functions

1-7IM 761922-06E
Product Overview3
2
1
4
5
6
7
8
9
10
11
12
13
14
Index
To create reports, you can attach titles and comments to harmonic measurement data lists and bar graphs and then save them to .pdf or .bmp files or print them.
Save
Saving Setting InformationYou can save setting information, such as measurement settings, measurement time, bar graph and list display formats, and report titles and comments, to an .ini file (reports containinformationsuchasjudgmentresultsandlistsandgraphsofmeasureddatavalues).
Saving Measured Data and Waveform DataThe software can save the measured data and waveform data that it acquires from the WT to an .fdt file. When the software saves this data, it will also save the WT harmonic measurement conditions along with the setting information described above to an .ini file.
Saving Measured Data and Waveform Data to CSV FormatYou can use this software to save the harmonic measurement data and waveform data thatthePChasacquiredfromtheWTtoaCSVfile.ThissoftwarecannotloadCSVfiles,butyoucanuseanotherprogramonthePCtoloadandviewtheCSVfilesthatyousave.
Exit
Use to close the software.
Online Mode and Offline ModeOnline ModeThesoftwareisinonlinemodewhenthePCisconnectedtotheWTthroughaGP-IBor Ethernet interface. The software must be in online mode to acquire harmonic data from the WT as the data is being measured. You can switch to Online mode from the Connectionpage.Inonlinemode,youcanchangetheWTsettingsfromthePC.
Offline ModeYou can load previously saved harmonic measurement data into the software. You can change the settings and reanalyze the loaded data, and you can display a variety of lists and graphs.
1.1 Explanation of Functions

1-8 IM 761922-06E
1.2 PC System Requirements
PCCPU: DualcoreormoreprocessorMemory: 2 GB or more recommendedHard Disk: 10GB free space or more
Operating SystemEnglishversionofWindowsVista,Windows7,Windows8,Windows8.1,orWindows10
Communication CardGP-IBNI (National Instruments)
OSWindows Vista
Windows 7Windows 8
Windows 8.1Windows 10
Version of the driver NI-488.2PCI-GPIB 2.7.2 or later 3.1.0 or later 15.5.0 or laterPCI-GPIB+PCIe-GPIBPCIe-GPIB+GPIB-USB-HS 2.8.1orlaterGPIB-USB-HS+ 14.0 or later
EthernetAn Ethernet port that supports 10BASE-T, 100BASE-TX, or 1000BASE-T
Display, Disk Drive, Printer, and MouseDisplayResolution: 1366×768dotsorhigherDiskDrive: AdrivethatcanreadCD-RsOperating System: Operating system mentioned above
WT3000 or WT3000EThe WT must be equipped with the following:• Advancedcalculationfeature(/G6option)• GP-IBinterface(standard)orEthernetinterface(/C7option)
How Different WT Firmware Versions Handle IEC 61000-4-7InWTfirmwareversions4.11andlater,youcanselecttheIEC61000-4-7orJISC61000-4-7 edition.
Editon No. of the IEC 61000-4-7 Editon No. of the JIS C 61000-4-7•Edition1.0 •2007JA•Edition2.0 •2007•A1oftheEdition2.0
IEC61000-4-7orJISC61000-4-7specifiesrequirementsformeasurementinstruments.For details, see chapter 14. In WT firmware versions 4.01 to 4.10, the edition is fixed at IEC61000-4-7edition2.0.
NoteTo upgrade the firmware on your WT, contact your nearest YOKOGAWA dealer.

1-9IM 761922-06E
Product Overview3
2
1
4
5
6
7
8
9
10
11
12
13
14
Index
1.3 Applicable Standards
This software supports the following standards:• IEC61000-3-2Edition3.0:2005andA2oftheEdition3.0:2009,IEC61000-3-2Edition
4.0:2014• EN61000-3-2:2006/A2:2009,EN61000-3-2:2014• IEC61000-4-7Edition1.0:1991,Edition2.0:2002andA1oftheEdition2.0:2008• JISC61000-3-2:2011 JIS:JapaneseIndustrialStandard• JISC61000-4-7:2007This section gives an overview of the standards. For further details, see the actual text of the applicable standard.
Scope and ClassificationThelimitsforharmoniccurrentemissions(IEC61000-3-2orJIS)areapplicabletoelectrical and electronic equipment having an input current of up to 16 A (up to 20 A for JIS)perphaseandconnectedtopubliclow-voltagedistributionsystems.Classificationismadedependingonthetypeofequipment.IEC61000-3-2Edition4.0doesnotdefinethe limits for some types of equipment. For details, see the applicable standard.
• Balanced three-phase equipment• Household appliances, excluding
equipment identified as Class D• Tools excluding portable tools
(portable tools are Class B)• Dimmers for incandescent lamps• Audio equipment• Equipment not specified in one of the
other three classes (B, C, and D)
Class A Portable tools
Class B
Class D
Lighting equipment
Class C
Electrical and electronic equipment having an input current up to 16 A per phase
Arc welding equipment which is not professional equipment
• Television receivers, personal computers (PCs), and PC monitors with a rated power of 600 W or less
• Inverter refrigerator and refrigerator
LimitsThelimitsarespecifiedforeachclass.IEC61000-3-2assumesaphasevoltageof220V, 230 V, and 240 V for specifying the limits. For equipment of differing rated voltage, conversionmaybenecessary.Fortheconversionequation,see“ConversionofLimits”(page1-11).ThelimitsofJISC-61000-3-2:2011arethesameasthoseofIEC61000-3-2. However, limits indicated on the next page apply to air conditioners of class A whose active power exceeds 600 W.Limits for Class B Equipment
Harmonic ordern
Odd harmonics35791113
15≤n≤39Even harmonics
246
8≤n≤40
Maximum permissibleharmonic current [A]
2.301.140.770.400.330.21
0.15×(15/n)
1.080.430.30
0.23×(8/n)
1-10 IM 761922-06E
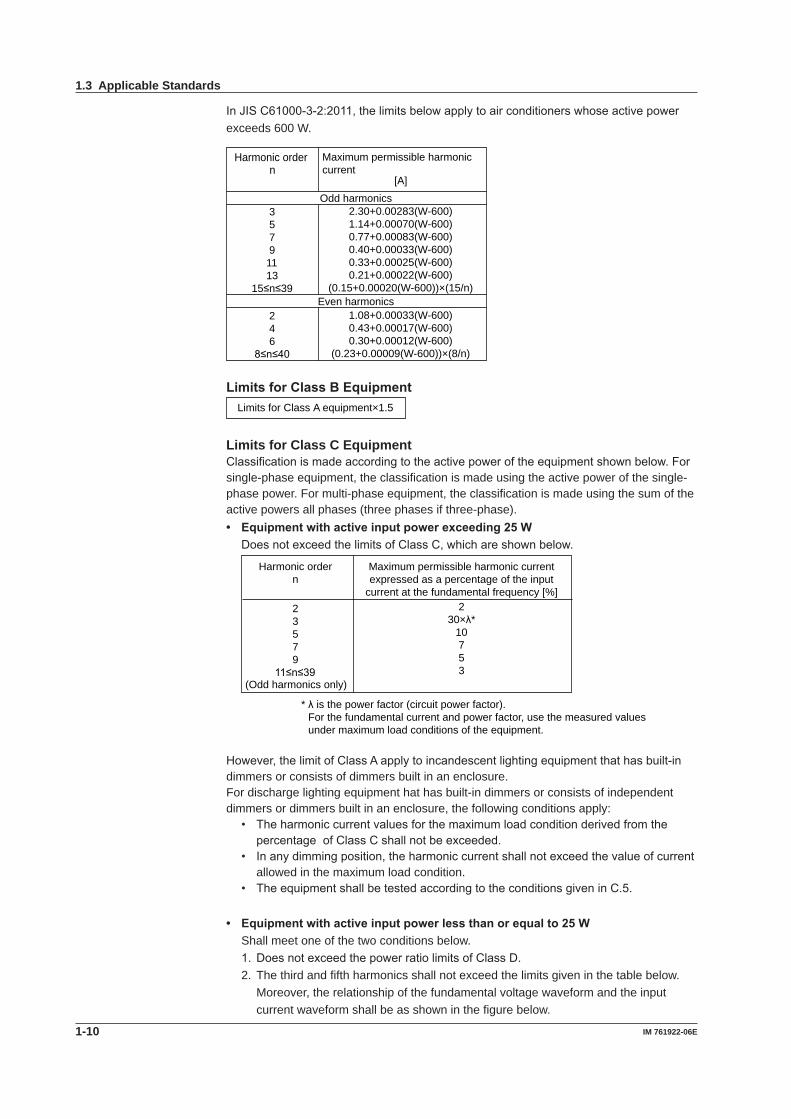
InJISC61000-3-2:2011,thelimitsbelowapplytoairconditionerswhoseactivepowerexceeds 600 W.
Even harmonics
Odd harmonics
Maximum permissible harmonic current
2.30+0.00283(W-600)1.14+0.00070(W-600)0.77+0.00083(W-600)0.40+0.00033(W-600)0.33+0.00025(W-600)0.21+0.00022(W-600)
(0.15+0.00020(W-600))×(15/n)
1.08+0.00033(W-600)0.43+0.00017(W-600)0.30+0.00012(W-600)
(0.23+0.00009(W-600))×(8/n)
[A]
3579
1113
15≤n≤39
246
8≤n≤40
Harmonic order n
Limits for Class B Equipment Limits for Class A equipment×1.5
Limits for Class C EquipmentClassificationismadeaccordingtotheactivepoweroftheequipmentshownbelow.Forsingle-phase equipment, the classification is made using the active power of the single-phase power. For multi-phase equipment, the classification is made using the sum of the active powers all phases (three phases if three-phase).• Equipment with active input power exceeding 25 W DoesnotexceedthelimitsofClassC,whichareshownbelow.
Maximum permissible harmonic currentexpressed as a percentage of the input
current at the fundamental frequency [%]2
30×λ*10753
* λ is the power factor (circuit power factor). For the fundamental current and power factor, use the measured values
under maximum load conditions of the equipment.
Harmonic ordern
23579
11≤n≤39(Odd harmonics only)
However,thelimitofClassAapplytoincandescentlightingequipmentthathasbuilt-indimmers or consists of dimmers built in an enclosure.For discharge lighting equipment hat has built-in dimmers or consists of independent dimmers or dimmers built in an enclosure, the following conditions apply:
• TheharmoniccurrentvaluesforthemaximumloadconditionderivedfromthepercentageofClassCshallnotbeexceeded.
• Inanydimmingposition,theharmoniccurrentshallnotexceedthevalueofcurrentallowed in the maximum load condition.
• TheequipmentshallbetestedaccordingtotheconditionsgiveninC.5.
• Equipment with active input power less than or equal to 25 W Shall meet one of the two conditions below.
1.DoesnotexceedthepowerratiolimitsofClassD.2. The third and fifth harmonics shall not exceed the limits given in the table below.
Moreover, the relationship of the fundamental voltage waveform and the input current waveform shall be as shown in the figure below.
1.3 Applicable Standards

1-11IM 761922-06E
Product Overview3
2
1
4
5
6
7
8
9
10
11
12
13
14
Index
Harmonic ordern
35
Maximum permissible harmonic currentexpressed as a percentage of the input
current at the fundamental frequency [%]8661
The relationship of the fundamental supply voltage waveform and the input current waveform is as follows, where the zero crossing of the fundamental supply voltage is assumed to be at 0° (degrees).• Beginningofthecurrentflow :It reaches the 5 % current threshold before or at 60°• Currentpeak :Beforeorat65°• Endofthecurrentflow :Itdoesnotfallbelowthe5%currentthreshold
before 90°.
The 5% current threshold is defined to be 5% of the maximum absolute peak value (Ip(abs)).
0°
60° 65° 90°Voltage
Current
Ip+
Ip-
+0.05Ip(abs)
-0.05Ip(abs)
Ip+ : Peak value of the current waveform (+)Ip- : Peak value of the current waveform (-)Ip(abs) : The higher absolute value of Ip+ and Ip-
Limits for Class D EquipmentShall meet the maximum permissible harmonic current (power ratio limit) per watt and the maximum permissible current given in the next table. The concept of power (active power)ofsingle-ormulti-phaseequipmentisthesameasClassC.
Maximum permissible harmoniccurrent per watt [mA/W]
(Power ratio limit)
3.41.91.00.50.35
3.85/n
Maximum permissibleharmonic current
(Odd harmonics only)[A]
2.301.140.770.430.33
Same as class A.
Harmonic ordern
357911
13≤n≤39(Odd harmonics only)
Conversion of LimitsIEC61000-3-2assumesaphasevoltageof220V,230V,and240Vforspecifyingthelimits.Forequipmentofdifferingratedvoltage,conversionmaybenecessary.Convertthe limits of all the classes using the following equations and apply them. However, conversion to a phase voltage of 220 V or 240 V is not necessary.
Converted limit = Limit of each class ×
230Rated voltage of the equipment
Phase voltage
Converted limit = Limit of each class ×400
Rated voltage of the equipment
Line voltage of three-phase
1.3 Applicable Standards

1-12 IM 761922-06E
Simple TestEquipment whose compliance test result meets the conditions below can be tested using the simple test method the next time the equipment is updated.• Harmoniccurrent :Below60%oftheapplicablelimits• THDofthesupplycurrent :Lessthan15%
Products that fulfill the following requirements are deemed to comply with the applicable limits.• Activeinputpower :Within±20%ofthatoftheoriginallytestedproduct• THDofthesupplycurrent :Lessthan15%
1.3 Applicable Standards
1-13IM 761922-06E
Product Overview3
2
1
4
5
6
7
8
9
10
11
12
13
14
Index
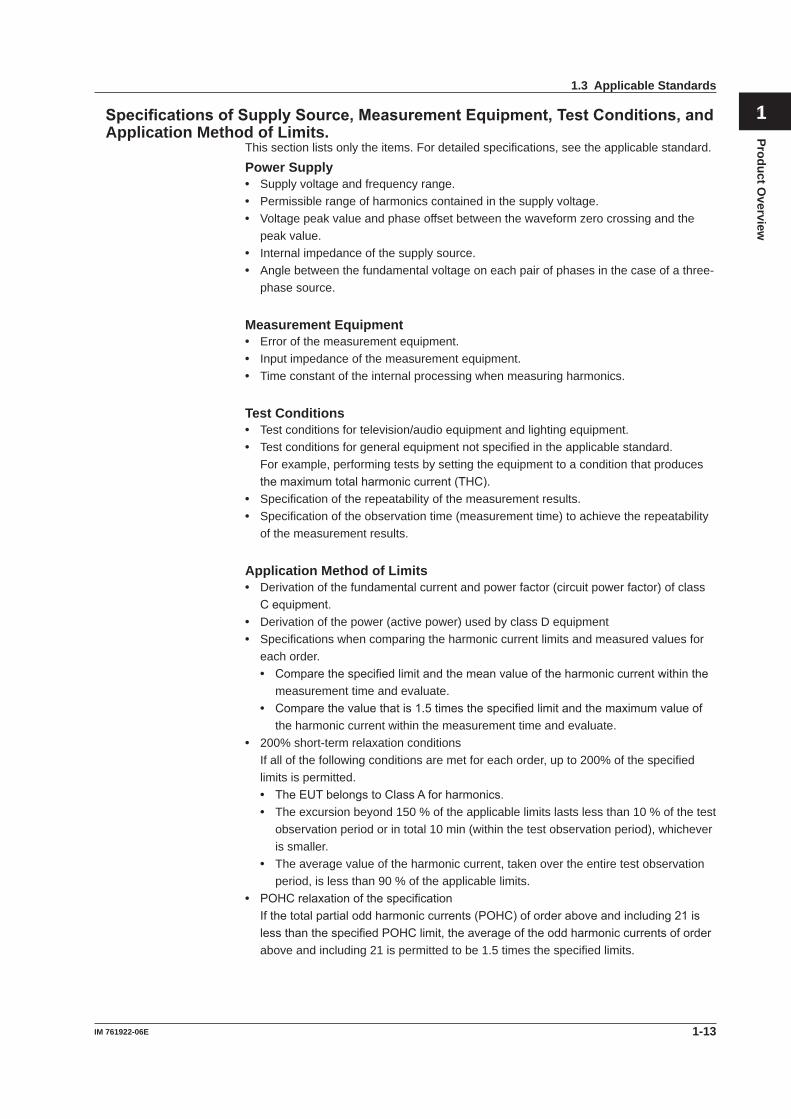
Specifications of Supply Source, Measurement Equipment, Test Conditions, and Application Method of Limits.
This section lists only the items. For detailed specifications, see the applicable standard.
Power Supply• Supply voltage and frequency range.• Permissible range of harmonics contained in the supply voltage.• Voltage peak value and phase offset between the waveform zero crossing and the
peak value.• Internal impedance of the supply source.• Angle between the fundamental voltage on each pair of phases in the case of a three-
phase source.
Measurement Equipment• Error of the measurement equipment.• Input impedance of the measurement equipment.• Time constant of the internal processing when measuring harmonics.
Test Conditions• Test conditions for television/audio equipment and lighting equipment.• Test conditions for general equipment not specified in the applicable standard. For example, performing tests by setting the equipment to a condition that produces
themaximumtotalharmoniccurrent(THC).• Specification of the repeatability of the measurement results.• Specification of the observation time (measurement time) to achieve the repeatability
of the measurement results.
Application Method of Limits• Derivation of the fundamental current and power factor (circuit power factor) of class
Cequipment.• Derivation of the power (active power) used by class D equipment• Specifications when comparing the harmonic current limits and measured values for
each order.• Comparethespecifiedlimitandthemeanvalueoftheharmoniccurrentwithinthe
measurement time and evaluate.• Comparethevaluethatis1.5timesthespecifiedlimitandthemaximumvalueof
the harmonic current within the measurement time and evaluate.• 200% short-term relaxation conditions If all of the following conditions are met for each order, up to 200% of the specified
limits is permitted.• TheEUTbelongstoClassAforharmonics.• The excursion beyond 150 % of the applicable limits lasts less than 10 % of the test
observation period or in total 10 min (within the test observation period), whichever is smaller.
• The average value of the harmonic current, taken over the entire test observation period, is less than 90 % of the applicable limits.
• POHCrelaxationofthespecification Ifthetotalpartialoddharmoniccurrents(POHC)oforderaboveandincluding21is
lessthanthespecifiedPOHClimit,theaverageoftheoddharmoniccurrentsoforderabove and including 21 is permitted to be 1.5 times the specified limits.
1.3 Applicable Standards

1-14 IM 761922-06E
Decision Process for Determining Whether 200% Short-Term Relaxation or POHC Relaxation Is Applicable
Measurement execution
Pass Fail
Fail
Pass
Yes (Class A)
No
Yes (< 90%)
Yes (≤ 200%)
Yes
No
Yes
No (≥ 90%)
No (> 200%)
No
Meets the POHC relaxation condition1
The maximum value is less than or equal to 200% of the limits.
Period during which 150% is exceeded2 Excursion period limit3
The average value is less than 90% of the limits.
Edition 2.2 and laterMeets the limits specified in the standard (Edition 2.2)
The EUT is of class A.
1 The200%short-termrelaxationandPOHCrelaxationcannotbeappliedtogethertoasingletest.2 Period during which instantaneous values exceed 150% of the applicable limit.3 10% of the test observation period or 10 minutes (within the test observation period), whichever is smaller.
Window Function of the WT (Measurement Period)The width of the window function (measurement period) for the measurements is defined byIEC61000-4-7.Fordetails,seepage1-3orchapter14.
1.3 Applicable Standards
1-15IM 761922-06E
Product Overview3
2
1
4
5
6
7
8
9
10
11
12
13
14
Index
1.4 Flow of Operation
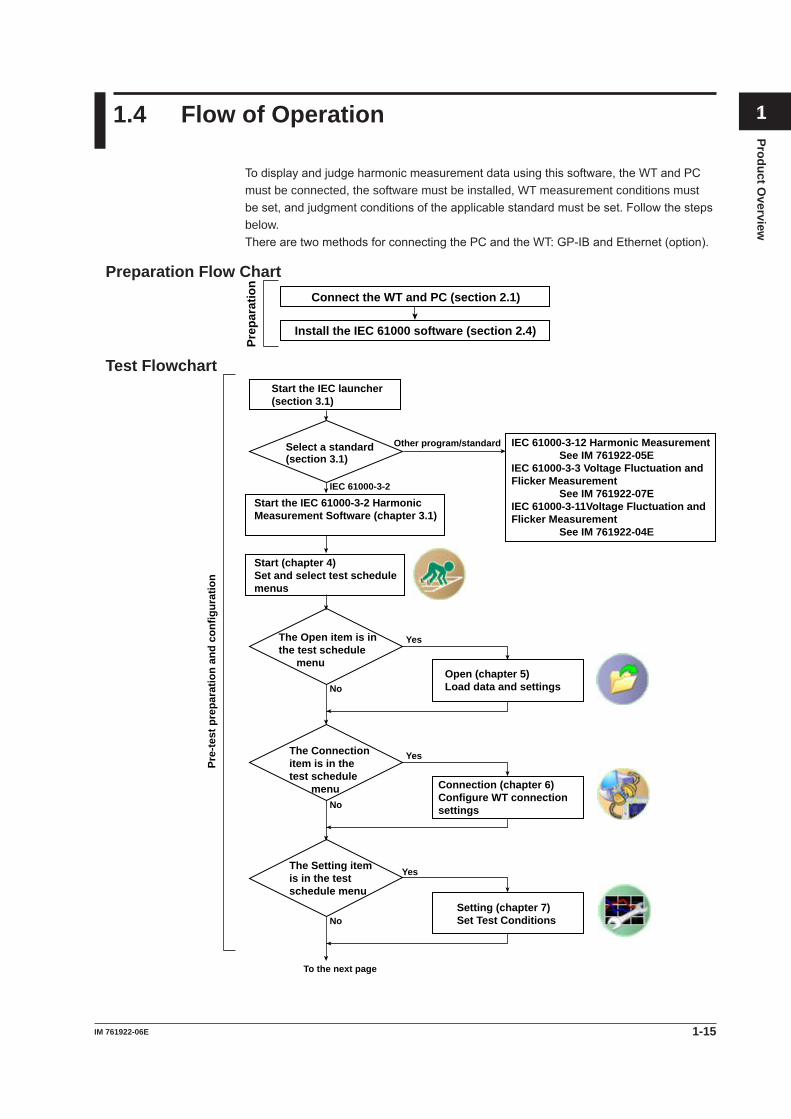
Todisplayandjudgeharmonicmeasurementdatausingthissoftware,theWTandPCmust be connected, the software must be installed, WT measurement conditions must beset,andjudgmentconditionsoftheapplicablestandardmustbeset.Followthestepsbelow.TherearetwomethodsforconnectingthePCandtheWT:GP-IBandEthernet(option).
Preparation Flow Chart
Connect the WT and PC (section 2.1)
Install the IEC 61000 software (section 2.4)
Prep
arat
ion
Test FlowchartStart the IEC launcher (section 3.1)
Pre-
test
pre
para
tion
and
conf
igur
atio
n
Select a standard (section 3.1)
IEC 61000-3-2
Start the IEC 61000-3-2 Harmonic Measurement Software (chapter 3.1)
IEC 61000-3-12 Harmonic Measurement See IM 761922-05EIEC 61000-3-3 Voltage Fluctuation andFlicker Measurement See IM 761922-07EIEC 61000-3-11Voltage Fluctuation andFlicker Measurement See IM 761922-04E
Start (chapter 4)Set and select test schedulemenus
No
YesThe Open item is in the test schedule menu
Open (chapter 5)Load data and settings
No
YesThe Connection item is in the test schedule menu Connection (chapter 6)
Configure WT connection settings
No
YesThe Setting item is in the testschedule menu
Setting (chapter 7)Set Test Conditions
To the next page
Other program/standard

1-16 IM 761922-06E
No
YesThe Print item is in the test schedule menu
Print (Chapter 10)Print a report
No
YesThe Save item is in the test schedule menu
Save (Chapter 11)Save data and settings
Test
exe
cutio
nPr
oces
sing
of t
est r
esul
tsNo
YesThe Measure item is in the test schedule menu
Measure (Chapter 8)Measure and perform a test
No
YesThe Analyze item is in the test schedule menu
Analysis (chapter 9)Analyze measured data
Continued from previous page
Close the IEC launcher
Close the IEC 61000-3-2 Harmonic MeasurementSoftware (chapter 4)
1.4 Flow of Operation

1-17IM 761922-06E
Product Overview3
2
1
4
5
6
7
8
9
10
11
12
13
14
Index
1.5 Terminology Related to Harmonics
Harmonics refer to sine waves whose frequency is an integer multiple of the fundamental wave (normally sine waves of commercial frequency 50-Hz or 60-Hz) excluding the fundamental frequency.
Fundamental Wave (Fundamental Component)The sine wave with the longest period among the different sine waves derived from the periodic complex wave. Or the sine wave that has the fundamental frequency within the components of the complex wave.
Fundamental FrequencyThe frequency corresponding to the longest period in the periodic complex wave. The frequency of the fundamental wave.
Distorted WaveA wave that differs from the fundamental wave.
Higher HarmonicA sine wave with frequency that is an integer multiple (twice or greater) of the fundamental frequency.
Harmonic ComponentWaveform component with frequency that is an integer multiple (twice or greater) of the fundamental frequency.
Harmonic OrderIntegerratiooftheharmonicfrequencywithrespecttothefundamentalfrequency.IECdefines the maximum harmonic order that is measured to be 40.
PLL SourceWhen measuring harmonics, the fundamental period (period of the fundamental signal) must be determined in order to analyze the higher orders. The PLL (Phase Locked Loop) source is the signal that is used to determine the fundamental period.
THC (Total Harmonic Component)Sum (rs value) of harmonic currents of orders 2 to 40.
k = 2
I(k): rms current of each orderk: harmonic order
40
I(k)2
THD (Total Harmonic Distortion)The ratio of the rms value of all harmonics of orders 2 to 40 and the rms value of the fundamental wave.
k = 2
40
U(k)2
U(1)U(k): rms voltage of each order, U(1): rms voltage of the fundamental signalI(k): rms current of each order, I(1): rms current of the fundamental signalP(k): active power of each order, P(1): active power of the fundamental signalk: harmonic order
× 100 k = 2
40
I(k)2
I(1)× 100
• V THD • A THD
k = 2
40
P(k)
P(1)× 100
• P THD

1-18 IM 761922-06E
InterharmonicsIftheinputsignalis50HzinIECharmonicmeasurement,Fouriertransformistakenon10 periods of the input signal to derive frequency components of 5-Hz resolution. Thus, the section between each harmonic order is divided into 10 frequency components. The components between each harmonic order are called interharmonics.
100 150
Interharmonics
Rms component
Frequency[Hz]
50 100 150 200 250dc
2nd harmonic 3rd harmonic 4th harmonic 5th harmonicFundamental signal
2nd harmonic 3rd harmonic
When the fundamental signal is 50 Hz
If the input signal is 60 Hz, 12 periods of the input waveform are divided into frequency components of 5-Hz resolution. Thus, the section between each harmonic order is divided into 12 frequency components.
Rms component
Frequency [Hz]60 120 180 240dc
2nd harmonic 3rd harmonic 4th harmonicFundamental signal
When the fundamental signal is 60 Hz
1.5 Terminology Related to Harmonics

1-19IM 761922-06E
Product Overview3
2
1
4
5
6
7
8
9
10
11
12
13
14
Index
Harmonic GroupThecombinedvalueofaharmonicanditsadjacentinterharmonics(rmsvalue).Thecomputingmethodtocombinetheharmonicanditstwoadjacentinterharmonicsisnotsimple addition, but the square root of the sum of the square of each component. A half of the amplitude is included for the interharmonic that is in the middle of two harmonics.
When the fundamental signal is 50 HzHarmonic group Include a half of the amplitude
Ck
k k+1k-1 k+5k+4k+3k+2k-2k-3k-4k-5
Harmonic groupWhen the fundamental signal is 60 Hz
Ck
k k+1k-1 k+5k+4k+3k+2k-2k-3k-4k-5 k+6k-6
k–5C2
k+iC22
k+5C2
2+Gg, n = + (for 50 Hz)
i=–4
4
k–6C2
k+iC22
k+6C2
2+Gg, n =
Ck: frequency component for every 5 kHz
+ (for 60 Hz)i=–5
5
Harmonic SubgroupThecombinedvalue(rmsvalue)ofaharmonicanditstwoadjacentinterharmonics.Thecomputing method to combine the components is the average of the sum of the squares as with the harmonic group.
When the fundamental signal is 50 HzHarmonic subgroup
k k+1k-1
Ck
k+iC2Gsg, n =i=–1
1
Ck: frequency component for every 5 kHz
THDG (Group Total Harmonic Distortion)The ratio of the sum of all harmonic groups of orders 2 to 40 with respect to the group related to the fundamental wave.
k = 2
40
Ug(k)2
Ug(1)×100 k = 2
40
Ig(k)2
Ig(1)×100
Ug(k), Ig(k): rms value of the harmonic group of each orderk: harmonic order
• V THDG • A THDG
1.5 Terminology Related to Harmonics

1-20 IM 761922-06E
THDS (Subgroup Total Harmonic Distortion)The ratio of the sum of all harmonic sub groups of orders 2 to 40 with respect to the sub group related to the fundamental wave.
k = 2
40
Usg(k)2
Usg(1)×100 k = 2
40
Isg(k)2
Isg(1)×100
Usg(k), Isg(k): rms value of the harmonic subgroup of each orderk: harmonic order
• V THDS • A THDS
Interharmonic GroupThe combined value (rms value) of all interharmonic components between two consecutive harmonic frequencies.
When the fundamental signal is 50 HzInterharmonic group
When the fundamental signal is 60 HzInterharmonic group
Interharmonic Center SubgroupThe combined value (rms value) of all interharmonic components between two consecutiveharmonicfrequenciesexcludingthefrequencycomponentsadjacenttotheharmonic frequencies.
When the fundamental signal is 50 HzInterharmonic center subgroup
When the fundamental signal is 60 HzInterharmonic center subgroup
1.5 Terminology Related to Harmonics

1-21IM 761922-06E
Product Overview3
2
1
4
5
6
7
8
9
10
11
12
13
14
Index
200% Short-Term RelaxationCalculatingtheperiodduringwhich150%oftheapplicablelimitisexceededanddetermining whether or not the relaxation condition applies
H
arm
onic
cur
rent
of e
ach
orde
r
150% of the limits
Measured values
Test observation period
t1 t3t2
When the test observation period is less than 100 minutest1 + t2 + t3 × 10% of the test observation period
When the test observation period is greater than or equal to 100 minutest1 + t2 + t3 < 10 minutes
POHC: The combined value of all odd harmonic currents greater than or equal to order 21 (Partial Odd Harmonic Current)
k = 21, 23
39
I(k)2
I(k): rms current of odd harmonics above and including order 21k: harmonic order, odd value above and including 21
PoHC Maximum: The maximum value of the combined value of all odd harmonic currents greater than or equal to order 21
ThePOHCmaximumderivedfromindividualmeasureddatapointswithinthemeasurementtime.IfthisvalueislessthanthePOHCLimitbelow,therelaxationcondition (see page 1-12) is applied.
POHC Limit
k = 21, 23
39
IL(k)2
IL(k): limits of odd harmonics above and including 21 as specified by the applicable standardk: harmonic order, odd value above and including 21
1.5 Terminology Related to Harmonics

1-22 IM 761922-06E
Crest FactorThe crest factor is defined as the ratio of the peak value of the waveform to the rms value.
Peak valueRMS valueCrest factor (CF) =
Peak value
RMS value
Input signal waveform
The crest factor on the WT is determined by the maximum peak value that can be applied for rated input in terms of a multiplication factor.
Peak value that can be input
Measurement rangeCrest factor (CF) =
You can select a crest factor of 3 or 6 on the WT3000 or WT3000E. For details on themeasurementaccuracyandcrestfactoroftheIECstandard,seechapter14,“Specifications.”Highlyaccuratemeasurementscanbeperformedbysettingthecrestfactor to 3.
1.5 Terminology Related to Harmonics

2-1IM 761922-06E
Preparation before Use
3
2
1
4
5
6
7
8
9
10
11
12
13
14
Index
2.1 Connecting the WT and the PC
CAUTIONWhen connecting or disconnecting communication cables, make sure to turn OFF thePCandtheWT.Otherwise,erroneousoperationordamagetotheinternalcircuitry may result.
French
ATTENTIONToujoursmettrelePCetleWThorstensionavantdebrancheroudedébrancherdescâblesdecommunication,pourévitertoutdysfonctionnementoupanneducircuit interne.
When Controlling the WT through the GP-IBTheGP-IBavailableontheWTisa24-pinconnectorthatconformstotheIEEESt’d488-1978.UseaGP-IBcablethatconformstothisstandard.ConnectthecabletotheGP-IBconnector on the rear panel of the WT. For details on the connection procedure and the specifications of the GP-IB interface, see the WT main unit user’s manual.• WT3000 CommunicationInterfaceUser’sManualIM760301-17EontheCD• WT3000E CommunicationInterfaceUser’sManualIMWT3001E-17ENontheCD
UseanappropriateconnectorforyourPCtoconnecttheotherendoftheGP-IBcable.
Chapter 2 Preparation before Use
2-2 IM 761922-06E
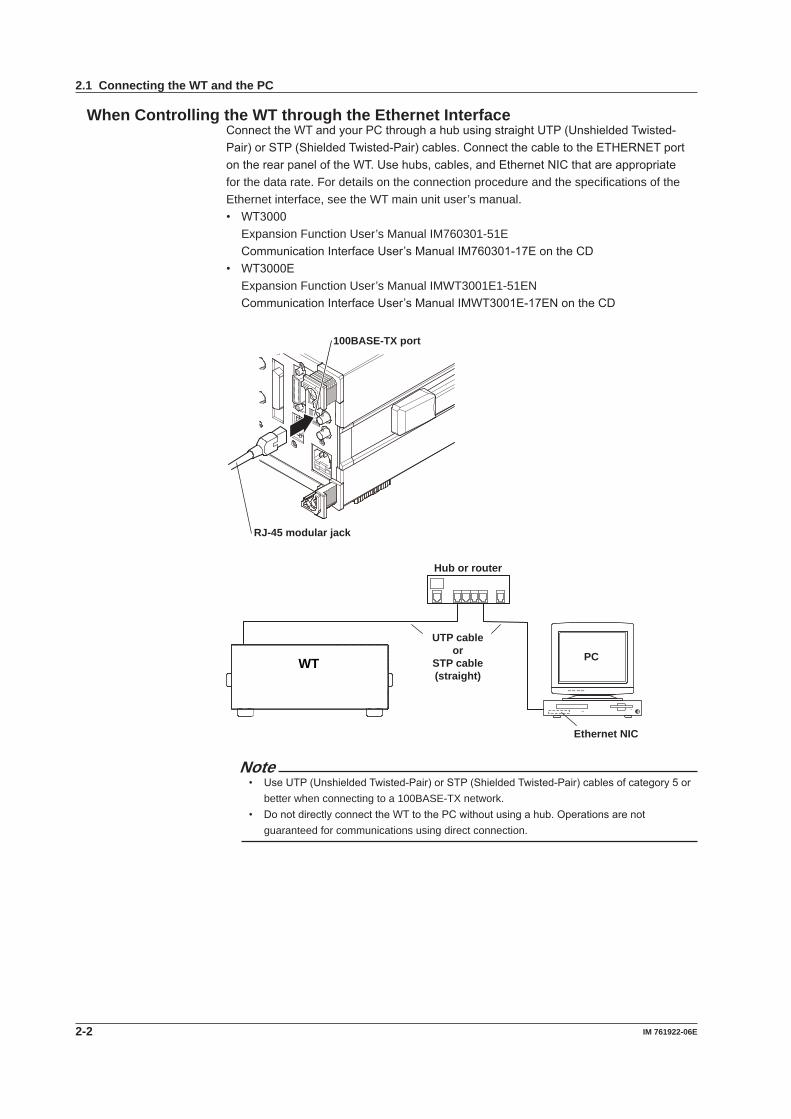
When Controlling the WT through the Ethernet InterfaceConnecttheWTandyourPCthroughahubusingstraightUTP(UnshieldedTwisted-Pair)orSTP(ShieldedTwisted-Pair)cables.ConnectthecabletotheETHERNETportontherearpaneloftheWT.Usehubs,cables,andEthernetNICthatareappropriatefor the data rate. For details on the connection procedure and the specifications of the Ethernet interface, see the WT main unit user’s manual.• WT3000 Expansion Function User’s Manual IM760301-51E CommunicationInterfaceUser’sManualIM760301-17EontheCD• WT3000E Expansion Function User’s Manual IMWT3001E1-51EN CommunicationInterfaceUser’sManualIMWT3001E-17ENontheCD
100BASE-TX port
RJ-45 modular jack
Hub or router
UTP cableor
STP cable(straight)
PC
Ethernet NIC
WT
Note• UseUTP(UnshieldedTwisted-Pair)orSTP(ShieldedTwisted-Pair)cablesofcategory5or
better when connecting to a 100BASE-TX network.• DonotdirectlyconnecttheWTtothePCwithoutusingahub.Operationsarenot
guaranteed for communications using direct connection.
2.1 Connecting the WT and the PC
2-3IM 761922-06E
Preparation before Use
3
2
1
4
5
6
7
8
9
10
11
12
13
14
Index
2.2 Setting the GP-IB Control
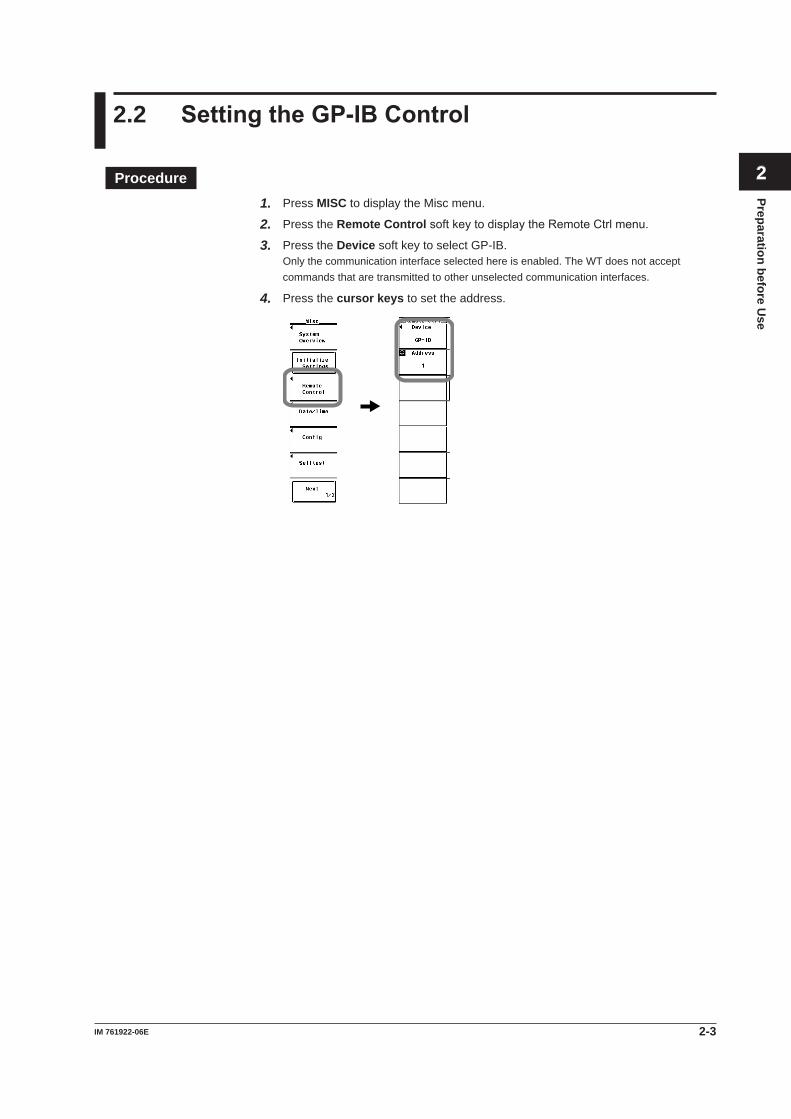
Procedure1. Press MISC to display the Misc menu.
2. Press the Remote ControlsoftkeytodisplaytheRemoteCtrlmenu.
3. Press the Device soft key to select GP-IB.Only the communication interface selected here is enabled. The WT does not accept commands that are transmitted to other unselected communication interfaces.
4. Press the cursor keys to set the address.
2-4 IM 761922-06E
ExplanationTo use the software in On-Line mode through the GP-IB interface, operate the WT to select GP-IB.
Setting the AddressSet the WT address within the following range.1 to 30
Each device that can be connected via GP-IB has a unique address within the GP-IB system. This address is used to distinguish the device from others. Therefore, make sure that the WT address does not overlap with other devices when connecting the WT to the PC.
Note• Donotchangetheaddresswhilethecontroller(PC)orotherdevicesareusingtheGP-IB
system.• WhenconnectingtheWTtoasinglePCandcontrollingtheWTusingthissoftware,multiple
communication interfaces cannot be used simultaneously.• UseaGP-IBcardbyNationalInstrumentsonthePCend.Fordetails,seesection1.2.• Thesoftwaremaynotoperatecorrectly,ifanadapterisinsertedinthemiddleofthe
connectionbetweentheWTandthePC(forexample,GP-IB-to-USBadapter).Fordetails,contact your nearest YOKOGAWA dealer.
2.2 Setting the GP-IB Control
2-5IM 761922-06E
Preparation before Use
3
2
1
4
5
6
7
8
9
10
11
12
13
14
Index
2.3 Setting the Ethernet Control
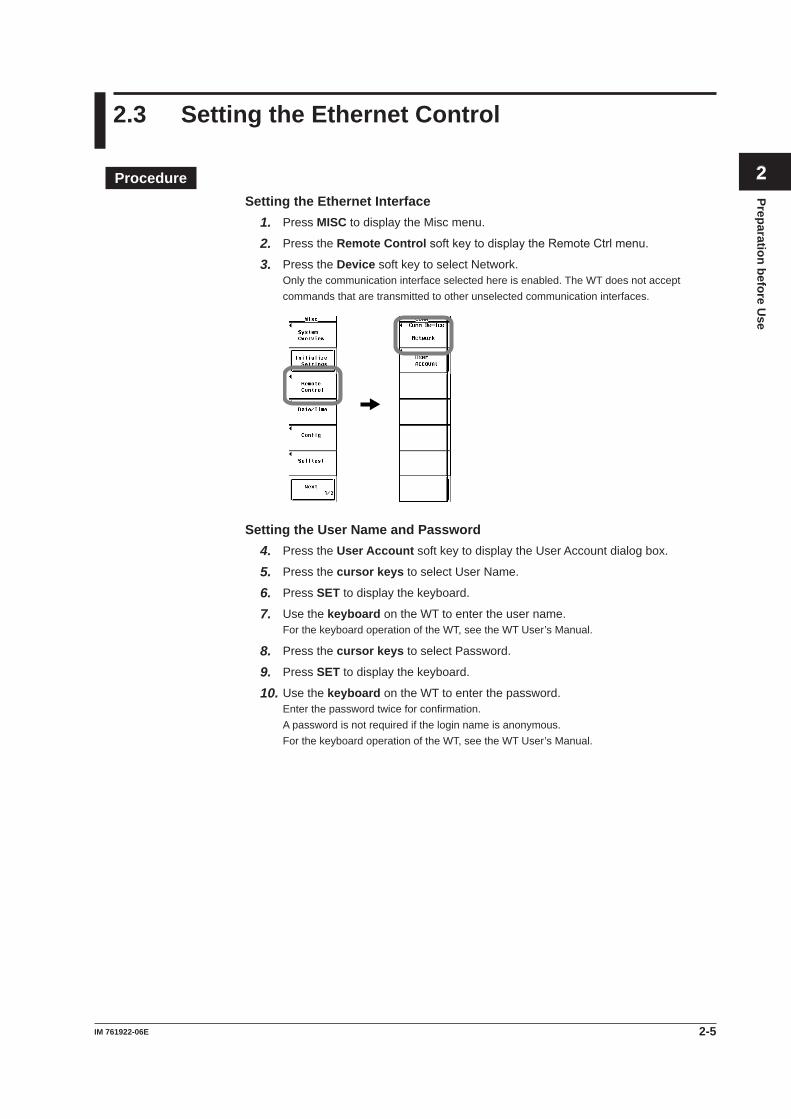
ProcedureSetting the Ethernet Interface
1. Press MISC to display the Misc menu.
2. Press the Remote ControlsoftkeytodisplaytheRemoteCtrlmenu.
3. Press the Device soft key to select Network.Only the communication interface selected here is enabled. The WT does not accept commands that are transmitted to other unselected communication interfaces.
Setting the User Name and Password4. Press the User Account soft key to display the User Account dialog box.
5. Press the cursor keys to select User Name.
6. Press SET to display the keyboard.
7. Use the keyboard on the WT to enter the user name.For the keyboard operation of the WT, see the WT User’s Manual.
8. Press the cursor keys to select Password.
9. Press SET to display the keyboard.
10. Use the keyboard on the WT to enter the password.Enter the password twice for confirmation.A password is not required if the login name is anonymous.For the keyboard operation of the WT, see the WT User’s Manual.
2-6 IM 761922-06E
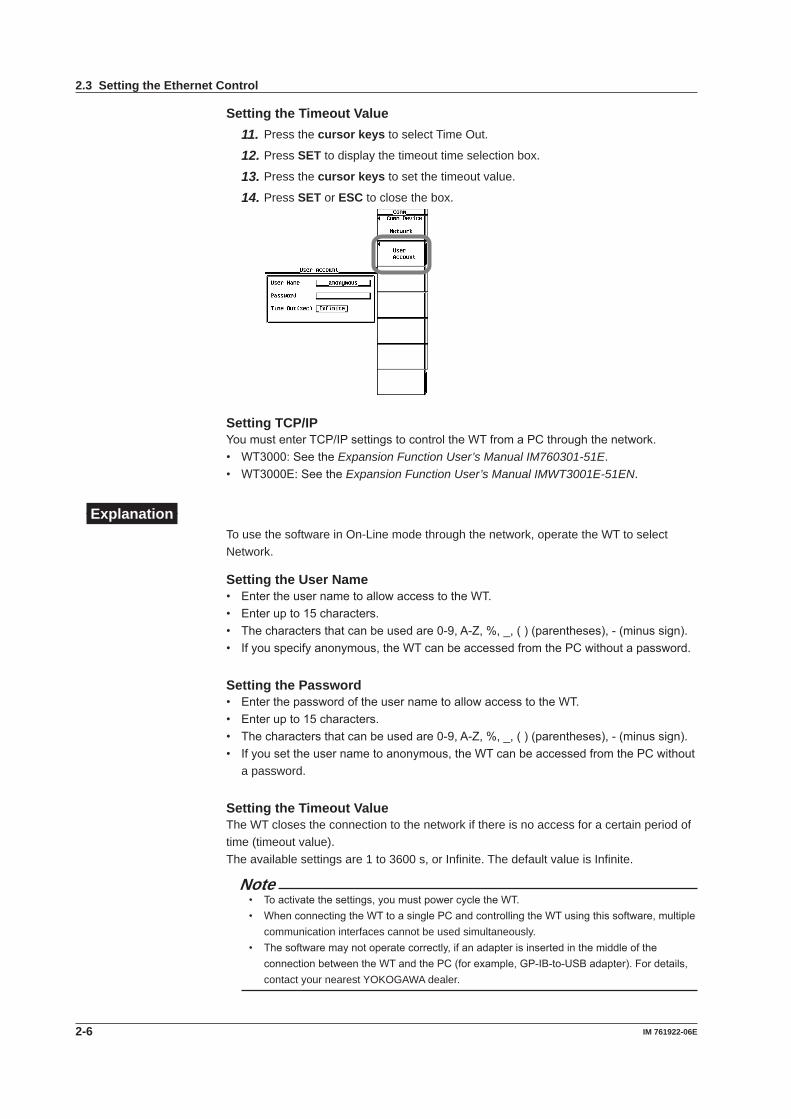
Setting the Timeout Value11. Press the cursor keys to select Time Out.
12. Press SET to display the timeout time selection box.
13. Press the cursor keys to set the timeout value.
14. Press SET or ESC to close the box.
Setting TCP/IPYoumustenterTCP/IPsettingstocontroltheWTfromaPCthroughthenetwork.• WT3000:SeetheExpansion Function User’s Manual IM760301-51E.• WT3000E:SeetheExpansion Function User’s Manual IMWT3001E-51EN.
ExplanationTo use the software in On-Line mode through the network, operate the WT to select Network.
Setting the User Name• EntertheusernametoallowaccesstotheWT.• Enterupto15characters.• Thecharactersthatcanbeusedare0-9,A-Z,%,_,()(parentheses),-(minussign).• Ifyouspecifyanonymous,theWTcanbeaccessedfromthePCwithoutapassword.
Setting the Password• EnterthepasswordoftheusernametoallowaccesstotheWT.• Enterupto15characters.• Thecharactersthatcanbeusedare0-9,A-Z,%,_,()(parentheses),-(minussign).• Ifyousettheusernametoanonymous,theWTcanbeaccessedfromthePCwithout
a password.
Setting the Timeout ValueThe WT closes the connection to the network if there is no access for a certain period of time (timeout value).The available settings are 1 to 3600 s, or Infinite. The default value is Infinite.
Note• Toactivatethesettings,youmustpowercycletheWT.• WhenconnectingtheWTtoasinglePCandcontrollingtheWTusingthissoftware,multiple
communication interfaces cannot be used simultaneously.• Thesoftwaremaynotoperatecorrectly,ifanadapterisinsertedinthemiddleofthe
connectionbetweentheWTandthePC(forexample,GP-IB-to-USBadapter).Fordetails,contact your nearest YOKOGAWA dealer.
2.3 Setting the Ethernet Control
2-7IM 761922-06E
Preparation before Use
3
2
1
4
5
6
7
8
9
10
11
12
13
14
Index
2.4 Installing the Software
ProcedureHavetheCDcontainingthesoftwareready.Exitallprogramsthatarecurrentlyrunningbefore starting the installation. If an older version of the Harmonic/Flicker Measurement Software is installed, uninstall it first (see page 2-10).The following procedure explains how to install the software on Windows 7. The windows that appear will vary depending on the operating system.
1. TurnonthePCandstartWindows.Logonasanadministrator.
2. InserttheinstallationdiskthatcontainsthissoftwareintotheCDdrive.
3. OnthePC,selecttheCDdrive.
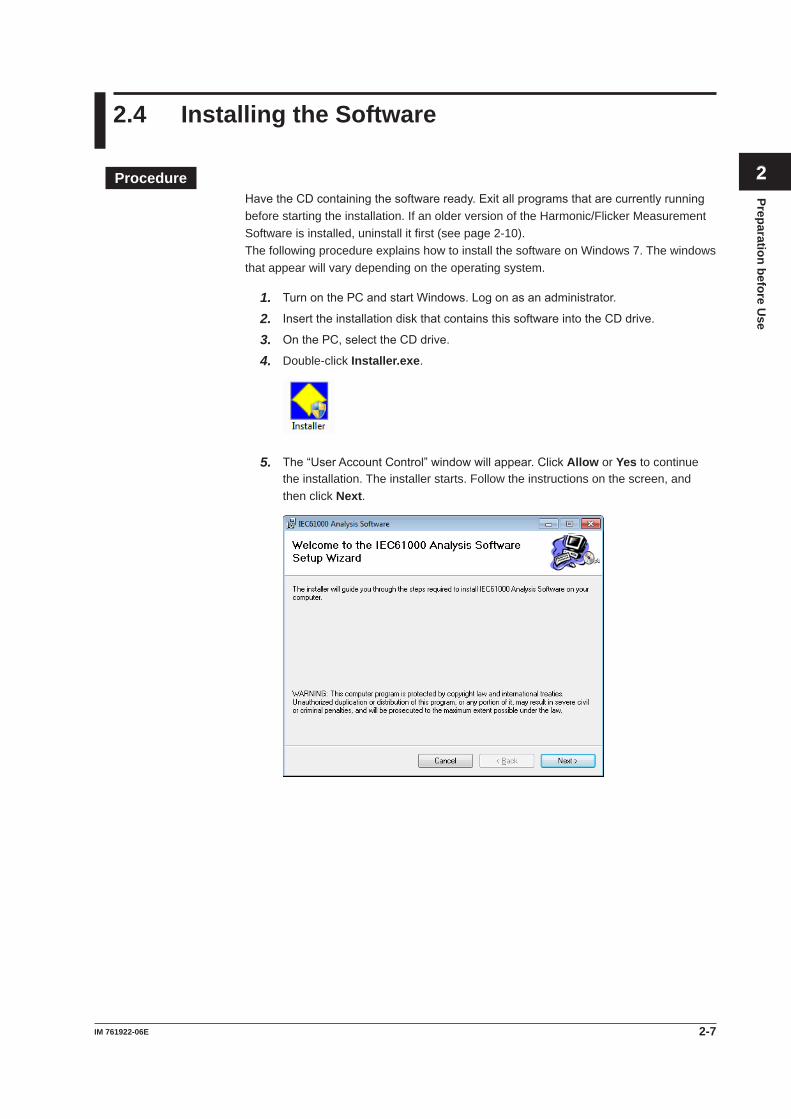
4. Double-click Installer.exe.
5. The“UserAccountControl”windowwillappear.ClickAllow or Yes to continue the installation. The installer starts. Follow the instructions on the screen, and then click Next.

2-8 IM 761922-06E
6. If you agree with the license agreement, select I Agree, and click Next. Otherwise, select I Do Not Agree. The installation will be canceled.
7. Select the installation destination, and click Next.ClickBrowse to specify the destination. The default installation destination is as follows:C:\ProgramFiles\YOKOGAWA\PowerViewerPlus
2.4 Installing the Software

2-9IM 761922-06E
Preparation before Use
3
2
1
4
5
6
7
8
9
10
11
12
13
14
Index
8. A window prompting you to start the installation appears. If the installation settings are okay, click Next. The software installation starts.
ClickBack if you want to change the installation settings.
ClickCancel to cancel the installation.
9. When the software installation finishes normally, the following window appears. ClickClosetocompletetheinstallation.YOKOGAWA>IEC61000Analysis>IEC61000willbeaddedtoAllProgramsintheWindowsStartmenu.
Note Aftertheinstallationfinishes,aProgramCompatibilityAssistantwindowmayappear.The
installationhasbeencompletedsuccessfully,soselect“This program installed correctly”or Cancel to close the window.
2.4 Installing the Software
2-10 IM 761922-06E
Uninstalling the SoftwareThis section explains how to uninstall the software on Windows 7.
1. On the Windows Start menu, click Control Panel.
2. ClickUninstall a programintheControlPanel.
3. Right-click IEC61000 Analysis Software, and then click Uninstall.
4. A uninstallation confirmation window appears.
ClickYestouninstallIEC61000AnalysisSoftware.
ClickNo to cancel.
5. OnWindowsVistaorWindows7,the"UserAccountControl"windowwillappearduringtheuninstallation.ClickAllow or Yes to continue the installation. The uninstallation will continue.
2.4 Installing the Software

3-1IM 761922-06E
Starting and Using the Softw
are
3
2
1
4
5
6
7
8
9
10
11
12
13
14
Index
3.1 Starting the Software
ProcedureStarting the Software
1. ChooseStart > All Programs > YOKOGAWA > IEC61000 Analysis > IEC61000.The procedure above applies when the default software installation destination and program folder are used. If you changed the installation destination or program folder at installation, select the corresponding location.
2. The“UserAccountControl”windowwillappear.ClickAllow or Yes.
TheIECLauncherappears.Useittoselecttheappropriatestandard.
Selecting a Standard3. Select IEC 61000-3-2toopentheIEC61000-3-2HarmonicMeasurement
Software.
Closes the IEC launcher
Starts the IEC 61000-3-2Harmonic Measurement Software
Chapter 3 Starting and Using the Software
3-2 IM 761922-06E
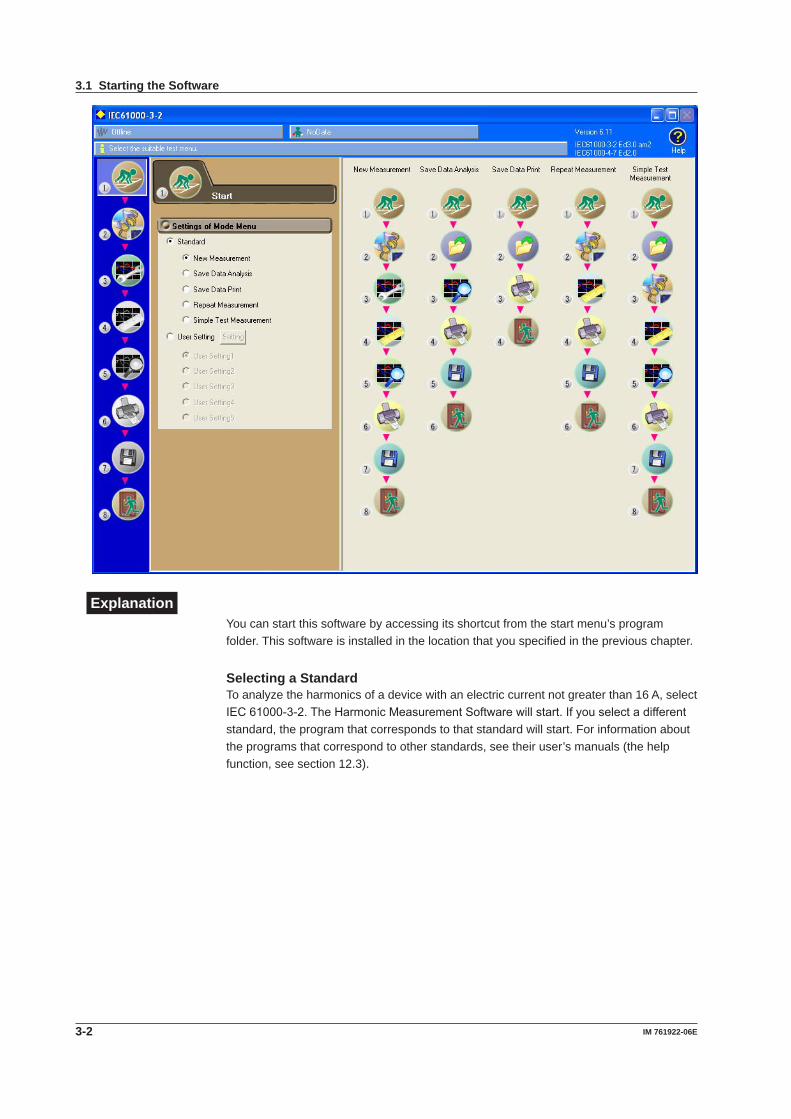
ExplanationYou can start this software by accessing its shortcut from the start menu’s program folder. This software is installed in the location that you specified in the previous chapter.
Selecting a StandardTo analyze the harmonics of a device with an electric current not greater than 16 A, select IEC61000-3-2.TheHarmonicMeasurementSoftwarewillstart.Ifyouselectadifferentstandard, the program that corresponds to that standard will start. For information about the programs that correspond to other standards, see their user’s manuals (the help function, see section 12.3).
3.1 Starting the Software

3-3IM 761922-06E
Starting and Using the Softw
are
3
2
1
4
5
6
7
8
9
10
11
12
13
14
Index
3.2 Basic Operations
Information area
Setting and display areaThe following types of information are displayed.• Configuration dialog boxes• Measurement and judgment results• Print previews• Information about loaded or saved files
Menu areaThe test schedule menu items, such as Connection, Measure, and Print, appear here.When you click an icon, its submenu appears. Icons that cannot be selected are grayed out.
Submenu areaIn the Start window, you select the test schedule menu here. In other windows, boxes for configuring the settings of the selected menu item appear here.
The currently selected icon is highlighted.
Judgment results (chapter 8)
Compliance judgment standard number and edition
Software version
Help button (chapter 12)
Information bar: Notices appear here.
Connection status: Online/offline (see chapter 6)

3-4 IM 761922-06E
Menu Area Icons
StartUse to select and edit test schedule menus. There are five preset standard menus available, in addition to custom menus that you can make yourself (located under the“UserSetting”optionbutton).
OpenUse to open the following kinds of files:•Settinginformationfilesthatcontaininformationsuchasmeasurementconditionsandjudgmentconditions.
•MeasureddatafilesthatcontainmeasureddataacquiredbythePCfromaWT.
ConnectionUsetoconnectthePCtotheWTthroughaGP-IBorEthernetinterface.
SettingUsetosetmeasurementandjudgmentconditions.
MeasureUse to measure harmonics. You can also preview test data.
AnalysisUse to display measured results using a variety of lists and graphs.
PrintYou can attach comments and titles to a list of measured values and print the list as a report.
SaveUse to save the following kinds of files.•Settinginformationfilesthatcontaininformationsuchasmeasurementconditionsandjudgmentconditions.
•MeasureddatafilesthatcontainmeasureddataacquiredbythePCfromaWT.•CSVfilesthatcontainmeasureddataandwaveformdata.
ExitUse to close the software.
3.2 Basic Operations

4-1IM 761922-06E
Using the Start and Exit Pages
3
2
1
4
5
6
7
8
9
10
11
12
13
14
Index
4.1 Selecting a Test Schedule Menu
Procedure
1. Select the icon in the menu area. The Start submenu appears.
Standard (page 4-2)There are five standard menus.
User Setting (page 4-3)You can select and edit specific custom test schedule menus.
Chapter 4 Using the Start and Exit Pages
4-2 IM 761922-06E
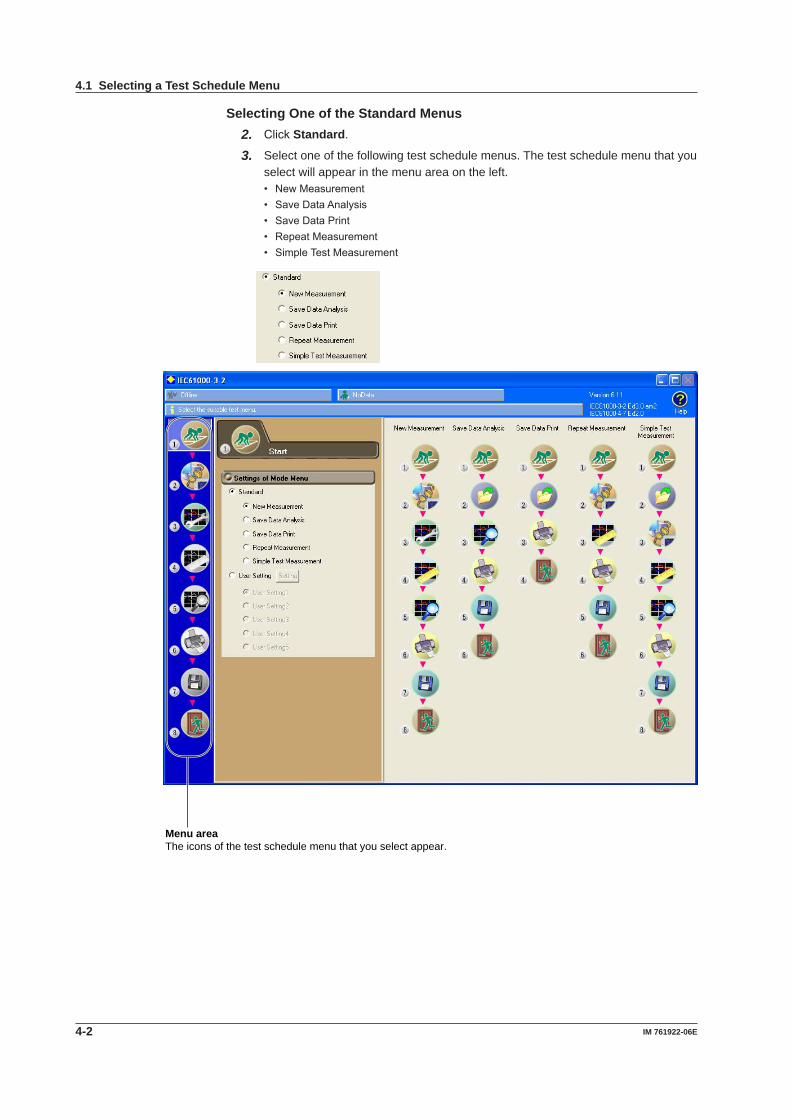
Selecting One of the Standard Menus2. ClickStandard.
3. Select one of the following test schedule menus. The test schedule menu that you select will appear in the menu area on the left.• NewMeasurement• SaveDataAnalysis• SaveDataPrint• RepeatMeasurement• SimpleTestMeasurement
Menu areaThe icons of the test schedule menu that you select appear.
4.1 Selecting a Test Schedule Menu

4-3IM 761922-06E
Using the Start and Exit Pages
3
2
1
4
5
6
7
8
9
10
11
12
13
14
Index
Creating Your Own Custom Menu (User Setting)2. ClickUser Setting.
3. ClickSetting. The menu customization dialog box appears (the dialog box is labeled“Testmenuusersetting”).
4. Use the check boxes to select the menu items that you want to include in each of thefivecustommenus(labeledas“UserSetting”1to5inthestartwindow).
5. ClickOK.
6. Selectthecustommenuthatyouwanttousefrom“UserSetting”1to5.Thecustom menu that you select will appear in the menu area on the left.
4.1 Selecting a Test Schedule Menu

4-4 IM 761922-06E
ExplanationSelecting a Test Schedule MenuA test schedule menu lays out the overall test structure. You can choose from test schedule menus that contain different combinations of the following 9 steps. For more information on each step, see section 1.1.
Start: Select and edit test schedule menus.
Open: Load measured data and WT setting information files.
Connection:ConfiguretheconnectionbetweenthePCandaWT.
Setting: Set compatibility and measurement conditions.
Measure: Measure voltage fluctuation and flicker.
Analysis: Display measured results as bar and trend graphs.
Print: Print screen images and reports.
Save: Save measured data and setting information files.
Exit:Closethesoftware.
Icon Display
Icon NumberThis number indicates an icon’s order in a menu.
4.1 Selecting a Test Schedule Menu
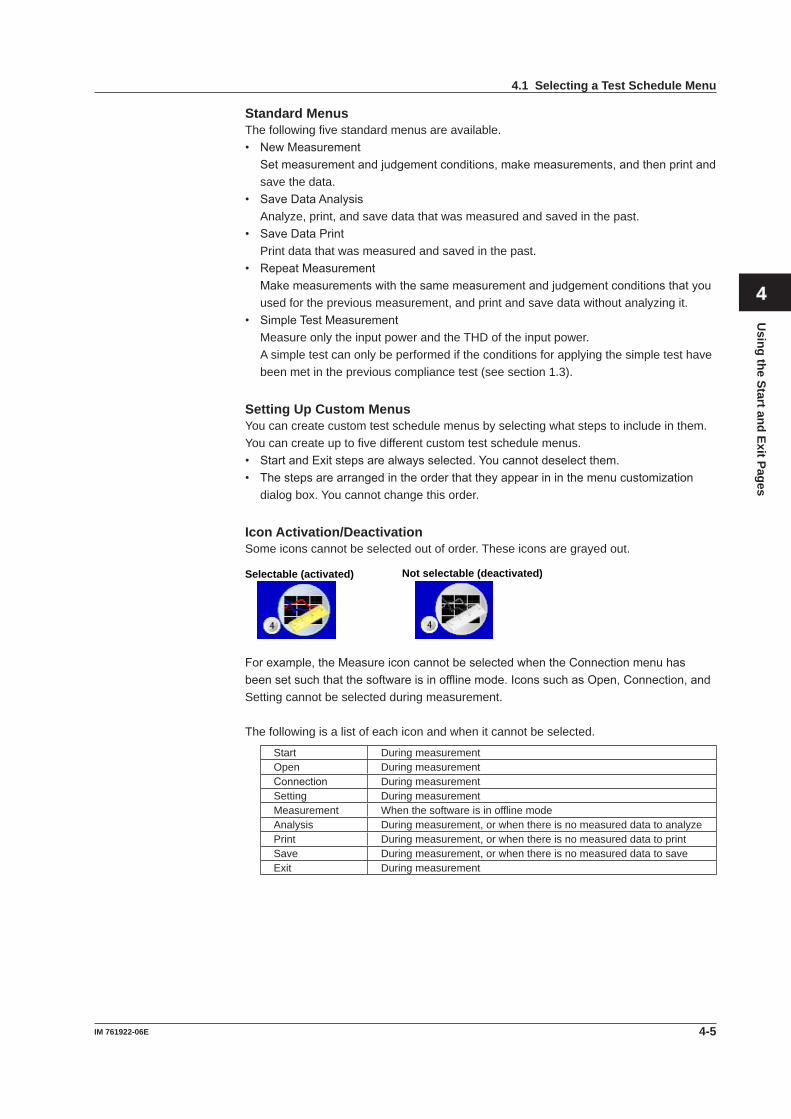
4-5IM 761922-06E
Using the Start and Exit Pages
3
2
1
4
5
6
7
8
9
10
11
12
13
14
Index
Standard MenusThe following five standard menus are available.• NewMeasurement Setmeasurementandjudgementconditions,makemeasurements,andthenprintand
save the data.• SaveDataAnalysis Analyze, print, and save data that was measured and saved in the past.• SaveDataPrint Print data that was measured and saved in the past.• RepeatMeasurement Makemeasurementswiththesamemeasurementandjudgementconditionsthatyou
used for the previous measurement, and print and save data without analyzing it.• SimpleTestMeasurement Measure only the input power and the THD of the input power. A simple test can only be performed if the conditions for applying the simple test have
been met in the previous compliance test (see section 1.3).
Setting Up Custom MenusYou can create custom test schedule menus by selecting what steps to include in them. You can create up to five different custom test schedule menus.• StartandExitstepsarealwaysselected.Youcannotdeselectthem.• Thestepsarearrangedintheorderthattheyappearininthemenucustomization
dialog box. You cannot change this order.
Icon Activation/DeactivationSome icons cannot be selected out of order. These icons are grayed out.
Selectable (activated) Not selectable (deactivated)
Forexample,theMeasureiconcannotbeselectedwhentheConnectionmenuhasbeensetsuchthatthesoftwareisinofflinemode.IconssuchasOpen,Connection,andSetting cannot be selected during measurement.
The following is a list of each icon and when it cannot be selected.
Start During measurementOpen During measurementConnection During measurementSetting During measurementMeasurement When the software is in offline modeAnalysis During measurement, or when there is no measured data to analyzePrint During measurement, or when there is no measured data to printSave During measurement, or when there is no measured data to saveExit During measurement
4.1 Selecting a Test Schedule Menu
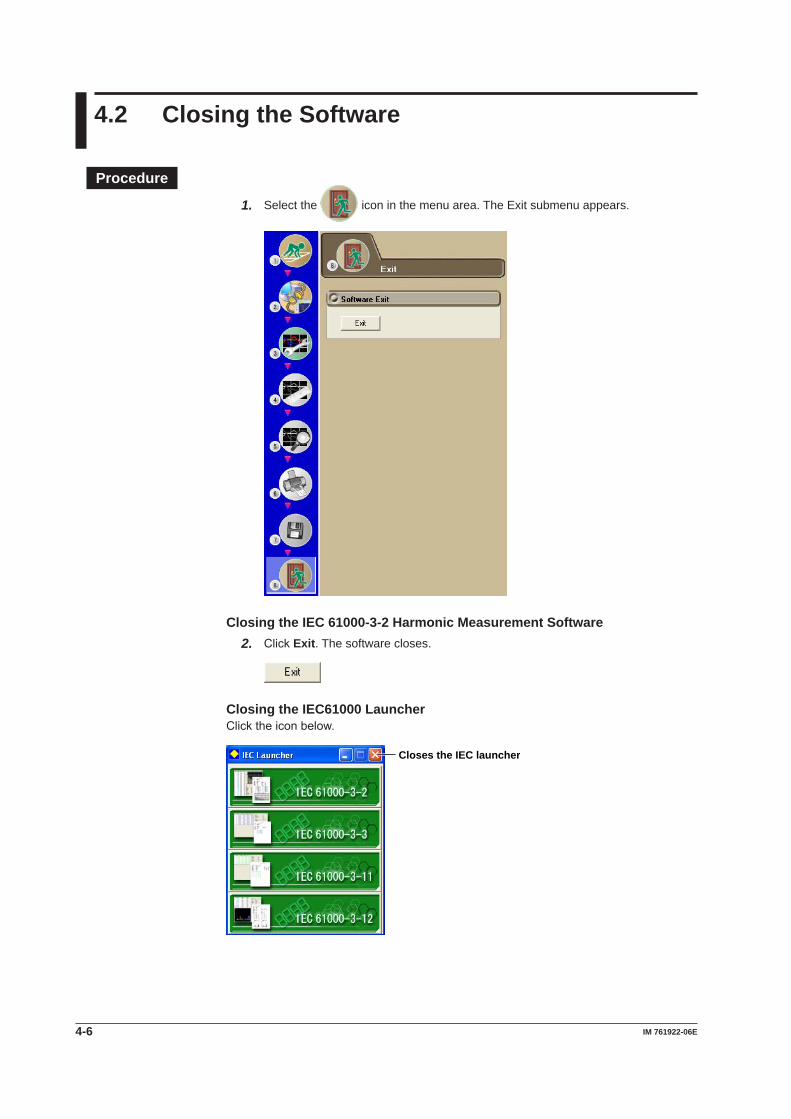
4-6 IM 761922-06E
4.2 Closing the Software
Procedure
1. Select the icon in the menu area. The Exit submenu appears.
Closing the IEC 61000-3-2 Harmonic Measurement Software2. ClickExit. The software closes.
Closing the IEC61000 LauncherClicktheiconbelow.
Closes the IEC launcher
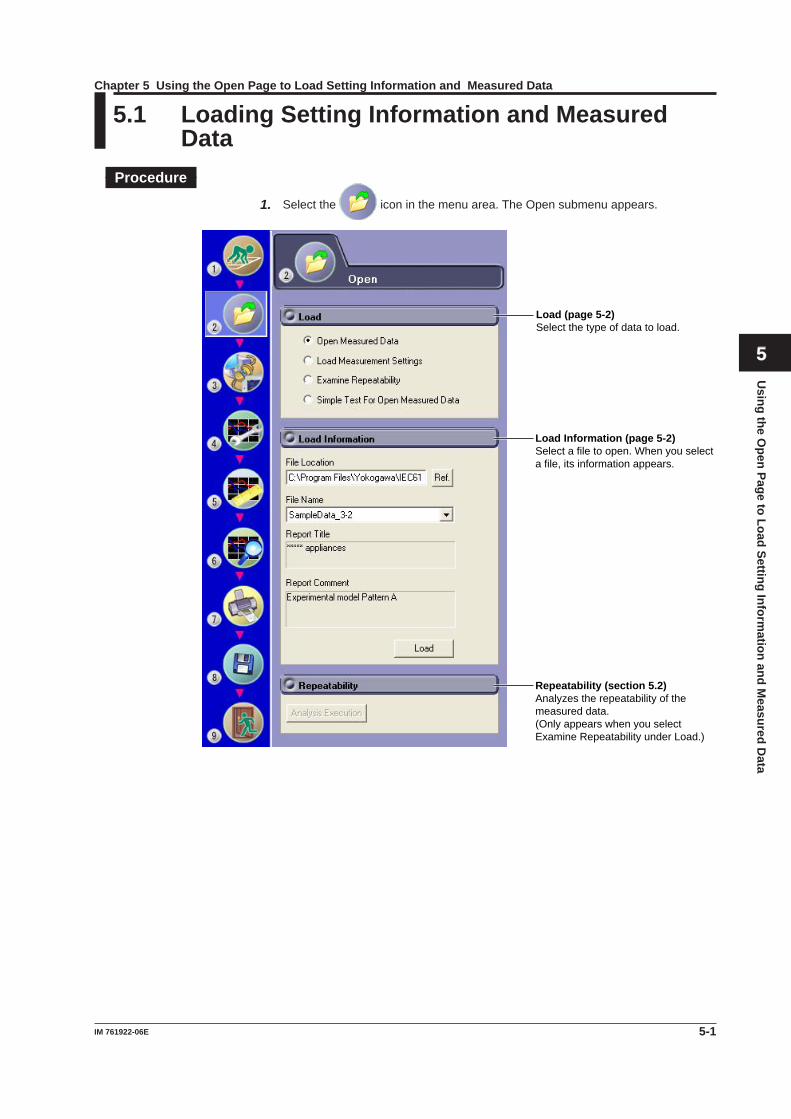
5-1IM 761922-06E
Using the O
pen Page to Load Setting Information and M
easured Data
3
2
1
4
5
6
7
8
9
10
11
12
13
14
Index
5.1 Loading Setting Information and Measured Data
Procedure
1. Select the icon in the menu area. The Open submenu appears.
Load (page 5-2)Select the type of data to load.
Load Information (page 5-2)Select a file to open. When you select a file, its information appears.
Repeatability (section 5.2)Analyzes the repeatability of the measured data.(Only appears when you select Examine Repeatability under Load.)
Chapter 5 Using the Open Page to Load Setting Information and Measured Data

5-2 IM 761922-06E
Selecting the Type of Data to Load2. Select one of the two data types listed under Load.
Note• Inthetestschedulemenudescribedinsection4.1,selectSimpleTestMeasurement,and
only if you are about to execute a simple compliance test, select the Simple Test For Open Measured Data option.
• Ifyouhavealreadyexecutedatestandwanttoanalyzethesavedcompliancetestresultsor simple compliance test results, select the Open Measured Data option.
Selecting a File to Open3. Specify the file location. There are two places where you can specify the file
location.• UnderLoadInformationinthesubmenu• AtthetopofthesettinganddisplayareaWhen you specify the file location, information about the files that can be loaded appears in the setting and display area.
4. Select a file to open. When there is more than one available file, you can select which file to open using one of the following two methods.• ClicknexttotheFileNameboxunderLoadInformation.Alistofavailablefiles
appears. Select a file from the list.• Selectafiletoopenfromoneofthefileslistedinthesettinganddisplayarea.
5. ClickLoad, or double-click the file you want to open. The software will open the measured data or setting information file.
Note• Whenthesoftwareisinonlinemode,itwillswitchtoofflinemodeifyouloadsetting
information or measured data.• Ifanerroroccurswhileloadingthesettinginformation,thesettingsareresettotheirdefault
values.• Ifanerroroccurswhileloadingmeasureddataorsettinginformation,thedatamaynotbe
loadedproperly.Confirmthefilenameandextensionandthenreopenthefile.• Youcannotloadsettinginformation,measureddata,orwaveformdatawhilemaking
measurements.
5.1 Loading Setting Information and Measured Data

5-3IM 761922-06E
Using the O
pen Page to Load Setting Information and M
easured Data
3
2
1
4
5
6
7
8
9
10
11
12
13
14
Index
Configuring File Information Display Settings1. Right-click the file information heading area at the top of the setting and display
area. A list of the different types of information that can be displayed appears.
2. Select the type of information that you want to be displayed.
ExplanationLoading Setting InformationYou can load the setting information that has been saved using the procedure described in section 11.1.• AdashappearsintheGeneralDataandManualDatacolumnsforsettinginformation
files.• Settinginformationfilenameshavethefollowingextension. Extension: .ini• Settinginformationfilescontainthefollowing:
• Measurementandjudgmentconditions(seechapter7) DatathathasbeenacquiredfromtheWTorloadedfromafilecanbejudgedusing
loadedjudgmentconditions.• Displaysettings(seechapters8and9).• Reporttitlesandcomments(seesection10.1) You can put comments and titles on reports of data acquired from the WT or loaded
from files, and then print and save the reports. For more information about printing and saving, see chapters 10 and 11.
Loading Measured DataYou can load the measured data, waveform data, and setting information that has been saved using the procedure described in section 11.1.The following two types of measured data files are available.• Filesthatonlycontainthemeasureddataofcompliancetests(donotcontainthe
measured data of simple tests)• AnasteriskappearsintheMeasureddatacolumnforfilesthatcontainmeasured
data.• Filesarecomposedoftwotypesoffileswiththefollowingextensions.
• .fdt Measureddata(compliancetestdata)• .ini Settinginformation
• Filesthatcontainboththemeasureddataofcompliancetestsandthemeasureddataof simple tests• ThesefilesaresavedwhenyouselectSimpleTestMeasurementinthetest
schedule menu described in section 4.1, execute a simple compliance test, and save the measured data of the test.
• Two asterisks appear in the Measured Data column of the file information display area.• Filesarecomposedoftwotypesoffileswiththefollowingextensions.
• .fdt Measureddata(Thefollowingtwotypesofdataareincluded.)• Simpletestdata• Compliancetestdatathathasbeenspecifiedasthetestreferenceforthe
simple test• .ini Settinginformation
5.1 Loading Setting Information and Measured Data
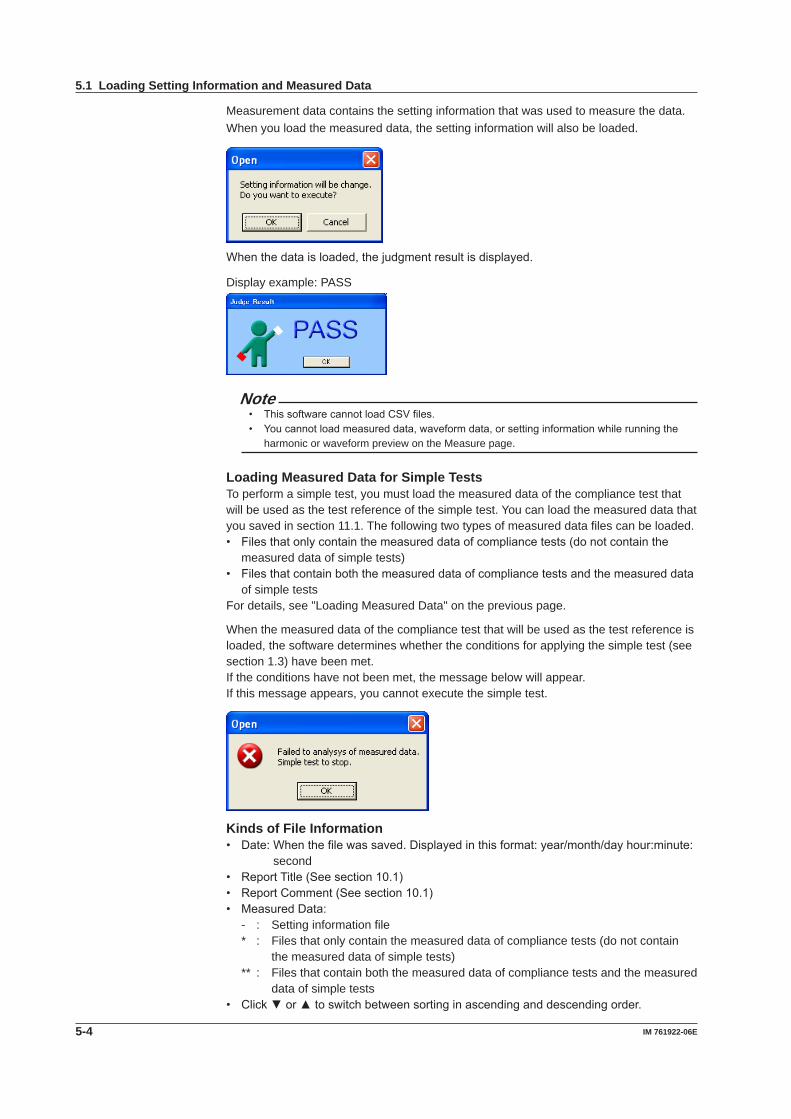
5-4 IM 761922-06E
Measurement data contains the setting information that was used to measure the data.When you load the measured data, the setting information will also be loaded.
Whenthedataisloaded,thejudgmentresultisdisplayed.
Display example: PASS
Note• ThissoftwarecannotloadCSVfiles.• Youcannotloadmeasureddata,waveformdata,orsettinginformationwhilerunningthe
harmonic or waveform preview on the Measure page.
Loading Measured Data for Simple TestsTo perform a simple test, you must load the measured data of the compliance test that will be used as the test reference of the simple test. You can load the measured data that you saved in section 11.1. The following two types of measured data files can be loaded.• Filesthatonlycontainthemeasureddataofcompliancetests(donotcontainthe
measured data of simple tests)• Filesthatcontainboththemeasureddataofcompliancetestsandthemeasureddata
of simple testsFor details, see "Loading Measured Data" on the previous page.
When the measured data of the compliance test that will be used as the test reference is loaded, the software determines whether the conditions for applying the simple test (see section 1.3) have been met.If the conditions have not been met, the message below will appear.If this message appears, you cannot execute the simple test.
Kinds of File Information• Date:Whenthefilewassaved.Displayedinthisformat:year/month/dayhour:minute:
second• ReportTitle(Seesection10.1)• ReportComment(Seesection10.1)• MeasuredData:
- : Setting information file* : Files that only contain the measured data of compliance tests (do not contain
the measured data of simple tests)** : Files that contain both the measured data of compliance tests and the measured
data of simple tests• Clickortoswitchbetweensortinginascendinganddescendingorder.
5.1 Loading Setting Information and Measured Data

5-5IM 761922-06E
Using the O
pen Page to Load Setting Information and M
easured Data
3
2
1
4
5
6
7
8
9
10
11
12
13
14
Index
5.2 Checking the Repeatability of the Measured Data
Procedure
1. Select the icon in the menu area. The Open submenu appears. For
general information about the Open submenu, see section 5.1.
2. Select Examine Repeatability listed under Load.
Selecting a File to Open3. Specify the file location. There are two places where you can specify the file
location.• UnderLoadInformationinthesubmenu
• AtthetopofthesettinganddisplayareaWhen you specify the file location, information about the files that can be loaded appears in the setting and display area.
4. Select a file to open. You can select which file to open using one of the following two methods. Information about the selected file is displayed at the bottom of the setting and display area in the file analysis list.• ClicknexttotheFileNameboxunderLoadInformation.Alistofavailablefilesappears.SelectafilefromthelistandClickLoad.
• Double-clickafileinthemeasureddatafilelist.• Dragafilefromthemeasureddatafilelisttothefileanalysislist.• Click while a file is selected in the measured data file list.• Right-clickafileinthemeasureddatafilelist,andthenclickAdd.
NoteThis software can load data saved in files with .fdt and .ini extensions. This software cannot loadCSVfiles(fileswith.csvextensions).

5-6 IM 761922-06E
5. Repeat step 4 to select all of the files that you want to compare.
Specify the measured data file location.
Measured data file list
Click to add the file currently selected in the upper measured data file list to the lower file analysis list.
File analysis listA list of the files selected for repeatability analysis.
Unselecting a File Selected for Analysis6. To unselect a file selected for analysis:
• Click while a file is selected in the file analysis list.
• Dragafileinthefileanalysislistto .• PressDELETEwhileafileisselectedinthefileanalysislist.• Right-clickafileinthefileanalysislist,andthenclickDelete.
Starting Analysis7. ClickAnalysis Execution. The analysis menu appears, and the results of the
analysis of the measured data's repeatability appear.
Note• Formulti-phaseequipment,itisrecommendedthatfilesofthesameinputelement(same
phase) be selected and the data be compared. The repeatability cannot be evaluated correctly when using measured data of different phases.
• Ifonlyonefilehasbeenselectedforanalysis,theAnalysisExecutionbuttonwillbeunavailable.
• Ifthesoftwareisinonlinemode,itwillswitchtoofflinemodewhenanalysisstarts.• Intheanalysismenu,itemsotherthanrepeatabilitywillbedimmedandunavailable.• Whenyoustartanalysis,theMeasure,Print,andSavemenuswillbedimmedand
unavailable.
5.2 Checking the Repeatability of the Measured Data

5-7IM 761922-06E
Using the O
pen Page to Load Setting Information and M
easured Data
3
2
1
4
5
6
7
8
9
10
11
12
13
14
Index
Example of Comparison: The difference at order 27 exceeds 5%.
Order 27 component
Configuring File Information Display Settings1. Right-click the file information heading area at the top of the setting and display
area. A list of the different types of information that can be displayed appears.
2. Select the type of information that you want to be displayed.
NoteThe order is always displayed. You cannot hide it.
5.2 Checking the Repeatability of the Measured Data
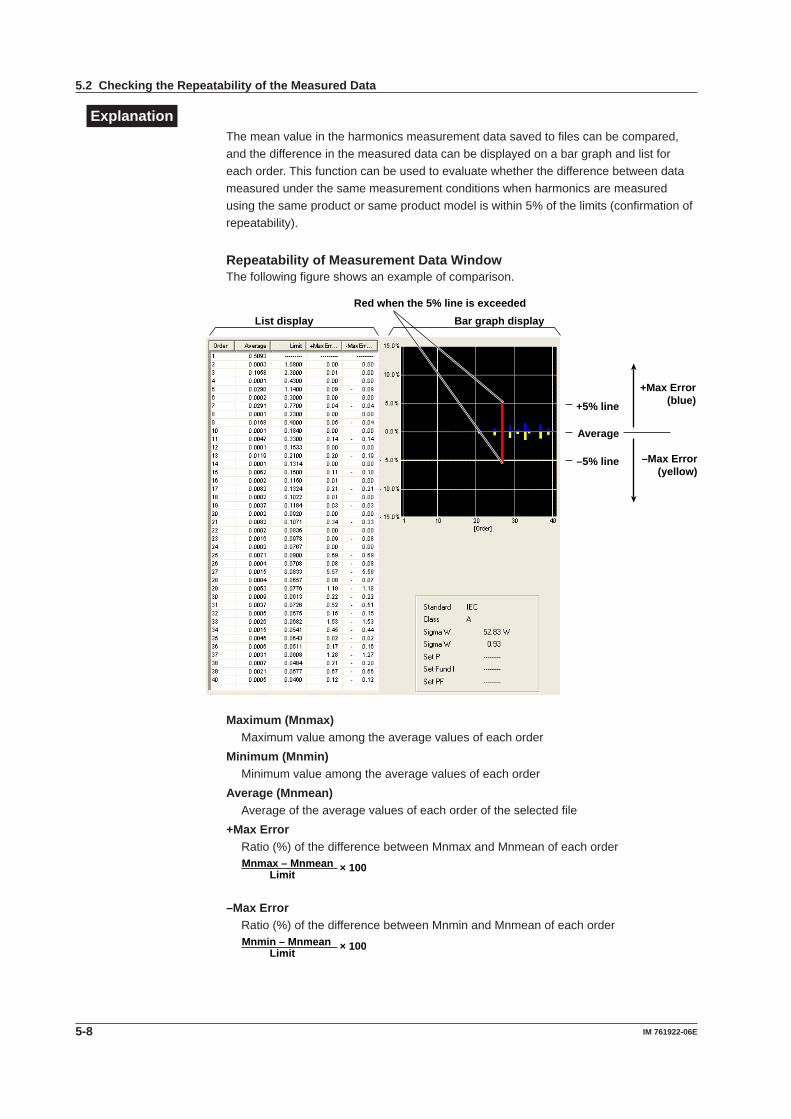
5-8 IM 761922-06E
ExplanationThe mean value in the harmonics measurement data saved to files can be compared, and the difference in the measured data can be displayed on a bar graph and list for each order. This function can be used to evaluate whether the difference between data measured under the same measurement conditions when harmonics are measured using the same product or same product model is within 5% of the limits (confirmation of repeatability).
Repeatability of Measurement Data WindowThe following figure shows an example of comparison.
Average
+5% line
–5% line –Max Error(yellow)
+Max Error(blue)
Red when the 5% line is exceededBar graph displayList display
Maximum (Mnmax)Maximum value among the average values of each order
Minimum (Mnmin)Minimum value among the average values of each order
Average (Mnmean)Average of the average values of each order of the selected file
+Max ErrorRatio (%) of the difference between Mnmax and Mnmean of each order
Mnmax – MnmeanLimit × 100
–Max ErrorRatio (%) of the difference between Mnmin and Mnmean of each order
Mnmin – MnmeanLimit × 100
5.2 Checking the Repeatability of the Measured Data

5-9IM 761922-06E
Using the O
pen Page to Load Setting Information and M
easured Data
3
2
1
4
5
6
7
8
9
10
11
12
13
14
Index
Color• Bar Graph The bar graph that is displayed for each order is displayed using a length converted
from the +Max Error or –Max Error. The meaning of the colors is indicated in the following table.
Blue Difference (error) less than the +5% line for +Max Error.
Yellow Difference (error) less than the –5% line for –Max Error.
Red Difference (error) greater than or equal to the +5% line for +Max Error. Difference (error) greater than or equal to the –5% line for –Max Error.* The names of the sample colors of Microsoft Word or Excel are used for the names of the
colors.
• List The average, limit, +maximum error, and –maximum error for each order are displayed
using values in black.
Number of Files That Can Be ComparedTo evaluate the repeatability of the measured data, multiple files must be selected.Number of files that can be compared: 2 to 10
Note• For multi-phase equipment, it is recommended that files of the same input element (same
phase) be selected and the data be compared. The repeatability cannot be evaluated correctly when using measured data of different phases.
• Even if only one file is selected, the Repeatability of Measurement Data window will open. In this case, no comparison is made.
• To evaluate the repeatability, check that the measured data saved to the file to be compared was measured under the following conditions.• Same DUT (not the same model, but the same equipment).• Same test conditions.• Same test equipment.• Same atmospheric conditions (when the DUT is affected by them).
5.2 Checking the Repeatability of the Measured Data

6-1IM 761922-06E
Using the C
onnection Page to Establish a Connection betw
een the PC and a W
T
3
2
1
4
5
6
7
8
9
10
11
12
13
14
Index
6.1 Establishing a New Connection Between the PC and a WT
Procedure
1. Select the iconinthemenuarea.TheConnectionsubmenuappears.
Connection Condition (page 6-2)Select the connection condition (the connection settings).
Connection Device (page 6-2)Select the communication interface and configure the connection settings.
Connection (page 6-3)Switch between online and offline mode.
Chapter 6 Using the Connection Page to Establish a Connection between the PC and a WT

6-2 IM 761922-06E
Connection Condition2. Select New Connection.
Note• YoucanonlyselectSameConditionasLoadedFileifyouloadsettinginformationor
measured data using the procedure described in section 5.1.• Toperformasimpletest,selecttheSameConditionasLoadedFileoption.• YoucannotselectSameConditionasLastExecutionwhenyoufirststartupthesoftware.
Connection Device3. Select GPIB or Ethernet.
• IfyouselectGP-IB,proceedtostep4.• IfyouselectEthernet,proceedtostep5.
Selecting a Communication Address (GP-IB)4. Select the GP-IB address of the WT that you intend to connect to.
Proceed to step 6.
NoteGP-IBaddressnumber0isreservedforthePCandcannotbeselected.
6.1 Establishing a New Connection Between the PC and a WT
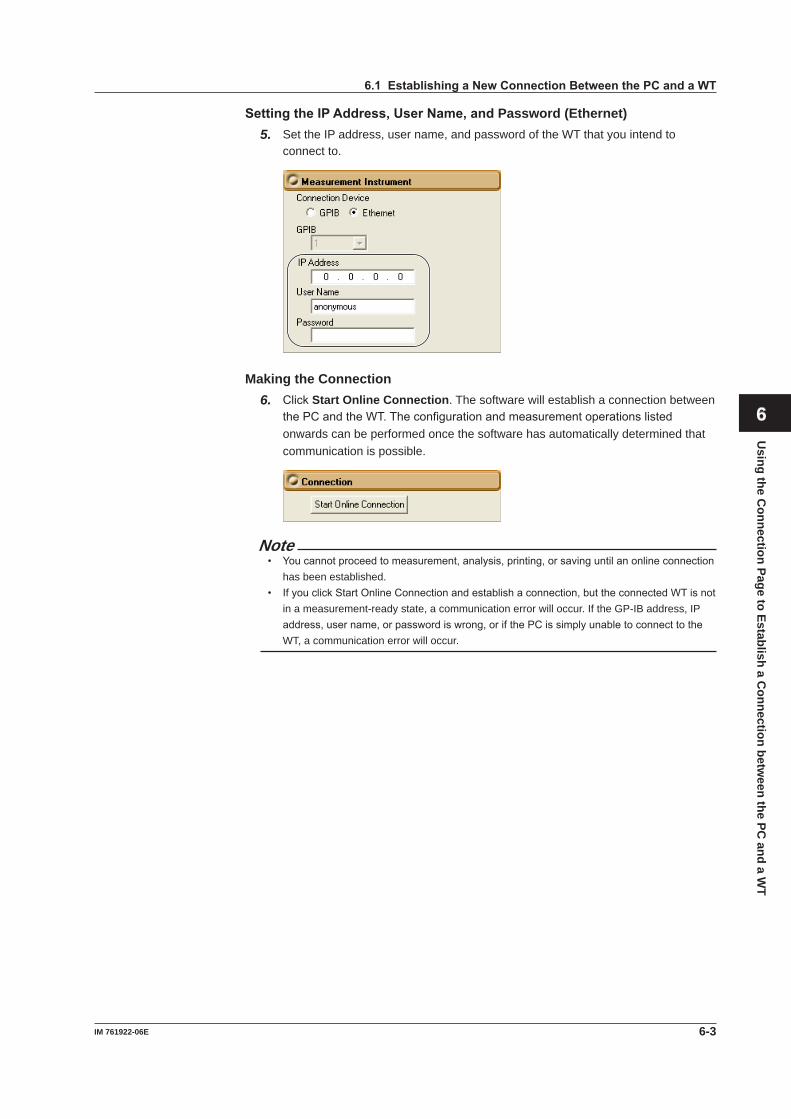
6-3IM 761922-06E
Using the C
onnection Page to Establish a Connection betw
een the PC and a W
T
3
2
1
4
5
6
7
8
9
10
11
12
13
14
Index
Setting the IP Address, User Name, and Password (Ethernet)5. Set the IP address, user name, and password of the WT that you intend to
connect to.
Making the Connection6. ClickStart Online Connection. The software will establish a connection between
thePCandtheWT.Theconfigurationandmeasurementoperationslistedonwards can be performed once the software has automatically determined that communication is possible.
Note• Youcannotproceedtomeasurement,analysis,printing,orsavinguntilanonlineconnection
has been established.• IfyouclickStartOnlineConnectionandestablishaconnection,buttheconnectedWTisnot
in a measurement-ready state, a communication error will occur. If the GP-IB address, IP address,username,orpasswordiswrong,orifthePCissimplyunabletoconnecttotheWT, a communication error will occur.
6.1 Establishing a New Connection Between the PC and a WT

6-4 IM 761922-06E
ExplanationSelecting a Communication Address• GP-IB
Select the GP-IB address of the WT that you intend to connect to.Selectable range: 1 to 30
• Ethernet• SettheIPaddressoftheWTthatyouintendtoconnectto. Selectable range: 0.0.0.0 to 255.255.255.255• YoucansettheusernameandpasswordoftheWTthatyouintendtoconnectto. Usable characters: Those characters that the WT supports.
Displaying Connection Conditions and StatusTheconnectionconditionsthatyousetintheConnectionsubmenuappearinthesettingand display area along with the current connection status.
Disconnected (offline) Connection condition
Connected (online)
The connection status also appears in the information area.
Connection status
Note• Itcantakemorethan10secondstoswitchfromofflinetoonlinemode.• WerecommendthatyouuseaNationalInstrumentsGP-IBcard.GP-IBcardsmadeby
other companies may not function properly.
6.1 Establishing a New Connection Between the PC and a WT

6-5IM 761922-06E
Using the C
onnection Page to Establish a Connection betw
een the PC and a W
T
3
2
1
4
5
6
7
8
9
10
11
12
13
14
Index
6.2 Using the Connection Settings from a Loaded File
Procedure
1. Select the iconinthemenuarea.TheConnectionsubmenuappears.For
generalinformationabouttheConnectionsubmenu,seesection6.1.
2. Select Same Condition as Loaded FileunderConnectionCondition.
Note• YoucanonlyselectSameConditionasLoadedFileifyouloadsettinginformationusingthe
process described in section 5.1.• Toperformasimpletest,selecttheSameConditionasLoadedFileoption.
Making the Connection3. ClickStart Online Connection. The software will establish a connection between
thePCandtheWT.Theconfigurationandmeasurementoperationslistedonwards can be performed once the software has automatically determined that communication is possible.
Note• Youcannotproceedtomeasurement,analysis,printing,orsavinguntilanonlineconnection
has been established.• IfyouclickStartOnlineConnectionandestablishaconnection,buttheconnectedWTisnot
in a measurement-ready state, a communication error will occur. If the GP-IB address, IP address,username,orpasswordiswrong,orifthePCissimplyunabletoconnecttotheWT, a communication error will occur.
ExplanationFollow this procedure to use the settings from a file that has been loaded according to theproceduredescribedin“LoadingSettingInformation”insection5.1.

6-6 IM 761922-06E
6.3 Using the Same Connection Settings as Before
Procedure
1. Select the iconinthemenuarea.TheConnectionsubmenuappears.For
generalinformationabouttheConnectionsubmenu,seesection6.1.
2. Select Same Condition as Last ExecutionunderConnectionCondition.
Note• YoucannotselectSameConditionasLastExecutionwhenyoufirststartupthesoftware.• Toperformasimpletest,selecttheSameConditionasLoadedFileoption.
Making the Connection3. ClickStart Online Connection. The software will establish a connection between
thePCandtheWT.Theconfigurationandmeasurementoperationslistedonwards can be performed once the software has automatically determined that communication is possible.
Note• Youcannotproceedtomeasurement,analysis,printing,orsavinguntilanonlineconnection
has been established.• IfyouclickStartOnlineConnectionandestablishaconnection,buttheconnectedWTisnot
in a measurement-ready state, a communication error will occur. If the GP-IB address, IP address,username,orpasswordiswrong,orifthePCissimplyunabletoconnecttotheWT, a communication error will occur.
ExplanationFollow this procedure to set the connection settings to the same as when you last closed this software.

6-7IM 761922-06E
Using the C
onnection Page to Establish a Connection betw
een the PC and a W
T
3
2
1
4
5
6
7
8
9
10
11
12
13
14
Index
6.4 Ending a Connection by Switching to Offline Mode
Procedure
1. Select the iconinthemenuarea.TheConnectionsubmenuappears.For
generalinformationabouttheConnectionsubmenu,seesection6.1.
2. When you are in online mode, click Exit online connection. The software will disconnect from the WT.

7-1IM 761922-06E
Using the Setting Page to C
onfigure Measurem
ent and Judgment C
onditions
3
2
1
4
5
6
7
8
9
10
11
12
13
14
Index
7.1 Setting General Test Conditions
Procedure
1. Select the icon in the menu area. The Setting submenu appears.
Wiring pattern (page 7-2)Select the wiring pattern of the circuit whosecurrent you will measure.
Test conditions (page 7-2)Set the test conditions.
Input Current (page 7-1)Select the current range to measure.
Measurement time (page 7-4)Set the measurement time based on theconditions of the EUT.
In the setting and display area, you can switch between basic settings and advanced settings by clicking these buttons: . For details, see sections 7.2 and 7.3.
Basic settings
Advanced settings
Input Current2. Select the current range to measure.
NoteCF3andCF6indicatewhichvaluethecrestfactorissetto(3or6).
Chapter 7 Using the Setting Page to Configure Measurement and Judgment Conditions

7-2 IM 761922-06E
Wiring Pattern3. Select the wiring pattern of the circuit you will measure.
If the "The JIS regulation used" check box under Regulation in the Option tab is selected, you can select JIS standards.
NoteWhen you switch wiring patterns, the following settings, which are displayed in the setting and display area, will change to default values that are appropriate to the wiring pattern that you select. For details, see sections 7.2 and 7.3.• TheWTsettings(thesettingsontheWTMeasurementInstrumenttab)• Thetestingjudgmentconditions(thesettingsundertheStandardtab).
Test Conditions4. WhenusingAnnexCofIEC61000-3-2Ed4.0,selectthecheckbox,andselectthe
equipment test conditions.WhennotusingAnnexC,proceedtostep6.
NoteWhenusingtestconditionsofAnnexCthatarenotinthemenu,proceedtostep6,inthesamemanneraswhennotusingAnnexC.
5. IfyouselectAnnexC16.2ofIEC61000-3-2Ed4.0,specifyCurrentoftheappliance (Im) and Rated voltage of the appliance (Ur). Effective power of the appliance (Pi) is calculated automatically.
7.1 Setting General Test Conditions

7-3IM 761922-06E
Using the Setting Page to C
onfigure Measurem
ent and Judgment C
onditions
3
2
1
4
5
6
7
8
9
10
11
12
13
14
Index
6. IfselectednottouseAnnexCofIEC61000-3-2Ed4.0butselectedthefollowingitems,selecttheDUTclassfromA,B,C,andD.• NotuseAnnexC(checkboxnotselected)• UseAnnexC7• UseAnnexC15
The display shown below appears when you set the wiring pattern to one of the following:
• For1P2W230VDevices• For3P4W400VDevices
7. If you have set the wiring pattern to one of the items below and you select class A for the test conditions, select whether the equipment is an air conditioner whose active power exceeds 600 W.• For1P2W100VDevices(JIS)• For1P2W200VDevices(JIS)• For3P3W200VDevices(JIS)• For1P3W100V/200VDevices(JIS)
8. IfyouselectclassC,specifywhetherornotthepowerrangeexceeds25W.• Ifyouselect>25W,proceedtostep9.• Ifyouselect<=25W,proceedtostep10.
9. IfyouselectclassCandthepowerrangeexceeds25W,selectthelimittoapply.• applylimitvalueofClassC• applylimitvalueofClassC(Dimminglights)• applylimitvalueofClassA(Dimminglights)
Proceed to step 10.
7.1 Setting General Test Conditions

7-4 IM 761922-06E
10.IfyouselectclassCandthepowerrangeis25Worlower,selectoneofthefollowing:• applylimitvalueofClassD• judgewithcurrentwavepatternof3rd&5th
Proceed to step 9.
Measurement Time11. IfyouselectedthefollowingitemsforAnnexCofIEC61000-3-2Ed4.0,setthe
measurement time.• NotuseAnnexC(checkboxnotselected)• UseAnnexC7• UseAnnexC15
NoteWhenyouchangetestconditionsorthemeasurementtime,thejudgmentconditionsonthestandard tab that are displayed in the setting and display area will change accordingly. For details, see section 7.3.
ExplanationWiring PatternWhenyouaremeasuringusingthelimitsspecifiedbyIEC61000-3-2,selectoneofthefollowing wiring patterns:• For1P2W230VDevices• For3P4W400VDevicesWhenyouaremeasuringusingthelimitsspecifiedbyJISC61000-3-2,selectoneofthefollowing wiring patterns:• For1P2W100VDevices(JIS)• For1P2W200VDevices(JIS)• For3P3W200VDevices(JIS)• For1P3W100V/200VDevices(JIS)
Test Conditions• Use Annex C SelectwhethertouseAnnexCofIEC61000-3-2Ed4.0fromthefollowing.The
settings vary depending on the test conditions of the equipment selected here.• NotuseAnnexC(checkboxnotselected)• C.7Vacuumcleaners• C.15Highpressurecleaners• C.16.2(withVSD)Refrigeratorsandfreezers• C.16.3(withoutVSD)Refrigeratorsandfreezers
WhenusingtestconditionsofAnnexCthatarenotintheoptions,cleartheUseAnnexCcheckbox.
7.1 Setting General Test Conditions

7-5IM 761922-06E
Using the Setting Page to C
onfigure Measurem
ent and Judgment C
onditions
3
2
1
4
5
6
7
8
9
10
11
12
13
14
Index
• Current of the appliance (Im), Rated voltage of the appliance (Ur), Effective power of the appliance (Pi)
Ifyouselected“C16.2(withVSD)Refrigeratorsandfreezers,”thepowerratiolimitsofClassDareappliedaccordingtotheeffectivepoweroftheappliance(Pi)calculatedasaresultofsettingCurrentoftheappliance(Im)andRatedvoltageoftheappliance(Ur).• Currentoftheappliance(Im) Selectable range: 0.0001 to 100.0000 A Default value: 1A• Ratedvoltageoftheappliance(Ur) Selectable range: 0.1 to 1000.0 V If you select the wiring system, the Ur setting is changed in sync to the default
value. The default value is as follows:Wiring Pattern UrFor 1P2W 230V Devices 230.00 VFor 3P4W 400V Devices 400.00 VOther than those above Not synchronized to the wiring system
• Effectivepoweroftheappliance(Pi) If you set Im and Ur, Pi is calculated automatically with the following equation. Pi=0.78*Im*Ur
• Class (Evaluate Class) SelecttheclassfromA,B,C,andD,accordingtotheclassificationsspecifiedinthe
standard. The setup information varies depending on the class selected here.
Dependingonthe“UseAnnexC”setting,theclassisasfollows:Use Annex C ClassC16.2(withVSD)Refrigeratorsandfreezers Fixed to DC16.3(withoutVSD)Refrigeratorsandfreezers Fixed to AOther than those above SelectablefromA,B,C,andD
Class A• See section 7.3 for selecting the lower power limit for applying the limits• SelectingWhethertoApplytheLimitforAirConditionersExceeding600WforJIS
ClassA InJISClassA,speciallimitsaredefinedforairconditionersthatexceed600W.
You can select whether to apply this limit.
Class B The setup information is the same as class A. The limits applied are 1.5 times the
limits for class A.
Class C Specify whether or not the EUT's active power exceeds 25 W.
• WhentheActivePoweroftheEUTExceeds25W(>25W) Youcansetthelimittoapplyto"applylimitvalueofClassA"or"applylimitvalueof
ClassC."• ThelimitofClassA(Dimminglights)isappliedtoincandescentlighting
equipment that has built-in dimmers or consists of dimmers built in an enclosure.• ThelimitofClassC(Dimminglights)isappliedtoequipmentotherthan
incandescent lighting equipment that has built-in dimmers or consists of dimmers built in an enclosure.
• ThelimitvalueofClassCisappliedtootherlightingequipment. For details on setting the fundamental current and the power factor, see section 7.3.
7.1 Setting General Test Conditions

7-6 IM 761922-06E
• WhentheActivePoweroftheEUTIsLessThanorEqualto25W(<=25W) TheIECstandardspecifiesthateither“thepowerratiolimitsofclassD”or“the
conditionsofharmonicorder3and5”aremet. • EvaluatingbyApplyingthePowerRatioLimitsofClassD The same power ratio limit of class D is applied. For details on setting the power, see section 7.3.
• EvaluatingontheConditionsofHarmonicOrder3and5 TheIECstandardspecifiesthecurrentratioofharmonicorder3and5tothe
fundamental frequency and the relationship between the fundamental current and the current waveform (see page 1-11).
Fordetailsonsettingthefundamentalcurrentandjudgementofthewaveform,see section 7.3.
Class D For information about the following settings, see section 7.3.
• SelectingthePower• SelectingtheLowerPowerLimitforApplyingtheLimits
Measurement TimeThe measurement time is the time between the start of the measurement to the end of the measurement. The time for measuring harmonics can be set in advance. The harmonics can be measured continuously for the specified time. The measurement time can be changed when equipment that emits harmonics that fluctuate over time is measured or when confirming that the emitted harmonics do not change even when the equipment is operated over extended time.
Selectable range: 0 H 0 M 1 S to 24 H 0 M 0 S in units of 1 s.An error occurs if a time exceeding 24 hours is specified.
Dependingonthe“UseAnnexC”setting,themeasurementtimeisasfollows:Use Annex C ClassNotuseAnnexC(checkboxnotselected) Setting possibleAnnexC.7Vacuumcleaners Setting possible*AnnexC.15Highpressurecleaners Setting possible*AnnexC.16.2(withVSD)Refrigeratorsandfreezers Fixed to 1 hourAnnexC.16.3(withoutVSD)Refrigeratorsandfreezers Fixed to 2 minutes 30 seconds
* Settings under 2 minutes are prohibited by the standard, and therefore, a warning is displayed, and the setting change is considered invalid.
NoteDependingontheenvironmentofthePContowhichthissoftwarewasinstalled,anerroroccurs if you specify a time longer than the memory area that can be reserved. If this happens, the following measures can be taken to increase the upper limit of time that can be specified.• Closeothersoftwareapplications• Restartthesoftware• RestartthePC• ExpandthememoryinstalledinthePC
7.1 Setting General Test Conditions
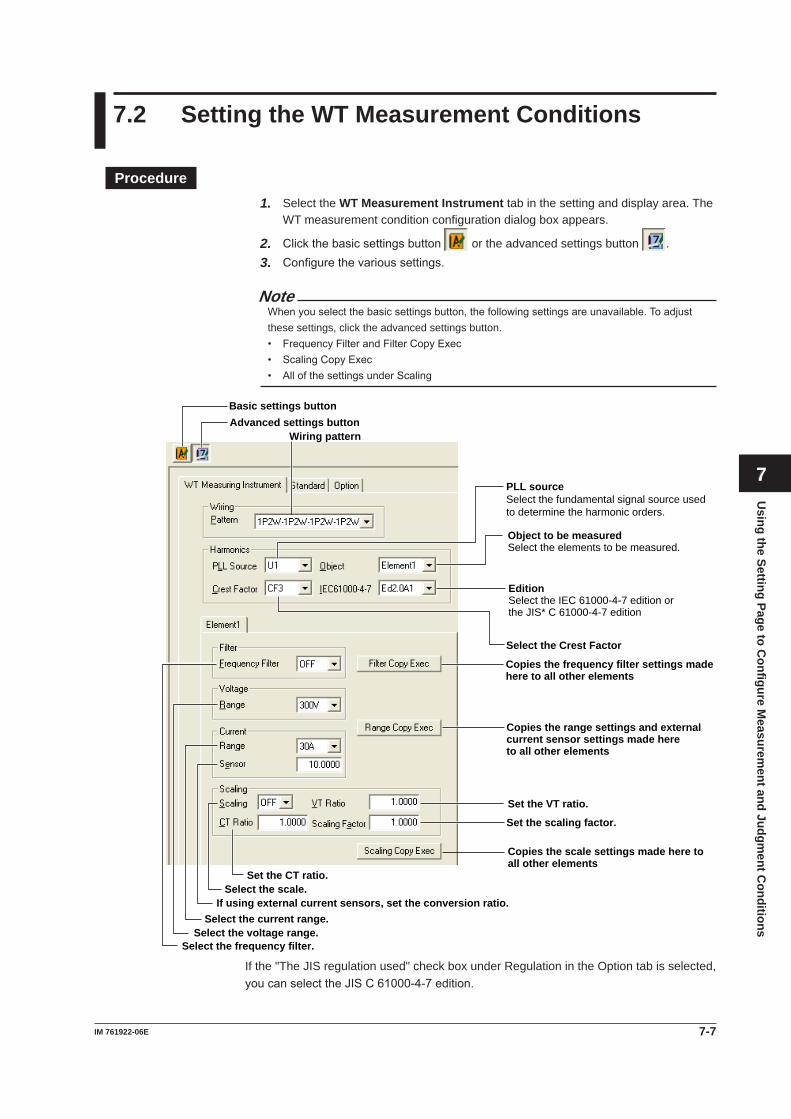
7-7IM 761922-06E
Using the Setting Page to C
onfigure Measurem
ent and Judgment C
onditions
3
2
1
4
5
6
7
8
9
10
11
12
13
14
Index
7.2 Setting the WT Measurement Conditions
Procedure1. Select the WT Measurement Instrument tab in the setting and display area. The
WT measurement condition configuration dialog box appears.
2. Clickthebasicsettingsbutton or the advanced settings button .3. Configurethevarioussettings.
NoteWhenyouselectthebasicsettingsbutton,thefollowingsettingsareunavailable.Toadjustthese settings, click the advanced settings button.• FrequencyFilterandFilterCopyExec• ScalingCopyExec• AllofthesettingsunderScaling
Set the CT ratio. Select the scale.
If using external current sensors, set the conversion ratio.Select the current range.
Select the voltage range. Select the frequency filter.
Object to be measured Select the elements to be measured.
Copies the range settings and external current sensor settings made hereto all other elements
Copies the frequency filter settings made here to all other elements
Set the VT ratio.
Set the scaling factor.
Copies the scale settings made here to all other elements
PLL source Select the fundamental signal source used to determine the harmonic orders.
Wiring pattern
Basic settings button Advanced settings button
Select the Crest Factor
Edition Select the IEC 61000-4-7 edition or the JIS* C 61000-4-7 edition
If the "The JIS regulation used" check box under Regulation in the Option tab is selected, youcanselecttheJISC61000-4-7edition.

7-8 IM 761922-06E
ExplanationEdition of the StandardInWTfirmwareversions4.11andlater,youcanselecttheIEC61000-4-7orJISC61000-4-7 edition.
Editon No. of the IEC 61000-4-7 Editon No. of the JIS C 61000-4-7•Edition1.0 •2007JA•Edition2.0 •2007•A1oftheEdition2.0
IEC61000-4-7orJISC61000-4-7specifiesrequirementsformeasurementinstruments.For details, see chapter 14. In WT3000 firmware versions 4.01 to 4.10, the edition is fixedatorIEC61000-4-7edition2.0.
Copying the Frequency FilterYou can copy the frequency filter settings configured for one element to all other elements with the same wiring.
Copying the RangeYou can copy the range settings configured for one element to all other elements with the same wiring. The voltage range, the current range, and the external current sensor range are copied.
Copying the Scaling SettingsYou can copy the scaling settings configured for one element to all other elements with the same wiring. The settings that are copied are:• VTratio• CTratio• Scalingfactor
For information about the following settings and how to make settings from the WT, see the WT3000 or WT3000E User’s Manual.
Setting WT3000 (IM760301-01E) WT3000E (IMWT3001E-01EN)Wiring Pattern Section 4.1PLL source Section 7.5Crestfactor Section4.6Frequencyfilter Section4.8Voltage/current range Sections 4.3 and 4.4Scaling Section 4.5
Note• Whenthewiringsystemispattern1(whenallare1P2W),filter,range,andscalingare
copied to all other elements.• Whentakingmeasurementswiththissoftware,theantialiasing filter cutoff frequency is fixed
at 5.5 kHz.• Tomakeaccuratemeasurements,turnONthefrequencyfilteroftheinputelementsetto
PLL source.• Theexponentialaverage function of the WT is ON.
7.2 Setting the WT Measurement Conditions

7-9IM 761922-06E
Using the Setting Page to C
onfigure Measurem
ent and Judgment C
onditions
3
2
1
4
5
6
7
8
9
10
11
12
13
14
Index
Shared Settings between the Submenu and the Setting and Display AreaWhen you change the following settings in the submenu, the settings in the setting and display area will also change.• CurrentRange(seepage7-10)• WiringPattern(seepage7-11)• TestConditions(seesection7.3)• Measurementtime(seesection7.3)
The settings in the submenu will not change when you change the settings in the setting and display area.When the settings in the submenu and the setting and display area are different, the settings in the setting and display area take precedence.
Submenu area Setting and display area
These settings have priority.
Change
No change ×
7.2 Setting the WT Measurement Conditions

7-10 IM 761922-06E
Setting Changes Based on Current Range SelectionWhen you select a current range in the Setting submenu, the settings marked off in the following figures will also change.
7.2 Setting the WT Measurement Conditions

7-11IM 761922-06E
Using the Setting Page to C
onfigure Measurem
ent and Judgment C
onditions
3
2
1
4
5
6
7
8
9
10
11
12
13
14
Index
Setting Changes Based on Wiring Pattern SelectionWhen you select a wiring pattern in the Setting submenu, the settings marked off in the following figures change to their default values. The values in the figures are the default values.
*1 U1
*3
OFF
OFF
*4
*2
*1 The default setting for Wiring Pattern varies depending on the wiring pattern and the number of elements installed in the WT.
Wiring Pattern 1Element 2Element 3Element 4ElementFor 1P2W 230V Devices 1P2W 1P2W-1P2W 1P2W-1P2W-1P2W 1P2W-1P2W-1P2W-1P2WFor 3P4W 400V Devices 1P2W*5 1P2W-1P2W*5 3P4W 3P4W-1P2WFor 1P2W 100V Devices (JIS) 1P2W 1P2W-1P2W 1P2W-1P2W-1P2W 1P2W-1P2W-1P2W-1P2WFor 1P2W 200V Devices (JIS) 1P2W 1P2W-1P2W 1P2W-1P2W-1P2W 1P2W-1P2W-1P2W-1P2WFor 3P3W 200V Devices (JIS) 1P2W*5 1P2W-1P2W*5 3V3A 3V3A-1P2WFor 1P3W 100V/200V Devices (JIS) 1P2W*5 1P3W 1P3W-1P2W 1P3W-1P2W-1P2W
*5 An error message appears, because there are not enough elements.
*2,*4ThedefaultsettingforObjectandVoltageRangevariesdependingonthewiringpattern.
Wiring Pattern Object Voltage RangeFor 1P2W 230V Devices Element 1 300VFor 3P4W 400V Devices SigmaA *6 300VFor 1P2W 100V Devices (JIS) Element 1 150VFor 1P2W 200V Devices (JIS) Element 1 300VFor 3P3W 200V Devices (JIS) SigmaA *6 300VFor 1P3W 100V/200V Devices (JIS) SigmaA *6 150V
*6Iftheerrordescribedabovein*5occursbecauseoftheselectedwiringpattern,Objectisautomatically set to Element 1.
7.2 Setting the WT Measurement Conditions
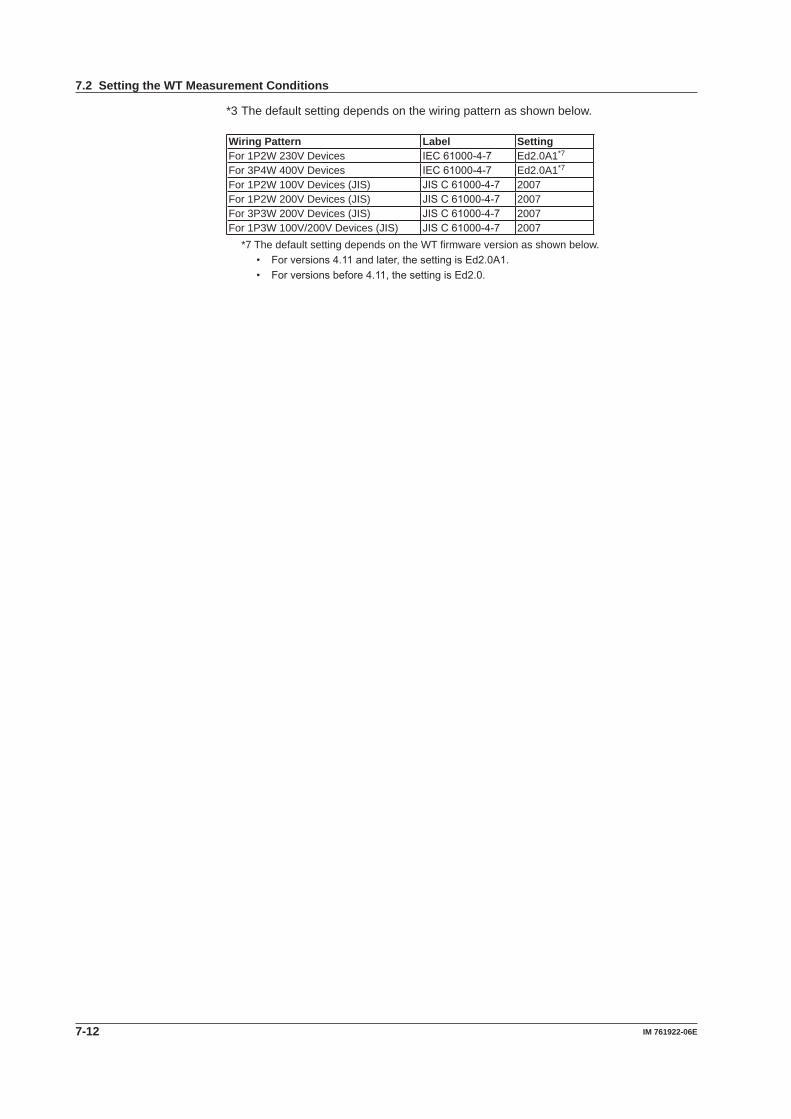
7-12 IM 761922-06E
*3 The default setting depends on the wiring pattern as shown below.
Wiring Pattern Label SettingFor 1P2W 230V Devices IEC61000-4-7 Ed2.0A1*7
For 3P4W 400V Devices IEC61000-4-7 Ed2.0A1*7
For 1P2W 100V Devices (JIS) JISC61000-4-7 2007For 1P2W 200V Devices (JIS) JISC61000-4-7 2007For 3P3W 200V Devices (JIS) JISC61000-4-7 2007For 1P3W 100V/200V Devices (JIS) JISC61000-4-7 2007
*7 The default setting depends on the WT firmware version as shown below.• Forversions4.11andlater,thesettingisEd2.0A1.• Forversionsbefore4.11,thesettingisEd2.0.
7.2 Setting the WT Measurement Conditions

7-13IM 761922-06E
Using the Setting Page to C
onfigure Measurem
ent and Judgment C
onditions
3
2
1
4
5
6
7
8
9
10
11
12
13
14
Index
7.3 Setting the WT Judgment Conditions
Procedure1. Select the Standardtabinthesettinganddisplayarea.Thejudgmentcondition
configuration dialog box appears.
2. Configurethevarioussettings.
NoteThe items that you can set are the same whether you press the basic settings button or
the advanced settings button .
• For 1P2W 100V Devices (JIS)• For 1P2W 200V Devices (JIS)• For 3P3W 200V Devices (JIS)• For 1P3W 100V/200V Devices (JIS)
These setting items appear when you select one of the following wiring patterns in the procedure described in section 7.1.
• Select the “Use Annex C” check box.• Select Annex C16.2.
These setting items appear when you select following settings in the procedure described in section 7.1.
This setting item appears when you select "IEC61000-3-2 Ed4.0" for "Regulation."

7-14 IM 761922-06E
ExplanationFor explanations of these terms, see section 1.3 and 1.5.
Standard (Regulation)ThesoftwarecanmakemeasurementsandevaluationsaccordingtotheIECorJISstandard (see section 1.3).ToselectJIS,youmustsettheedition(IEC61000-4-7;seesection7.2)ontheWTMeasuring Instrument tab to a value other than Ed2.0 A1.
When you change the Standard setting, the edition (see section 7.2) label and setting on the WT Measuring Instrument tab will change as shown below.• WhenyouchangefromIECtoJIS
Setting for IEC Label Setting for JISEd1.0 JISC61000-4-7 2007 JAEd2.0 JISC61000-4-7 2007Ed2.0A1 JISC61000-4-7 ChangefromIECtoJISisnotpossible.
• WhenyouchangefromJIStoIECSetting for JIS Label Setting for IEC2007 JA IEC61000-4-7 Ed1.02007 IEC61000-4-7 Ed2.0
Use Annex CIfyouselectIEC61000-3-2Ed4.0forthestandard,youcanselectfromthefollowingforAnnexC.
• NotuseAnnexC(checkboxnotselected)• C.7Vacuumcleaners• C.15Highpressurecleaners• C.16.2(withVSD)Refrigeratorsandfreezers• C.16.3(withoutVSD)Refrigeratorsandfreezers
WhenusingtestconditionsofAnnexCthatarenotintheoptions,cleartheUseAnnexCcheck box.
Class (Evaluate Class)SelecttheclassfromA,B,C,andD,accordingtotheclassificationsspecifiedinthestandard. The setup information varies depending on the class selected here.
Class A, B, and DSelecting the Lower Power Limit for Applying the LimitsSelect 50W, 75W, None, or Infinity. When the active power of the EUT is less than the selected power, the limits are not applied.
Class C• Power Range
Specify whether or not the EUT's active power exceeds 25 W.• WhentheActivePoweroftheEUTExceeds25W(>25W) Youcansetthelimittoapplyto"applylimitvalueofClassA"or"applylimitvalueofClassC."
• ThelimitofClassA(Dimminglights)isappliedtoincandescentlightingequipment that has built-in dimmers or consists of dimmers built in an enclosure.
• ThelimitofClassC(Dimminglights)isappliedtoequipmentotherthanincandescentlighting equipment that has built-in dimmers or consists of dimmers built in an enclosure.
• ThelimitvalueofClassCisappliedtootherlightingequipment. Set the fundamental current and the power factor.
7.3 Setting the WT Judgment Conditions

7-15IM 761922-06E
Using the Setting Page to C
onfigure Measurem
ent and Judgment C
onditions
3
2
1
4
5
6
7
8
9
10
11
12
13
14
Index
• WhentheActivePoweroftheEUTIsLessThanorEqualto25W(<=25W) TheIECstandardspecifiesthateither“thepowerratiolimitsofclassD”or“the
conditionsofharmonicorder3and5”aremet.• EvaluatingbyApplyingthePowerRatioLimitsofClassD The same power ratio limit of class D is applied. Set the power.
• EvaluatingontheConditionsofHarmonicOrder3and5 TheIECstandardspecifiesthecurrentratioofharmonicorder3and5tothe
fundamental frequency and the relationship between the fundamental current and the current waveform (see page 1-11).
Setthefundamentalcurrentandjudgementofthewaveform(WavepeakandThreshold).
• Fundamental current and power factor Determine whether to set the EUT fundamental current and power factor values that are
necessary for determining the limits by specifying them manually or by measuring them. You can also set the fundamental current and the power factor to the values that you
measureaccordingtotheprocedureinsection8.6.Ifyouaregoingtomeasurethevalues, first set the load of the EUT as high as possible.
• Wave Judge (judgement of the waveform) You can enter the following values.
• Wavepeak(Wavepeakphaselimit)• Threshold(Currentthresholdlimit) Set the current threshold limit as a percentage of the maximum absolute current
peak value Ip(abs). For example, to set 5%, enter 0.05.
Class D• To an electric power Determine whether to set the power value that is necessary for determining the limits
by specifying it manually or by measuring it. Youcanalsospecifythevaluethatyoumeasureaccordingtotheprocedureinsection8.6.
If you are going to measure the value, first set the load of the EUT as high as possible.
Measurement TimeThe measurement time is the time between the start of the measurement to the end of the measurement. The time for measuring harmonics can be set in advance. The harmonics can be measured continuously for the specified time. The measurement time can be changed when equipment that emits harmonics that fluctuate over time is measured or when confirming that the emitted harmonics do not change even when the equipment is operated over extended time.
Selectable range: 0 H 0 M 1 S to 24 H 0 M 0 S in units of 1 s.An error occurs if a time exceeding 24 hours is specified.
NoteDependingontheenvironmentofthePContowhichthissoftwarewasinstalled,anerroroccurs if you specify a time longer than the memory area that can be reserved. If this happens, the following measures can be taken to increase the upper limit of time that can be specified.• Closeothersoftwareapplications• Restartthesoftware• RestartthePC• ExpandthememoryinstalledinthePC
7.3 Setting the WT Judgment Conditions

7-16 IM 761922-06E
Setting Changes Based on Wiring Pattern SelectionWhen you select a wiring pattern in the Setting submenu, the settings marked off in the following figures change to their default values. The values in the figures are the default values.
*1
Wiring Pattern *1For 1P2W 230V Devices IEC61000-3-2Ed4.0For 3P4W 400V Devices IEC61000-3-2Ed4.0
If the "The JIS regulation used" check box under Regulation in the Option tab is selected, you can select JIS standards.
Wiring Pattern *1 *2 *3 *4Regulation ConversionLimis Numerator
of the limit equation
Denominator of the limit equation
For 1P2W 230V Devices IEC61000-3-2 Ed4.0
--- --- ---
For 3P4W 400V Devices IEC61000-3-2 Ed4.0
--- --- ---
For 1P2W 100V Devices (JIS) JIS Single Phase 230V 100VFor 1P2W 200V Devices (JIS) JIS Single Phase 230V 200VFor 3P3W 200V Devices (JIS) JIS three Phase 400V 200VFor 1P3W 100V/200V Devices (JIS) JIS Single Phase 230V 100V
*2
*4
*3
7.3 Setting the WT Judgment Conditions

7-17IM 761922-06E
Using the Setting Page to C
onfigure Measurem
ent and Judgment C
onditions
3
2
1
4
5
6
7
8
9
10
11
12
13
14
Index
Setting Changes Based on “Use Annex C”
Changes when you select “C.7 Vacuum cleaners” or “C.15 High pressure cleaners.”The settings marked off in the following figures will also change. And the regulation and the measurement time will change to its default value. The value in the figures are the default values.
7.3 Setting the WT Judgment Conditions

7-18 IM 761922-06E
Changes when you select “C.16.2 (with VSD) Refrigerators and freezers.”The settings marked off in the following figures will also change. And the regulation, evaluate class, to an electric power value, and measurement time will change to their default values. The value in the figures are the default values.
7.3 Setting the WT Judgment Conditions

7-19IM 761922-06E
Using the Setting Page to C
onfigure Measurem
ent and Judgment C
onditions
3
2
1
4
5
6
7
8
9
10
11
12
13
14
Index
Changes when you select “C.16.3 (without VSD) Refrigerators and freezers.”The settings marked off in the following figures will also change. And the regulation, evaluate class, and measurement time will change to their default values. The value in the figures are the default values.
7.3 Setting the WT Judgment Conditions
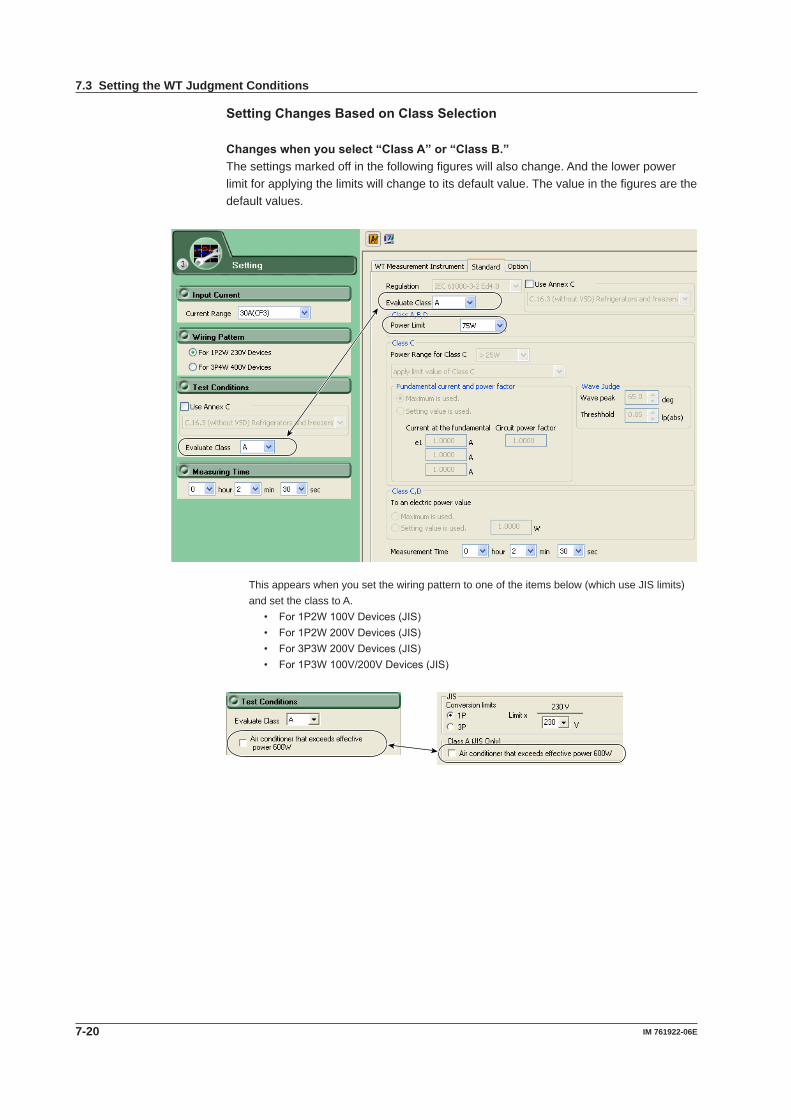
7-20 IM 761922-06E
Setting Changes Based on Class Selection
Changes when you select “Class A” or “Class B.”The settings marked off in the following figures will also change. And the lower power limit for applying the limits will change to its default value. The value in the figures are the default values.
This appears when you set the wiring pattern to one of the items below (which use JIS limits) and set the class to A.
• For1P2W100VDevices(JIS)• For1P2W200VDevices(JIS)• For3P3W200VDevices(JIS)• For1P3W100V/200VDevices(JIS)
7.3 Setting the WT Judgment Conditions

7-21IM 761922-06E
Using the Setting Page to C
onfigure Measurem
ent and Judgment C
onditions
3
2
1
4
5
6
7
8
9
10
11
12
13
14
Index
Changes when you select “Class C.”The settings marked off in the following figures will also change. And the fundamental current and the power factor will change to their default values. The values in the figures are the default values.
*1
*2
*1 Thesettingforthefundamentalcurrentandthepowerfactorvaluesissetto“Maximumisused”bydefaultwhen:• Yousetthepowerclassto“>25W.”• Yousetthepowerclassto“<=25W”andyousetthelimitsto“judgewithcurrentwave
patternof3rd&5th.”
*2 Thesettingforthepowervalueissetto“Maximumisused”bydefaultwhen:• Yousetthepowerclassto“<=25W”andyousetthelimitsto“applylimitvalueofClassD.”
7.3 Setting the WT Judgment Conditions

7-22 IM 761922-06E
Changes when you select “Class D.”The settings marked off in the following figures will also change. And the lower power limit for applying the limits and the power factor will change to their default values. The values in the figures are the default values.
Setting Changes Based on Measurement Time SelectionThe settings marked off in the following figures will also change.
7.3 Setting the WT Judgment Conditions

7-23IM 761922-06E
Using the Setting Page to C
onfigure Measurem
ent and Judgment C
onditions
3
2
1
4
5
6
7
8
9
10
11
12
13
14
Index
7.4 Setting the Optional Conditions
Procedure1. Select the Option tab in the setting and display area. The optional condition
configuration dialog box appears.
2. Configurethevarioussettings.
NoteThe items that you can set are the same whether you press the basic settings button or
the advanced settings button .
ExplanationFor explanations of these terms, see section 1.5.
Margin DegreeSelectwhetherornottosetamargindegreeforjudgment.Ifyouchoosetosetamargindegree, specify it as a percentage. If you set the margin degree to 5.00%, the limits will be narrowed by 5%. If you set the margin degree to 0.00%, the limits will be used as is.
Report• Addawaveformgraph Select this check box to include a waveform graph in the report.
• SettingdisplayofBMPresolution In the BMP item under Output Form of the Print menu, the selectable output
resolutions appear. (See section 10.2.)
Wave JudgeSelectthischeckboxtonotincludewavejudgmentintheoveralljudgment(seesection8.7).

7-24 IM 761922-06E
SettingSelect the check box to select the target element.A target element setting box appears in the Setting submenu area.
If the check box is not selected, the target element is fixed to element 1.
Regulation• WhenthelanguageisJapanese The check box is always selected. On the Standard tab, you can select JIS in addition
toIEC61000-3-2Ed3.2A2andIEC61000-3-2Ed4.0.• WhenthelanguageisnotJapanese The check box can be cleared. If the check box is cleared, the JIS standard is not
displayed under the standard options. In this way, you can prohibit the JIS standard from being selected.
7.4 Setting the Optional Conditions
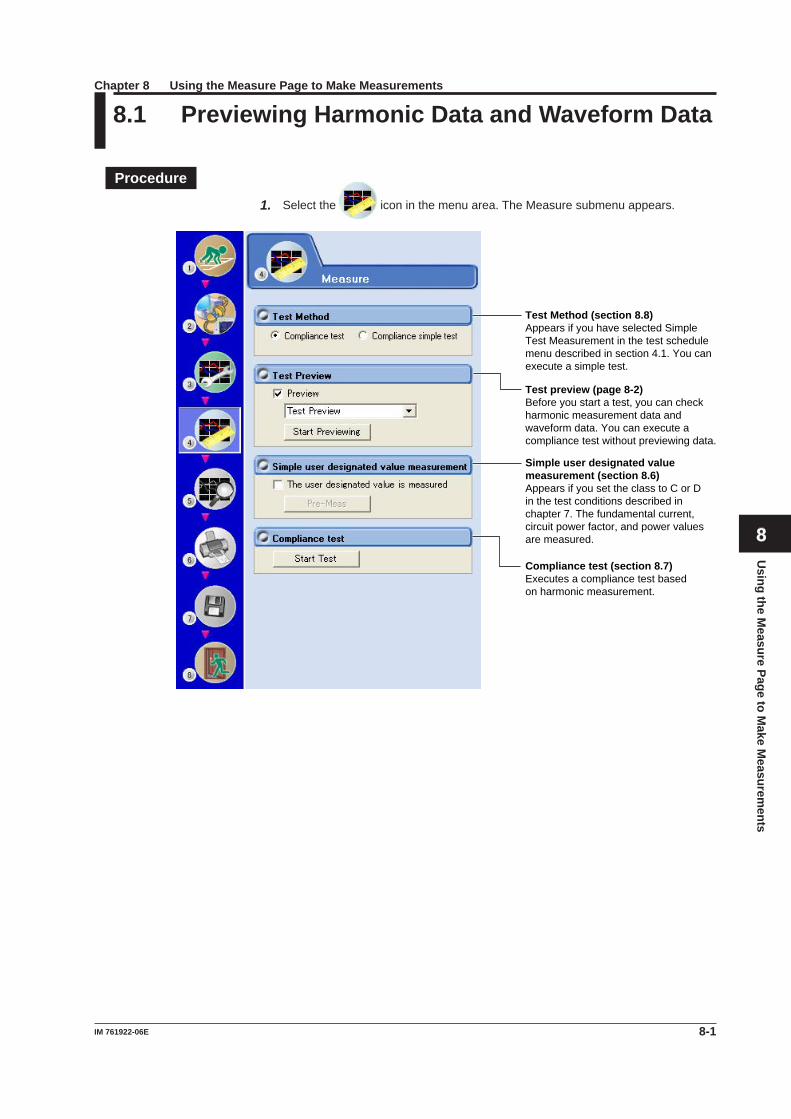
8-1IM 761922-06E
Using the M
easure Page to Make M
easurements
Chapter 8 Using the Measure Page to Make Measurements
3
2
1
4
5
6
7
8
9
10
11
12
13
14
Index
8.1 Previewing Harmonic Data and Waveform Data
Procedure
1. Select the icon in the menu area. The Measure submenu appears.
Test preview (page 8-2)Before you start a test, you can checkharmonic measurement data and waveform data. You can execute acompliance test without previewing data.
Simple user designated valuemeasurement (section 8.6)Appears if you set the class to C or D in the test conditions described in chapter 7. The fundamental current, circuit power factor, and power values are measured.
Compliance test (section 8.7)Executes a compliance test basedon harmonic measurement.
Test Method (section 8.8)Appears if you have selected Simple Test Measurement in the test schedule menu described in section 4.1. You can execute a simple test.

8-2 IM 761922-06E
8.1 Previewing Harmonic Data and Waveform Data
Previewing Test Data2. Select the Preview check box.
3. Select the preview that you want to display.
4. ClickStart Previewing. A message will appear to indicate that you have to wait before measurement starts. After that, the measured harmonic values will appear in the display area.
NoteWhen you preview the harmonics of a current, the data that had been acquired or loaded before the preview is discarded. Be sure to save any compliance test data before you begin a test preview (for information on how to save data, see chapter 11).
Stopping a Test PreviewClickStop Previewing.
Checking the Class Setting and Active PowerWhen you stop previewing, the software checks whether the measured active power is within the standard limits of each class.
Class Active Power P RangeA No specificationA (JIS, P>600W, Air conditioner) P>600WB No specificationC(P>25W) P>25WC(P≤25W) P≤25D P≤600W
Amessageappearsifthemeasuredactivepowerisoutsidethestandardlimits.Checkwhether the class setting is correct.
Message example

8-3IM 761922-06E
Using the M
easure Page to Make M
easurements
8.2 Setting the Display of the Test Preview
ProcedureAn Example of the Test Preview
Toolbar
Numerical Lists Bar Graphs
Measured value lists For explanations of these terms, see section 1.5.
An Example of the Setting and Display AreaSampled data countWhen a preview is being displayed, the display here is 0/0. When a compliance test is being executed, the numberof times measured data has been acquired is displayed (for details, see section 8.2).
Measure timeWhen a preview is being displayed, the display here is 0.0sec/[the measurement time set accordingto the procedure described in chapter 7]. When a compliance test is being executed, the amount oftime for which measured data has been acquired is displayed (for details, see section 8.2).
Toolbar
Select the element whose data you want to display.
Switch the max hold ON or OFF.Switch the limits display of the bar graphs ON or OFF.
Set the display format.
Switch the percentage display ON or OFF.
3
2
1
4
5
6
7
8
9
10
11
12
13
14
Index

8-4 IM 761922-06E
Select the y-axis scale of the bar graphs.
Select the measurement function to display.Select the y-axis magnification of the bar graphs.
Window arrangement buttons For details, see chapter 12.
Displays cascaded windows
Displays tiled windows
Selecting the Element Whose Data You Want to Display
Click . If input elements 1 to 3 are being measured, as you click the icon, the displayed data will switch from element 1, to element 2, to element 3, to element 1, and soon.Clicktoselectanelementdirectly.
Selecting the display formatSelect Test(Bar+List), Bar, List, or Simple*.
* Simpleappearswhenyouareperformingasimplecompliancetest(seesection8.8).
Switching the Limits Display of the Bar Graphs ON or OFF.
Click to select whether or not to display the limits in the bar graph. The limits are displayed using yellow bars. Limits are only applied to harmonic current values. There are no specified limits for voltages or phase angles. So limits for these values are not displayed.
Switching the Max Hold ON or OFF.Click to turn MaxHold ON. The maximum value of the measured data is held when MaxHold is ON. When MaxHold is ON, bars are displayed as shown below.
Maximum value of the data
Current value of the data
Switching the Percentage Display ON or OFF.Click to turn the percentage display ON and display the following items as percentages.
• Numerical lists•Therelativeharmonicdataorcontentofeachorder•Limits
• Bar graphs•TheY-axisscale
8.2 Setting the Display of the Test Preview
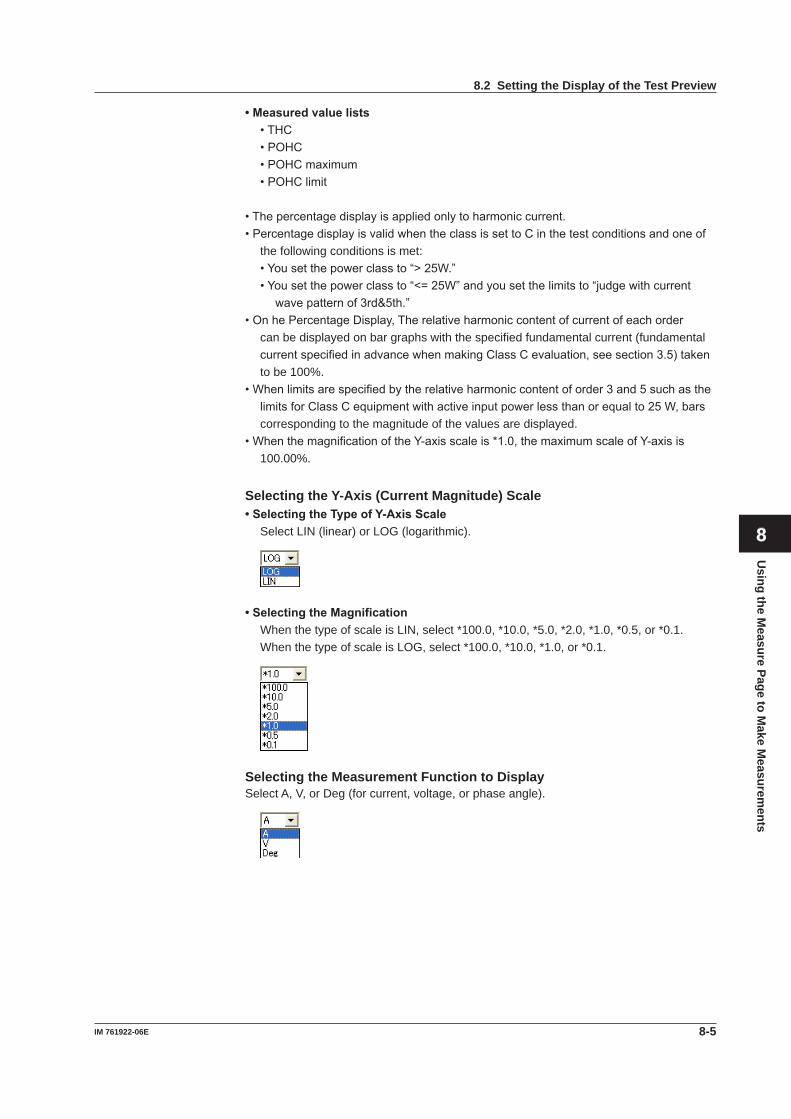
8-5IM 761922-06E
Using the M
easure Page to Make M
easurements
• Measured value lists•THC•POHC•POHCmaximum•POHClimit
•Thepercentagedisplayisappliedonlytoharmoniccurrent.•PercentagedisplayisvalidwhentheclassissettoCinthetestconditionsandoneof
the following conditions is met:•Yousetthepowerclassto“>25W.”•Yousetthepowerclassto“<=25W”andyousetthelimitsto“judgewithcurrent
wavepatternof3rd&5th.”•OnhePercentageDisplay,Therelativeharmoniccontentofcurrentofeachorder
can be displayed on bar graphs with the specified fundamental current (fundamental currentspecifiedinadvancewhenmakingClassCevaluation,seesection3.5)takento be 100%.
•Whenlimitsarespecifiedbytherelativeharmoniccontentoforder3and5suchasthelimitsforClassCequipmentwithactiveinputpowerlessthanorequalto25W,barscorresponding to the magnitude of the values are displayed.
•WhenthemagnificationoftheY-axisscaleis*1.0,themaximumscaleofY-axisis100.00%.
Selecting the Y-Axis (Current Magnitude) Scale• Selecting the Type of Y-Axis Scale Select LIN (linear) or LOG (logarithmic).
• Selecting the Magnification When the type of scale is LIN, select *100.0, *10.0, *5.0, *2.0, *1.0, *0.5, or *0.1. When the type of scale is LOG, select *100.0, *10.0, *1.0, or *0.1.
Selecting the Measurement Function to DisplaySelect A, V, or Deg (for current, voltage, or phase angle).
8.2 Setting the Display of the Test Preview
3
2
1
4
5
6
7
8
9
10
11
12
13
14
Index

8-6 IM 761922-06E
ExplanationColors of the numerical lists and bar graphs of the currentThetablebelowdescribeswhatthecolors.Condition1,Condition2,200%short-termrelaxation,andPOHCrelaxationconditionsthatappearinthetablearedefinedbelow.
• Condition 1 The maximum harmonic current over the measurement time is within 1.5 times the
specified limit. Evaluation is made on each order.
• Condition 2 The mean harmonic current over the measurement time is within the specified limit.
Evaluation is made on each order.
• 200% Short-Term Relaxation Conditions If all of the following conditions are met, up to 200% of the specified limits is permitted.
• TheEUTbelongstoClassAforharmonics.• Theexcursionbeyond150%oftheapplicablelimitslastslessthan10%ofthetest
observation period or in total 10 min (within the test observation period), whichever is smaller.
• Theaveragevalueoftheharmoniccurrent,takenovertheentiretestobservationperiod, is less than 90 % of the applicable limits.
• POHC Relaxation Condition Ifthemaximumvalueofthesumofpartialoddharmoniccurrents(POHC)oforder
aboveandincluding21islessthanthespecifiedPOHClimit,themeanoftheoddharmonic currents of order above and including 21 is permitted to be 1.5 times the specified limit.
BlueLimit not exceeded.RedLimit exceeded.Yellow (applies only to bar graph)Limit specified by the applicable standard.Black (applies only to numerical list)No applicable limit is specified.(The measured value of the fundamental frequency and orders that are not applicable is displayed in black.)White (applies only to numerical list)No applicable limit is specified.(The bar graph of the fundamental frequency and orders that are not applicable is displayed in white.)TurquoiseThe measured data is less than the larger of the two values, 0.6% of the mean rms current and 5 mA.Aqua
• Limit exceeded.• Excluded from applying the limits because the maximum active power is less than the
minimum power (75 W or 50 W) for applying the limits or set to Infinity.
* The names of the sample colors of Microsoft Word or Excel are used for the names of the colors.
8.2 Setting the Display of the Test Preview

8-7IM 761922-06E
Using the M
easure Page to Make M
easurements
Colors of the numerical lists and bar graphs of the voltage and phase angleThere are no voltage or phase angle limits. Bar graphs of harmonic voltage or phase angle are displayed in white. The values displayed in the list are black.
Numerical Lists• Limit
• Thelimitsspecifiedintheapplicablestandardaredisplayedinalistforeachorder.• TheharmonicdatashownintheTestpreviewconsistsofinstantaneousvalues,so
the listed limit values and yellow bars are shown using values that are 1.5 times larger than the limits.
• Thelimitsareappliedonlytoharmoniccurrent.• IfthePercentageDisplaycheckboxisselected,therelativeharmoniccontentof
the limit of each order can be displayed with the specified fundamental current (fundamentalcurrentspecifiedinadvancewhenmakingClassCevaluation,seesection 7.3) taken to be 100%.
• Whenlimitsarespecifiedbytherelativeharmoniccontentoforder3and5suchasthelimitsforClassCequipmentwithactiveinputpowerlessthanorequalto25W,the current value converted from the relative harmonic content of order 3 and 5 with the fundamental current specified in advance (see section 7.3) taken to be 100% is displayed.
• Margin• Indicatesthemargintothelimit.Foreachorder,themarginisderivedfromthe
following equation using the limits and measured values displayed in the list.
× 100Limit – measured valueLimit
• Themarginonlyappliestoharmoniccurrentvalues.• Thecolorofthevalueschangesdependingonwhetherornotyouselect“The
margindegreeisused”checkboxdescribedinsection7.4.• WhentheMarginDegreeIsUsed Blue indicates that a value has exceeded the margin that you specified
according to the procedure in section 7.4. Red indicates that a value is at or below the margin that you specified according
to the procedure in section 7.4.• WhentheMarginDegreeIsNotUsed Values are displayed in black.
Bar Graphs• Bar Graph of Harmonic Current or Voltage The software displays the instantaneous values acquired within the measurement time
for each harmonic order.
• Bar Graph of Harmonic Phase Angles Bar graphs of the phase angle of the harmonic current with respect to the
fundamental current for each order can be displayed. However, the phase angle with respect to the fundamental voltage is displayed on the bar graph for the fundamental current.
• Whentheharmonicphaseisleadingthefundamentalcurrent,apositivephaseangle is indicated; when the harmonic phase is lagging the fundamental current, a negative phase angle is indicated.
• Whenthefundamentalcurrentisleadingthefundamentalvoltage,anegativephase angle is indicated; when the fundamental current is lagging the fundamental voltage, a positive phase angle is indicated.
8.2 Setting the Display of the Test Preview
3
2
1
4
5
6
7
8
9
10
11
12
13
14
Index
8-8 IM 761922-06E
Measured Value ListsFor explanations of these terms, see section 1.5.
• Sigma W Sigma W is the active power for all grouped phases (all measured input elements).
Note• WhenapplyingthepowerratiolimitonClassCorDmulti-phaseequipment,the
harmonic current per watt derived from the total active power (Sigma W) of all phases (three phases if three-phase) and the power ratio limit are compared and evaluated.
• EquipmentwhoseSigmaWexceeds600WisconsideredClassAequipmentunderthestandard. Use caution because the software makes evaluations using the class selected in standard and measurement environment settings (see section 7.3).
• Set P, Set Fund I, and Set PF For Set P, the power value (see section 3.5) specified in advance is displayed when
makingClassCorDevaluations. For Set Fund I and Set PF, the fundamental current and power factor values (see
section7.3)specifiedinadvancearedisplayedrespectivelywhenmakingClassCevaluations.
NoteInsection7.1,ifyouselectedthe“UseAnnexC”checkboxandselected“C16.2(withVSD)Refrigeratorsandfreezers,”theseitemsaredisplayedasfollows:• SetP: C16.2Im (currentoftheappliance)• SetFundI: C16.2Ur (ratedvoltageoftheappliance)• SetPF: C16.2Pi (effectivepoweroftheappliance)
8.2 Setting the Display of the Test Preview

8-9IM 761922-06E
Using the M
easure Page to Make M
easurements
8.3 Setting the Display of the List Preview
ProcedureAn Example of the List PreviewFor information about the functions of toolbar icons other than those listed below, see section8.2.
Interharmonic Subgroup
Harmonic GroupHarmonic Subgroup
Harmonic
Interharmonic Group
Turning Each of the Measured Value Lists (Columns) ON and OFF
Interharmonic Subgroup Harmonic Group
Harmonic Subgroup Harmonic
Interharmonic Group
Fordetailsonthenumericallists,seesection8.2.
3
2
1
4
5
6
7
8
9
10
11
12
13
14
Index

8-10 IM 761922-06E
8.4 Setting the Display of the Bar Preview
ProcedureAn Example of the Bar Preview
The harmonic, harmonic group, harmonic subgroup, and limit displays area
The interharmonic group and interharmonic center subgroup display area*
See section 8.2. See section 8.3. See section 8.2.
Appears when the interharmonic group display button is pressed or when the
interharmonic center subgroup button is pressed.
Fordetailsonthebargrahp,seesection8.2.

8-11IM 761922-06E
Using the M
easure Page to Make M
easurements
ExplanationColor of Bars• Color of the Harmonic bar graph
Seesection8.2.
• Color of the Harmonic Group and Harmonic Subgroup of Current The harmonic, harmonic group, and harmonic subgroup are superimposed on the bar
graph.• When the Measured Values Are within the Limit
Bar graph of the harmonic group(deep blue)Bar graph of the harmonic subgroup(ultramarine blue)
Bar graph of the harmonic(blue)
• When Evaluation Is Not Made Because the Measured Data Is Less than the Larger oftheTwoValues,0.6%oftheMeanRmsCurrentand5mA
Bar graph of the harmonic group (dark green)
Bar graph of the harmonic subgroup (aqua)
Bar graph of the harmonic (turquoise)
• Color of the Harmonic Group and Harmonic Subgroup of Voltage The harmonic, harmonic group, and harmonic subgroup are displayed as shown
below. There is no need to compare with the limit to make evaluations.
Bar graph of the harmonic group (dark gray)
Bar graph of the harmonic subgroup (gray)
Bar graph of the harmonic (white)
• Color of the Interharmonic Group and Interharmonic Center Subgroup The interharmonic group and interharmonic center subgroup are displayed as shown
below. There is no need to compare with the limit to make evaluations. Bar graph of the interharmonic center
Bar graph of the interharmonic centersubgroup (white)
Bar graph of the interharmonic group(dark gray)
8.4 Setting the Display of the Bar Preview
3
2
1
4
5
6
7
8
9
10
11
12
13
14
Index

8-12 IM 761922-06E
8.5 Setting the Display of the Wave Preview
ProcedureAn Example of the Waveforms Preview
Measured values for wave judgment
Select the X-axis scale.
Select the element whose data you want to display. See section 8.2.
Select the max hold.
Switch the voltage waveform display ON or OFF.Select the voltage waveform magnification. See section 8.2.
Window arrangement buttons. See chapter 12.
Switch the current waveform display ON or OFF.Select the current waveform magnification. See section 8.2.
Selecting the Max HoldClick . Select Dotted, Line, or None.
The button indication changes depending on the current setting.
Selecting the Max HoldClick . Select ALL, Cycle, Half Cycle+, or Half Cycle-.
The button indication changes depending on the current setting.

8-13IM 761922-06E
Using the M
easure Page to Make M
easurements
Switching the Waveform Display ON or OFF.You can show or hide an element’s voltage or current waveform by clicking on the VoltageandCurrentbuttonsforeachelementintheshow/hidebox.
Show/hide box (an example of the three-phase input)
Voltage and Current buttons for each element
Using the Cursor to Display Current and Phase Angle ValuesWhen you click an area of the waveform, a cursor will appear there. The current and phase angle values at the cursor position will be displayed.
Cursor
Voltage value
Current value
ExplanationDisplay ColorsThe following colors are assigned to the waveforms of each input element in order, starting with the lowest numbered element. If you are previewing the waveforms of elements 1, 2, and 3, the following colors will be assigned to the element’s voltage and current waveforms:
Element Voltage Waveform Current WaveformElement 1 Pink Bright greenElement 2 Blue YellowElement 3 Turquoise Red
* The colors and corresponding names are the same as those in Microsoft Word and Microsoft Excel.
Measured Values for Wave JudgmentThisappearswhenyousetthefollowingjudgmentconditions(seesection7.3).• ClassC• TheActivePowerIsLessThanorEqualto25W(<=25W)• EvaluatingontheConditionsofHarmonicOrder3and5
8.5 Setting the Display of the Wave Preview
3
2
1
4
5
6
7
8
9
10
11
12
13
14
Index

8-14 IM 761922-06E
Thedisplayedcontentsareshownbelow.Fordetailsonwavejudgment,seesection1.3.• Ip+ :Phaseangleofthepeakvalueofthecurrentwaveform(+)• Ip- :Phaseangleofthepeakvalueofthecurrentwaveform(-)• Ip(abs) :Thehigherabsolutevalueofthepeakvalueofthecurrent
waveform (+) and (-)• 60-90deg(+)Min :Minimumcurrentbetween60°to90°inthepositivehalfcycle• 60-90deg(-)Max :Maximumcurrentbetween60°to90°inthenegativehalfcycle
Colorsofmeasuredvalues• Ip+andIp-aredisplayedinredwhenthe"wavepeakphase"setinsection7.3is
exceeded.• 60-90deg(+)Minisdisplayedinredwhenitislessthanorequaltothe"current
threshold" set in section 7.3.• 60-90deg(-)Maxisdisplayedinredwhenitisgreaterthanorequaltothe"current
threshold" set in section 7.3.
Setting MaxHoldIf MaxHold is set to Dotted or Line, the MaxHold waveform and the waveform that is currently being measured are displayed. The MaxHold waveform is a waveform derived by superimposing the waveforms measured after the start of a waveform preview and connecting the maximum values at each phase. The MaxHold waveform is displayed in the following manner.• Dotted :TheMaxHoldwaveformisdisplayedusingdots.• Line :TheMaxHoldwaveformisdisplayedusingasolidlinewithdots.• None :TheMaxHoldwaveformisnotdisplayed.The MaxHold waveform is displayed with lower intensity than the waveform that is currently being measured.
DottedLine
Currente Waveform (Waveform that is currently being measured)Currente Waveform (MaxHold Waveform)
Voltage Waveform (The MaxHold waveform and the waveform that is currently being measured overlap each other.)
None
WhenMaxHoldissettoDottedorLine,themeasuredvalueofwavejudgmenttakesonthe following value.• Ip(abs), Ip+, Ip-, 60-90deg(-)Max :Maximum value after the start of the waveform preview• 60-90deg(+)Min:Minimumvalueafterthestartofthewaveformpreview
When MaxHold is set to Dotted or Line, the cursor value indicates the current or voltage of the MaxHold waveform.
Selecting the X-Axis Scale• ALL :50ms• Cycle :1cycle• HalfCycle+ :HalfCycle(Positiveside)• HalfCycle- :HalfCycle(Negativeside)
Changing the Y-Axis Scale (the Size of the Voltage and Current Waveforms)• Linearscalingisused.Logarithmicscalingisnotsupported.• ThemeasurementrangespecifiedfortheWTisusedasthemaximumvalue,1.0,on
the Y-axis (see section 7.2 for details on setting the range).
8.5 Setting the Display of the Wave Preview
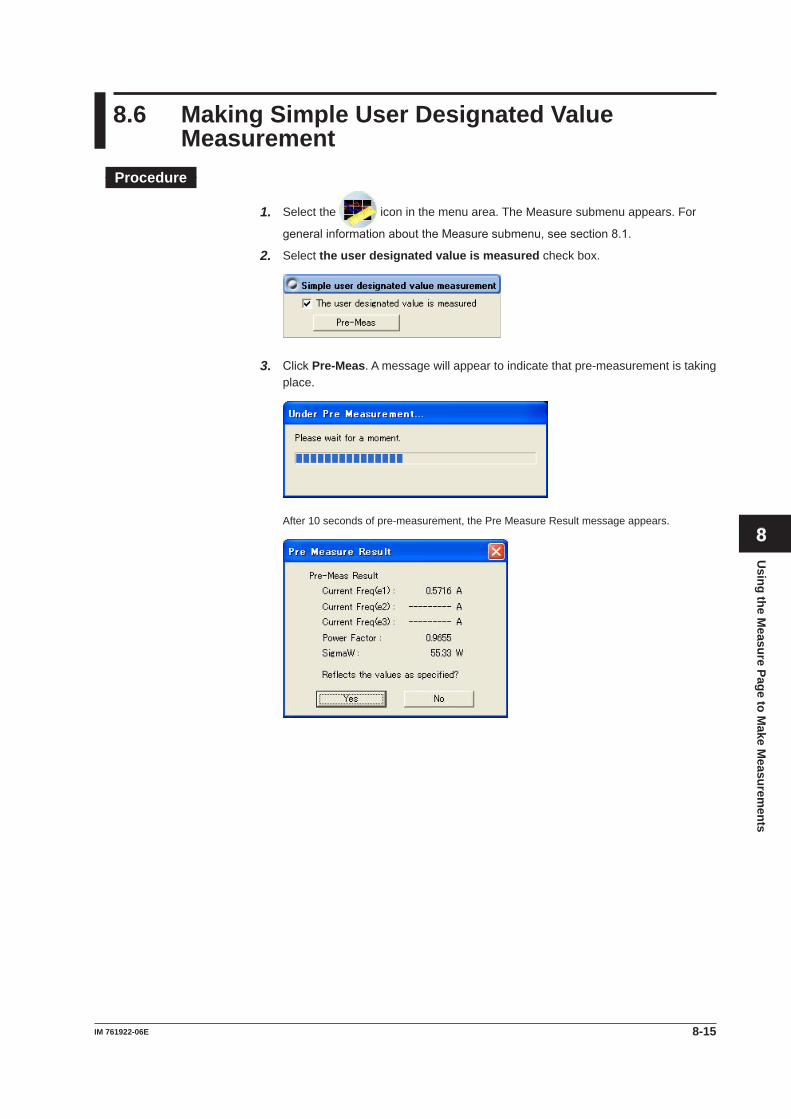
8-15IM 761922-06E
Using the M
easure Page to Make M
easurements
8.6 Making Simple User Designated Value Measurement
Procedure
1. Select the icon in the menu area. The Measure submenu appears. For
generalinformationabouttheMeasuresubmenu,seesection8.1.
2. Select the user designated value is measured check box.
3. ClickPre-Meas. A message will appear to indicate that pre-measurement is taking place.
After 10 seconds of pre-measurement, the Pre Measure Result message appears.
3
2
1
4
5
6
7
8
9
10
11
12
13
14
Index

8-16 IM 761922-06E
4. Select whether or not to use the results of pre-measurement to set the fundamental current, circuit power factor, and power values described in section 7.3. If you select Yes, the values will be set to the pre-measured values.
ExplanationSimple User Designated Value MeasurementForclassCandclassD,toperformcompliancetests,userscanspecifythefundamentalcurrent and circuit power factor, or the power value to perform compliance tests.If you measure the fundamental current, circuit power factor, and power value using the procedure described in this section, you can apply the measured results to the fundamentalcurrent,circuitpowerfactor,andpowervalueinthejudgmentconditionsdescribed in section 7.3.
8.6 Making Simple User Designated Value Measurement

8-17IM 761922-06E
Using the M
easure Page to Make M
easurements
8.7 Making Compliance Test (Harmonic Measurements)
Procedure
1. Select the icon in the menu area. The Measure submenu appears. For
generalinformationabouttheMeasuresubmenu,seesection8.1.
Selecting the Test MethodThis only appears if you have selected Simple Test Measurement in the test schedule menu described in section 4.1.
2. Select Compliance test.
Starting a Test3. ClickStart Test. A dialog box opens that indicates that you have to wait before
measurement starts. Then measured harmonic values appear in the measured harmonic values lists and bar graphs.
Insection7.1,ifyouselectedthe“UseAnnexC”checkboxandselected“C.7Vacuumcleaners”or“C.15Highpressurecleaners,”thetestisperformedformaximum,50%,and minimum.
Stopping a Test• Stopping Automatically The software will stop testing automatically once the specified measurement time has
been reached.
• Stopping Manually ClickStop Test. If the WT is measuring, it will stop when measurement ends normally
and data has been acquired.
Oncethetestisfinished,theoveralljudgmentappears.
Display example: PASS
Theoveralljudgmentalsoappearsintheinformationarea.
Judge Result
3
2
1
4
5
6
7
8
9
10
11
12
13
14
Index

8-18 IM 761922-06E
ExplanationAn Example of the Setting and Display Area during a Compliance Test
Sampled data countOne sample count is equivalent to 200 ms (10 cycles for 50 Hz and 12 cycles for 60 Hz)* worth ofmeasured instantaneous data values. This data is acquired by the software and displayed. In this example,145 samples have been acquired.
Measure timeThe amount of time that has elapsed since the start of measurement/the measurement time setaccording to the procedure described in chapter 7.
* ForwhentheIEC61000-4-7editionissetto2.0or2.0A1.WhentheIEC61000-4-7editionis set to 1.0, the number of cycles is 16 (320 ms at 50 Hz or 267 ms at 60 Hz).
Toolbar See section 8.2.
Numerical Lists Bar Graphs
Measured value lists For explanations of these terms, see section 1.5.
Selecting the display format of the setting and display areaOnly Test(Bar+List) is valid. Even if you select a different display format (Bar or List) by clicking one of the display format selection icons in the toolbar, measured data will not be displayed.
JudgmentIf all of the elements that are tested pass, PASS appears. Otherwise, FAIL appears.
PASS
FAIL
The limit has not been exceeded, but the margin specified in section 7.4 has been exceeded.
NoData
8.7 Making Compliance Test (Harmonic Measurements)

8-19IM 761922-06E
Using the M
easure Page to Make M
easurements
Error Messages during MeasurementThefollowingerrormessagemayappearwhenmeasurementisexecutedinComplianceTest.
This software retrieves large amount of measured data from the WT. The error message mayappeariftheCPUonthePCisoverloadedandcannotkeepupwiththedatatransfer.LightentheloadplacedontheCPUonthePCbycheckingthepointslistedbelow.• Donotoperateorrunotherprograms.• Closememory-residentprograms(turnthemOFF).• Disablethestandbymode.• UsethesoftwareonaPCthatsatisfiesthesystemrequirementsgiveninsection1.2.
Checking the Test ConditionsWhenthetestisfinished,beforemakinganoveralljudgment,thesoftwarechecksthefollowing items to determine whether the test conditions are appropriate.• CheckingtheClassSettingandActivePower• FundamentalcurrentandcircuitpowerfactorforclassC• ActivepowerforclassD
Checking the Class Setting and Active PowerThe software checks whether the measured active power is within the standard limits of each class.
Class Active Power P RangeA No specificationA (JIS, P>600W, Air conditioner) P>600WB No specificationC(P>25W) P>25WC(P≤25W) P≤25D P≤600W
Amessageappearsifthemeasuredactivepowerisoutsidethestandardlimits.Checkwhether the class setting is correct.
Message example
Afteryouconfirmthemessage,theoveralljudgmentisdisplayed.
8.7 Making Compliance Test (Harmonic Measurements)
3
2
1
4
5
6
7
8
9
10
11
12
13
14
Index

8-20 IM 761922-06E
Checking the Fundamental Current and Circuit Power Factor for Class CWhenyouspecifythefundamentalcurrentandcircuitpowerfactorforaclassCtest,thesoftware checks the fundamental current and circuit power factor.• Fundamentalcurrentcheck The software checks whether the measured value of the fundamental current is
greater than or equal to 90% and less than or equal to 110% of the specified value.• Circuitpowerfactorcheck The software checks whether the measured value of the circuit power factor is greater
than or equal to 90% and less than or equal to 110% of the specified value.
Classifications in Class C Fundamental Current Check
Circuit Power Factor Check
P>25W ApplylimitvalueofclassC Yes YesApplylimitvalueofclassC(dimminglights) No NoApply limit value of class A (dimming lights) No No
P≤25 Apply limit value of class D No NoJudgewithcurrentwavepatternof3rd&5th Yes No
Amessageappearsifthemeasuredvaluesareoutsidetheaboveranges.Checkwhether the specified values are correct.
Afteryouconfirmthemessage,theoveralljudgmentisdisplayed.• Ifthefundamentalcurrentisoutsidetheaboverange,judgmentisperformedwith
the maximum measured value of the fundamental current of input element 1 as the reference.
• Ifthecircuitpowerfactorisoutsidetheaboverange,judgmentisperformedwiththe maximum measured value of the circuit power factor of the wiring unit as the reference.
Checking the Active Power for Class DWhen you specify the active power for a class D test, the software checks whether the measured active power is greater than or equal to 90% and less than or equal to 110% of the specified value.Amessageappearsifthemeasuredvaluesareoutsidetheaboveranges.Checkwhether the specified values are correct.
Afteryouconfirmthemessage,theoveralljudgmentisdisplayed.Iftheactivepowerisoutsidetheaboverange,judgmentisperformedwiththemaximummeasured active power as the reference.
8.7 Making Compliance Test (Harmonic Measurements)
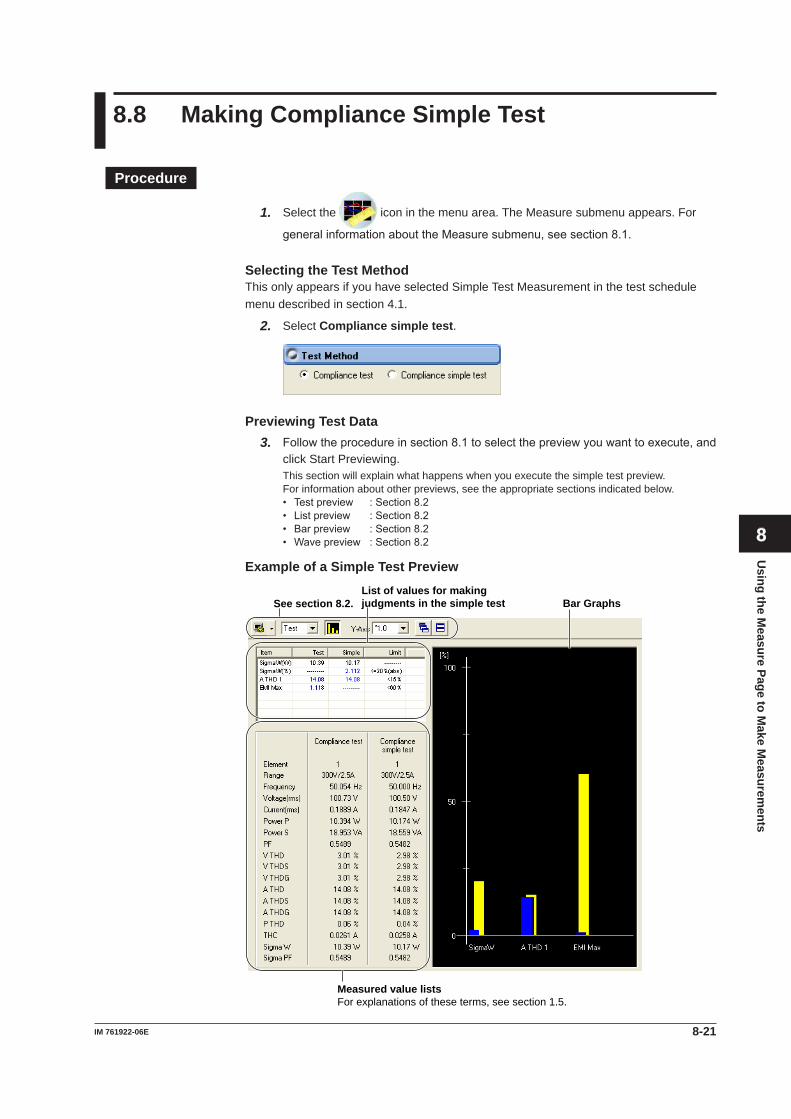
8-21IM 761922-06E
Using the M
easure Page to Make M
easurements
8.8 Making Compliance Simple Test
Procedure
1. Select the icon in the menu area. The Measure submenu appears. For
generalinformationabouttheMeasuresubmenu,seesection8.1.
Selecting the Test MethodThis only appears if you have selected Simple Test Measurement in the test schedule menu described in section 4.1.
2. Select Compliance simple test.
Previewing Test Data3. Followtheprocedureinsection8.1toselectthepreviewyouwanttoexecute,and
click Start Previewing.This section will explain what happens when you execute the simple test preview.For information about other previews, see the appropriate sections indicated below.• Testpreview :Section8.2• Listpreview :Section8.2• Barpreview :Section8.2• Wavepreview :Section8.2
Example of a Simple Test Preview
List of values for making judgments in the simple test Bar GraphsSee section 8.2.
Measured value listsFor explanations of these terms, see section 1.5.
3
2
1
4
5
6
7
8
9
10
11
12
13
14
Index

8-22 IM 761922-06E
Starting a Test4. ClickStart Test. A dialog box opens that indicates that you have to wait before
measurement starts. Then measured harmonic values appear in the measured harmonic values lists and bar graphs.
Stopping a Test• Stopping Automatically The software will stop testing automatically once the specified measurement time has
been reached.
• Stopping Manually ClickStop Test. If the WT is measuring, it will stop when measurement ends normally
and data has been acquired.
Oncethetestisfinished,theoveralljudgmentappears.
Theoveralljudgmentalsoappearsintheinformationarea.
Judge Result
8.8 Making Compliance Simple Test
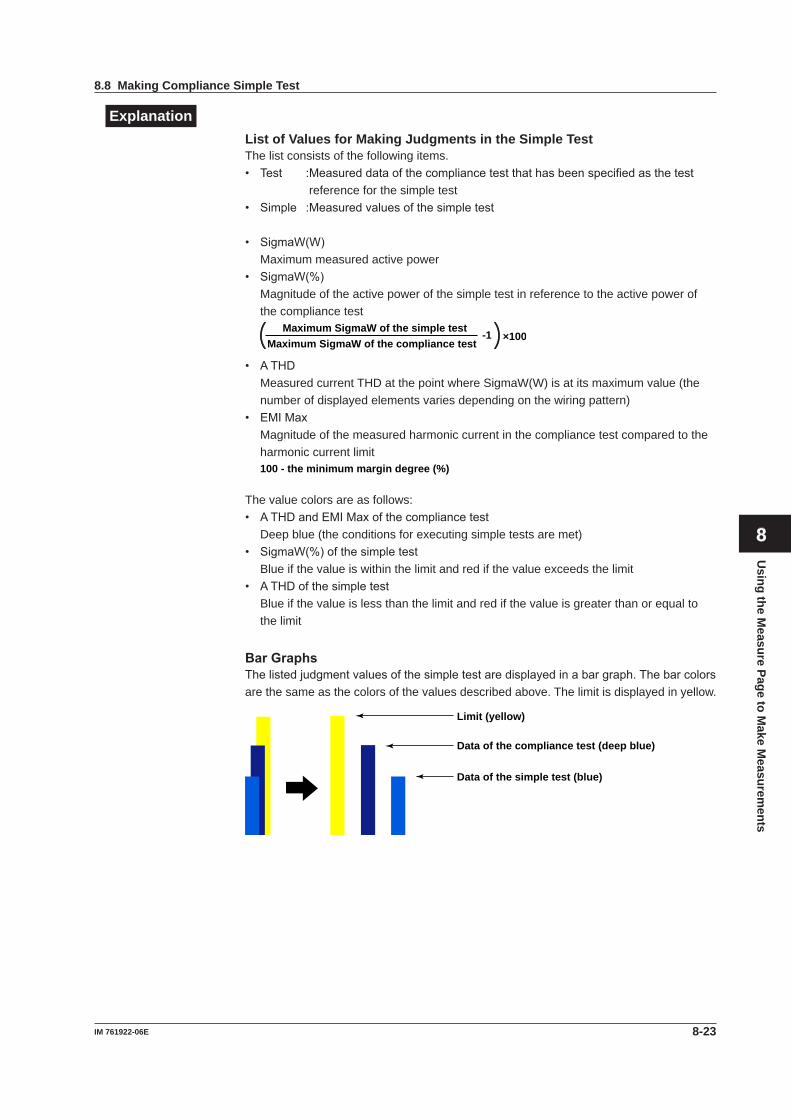
8-23IM 761922-06E
Using the M
easure Page to Make M
easurements
ExplanationList of Values for Making Judgments in the Simple TestThe list consists of the following items.• Test :Measureddataofthecompliancetestthathasbeenspecifiedasthetest
reference for the simple test• Simple :Measuredvaluesofthesimpletest
• SigmaW(W) Maximum measured active power• SigmaW(%) Magnitude of the active power of the simple test in reference to the active power of
the compliance test
Maximum SigmaW of the simple test
Maximum SigmaW of the compliance test-1 ×100
• ATHD Measured current THD at the point where SigmaW(W) is at its maximum value (the
number of displayed elements varies depending on the wiring pattern)• EMIMax Magnitude of the measured harmonic current in the compliance test compared to the
harmonic current limit 100 - the minimum margin degree (%)
The value colors are as follows:• ATHDandEMIMaxofthecompliancetest Deep blue (the conditions for executing simple tests are met)• SigmaW(%)ofthesimpletest Blue if the value is within the limit and red if the value exceeds the limit• ATHDofthesimpletest Blue if the value is less than the limit and red if the value is greater than or equal to
the limit
Bar GraphsThelistedjudgmentvaluesofthesimpletestaredisplayedinabargraph.Thebarcolorsare the same as the colors of the values described above. The limit is displayed in yellow.
Limit (yellow)
Data of the compliance test (deep blue)
Data of the simple test (blue)
8.8 Making Compliance Simple Test
3
2
1
4
5
6
7
8
9
10
11
12
13
14
Index
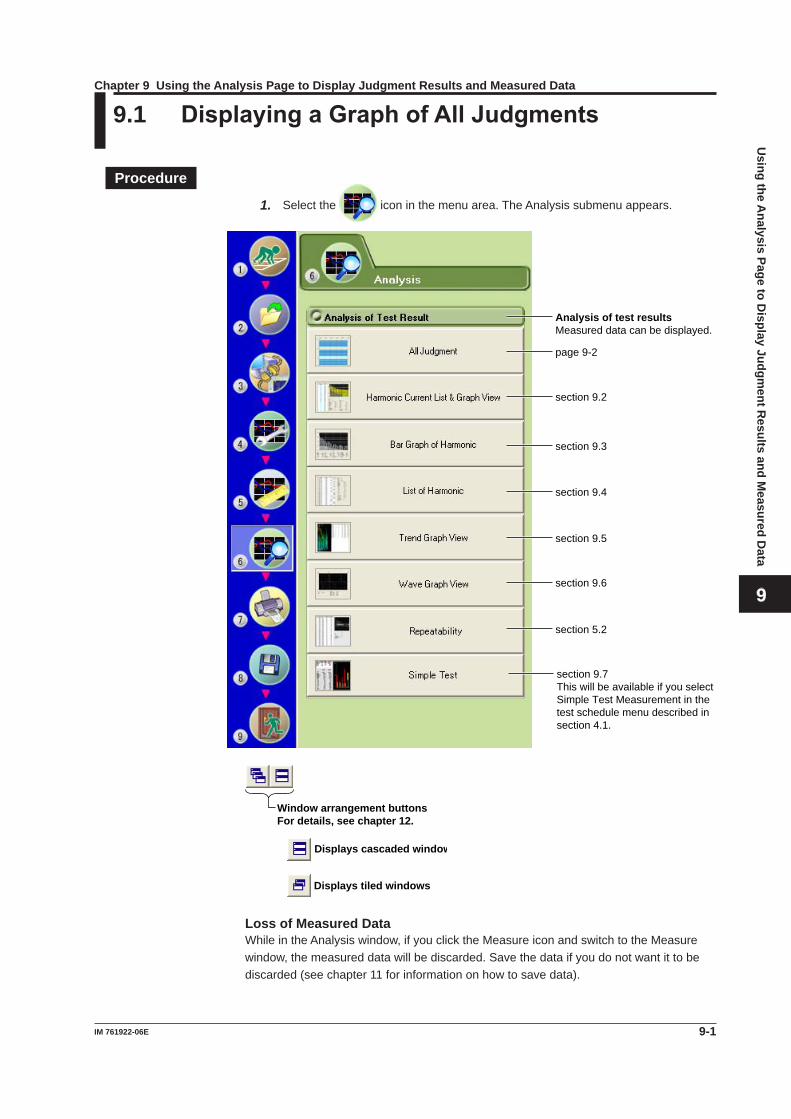
9-1IM 761922-06E
Using the A
nalysis Page to Display Judgm
ent Results and M
easured Data
3
2
1
4
5
6
7
8
9
10
11
12
13
14
Index
9.1 Displaying a Graph of All Judgments
Procedure
1. Select the icon in the menu area. The Analysis submenu appears.
Analysis of test resultsMeasured data can be displayed.
page 9-2
section 9.2
section 9.3
section 9.4
section 9.5
section 9.6
section 5.2
section 9.7This will be available if you select Simple Test Measurement in the test schedule menu described in section 4.1.
Window arrangement buttonsFor details, see chapter 12.
Displays cascaded windows
Displays tiled windows
Loss of Measured DataWhile in the Analysis window, if you click the Measure icon and switch to the Measure window, the measured data will be discarded. Save the data if you do not want it to be discarded (see chapter 11 for information on how to save data).
Chapter 9 Using the Analysis Page to Display Judgment Results and Measured Data

9-2 IM 761922-06E
Displaying a Graph of All Judgments2. ClickAll Judgment.Agraphofalljudgmentsappears.
Scroll barYou can drag (the slider) with the mouse or click toselect the measured data that you want to display. Whenyou move the slider, the measure time, sample countnumber, and cursor position change accordingly.
Sampled data count
Measuretime
Zoom in/zoom out/display all (page 9-4)
Judgment graphThis graph shows the judgment results for all data within the measurement time. The judgments for each element are displayed in different colors, depending on the judgment results. The judgment results that are displayed here will change if you shift the displayed time range using the display range bar.
Display range barThis bar indicates where the currently displayed period of time is within the measurement time.
Cursor(page 9-4)
9.1 Displaying a Graph of All Judgments

9-3IM 761922-06E
Using the A
nalysis Page to Display Judgm
ent Results and M
easured Data
3
2
1
4
5
6
7
8
9
10
11
12
13
14
Index
ExplanationThe software displays a graph that shows whether each of the values for current harmonic that are measured within the specified measurement time are within their limitsaccordingtothesettingsdescribedinsection7.3,“SettingtheWT3000JudgmentConditions.”
The input elements that are measured vary depending on the Wiring Pattern setting (see chapter7fordetails).Thesoftwaremakesjudgmentsforeveryinputelementthatissetin the Wiring Pattern setting.
Evaluation ColorsThetablebelowdescribeswhatthecolorsintheevaluationgraphindicate.Condition1,Condition2,200%short-termrelaxation,andPOHCrelaxationconditionsthatappearinthe table are defined below.
• Condition 1 The maximum harmonic current over the measurement time is within 1.5 times the
specified limit. Evaluation is made on each order.
• Condition 2 The mean harmonic current over the measurement time is within the specified limit.
Evaluation is made on each order.
• 200% Short-Term Relaxation Conditions If all of the following conditions are met, up to 200% of the specified limits is permitted.
• TheEUTbelongstoClassAforharmonics.• The excursion beyond 150 % of the applicable limits lasts less than 10 % of the test
observation period or in total 10 min (within the test observation period), whichever is smaller.
• The average value of the harmonic current, taken over the entire test observation period, is less than 90 % of the applicable limits.
• POHC Relaxation Condition Ifthemaximumvalueofthesumofpartialoddharmoniccurrents(POHC)oforder
aboveandincluding21islessthanthespecifiedPOHClimit,themeanoftheoddharmonic currents of order above and including 21 is permitted to be 1.5 times the specified limit.
9.1 Displaying a Graph of All Judgments
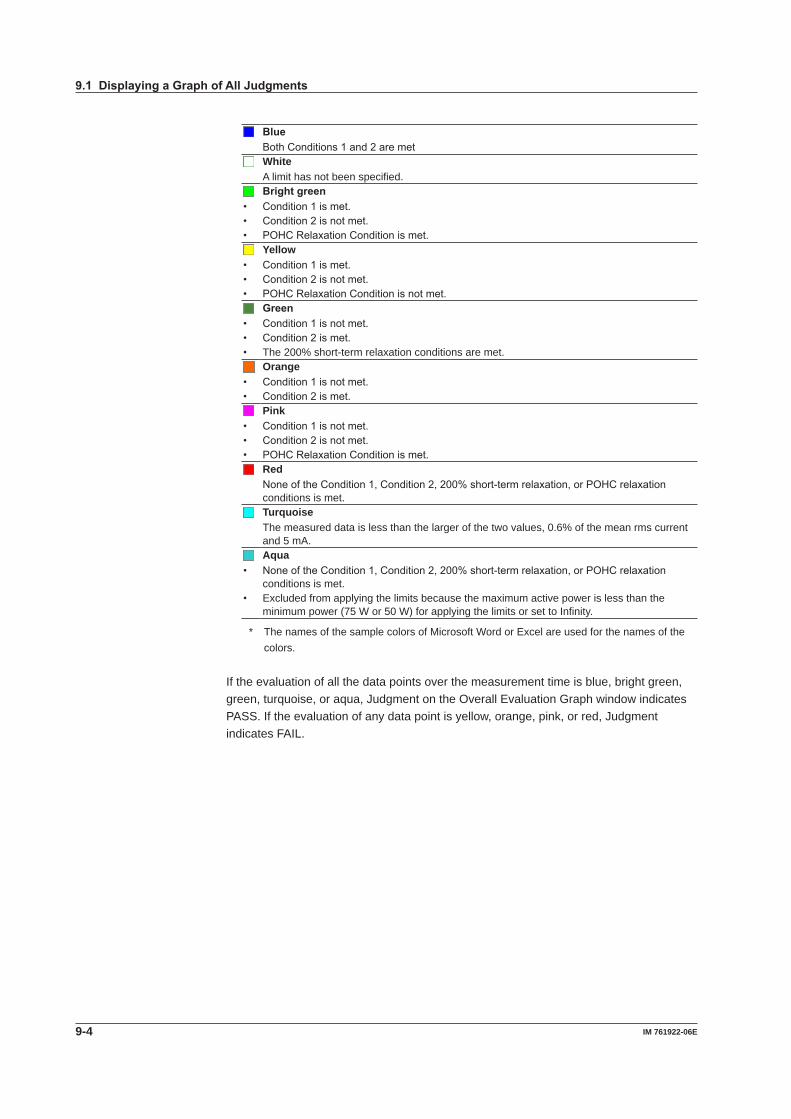
9-4 IM 761922-06E
BlueBothConditions1and2aremetWhiteA limit has not been specified.Bright green
• Condition1ismet.• Condition2isnotmet.• POHCRelaxationConditionismet.
Yellow• Condition1ismet.• Condition2isnotmet.• POHCRelaxationConditionisnotmet.
Green• Condition1isnotmet.• Condition2ismet.• The 200% short-term relaxation conditions are met.
Orange• Condition1isnotmet.• Condition2ismet.
Pink• Condition1isnotmet.• Condition2isnotmet.• POHCRelaxationConditionismet.
RedNoneoftheCondition1,Condition2,200%short-termrelaxation,orPOHCrelaxationconditions is met.TurquoiseThe measured data is less than the larger of the two values, 0.6% of the mean rms current and 5 mA.Aqua
• NoneoftheCondition1,Condition2,200%short-termrelaxation,orPOHCrelaxationconditions is met.
• Excluded from applying the limits because the maximum active power is less than the minimum power (75 W or 50 W) for applying the limits or set to Infinity.
* The names of the sample colors of Microsoft Word or Excel are used for the names of the colors.
If the evaluation of all the data points over the measurement time is blue, bright green, green, turquoise, or aqua, Judgment on the Overall Evaluation Graph window indicates PASS. If the evaluation of any data point is yellow, orange, pink, or red, Judgment indicates FAIL.
9.1 Displaying a Graph of All Judgments
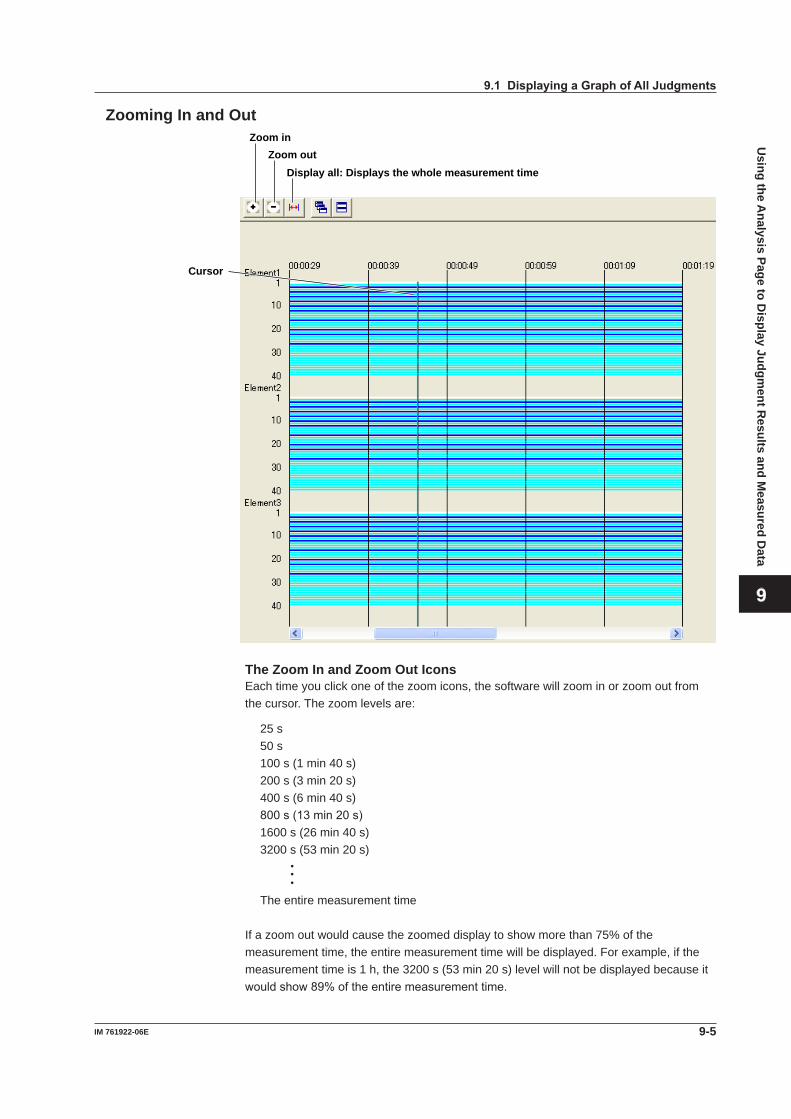
9-5IM 761922-06E
Using the A
nalysis Page to Display Judgm
ent Results and M
easured Data
3
2
1
4
5
6
7
8
9
10
11
12
13
14
Index
Zooming In and Out
Display all: Displays the whole measurement timeZoom out
Zoom in
Cursor
The Zoom In and Zoom Out IconsEach time you click one of the zoom icons, the software will zoom in or zoom out from the cursor. The zoom levels are:
25 s 50 s 100 s (1 min 40 s) 200 s (3 min 20 s) 400 s (6 min 40 s) 800s(13min20s) 1600 s (26 min 40 s) 3200 s (53 min 20 s) • • •
The entire measurement time
If a zoom out would cause the zoomed display to show more than 75% of the measurement time, the entire measurement time will be displayed. For example, if the measurement time is 1 h, the 3200 s (53 min 20 s) level will not be displayed because it wouldshow89%oftheentiremeasurementtime.
9.1 Displaying a Graph of All Judgments
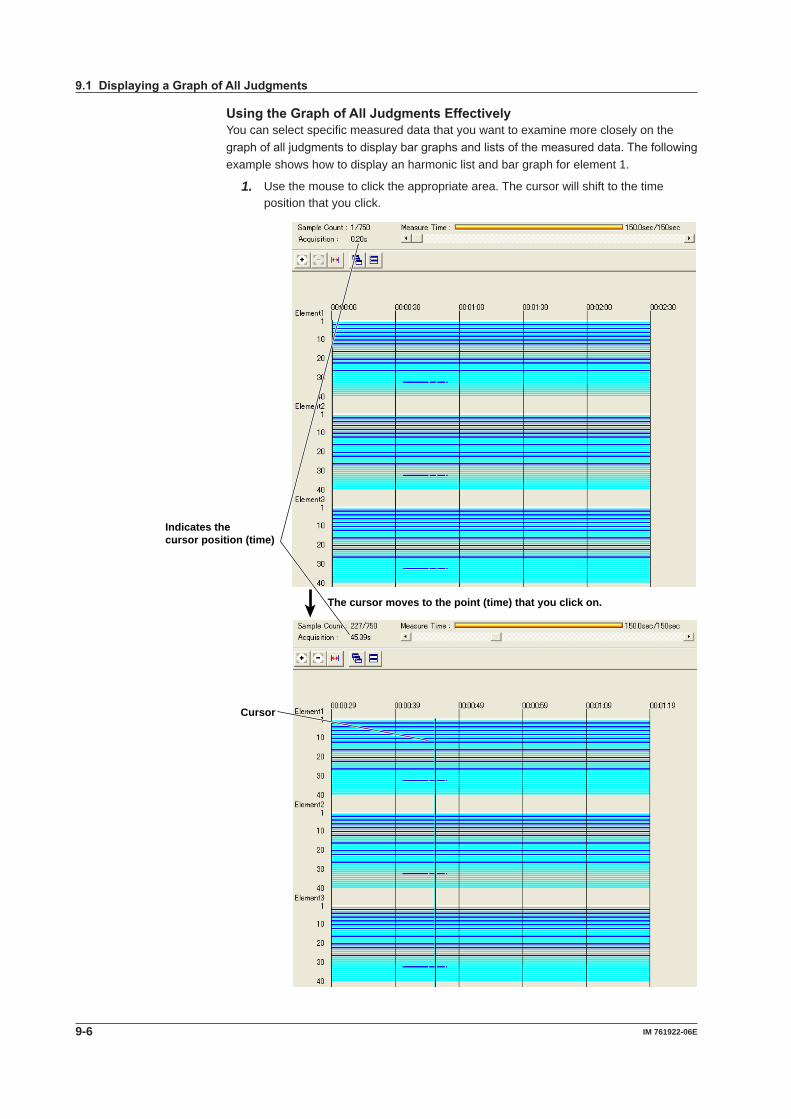
9-6 IM 761922-06E
Using the Graph of All Judgments EffectivelyYou can select specific measured data that you want to examine more closely on the graphofalljudgmentstodisplaybargraphsandlistsofthemeasureddata.Thefollowingexample shows how to display an harmonic list and bar graph for element 1.
1. Use the mouse to click the appropriate area. The cursor will shift to the time position that you click.
Indicates thecursor position (time)
The cursor moves to the point (time) that you click on.
Cursor
9.1 Displaying a Graph of All Judgments

9-7IM 761922-06E
Using the A
nalysis Page to Display Judgm
ent Results and M
easured Data
3
2
1
4
5
6
7
8
9
10
11
12
13
14
Index
2. Inthesubmenu,selectHarmonicCurrentListandGraphView,andthenselect Instant from the list in the setting and display area. A bar graph for the instantaneous values from the cursor position will appear.For detailed information about the bar graph display, see section 9.3.
Indicates the cursor position (time)
The level of the 33th harmonic order changes, and the judgment changes from blue to turquoise.
9.1 Displaying a Graph of All Judgments

9-8 IM 761922-06E
9.2 Displaying a List and Graph of Harmonic Current Values
Procedure
1. Select the icon in the menu area. The Analysis submenu appears. For
general information about the Analysis submenu, see section 9.1.
Displaying a List and Graph of Harmonic Current Values2. ClickHarmonic Current List and Graph View. A list and graph of harmonic
current values appear.
Numerical List
Scroll bar When displaying instantaneous values, you can drag (the slider) with the mouse or click to select the measured data that you want to display. When you move the slider, the measure time, sample count number, and displayed measured data (instantaneous values) change accordingly. Toolbar
Bar Graph
Measured value lists For explanations of these terms, see section 1.5.
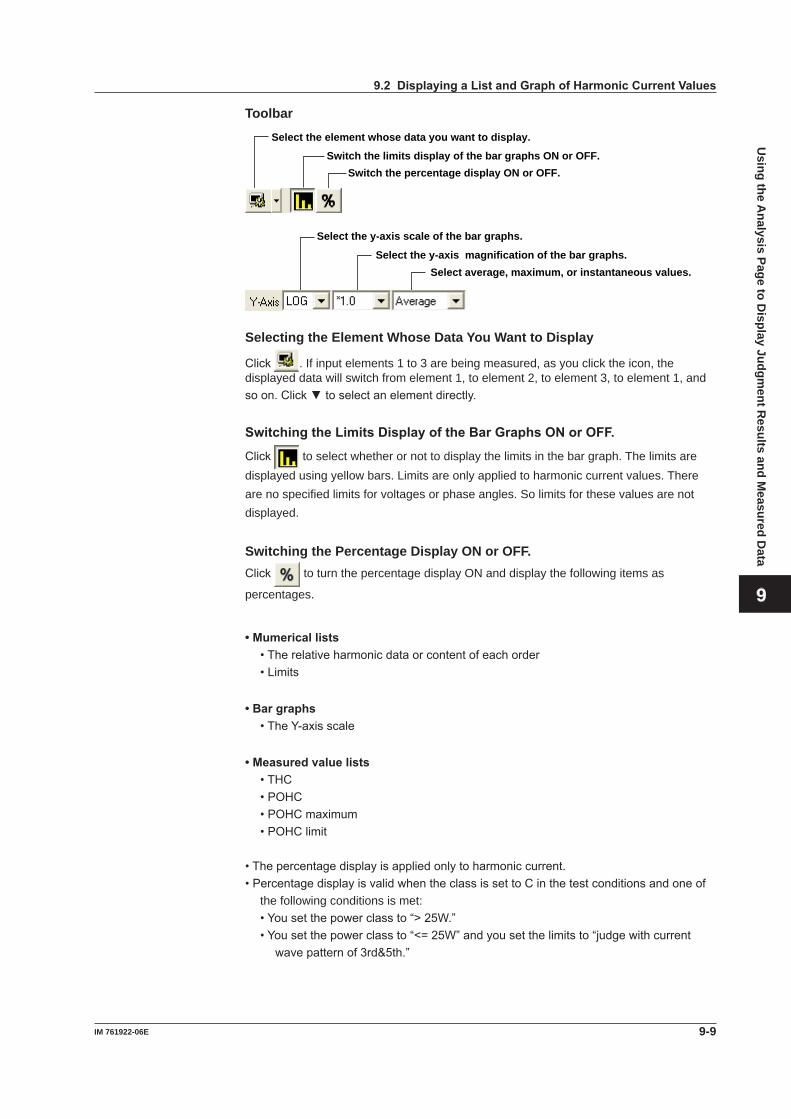
9-9IM 761922-06E
Using the A
nalysis Page to Display Judgm
ent Results and M
easured Data
3
2
1
4
5
6
7
8
9
10
11
12
13
14
Index
Toolbar
Select the element whose data you want to display.
Switch the limits display of the bar graphs ON or OFF.Switch the percentage display ON or OFF.
Select the y-axis scale of the bar graphs.
Select average, maximum, or instantaneous values.Select the y-axis magnification of the bar graphs.
Selecting the Element Whose Data You Want to Display
Click . If input elements 1 to 3 are being measured, as you click the icon, the displayed data will switch from element 1, to element 2, to element 3, to element 1, and soon.Clicktoselectanelementdirectly.
Switching the Limits Display of the Bar Graphs ON or OFF.
Click to select whether or not to display the limits in the bar graph. The limits are displayed using yellow bars. Limits are only applied to harmonic current values. There are no specified limits for voltages or phase angles. So limits for these values are not displayed.
Switching the Percentage Display ON or OFF.Click to turn the percentage display ON and display the following items as
percentages.
• Mumerical lists•Therelativeharmonicdataorcontentofeachorder•Limits
• Bar graphs•TheY-axisscale
• Measured value lists•THC•POHC•POHCmaximum•POHClimit
•Thepercentagedisplayisappliedonlytoharmoniccurrent.•PercentagedisplayisvalidwhentheclassissettoCinthetestconditionsandoneof
the following conditions is met:•Yousetthepowerclassto“>25W.”•Yousetthepowerclassto“<=25W”andyousetthelimitsto“judgewithcurrent
wavepatternof3rd&5th.”
9.2 Displaying a List and Graph of Harmonic Current Values

9-10 IM 761922-06E
•OnhePercentageDisplay,Therelativeharmoniccontentofcurrentofeachordercan be displayed on bar graphs with the specified fundamental current (fundamental currentspecifiedinadvancewhenmakingClassCevaluation,seesection3.5)takento be 100%.
•Whenlimitsarespecifiedbytherelativeharmoniccontentoforder3and5suchasthelimitsforClassCequipmentwithactiveinputpowerlessthanorequalto25W,barscorresponding to the magnitude of the values are displayed.
•WhenthemagnificationoftheY-axisscaleis*1.0,themaximumscaleofY-axisis100.00%.
Selecting the Y-Axis (Current Magnitude) Scale• Selecting the Type of Y-Axis Scale Select LIN (linear) or LOG (logarithmic).
• Selecting the Magnification When the type of scale is LIN, select *100.0, *10.0, *5.0, *2.0, *1.0, *0.5, or *0.1. When the type of scale is LOG, select *100.0, *10.0, *1.0, or *.1.
Selecting Average, Maximum, or Instantaneous ValuesSelect Average, Maximum, or Instant.
9.2 Displaying a List and Graph of Harmonic Current Values
9-11IM 761922-06E
Using the A
nalysis Page to Display Judgm
ent Results and M
easured Data
3
2
1
4
5
6
7
8
9
10
11
12
13
14
Index
ExplanationList Display
Limit• Thelimitsspecifiedintheapplicablestandardaredisplayedinalistforeachorder.• Thelimitsareappliedonlytoharmoniccurrent.• IfthePercentageDisplaycheckboxisselected,therelativeharmoniccontentofthe
limit of each order can be displayed with the specified fundamental current (fundamental currentspecifiedinadvancewhenmakingClassCevaluation,seesection7.3)takento be 100%.
• Whenlimitsarespecifiedbytherelativeharmoniccontentoforder3and5suchasthelimitsforClassCequipmentwithactiveinputpowerlessthanorequalto25W,the current value converted from the relative harmonic content of order 3 and 5 with the fundamental current specified in advance (see section 7.3) taken to be 100% is displayed.
MarginIndicates the margin to the limit. For each order, the margin is derived from the following equation using the limits and measured values displayed in the list.
× 100Limit – measured valueLimit
• Themarginonlyappliestoharmoniccurrentvalues.• Thecolorofthevalueschangesdependingonwhetherornotyouselect“The
margindegreeisused”checkboxdescribedinsection7.4.• WhentheMarginDegreeIsUsed Blue indicates that a value has exceeded the margin that you specified
according to the procedure in section 7.4. Red indicates that a value is at or below the margin that you specified according
to the procedure in section 7.4.• WhentheMarginDegreeIsNotUsed Values are displayed in black.
9.2 Displaying a List and Graph of Harmonic Current Values

9-12 IM 761922-06E
Bar Graph DisplayAverage/Maximum/Instantaneous ValueThe software displays bar graphs and lists in three ways depending on whether you select to display average, maximum, or instantaneous values. This section explains the differences between each display.• Average value display
• Valuesandbarsforeachharmonicorder The software averages the measured data (instantaneous values) of each
harmonic order that is acquired within the measurement time and displays those averages.
• Measureditemsthatappeartotherightofthelist The software averages the values acquired for each measured item within the
measurement time and displays those averages.• Limitvaluesandbars The software displays numbers and yellow bars that indicate the values of the
limits.
• Maximum value display• Valuesandbarsforeachharmonicorder The software finds and displays the maximum value from each harmonic order’s
measured values by comparing the instantaneous values that have been acquired within the measurement time.
• Itemsthatappeartotherightofthelist The software finds and displays the maximum value for each measured item
by comparing the instantaneous values that have been acquired within the measurement time.
• Limitvaluesandbars The software displays numbers and yellow bars that are 1.5 times greater than the
values of the limits.
• Instantaneous value display• Valuesandbarsforeachharmonicorder The software displays the instantaneous values acquired within the measurement
time for each harmonic order.• Measureditemsthatappeartothelowerrightofthelist The software displays the instantaneous values acquired within the measurement
time.• Limitvaluesandbars The software displays numbers and yellow bars that are 1.5 times greater than the
values of the limits.• Selectingvalues Use the scroll bar to change the displayed instantaneous values.
NoteWhen the software is displaying average or maximum values, using the scroll bar will have no effect on the harmonic current list and graph displays.
9.2 Displaying a List and Graph of Harmonic Current Values
9-13IM 761922-06E
Using the A
nalysis Page to Display Judgm
ent Results and M
easured Data
3
2
1
4
5
6
7
8
9
10
11
12
13
14
Index
Colors of the numerical lists and bar graphs of the currentThe lengths for the bar graphs are determined by the size of the measured data that they represent. The meanings of bar colors are as follows:
BlueLimit not exceeded.Bright green (applies only to average list)When the same conditions of bright green on page 9-4 applies.Green (applies only to maximum list and Instantaneous list)When the same conditions of green on page 9-4 applies.RedExceeds the limit.Yellow (applies only to bar graph)The limit specified by the standard.Black (applies only to numerical list)No applicable limit is specified.(The measured value of the fundamental frequency and orders that are not applicable is displayed in black.)WhiteNo applicable limit is specified.(The bar graph of the fundamental frequency and orders that are not applicable is displayed in white.)TurquoiseThe measured data is less than the larger of the two values, 0.6% of the mean rms current and 5 mA.AquaLimit exceeded.Excluded from applying the limits because the maximum active power is less than the minimum power (75 W or 50 W) for applying the limits or set to Infinity.
* The names of the sample colors of Microsoft Word or Excel are used for the names of the colors.
Colors of the numerical lists and bar graphs of the voltage and phase angleThere are no voltage or phase angle limits. Bar graphs of harmonic voltage or phase angle are displayed in white. The values displayed in the list are black.
Measured Value ListsFor explanations of these terms, see section 1.5.
• Sigma W Sigma W is the active power for all grouped phases (all measured input elements).
Note• WhenapplyingthepowerratiolimitonClassCorDmulti-phaseequipment,the
harmonic current per watt derived from the total active power (Sigma W) of all phases (three phases if three-phase) and the power ratio limit are compared and evaluated.
• EquipmentwhoseSigmaWexceeds600WisconsideredClassAequipmentunderthestandard. Use caution because the software makes evaluations using the class selected in standard and measurement environment settings (see section 7.3).
9.2 Displaying a List and Graph of Harmonic Current Values
9-14 IM 761922-06E
• Set P, Set Fund I, and Set PF For Set P, the power value (see section 3.5) specified in advance is displayed when
makingClassCorDevaluations. For Set Fund I and Set PF, the fundamental current and power factor values (see
section7.3)specifiedinadvancearedisplayedrespectivelywhenmakingClassCevaluations.
NoteInsection7.1,ifyouselectedthe“UseAnnexC”checkboxandselected“C16.2(withVSD)Refrigeratorsandfreezers,”theseitemsaredisplayedasfollows:• SetP: C16.2Im (currentoftheappliance)• SetFundI: C16.2Ur (ratedvoltageoftheappliance)• SetPF: C16.2Pi (effectivepoweroftheappliance)
Mutual Relationship of Graphs and ListsWhen using the scroll bar to select the time of acquisition and displaying the measured data on a graph window or list window displaying a certain instantaneous value, the other graph window or list window also shows the measured data at the same time of acquisition.
9.2 Displaying a List and Graph of Harmonic Current Values

9-15IM 761922-06E
Using the A
nalysis Page to Display Judgm
ent Results and M
easured Data
3
2
1
4
5
6
7
8
9
10
11
12
13
14
Index
9.3 Displaying a Harmonic Bar Graph
Procedure
1. Select the icon in the menu area. The Analysis submenu appears. For
general information about the Analysis submenu, see section 9.1.
Displaying a Harmonic Bar Graph2. ClickBar Graph of Harmonic. A harmonic bar graph appears.
Select the element whose data you want to display. Scroll bar You can drag (the slider) with the mouse or click to select the measured data that you want to display. When you move the slider, the measure time, sample count number, and displayed measured data (instantaneous values) change accordingly.

9-16 IM 761922-06E
Changing the Y-Axis Scale (the Size of the Current Waveform)• Selecting the Type of Y-Axis Scaling Select LIN (linear) or LOG (logarithmic).
• Selecting the Scale When the scaling type is LIN, you can select *100.0, *10.0, *5.0, *2.0, *1.0, *0.5, or
*0.1. When the scaling type is LOG, you can select *100.0, *10.0, *1.0, or *0.1.
Selecting the Measurement Function to DisplaySelect A, V, or Deg (for current, voltage, or phase angle).
ExplanationBar Graph of Harmonic Current or VoltageThe software displays the instantaneous values acquired within the measurement time for each harmonic order.
Bar Graph of Harmonic Phase AnglesBar graphs of the phase angle of the harmonic current with respect to the fundamental current for each order can be displayed. However, the phase angle with respect to the fundamental voltage is displayed on the bar graph for the fundamental current.• Whentheharmonicphaseisleadingthefundamentalcurrent,apositivephaseangle
is indicated; when the harmonic phase is lagging the fundamental current, a negative phase angle is indicated.
• Whenthefundamentalcurrentisleadingthefundamentalvoltage,anegativephaseangle is indicated; when the fundamental current is lagging the fundamental voltage, a positive phase angle is indicated.
Bar Graph Display ColorThe bar graph is displayed in white.
NoteThis bar graph does not display limits.
Selecting Instantaneous ValuesUse the scroll bar to change the displayed instantaneous values.
9.3 Displaying a Harmonic Bar Graph
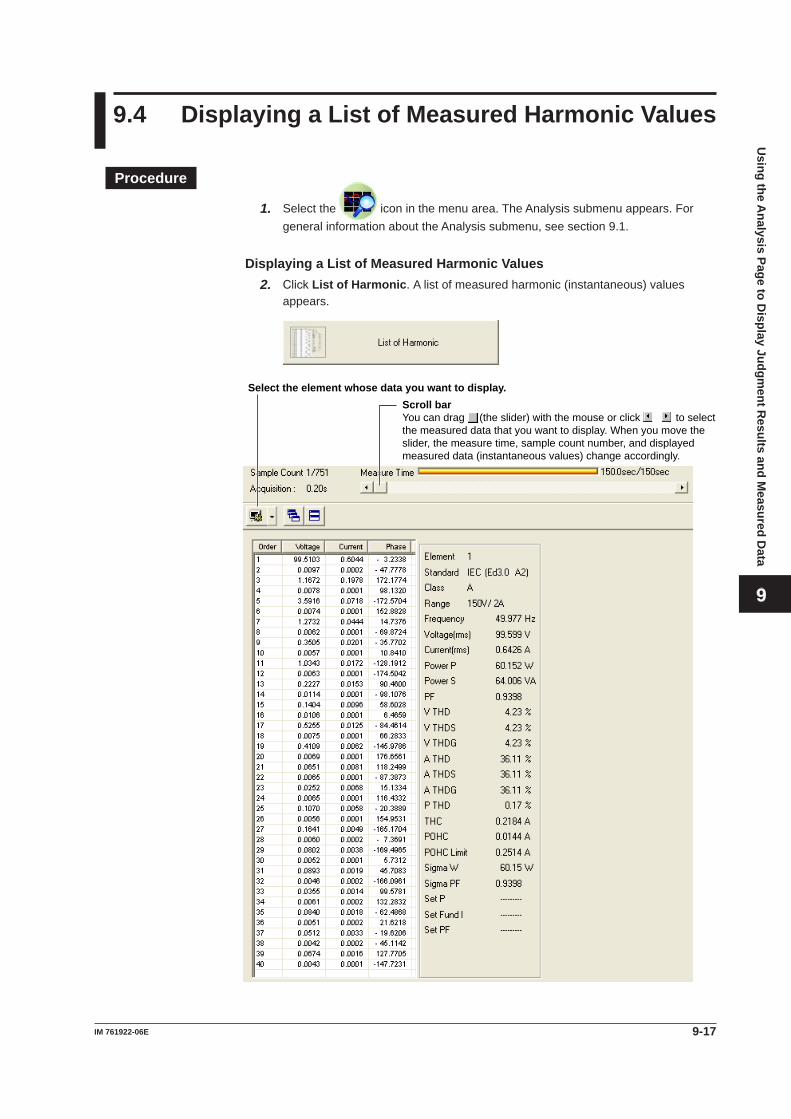
9-17IM 761922-06E
Using the A
nalysis Page to Display Judgm
ent Results and M
easured Data
3
2
1
4
5
6
7
8
9
10
11
12
13
14
Index
9.4 Displaying a List of Measured Harmonic Values
Procedure
1. Select the icon in the menu area. The Analysis submenu appears. For general information about the Analysis submenu, see section 9.1.
Displaying a List of Measured Harmonic Values2. ClickList of Harmonic. A list of measured harmonic (instantaneous) values
appears.
Select the element whose data you want to display. Scroll bar You can drag (the slider) with the mouse or click to select the measured data that you want to display. When you move the slider, the measure time, sample count number, and displayed measured data (instantaneous values) change accordingly.
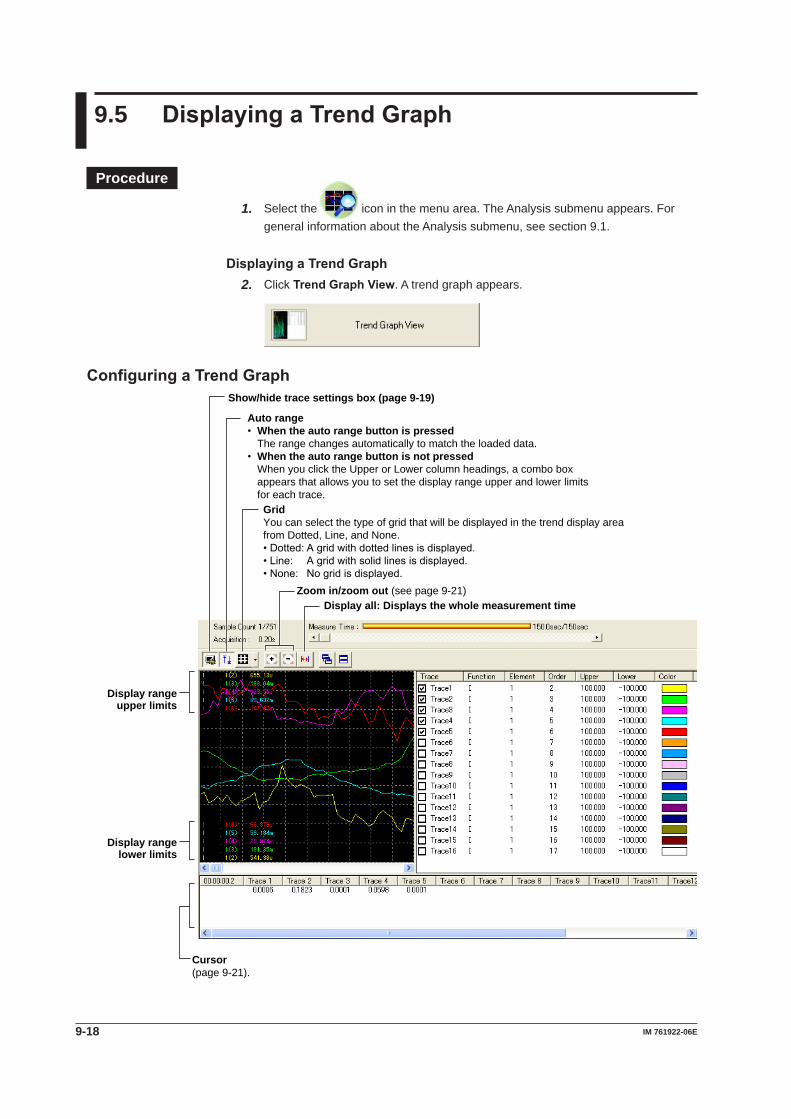
9-18 IM 761922-06E
9.5 Displaying a Trend Graph
Procedure
1. Select the icon in the menu area. The Analysis submenu appears. For general information about the Analysis submenu, see section 9.1.
Displaying a Trend Graph2. ClickTrend Graph View. A trend graph appears.
Configuring a Trend Graph
Display rangeupper limits
Display rangelower limits
Cursor(page 9-21).
GridYou can select the type of grid that will be displayed in the trend display areafrom Dotted, Line, and None.• Dotted: A grid with dotted lines is displayed.• Line: A grid with solid lines is displayed.• None: No grid is displayed.
Show/hide trace settings box (page 9-19)
Zoom in/zoom out (see page 9-21)
Auto range• When the auto range button is pressed The range changes automatically to match the loaded data.• When the auto range button is not pressed When you click the Upper or Lower column headings, a combo box appears that allows you to set the display range upper and lower limits for each trace.
Display all: Displays the whole measurement time

9-19IM 761922-06E
Using the A
nalysis Page to Display Judgm
ent Results and M
easured Data
3
2
1
4
5
6
7
8
9
10
11
12
13
14
Index
Configuring TracesShow/hide trace settings box Trace settings box
TraceSelect the trends you want to display (select or clear the check boxes).
FunctionSelect the measurement function to be displayed.
1. ClicktheFunction column. A combo box opens.
2. Select the measurement function.
NoteYou can select from the following measurement functions.• U Voltage• I Current• P Power• S Apparentpower• SigmaW Activepowerofallphases• SigmaPF Powerfactorofallphases• Freq FundamentalfrequencyofthePLLsource• LAMBDA Powerfactor• POHC Sumofoddharmoniccurrentsoforderaboveandincluding21• THC Totalharmoniccurrent• PHI Phaseangle
ElementSelect the element to be displayed.
1. ClicktheElement column. A combo box opens.
2. Select the element.
9.5 Displaying Trend Graphs
9-20 IM 761922-06E
OrderSelect the harmonic order that you want to display.
1. ClicktheOrder column heading. A dialog box appears.
2. Select the harmonic order you want to display.
Upper and LowerIf the Auto Ranging check box is not selected, set the Upper and Lower limit of the display range.
1. ClicktheUpper or Lower column. A edit box opens.
2. Set the upper or lower limit value of the display range.
ColorSelect the display color of the trend.
1. ClicktheColor column. A combo box opens.
2. Select the display color of the trend.
9.5 Displaying Trend Graphs

9-21IM 761922-06E
Using the A
nalysis Page to Display Judgm
ent Results and M
easured Data
3
2
1
4
5
6
7
8
9
10
11
12
13
14
Index
Zooming In and Zooming Out
Zoom out
Zoom in Click to zoom in. You can zoom in until the trend display area contains 2 s worth of data.
Click to zoom out. You can zoom out until the trend display area contains the data for all of the elapsed time.
Scroll bar You can drag (the slider) with the mouse or click to select the measured data that you want to display.
CursorWhen you click somewhere on the trend display area, a cursor will appear there.You can move the cursor by dragging it.
SliderMove along the time axis to the waveform that you want to display.
PP_Max In the trend display, if not all the measured values can be displayed because the specified time axis value is set too high, measured values are P-P compressed and displayed.* When this occurs, PP_Max is displayed here. To display values without P-P compression, zoom in on the time axis.
* P-P Compression (Peak-to-Peak Compression)In P-P compression, a maximum and minimum value are extracted from the values measured over a given period of time and are used to produce a compressed measured value.For details, see section 2.7 of the WT3000 or WT3000E User’ s Manual.• WT3000: IM760301-01E• WT3000E: IMWT3001E-01EN
9.5 Displaying Trend Graphs

9-22 IM 761922-06E
9.6 Displaying a Waveform Graph
Procedure
1. Select the icon in the menu area. The Analysis submenu appears. For general information about the Analysis submenu, see section 9.1.
Displaying a Waveform Graph2. ClickWave Graph View. A waveform graph appears.
Select the X- Axis Scale. Switch the voltage waveforms display ON or OFF.
Select the magnification of the voltage waveforms. Switch the current waveforms display ON or OFF.
Select the magnification of the current waveforms.
Switch the regulation zone display ON or OFF. Select the element whose data you want to display.
Measured values for wave judgment

9-23IM 761922-06E
Using the A
nalysis Page to Display Judgm
ent Results and M
easured Data
3
2
1
4
5
6
7
8
9
10
11
12
13
14
Index
Switching the Regulation Zone Display ON or OFF.
Click .Youcanselectwhethertodisplaythewavejudgmentregulationzones.There are the following two regulation zones.
Current peak : Before or at 65°
Beginning of the current flow to the end of the current flow: 5% between 60° to 90°
Switching the Limits Display of the Bar Graphs ON or OFF.
Click . Select ALL, Cycle, Half Cycle+, or Half Cycle-. The button indication changes depending on the current setting.
Changing the Y- Axis Scale (the Size of the Voltage and Current Waveforms)Select *100.0, *10.0, *50, *2.0, *1.0, *0.5, or *0.1.
9.6 Displaying a Waveform Graph

9-24 IM 761922-06E
Using the Cursor to Display Current and Phase Angle ValuesWhen you click an area of the waveform, a cursor will appear there. The current and phase angle values at the cursor position will be displayed.
Current value
Slider CursorPhase angle
ExplanationThe waveform data is acquired immediately after the measurement for a compliance test is finished. The software acquires and displays a waveform graph of about two periods using 2200 points of current and voltage waveform data. You can display waveform graphs for each WT input element. This waveform data is different than the waveform data that is displayed in the waveform preview.
NoteUsing the scroll bar will have no effect on the waveform graph display.
Switching the Regulation Zone Display ON or OFFYoucanshoworhidetheregulationzonedisplaywhenyousetthefollowingjudgmentconditions (see section 7.3).• ClassC• TheActivePowerIsLessThanorEqualto25W(<=25W)• EvaluatingontheConditionsofHarmonicOrder3and5
Numeric Value Displays below the Graph• Frequency The average value of all frequencies (frequency of the fundamental signal of the PLL
source) within the measurement time.• CurrentPeak(+) Maximum positive value of the current waveform displayed.• CurrentPeak(–) Maximum negative value of the current waveform displayed.• Voltage Peak (+) Maximum positive value of the voltage waveform displayed.• VoltagePeak(–) Maximum negative value of the voltage waveform displayed.
9.6 Displaying a Waveform Graph

9-25IM 761922-06E
Using the A
nalysis Page to Display Judgm
ent Results and M
easured Data
3
2
1
4
5
6
7
8
9
10
11
12
13
14
Index
Measured Values for Wave JudgmentThisappearswhenyousetthefollowingjudgmentconditions(seesection7.3).• ClassC• TheActivePowerIsLessThanorEqualto25W(<=25W)• EvaluatingontheConditionsofHarmonicOrder3and5
Thedisplayedcontentsareshownbelow.Fordetailsonwavejudgment,seesection1.3.• Ip+ :Phaseangleofthepeakvalueofthecurrentwaveform(+)• Ip- :Phaseangleofthepeakvalueofthecurrentwaveform(-)• Ip(abs) :Thehigherabsolutevalueofthepeakvalueofthecurrent
waveform (+) and (-)• 60-90deg(+)Min :Minimumcurrentbetween60°to90°inthepositivehalfcycle• 60-90deg(-)Max :Maximumcurrentbetween60°to90°inthenegativehalfcycle
Colorsofmeasuredvalues• Ip+andIp-aredisplayedinredwhenthe"wavepeakphase"setinsection7.3is
exceeded.• 60-90deg(+)Minisdisplayedinredwhenitislessthanorequaltothe"current
threshold" set in section 7.3.• 60-90deg(-)Maxisdisplayedinredwhenitisgreaterthanorequaltothe"current
threshold" set in section 7.3.
9.6 Displaying a Waveform Graph

9-26 IM 761922-06E
9.7 Displaying the Results of Simple Compliance Tests
Procedure
1. Select the icon in the menu area. The Analysis submenu appears. For general information about the Analysis submenu, see section 9.1.
Displaying the Results of Simple Compliance Tests2. ClickSimple Test. The results of simple compliance tests appears.
See section 9.2. Bar Graph
Measured value listsFor explanations of these terms, see section 1.5.
List of values for making judgments in the simple test

9-27IM 761922-06E
Using the A
nalysis Page to Display Judgm
ent Results and M
easured Data
3
2
1
4
5
6
7
8
9
10
11
12
13
14
Index
List of Values for Making Judgments in the Simple TestThe list consists of the following items.• Test :Measureddataofthecompliancetestthathasbeenspecifiedasthetest
reference for the simple test• Simple :Measuredvaluesofthesimpletest
• SigmaW(W) Maximum measured active power• SigmaW(%) Magnitude of the active power of the simple test in reference to the active power of
the compliance test
Maximum SigmaW of the simple test
Maximum SigmaW of the compliance test-1 ×100
• ATHD Measured current THD at the point where SigmaW(W) is at its maximum value (the
number of displayed elements varies depending on the wiring pattern)• EMIMax Magnitude of the measured harmonic current in the compliance test compared to the
harmonic current limit 100 - the minimum margin degree (%)
The value colors are as follows:• ATHDandEMIMaxofthecompliancetest Deep blue (the conditions for executing simple tests are met)• SigmaW(%)ofthesimpletest Blue if the value is within the limit and red if the value exceeds the limit• ATHDofthesimpletest Blue if the value is less than the limit and red if the value is greater than or equal to
the limit
Bar GraphsThelistedjudgmentvaluesofthesimpletestaredisplayedinabargraph.Thebarcolorsare the same as the colors of the values described above. The limit is displayed in yellow.
Displaying Other Analysis ResultsWhen you execute a simple compliance test, the following buttons become available in addition to the simple test button. The analysis results that appear when you click these buttons are the measured data of the simple compliance test. The data is not the measured data of the compliance test that has been specified as the test reference for the simple test.
9.7 Displaying the Results of Simple Compliance Tests

10.1 Setting a Report’s Title and Comments
Procedure
1. Select the icon in the menu area. The Print submenu appears.
Enter report comments (page 10-2).
Enter the report title (page 10-2).
Set the print mode (section 10.2).
Set the print language (section 10.2).
Set print options* (section 10.3).
Repor output (section 10.4).
Set the output form (section 10.2).
* The following appears if you have selected Simple Test Measurement in the test schedule menu described in section 4.1.
Chapter 10 Using the Print Page to Print Reports
10-1IM 761922-06E
Using the Print Page to Print R
eports
3
2
1
4
5
6
7
8
9
10
11
12
13
14
Index

Print preview
Switches pagesClick the page you want to display the print preview of.
PrintZooms the print preview in or out
2. Enter the report title and the report comments in their respective boxes.
10.1 Setting a Report’s Title and Comments
10-2 IM 761922-06E

ExplanationYou can create reports using the data measured with the software.
Switching the Page to Display a Print Preview OfThe following pages can be displayed in the print preview.• Compliancesimpletest(Simple) This appears if you have selected Simple Test Measurement in the test schedule
menu described in section 4.1.• Compliancetest
• Elementsdata(Element)• Averagedata(Ave),Maximumdata(Max)
• Waveformdata(Wave) Todisplaywaveformsintheprintpreviewandprintthem,selectthe“Addawaveform
graph”checkboxunder“Report”intheOptiontabdescribedinsection7.4.
Print Preview Display RangeIf the print preview is being zoomed in on, the displayed area is indicated with a red frame.
Moving the Print Preview Display RangeDrag the red frame (which indicates the display range) to move the display range.
Setting the Title and Comment of ReportsAs necessary, you can set the title and comment of a report.• Number of Characters That Can Be Entered See the table below.
Item Number of Characters That Can Be EnteredTitle Up to 40 characters can be entered.Comment Upto1000characterscanbeentered. Up to 90 characters can be displayed on one line. Up to 6 lines can be displayed.
10.1 Setting a Report’s Title and Comments
10-3IM 761922-06E
Using the Print Page to Print R
eports
3
2
1
4
5
6
7
8
9
10
11
12
13
14
Index

10.2 Setting the Print Mode, Print Language and Output Form
ProcedureSelecting the Print Mode
1. SelectColororBlackandWhiteunderPrintMode.Whenyouchangetheprintmode, the print preview in the setting and display area will change accordingly.
Selecting a Print Language2. Select English or Japanese under Print Language. When you change the print
language, the print preview in the setting and display area will change accordingly.
Selecting a Output Form3. Select Paper, PDF or BMP under Output Form.
Selecting the BMP Resolution4. On the Option tab in the setting and display area of section 7.4, if you selected
the“SettingdisplayofBMPresolution”checkbox,selecttheBMPresolution.
ExplanationSelecting the BMP ResolutionYou can select the resolution from the following:• Lowest: Approx.2MB,768×1024• Low: Approx.9MB,1536×2048• High: Approx.36MB,3072×4096• Highest: Approx.147MB,6144×8192
10-4 IM 761922-06E
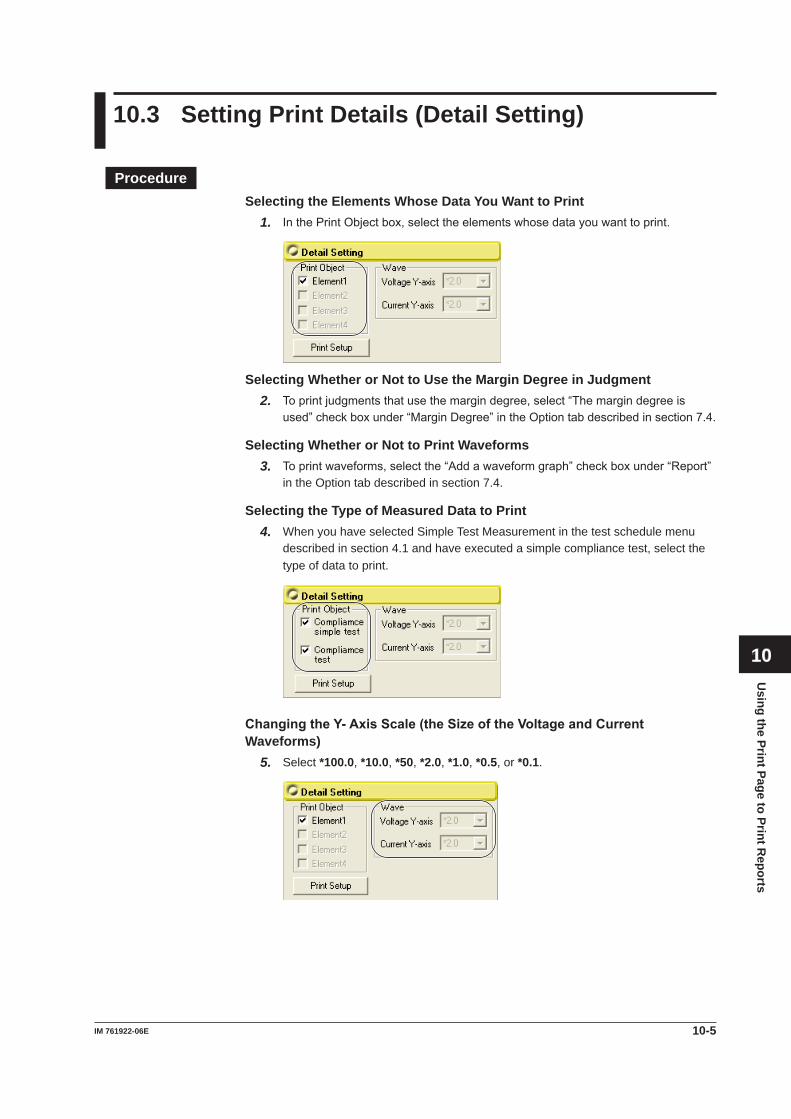
10.3 Setting Print Details (Detail Setting)
ProcedureSelecting the Elements Whose Data You Want to Print
1. InthePrintObjectbox,selecttheelementswhosedatayouwanttoprint.
Selecting Whether or Not to Use the Margin Degree in Judgment2. Toprintjudgmentsthatusethemargindegree,select“Themargindegreeis
used”checkboxunder“MarginDegree”intheOptiontabdescribedinsection7.4.
Selecting Whether or Not to Print Waveforms3. Toprintwaveforms,selectthe“Addawaveformgraph”checkboxunder“Report”
in the Option tab described in section 7.4.
Selecting the Type of Measured Data to Print4. When you have selected Simple Test Measurement in the test schedule menu
described in section 4.1 and have executed a simple compliance test, select the type of data to print.
Changing the Y- Axis Scale (the Size of the Voltage and Current Waveforms)
5. Select *100.0, *10.0, *50, *2.0, *1.0, *0.5, or *0.1.
10-5IM 761922-06E
Using the Print Page to Print R
eports
3
2
1
4
5
6
7
8
9
10
11
12
13
14
Index

Setting Up the Printer6. ChoosePrint Setup. The Print Setup dialog box opens.
7. Enter appropriate settings for Printer, Size, Source, and Orientation.
8. ClickOK.
ExplanationSelecting the Elements Whose Data You Want to PrintThe elements that you can select are determined by the options that you select for Wiring andObjectinsection7.2.
Margin Degree JudgmentsIfyouselect“Themargindegreeisused”checkboxunder“MarginDegree”intheOptiontabdescribedinsection7.4,thejudgmentsbasedonthemarginvaluesforeachharmonic will be printed in red and blue (for information about what each color means, see section 9.2).
Type of Measured Data to Print• Compliancesimpletest :Measureddataofthesimpletest• Compliancetest :Measureddataofthecompliancetestthathasbeen
specified as the test reference for the simple test.
Selecting the Magnification of the Waveform's Y-axis (Voltage or Current Amplitude) ScaleIf you select the "Add a waveform graph" check box under "Report" in the Option tab described in section 7.4, you can select the magnification of the Y-axis (voltage or current amplitude) scale of the waveform graph in reports.
Print SetupMake printer settings according to your system environment.
10.3 Setting Print Details (Detail Setting)
10-6 IM 761922-06E
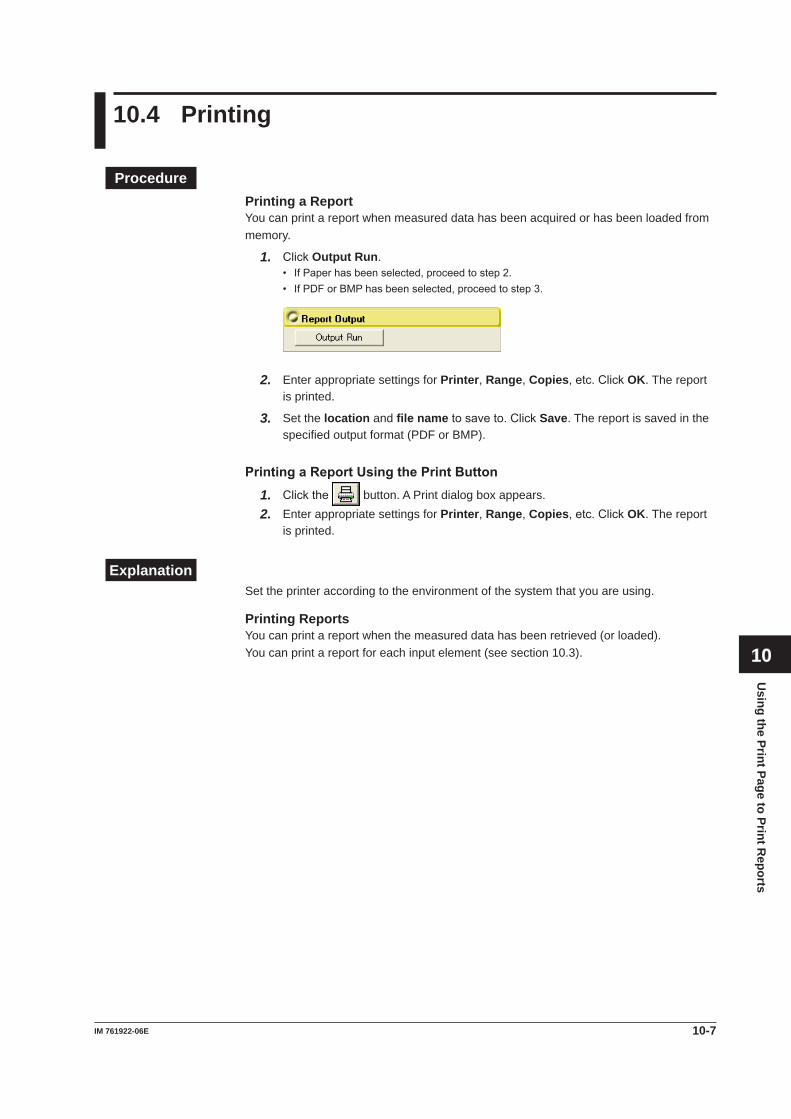
10.4 Printing
ProcedurePrinting a ReportYou can print a report when measured data has been acquired or has been loaded from memory.
1. ClickOutput Run.• IfPaperhasbeenselected,proceedtostep2.• IfPDForBMPhasbeenselected,proceedtostep3.
2. Enter appropriate settings for Printer, Range, Copies,etc.ClickOK. The report is printed.
3. Set the location and file nametosaveto.ClickSave. The report is saved in the specified output format (PDF or BMP).
Printing a Report Using the Print Button1. Clickthe button. A Print dialog box appears.2. Enter appropriate settings for Printer, Range, Copies,etc.ClickOK. The report
is printed.
ExplanationSet the printer according to the environment of the system that you are using.
Printing ReportsYou can print a report when the measured data has been retrieved (or loaded).You can print a report for each input element (see section 10.3).
10-7IM 761922-06E
Using the Print Page to Print R
eports
3
2
1
4
5
6
7
8
9
10
11
12
13
14
Index

Print example of a report
10.4 Printing
10-8 IM 761922-06E

11.1 Saving Setting Information and Measured Data
Procedure
1. Select the icon in the menu area. The Save submenu appears.
Save Method (page 11-2)Select the type of data to save and the file format to save it to.
Save Information (page 11-2)Set the location and file name to save to.
Execute save operation (page 11-2).
Chapter 11 Using the Save Page to Save Setting Information and Measured Data
11-1IM 761922-06E
Using the Save Page to Save Setting Inform
ation and Measured D
ata
3
2
1
4
5
6
7
8
9
10
11
12
13
14
Index
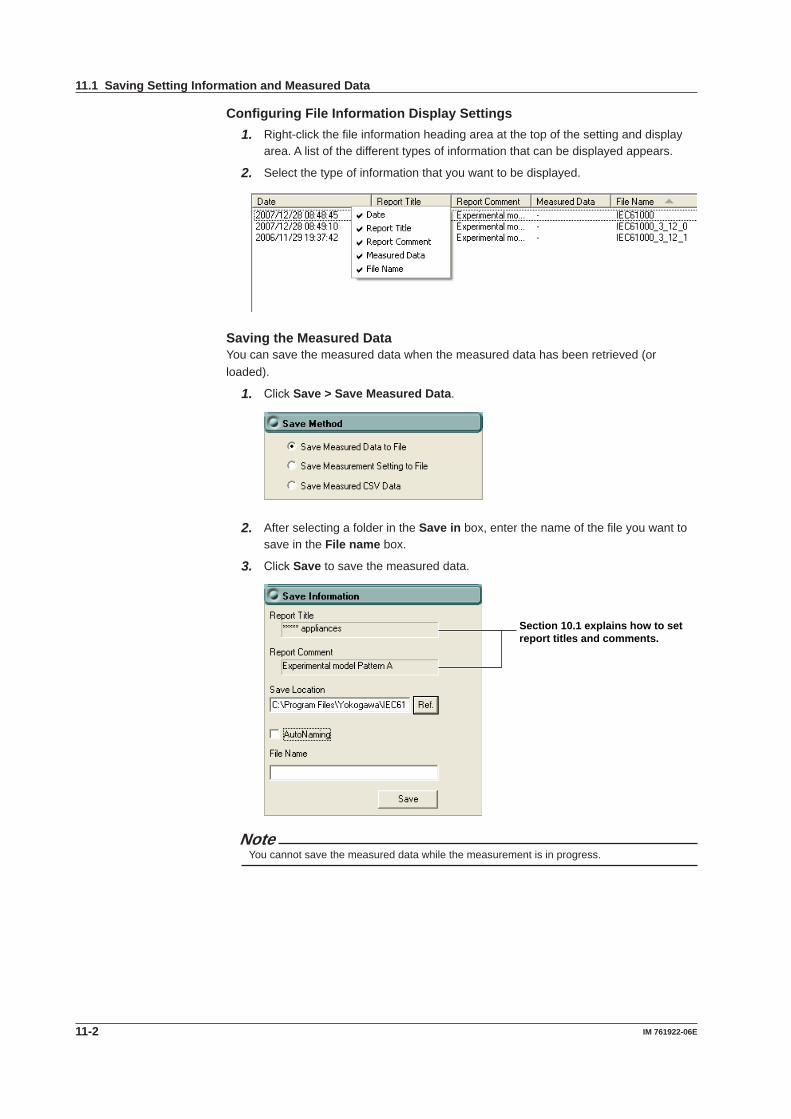
Configuring File Information Display Settings1. Right-click the file information heading area at the top of the setting and display
area. A list of the different types of information that can be displayed appears.
2. Select the type of information that you want to be displayed.
Saving the Measured DataYou can save the measured data when the measured data has been retrieved (or loaded).
1. ClickSave > Save Measured Data.
2. After selecting a folder in the Save in box, enter the name of the file you want to save in the File name box.
3. ClickSave to save the measured data.
Section 10.1 explains how to set report titles and comments.
NoteYou cannot save the measured data while the measurement is in progress.
11.1 Saving Setting Information and Measured Data
11-2 IM 761922-06E
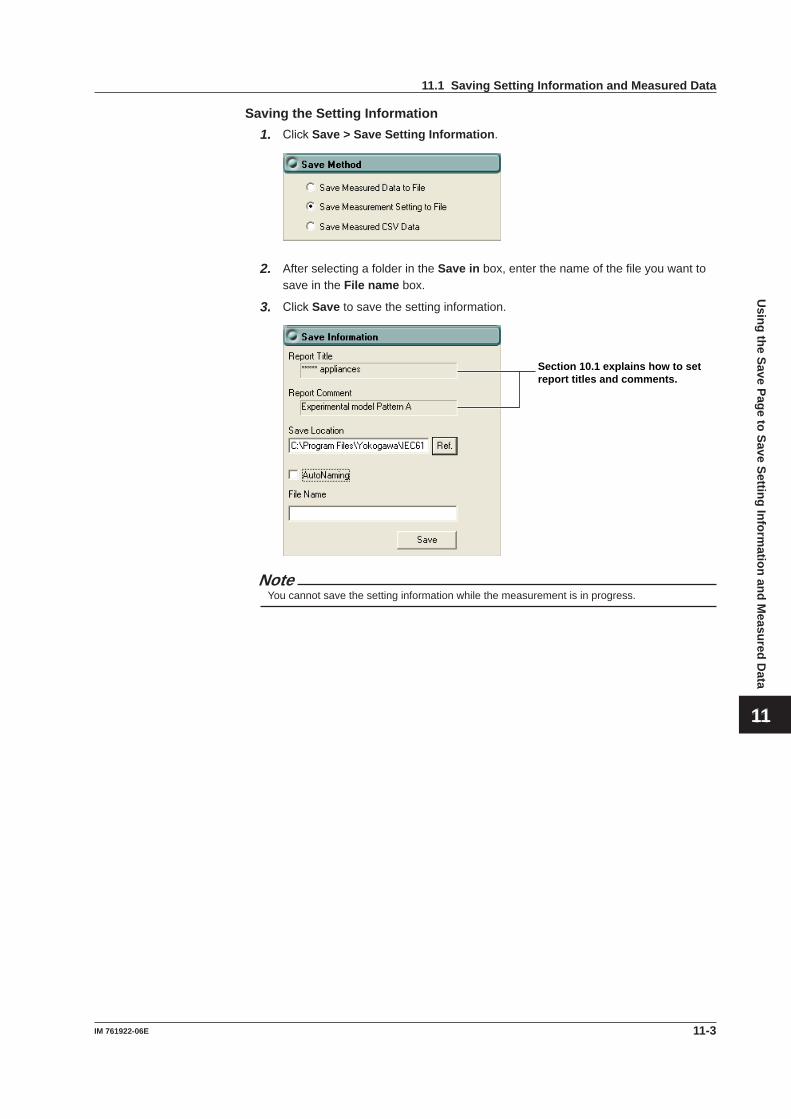
Saving the Setting Information1. ClickSave > Save Setting Information.
2. After selecting a folder in the Save in box, enter the name of the file you want to save in the File name box.
3. ClickSave to save the setting information.
Section 10.1 explains how to set report titles and comments.
NoteYou cannot save the setting information while the measurement is in progress.
11.1 Saving Setting Information and Measured Data
11-3IM 761922-06E
Using the Save Page to Save Setting Inform
ation and Measured D
ata
3
2
1
4
5
6
7
8
9
10
11
12
13
14
Index
ExplanationKinds of File Information• Date:Whenthefilewassaved.Displayedinthisformat:year/month/dayhour:minute:
second• ReportTitle(Seesection10.1)• ReportComment(Seesection10.1)• MeasuredData:Whenmeasureddataisincludedinafile,anasteriskappears.
- : Setting information file* : Files that only contain the measured data of compliance tests (do not contain
the measured data of simple tests)** : Files that contain both the measured data of compliance tests and the measured
data of simple tests• Clickortoswitchbetweensortinginascendinganddescendingorder.
Saving Measured DataYou can use this software to save the harmonic measurement data and waveform data thatthePChasacquiredfromtheWTtoafile.Whenthesoftwaresavesthisdata,itwillalso save the WT harmonic measurement conditions along with the setting information described below.The following two types of measured data files are available.• Filesthatonlycontainthemeasureddataofcompliancetests(donotcontainthe
measured data of simple tests)• AnasteriskappearsintheMeasureddatacolumnforfilesthatcontainmeasured
data.• Twofileswillbesavedwiththefollowingextensions.
• .fdt Measureddata(compliancetestdata)• .ini Settinginformation
• Filesthatcontainboththemeasureddataofcompliancetestsandthemeasureddataof simple tests• ThesefilesaresavedwhenyouselectSimpleTestMeasurementinthetest
schedule menu described in section 4.1, execute a simple compliance test, and save the measured data of the test.
• Two asterisks appear in the Measured Data column of the file information display area.• Twofileswillbesavedwiththefollowingextensions.
• .fdt Measureddata(Thefollowingtwotypesofdataareincluded.)• Simpletestdata• Compliancetestdatathathasbeenspecifiedasthetestreferenceforthe
simple test• .ini Settinginformation
File Name/Extension YoucanselectanyfilenamethatthePCwillrecognize.
Saving Setting InformationWhen in online mode, the software can save the following setting information to a file.• Measurementandjudgementconditions(seechapter7)• Alldisplaysettings(seechapters8and9)• Reporttitlesandcomments(seesection10.1)
File Name/Extension• YoucanselectanyfilenamethatthePCwillrecognize.• Extension:.ini
11.1 Saving Setting Information and Measured Data
11-4 IM 761922-06E
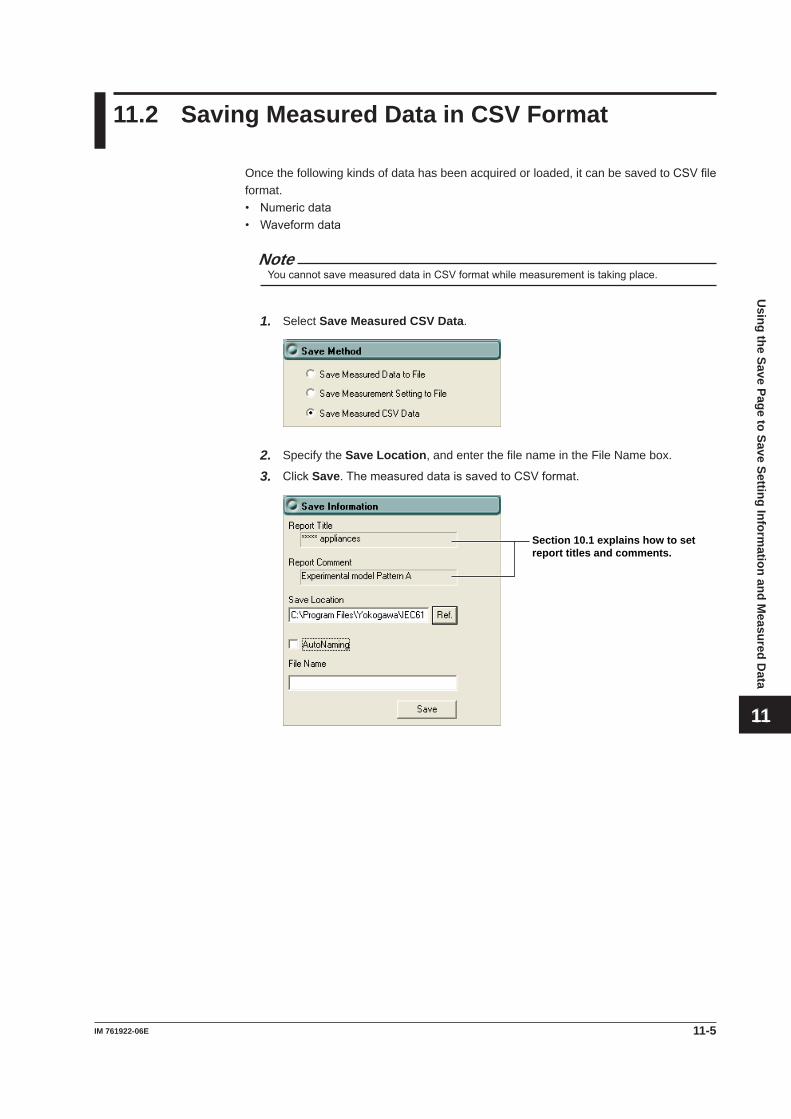
11.2 Saving Measured Data in CSV Format
Once the following kinds of data has been acquired or loaded, it can be saved to CSVfileformat.• Numericdata• Waveformdata
NoteYoucannotsavemeasureddatainCSVformatwhilemeasurementistakingplace.
1. Select Save Measured CSV Data.
2. Specify the Save Location, and enter the file name in the File Name box.
3. ClickSave.ThemeasureddataissavedtoCSVformat.
Section 10.1 explains how to set report titles and comments.
11-5IM 761922-06E
Using the Save Page to Save Setting Inform
ation and Measured D
ata
3
2
1
4
5
6
7
8
9
10
11
12
13
14
Index

ExplanationYoucansavedatatoCSVfileformatafterithasbeenacquiredorloaded.WhenyousavethedatainCSVformat,youcanviewitusingaPCspreadsheetprogram(suchasMicrosoftExcel).
NoteThissoftwarecannotloadCSVfiles.
File Name/ExtensionYoucanselectanyfilenamethatthePCwillrecognize.Extension: .csv
IfAutoNamingisnotusedwhensavingtoaCSVfile,thefileissavedwiththefollowingname.”Textwritteninthefilenamebox”+”_CSV”.csv
Data TypesThe following data is saved for each measured input element:
Voltage valuesCurrentvaluesActive powerΦ(phaseangle)Apparent powerCircuitpowerfactorFreqPLLNone (Blank column)Uthd : Voltage THDUthdGUthdSIthd :CurrentTHDIthdGIthdSDistortion factor (P THD)PhiFreqUThcPohcPhiU1_U2PhiU1_U3Voltage waveform data (2200 points)Currentwaveformdata(2200points)
WhenyousavethemeasureddataofasimplecompliancetestinCSVformat,thedatais saved in the following order.• Measureddataofthesimplecompliancetest• Measureddataofthecompliancetestthathasbeenspecifiedasthetestreferencefor
the simple test
Data SizeUnder the following circumstances, the software will produce an approximately 9-MB file withabout18000lines.• Compliancetest• Wiringpatternsetto3P4W400V,andthemeasuredinputelementssetto1to3• Measurementtimesetto2min30s
11.2 Saving Measured Data in CSV Format
11-6 IM 761922-06E
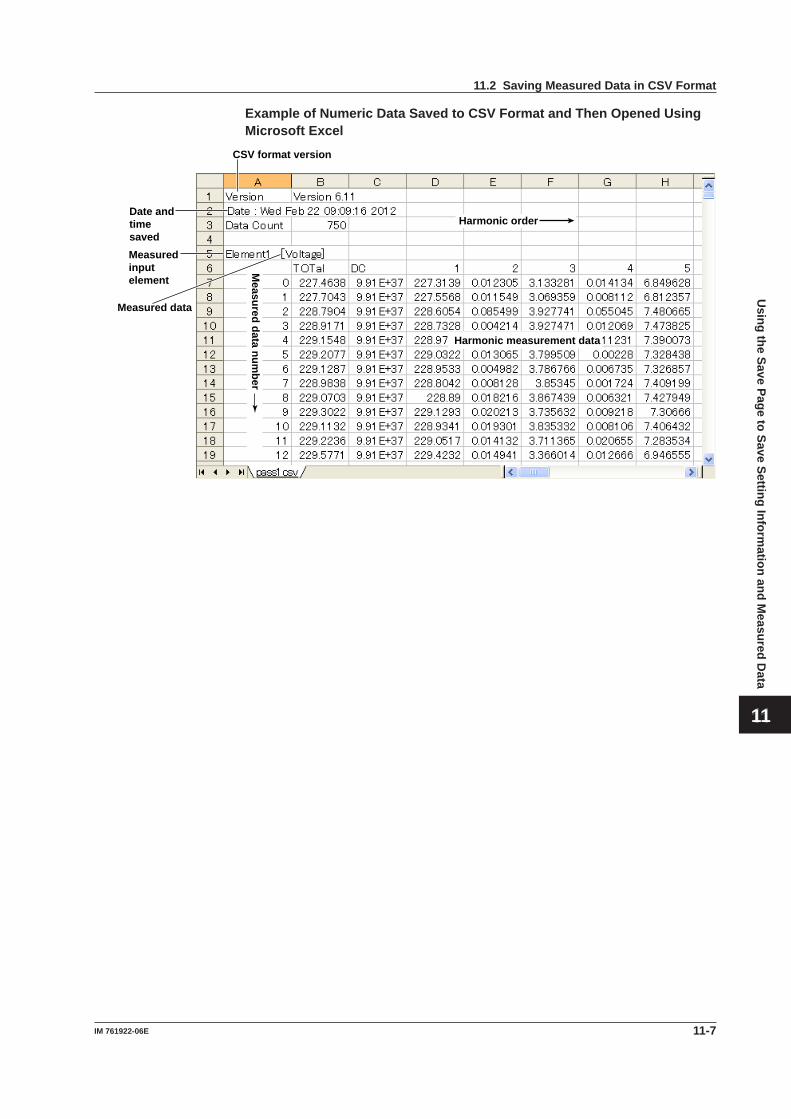
Example of Numeric Data Saved to CSV Format and Then Opened Using Microsoft Excel
Date andtimesaved
Measured data
Measuredinputelement
Harmonic order
Harmonic measurement data
Measured data num
ber
CSV format version
11.2 Saving Measured Data in CSV Format
11-7IM 761922-06E
Using the Save Page to Save Setting Inform
ation and Measured D
ata
3
2
1
4
5
6
7
8
9
10
11
12
13
14
Index
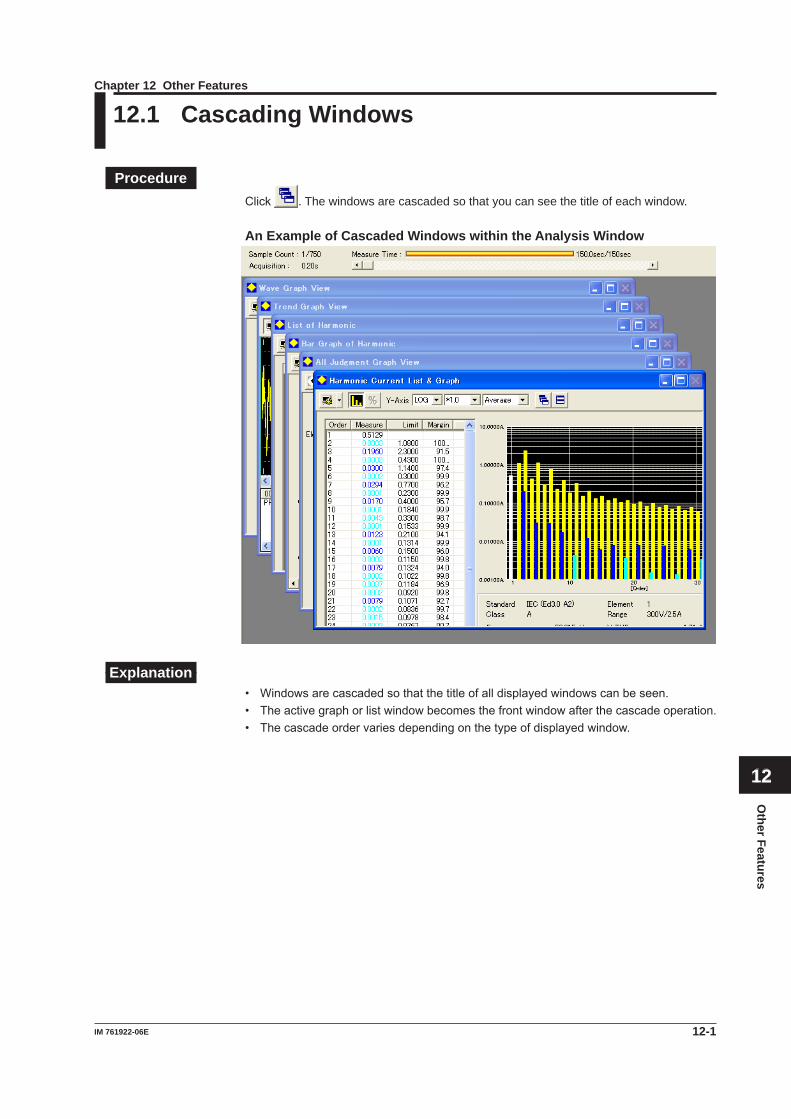
12-1IM 761922-06E
Other Features
3
2
1
4
5
6
7
8
9
10
11
12
13
14
Index
12.1 Cascading Windows
ProcedureClick . The windows are cascaded so that you can see the title of each window.
An Example of Cascaded Windows within the Analysis Window
Explanation• Windowsarecascadedsothatthetitleofalldisplayedwindowscanbeseen.• Theactivegraphorlistwindowbecomesthefrontwindowafterthecascadeoperation.• Thecascadeordervariesdependingonthetypeofdisplayedwindow.
Chapter 12 Other Features
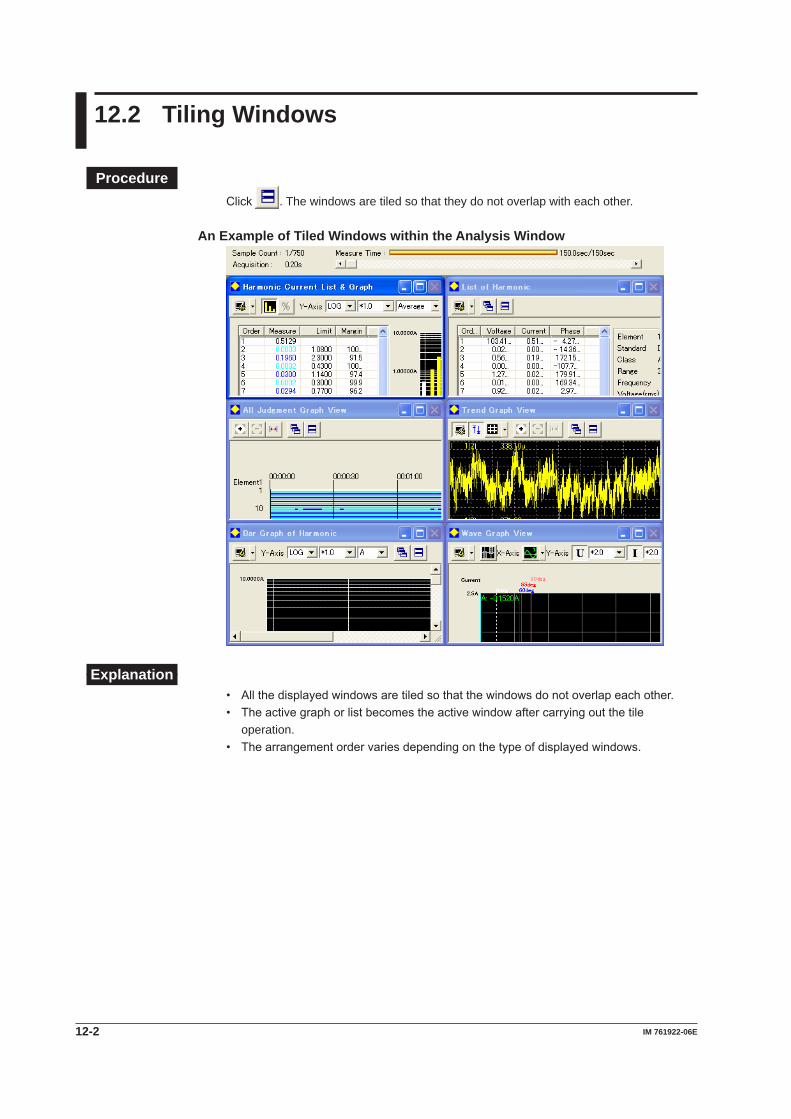
12-2 IM 761922-06E
12.2 Tiling Windows
ProcedureClick . The windows are tiled so that they do not overlap with each other.
An Example of Tiled Windows within the Analysis Window
Explanation• Allthedisplayedwindowsaretiledsothatthewindowsdonotoverlapeachother.• Theactivegraphorlistbecomestheactivewindowaftercarryingoutthetile
operation.• Thearrangementordervariesdependingonthetypeofdisplayedwindows.

12-3IM 761922-06E
Other Features
3
2
1
4
5
6
7
8
9
10
11
12
13
14
Index
12.3 Using the Help Function
ProcedureDisplaying Help
Click ,thehelpbutton.IfAdobeReaderisinstalledonthePC,itwillstartupandopen the PDF User’s Manual for this software.
Displaying Alteration NoticesIf alteration notices are available, you can view them by following the procedure below.
1. Right-click the help button.2. ClickAlterations of User’s Manual.
Shows alterations to the manual

12-4 IM 761922-06E
View the WT User’s Manual
1. Right-click the help button.2. ClickEquipment Manual.
3. Clickthemanualyouwanttoview.
ExplanationOnline HelpThe user’s manual is displayed as a help document in PDF (Portable Document Format). You can find information about operating procedures of this software and terminology. You can view PDF files using Adobe Reader, a freeware.If there is an alteration notice, you can display it by clicking Help and then clicking Alterations of User’s Manual. This will open a PDF file of the alteration notice.
Viewing the Most Recent User’s Manual or Alteration NoticeTo obtain the most recent PDF files of the user’s manual and alteration notice, go to the following Web page, and then browse to the download page. http://tmi.yokogawa.com/service-support/downloads/
Rename the downloaded user’s manual and alteration notice as indicated below, and copy (overwrite) the files in the software installation folder that you specified when you carriedoutthestepsonpage2-8.Youwillbeabletoviewthemostrecentoperatinginstructions by selecting the user’s manual or alteration notice from the Help menu.
User’s Manual File Name Alteration Notice File NameIM761922-06E.pdf Alterations-06E.pdf
Note• YoucandownloadAdobeReaderfromAdobeSystem’sWebpage.• Themostrecentuser’smanualandalterationnoticethatyoucandownloadfrom
YOKOGAWA’s Web page correspond to the most recent version of this software program. Update the software program as necessary. The program for updating the software can be downloaded from YOKOGAWA’s Web page above.
12.3 Using the Help Function

12-5IM 761922-06E
Other Features
3
2
1
4
5
6
7
8
9
10
11
12
13
14
Index
12.4 Viewing Version Information
TheIEC61000-3-2HarmonicMeasurementSoftwareversionnumberappearsintheinformation area.
Software version
Note• Thesoftwareversionisdifferentforeachoperationmodeindicatedbelow.
• IEC61000-3-2HarmonicMeasurement• IEC61000-3-3VoltageFluctuationandFlickerMeasurement• IEC61000-3-11VoltageFluctuationandFlickerMeasurement• IEC61000-3-12HarmonicMeasurement
If any function is updated, the version of the other function may not change.• Forthemostrecentversionofthesoftware,checktheYOKOGAWA’sWebpagebelow. http://tmi.yokogawa.com/products/digital-power-analyzers/ The program for updating the software as well as the most recent user’s manual and
alteration notice (see section 12.4) can be downloaded from YOKOGAWA’s Web page above.

12-6 IM 761922-06E
12.5 Setting the Displayed Language
1. Right-click the help button.2. ClickChange Language.
3. Select the language you want to use.
NoteDepending on the operating system, some language fonts may not be installed. In such cases, if you change the language, text will not be displayed properly. To display the text properly, you need to install appropriate fonts in the operating system.
Customizing the Displayed LanguageTo customize the displayed language, edit the language file by following the procedure in section8.4.If there is a language file that you create (custom file), the submenu will appear as follows:
Select Custom to load the custom file.

12-7IM 761922-06E
Other Features
3
2
1
4
5
6
7
8
9
10
11
12
13
14
Index
12.6 Editing the Displayed Language
You can edit the text that is displayed in the dialog boxes and windows of the software.
Editing the Displayed Language
1. Right-click the help button.2. ClickLanguage Editor.
Edit the displayed language
3. IntheLanguageEditordialogbox,clickthecellsintheCurrentcolumntoeditthetext to display.
Click
Edit the character string to display.
You can search for a character string by entering the string here and clicking Search.
Saving the Edited Language InformationClickSave As to save the edited language information to a file. The file name extension is .lang.
NoteThe English and Japanese language information files are in the following folder.• Windows32-bitversion C:\ProgramFiles\YOKOGAWA\IEC61000AnalysisSoftware\Language• Windows64-bitversion C:\ProgramFiles(x86)\YOKOGAWA\IEC61000AnalysisSoftware\Language
Loading Saved Language InformationClickLoad to load a language information file into the Language Editor dialog box.

13.1 Troubleshooting
IfamessageisdisplayedonthePCdisplay,seesection13.2,“ErrorMessages.”Ifservicing is necessary or if the software is not operating correctly after performing the corrective actions, contact your nearest YOKOGAWA dealer.
Problems and SolutionsIf you cannot connect to the WT3000 or WT3000E via GP-IB:
A GP-IB connection made to the WT may not work properly if the GP-IB card that is used is not made by NI (National Instruments). We recommend that you use a National Instruments GP-IB card (see section 1.2).
Measurement stops suddenly.Closethememory-residentsoftwarerunningonthePC.Forexample,ifviruscheckingsoftwarefrequentlychecksthecommunicationsbetweenthissoftwareandthePC,theperformanceofthePCmaydeclinedrastically.IfyouchoosetostoptheviruscheckandusethePC,pleasedosoinanetworkenvironmentthat is well protected against viruses.
13-1IM 761922-06E
Troubleshooting
Chapter 13 Troubleshooting
3
2
1
4
5
6
7
8
9
10
11
12
13
14
Index

13.2 Error Messages
Message Corrective ActionMeasured data will be initialized. Do you want to execute? Select OK to initialize the measured data. Otherwise, select
Cancel.Data was lost. Please check your settings and try again. Thecommunicationmaybedisconnected.Checkthecable,noise,
etc.Connectionerror. Checkthefollowingitems.Please check your settings and try again. •TheWTisturnedON.
•TheGP-IBorEthernetcableisconnectedproperly.•ForGP-IB,checkthatauniqueGP-IBaddressisassignedwithinthesystem.CheckthattheGP-IBaddressspecifiedontheWTmatchestheaddressspecifiedonthesoftware.CheckthattheGP-IBcommunicationdriverisinstalledcorrectlyinthePC.
•ForEthernet,checkthattheIPaddress,username,andpassword specified on the WT match those specified on the software.
Peak over. Please check your settings and try again. Checkthatthevoltageorcurrentrangeisappropriate.Frequency error. Please check your settings and try again. Checkthefrequencyandvoltagerange.Unrecognized error. Please check your settings and try again.
Anunexpectederroroccurred.ContactyournearestYOKOGAWA dealer.
All the data will be discarded. Select OK to discard the current data.Do you want to continue? Otherwise,selectCancel.Write failed. Checkthedestinationmedium.
•Checkthatthestoragemediumispresent.•Checkthatthereisenoughfreespaceonthestoragemedium.•Checkthatthestoragemediumisformatted.•Checkthatthestoragemediumisnotwrite-protected.
Please input a value from 0.0001 to 99999.9999. The value you tried to specify is out of range.Please input a value from 0.01 to 999.99. Set the value within the allowed range.Please input a value from 1.00 to 99.99.Please input a value from 0.10 to 99.99.Please input value from 0:30 to 15:00.Please input a value from 1 to 99999.Please input a value from 1 to 99.Please input a value from 0.10 to 9.99.
13-2 IM 761922-06E

Specifications
Item SpecificationSoftware* Harmonicmeasurement/judgmentsoftwarethatcanmeasureharmoniccurrentsandjudgethe
resultsofthosemeasurementsbasedonIECorJISstandards.Displaysandprintsmeasurementsandjudgments.Thesoftware’sexecutablefilenameisIEC61000.exe.
Compatiblemeasurementdevices*
WT3000 (Models 760301, 760302, 760303, and 760304)WT3000E (models WT3001E, WT3002E, WT3003E and WT3004E)
Applicable standards* IEC61000-3-2Edition3.0:2005 and A2 of the Edition 3.0:2009,IEC61000-3-2Edition4.0:2014• EN 61000-3-2:2006/A2:2009, EN 61000-3-2:2014• IEC61000-4-7Edition1.0:1991,Edition2.0:2002,A1 of the Edition2.0:2008• JISC61000-3-2:2011,abbreviatedasJIS• JISC61000-4-7:2007
Features Acquisitionandloadingofmeasureddataandwaveformdatatobejudged.• ConfigurationofWTmeasurementconditions• Online acquisition of measured data and waveform data from the WT (online mode)• Loading of previously saved measured data and waveform data (offline mode)Measurement modes*• Compliancetest,Simpletest
• In online modeMeasurestheharmonicsofthedataacquiredfromtheWT,andjudgesthoseharmonicsbasedonIECorJIS.
• In offline modeJudgesthemeasureddataloadedfromafileaccordingtoIECorJIS.
• Test previewOnly available in online mode. As the WT measures the harmonic appear on a list or bar graph of measured values and waveform.
Standard and measurement settingsSetstheclassificationoftheequipmentundertest(EUT)asdefinedinIECorJISandevaluationconditions within each class.
Measurement timeThe time from the start to the end of measurement.Measurement time can be set in one-second intervals within the range of 0 h 0 min 1 s to 24 h 0 min 0 s.
Report titles/commentsReport titles and comments can be entered. Report formats: color/black and white; English/Japanese. Reports are printed and saved to .bmp or .pdf files along with measured data.
Measure start/stopMeasurement can be started in online mode.
Displayofjudgmentresults,measureddata,andwaveformdataWhenacompliancetestisperformed,thesoftwarewilldisplayjudgmentsastowhetherornotthedatacomplieswithIECorJIS,alongwiththemeasureddataandwaveformdatathatwasjudged.• Displayofalljudgmentresultswithinthemeasurementtime
Determines whether or not all of the data within the measurement time is within the set limits, and displays the result.
• Harmonic current list and graph display Displays the measured harmonic values and the limits for each order set by the standard for
those values in both a list and a bar graph.• Bar graph display of harmonic voltage, current, and phase angle Displays the measured data for each harmonic in a color-coded bar graph.• List display of harmonic voltage, current, and phase angle values Displays the measured data for each harmonic in a color-coded list.• Trend graph display
Displays a graph that shows data fluctuations over time. • Waveform display of voltage and current
Displays a waveform of data measured immediately after the measurement time (displays approximately two waveform periods).
Chapter 14 Specifications
14-1IM 761922-06E
Specifications
3
2
1
4
5
6
7
8
9
10
11
12
13
14
Index
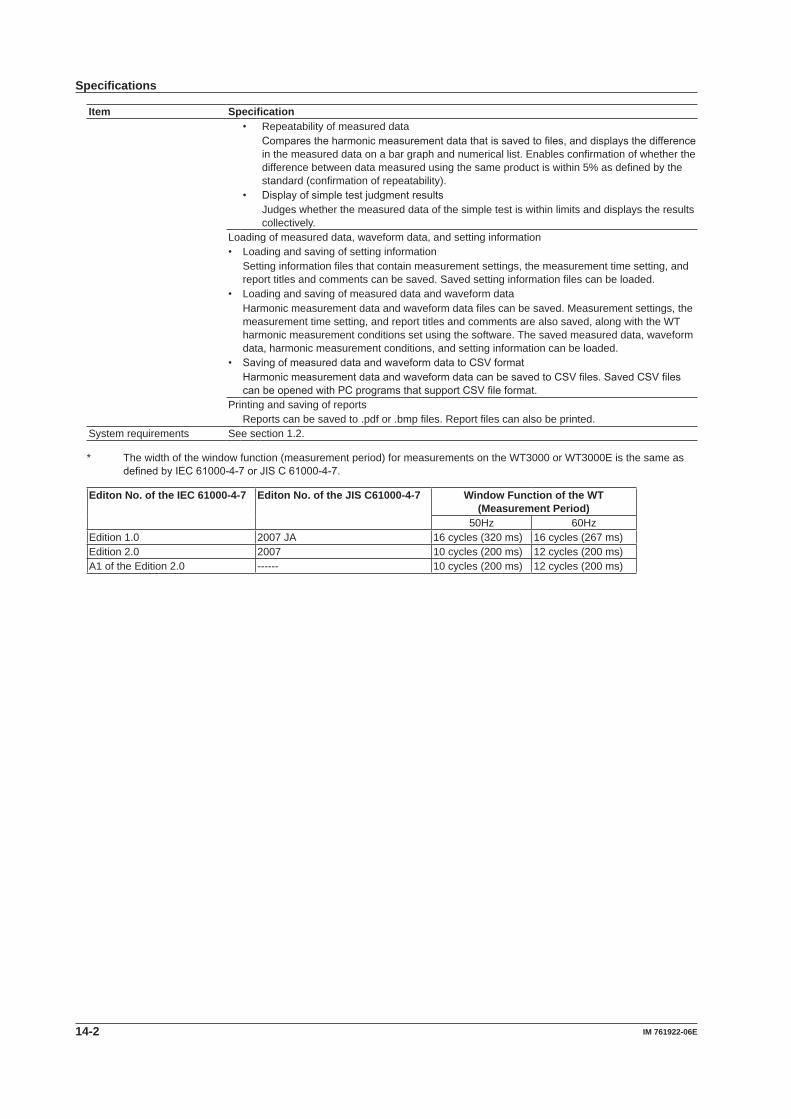
Item Specification• Repeatability of measured data
Comparestheharmonicmeasurementdatathatissavedtofiles,anddisplaysthedifferencein the measured data on a bar graph and numerical list. Enables confirmation of whether the difference between data measured using the same product is within 5% as defined by the standard (confirmation of repeatability).
• Displayofsimpletestjudgmentresults Judges whether the measured data of the simple test is within limits and displays the results
collectively.Loading of measured data, waveform data, and setting information• Loading and saving of setting information
Setting information files that contain measurement settings, the measurement time setting, and report titles and comments can be saved. Saved setting information files can be loaded.
• Loading and saving of measured data and waveform dataHarmonic measurement data and waveform data files can be saved. Measurement settings, the measurement time setting, and report titles and comments are also saved, along with the WT harmonic measurement conditions set using the software. The saved measured data, waveform data, harmonic measurement conditions, and setting information can be loaded.
• SavingofmeasureddataandwaveformdatatoCSVformatHarmonicmeasurementdataandwaveformdatacanbesavedtoCSVfiles.SavedCSVfilescanbeopenedwithPCprogramsthatsupportCSVfileformat.
Printing and saving of reportsReports can be saved to .pdf or .bmp files. Report files can also be printed.
System requirements See section 1.2.
* The width of the window function (measurement period) for measurements on the WT3000 or WT3000E is the same as definedbyIEC61000-4-7orJISC61000-4-7.
Editon No. of the IEC 61000-4-7 Editon No. of the JIS C61000-4-7 Window Function of the WT (Measurement Period)
50Hz 60HzEdition 1.0 2007 JA 16 cycles (320 ms) 16 cycles (267 ms)Edition 2.0 2007 10 cycles (200 ms) 12 cycles (200 ms)A1 of the Edition 2.0 ------ 10 cycles (200 ms) 12 cycles (200 ms)
Specifications
14-2 IM 761922-06E

Compatibility between the WT3000 or WT3000E Precision Power Analyzer and IECIntheEN61000-3-2:2006/A2:2009(IEC61000-3-2Edition3.0:2005/A2:2009)standardor EN61000-3-2:2014 the requirements for measurement instruments are specified in EN 61000-4-7(IEC61000-4-7).
The WT3000 or WT3000E complies with the items related to EN 61000-3-2:2006/A2:2009(IEC61000-3-2Edition3.0:2005/A2:2009)orEN61000-3-2:2014ofEN61000-4-7 shown below in the range indicated in the table on the next page.• EN61000-4-7:1993(IEC61000-4-7Edition1.0:1991)• EN61000-4-7:2002(IEC61000-4-7Edition2.0:2002)• EN61000-4-7:2002andA1:2009(IEC61000-4-7Edition2.0:2002andA1:2008)
Compatibility between the WT3000 or WT3000E Precision Power Analyzer and JISIntheJISC61000-3-2:2011standard,therequirementsformeasurementinstrumentsarespecifiedinJISC61000-4-7.
TheWT3000orWT3000EcomplieswiththeitemsrelatedtoJISC61000-3-2:2011(IEC61000-3-2Edition3.0:2005/A2:2009)ofEN61000-4-7shownbelowintherangeindicated in the table on the next page.• JISC61000-4-7:2007JA(appendixJA)• JISC61000-4-7:2007
Specifications
14-3IM 761922-06E
Specifications
3
2
1
4
5
6
7
8
9
10
11
12
13
14
Index
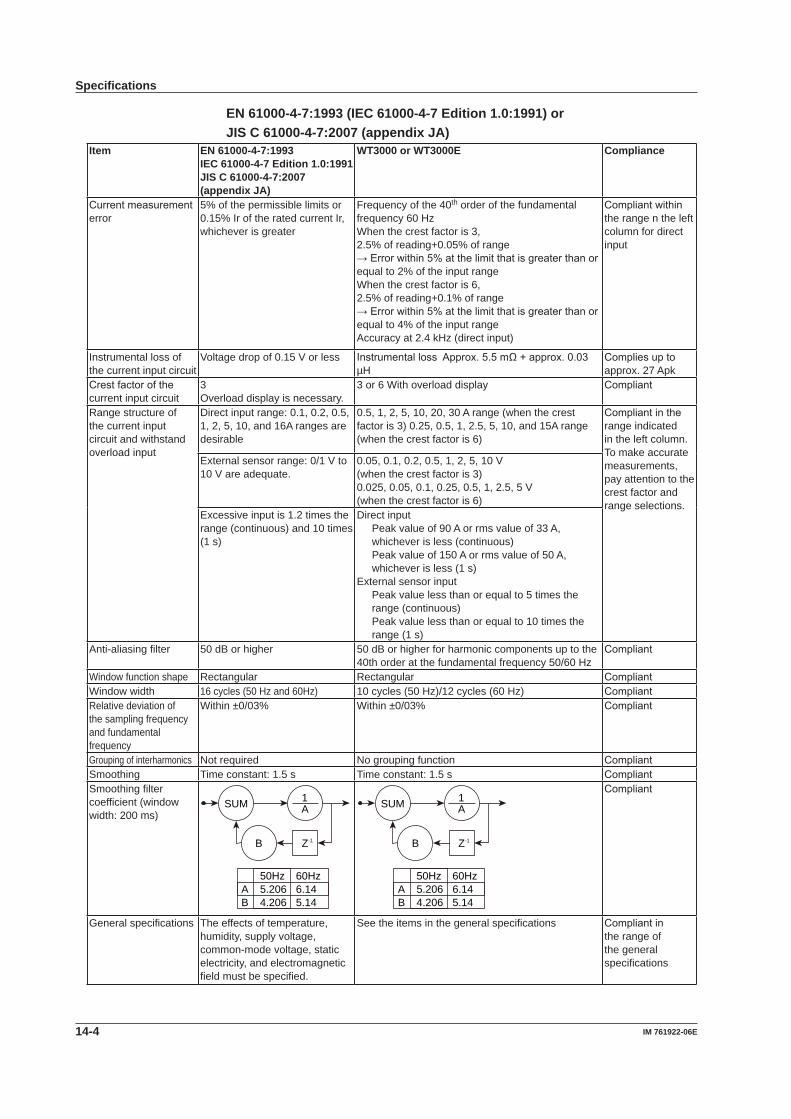
EN 61000-4-7:1993 (IEC 61000-4-7 Edition 1.0:1991) orJIS C 61000-4-7:2007 (appendix JA)
Item EN 61000-4-7:1993IEC 61000-4-7 Edition 1.0:1991JIS C 61000-4-7:2007 (appendix JA)
WT3000 or WT3000E Compliance
Currentmeasurementerror
5% of the permissible limits or 0.15% Ir of the rated current Ir, whichever is greater
Frequency of the 40th order of the fundamental frequency 60 HzWhen the crest factor is 3, 2.5% of reading+0.05% of range→Errorwithin5%atthelimitthatisgreaterthanorequal to 2% of the input rangeWhen the crest factor is 6,2.5% of reading+0.1% of range→Errorwithin5%atthelimitthatisgreaterthanorequal to 4% of the input rangeAccuracy at 2.4 kHz (direct input)
Compliantwithinthe range n the left column for direct input
Instrumental loss of the current input circuit
Voltage drop of 0.15 V or less InstrumentallossApprox.5.5mΩ+approx.0.03µH
Compliesuptoapprox. 27 Apk
Crestfactorofthecurrent input circuit
3Overload display is necessary.
3 or 6 With overload display Compliant
Range structure of the current input circuit and withstand overload input
Direct input range: 0.1, 0.2, 0.5, 1, 2, 5, 10, and 16A ranges are desirable
0.5, 1, 2, 5, 10, 20, 30 A range (when the crest factor is 3) 0.25, 0.5, 1, 2.5, 5, 10, and 15A range (when the crest factor is 6)
Compliantintherange indicated in the left column. To make accurate measurements, pay attention to the crest factor and range selections.
External sensor range: 0/1 V to 10 V are adequate.
0.05, 0.1, 0.2, 0.5, 1, 2, 5, 10 V(when the crest factor is 3)0.025, 0.05, 0.1, 0.25, 0.5, 1, 2.5, 5 V(when the crest factor is 6)
Excessive input is 1.2 times the range (continuous) and 10 times (1 s)
Direct input Peak value of 90 A or rms value of 33 A,
whichever is less (continuous) Peak value of 150 A or rms value of 50 A,
whichever is less (1 s)External sensor input Peak value less than or equal to 5 times the
range (continuous) Peak value less than or equal to 10 times the
range (1 s)Anti-aliasing filter 50 dB or higher 50 dB or higher for harmonic components up to the
40th order at the fundamental frequency 50/60 HzCompliant
Window function shape Rectangular Rectangular CompliantWindow width 16 cycles (50 Hz and 60Hz) 10 cycles (50 Hz)/12 cycles (60 Hz) CompliantRelative deviation of the sampling frequency and fundamental frequency
Within ±0/03% Within ±0/03% Compliant
Grouping of interharmonics Not required No grouping function CompliantSmoothing Time constant: 1.5 s Time constant: 1.5 s CompliantSmoothing filter coefficient (window width: 200 ms)
SUM A
Z-1B
1
A 6.145.206B 5.144.206
60Hz50Hz
SUM A
Z-1B
1
A 6.145.206B 5.144.206
60Hz50Hz
Compliant
General specifications The effects of temperature, humidity, supply voltage, common-mode voltage, static electricity, and electromagnetic field must be specified.
See the items in the general specifications Compliantinthe range of the general specifications
Specifications
14-4 IM 761922-06E

EN 61000-4-7:2002 (IEC 61000-4-7 Edition 2.0:2002) orJIS C 61000-4-7:2007
Item EN 61000-4-7:2002IEC 61000-4-7 Edition 2.0:2002JIS C 61000-4-7:2007
WT3000 or WT3000E Compliance
Currentmeasurementerror
5% of the permissible limits or 0.15% Ir of the rated current Ir, whichever is greater
Frequency of the 40th order of the fundamental frequency 60 HzWhen the crest factor is 3, 2.5% of reading+0.05% of range→Errorwithin5%atthelimitthatisgreaterthanorequal to 2% of the input rangeWhen the crest factor is 6,2.5% of reading+0.1% of range→Errorwithin5%atthelimitthatisgreaterthanorequal to 4% of the input rangeAccuracy at 2.4 kHz (direct input)
Compliantwithinthe range n the left column for direct input
Instrumental loss of the current input circuit
Voltage drop of 0.15 Vrms or less
InstrumentallossApprox.5.5mΩ+approx.0.03µH
Compliesuptoapprox. 27 Arms
Crestfactorofthecurrent input circuit
5 Arms range or less: 410 Arms range or less: 3.5Range above 10 Arms: 2.5Overload display is necessary.
3 or 6 With overload display Compliant
Range structure of the current input circuit and withstand overload input
Direct input range: 0.1, 0.2, 0.5, 1, 2, 5, 10, 20, 50, and 100A ranges are desirable
0.5, 1, 2, 5, 10, 20, 30 A range (when the crest factor is 3) 0.25, 0.5, 1, 2.5, 5, 10, and 15A range (when the crest factor is 6)
Compliantintherange indicated in the left column. To make accurate measurements, pay attention to the crest factor and range selections.
External sensor range: 0/1 V to 10 V are adequate.
0.05, 0.1, 0.2, 0.5, 1, 2, 5, 10 V(when the crest factor is 3)0.025, 0.05, 0.1, 0.25, 0.5, 1, 2.5, 5 V(when the crest factor is 6)
Excessive input is 1.2 times the range (continuous) and 10 times (1 s)
Direct input Peak value of 90 A or rms value of 33 A,
whichever is less (continuous) Peak value of 150 A or rms value of 50 A,
whichever is less (1 s)External sensor input Peak value less than or equal to 5 times the
range (continuous) Peak value less than or equal to 10 times the
range (1 s)Anti-aliasing filter 50 dB or higher 50 dB or higher for harmonic components up to the
40th order at the fundamental frequency 50/60 HzCompliant
Window function shape Rectangular Rectangular CompliantWindow width 10 cycles (50 Hz)/12 cycles (60 Hz) 10 cycles (50 Hz)/12 cycles (60 Hz) CompliantRelative deviation of the sampling frequency and fundamental frequency
Within ±0/03% Within ±0/03% Compliant
Grouping of interharmonics Required Grouping function available CompliantSmoothing Time constant: 1.5 s Time constant: 1.5 s CompliantSmoothing filter coefficient (window width: 200 ms)
SUM 8.012
Z-17.012
1 SUM 8.012
Z-17.012
1Compliant
General specifications The effects of temperature, humidity, supply voltage, common-mode voltage, static electricity, and electromagnetic field must be specified.
See the items in the general specifications Compliantinthe range of the general specifications
Specifications
14-5IM 761922-06E
Specifications
3
2
1
4
5
6
7
8
9
10
11
12
13
14
Index

EN 61000-4-7:2002 and A1:2009 (IEC 61000-4-7 Edition 2.0:2002 and A1:2008)
Item EN 61000-4-7:2002 +A1:2009IEC 6100-4-7 Editon 2.0:2002 + A1:2008
WT3000 or WT3000E Compliance
Currentmeasurementerror
5% of the permissible limits or 0.15% Ir of the rated current Ir, whichever is greater
Frequency of the 40th order of the fundamental frequency 60 HzWhen the crest factor is 3, 2.5% of reading+0.05% of range→Errorwithin5%atthelimitthatisgreaterthanorequal to 2% of the input rangeWhen the crest factor is 6,2.5% of reading+0.1% of range→Errorwithin5%atthelimitthatisgreaterthanorequal to 4% of the input rangeAccuracy at 2.4 kHz (direct input)
Compliantwithinthe range n the left column for direct input
Instrumental loss of the current input circuit
Voltage drop of 0.15 Vrms or less
InstrumentallossApprox.5.5mΩ+approx.0.03µH
Compliesuptoapprox. 27 Arms
Crestfactorofthecurrent input circuit
5 Arms range or less: 410 Arms range or less: 3.5Range above 10 Arms: 2.5Overload display is necessary.
3 or 6 With overload display Compliant
Range structure of the current input circuit and withstand overload input
Direct input range: 0.1, 0.2, 0.5, 1, 2, 5, 10, 20, 50, and 100A ranges are desirable
0.5, 1, 2, 5, 10, 20, 30 A range (when the crest factor is 3) 0.25, 0.5, 1, 2.5, 5, 10, and 15A range (when the crest factor is 6)
Compliantintherange indicated in the left column. To make accurate measurements, pay attention to the crest factor and range selections.
External sensor range: 0/1 V to 10 V are adequate.
0.05, 0.1, 0.2, 0.5, 1, 2, 5, 10 V(when the crest factor is 3)0.025, 0.05, 0.1, 0.25, 0.5, 1, 2.5, 5 V(when the crest factor is 6)
Excessive input is 1.2 times the range (continuous) and 10 times (1 s)
Direct input Peak value of 90 A or rms value of 33 A,
whichever is less (continuous) Peak value of 150 A or rms value of 50 A,
whichever is less (1 s)External sensor input Peak value less than or equal to 5 times the
range (continuous) Peak value less than or equal to 10 times the
range (1 s)Anti-aliasing filter 50 dB or higher 50 dB or higher for harmonic components up to the
40th order at the fundamental frequency 50/60 HzCompliant
Window function shape
Rectangular Rectangular Compliant
Window width 10 cycles (50 Hz)/12 cycles (60 Hz) 10 cycles (50 Hz)/12 cycles (60 Hz) CompliantRelative deviation of the sampling frequency and fundamental frequency
Within ±0/03% Within ±0/03% Compliant
Grouping of interharmonics
RequiredApplies to the second and higher harmonics.
Grouping function availableApplies to the second and higher harmonics.
Compliant
Smoothing Time constant: 1.5 s Time constant: 1.5 s CompliantSmoothing filter coefficient (window width: 200 ms)
SUM 8.012
Z-17.012
1 SUM 8.012
Z-17.012
1Compliant
General specifications The effects of temperature, humidity, supply voltage, common-mode voltage, static electricity, and electromagnetic field must be specified.
See the items in the general specifications Compliantinthe range of the general specifications
Specifications
14-6 IM 761922-06E

Index-1IM 761922-06E
3
2
1
4
5
6
7
8
9
10
11
12
13
14
Index
Index
I Page
icon ....................................................................................... 3-4IEC61000-3-12 .................................................................... 1-9IEC61000-4-7 ...................................................................... 1-3information area.................................................................... 3-3information bar...................................................................... 3-3installation............................................................................. 2-7instantaneous values .......................................................... 9-12
J Page
JISC61000-4-7 ................................................................... 1-3judgmentconditions............................................................ 7-13
L Page
limits ..................................................................................... 1-9Lower .................................................................................. 9-20
M Page
magnification ...................................................................... 9-10margin.................................................................................. 9-11maximum value .................................................................. 9-12measured data, loading ........................................................ 5-1measureddata,savingtoCSVformat................................. 11-5measurement conditions ...................................................... 7-7measurement time ......................................................... 1-2, 7-4menu area ............................................................................ 3-3
N Page
new connection..................................................................... 6-1
O Page
offline mode .......................................................................... 1-7offline, switching to ............................................................... 6-7online .................................................................................... 6-3online mode .......................................................................... 1-7operation, flow chart ........................................................... 1-15Order .................................................................................. 9-20
P Page
password .............................................................................. 6-3PLL source ................................................................ 1-17, 9-24printer setup........................................................................ 10-6printing ................................................................................ 10-1print language ..................................................................... 10-4print mode........................................................................... 10-4print preview ....................................................................... 10-2
R Page
range, copying ...................................................................... 7-8report .................................................................................. 10-1report, printing .................................................................... 10-7
A Page
address ................................................................................. 6-3alljudgments,graphof ......................................................... 9-1antialiasing filter .................................................................... 7-8applicable measurement instruments ................................... 1-1applicable standard .............................................................. 1-1auto range .......................................................................... 9-18average value ..................................................................... 9-12averaging .............................................................................. 7-8
C Page
cascading ........................................................................... 12-1Color ................................................................................... 9-20comments ........................................................................... 10-1communication address........................................................ 6-2compliance test..................................................................... 1-3connection ............................................................................ 6-1connection conditions ........................................................... 6-2connection device ................................................................. 6-2connection status.................................................................. 3-3CSVfile,savingto ............................................................... 11-5CSVformat .......................................................................... 11-5CurrentPeak(–) ................................................................. 9-24CurrentPeak(+) ................................................................. 9-24cursor......................................................................... 9-21, 9-24
D Page
distorted wave .................................................................... 1-17
E Page
Element .............................................................................. 9-19error messages................................................................... 13-2Ethernet control ............................................................. 2-2, 2-5evaluation colors................................................................... 9-3
F Page
file information ...................................................................... 5-3Frequency........................................................................... 9-24frequency filter, copying ........................................................ 7-8Function .............................................................................. 9-19functions, explanation of ....................................................... 1-1fundamental frequency ....................................................... 1-17fundamental wave .............................................................. 1-17
G Page
GP-IB control ................................................................. 2-1, 2-3graph .................................................................................... 9-8grid...................................................................................... 9-18
H Page
harmonic bar graph ............................................................ 9-15harmonic component .......................................................... 1-17harmonic measurement ...................................................... 8-17harmonic order ................................................................... 1-17harmonic preview ................................................................. 8-2harmonic values, list of measured ...................................... 9-17help ..................................................................................... 12-3higher harmonic .................................................................. 1-17 Index
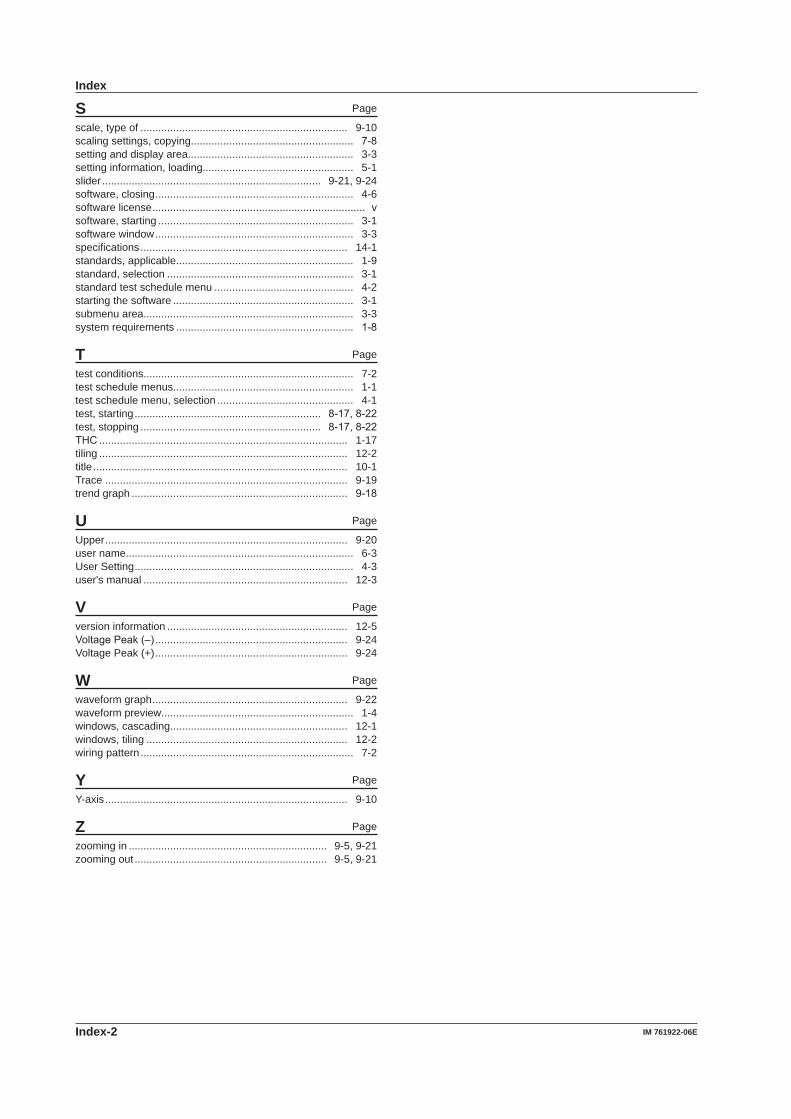
Index-2 IM 761922-06E
S Page
scale, type of ...................................................................... 9-10scaling settings, copying....................................................... 7-8setting and display area........................................................ 3-3setting information, loading................................................... 5-1slider .......................................................................... 9-21, 9-24software, closing ................................................................... 4-6software license ........................................................................ vsoftware, starting .................................................................. 3-1software window ................................................................... 3-3specifications ...................................................................... 14-1standards, applicable............................................................ 1-9standard, selection ............................................................... 3-1standard test schedule menu ............................................... 4-2starting the software ............................................................. 3-1submenu area....................................................................... 3-3system requirements ............................................................ 1-8
T Page
test conditions....................................................................... 7-2test schedule menus............................................................. 1-1test schedule menu, selection .............................................. 4-1test, starting ............................................................... 8-17,8-22test, stopping ............................................................. 8-17,8-22THC .................................................................................... 1-17tiling .................................................................................... 12-2title ...................................................................................... 10-1Trace .................................................................................. 9-19trend graph ......................................................................... 9-18
U Page
Upper .................................................................................. 9-20user name............................................................................. 6-3User Setting .......................................................................... 4-3user's manual ..................................................................... 12-3
V Page
version information ............................................................. 12-5VoltagePeak(–) ................................................................. 9-24Voltage Peak (+) ................................................................. 9-24
W Page
waveform graph .................................................................. 9-22waveform preview................................................................. 1-4windows, cascading............................................................ 12-1windows, tiling .................................................................... 12-2wiring pattern ........................................................................ 7-2
Y Page
Y-axis .................................................................................. 9-10
Z Page
zooming in ................................................................... 9-5, 9-21zooming out ................................................................. 9-5, 9-21
Index