Embed Size (px)
Citation preview

Comprehensive Annual Financial Report
A Component Unit of Harford County, Maryland
For the Fiscal Year ended June 30, 2011
Prepared by the Division of Business Services Finance Department
102 S. Hickory Avenue l Bel Air, MD 21014
Harford County Public Schools

2010-2011 BOARD OF EDUCATION OF HARFORD COUNTY
PICTURED FROM LEFT TO RIGHT:
Donald R. Osman, Robert L. Frisch, Thomas P. Evans, Robert M. Tomback, Ph.D, Mark M. Wolkow, Leonard D. Wheeler, Ed.D., Francis F. “Rick” Grambo, III, Alysson L. Krchnavy and Caitlin R. Dooling.

Harford County Public Schools A Component Unit of Harford County, Maryland
102 South Hickory Avenue Bel Air, Maryland 21014
Comprehensive Annual Financial Report For the Fiscal Year ended June 30, 2011
Prepared by the Division of Business Services
Finance Department
Office of Civil Rights Statement for Harford County Public Schools The Harford County Public School System does not discriminate on the basis of race, color, sex, age, national origin, religion, sexual orientation,
or disability in matters affecting employment or in providing access to programs. Inquires related to the policies of the Board of Education should be directed to the Director of Public Information, 410-588-5203.
Harford County Public Schools Student Contributors for Pictures:
Student Grade School Page Autumn Skinner 11 Aberdeen High School 1 Catie Gottschalk 7 Bel Air Middle School 2 Grant MacFarland 12 Havre de Grace High School 11 Daniel Jenkins 4 Joppatowne Elementary School 12 Megan Reinhardt 4 Magnolia Elementary School 27 Hanna Taylor 12 Bel Air High School 55 Mark Niedswicke 8 Southampton Middle School 57 Sophia Tobio 7 Havre de Grace Middle School 64 Trinity Sprague 9 Harford Technical High School 77 Tyler Dameron 10 C Milton Wright High School 80 Marc Badger 10 Fallston High School 80
Cover design by Casey Payne, Public Relations Specialist, HCPS Communications Office. Cover pictures:
UPPER LEFT Eighteen Fallston High School students scored in the top 20 percent in the National Financial Capability Challenge. The challenge is an awards program designed to increase the financial knowledge and
capability of high school students across the United States. It challenges teachers and students alike to teach and learn to their fullest abilities. Top-scoring educators and students receive award certificates, and schools and states
with the highest participation can earn special distinction. Senior Ryder Ford received a perfect score and was given a $50 savings bond. Pictured from left to right below are (back row) Colin Clotworthy, Jason Faust, Ryder Ford,
Steve Gutermuth, Zac Gutermuth, and Michael Kundrat; (middle row) Zimuzo Nwaigwe, Dana Packett, Iiley Thompson, Tyler Tracey, Alec Tsirigos, and Andy Weaver; and (front row) Chris Lievendag, Zack Wheeler, Mr.
Brian Yeager (teacher), Steve Kauffman, Doug Ziemba, and Taylor Brown.
UPPER RIGHT Six fourth and fifth grade students from Hall’s Cross Roads Elementary School participated in the Maryland State Black Saga Competition held at Towson University on March 19, 2011. This was the first year
Hall’s Cross Roads participated in the Black Saga Competition. Fourth grade students Brittany Madison, Kiana Earl, Kaelyn James and Terel Hubbard joined fifth graders Drake Garner and Christian Allen to form competing teams.
BOTTOM LEFT Students, along with teacher Caroly Kustanbauter from Edgewood High School’s Academy
of Finance program.
BOTTOM RIGHT In the wake of the this year’s disaster in Japan, the students at Forest Lakes Elementary School wanted to have a small part in demonstrating their compassion to the families who have survived the massive
devastation caused by the earthquake and tsunami. Partnering with Students Rebuild, DoSomething.org, and the Bezos Family Foundation, they have joined the efforts of children worldwide in the task of making 100,000 paper cranes. The school goal is to make 1,000 cranes. For each crane received, the Bezos Foundation will donate $2 to
Japan’s reconstruction efforts with a total financial gift of $200,000. Cranes are sacred creatures in Japanese culture. According to legend, anyone who folds a thousand paper cranes will be granted a wish by a crane. All cranes
received will be woven into an art installation – a symbolic gift from students around the globe.
Harford County Public Schools
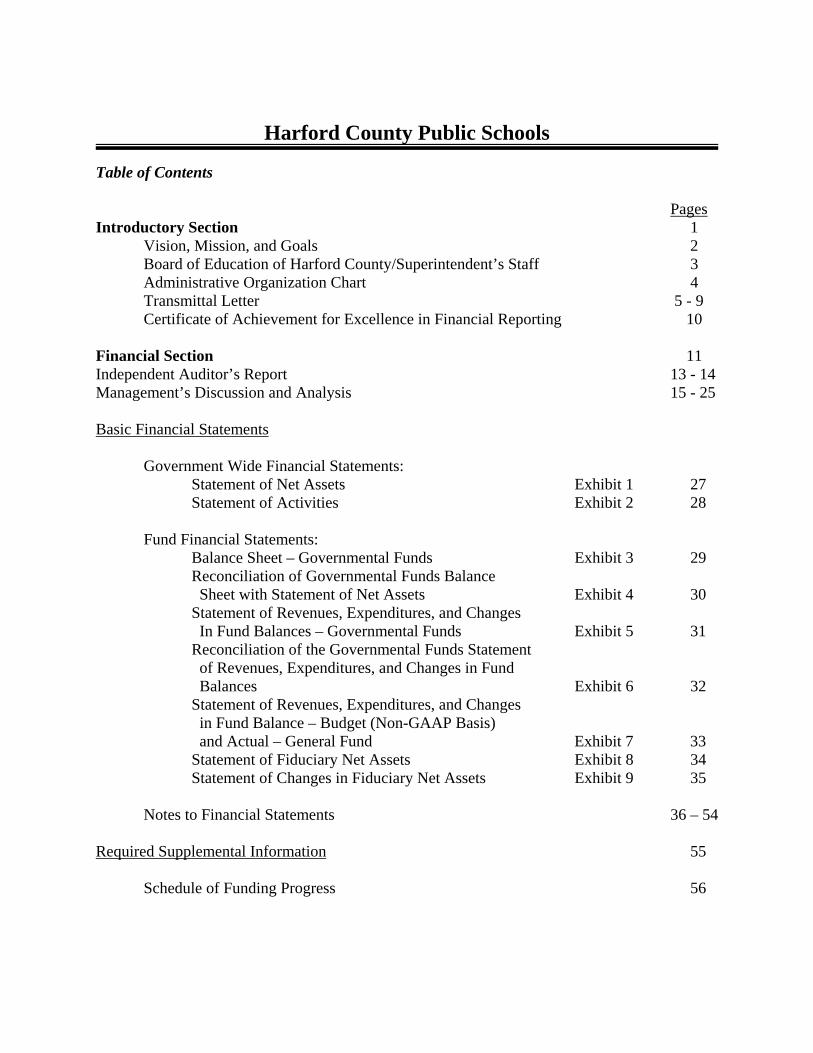
Table of Contents Pages Introductory Section 1 Vision, Mission, and Goals 2 Board of Education of Harford County/Superintendent’s Staff 3 Administrative Organization Chart 4 Transmittal Letter 5 - 9 Certificate of Achievement for Excellence in Financial Reporting 10 Financial Section 11 Independent Auditor’s Report 13 - 14 Management’s Discussion and Analysis 15 - 25 Basic Financial Statements Government Wide Financial Statements: Statement of Net Assets Exhibit 1 27 Statement of Activities Exhibit 2 28 Fund Financial Statements: Balance Sheet – Governmental Funds Exhibit 3 29 Reconciliation of Governmental Funds Balance Sheet with Statement of Net Assets Exhibit 4 30 Statement of Revenues, Expenditures, and Changes In Fund Balances – Governmental Funds Exhibit 5 31 Reconciliation of the Governmental Funds Statement of Revenues, Expenditures, and Changes in Fund Balances Exhibit 6 32 Statement of Revenues, Expenditures, and Changes in Fund Balance – Budget (Non-GAAP Basis) and Actual – General Fund Exhibit 7 33 Statement of Fiduciary Net Assets Exhibit 8 34 Statement of Changes in Fiduciary Net Assets Exhibit 9 35 Notes to Financial Statements 36 – 54 Required Supplemental Information 55 Schedule of Funding Progress 56

Harford County Public Schools Table of Contents – Continued Other Supplemental Information 57
Food Service Fund (Special Revenue Fund) Schedule of Revenues, Expenditures, and Changes in Fund Balance Compared to Budget (Non-GAAP Basis) Schedule A 58
School Construction Fund (Capital Projects Fund) Schedule of Expenditures by Project Schedule B 59 School Funds (Agency Fund) Schedule of Increases, Decreases, and Fund Balances Schedule C 60 - 61
Combining Statement of Fiduciary Net Assets – Agency Funds Schedule D 62
Combining Statement of Changes in Assets and Liabilities – Agency Funds Schedule E 63
Statistical Section 65 Net Assets by Component Table 1 66 Changes in Net Assets Table 2 67 Fund Balances of Governmental Funds Table 3 68 Changes in Fund Balances of Governmental Funds Table 4 69 Enrollment by School and Student to Teacher Ratio Table 5 70 Enrollment by Grade Table 6 71 Other Data Table 7 72 Student Academic Performance Table 8 73 Insurance Summary Table 9 74 Facilities Information Table 10 75 Largest Employers Table 11 76 Compliance Section 77
Independent Auditor’s Report on Internal Control over Financial Reporting and on Compliance and Other Matters Based on an Audit of Financial Statements Performed in Accordance with Government Auditing Standards 78

Introductory Section
Student, Autumn Skinner, Grade 11 at Aberdeen High School, Teacher: Rick Morris
1

Harford County Public Schools
Student: Catie Gottschalk, Grade 7 at Bel Air Middle School, Teacher Claire Parker
Vision Harford County Public Schools will be a community of learners in which our public
schools, families, public officials, businesses, community organizations, and other citizens work collaboratively to prepare all of our students to succeed academically and socially in a diverse, democratic, change-oriented, and global economy.
Mission The Mission of Harford County Public Schools is to promote excellence in instructional
leadership and teaching and to provide facilities and instructional materials that support teaching and learning for the 21st century. The Harford County Board of Education will support this mission by fostering a climate for deliberate change and monitoring progress though measurable indicators.
Goals Ensure a safe, positive learning environment for students and staff in our schools.
Accelerate student learning and eliminate the achievement gaps.
Ensure the effective use of all resources focusing on the areas of technology,
fiscal and budgetary management, and community partnerships. Understanding that all employees contribute to the learning environment, we will
maintain a highly qualified workforce.
2
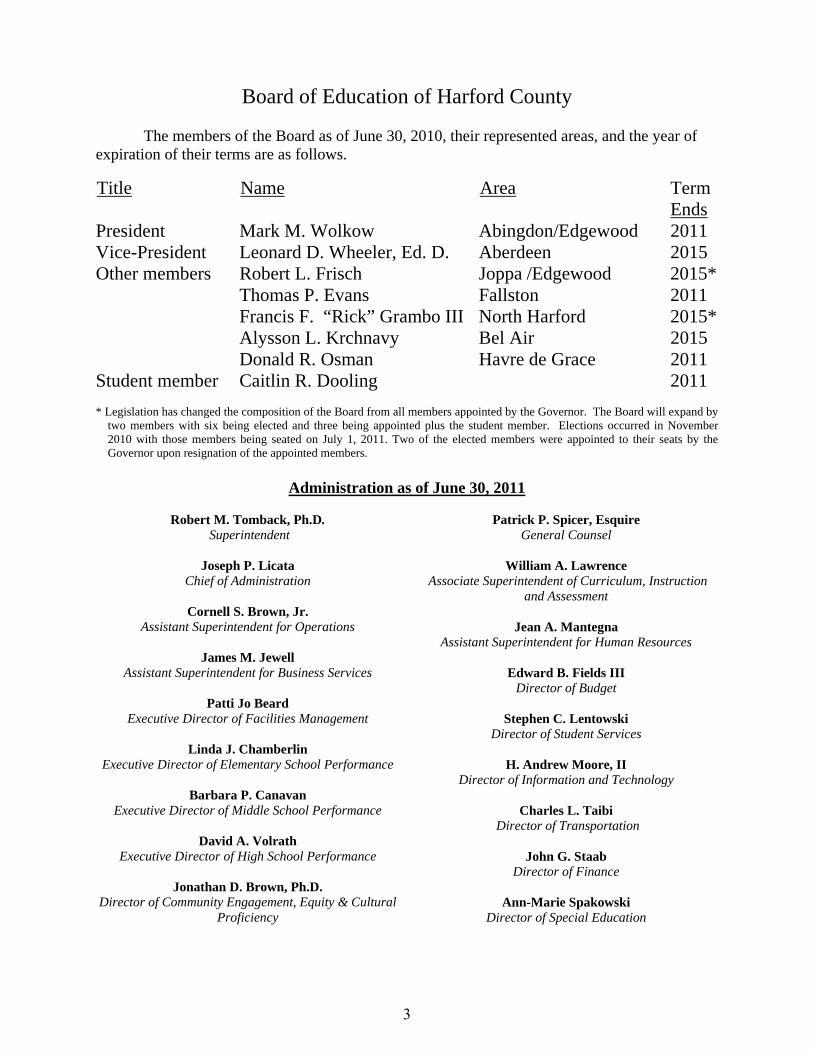
Board of Education of Harford County
The members of the Board as of June 30, 2010, their represented areas, and the year of expiration of their terms are as follows.
UTitleU UNameU UAreaU Term Ends President Mark M. Wolkow Abingdon/Edgewood 2011 Vice-President Leonard D. Wheeler, Ed. D. Aberdeen 2015 Other members Robert L. Frisch Joppa /Edgewood 2015* Thomas P. Evans Fallston 2011
Francis F. “Rick” Grambo III North Harford 2015* Alysson L. Krchnavy Bel Air 2015 Donald R. Osman Havre de Grace 2011 Student member Caitlin R. Dooling 2011
* Legislation has changed the composition of the Board from all members appointed by the Governor. The Board will expand by
two members with six being elected and three being appointed plus the student member. Elections occurred in November 2010 with those members being seated on July 1, 2011. Two of the elected members were appointed to their seats by the Governor upon resignation of the appointed members.
Administration as of June 30, 2011
Robert M. Tomback, Ph.D.
Superintendent
Joseph P. Licata Chief of Administration
Patrick P. Spicer, Esquire General Counsel
William A. Lawrence
Associate Superintendent of Curriculum, Instruction and Assessment
Cornell S. Brown, Jr. Assistant Superintendent for Operations
James M. Jewell
Assistant Superintendent for Business Services
Patti Jo Beard Executive Director of Facilities Management
Linda J. Chamberlin
Executive Director of Elementary School Performance
Barbara P. Canavan Executive Director of Middle School Performance
David A. Volrath
Executive Director of High School Performance
Jonathan D. Brown, Ph.D. Director of Community Engagement, Equity & Cultural
Proficiency
Jean A. Mantegna
Assistant Superintendent for Human Resources
Edward B. Fields III Director of Budget
Stephen C. Lentowski
Director of Student Services
H. Andrew Moore, II Director of Information and Technology
Charles L. Taibi
Director of Transportation
John G. Staab Director of Finance
Ann-Marie Spakowski
Director of Special Education
3

Students, Parents, & Citizensof Harford County
Organization at June 30, 2010
Curriculum & Instruction
Elementary Education
Secondary Education
Special Education
Student Services
Curriculum Development
Account-ability
Grants Alternative Education
School
Psych & Pupil Personnel Services
Elementary Schools
Secondary Schools
Key:InstructionSupportingStaff Function
Equity & Cultural Diversity
Compensatory Education (Title I)
Partnerships for Special Programs
& Student Achievement
Health Services
John Archer School
Superintendent
InformationTechnology
Human Resources
OperationsBusiness Services
Public Information
Government Relations
Safety & Security
Facilities
Transport-ation
Food & Nutrition Services
Planning & Construction
Finance
Risk Management
Purchasing
General Counsel Internal Audit
Administration
Budget
Board of Education
Professional Development
Benefits
Certification
Internal Investigations
Staff Relations
Recruitment & Staffing
Application Development
Clent/Server Support
Instructional Technology
Technical Services
User Support
Charter Schools
School Improvement
Interventions
Students, Parents, & Citizensof Harford County
HRIS
Compliance
4

September 30, 2011 Members of the Board of Education: The Public School Laws of the State of Maryland require school districts publish within three months of the close of each fiscal year a complete set of audited financial statements. This report is published to fulfill that requirement for the fiscal year ended June 30, 2011. Management assumes full responsibility for the completeness and reliability of the information contained in this report, based upon a comprehensive framework of internal control that it has established for this purpose. Because the cost of internal controls should not exceed anticipated benefits, the objective is to provide reasonable rather than absolute assurance that the financial statements are free of any material misstatements. SB & Company, LLC, a firm of licensed certified public accountants, have issued an unqualified (“clean”) opinion on Harford County Public Schools (HCPS) financial statements for the fiscal year ended June 30, 2011. The independent public accountants’ report is located at the front of the financial section of this report. Management’s discussion and analysis (MD&A) immediately follows the independent public accountants’ report and provides a narrative introduction, overview, and analysis of the basic financial statements. MD&A complement this letter of transmittal and should be read in conjunction with it. All funds and accounts of the HCPS are included in the comprehensive annual financial report. For financial reporting purposes, HCPS has been defined as a component unit of the Harford County Government. Therefore, HCPS is included in the comprehensive annual financial report of Harford County. Profile of the Government
Harford County Public Schools (HCPS) is a fiscally dependent school system with an actual enrollment of 38,394 students in fiscal 2011. HCPS is the 135th largest school system of the 17,817 regular school districts in the country when ranked by enrollment. There are 24 school districts in the State of Maryland. This places HCPS in the top one percent of school districts by size. The student body will be served by a projected 5,440.0 FTE faculty and staff positions for fiscal 2012. Currently Harford County has 53 public schools along with 48 non public schools located within the County. Citizens in the County have a choice of public or private schools. 38,394 students attend public schools. The number of students attending private schools is unknown. The
Robert M. Tomback, Ph.D., Superintendent of Schools
Harford County Public Schools 102 S. Hickory Avenue Bel Air, MD 21014 410-838-7300 Fax 410-893-2478
5
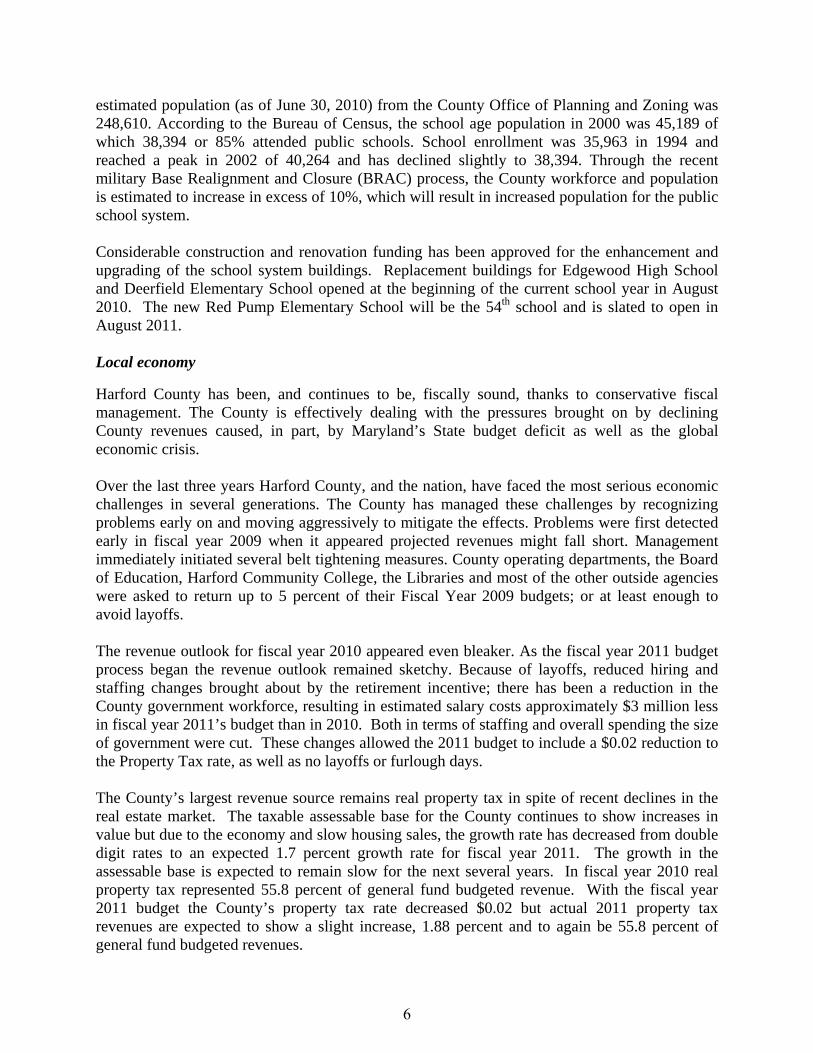
estimated population (as of June 30, 2010) from the County Office of Planning and Zoning was 248,610. According to the Bureau of Census, the school age population in 2000 was 45,189 of which 38,394 or 85% attended public schools. School enrollment was 35,963 in 1994 and reached a peak in 2002 of 40,264 and has declined slightly to 38,394. Through the recent military Base Realignment and Closure (BRAC) process, the County workforce and population is estimated to increase in excess of 10%, which will result in increased population for the public school system. Considerable construction and renovation funding has been approved for the enhancement and upgrading of the school system buildings. Replacement buildings for Edgewood High School and Deerfield Elementary School opened at the beginning of the current school year in August 2010. The new Red Pump Elementary School will be the 54th school and is slated to open in August 2011.
Local economy
Harford County has been, and continues to be, fiscally sound, thanks to conservative fiscal management. The County is effectively dealing with the pressures brought on by declining County revenues caused, in part, by Maryland’s State budget deficit as well as the global economic crisis. Over the last three years Harford County, and the nation, have faced the most serious economic challenges in several generations. The County has managed these challenges by recognizing problems early on and moving aggressively to mitigate the effects. Problems were first detected early in fiscal year 2009 when it appeared projected revenues might fall short. Management immediately initiated several belt tightening measures. County operating departments, the Board of Education, Harford Community College, the Libraries and most of the other outside agencies were asked to return up to 5 percent of their Fiscal Year 2009 budgets; or at least enough to avoid layoffs. The revenue outlook for fiscal year 2010 appeared even bleaker. As the fiscal year 2011 budget process began the revenue outlook remained sketchy. Because of layoffs, reduced hiring and staffing changes brought about by the retirement incentive; there has been a reduction in the County government workforce, resulting in estimated salary costs approximately $3 million less in fiscal year 2011’s budget than in 2010. Both in terms of staffing and overall spending the size of government were cut. These changes allowed the 2011 budget to include a $0.02 reduction to the Property Tax rate, as well as no layoffs or furlough days. The County’s largest revenue source remains real property tax in spite of recent declines in the real estate market. The taxable assessable base for the County continues to show increases in value but due to the economy and slow housing sales, the growth rate has decreased from double digit rates to an expected 1.7 percent growth rate for fiscal year 2011. The growth in the assessable base is expected to remain slow for the next several years. In fiscal year 2010 real property tax represented 55.8 percent of general fund budgeted revenue. With the fiscal year 2011 budget the County’s property tax rate decreased $0.02 but actual 2011 property tax revenues are expected to show a slight increase, 1.88 percent and to again be 55.8 percent of general fund budgeted revenues.
6

Income tax revenue, the second largest revenue source in the County, which is directly affected by population growth, employment levels and personal income, had shown steady growth until fiscal year 2008. Starting in fiscal year 2008 through 2010 income tax has been declining and this is expected to continue into fiscal year 2011. The drop in revenues is largely due to the slowdown in the overall economy, which is projected to continue through the early part of fiscal year 2011, as the credit crunch, carryover capital losses, high unemployment and the continued decrease in consumer spending combine to limit the growth of taxable income. In fiscal year 2010 income tax represented 34.8 percent of general fund budgeted revenue. In fiscal year 2011 income tax revenues are expected to decline (3.67 percent) and make-up 32.9 percent of general fund budgeted revenues.
The County must also contend with reductions in revenues tied to the State and affected by the State of Maryland’s budget shortfalls. The most significant revenue reduction will be Highway User Tax revenue. The State’s fiscal year 2011 budget projects a 96.2 percent decrease in the amount of Highway User Tax revenue that will be shared with the counties; nearly $10.0 million will be lost to Harford County. Long-term financial planning In 2002 the State legislature enacted the Bridge to Excellence in Public Schools Act. This law initiated major changes in the State financing of local schools in an effort to achieve both funding equity and adequacy between Maryland’s 24 school districts. The law achieved its promise of an increase in State funding to public education of $1.3 billion over six years. However, the governor of Maryland convened a special session of the Maryland general assembly in October 2007 to reduce the projected $1.5 billion state structural deficit. During the special session, increases in taxes were approved and planned funding increases for public education were curtailed through FY2011. As a result, increases in State Aid to the Unrestricted Budget will be at a minimum growth of 1% over next year. In 2009, the State legislature enacted changes to the Harford County Board of Education. Currently the Board is comprised of seven members appointed by the governor and one student member. The legislation expands the Board to nine members and one student member. Ultimately six members will be elected and three appointed by the governor. The transition will not be complete until the Board is seated in 2015. Relevant financial policies Primary funding is provided by the State of Maryland and Harford County Government. The budget is approved by the Board of Education and the Harford County Council in accordance with State laws. The Board has no authority to levy and collect taxes or increase the budget. Formal budgetary integration, including encumbrance accounting, is employed as a management control device during the year for the governmental fund types. Management is authorized to transfer funds within major categories of expenditure, as defined by statute. Transfers between categories of expenditure during the fiscal year require approval of both the Board of Education and Harford County Council.
7

By statute, in order to receive any increase in State basic school aid, each county must appropriate an amount equal to, or greater than, the prior year per pupil appropriation. Referred to as the ‘maintenance of effort’ calculation, it provides that if there is no enrollment growth county funding will remain the same as that of the prior year in terms of total dollars. Counties often appropriate far in excess of the minimum amount stipulated in the law. Capital projects are funded by Harford County Government and the State of Maryland. The Board of Education has no authority to issue general obligation debt. Funds are budgeted and appropriated on both a project and annual basis. Capital projects funds do not lapse at the end of each year and may be expended until completion of the project. Budget transfers between projects require the approval of both the Board of Education and the Harford County Council. Major initiatives Construction is underway for the new Red Pump Elementary School. The new elementary school has necessitated a redistricting which will be effective for the FY 2011 – 2012 school year. Magnet and completer school programs continue to expand. Awards and Acknowledgements The Government Finance Officers Association of the United States and Canada (GFOA) awarded a Certificate of Achievement for Excellence in Financial Reporting to Harford County Public Schools for its comprehensive annual financial report for the fiscal year ended June 30, 2010. In order to be awarded a Certificate of Achievement, a government must publish an easily readable and efficiently organized comprehensive annual financial report. This report must satisfy both generally accepted accounting principles and applicable legal requirements. A Certificate of Achievement is valid for a period of one year only. We believe our current comprehensive annual financial report continues to meet the Certificate of Achievement Program’s requirements and we are submitting it to the GFOA to determine its eligibility for another certificate. In addition, HCPS also received the GFOA’s Distinguished Budget Presentation Award for its annual budget document for the Year Beginning July 1, 2010. In order to qualify for the Distinguished Budget Presentation Award, the budget document was judged to be proficient in several categories, including as a policy document, a financial plan, an operations guide, and a communications device. The preparation of this report would not have been possible without the services of the entire staff of the Finance Department under the direction of John G. Staab, Director of Finance, the Office of Internal Audit, and SB & Company, LLC. Many other offices in the system contributed to provide data for this report, including the students whose art work is published throughout the document. Our appreciation is extended to all who assisted in the timely closing of the school system’s financial records and in the preparation of this report. Credit must also be
8

given to the Superintendent and Board of Education for their unfailing support for maintaining the highest standards of professionalism in the management of HCPS’ finances. Sincerely,
Robert M. Tomback, Ph.D. James M. Jewell Jay Staab Superintendent Assistant Superintendent Finance Director
9

10

Financial Section
Student: Grant MacFarland Grade 12 Have de Grace High School, Teacher Jenna Zimmerman
11

Student: Daniel Jenkins, Grade 4 at Joppatowne Elementary School; Teacher Sharon Pardew
12

13

14

Harford County Public Schools
Management's Discussion and Analysis (MD&A) June 30, 2011 As Management of the Harford County Public Schools (HCPS), we offer readers of the HCPS financial statements this narrative overview and analysis of the financial activities of HCPS for the fiscal year ended June 30, 2011. We encourage readers to consider the information presented here in conjunction with additional information that we have furnished in our letter of transmittal, which can be found on pages 3 – 9 of this report. All amounts, unless otherwise indicated, are expressed in thousands of dollars. Management's Discussion and Analysis (MD&A) is an element of the reporting model adopted by the Governmental Accounting Standards Board (GASB) in their Statement No. 34 Basic Financial Statements - and Management's Discussion and Analysis - for State and Local Governments issued June 1999. Certain comparative information between the current and prior fiscal years is required to be presented in the MD&A. The goal of MD&A is for the HCPS’ financial managers to present an objective and easily readable analysis of its financial activities based on currently known facts, decisions, or conditions. Financial Highlights
The assets for Harford County Public Schools exceeded its liabilities at the close of the most recent fiscal year by $460.0 million. Net assets at June 30 2010 were $458.6 million and increased slightly to $460.0 million for the year ended June 30, 2011.
The final unrestricted General Fund budget changed by a reduction of $6.1 million or
1.45% during the year from the originally adopted budget.
The General Fund unrestricted, unassigned fund balance on a budgetary basis decreased from $8,819,623 to $6,096,029, a reduction of approximately $2.7 million which was the product of spending containment strategies enacted during the year in response to funding reductions by the state and County governments. Accumulating fund balance was also a strategic decision to prepare for additional funding reductions or cost shifting by the state government, notably the threat to move some portion of teacher pension costs to the local school systems.
The unrestricted General Fund actual revenues were less than the amended budget by
$93,648 or two hundredths of a percent (0.02%), and expenditures were $7,616,270, or one and eighty-three hundredths of a percent (1.83%), under the amended budget.
The HCPS total debt increased by $27.0 million during the current fiscal year. The key
factor in this change was the increase of $27.7 million in the OPEB Obligation.
15

Harford County Public Schools
Management's Discussion and Analysis (MD&A) June 30, 2011 Overview of the Financial Statements This discussion and analysis are intended to serve as an introduction to the Harford County Public Schools basic financial statements. Basic Financial Statements
The illustration above represents the minimum requirements for the basic external financial statements. This report also contains other supplementary information in addition to the basic financial statements themselves. District-wide financial statements In addition to the MD&A, the District-wide Financial Statements are the other primary addition to financial reporting under GASB Statement No. 34. The District-wide perspective is designed to provide readers with a complete financial view of the entity known as Harford County Public Schools. The financial presentation of this perspective is similar to a private sector business. The statement of net assets presents information on all of the assets and liabilities of HCPS with the difference between the two reported as net assets. Over time, increases or decreases in net assets may serve as a useful indicator of whether the financial position of HCPS is improving or deteriorating. The statement of activities presents information showing how HCPS’ net assets changed during the most recent fiscal year. These statements measure the change in total economic resources during the period utilizing the accrual basis of accounting. This means that any change in net assets is reported as soon as the underlying event giving rise to the change occurs, regardless of the timing of related cash flows. Thus, revenues and expenses are reported in this statement for some items that will only result in cash flows in future fiscal periods (like earned but unused employees leave), or for which cash has already been expended (depreciation of buildings and equipment already purchased). The District-wide perspective is unrelated to budget and accordingly, budget comparisons are not provided. Fund financial statements. A fund is a grouping of related accounts used to maintain control over resources that have been segregated for specific activities or objectives. Harford County
Management Discussion & Analysis
District-wide Financial Statements Fund Financial Statements Notes to the Financial Statements
16

Harford County Public Schools
Management's Discussion and Analysis (MD&A) June 30, 2011 Public Schools uses fund accounting to ensure and demonstrate compliance with finance-related requirements. HCPS’ funds are in two categories, governmental funds and fiduciary funds. Harford County Public Schools does not operate any enterprise activities that are reported as proprietary funds. The measurement focus of these statements is current financial resources; therefore the emphasis is placed on the cash flows of the organization within the reporting period or near future. Accordingly, the modified accrual basis of accounting that measures these cash flows is used. In the case of Harford County Public Schools, open encumbrances are excluded from expenditures and the State of Maryland's contribution to the teachers retirement system is added to revenue and expenditures. Fund Financial Statements are also unrelated to budget and accordingly, budget comparisons are not provided in the presentation. Budgetary presentation of individual fund financial information utilizing the current financial resources measurement focus and the budgetary basis of accounting is presented as part of the Fund Financial Statements as well. In these statements, available cash flows of HCPS itself are measured as well as the commitment to acquire goods or services with that cash. Open encumbrances at year-end are included in the expenditures. This is the legal basis upon which the budget is adopted so budget comparisons are provided. GASB Statement Number 34 requires that we present the original adopted budget as well as the final budget and discuss the changes between them.
District-wide Statements
Fund Statements Budgetary Fund Statements
Measurement Focus Economic Resources Current Financial
Resources Current Financial
Resources
Basis of Accounting Accrual Modified Accrual Cash and
Commitments Budget No No Yes
The table above presents the differences in the presentation of the basic financial statements. Fiduciary responsibility – Retiree Health Plan Trust, Scholarship, and School Activity Funds (Exhibit 8). HCPS is the trustee, or fiduciary, for its retiree health plan trust, scholarship, and student activity funds. These funds are reported as separate Agency and Trust Funds. We exclude these activities from Harford County Public Schools' other financial statements because the assets cannot be used to finance HCPS’ activities. We are responsible for ensuring that the assets reported in these Funds are used for their intended purposes.
17
Harford County Public Schools
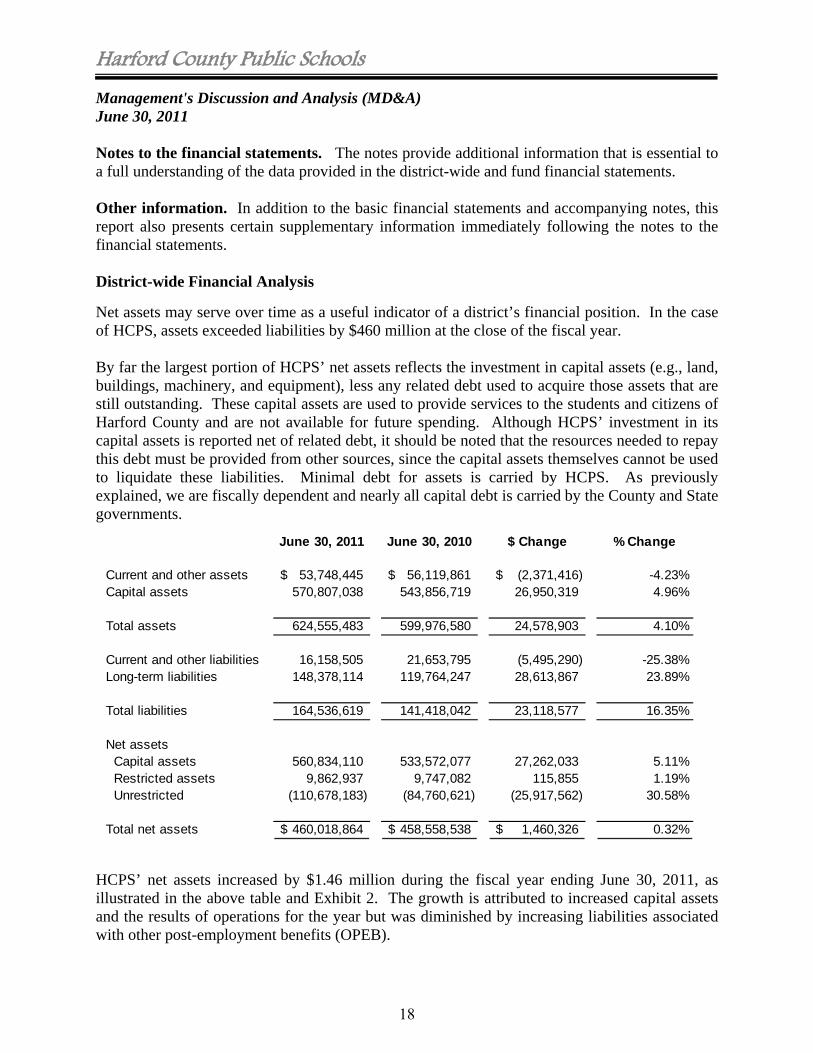
Management's Discussion and Analysis (MD&A) June 30, 2011 Notes to the financial statements. The notes provide additional information that is essential to a full understanding of the data provided in the district-wide and fund financial statements. Other information. In addition to the basic financial statements and accompanying notes, this report also presents certain supplementary information immediately following the notes to the financial statements. District-wide Financial Analysis
Net assets may serve over time as a useful indicator of a district’s financial position. In the case of HCPS, assets exceeded liabilities by $460 million at the close of the fiscal year. By far the largest portion of HCPS’ net assets reflects the investment in capital assets (e.g., land, buildings, machinery, and equipment), less any related debt used to acquire those assets that are still outstanding. These capital assets are used to provide services to the students and citizens of Harford County and are not available for future spending. Although HCPS’ investment in its capital assets is reported net of related debt, it should be noted that the resources needed to repay this debt must be provided from other sources, since the capital assets themselves cannot be used to liquidate these liabilities. Minimal debt for assets is carried by HCPS. As previously explained, we are fiscally dependent and nearly all capital debt is carried by the County and State governments.
HCPS’ net assets increased by $1.46 million during the fiscal year ending June 30, 2011, as illustrated in the above table and Exhibit 2. The growth is attributed to increased capital assets and the results of operations for the year but was diminished by increasing liabilities associated with other post-employment benefits (OPEB).
June 30, 2011 June 30, 2010 $ Change % Change
Current and other assets 53,748,445$ 56,119,861$ (2,371,416)$ -4.23%Capital assets 570,807,038 543,856,719 26,950,319 4.96%
Total assets 624,555,483 599,976,580 24,578,903 4.10%
Current and other liabilities 16,158,505 21,653,795 (5,495,290) -25.38%Long-term liabilities 148,378,114 119,764,247 28,613,867 23.89%
Total liabilities 164,536,619 141,418,042 23,118,577 16.35%
Net assets Capital assets 560,834,110 533,572,077 27,262,033 5.11% Restricted assets 9,862,937 9,747,082 115,855 1.19% Unrestricted (110,678,183) (84,760,621) (25,917,562) 30.58%
Total net assets 460,018,864$ 458,558,538$ 1,460,326$ 0.32%
18

Harford County Public Schools
Management's Discussion and Analysis (MD&A) June 30, 2011 The unrestricted deficit at June 30, 2011 of $110.7 million is the result of reducing the fund balance from the General Fund (Exhibit 3) of $26.0 million with the compensated absences long-term liabilities of $26.85 million and $109.94 million for other post-employment benefits. We are committed by employee agreements to pay employees at retirement twenty-five percent (25%) of their earned but unused sick leave. For administrators the limit is 250 days, all others are up to 200 days, plus any earned and unused vacation. The long-term portion is the amount we expect to pay beyond June 30, 2011. A total of $28.5 million exists at June 30, 2011 with $4.7 million due within one year. The amount attributable to vacation leave is $4.2 million and $24.3 million for sick leave. Historically this liability was funded on a "pay as you go" basis from available current financial resources. This method is expected to continue. The remaining $9.98 million long-term liability balance represents our obligations under the capital lease for the construction of the administration building. Results of operations for HCPS as a whole are presented in Exhibit 2, the Statement of Activities. Approximately $548.5 million in expenses are reported. To the extent possible revenue directly attributed to the function or program is reported against the appropriate expense. Included in such revenues are charges for services and grants. $354.9 million in expenses were paid using other general revenue sources not specifically attributed to a function or program. The Food Service program is designed to be self-funded. Allocation of program revenues to expenses produced a net gain for this program.
Total Cost of Services
Net Cost of Services
% Net Cost to Total
Instruction $383,639,311 $224,007,583 58.39%Pupil personnel 2,222,690 2,060,398 92.70%Health services 4,849,562 4,849,562 100.00%Pupil transportation 35,423,950 23,740,003 67.02%Operation and maintenance of plant 54,505,304 53,253,968 97.70%Food services 14,848,019 (260,458) -1.75%All others 53,011,922 47,292,776 89.21%
Total $548,500,758 $354,943,832 64.71%
All othersAdministration $15,340,652 $13,614,535 88.75%Mid-level administration 36,620,721 32,984,142 90.07%Community services 451,022 94,572 20.97%Depreciation - unallocated 87,419 87,419 100.00%Interest on debt 512,108 512,108 100.00%Total $53,011,922 $47,292,776 89.21%
19

Harford County Public Schools
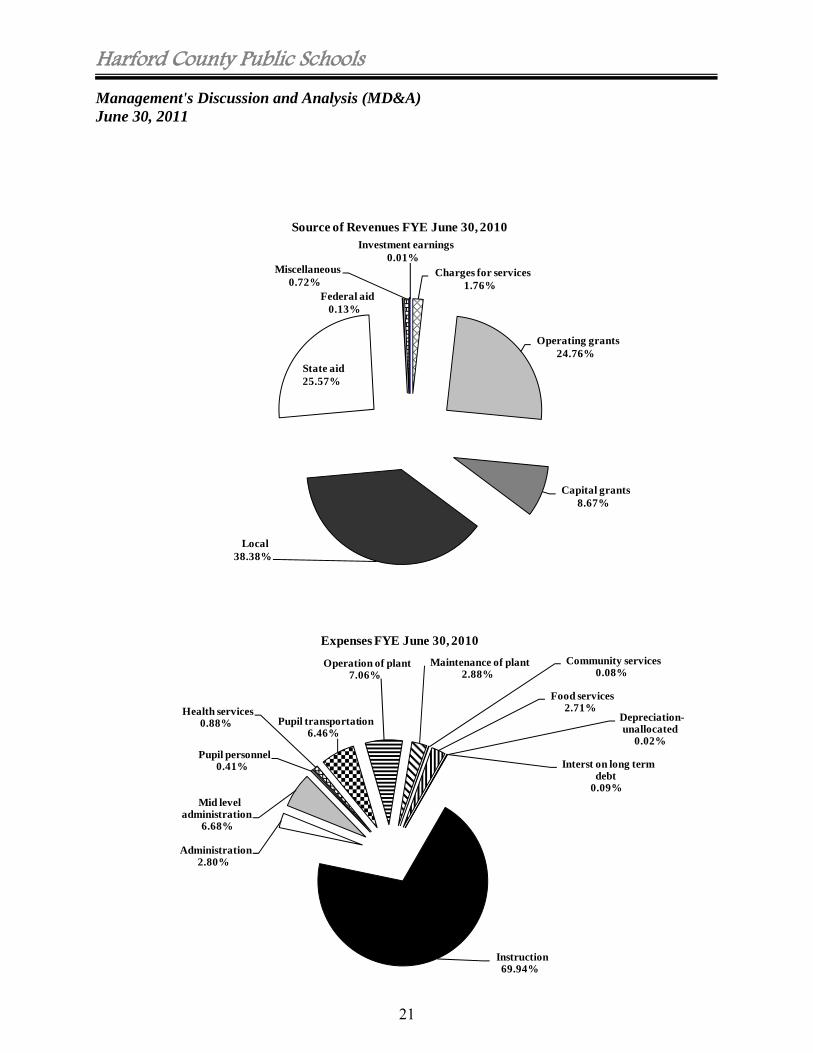
Management's Discussion and Analysis (MD&A) June 30, 2011 Above is a table summarizing the district-wide cost of services for each program or function. About 86.75% of the net costs of services are directly related to students' instruction and welfare. Of the remaining 13.25%, all but about 4.0% is used for the direct administration of schools and instructional support. It is important to note that in this report format, costs for employee benefits and depreciation on fixed assets are allocated to the appropriate program or function. Total revenues decreased by 4.92% from the prior year, as shown on the table below. This decrease is attributable to operating grants and state aid. HCPS is fiscally dependent on local and state aid to fund its daily operations. State aid is largely formula driven based on student population and wealth. Local revenue, provided by the Harford County Government, is dependent upon the economic condition of the County. However, the education statute requires a minimum level of funding equal to the prior year’s per pupil contribution times the current year projected enrollment. Most the operating grant funding is from the State and County governments as well. Expenses decreased by 0.15%. The bulk of the decrease, in terms of dollars, occurred in the Administration and Mid Level Administration categories reflecting decreased costs from lower operating grants to support positions. Other large dollar decreases occurred in operation of Plant and Food Services.
June 30, 2011 June 30, 2010 $ Change % ChangeRevenuesProgram revenues Charges for services 9,694,002$ 9,825,325$ (131,323)$ -1.34% Operating grants 136,195,979 122,435,621 13,760,358 11.24% Capital grants 47,666,945 85,054,404 (37,387,459) -43.96% Local 211,067,388 210,414,800 652,588 0.31% State aid 140,638,081 147,509,796 (6,871,715) -4.66% Federal aid 695,554 625,283 70,271 11.24% Miscellaneous 3,960,060 2,486,813 1,473,247 59.24% Investment earnings 43,075 39,601 3,474 8.77%
Total revenues 549,961,084 578,391,643 (28,430,559) -4.92%
Expenses Instruction 383,639,311 383,382,564 256,747 0.07% Administration 15,340,652 16,002,536 (661,884) -4.14% Mid level administration 36,620,721 37,515,873 (895,152) -2.39% Pupil personnel 2,222,690 2,338,402 (115,712) -4.95% Health services 4,849,562 5,069,023 (219,461) -4.33% Pupil transportation 35,423,950 33,647,222 1,776,728 5.28% Operation of plant 38,716,053 39,310,381 (594,328) -1.51% Maintenance of plant 15,789,251 15,129,880 659,371 4.36% Community services 451,022 398,983 52,039 13.04% Food services 14,848,019 15,390,849 (542,830) -3.53% Interst on long term debt 512,108 512,893 (785) -0.15% Depreciation-unallocated 87,419 89,271 (1,852) -2.07%
Total expenses 548,500,758 548,787,877 (287,119) -0.05%
Increase in net assets 1,460,326$ 29,603,766$ (28,143,440)$ -95.07%
Changes in Net Assets
20
Harford County Public Schools
Management's Discussion and Analysis (MD&A) June 30, 2011
Instruction69.94%
Administration2.80%
Mid level administration
6.68%
Pupil personnel0.41%
Health services0.88% Pupil transportation
6.46%
Operation of plant7.06%
Maintenance of plant2.88%
Community services0.08%
Food services2.71%
Interst on long term debt
0.09%
Depreciation-unallocated
0.02%
Expenses FYE June 30, 2010
Charges for services1.76%
Operating grants24.76%
Capital grants8.67%
Local38.38%
State aid25.57%
Federal aid0.13%
Miscellaneous0.72%
Investment earnings0.01%
Source of Revenues FYE June 30, 2010
21

Harford County Public Schools
Management's Discussion and Analysis (MD&A) June 30, 2011
Fund Performance
Funds are self-balancing sets of accounts used to control and manage money for particular purposes. As pointed out earlier, fund information is presented in two ways to satisfy two specific purposes. Exhibit 3 is the Balance Sheet for the HCPS’ governmental funds and Exhibit 5 presents those same funds' results of operations.
General Fund - Unrestricted (Exhibit 7)
Changes made to the original budget during the fiscal year were inter-categorical transfers made for two purposes; provide for additional non-public placement special education costs and provide additional funds within categories to cover expenditures. Also the State Aid was reduced by $6.1 million when the Governor substituted federal education jobs funds for state foundation aid funding after the fiscal year began.
O riginal Budget Additions Reductions Total Change Final Budget
Local 214,061,789$ -$ -$ -$ 214,061,789$
State 199,663,261 - (6,144,622) (6,144,622) 193,518,639
Federal 650,000 - - - 650,000
Earnings on investments 150,000 - - - 150,000
Other Sources 2,570,958 - - - 2,570,958
Prior year's fund balance 5,432,714 - - - 5,432,714
Total revenues 422,528,722$ -$ (6,144,622)$ (6,144,622)$ 416,384,100$
EXPENDITURES
Administration 11,334,110.00$ 105,145$ (200,000)$ (94,855)$ 11,239,255$
Mid-Level Administration 25,760,132 - (205,145) (205,145) 25,554,987
Instructional Salaries 167,034,492 - (600,000) (600,000) 166,434,492
Textbooks 7,969,580 - - - 7,969,580
Other Instructional Costs 3,347,357 - 200,000 200,000 3,547,357
Special Education 38,960,597 700,000 - 700,000 39,660,597
Student Personnel Services 1,654,612 - - - 1,654,612
Student Health Services 3,334,606 - 30,000 30,000 3,364,606
Student Transportation 29,291,690 - 450,000 450,000 29,741,690
Operation of Plant 31,545,767 - (585,449) (585,449) 30,960,318
Maintenance of Plant 11,697,674 585,449 - 585,449 12,283,123
Fixed Charges 89,715,918 (6,624,622) - (6,624,622) 83,091,296
Community Services 520,473 - - - 520,473
Capital Outlay 361,714 - - - 361,714
Total expenditures 422,528,722$ (5,234,028)$ (910,594)$ (6,144,622)$ $ 416,384,100
REVENUE
22
Harford County Public Schools
Management's Discussion and Analysis (MD&A) June 30, 2011 It is critical for the reader to understand that local and state revenues account for 99% of the total General Fund unrestricted revenue. Until recently, both have been stable and highly predictable. In the past few years, as state and local revenues declined with the general condition of the economy, mid-year legislative and executive initiatives resulted in the reduction of revenues.
To facilitate the anticipated County revenue shortfalls this fiscal year, requests were made to all departments and agencies to restrict spending in December 2010 resulting in a reduction of $2,994,401 in County revenues for the year.
Interest earnings continue to fall well below budget as a result of historic low rates and aggressive cash management by the County in matching our cash demands with their payment schedule to us.
Other revenue is substantially over budget. Included are tuition, facility rental, e-rate rebates, Medicare Part D receipts, dividends from MABE’s insurance programs, and payments from health and dental insurance carriers. Major receipt amounts in the miscellaneous revenue account are from the following:
Health/Dental Insurance rebates & settlements $2,179,309 Residual flex plan* 35,860 MABE insurance dividend 221,455 Medicare Part D* 817,185 Insurance recoveries 138,077
*Part of the Contribution to the OPEB Investment Trust Fund appropriated for FY11
Always frugal, over the past two years hiring, conference, and other expenditure restrictions implemented early in the fiscal year helped achieve spending 1.83% (one and eighty-three hundreths percent) below budget in FY11.
Capital Asset and Debt Administration (See Notes 2 and 7) At June 30, 2011 HCPS had over $707.5 million invested in a broad range of capital assets including land (over 1,952 acres), buildings (over 6.231 million square feet) and improvements, furniture, vehicles and other equipment. Capital assets increased by just over $34.9 million from the same time last year, excluding the effect of depreciation as shown in the table below. This increase is primarily attributed to the near completion of Red Pump Elementary School scheduled to receive students in August 2011. June 30 2011 June 30 2010 $ Change % Change
Construction in progress $139,089,104 $201,713,777 ($62,624,673) -31.05%
School properties 536,382,485 441,947,687 94,434,798 21.37%Furniture, fixtures and equipment 32,046,680 28,969,652 3,077,028 10.62%
Total capital assets $707,518,269 $672,631,116 $34,887,153 5.19%
23
Harford County Public Schools
Management's Discussion and Analysis (MD&A) June 30, 2011 School districts in Maryland are in the uncommon position of owning assets but not the debt associated with those facilities as they are fully fiscally dependent on the state and county governments,. Accordingly, HCPS carries no bond rating and has no debt policy. Future Issues Significant legislation by the federal and state governments has impacted public education in Maryland. The federal “No Child Left Behind” act requires that the all students meet standards and that each school and sub-group of students show adequate yearly progress. In addition it requires that teachers be highly qualified in their content areas. Maryland enacted the “Bridge to Excellence” statute which requires that each school district adopt a master plan. This plan is to be reviewed by the County governments, and then submitted to the Maryland State Department of Education for approval. A component of the plan is the fiscal impact of each new initiative contained in the plan. Exacerbating the facilities issues is the anticipation of the expansion of the mission of Aberdeen Proving Ground (APG), the County’s largest employer. Congress approved in its Base Realignment and Closure (BRAC) legislation closing the facility in Fort Monmouth, NJ and relocating it to APG. Despite numerous studies to determine the impact on the region surrounding APG that impact has yet be determined or experienced. The move is to be completed by 2011. The Governmental Accounting Standards Board (GASB) has issued Statement No. 45, Accounting and Financial Reporting by Employers for Postemployment Benefits Other Than Pensions, which addresses how state and local governments should account for and report their costs and obligations related to postemployment healthcare and other nonpension benefits. Collectively, these benefits are commonly referred to as other postemployment benefits, or OPEB. HCPS made several policy changes with respect to benefits provided to retirees and committed to using excess monies in the health insurance rate stabilization account and federal Medicare Part D reimbursement to at least partially fund the OPEB liability. Currently HCPS is participating in a multi-employer OPEB Investment Trust administered by the Maryland Association of Boards of Education (MABE). We believe this structure is unique in the country. While we have the vehicle to invest OPEB funds the issue will be whether or not the County will fund OPEB contributions to meet our proposed 15 year timeframe to achieve full funding. The current economic climate has been, and is forecast to continue to be, prohibitive to this objective. Meanwhile the unfunded liability continues to grow. Federal grant programs, notably Education Jobs program, are further clouding the fiscal picture. While the additional funds were welcome, restrictions on their use and the intended purpose of preserving classroom teaching positions are less applicable at HCPS than in other parts of the
24

Harford County Public Schools
Management's Discussion and Analysis (MD&A) June 30, 2011 nation. We neither reduced the workforce nor imposed furlough days throughout the economic decline. We have reduced positions in the FY 2012 budget. The continuing escalation and unpredictability of energy costs remains a vexing problem for this, and all other districts. By action of the Board a $915,000 assignment of fund balance was set aside for future energy costs to offset whatever future unanticipated costs will arise. HCPS has not escaped the souring economy. As both the state and County experience continuing reductions in revenue, a source of relief for them is passing costs off to local Boards of Education. With the stimulus funding made available to public schools some of those reductions were absorbed. Of greatest concern are actions to modifying the maintenance of effort calculation statutorily required by County governments to fund their local school systems, and the transfer of some part of teacher pension costs now paid directly by the State to the local Boards of Education. We will be monitoring the upcoming legislative session to track progress on these issues. Contacting Harford County Public Schools' Financial Management Our financial report is designed to provide our citizens, taxpayers, parents, and students with a general overview of the HCPS’ finances and to demonstrate its accountability for the money it receives. If you have questions about this report or wish to request additional financial information, contact James M. Jewell, Assistant Superintendent of Business Services at (410) 588-5321, or John G. Staab, Director of Finance, (410) 588-5237, at Harford County Public Schools, 102 South Hickory Avenue, Bel Air, Maryland 21014.
25

Student: Megan Reinhardt Grade 4 Magnolia Elementary School, Teacher Kate Thurlow
26
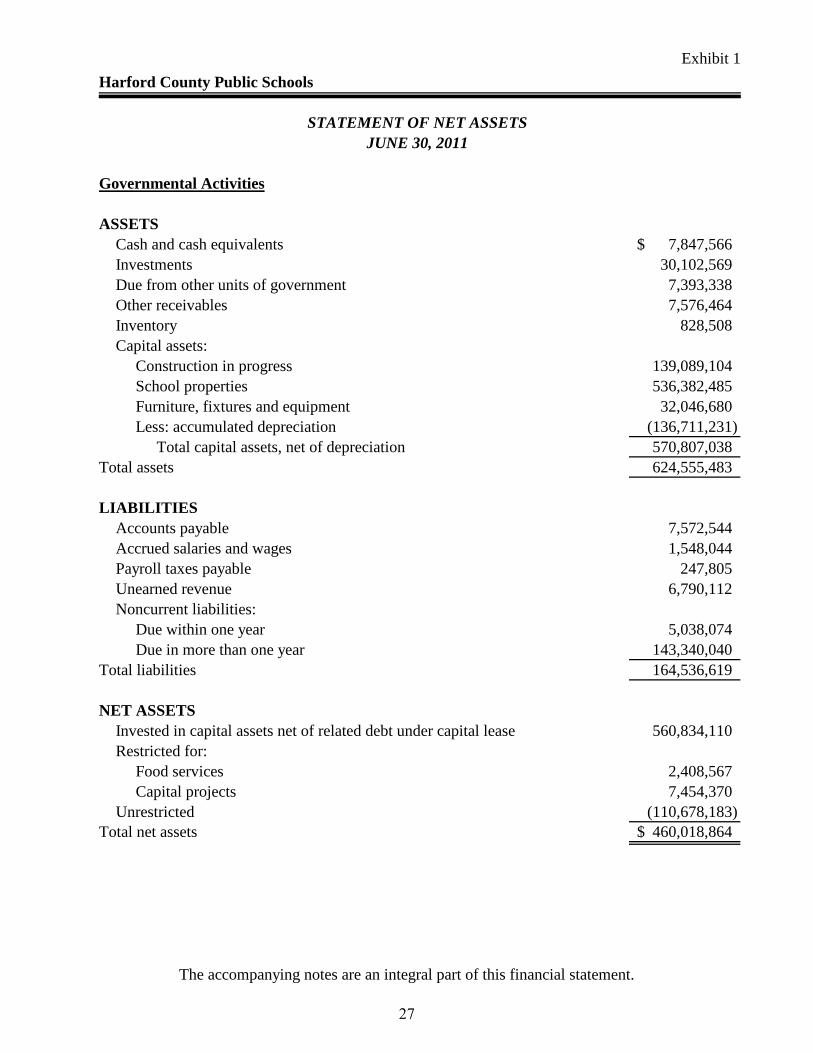
Exhibit 1
The accompanying notes are an integral part of this financial statement.
Cash and cash equivalents 7,847,566$ Investments 30,102,569 Due from other units of government 7,393,338 Other receivables 7,576,464 Inventory 828,508 Capital assets:
Construction in progress 139,089,104 School properties 536,382,485 Furniture, fixtures and equipment 32,046,680 Less: accumulated depreciation (136,711,231)
Total capital assets, net of depreciation 570,807,038 Total assets 624,555,483
Accounts payable 7,572,544 Accrued salaries and wages 1,548,044 Payroll taxes payable 247,805 Unearned revenue 6,790,112 Noncurrent liabilities:
Due within one year 5,038,074 Due in more than one year 143,340,040
Total liabilities 164,536,619
Invested in capital assets net of related debt under capital lease 560,834,110 Restricted for:
Food services 2,408,567 Capital projects 7,454,370
Unrestricted (110,678,183) Total net assets 460,018,864$
LIABILITIES
Governmental Activities
NET ASSETS
Harford County Public Schools
STATEMENT OF NET ASSETSJUNE 30, 2011
ASSETS
27

Exhibit 2
The accompanying notes are an integral part of this financial statement.
Harford County Public Schools
STATEMENT OF ACTIVITIES
Net (Expenses) Revenue and Changes in
Net AssetsOperating Capital
Charges for Grants and Grants and GovernmentalExpenses Services Contributions Contributions Activities
Functions/Programs
Governmental activities:Instruction:
Regular education 289,527,210$ 1,470,601$ 64,030,416$ 46,732,555$ (177,293,638)$ Special education 94,112,101 - 47,398,156 - (46,713,945)
Total Instruction 383,639,311 1,470,601 111,428,572 46,732,555 (224,007,583)
Support servicesAdministration 15,340,652 - 1,658,779 67,338 (13,614,535) Mid level administration 36,620,721 - 3,636,579 - (32,984,142) Pupil personnel services 2,222,690 - 162,292 - (2,060,398) Health services 4,849,562 - - - (4,849,562) Pupil transportation 35,423,950 - 10,913,056 770,891 (23,740,003) Operation of plant 38,716,053 - - 96,161 (38,619,892) Maintenance of plant and equipment 15,789,251 - 1,155,175 - (14,634,076) Community services 451,022 348,335 8,115 - (94,572) Food services 14,848,019 7,875,066 7,233,411 - 260,458 Interest on long-term debt 512,108 - - - (512,108) Depreciation - unallocated 87,419 - - - (87,419)
Total Support Services 164,861,447 8,223,401 24,767,407 934,390 (130,936,249)
Total governmental activities 548,500,758$ 9,694,002$ 136,195,979$ 47,666,945$ (354,943,832)
General revenues: Local appropriations 211,067,388 State Aid - unrestricted 140,638,081 Federal Aid - unrestricted 695,554 Miscellaneous 3,960,060 Unrestricted investment earnings 43,075 Total general revenues 356,404,158
Change in net assets 1,460,326
Net assets - beginning of year 458,558,538
Net assets - end of year 460,018,864$
Program Revenues
FOR THE FISCAL YEAR ENDED JUNE 30, 2011
28
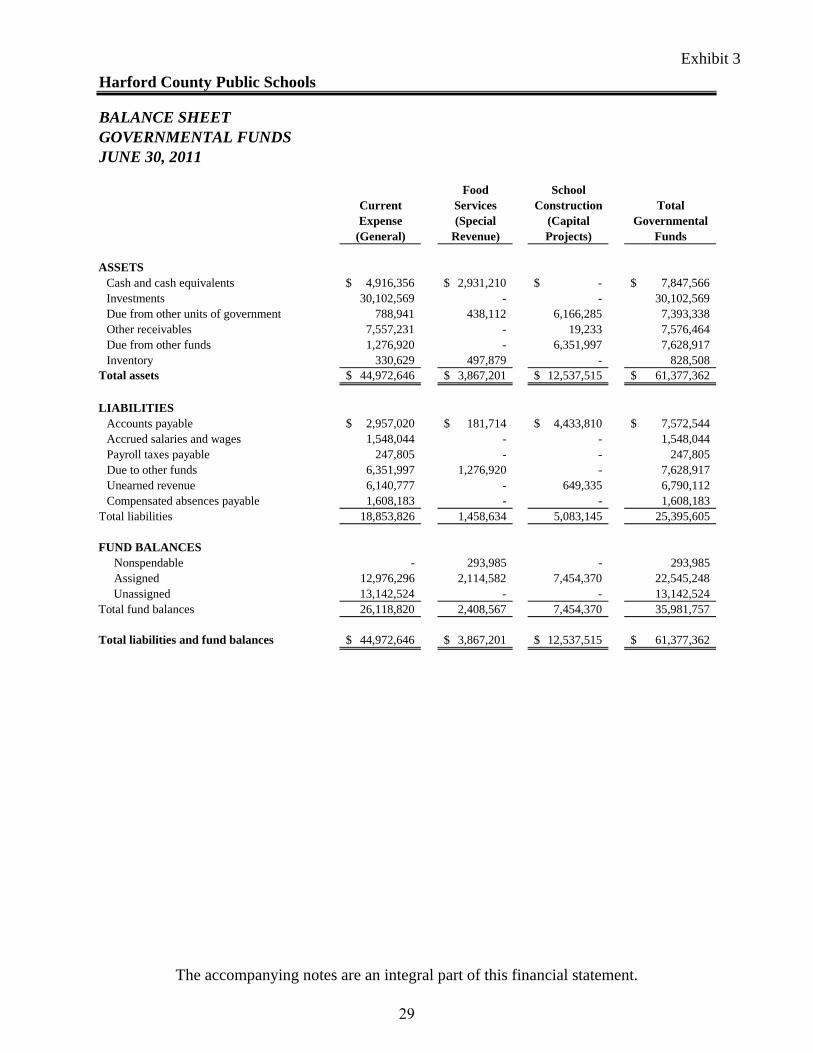
Exhibit 3
The accompanying notes are an integral part of this financial statement.
Food SchoolCurrent Services Construction TotalExpense (Special (Capital Governmental
(General) Revenue) Projects) Funds
Cash and cash equivalents 4,916,356$ 2,931,210$ -$ 7,847,566$ Investments 30,102,569 - - 30,102,569 Due from other units of government 788,941 438,112 6,166,285 7,393,338 Other receivables 7,557,231 - 19,233 7,576,464 Due from other funds 1,276,920 - 6,351,997 7,628,917 Inventory 330,629 497,879 - 828,508
Total assets 44,972,646$ 3,867,201$ 12,537,515$ 61,377,362$
Accounts payable 2,957,020$ 181,714$ 4,433,810$ 7,572,544$ Accrued salaries and wages 1,548,044 - - 1,548,044 Payroll taxes payable 247,805 - - 247,805 Due to other funds 6,351,997 1,276,920 - 7,628,917 Unearned revenue 6,140,777 - 649,335 6,790,112 Compensated absences payable 1,608,183 - - 1,608,183
Total liabilities 18,853,826 1,458,634 5,083,145 25,395,605
Nonspendable - 293,985 - 293,985 Assigned 12,976,296 2,114,582 7,454,370 22,545,248 Unassigned 13,142,524 - - 13,142,524
Total fund balances 26,118,820 2,408,567 7,454,370 35,981,757
Total liabilities and fund balances 44,972,646$ 3,867,201$ 12,537,515$ 61,377,362$
LIABILITIES
FUND BALANCES
JUNE 30, 2011
Harford County Public Schools
BALANCE SHEETGOVERNMENTAL FUNDS
ASSETS
29

Exhibit 4
The accompanying notes are an integral part of this financial statement.
Total fund balances - governmental funds (Exhibit 3) 35,981,757$
Amounts reported for governmental activities in the statement of net assets aredifferent because:
Capital assets used in governmental activities are not financial resources and therefore are not reported as assets in governmental funds. The cost of these 570,807,038 assets is $707,518,269 and the accumulated depreciation is $136,711,231.
Long-term liabilities are not due and payable from current resources and thereforeare not reported as liabilities in the funds. Long-term liabilities at year end consistof compensated absences payable ($26,856,188), an obligation under capital lease ($9,972,928) and Net OPEB Obligation ($109,940,815). (146,769,931)
Total net assets - governmental activities (Exhibit 1) 460,018,864$
JUNE 30, 2011
Harford County Public Schools
RECONCILIATION OF THE GOVERNMENTAL FUNDS BALANCE SHEET TO THESTATEMENT OF NET ASSETS
30
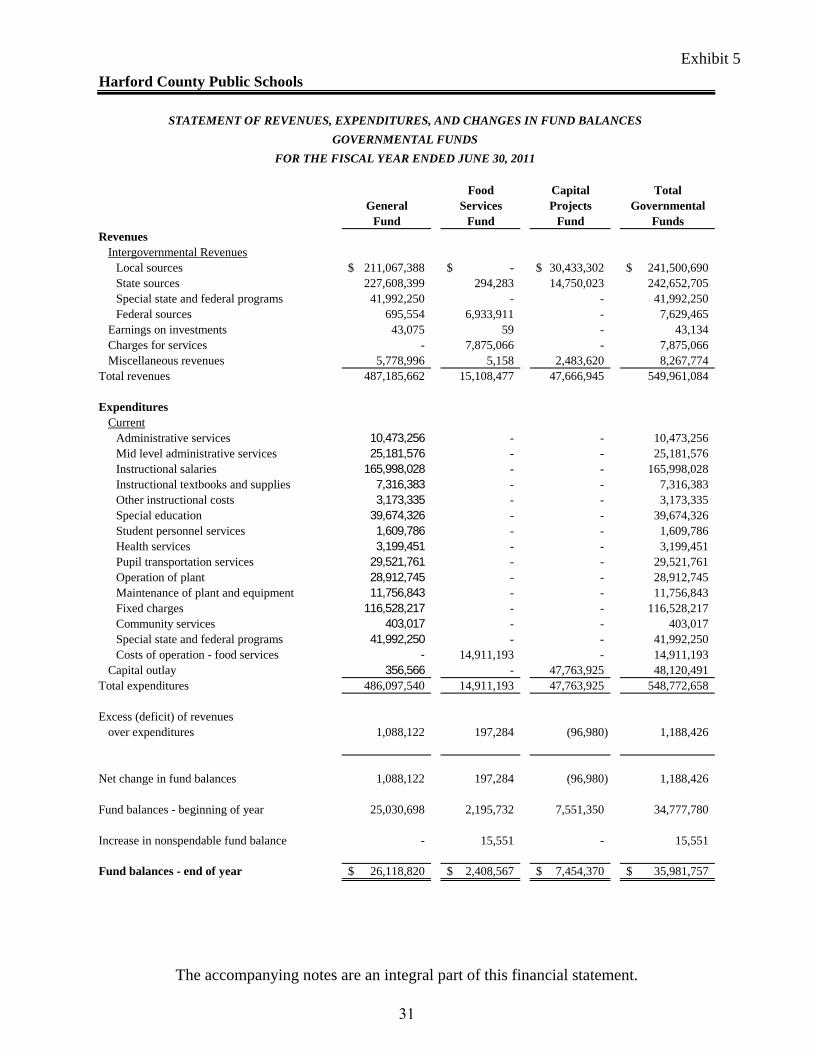
Exhibit 5
The accompanying notes are an integral part of this financial statement.
Food Capital TotalGeneral Services Projects Governmental
Fund Fund Fund FundsRevenues
Intergovernmental RevenuesLocal sources 211,067,388$ -$ 30,433,302$ 241,500,690$ State sources 227,608,399 294,283 14,750,023 242,652,705 Special state and federal programs 41,992,250 - - 41,992,250 Federal sources 695,554 6,933,911 - 7,629,465
Earnings on investments 43,075 59 - 43,134 Charges for services - 7,875,066 - 7,875,066 Miscellaneous revenues 5,778,996 5,158 2,483,620 8,267,774
Total revenues 487,185,662 15,108,477 47,666,945 549,961,084
ExpendituresCurrent
Administrative services 10,473,256 - - 10,473,256 Mid level administrative services 25,181,576 - - 25,181,576 Instructional salaries 165,998,028 - - 165,998,028 Instructional textbooks and supplies 7,316,383 - - 7,316,383 Other instructional costs 3,173,335 - - 3,173,335 Special education 39,674,326 - - 39,674,326 Student personnel services 1,609,786 - - 1,609,786 Health services 3,199,451 - - 3,199,451 Pupil transportation services 29,521,761 - - 29,521,761 Operation of plant 28,912,745 - - 28,912,745 Maintenance of plant and equipment 11,756,843 - - 11,756,843 Fixed charges 116,528,217 - - 116,528,217 Community services 403,017 - - 403,017 Special state and federal programs 41,992,250 - - 41,992,250 Costs of operation - food services - 14,911,193 - 14,911,193
Capital outlay 356,566 - 47,763,925 48,120,491 Total expenditures 486,097,540 14,911,193 47,763,925 548,772,658
Excess (deficit) of revenuesover expenditures 1,088,122 197,284 (96,980) 1,188,426
Net change in fund balances 1,088,122 197,284 (96,980) 1,188,426
Fund balances - beginning of year 25,030,698 2,195,732 7,551,350 34,777,780
Increase in nonspendable fund balance - 15,551 - 15,551
Fund balances - end of year 26,118,820$ 2,408,567$ 7,454,370$ 35,981,757$
FOR THE FISCAL YEAR ENDED JUNE 30, 2011
Harford County Public Schools
STATEMENT OF REVENUES, EXPENDITURES, AND CHANGES IN FUND BALANCESGOVERNMENTAL FUNDS
31

Exhibit 6
The accompanying notes are an integral part of this financial statement.
Total net change in fund balances - governmental funds (Exhibit 5) 1,188,426$
Amounts reported for governmental activities in the statement of activities are different because:
Capital outlays are reported in governmental funds as expenditures. However, in the statement ofactivities, the cost of those assets is allocated over their estimated useful lives as depreciationexpense. This is the amount by which capitalized capital outlay ( $39,436,255 ) exceeds depreciationexpense ( $ 12,439,769 ) and loss on disposal of assets ($46,167). 26,950,319
Capital lease provides current financial resources to government funds but increases long-term liabilities in the statement of net assets. Repayment of long-term debt is reported as an expenditure in governmental funds, but the repayment reduces long-term liabilities in the statement of net assets. In the current year, the net effect of capital lease borrowings 311,714 and repayment was $311,714.
In the statement of activities, compensated absences are measured by the amounts earned duringthe year. In the governmental funds, however, expenditures for compensated absences aremeasured by the amount of financial resources used (essentially, the amounts actually paid or expected to be paid within one year) This year, vacation and sick leave used exceeded theamounts earned by $722,316. 722,316
OPEB costs reported in the statement of activities do not require the use of current financial resources and, therefore, are not reported as expenditures in governmental funds. (27,728,000)
In the statement of activities, all inventories are charged to expense as goods are used inoperations (the consumption method). However, in the government funds, the value ofU.S.D.A. commodities is recorded as an expenditure at the time the inventory is acquired(the purchase method) and reflected as a reservation of fund balance. The increase in theamount of fund balance reserved for inventory during the year was $15,551. 15,551
Change in net assets of governmental activities (Exhibit 2) 1,460,326$
Harford County Public Schools
FOR THE YEAR ENDED JUNE 30, 2011
RECONCILIATION OF THE GOVERNMENTAL FUNDS STATEMENT OFREVENUES, EXPENDITURES, AND CHANGES IN FUND BALANCES
32

Exhibit 7
The accompanying notes are an integral part of this financial statement.
Harford County Public Schools
STATEMENT OF REVENUES, EXPENDITURES AND CHANGES IN FUND BALANCES -BUDGET (NON-GAAP BASIS) AND ACTUAL - GENERAL FUND
FOR THE FISCAL YEAR ENDED JUNE 30, 2011
Unrestricted Restricted
Variance - Variance -Original Final Favorable Original Final FavorableBudget Budget Actual (Unfavorable) Budget Budget Actual (Unfavorable)
RevenuesIntergovernmental Revenues
Local 214,061,789$ 214,061,789$ 211,067,388$ (2,994,401)$ -$ -$ -$ -$ State 199,663,261 193,518,639 193,284,423 (234,216) - - - - Federal 650,000 650,000 695,554 45,554 - - - - Special state and federal - - - - 34,722,098 49,320,762 41,571,808 (7,748,954)
Earnings on investments 150,000 150,000 31,377 (118,623) - - - - Other Sources 2,570,958 2,570,958 5,778,996 3,208,038 - - - - Fund balance at July 1, 2010 - assigned - - - - -
for fiscal year ended June 30, 2011 5,432,714 5,432,714 5,432,714 - - - - - Total revenues 422,528,722$ 416,384,100$ 416,290,452 (93,648)$ 34,722,098$ 49,320,762$ 41,571,808$ (7,748,954)$
ExpendituresCurrent
Administrative services 11,334,110$ 11,239,255$ 10,395,971 843,284$ 563,882$ 925,552$ 653,379$ 272,173$ Mid-level administration 25,760,132 25,554,987 25,183,383 371,604 375,194 589,875 383,578 206,297 Instructional salaries 167,034,492 166,434,492 165,998,028 436,464 4,474,199 5,199,037 4,104,105 1,094,932 Instructional textbooks and supplies 7,969,580 7,969,580 7,623,673 345,907 775,441 1,304,734 854,313 450,421 Other instructional costs 3,347,357 3,547,357 3,088,587 458,770 1,888,384 2,814,010 1,849,342 964,668 Special education 38,960,597 39,660,597 39,615,340 45,257 18,163,703 20,764,140 16,910,043 3,854,097 Student personnel services 1,654,612 1,654,612 1,608,766 45,846 - - - - Student health services 3,334,606 3,364,606 3,193,276 171,330 - - - - Student transportation 29,291,690 29,741,690 29,521,664 220,026 23,640 59,780 62,491 (2,711) Operation of plant 31,545,767 30,960,318 28,984,446 1,975,872 - - - - Maintenance of plant 11,697,674 12,283,123 11,902,488 380,635 - - - - Fixed charges 89,715,918 83,091,296 80,892,625 2,198,671 7,896,276 16,611,448 15,733,371 878,077 Community services 520,473 520,473 403,017 117,456 - - - -
Capital outlay 361,714 361,714 356,566 5,148 561,379 1,052,186 1,021,186 31,000 Total expenditures 422,528,722$ 416,384,100$ 408,767,830 7,616,270$ 34,722,098$ 49,320,762$ 41,571,808$ 7,748,954$
Excess of revenues over expenditures 7,522,622
Transfer to health care rate stabilization fund (1,777,773)
Excess of revenues over expenditures and transfer 5,744,849
Total fund balance at July 1, 2010 16,477,503
Assigned fund balance at July 1, 2010 (recognized as revenue above) (5,432,714)
Total fund balance 16,789,638
Fund balance at June 30, 2011 - assigned (10,693,609)
Fund balance at June 30, 2011 - unassigned 6,096,029$
33

Exhibit 8
The accompanying notes are an integral part of this financial statement.
RetireeHealthPlan AgencyTrust Funds
Cash and cash equivalents 15,251,604$ 2,897,527$
Total assets 15,251,604 2,897,527.0
Scholarship funds payable - 88,704 School activity funds payable - 2,808,823
Total liabilities - 2,897,527
Net Assets
Held in trust for retiree health plan benefits 15,251,604 -
Total net assets 15,251,604$ -$
Liabilities
JUNE 30, 2011
Harford County Public Schools
STATEMENT OF FIDUCIARY NET ASSETS
Assets
34

Exhibit 9
The accompanying notes are an integral part of this financial statement.
RetireeHealthPlanTrust
Contributions 2,053,746$ Net investment portfolio results 2,248,840
Total additions 4,302,586
Administrative expenses 13,488
Total deductions 13,488
Net increase 4,289,098
Net fiduciary assets as of July 1, 2010 10,962,506
Net fiduciary assets as of June 30, 2011 15,251,604$
Harford County Public Schools
STATEMENT OF CHANGES IN FIDUCIARY NET ASSETSFOR THE FISCAL YEAR ENDED JUNE 30, 2011
Deductions
Additions
35

HARFORD COUNTY PUBLIC SCHOOLS NOTES TO FINANCIAL STATEMENTS
June 30, 2011 NOTE 1 – SUMMARY OF SIGNIFICANT ACCOUNTING POLICIES The Board of Education of Harford County (the Board) is a body politic and corporate established by the Public School Laws of Maryland. For financial reporting purposes, the Board (alternatively referred to herein as Harford County Public Schools) is a component unit of Harford County, Maryland by virtue of the County’s responsibility for levying taxes and its budgetary control over the Board of Education. Accordingly, the financial statements of the Board are included in the financial statements of Harford County. The accounting policies of Harford County Public Schools conform to generally accepted accounting principles (GAAP) for governmental units. Significant accounting policies employed by the Board are as follows: Government-Wide and Fund Financial Statements The Statement of Net Assets and the Statement of Activities report information on all of the non-fiduciary activities of Harford County Public Schools as a whole. The activities of the General Fund (Current Expense Fund), Special Revenue Fund (Food Service Fund) and Capital Projects Fund (School Construction Fund) have been presented as governmental activities in the government-wide financial statements. The Statement of Activities demonstrates the degree to which the direct expenses of a given function are offset by program revenues. Direct expenses are those that are specifically associated with a service, program or department and are therefore clearly identifiable to a particular function. Program revenues include charges paid by the recipient of the goods or services offered by the program and grants and contributions that are restricted to meeting the operational requirements of a particular program. Local appropriations, state and federal aid and other items which are not classified as program revenues are presented as general revenues of the Board. The Board has no internal service funds and interfund services provided and used are negligible and are not eliminated in the process of consolidation. Separate financial statements are provided for governmental funds and fiduciary funds, even though the latter are excluded from the government-wide financial statements. All individual governmental funds are considered to be major funds and are reported as separate columns in the fund financial statements. The Board has no proprietary funds. Measurement Focus, Basis of Accounting and Financial Statement Presentation The government-wide financial statements are reported using the economic resources measurement focus and the accrual basis of accounting. Revenues are recorded when earned and expenses are recorded when a liability is incurred, regardless of the timing of related cash flows. Local appropriations and state and federal aid are recognized as revenues in the year for which they were approved by the provider. Grants and similar items are recognized as revenues as soon as all eligibility requirements imposed by the provider have been met.
36

HARFORD COUNTY PUBLIC SCHOOLS NOTES TO FINANCIAL STATEMENTS
June 30, 2011 NOTE 1 – SUMMARY OF SIGNIFICANT ACCOUNTING POLICIES (continued) Measurement Focus, Basis of Accounting and Financial Statement Presentation (continued) Governmental fund financial statements are reported using the current financial resources measurement focus and the modified accrual basis of accounting. Revenues are recognized as soon as they are both measurable and available. Revenues are considered to be available when they are collectible within the current period or soon enough thereafter to pay liabilities of the current period. For this purpose, the Board considers revenues to be available if they are collected within sixty days of the end of the current fiscal period. Expenditures generally are recorded when a liability is incurred, as under accrual accounting. However, expenditures related to certain compensated absences are recognized when the obligations are expected to be liquidated with expendable available resources. Local appropriations and state and federal aid associated with the current fiscal period are considered to be susceptible to accrual and so have been recognized as revenues of the current fiscal period. Entitlements and shared revenues are recorded at the time of receipt or earlier if the susceptible to accrual criteria have been met. Expenditure-driven grants are recognized as revenues when the qualifying expenditures have been incurred and all other grant requirements have been met. Interfund balances account for expenditures paid in the general fund for other funds through a common system. Reimbursements are made periodically as revenues are received. Agency funds are custodial in nature and do not measure results of operations or have a measurement focus. Agency funds do, however, use the accrual basis of accounting. The Retiree Health Plan Trust Fund financial statements are reported using the economic resources measurement focus and the accrual basis of accounting. The Board reports the following funds in the fund financial statements: Governmental Funds Current Expense Fund (General Fund) - The general fund is the general operating fund of the Board. It is used to account for all financial resources except those required to be accounted for in another fund. Special state and federal programs are included in the restricted portion of this fund. Food Service Fund (Special Revenue Fund) - Special revenue funds are used to account for the proceeds of specific revenue sources (other than major capital projects) that are legally restricted to expenditures for specified purposes. School Construction Fund (Capital Projects Fund) - Capital projects funds are used to account for financial resources to be used for the acquisition or construction of major capital facilities.
37

HARFORD COUNTY PUBLIC SCHOOLS NOTES TO FINANCIAL STATEMENTS
June 30, 2011 NOTE 1 – SUMMARY OF SIGNIFICANT ACCOUNTING POLICIES (continued) Fiduciary Funds Scholarship and School Funds (Agency Fund) - Agency funds are used to account for assets held by the Board in a trustee capacity. Scholarship funds account for monies that have been donated for scholarships until awarded. The school funds account for student activities such as student clubs, yearbooks and field trips. These funds are the direct responsibility of the principals of the respective schools. Retiree Health Plan Trust Fund – This fund was established to prefund other postemployment benefits (OPEB) that the Board provides to retirees and their dependents of Harford County Public Schools. Applicability of Accounting Pronouncements The accounting policies of Harford County Public Schools conform to accounting principles generally accepted in the United States of America. Accordingly, the Board applies all applicable Governmental Accounting Standards Board (GASB) pronouncements as well as the following pronouncements issued on or before November 30, 1989, unless those pronouncements conflict with or contradict GASB pronouncements: Statements and Interpretations of the Financial Accounting Standards Board, Accounting Principles Board Opinions, and Accounting Research Bulletins. Capital Assets Capital assets, which include property, plant, equipment and infrastructure assets, are reported as governmental activities in the government wide financial statements. Capital assets are defined by the Board as assets with an initial, individual cost of more than $5,000. Capital assets are recorded at historical cost, or estimated historical cost if actual historical cost is not available. Donated capital assets are valued at their estimated fair value on the date donated. The costs of normal maintenance and repairs that do not add to the value of the asset or materially extend asset lives are not capitalized. Major outlays for capital assets and improvements are capitalized as projects are constructed. Property, plant and equipment are depreciated using the straight-line method over estimated useful lives of 20-50 years for buildings, improvements and infrastructure, and 5-20 years for equipment. Assets which have been acquired with funds received through federal grants must be used in accordance with the terms of the grant. Federal regulations require, in some cases, that the Board must reimburse the federal government for any assets which the Board retains for its own use after the termination of the grant unless otherwise provided by the grantor. Budgets and Budgetary Accounting The Board follows these procedures in establishing the budgetary data reflected in the financial statements: Budgetary compliance is measured using the budgetary basis of accounting, the purpose of which is to demonstrate compliance with the legal requirements of Harford County, the State of Maryland, and special federal and state programs.
38

HARFORD COUNTY PUBLIC SCHOOLS NOTES TO FINANCIAL STATEMENTS
June 30, 2011 NOTE 1 – SUMMARY OF SIGNIFICANT ACCOUNTING POLICIES (continued) Budgets and Budgetary Accounting (continued) The budgetary basis differs from GAAP, which is used for the fund financial statements, in that encumbrances, which represent commitments to purchase goods and services, are treated as expenditures of the current period rather than as reservations of the fund balance. The other principal difference is that under the budgetary basis, certain designations of the prior year's fund balance are treated as revenue of the current period. The Statement of Revenues, Expenditures and Changes in Fund Balances - Budget (non-GAAP basis) and Actual-General Fund is presented using the budgetary basis of accounting. Operating Budget (General Fund)
1) In early June, budget questionnaires are distributed to principals and staff members. These questionnaires and supporting documents are due in the office of the Director of Budget at the beginning of October.
2) At the regular monthly meetings in October and November, the Board will establish its
priorities for the operating budget.
3) At the regular monthly meeting in December, the Superintendent of Schools will present the recommended operating budget to the Board and the general public.
4) In January, the Board will hold a special meeting for the purpose of providing for a
public hearing on the Superintendent’s recommended operating budget.
5) At the regular monthly meeting in January, the Board will adopt an operating budget and submit the adopted operating budget to the County Executive.
6) After approval or adjustment by the County Council, the final operating budget is
approved by the Board in June.
7) Budgets are normally adopted on a basis consistent with GAAP except for the inclusion of portions of the prior year’s fund balance as revenues, the inclusion of encumbrances as expenditures and the exclusion of retirement payments made on the Board’s behalf by the State of Maryland as revenues and expenditures. Budget comparisons presented are on a non-GAAP budgetary basis.
8) Transfers may be made within the major categories by the Board of Education without
the approval of the County Council as budgetary control is at the category level.
9) Requests for transfers between major categories must be submitted to the County Council for approval or denial. No action within thirty (30) days of submission constitutes approval.
The expenditures under special state and federal programs may exceed budgeted amounts. The grants included in this category are not part of budget categories subject to the spending limitations of the operating budget. Expenditures under these programs are limited to the amounts of the respective grants.
39

HARFORD COUNTY PUBLIC SCHOOLS NOTES TO FINANCIAL STATEMENTS
June 30, 2011 NOTE 1 – SUMMARY OF SIGNIFICANT ACCOUNTING POLICIES (continued) Budgets and Budgetary Accounting (continued) Food Services Fund Budget (Special Revenue Fund) The Food Service Fund Budget is not a legally adopted budget and, therefore, a budget to actual presentation is not included in the basic financial statements. The comparison with actual revenues and expenditures is presented as a supplementary schedule to these financial statements. Revenue from Federal sources in the Food Services Fund includes $977,981 of donated commodities from the United States Department of Agriculture. Capital Budget - School Construction Fund (Capital Projects Fund) Annual budgetary comparisons to actual expenditures are not presented in the financial statements for the capital projects fund. School construction is budgeted on a project basis with funds primarily provided by Harford County and the State of Maryland. State funds are approved by the State’s interagency committee. Encumbrances Encumbrance accounting, under which purchase orders, contracts and other commitments for the expenditure of monies are recorded in order to reserve that portion of the applicable appropriation, is employed as an extension of formal budgetary integration in the General Fund, Special Revenue Fund, and Capital Projects Fund. Encumbrances outstanding at year-end are reported as reservations of fund balances since they do not constitute expenditures or liabilities. Cash and Investments
A. Cash on Hand At year end, cash on hand for petty cash and change funds was $238.
B. Deposits
As of June 30, 2011, the book and bank balances of cash were $10,744,855 and $13,749,720, respectively. The bank balance of $13,749,720 was 100% covered by Federal Depository Insurance and or collateralized with federal government backed securities held in the pledging bank’s trust department in the Board’s name. The Board has a contractual arrangement with the bank for funds to be transferred daily from investment in a repurchase agreement to cover checks as presented.
40
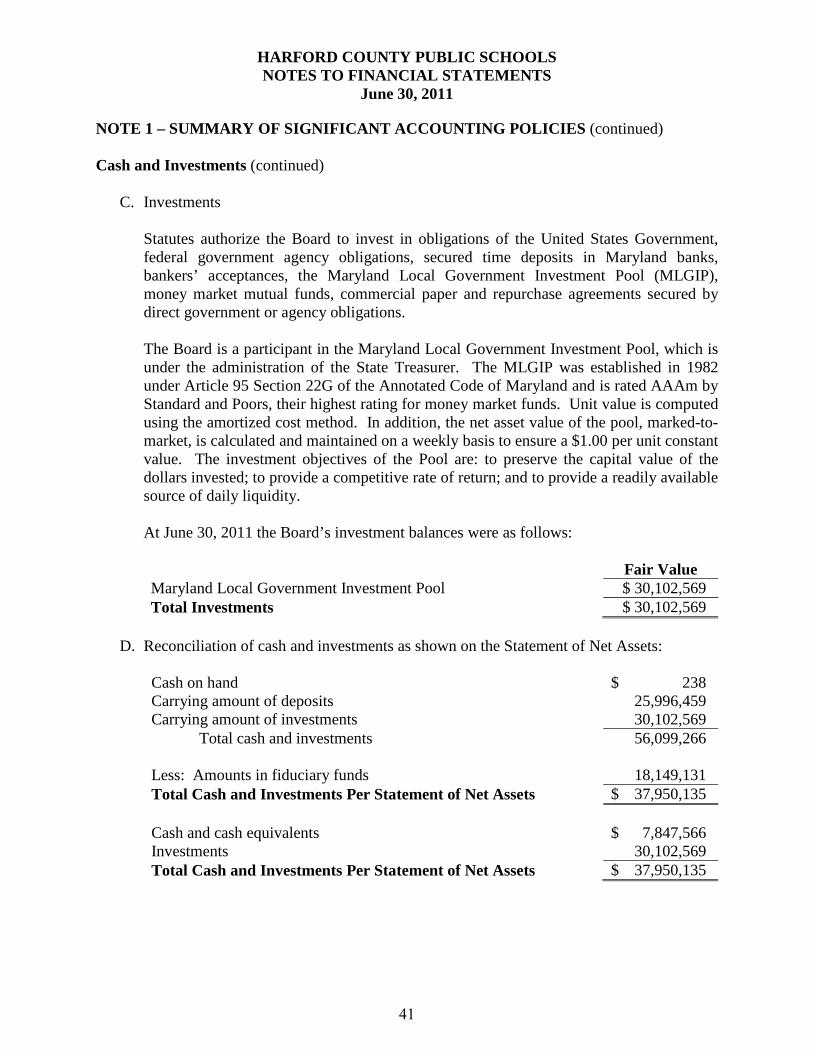
HARFORD COUNTY PUBLIC SCHOOLS NOTES TO FINANCIAL STATEMENTS
June 30, 2011 NOTE 1 – SUMMARY OF SIGNIFICANT ACCOUNTING POLICIES (continued)
Cash and Investments (continued)
C. Investments Statutes authorize the Board to invest in obligations of the United States Government, federal government agency obligations, secured time deposits in Maryland banks, bankers’ acceptances, the Maryland Local Government Investment Pool (MLGIP), money market mutual funds, commercial paper and repurchase agreements secured by direct government or agency obligations. The Board is a participant in the Maryland Local Government Investment Pool, which is under the administration of the State Treasurer. The MLGIP was established in 1982 under Article 95 Section 22G of the Annotated Code of Maryland and is rated AAAm by Standard and Poors, their highest rating for money market funds. Unit value is computed using the amortized cost method. In addition, the net asset value of the pool, marked-to-market, is calculated and maintained on a weekly basis to ensure a $1.00 per unit constant value. The investment objectives of the Pool are: to preserve the capital value of the dollars invested; to provide a competitive rate of return; and to provide a readily available source of daily liquidity. At June 30, 2011 the Board’s investment balances were as follows: Fair Value Maryland Local Government Investment Pool $ 30,102,569 Total Investments $ 30,102,569
D. Reconciliation of cash and investments as shown on the Statement of Net Assets:
Cash on hand $ 238 Carrying amount of deposits 25,996,459 Carrying amount of investments 30,102,569 Total cash and investments 56,099,266 Less: Amounts in fiduciary funds 18,149,131 Total Cash and Investments Per Statement of Net Assets $ 37,950,135 Cash and cash equivalents $ 7,847,566 Investments 30,102,569 Total Cash and Investments Per Statement of Net Assets $ 37,950,135
41
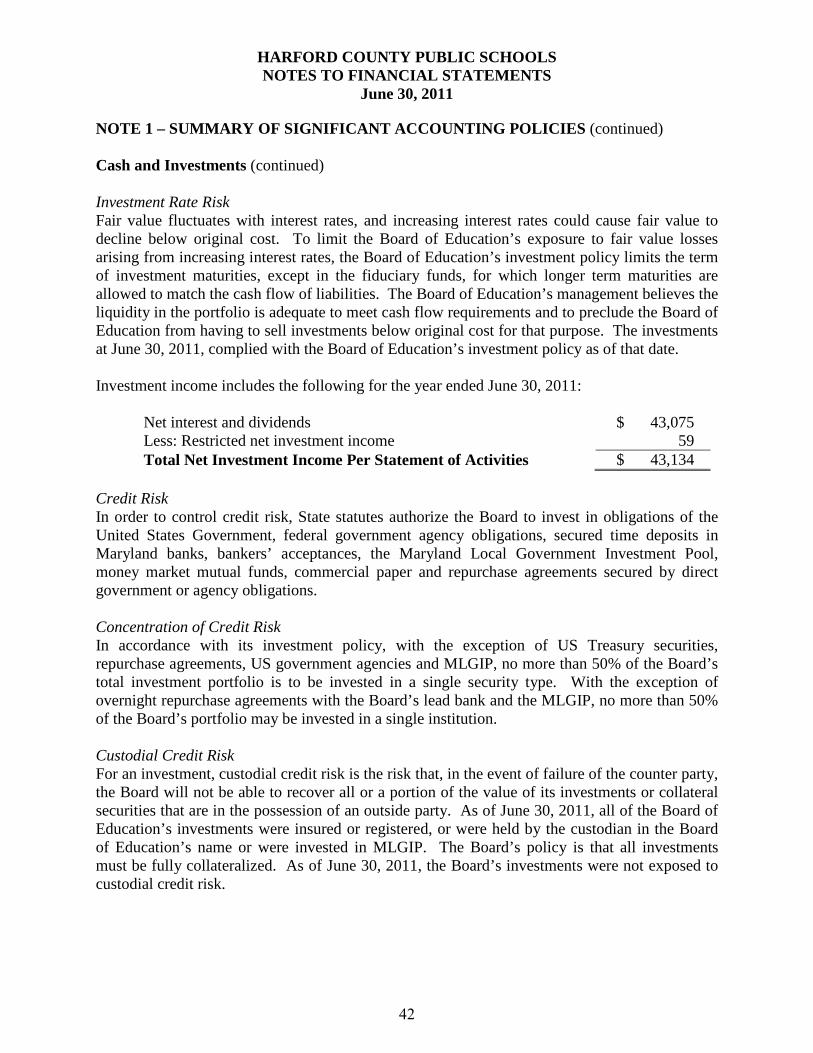
HARFORD COUNTY PUBLIC SCHOOLS NOTES TO FINANCIAL STATEMENTS
June 30, 2011 NOTE 1 – SUMMARY OF SIGNIFICANT ACCOUNTING POLICIES (continued) Cash and Investments (continued) Investment Rate Risk Fair value fluctuates with interest rates, and increasing interest rates could cause fair value to decline below original cost. To limit the Board of Education’s exposure to fair value losses arising from increasing interest rates, the Board of Education’s investment policy limits the term of investment maturities, except in the fiduciary funds, for which longer term maturities are allowed to match the cash flow of liabilities. The Board of Education’s management believes the liquidity in the portfolio is adequate to meet cash flow requirements and to preclude the Board of Education from having to sell investments below original cost for that purpose. The investments at June 30, 2011, complied with the Board of Education’s investment policy as of that date. Investment income includes the following for the year ended June 30, 2011:
Net interest and dividends $ 43,075 Less: Restricted net investment income 59 Total Net Investment Income Per Statement of Activities $ 43,134
Credit Risk In order to control credit risk, State statutes authorize the Board to invest in obligations of the United States Government, federal government agency obligations, secured time deposits in Maryland banks, bankers’ acceptances, the Maryland Local Government Investment Pool, money market mutual funds, commercial paper and repurchase agreements secured by direct government or agency obligations. Concentration of Credit Risk In accordance with its investment policy, with the exception of US Treasury securities, repurchase agreements, US government agencies and MLGIP, no more than 50% of the Board’s total investment portfolio is to be invested in a single security type. With the exception of overnight repurchase agreements with the Board’s lead bank and the MLGIP, no more than 50% of the Board’s portfolio may be invested in a single institution. Custodial Credit Risk For an investment, custodial credit risk is the risk that, in the event of failure of the counter party, the Board will not be able to recover all or a portion of the value of its investments or collateral securities that are in the possession of an outside party. As of June 30, 2011, all of the Board of Education’s investments were insured or registered, or were held by the custodian in the Board of Education’s name or were invested in MLGIP. The Board’s policy is that all investments must be fully collateralized. As of June 30, 2011, the Board’s investments were not exposed to custodial credit risk.
42
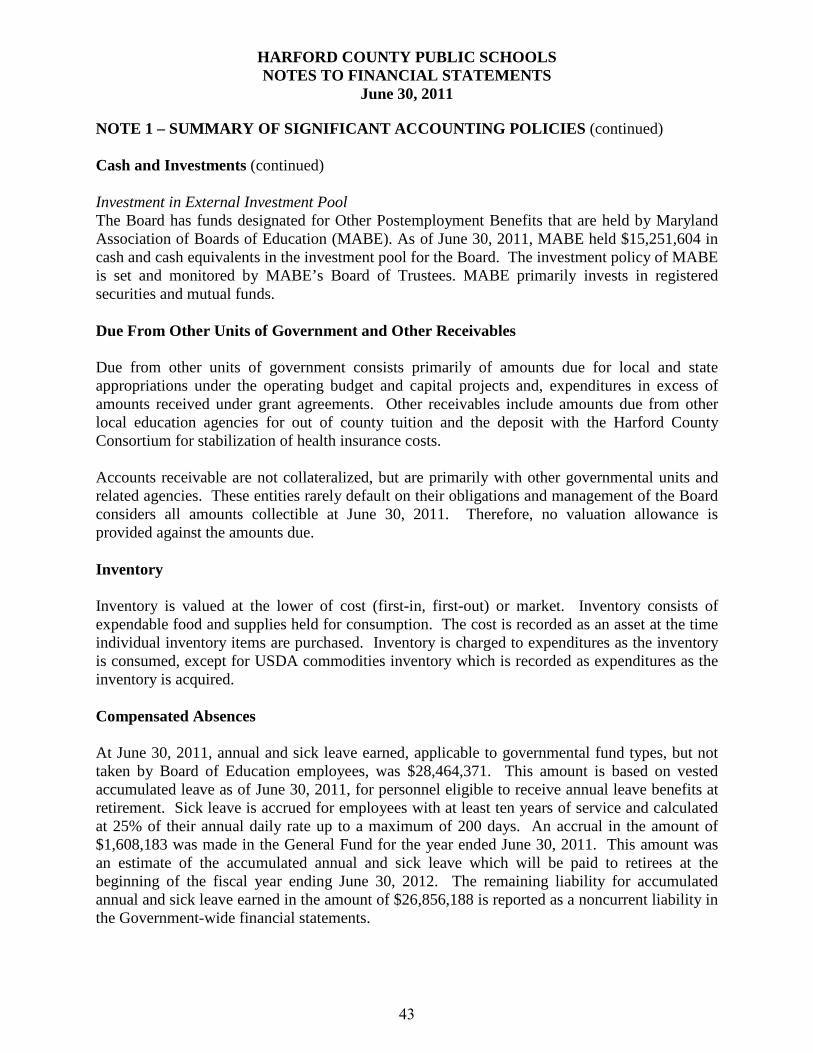
HARFORD COUNTY PUBLIC SCHOOLS NOTES TO FINANCIAL STATEMENTS
June 30, 2011 NOTE 1 – SUMMARY OF SIGNIFICANT ACCOUNTING POLICIES (continued) Cash and Investments (continued) Investment in External Investment Pool The Board has funds designated for Other Postemployment Benefits that are held by Maryland Association of Boards of Education (MABE). As of June 30, 2011, MABE held $15,251,604 in cash and cash equivalents in the investment pool for the Board. The investment policy of MABE is set and monitored by MABE’s Board of Trustees. MABE primarily invests in registered securities and mutual funds. Due From Other Units of Government and Other Receivables Due from other units of government consists primarily of amounts due for local and state appropriations under the operating budget and capital projects and, expenditures in excess of amounts received under grant agreements. Other receivables include amounts due from other local education agencies for out of county tuition and the deposit with the Harford County Consortium for stabilization of health insurance costs. Accounts receivable are not collateralized, but are primarily with other governmental units and related agencies. These entities rarely default on their obligations and management of the Board considers all amounts collectible at June 30, 2011. Therefore, no valuation allowance is provided against the amounts due. Inventory Inventory is valued at the lower of cost (first-in, first-out) or market. Inventory consists of expendable food and supplies held for consumption. The cost is recorded as an asset at the time individual inventory items are purchased. Inventory is charged to expenditures as the inventory is consumed, except for USDA commodities inventory which is recorded as expenditures as the inventory is acquired. Compensated Absences At June 30, 2011, annual and sick leave earned, applicable to governmental fund types, but not taken by Board of Education employees, was $28,464,371. This amount is based on vested accumulated leave as of June 30, 2011, for personnel eligible to receive annual leave benefits at retirement. Sick leave is accrued for employees with at least ten years of service and calculated at 25% of their annual daily rate up to a maximum of 200 days. An accrual in the amount of $1,608,183 was made in the General Fund for the year ended June 30, 2011. This amount was an estimate of the accumulated annual and sick leave which will be paid to retirees at the beginning of the fiscal year ending June 30, 2012. The remaining liability for accumulated annual and sick leave earned in the amount of $26,856,188 is reported as a noncurrent liability in the Government-wide financial statements.
43

HARFORD COUNTY PUBLIC SCHOOLS NOTES TO FINANCIAL STATEMENTS
June 30, 2011 NOTE 1 – SUMMARY OF SIGNIFICANT ACCOUNTING POLICIES (continued) Net Assets and Fund Equity The difference between fund assets and liabilities is “Net Assets” on the government-wide and fiduciary fund statements and “Fund Balance” on governmental fund statements. Net Assets are classified as “Invested in Capital Assets, Net of Related Debt,” legally “Restricted” for a specific purpose or “Unrestricted” and available for appropriation for general purposes. In the governmental fund financial statements, non-spendable and restricted fund balance represent amounts that are legally restricted by outside parties for use for a specific purpose or are otherwise not available for appropriation. Committed fund balance represents amounts that are reserved for a particular purpose by the Board and would require action by the Board to release the fund balance from its commitment. Assigned fund balance represents tentative management plans that are subject to change. Use of Estimates in Preparing Financial Statements The preparation of financial statements in conformity with GAAP requires management to make estimates and assumptions that affect the reported amounts of assets and liabilities and disclosure of contingent assets and liabilities at the date of the financial statements and the reported amounts of revenues and expenditures during the reporting period. Actual results could differ from those estimates.
44

HARFORD COUNTY PUBLIC SCHOOLS NOTES TO FINANCIAL STATEMENTS
June 30, 2011 NOTE 2 - CAPITAL ASSETS Capital asset balances and activity for the year ended June 30, 2011 were as follows:
Beginning Balance
Additions
Retirements/ Reclassifi-
cations
Ending Balance
Governmental activities:
Capital assets not being depreciated: Land $ 9,672,942 $ - $ - $ 9,672,942 Construction in progress 201,713,777 31,898,924 (94,523,597) 139,089,104
Total capital assets not being depreciated 211,386,719
31,898,924
(94,523,597)
148,762,046
Capital assets being depreciated: Land improvements 9,045,370 1,865,713 1,061,674 11,972,757 Buildings 423,229,375 2,401,081 89,106,330 514,736,786 Furniture and equipment 28,969,652 3,270,537 (193,509) 32,046,680
Total capital assets being depreciated 461,244,397
7,537,331
89,974,495
558,756,223
Less accumulated depreciation for: Land improvements 3,040,755 496,826 - 3,537,581 Buildings 109,771,018 9,093,878 (4,355,594) 114,509,302 Furniture and equipment 15,962,624 2,849,065 (147,341) 18,664,348
Total accumulated depreciation 128,774,397 12,439,769 (4,502,935) 136,711,231
Total capital assets being depreciated, net 332,470,000
(4,902,438)
94,477,430
422,044,992
Governmental activities capital
assets, net $ 543,856,719
$ 26,996,486
$ (46,167)
$ 570,807,038
45
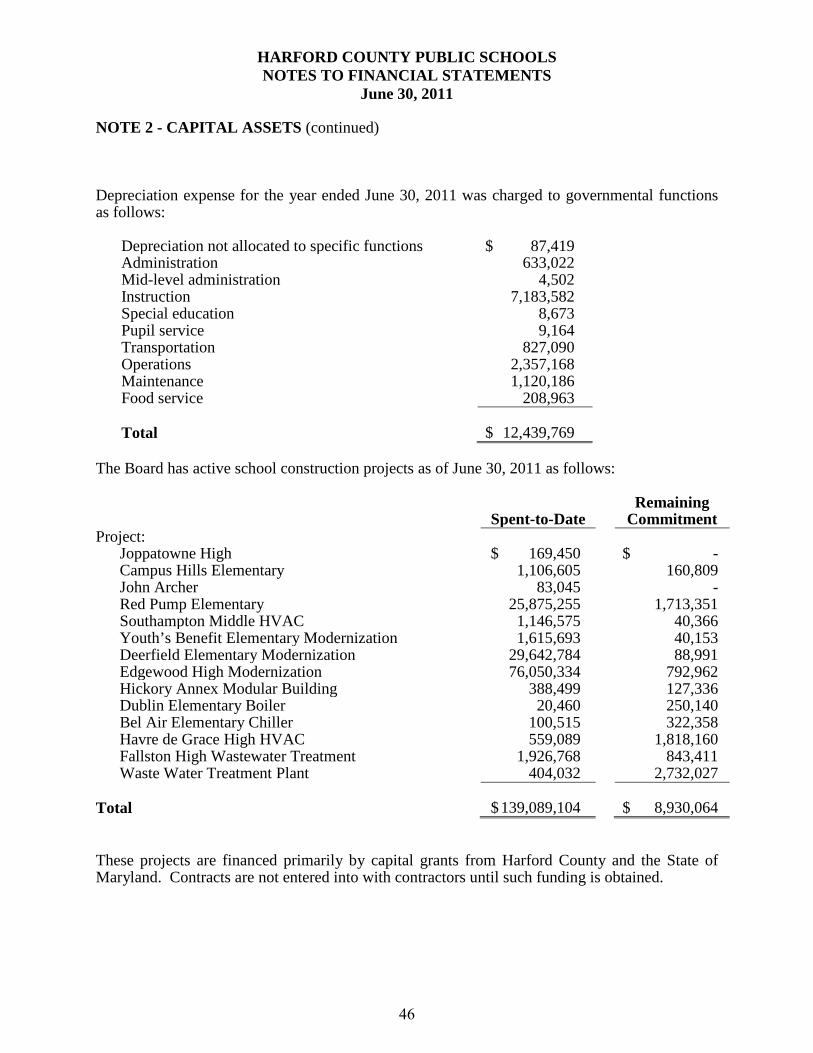
HARFORD COUNTY PUBLIC SCHOOLS NOTES TO FINANCIAL STATEMENTS
June 30, 2011 NOTE 2 - CAPITAL ASSETS (continued) Depreciation expense for the year ended June 30, 2011 was charged to governmental functions as follows:
Depreciation not allocated to specific functions $ 87,419 Administration 633,022 Mid-level administration 4,502 Instruction 7,183,582 Special education 8,673 Pupil service 9,164 Transportation 827,090 Operations 2,357,168 Maintenance 1,120,186 Food service 208,963 Total $ 12,439,769
The Board has active school construction projects as of June 30, 2011 as follows:
Spent-to-Date Remaining
Commitment Project:
Joppatowne High $ 169,450 $ - Campus Hills Elementary 1,106,605 160,809 John Archer 83,045 - Red Pump Elementary 25,875,255 1,713,351 Southampton Middle HVAC 1,146,575 40,366 Youth’s Benefit Elementary Modernization 1,615,693 40,153 Deerfield Elementary Modernization 29,642,784 88,991 Edgewood High Modernization 76,050,334 792,962 Hickory Annex Modular Building 388,499 127,336 Dublin Elementary Boiler 20,460 250,140 Bel Air Elementary Chiller 100,515 322,358 Havre de Grace High HVAC 559,089 1,818,160 Fallston High Wastewater Treatment 1,926,768 843,411
Waste Water Treatment Plant 404,032 2,732,027 Total $ 139,089,104 $ 8,930,064 These projects are financed primarily by capital grants from Harford County and the State of Maryland. Contracts are not entered into with contractors until such funding is obtained.
46
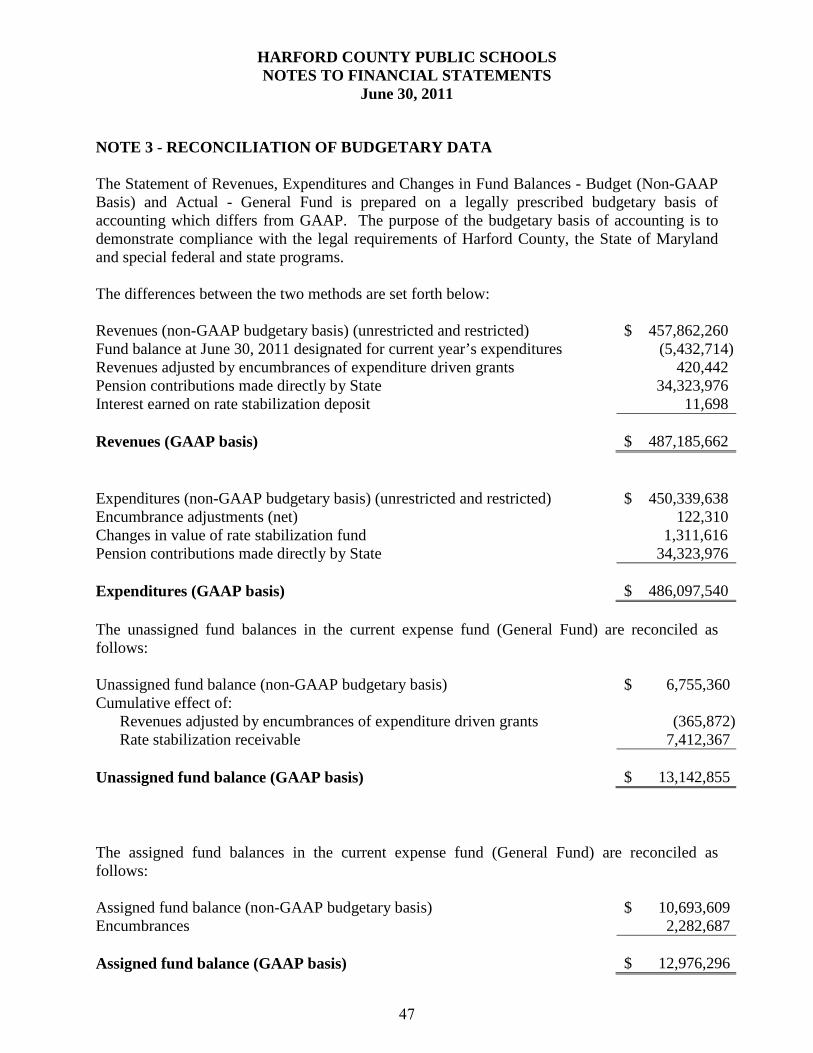
HARFORD COUNTY PUBLIC SCHOOLS NOTES TO FINANCIAL STATEMENTS
June 30, 2011 NOTE 3 - RECONCILIATION OF BUDGETARY DATA The Statement of Revenues, Expenditures and Changes in Fund Balances - Budget (Non-GAAP Basis) and Actual - General Fund is prepared on a legally prescribed budgetary basis of accounting which differs from GAAP. The purpose of the budgetary basis of accounting is to demonstrate compliance with the legal requirements of Harford County, the State of Maryland and special federal and state programs. The differences between the two methods are set forth below: Revenues (non-GAAP budgetary basis) (unrestricted and restricted) $ 457,862,260 Fund balance at June 30, 2011 designated for current year’s expenditures (5,432,714) Revenues adjusted by encumbrances of expenditure driven grants 420,442 Pension contributions made directly by State 34,323,976 Interest earned on rate stabilization deposit 11,698 Revenues (GAAP basis) $ 487,185,662 Expenditures (non-GAAP budgetary basis) (unrestricted and restricted) $ 450,339,638 Encumbrance adjustments (net) 122,310 Changes in value of rate stabilization fund 1,311,616 Pension contributions made directly by State 34,323,976 Expenditures (GAAP basis) $ 486,097,540 The unassigned fund balances in the current expense fund (General Fund) are reconciled as follows: Unassigned fund balance (non-GAAP budgetary basis) $ 6,755,360 Cumulative effect of: Revenues adjusted by encumbrances of expenditure driven grants (365,872) Rate stabilization receivable 7,412,367 Unassigned fund balance (GAAP basis) $ 13,142,855 The assigned fund balances in the current expense fund (General Fund) are reconciled as follows: Assigned fund balance (non-GAAP budgetary basis) $ 10,693,609 Encumbrances 2,282,687 Assigned fund balance (GAAP basis) $ 12,976,296
47

HARFORD COUNTY PUBLIC SCHOOLS NOTES TO FINANCIAL STATEMENTS
June 30, 2011 NOTE 4 - FUND BALANCES Non-spendable and assigned fund balances as of June 30, 2011: General Fund
Assigned Fund Balance Encumbrances $ 2,282,687 Fiscal year 2012 expenditures 8,294,472 Fiscal year 2012 OPEB contribution 258,971 Future health insurance call 1,225,166 Emergency fuel reserve 915,000 Total $ 12,976,296 Food Services
Fund
Nonspendable Fund Balance Inventory – U.S.D.A. $ 293,985 Total $ 293,985 Non-spendable fund balance reports resources that cannot be spent because of their form, or due to legal or contractual requirements. Committed fund balance reports resources with self-imposed limitation approved by the Board to the end of the period. Formal action is required to remove or modify a constraint reflected in the committed fund balance. There were no committed fund balances as of June 30, 2011. Assigned fund balance records the portion of fund balance that reflects the Board’s intended use of resources. Assigned fund balance can be established by either the Board or Assistant Superintendent of Business Services. Unlike committed fund balance, formal action is not required to impose, remove, or modify assigned fund balance.
48
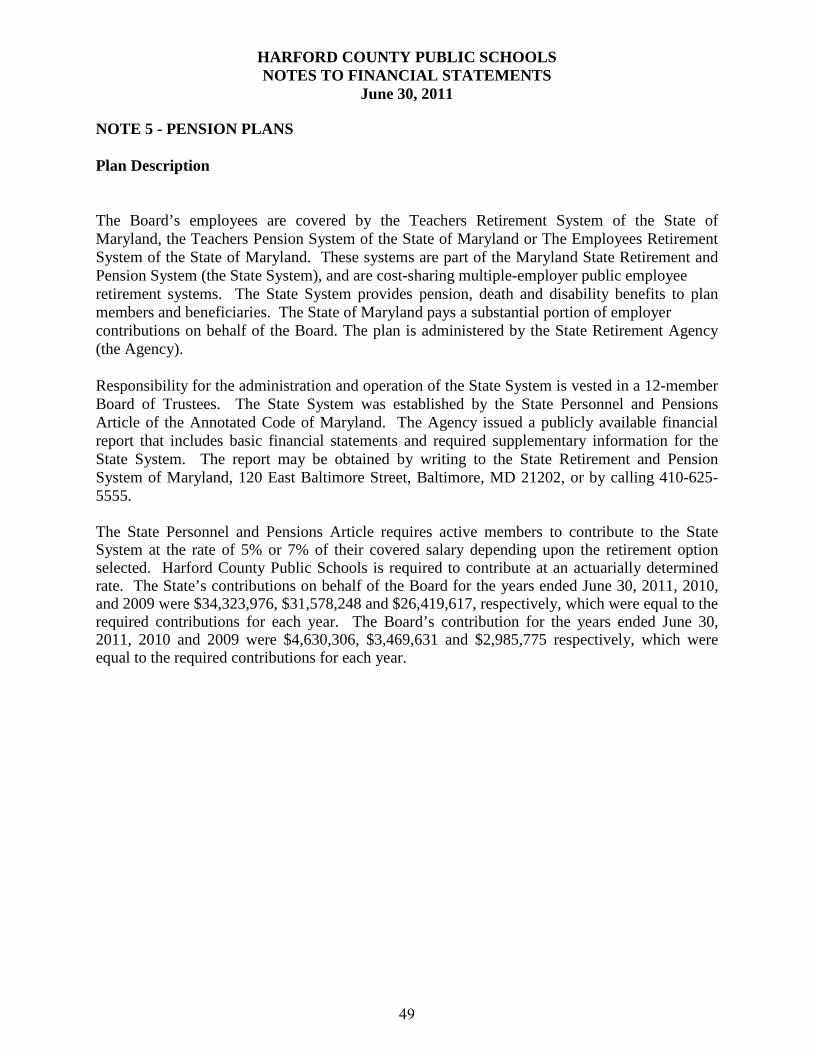
HARFORD COUNTY PUBLIC SCHOOLS NOTES TO FINANCIAL STATEMENTS
June 30, 2011 NOTE 5 - PENSION PLANS Plan Description The Board’s employees are covered by the Teachers Retirement System of the State of Maryland, the Teachers Pension System of the State of Maryland or The Employees Retirement System of the State of Maryland. These systems are part of the Maryland State Retirement and Pension System (the State System), and are cost-sharing multiple-employer public employee retirement systems. The State System provides pension, death and disability benefits to plan members and beneficiaries. The State of Maryland pays a substantial portion of employer contributions on behalf of the Board. The plan is administered by the State Retirement Agency (the Agency). Responsibility for the administration and operation of the State System is vested in a 12-member Board of Trustees. The State System was established by the State Personnel and Pensions Article of the Annotated Code of Maryland. The Agency issued a publicly available financial report that includes basic financial statements and required supplementary information for the State System. The report may be obtained by writing to the State Retirement and Pension System of Maryland, 120 East Baltimore Street, Baltimore, MD 21202, or by calling 410-625-5555. The State Personnel and Pensions Article requires active members to contribute to the State System at the rate of 5% or 7% of their covered salary depending upon the retirement option selected. Harford County Public Schools is required to contribute at an actuarially determined rate. The State’s contributions on behalf of the Board for the years ended June 30, 2011, 2010, and 2009 were $34,323,976, $31,578,248 and $26,419,617, respectively, which were equal to the required contributions for each year. The Board’s contribution for the years ended June 30, 2011, 2010 and 2009 were $4,630,306, $3,469,631 and $2,985,775 respectively, which were equal to the required contributions for each year.
49

HARFORD COUNTY PUBLIC SCHOOLS NOTES TO FINANCIAL STATEMENTS
June 30, 2011 NOTE 6 - POSTEMPLOYMENT BENEFITS OTHER THAN PENSION BENEFITS The Board provides medical, dental and life insurance benefits to eligible employees who retire from employment with the Harford County Public School System. The employer’s contributions are financed on a pay-as-you-go basis, and the future payment of these benefits is contingent upon the annual approval of the operating budget. Details of the postemployment benefits provided are as follows:
Medical Benefits - Retirees are eligible for continued membership in one of the school system’s group medical plans provided that they have at least 10 years service with the Harford County Public Schools and are under 65 years of age. The school system pays premiums for these plans limited to 80% or 90% based on the health plan chosen. Supplemental coverage for retirees 65 years of age and older are also paid up to 90% of premiums for such coverage. The medical benefits paid by the Board for the year ended June 30, 2011 was $15,360,571. As of June 30, 2011, 1,896 of approximately 2,082 eligible participants were receiving benefits.
Dental Benefits - The Board pays 90% of dental coverage for retirees with at least 10 years service. The dental benefits paid by the Board for the year ended June 30, 2011 was $813,030. As of June 30, 2011, 1,914 of approximately 2,082 eligible participants were receiving benefits.
Life Insurance Benefits - The Board pays 90% of the life insurance premiums for retirees with at least 10 years of service with the amount of insurance coverage reducing from $20,000 upon retirement to $10,000 five years after retirement. The life insurance benefits paid by the Board for the year ended June 30, 2011 was $227,301. As of June 30, 2011, 1,814 of approximately 2,082 eligible participants were receiving benefits.
Annual OPEB Cost and Net OPEB Obligation The Board's annual other postemployment benefit (OPEB) cost (expense) is calculated based on the annual required contribution of the employer (ARC), an amount actuarially determined in accordance with the parameters of GASB Statement 45. The ARC represents a level of funding that, if paid on an ongoing basis, is projected to cover normal cost each year and amortize any unfunded actuarial liabilities (or funding excess) over a period not to exceed thirty years. The following table shows the components of the Board's annual OPEB cost for the year, the amount actually contributed to the plan, and changes in the Board's net OPEB obligation:
Annual required contribution $ 46,040,000
Interest on net OPEB obligation 3,700,000
Amortization of net OPEB obligation (3,704,000)
Annual OPEB cost (expense) 46,036,000
Contributions made 18,308,000
Increase in net OPEB obligation 27,728,000
Net OPEB obligation - beginning of year 82,212,815
Net OPEB obligation - end of year $ 109,940,815
50
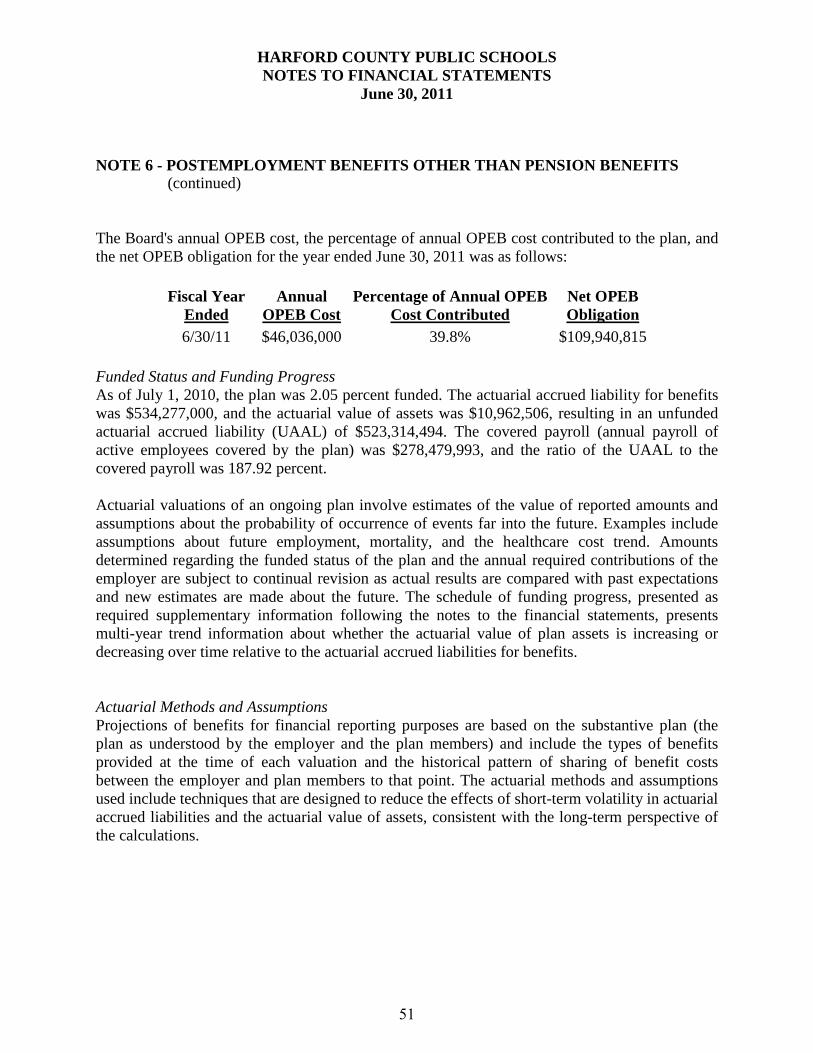
HARFORD COUNTY PUBLIC SCHOOLS NOTES TO FINANCIAL STATEMENTS
June 30, 2011 NOTE 6 - POSTEMPLOYMENT BENEFITS OTHER THAN PENSION BENEFITS (continued) The Board's annual OPEB cost, the percentage of annual OPEB cost contributed to the plan, and the net OPEB obligation for the year ended June 30, 2011 was as follows:
Fiscal Year Ended
Annual OPEB Cost
Percentage of Annual OPEB Cost Contributed
Net OPEB Obligation
6/30/11 $46,036,000 39.8% $109,940,815 Funded Status and Funding Progress As of July 1, 2010, the plan was 2.05 percent funded. The actuarial accrued liability for benefits was $534,277,000, and the actuarial value of assets was $10,962,506, resulting in an unfunded actuarial accrued liability (UAAL) of $523,314,494. The covered payroll (annual payroll of active employees covered by the plan) was $278,479,993, and the ratio of the UAAL to the covered payroll was 187.92 percent. Actuarial valuations of an ongoing plan involve estimates of the value of reported amounts and assumptions about the probability of occurrence of events far into the future. Examples include assumptions about future employment, mortality, and the healthcare cost trend. Amounts determined regarding the funded status of the plan and the annual required contributions of the employer are subject to continual revision as actual results are compared with past expectations and new estimates are made about the future. The schedule of funding progress, presented as required supplementary information following the notes to the financial statements, presents multi-year trend information about whether the actuarial value of plan assets is increasing or decreasing over time relative to the actuarial accrued liabilities for benefits. Actuarial Methods and Assumptions Projections of benefits for financial reporting purposes are based on the substantive plan (the plan as understood by the employer and the plan members) and include the types of benefits provided at the time of each valuation and the historical pattern of sharing of benefit costs between the employer and plan members to that point. The actuarial methods and assumptions used include techniques that are designed to reduce the effects of short-term volatility in actuarial accrued liabilities and the actuarial value of assets, consistent with the long-term perspective of the calculations.
51

HARFORD COUNTY PUBLIC SCHOOLS NOTES TO FINANCIAL STATEMENTS
June 30, 2011 NOTE 6 - POSTEMPLOYMENT BENEFITS OTHER THAN PENSION BENEFITS (continued) Significant valuation methods and assumptions are as follows:
Valuation Date July 1, 2010 Actuarial Cost Method Projected Unit Credit method Amortization Method Level percentage of projected pay over a 28-year period Asset Valuation Method Market value Actuarial Assumptions: Discount Rate 4.50% Investment Rate of Return 8.00% per year compounded annually Payroll Growth Rate 3% Healthcare Cost Trend Rates: Medical and prescription 8.00% initial year of valuation (not applicable to Life) 4.2% final year of valuation (not applicable to Life) Dental 5.0%
The actuarial value of assets was determined using market value of assets. The trust is assumed to earn 8% interest and contributions are assumed to be made in the middle of the year. The unfunded liability was amortized over a closed period of 28 years using level percentage of pay for FY11.
Schedule of Funding Progress
Valuation Date
Value of Assets
Accrued Liability (AAL)
Unfunded AAL (UAAL)
Funded Ratio
Covered Payroll
UAAL as a % of Covered
Payroll
June 30, 2008 $ 12,136,368 $ 361,962,000 $ 349,825,632 3.35% $ 274,153,946 127.60% July 1, 2008 12,136,368 589,795,000 577,658,632 2.06% 278,038,509 207.76% July 1, 2009 10,233,348 626,155,000 615,921,652 1.63% 278,636,614 221.05% July 1, 2010 10,962,506 534,277,000 523,314,494 2.05% 278,479,993 187.92%
Valuations prior to June 30, 2008 were not valued in accordance with GASB Statement No. 43.
52
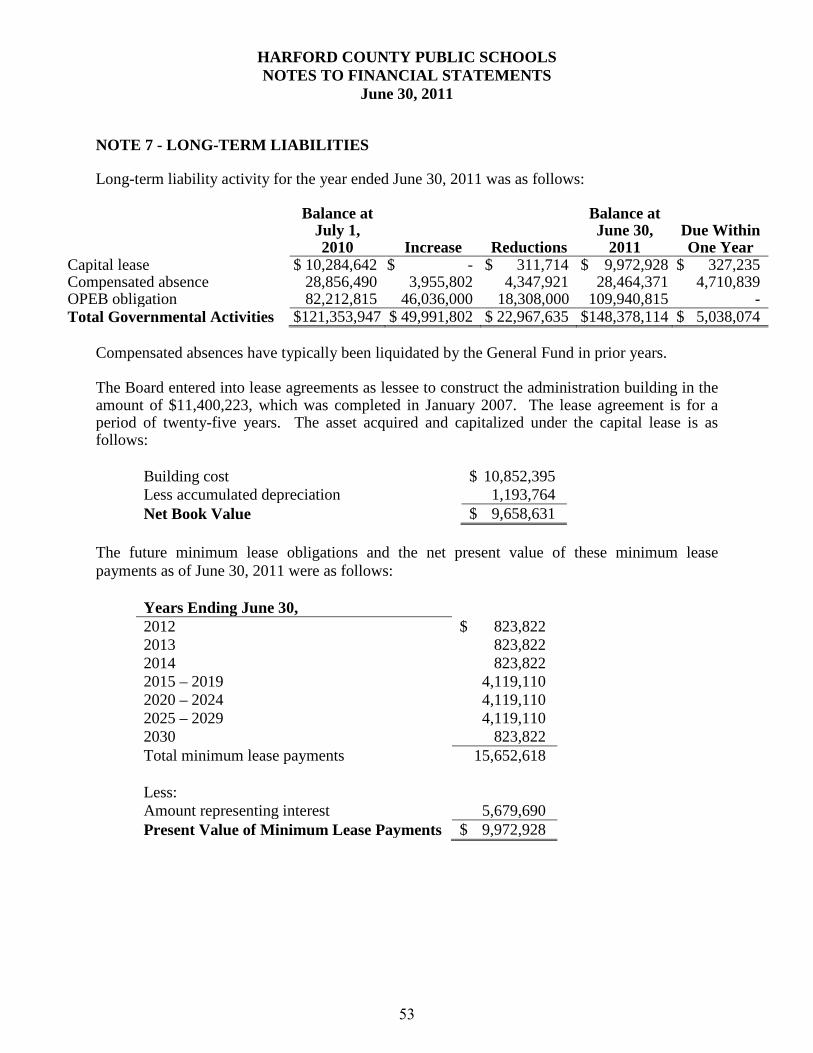
HARFORD COUNTY PUBLIC SCHOOLS NOTES TO FINANCIAL STATEMENTS
June 30, 2011 NOTE 7 - LONG-TERM LIABILITIES Long-term liability activity for the year ended June 30, 2011 was as follows:
Balance at July 1, 2010 Increase Reductions
Balance at June 30,
2011 Due Within One Year
Capital lease $ 10,284,642 $ - $ 311,714 $ 9,972,928 $ 327,235 Compensated absence 28,856,490 3,955,802 4,347,921 28,464,371 4,710,839 OPEB obligation 82,212,815 46,036,000 18,308,000 109,940,815 - Total Governmental Activities $121,353,947 $ 49,991,802 $ 22,967,635 $148,378,114 $ 5,038,074
Compensated absences have typically been liquidated by the General Fund in prior years. The Board entered into lease agreements as lessee to construct the administration building in the amount of $11,400,223, which was completed in January 2007. The lease agreement is for a period of twenty-five years. The asset acquired and capitalized under the capital lease is as follows:
Building cost $ 10,852,395 Less accumulated depreciation 1,193,764 Net Book Value $ 9,658,631
The future minimum lease obligations and the net present value of these minimum lease payments as of June 30, 2011 were as follows:
Years Ending June 30, 2012 $ 823,822 2013 823,822 2014 823,822 2015 – 2019 4,119,110 2020 – 2024 4,119,110 2025 – 2029 4,119,110 2030 823,822 Total minimum lease payments 15,652,618 Less: Amount representing interest 5,679,690 Present Value of Minimum Lease Payments $ 9,972,928
53

HARFORD COUNTY PUBLIC SCHOOLS NOTES TO FINANCIAL STATEMENTS
June 30, 2011 NOTE 8 - RISK MANAGEMENT The Board is exposed to various risks of loss related to torts; theft of, damage to, and destruction of assets; errors and omissions; injuries to employees; and natural disasters. The Board is a member of the Maryland Association of Boards of Education Group Liability Insurance Pool and the Workmen’s Compensation Self Insurance Fund. These pools are self insurance funds for the various member Maryland Boards of Education. The pools were organized for the purpose of minimizing the cost of insurance and related administrative expenses. Coverage is provided up to specified limits and Harford County Public Schools pays an annual premium for the coverage provided by those pools. In addition to general liability insurance, the Group Liability Insurance Pool also provides coverage for property liability and automobile liability. Coverage above these limits is provided by third party insurance carriers. Settled claims resulting from these risks have not exceeded commercial insurance coverage in any of the past three fiscal years. NOTE 9 - CONTINGENCIES AND COMMITMENTS The Board has also been named as defendant in several lawsuits, the outcome of which is uncertain. It is anticipated by the Board that an adverse decision on any or all of these suits would not have a material adverse effect on these financial statements. The Board leases certain properties for storage and other uses under long-term operating leases. Expenditures for rent under operating leases amounted to approximately $122,107 for the year ended June 30, 2011.
54

REQUIRED SUPPLEMENTAL INFORMATION
Student: Hanna Taylor Grade 12 Bel Air High School; Teacher Laura Crocker
55
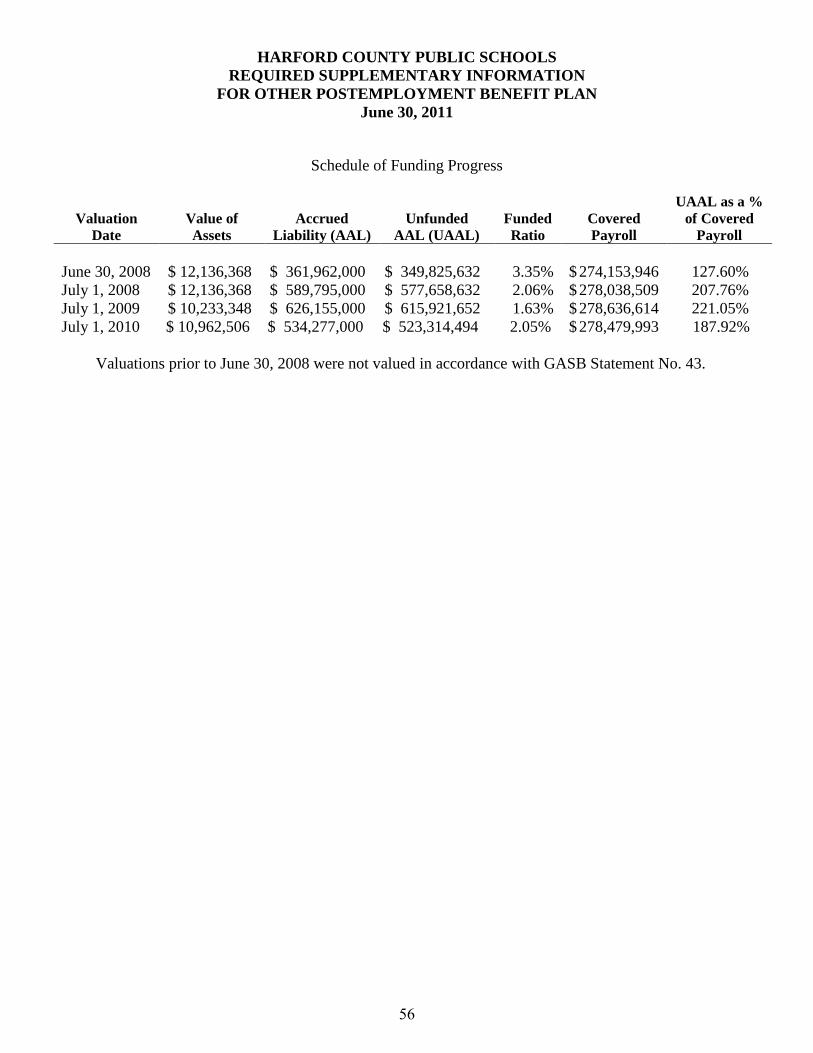
HARFORD COUNTY PUBLIC SCHOOLS REQUIRED SUPPLEMENTARY INFORMATION
FOR OTHER POSTEMPLOYMENT BENEFIT PLAN June 30, 2011
Schedule of Funding Progress
Valuation Date
Value of Assets
Accrued Liability (AAL)
Unfunded AAL (UAAL)
Funded Ratio
Covered Payroll
UAAL as a % of Covered
Payroll June 30, 2008 $ 12,136,368 $ 361,962,000 $ 349,825,632 3.35% $ 274,153,946 127.60% July 1, 2008 $ 12,136,368 $ 589,795,000 $ 577,658,632 2.06% $ 278,038,509 207.76% July 1, 2009 $ 10,233,348 $ 626,155,000 $ 615,921,652 1.63% $ 278,636,614 221.05% July 1, 2010 $ 10,962,506 $ 534,277,000 $ 523,314,494 2.05% $ 278,479,993 187.92%
Valuations prior to June 30, 2008 were not valued in accordance with GASB Statement No. 43.
56

OTHER SUPPLEMENTAL INFORMATION
Student: Mark Niedswicke Grade 8 Southampton Middle School, Teacher Sue Ellen North
57

Schedule A
Harford County Public Schools
FOOD SERVICE FUND(SPECIAL REVENUE FUND)SCHEDULE OF REVENUES, EXPENDITURES AND CHANGES INFUND BALANCE COMPARED TO BUDGET (NON-GAAP BASIS)FOR THE FISCAL YEAR ENDED JUNE 30, 2011
VarianceFavorable
Budget Actual (Unfavorable)Revenues
Cafeteria sales 8,459,585$ 7,875,066$ (584,519)$ Federal Aid
School Lunch Program 3,978,975 4,495,396 516,421 School Breakfast Program 1,070,634 1,261,525 190,891 Other Programs 98,800 199,009 100,209 U.S.D.A. Commodities 850,000 977,981 127,981
Total federal aid 5,998,409 6,933,911 935,502
State AidChild Feeding Program 318,240 294,283 (23,957)
Interest earned 25,000 59 (24,941) Miscellaneous revenues - 5,158 5,158
-
Total revenues 14,801,234$ 15,108,477 302,085
ExpendituresSalaries and wages 5,309,932 5,268,532 41,400 Contracted services 232,500 370,102 (137,602) Supplies and materials 6,261,983 6,300,309 (38,326) Other charges 1,816,509 1,850,906 (34,397) Furniture and equipment 330,310 249,881 80,429 U.S.D.A. commodities 850,000 962,430 (112,430)
Total expenditures 14,801,234$ 15,002,160 (200,926)
Deficit of revenues over expenditures 106,317 503,011$
Total fund balance at July 1, 2010 2,165,871
Increase (decrease) in nonspendable fund balance - U.S.D.A. inventory 15,551
Total fund Balance 2,287,739 Nonspendable fund balance - U.S.D.A. inventory - end of year (293,985) Fund balance at June 30, 2011 - unassigned 1,993,754$
58

Schedule B
Harford County Public Schools
SCHOOL CONSTRUCTION FUND(CAPITAL PROJECTS FUND)
SCHEDULE OF EXPENDITURES BY PROJECTFOR THE FISCAL YEAR ENDED JUNE 30, 2011
Construction in Progress - By Project
Campus Hills Elementary 300-1901 356,141$ Red Pump Elementary 300-4901 17,756,897 Patterson Mill Middle/High School 300-8701 63,703 Aberdeen High School Addition 305-7005 115,228 Joppatowne High School Gymnasium 305-8108 2,454 Deerfield Elementary Modernization 310-2010 4,392,983 Joppatowne Elementary Modernization 310-3710 640,443 Aberdeen High North Building 310-7110 204,886 Bel Air High Modernization 310-7310 1,884,316 Edgewood High Modernization 310-7610 9,950,523 North Harford High Modernization 310-8010 165,481 John Archer Modernization 310-9110 16,972 Prospect Mill Elem. Remedial Capacity Renovations 315-2915 15,903 North Harford Middle Renovations 315-8315 21,500 Technology Education Lab Refresh 315-9017 73,664 Music Technology Labs 315-9019 1,338 Data Center Air Conditioning 325-0183 3,844 Ring Factory Elementary Roof 325-4525 246,894 Southampton Middle HVAC 325-7468 529,542 Havre de Grace High HVAC 325-7868 562,460 Fallston High Roof 325-8225 114,099 North Harford Middle School HVAC 325-8368 24,780 Roofing Projects 325-9025 908 Harford Technical High School Athletic Fields 330-0462 41,664 Bel Air Elementary Improvements 330-1432 413,470 Board of Education Dais 340-0144 17,703 Relocatables 340-9041 456,695 Technology Wiring 350-9051 10,295 Technology Refresh 350-9057 2,940,507 Integrated Business Systems 350-9058 67,338 Bel Air Elementary Chiller 360-1463 100,515 Dublin Elementary Boiler 360-2273 20,460 Fallston High Waste Water Treatment Plant 360-8276 742,411 Environmental Compliance 360-9065 78,208 Alarms 360-9074 19,722 Maintenance Replacement Vehicles 360-9075 500,616 Septic Pretreat Facility 360-9077 1,482,363 Backflow Prevention 360-9078 73,886 Storm Water Management, Erosion and Sediment Control 360-9079 105,679 ADA Improvements 360-9080 69,303 Paving - New 360-9081 16,745 Paving - Overlay and Maintenance 360-9082 1,000,000 Bleachers 360-9084 73,825 Building Envelope Improvements 360-9085 184,085 Athletic Fields 360-9162 67,548 HVAC Major Repairs 360-9968 304,392 William S. James Elementary Playground 390-1395 59,474 Abingdon Elementary Playground 390-2395 88,458 Fountain Green Elementary Playground 390-2795 83,520 Forest Lakes Elementary Playgound 390-2895 53,519 Hickory Elementary Playground 390-3395 85,627 North Harford Elementary Playground 390-4495 88,022 Furniture 390-9092 134,396 Buses 390-9096 482,097 Music Refresh 390-9097 22,457 Security Cameras 390-9098 157,484 Textbooks 390-9793 306,085 CTE Equipment Refresh 390-9990 127,451 Swimming Pools 391-9095 142,946
47,763,925$
59
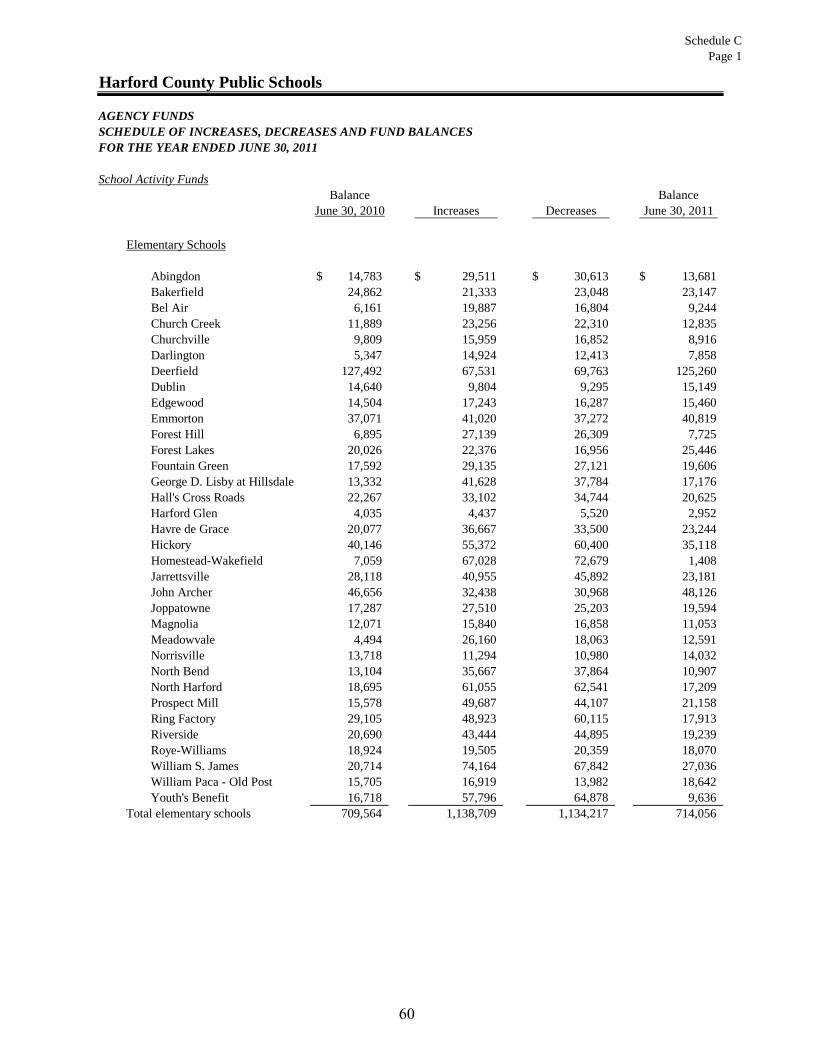
Schedule CPage 1
School Activity FundsBalance Balance
June 30, 2010 Increases Decreases June 30, 2011
Elementary Schools
Abingdon 14,783$ 29,511$ 30,613$ 13,681$ Bakerfield 24,862 21,333 23,048 23,147 Bel Air 6,161 19,887 16,804 9,244 Church Creek 11,889 23,256 22,310 12,835 Churchville 9,809 15,959 16,852 8,916 Darlington 5,347 14,924 12,413 7,858 Deerfield 127,492 67,531 69,763 125,260 Dublin 14,640 9,804 9,295 15,149 Edgewood 14,504 17,243 16,287 15,460 Emmorton 37,071 41,020 37,272 40,819 Forest Hill 6,895 27,139 26,309 7,725 Forest Lakes 20,026 22,376 16,956 25,446 Fountain Green 17,592 29,135 27,121 19,606 George D. Lisby at Hillsdale 13,332 41,628 37,784 17,176 Hall's Cross Roads 22,267 33,102 34,744 20,625 Harford Glen 4,035 4,437 5,520 2,952 Havre de Grace 20,077 36,667 33,500 23,244 Hickory 40,146 55,372 60,400 35,118 Homestead-Wakefield 7,059 67,028 72,679 1,408 Jarrettsville 28,118 40,955 45,892 23,181 John Archer 46,656 32,438 30,968 48,126 Joppatowne 17,287 27,510 25,203 19,594 Magnolia 12,071 15,840 16,858 11,053 Meadowvale 4,494 26,160 18,063 12,591 Norrisville 13,718 11,294 10,980 14,032 North Bend 13,104 35,667 37,864 10,907 North Harford 18,695 61,055 62,541 17,209 Prospect Mill 15,578 49,687 44,107 21,158 Ring Factory 29,105 48,923 60,115 17,913 Riverside 20,690 43,444 44,895 19,239 Roye-Williams 18,924 19,505 20,359 18,070 William S. James 20,714 74,164 67,842 27,036 William Paca - Old Post 15,705 16,919 13,982 18,642 Youth's Benefit 16,718 57,796 64,878 9,636
Total elementary schools 709,564 1,138,709 1,134,217 714,056
FOR THE YEAR ENDED JUNE 30, 2011
Harford County Public Schools
AGENCY FUNDSSCHEDULE OF INCREASES, DECREASES AND FUND BALANCES
60
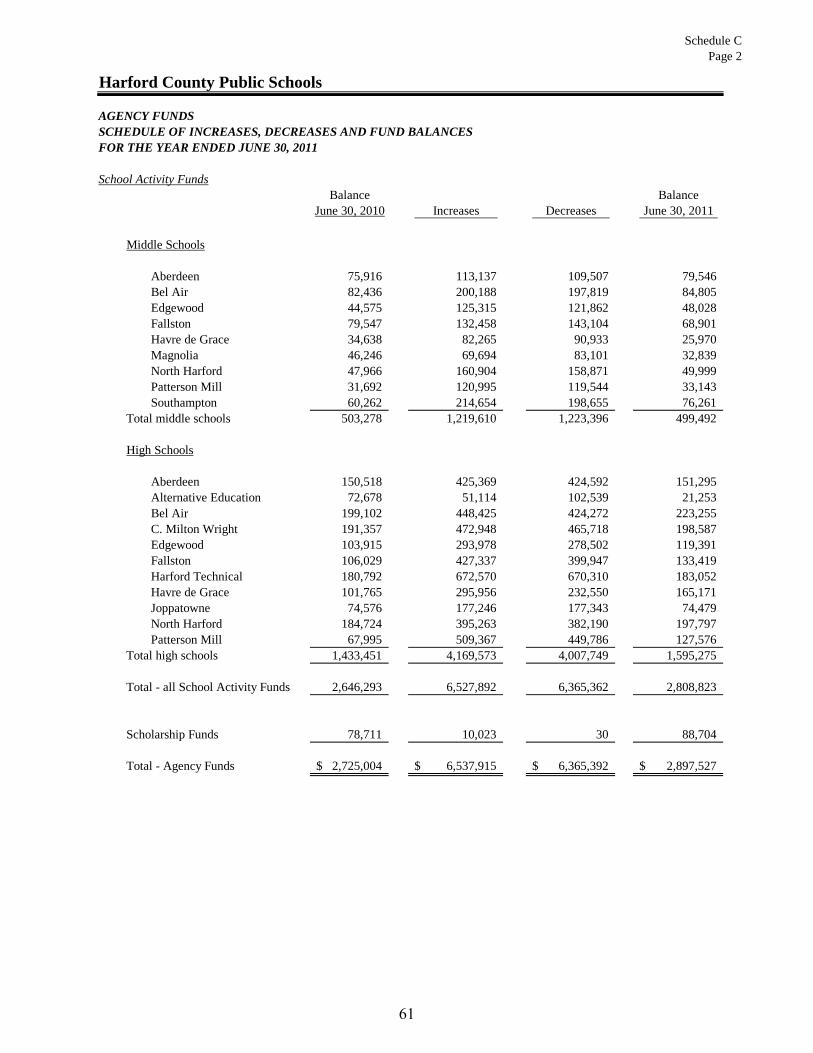
Schedule CPage 2
School Activity FundsBalance Balance
June 30, 2010 Increases Decreases June 30, 2011
FOR THE YEAR ENDED JUNE 30, 2011
Harford County Public Schools
AGENCY FUNDSSCHEDULE OF INCREASES, DECREASES AND FUND BALANCES
Middle Schools
Aberdeen 75,916 113,137 109,507 79,546 Bel Air 82,436 200,188 197,819 84,805 Edgewood 44,575 125,315 121,862 48,028 Fallston 79,547 132,458 143,104 68,901 Havre de Grace 34,638 82,265 90,933 25,970 Magnolia 46,246 69,694 83,101 32,839 North Harford 47,966 160,904 158,871 49,999 Patterson Mill 31,692 120,995 119,544 33,143 Southampton 60,262 214,654 198,655 76,261
Total middle schools 503,278 1,219,610 1,223,396 499,492
High Schools
Aberdeen 150,518 425,369 424,592 151,295 Alternative Education 72,678 51,114 102,539 21,253 Bel Air 199,102 448,425 424,272 223,255 C. Milton Wright 191,357 472,948 465,718 198,587 Edgewood 103,915 293,978 278,502 119,391 Fallston 106,029 427,337 399,947 133,419 Harford Technical 180,792 672,570 670,310 183,052 Havre de Grace 101,765 295,956 232,550 165,171 Joppatowne 74,576 177,246 177,343 74,479 North Harford 184,724 395,263 382,190 197,797 Patterson Mill 67,995 509,367 449,786 127,576
Total high schools 1,433,451 4,169,573 4,007,749 1,595,275
Total - all School Activity Funds 2,646,293 6,527,892 6,365,362 2,808,823
Scholarship Funds 78,711 10,023 30 88,704
Total - Agency Funds 2,725,004$ 6,537,915$ 6,365,392$ 2,897,527$
61
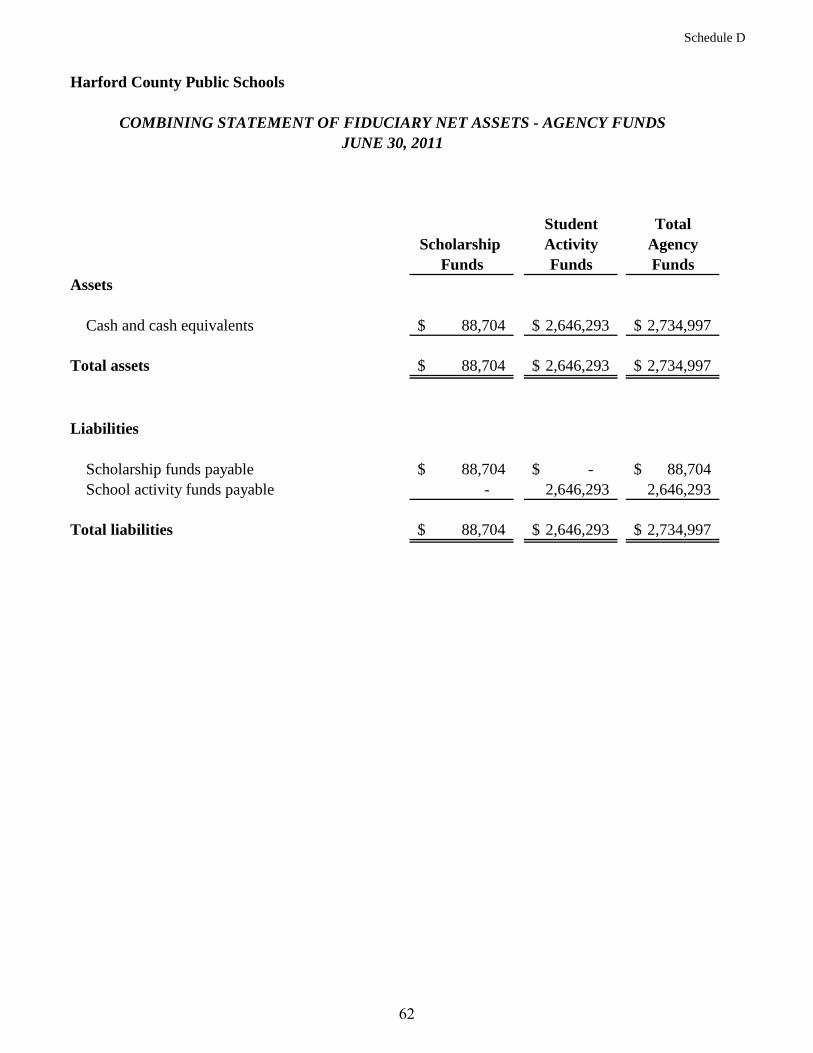
Schedule D
COMBINING STATEMENT OF FIDUCIARY NET ASSETS - AGENCY FUNDS
Student TotalScholarship Activity Agency
Funds Funds Funds
Cash and cash equivalents 88,704$ 2,646,293$ 2,734,997$
Total assets 88,704$ 2,646,293$ 2,734,997$
Scholarship funds payable 88,704$ -$ 88,704$ School activity funds payable - 2,646,293 2,646,293
Total liabilities 88,704$ 2,646,293$ 2,734,997$
Harford County Public Schools
Assets
Liabilities
JUNE 30, 2011
62

Schedule E
Harford County Public Schools
COMBINING STATEMENT OF CHANGES IN ASSETS AND LIABILITIES - AGENCY FUNDS
FOR FISCAL YEAR ENDED JUNE 30, 2011
Balance BalanceJune 30, 2010 Additions Deductions June 30, 2011
SCHOLARSHIP FUNDSASSETS
Cash and cash equivalents 78,711$ 10,023$ 30$ 88,704$
LIABILITIES
Scholarship funds payable 78,711$ 10,023$ 30$ 88,704$
STUDENT ACTIVITY FUNDSASSETS
Cash and cash equivalents 2,646,293$ 6,525,881$ 6,363,351$ 2,808,823$
LIABILITIES
Student activity funds payable 2,646,293$ 6,525,881$ 6,363,351$ 2,808,823$
TOTALS - ALL AGENCY FUNDSASSETS
Cash and cash equivalents 2,725,004$ 6,535,904$ 6,363,381$ 2,897,527$
LIABILITIES
Scholarship funds payable 78,711$ 10,023$ 30$ 88,704$ Student activity funds payable 2,646,293 6,525,881 6,363,351 2,808,823$
Total Liabilities 2,725,004 6,535,904$ 6,363,381$ 2,897,527$
63

Student: Sophia Tobio Grade 7 Havre de Grace Middle School, Teacher Laura Buscemi
64
Statistical Section This part of HCPS’ comprehensive annual financial report presents detailed information as a context for understanding what the information in the financial statements, note disclosures, and required supplementary information says about the district’s overall financial health. Contents Page Financial Trends 66 - 69 These schedules contain trend information to help the reader understand
how the district’s financial performance and well-being have changed over time.
Demographic and Economic Information 70 - 72 These schedules offer demographic and economic indicators to help the
reader understand the environment within which the district’s financial activities take place.
Operating Information 73 - 76
These schedules contain service and infrastructure data to help the reader understand how the information in the district’s financial report relates to the services it provides and activities it performs. This section also contains data for largest employers in the County.
Sources: Unless otherwise noted, the information in these schedules is derived from the comprehensive annual financial reports for the relevant year after June 30, 2004 and from the Independent Auditors’ Report, Financial Statements and Supplemental Information for the relevant year prior to that.
65
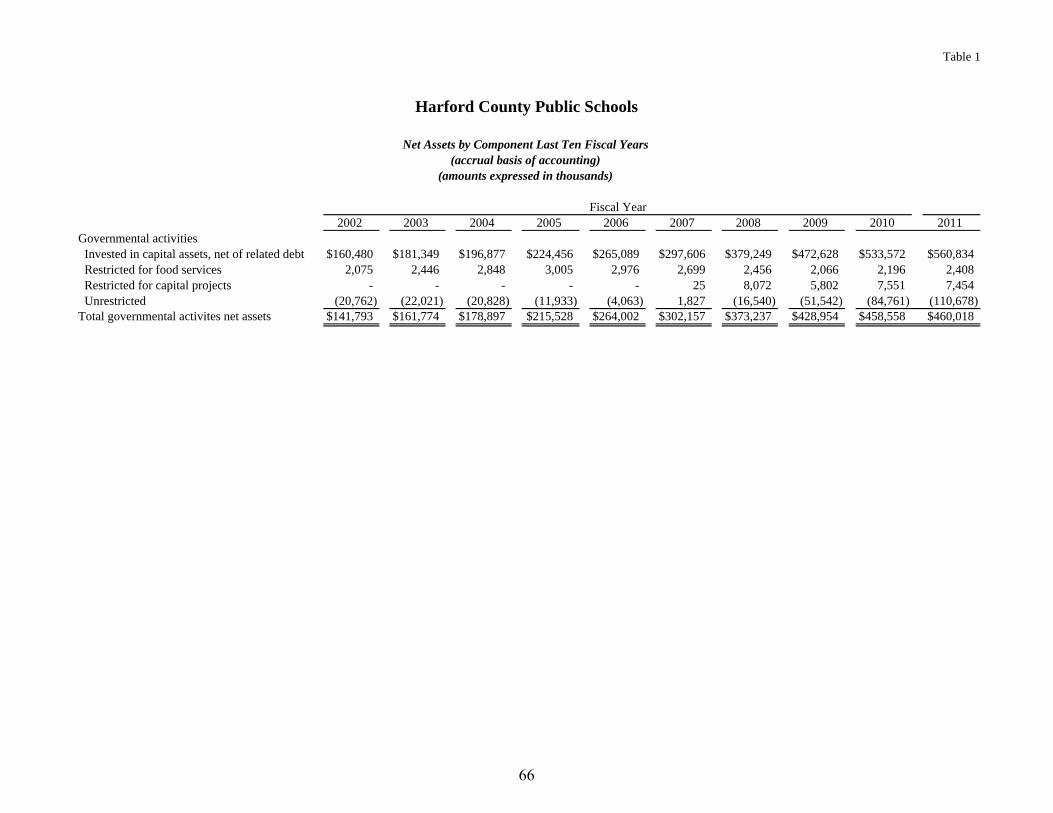
Table 1
Harford County Public Schools
Net Assets by Component Last Ten Fiscal Years(accrual basis of accounting)
(amounts expressed in thousands)
2002 2003 2004 2005 2006 2007 2008 2009 2010 2011Governmental activities Invested in capital assets, net of related debt $160,480 $181,349 $196,877 $224,456 $265,089 $297,606 $379,249 $472,628 $533,572 $560,834 Restricted for food services 2,075 2,446 2,848 3,005 2,976 2,699 2,456 2,066 2,196 2,408 Restricted for capital projects - - - - - 25 8,072 5,802 7,551 7,454 Unrestricted (20,762) (22,021) (20,828) (11,933) (4,063) 1,827 (16,540) (51,542) (84,761) (110,678) Total governmental activites net assets $141,793 $161,774 $178,897 $215,528 $264,002 $302,157 $373,237 $428,954 $458,558 $460,018
Fiscal Year
66
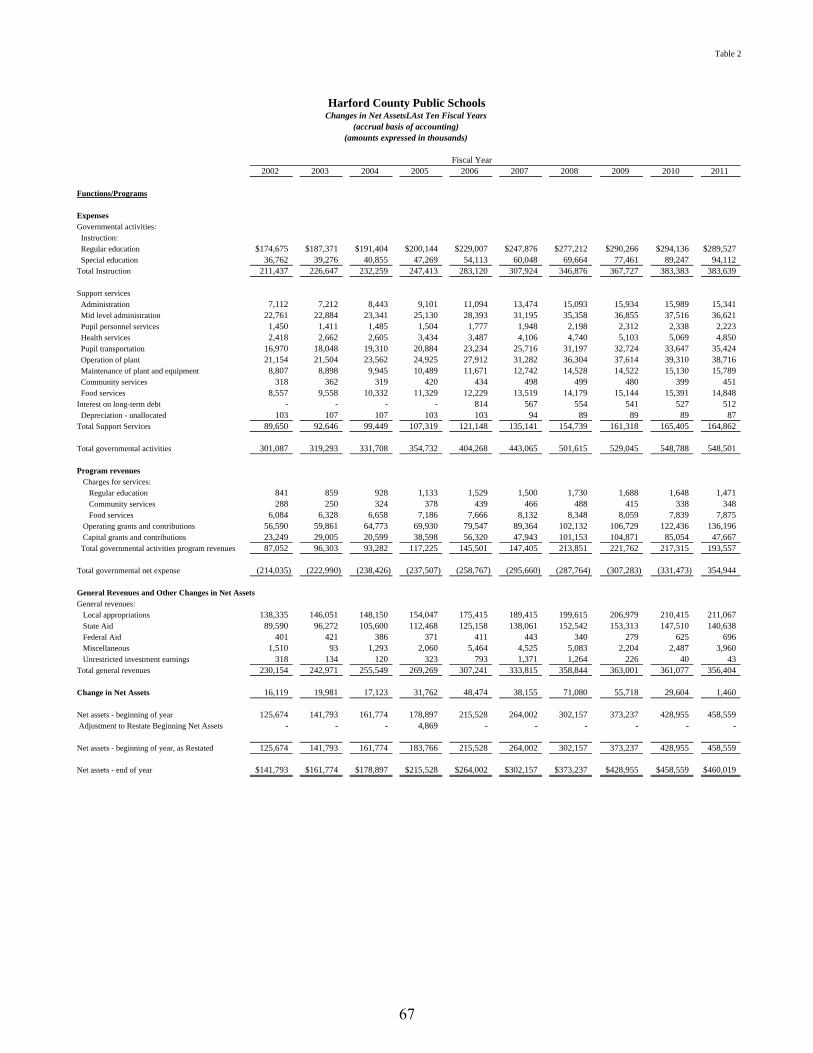
Table 2
Harford County Public SchoolsChanges in Net AssetsLAst Ten Fiscal Years
(accrual basis of accounting)(amounts expressed in thousands)
2002 2003 2004 2005 2006 2007 2008 2009 2010 2011
Functions/Programs
ExpensesGovernmental activities: Instruction: Regular education $174,675 $187,371 $191,404 $200,144 $229,007 $247,876 $277,212 $290,266 $294,136 $289,527 Special education 36,762 39,276 40,855 47,269 54,113 60,048 69,664 77,461 89,247 94,112 Total Instruction 211,437 226,647 232,259 247,413 283,120 307,924 346,876 367,727 383,383 383,639
Support services Administration 7,112 7,212 8,443 9,101 11,094 13,474 15,093 15,934 15,989 15,341 Mid level administration 22,761 22,884 23,341 25,130 28,393 31,195 35,358 36,855 37,516 36,621 Pupil personnel services 1,450 1,411 1,485 1,504 1,777 1,948 2,198 2,312 2,338 2,223 Health services 2,418 2,662 2,605 3,434 3,487 4,106 4,740 5,103 5,069 4,850 Pupil transportation 16,970 18,048 19,310 20,884 23,234 25,716 31,197 32,724 33,647 35,424 Operation of plant 21,154 21,504 23,562 24,925 27,912 31,282 36,304 37,614 39,310 38,716 Maintenance of plant and equipment 8,807 8,898 9,945 10,489 11,671 12,742 14,528 14,522 15,130 15,789 Community services 318 362 319 420 434 498 499 480 399 451 Food services 8,557 9,558 10,332 11,329 12,229 13,519 14,179 15,144 15,391 14,848 Interest on long-term debt - - - - 814 567 554 541 527 512 Depreciation - unallocated 103 107 107 103 103 94 89 89 89 87 Total Support Services 89,650 92,646 99,449 107,319 121,148 135,141 154,739 161,318 165,405 164,862
Total governmental activities 301,087 319,293 331,708 354,732 404,268 443,065 501,615 529,045 548,788 548,501
Program revenues Charges for services: Regular education 841 859 928 1,133 1,529 1,500 1,730 1,688 1,648 1,471 Community services 288 250 324 378 439 466 488 415 338 348 Food services 6,084 6,328 6,658 7,186 7,666 8,132 8,348 8,059 7,839 7,875 Operating grants and contributions 56,590 59,861 64,773 69,930 79,547 89,364 102,132 106,729 122,436 136,196 Capital grants and contributions 23,249 29,005 20,599 38,598 56,320 47,943 101,153 104,871 85,054 47,667 Total governmental activities program revenues 87,052 96,303 93,282 117,225 145,501 147,405 213,851 221,762 217,315 193,557
Total governmental net expense (214,035) (222,990) (238,426) (237,507) (258,767) (295,660) (287,764) (307,283) (331,473) 354,944
General Revenues and Other Changes in Net AssetsGeneral revenues: Local appropriations 138,335 146,051 148,150 154,047 175,415 189,415 199,615 206,979 210,415 211,067 State Aid 89,590 96,272 105,600 112,468 125,158 138,061 152,542 153,313 147,510 140,638 Federal Aid 401 421 386 371 411 443 340 279 625 696 Miscellaneous 1,510 93 1,293 2,060 5,464 4,525 5,083 2,204 2,487 3,960 Unrestricted investment earnings 318 134 120 323 793 1,371 1,264 226 40 43 Total general revenues 230,154 242,971 255,549 269,269 307,241 333,815 358,844 363,001 361,077 356,404
Change in Net Assets 16,119 19,981 17,123 31,762 48,474 38,155 71,080 55,718 29,604 1,460
Net assets - beginning of year 125,674 141,793 161,774 178,897 215,528 264,002 302,157 373,237 428,955 458,559 Adjustment to Restate Beginning Net Assets - - - 4,869 - - - - - -
Net assets - beginning of year, as Restated 125,674 141,793 161,774 183,766 215,528 264,002 302,157 373,237 428,955 458,559
Net assets - end of year $141,793 $161,774 $178,897 $215,528 $264,002 $302,157 $373,237 $428,955 $458,559 $460,019
Fiscal Year
67

Table 3
Harford County Public SchoolsFund Balances of Governmental Funds Last Ten Fiscal Years
(modified accrual basis of accounting)(amounts expressed in thousands)
2002 2003 2004 2005 2006 2007 2008 2009 2010 2011
General fund Assigned $1,945 $2,911 $3,409 $3,523 $4,230 $5,338 $2,937 $2,261 $2,405 $12,976 Unassigned 2,045 910 2,778 7,635 16,188 22,128 16,152 18,113 22,626 13,143 Total general fund $3,990 $3,821 $6,187 $11,158 $20,418 $27,466 $19,089 $20,374 $25,031 $26,119
All other governmental funds Non Spendable - Special Revenue Fund $160 $150 $339 $277 $239 $160 $122 $186 $278 $294 Assigned - reported in: Special revenue fund 1,915 2,295 2,509 2,729 2,737 2,539 2,334 1,880 1,918 2,115 Capital projects fund - - - - - 25 8,072 5,802 7,551 7,454 Total all other governmental funds $2,075 $2,445 $2,848 $3,006 $2,976 $2,724 $10,528 $7,868 $9,747 $9,863
Fiscal Year
68
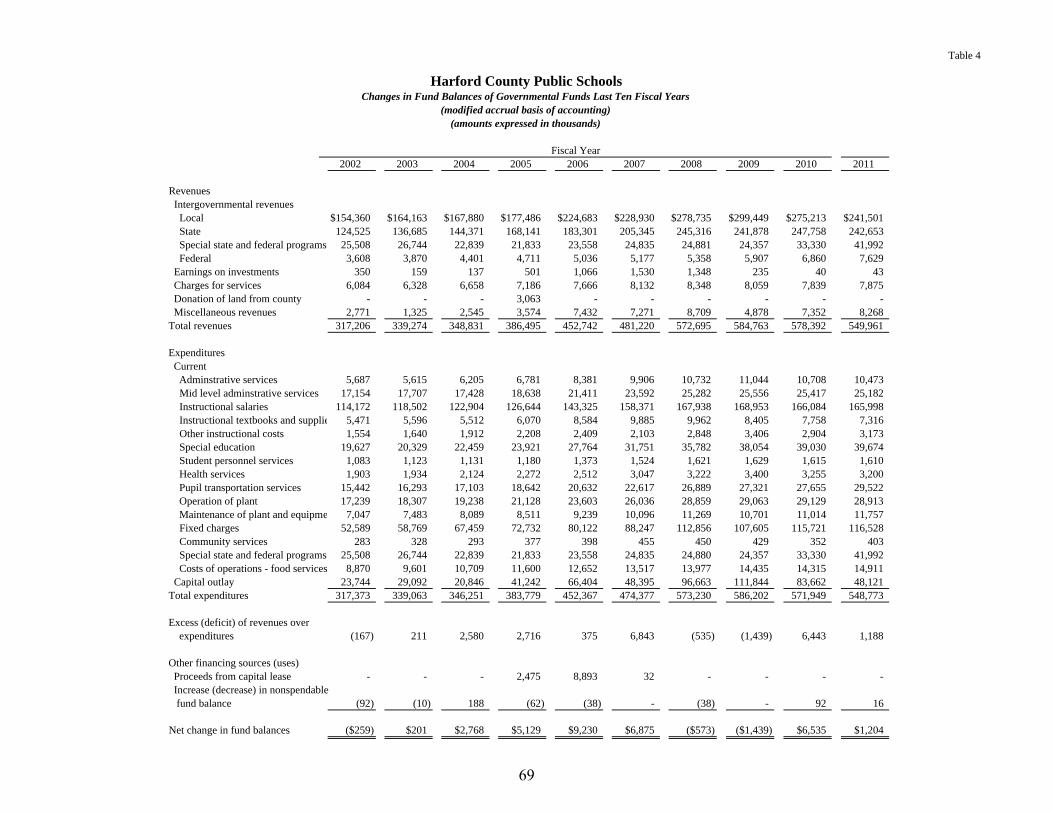
Table 4
Harford County Public SchoolsChanges in Fund Balances of Governmental Funds Last Ten Fiscal Years
(modified accrual basis of accounting)(amounts expressed in thousands)
2002 2003 2004 2005 2006 2007 2008 2009 2010 2011
Revenues Intergovernmental revenues Local $154,360 $164,163 $167,880 $177,486 $224,683 $228,930 $278,735 $299,449 $275,213 $241,501 State 124,525 136,685 144,371 168,141 183,301 205,345 245,316 241,878 247,758 242,653 Special state and federal programs 25,508 26,744 22,839 21,833 23,558 24,835 24,881 24,357 33,330 41,992 Federal 3,608 3,870 4,401 4,711 5,036 5,177 5,358 5,907 6,860 7,629 Earnings on investments 350 159 137 501 1,066 1,530 1,348 235 40 43 Charges for services 6,084 6,328 6,658 7,186 7,666 8,132 8,348 8,059 7,839 7,875 Donation of land from county - - - 3,063 - - - - - - Miscellaneous revenues 2,771 1,325 2,545 3,574 7,432 7,271 8,709 4,878 7,352 8,268 Total revenues 317,206 339,274 348,831 386,495 452,742 481,220 572,695 584,763 578,392 549,961
Expenditures Current Adminstrative services 5,687 5,615 6,205 6,781 8,381 9,906 10,732 11,044 10,708 10,473 Mid level adminstrative services 17,154 17,707 17,428 18,638 21,411 23,592 25,282 25,556 25,417 25,182 Instructional salaries 114,172 118,502 122,904 126,644 143,325 158,371 167,938 168,953 166,084 165,998 Instructional textbooks and supplie 5,471 5,596 5,512 6,070 8,584 9,885 9,962 8,405 7,758 7,316 Other instructional costs 1,554 1,640 1,912 2,208 2,409 2,103 2,848 3,406 2,904 3,173 Special education 19,627 20,329 22,459 23,921 27,764 31,751 35,782 38,054 39,030 39,674 Student personnel services 1,083 1,123 1,131 1,180 1,373 1,524 1,621 1,629 1,615 1,610 Health services 1,903 1,934 2,124 2,272 2,512 3,047 3,222 3,400 3,255 3,200 Pupil transportation services 15,442 16,293 17,103 18,642 20,632 22,617 26,889 27,321 27,655 29,522 Operation of plant 17,239 18,307 19,238 21,128 23,603 26,036 28,859 29,063 29,129 28,913 Maintenance of plant and equipme 7,047 7,483 8,089 8,511 9,239 10,096 11,269 10,701 11,014 11,757 Fixed charges 52,589 58,769 67,459 72,732 80,122 88,247 112,856 107,605 115,721 116,528 Community services 283 328 293 377 398 455 450 429 352 403 Special state and federal programs 25,508 26,744 22,839 21,833 23,558 24,835 24,880 24,357 33,330 41,992 Costs of operations - food services 8,870 9,601 10,709 11,600 12,652 13,517 13,977 14,435 14,315 14,911 Capital outlay 23,744 29,092 20,846 41,242 66,404 48,395 96,663 111,844 83,662 48,121 Total expenditures 317,373 339,063 346,251 383,779 452,367 474,377 573,230 586,202 571,949 548,773
Excess (deficit) of revenues over expenditures (167) 211 2,580 2,716 375 6,843 (535) (1,439) 6,443 1,188
Other financing sources (uses) Proceeds from capital lease - - - 2,475 8,893 32 - - - - Increase (decrease) in nonspendable fund balance (92) (10) 188 (62) (38) - (38) - 92 16
Net change in fund balances ($259) $201 $2,768 $5,129 $9,230 $6,875 ($573) ($1,439) $6,535 $1,204
Fiscal Year
69

Table 5
Harford County Public SchoolsEnrollment by School and Student to Teacher Ratio
Last Ten Years at September 30,
2001 2002 2003 2004 2005 2006 2007 2008 2009 2010 Capacity Capacity
Abingdon Elementary 833 853 836 841 822 751 769 795 766 798 864 92.36%Bakersfield Elementary 551 506 510 507 463 447 463 477 457 444 500 88.80%Bel Air Elementary 567 577 525 533 524 505 487 512 508 505 500 101.00%Church Creek Elementary 743 730 733 754 778 755 736 743 774 781 789 98.99%Churchville Elementary 408 384 398 383 383 371 359 363 371 376 388 96.91%Darlington Elementary 145 123 141 137 139 130 126 125 123 123 192 64.06%Deerfield Elementary 589 639 687 670 584 569 545 520 514 633 816 77.57%Dublin Elementary 266 258 260 268 239 250 246 247 247 246 295 83.39%Edgewood Elementary 447 442 458 506 473 422 419 393 434 422 511 82.58%Emmorton Elementary 544 576 580 617 617 653 667 676 704 732 549 133.33%Forest Hill Elementary 710 536 580 603 579 585 575 564 579 550 581 94.66%Forest Lakes Elementary 525 684 675 679 714 707 695 664 682 681 546 124.73%Fountain Green Elementary 605 616 647 616 664 643 662 651 604 567 571 99.30%George D. Lisby Elementary at Hillsda 440 391 383 378 347 333 311 350 333 347 455 76.26%Halls Cross Roads Elementary 401 401 359 364 383 415 437 430 446 492 632 77.85%Havre de Grace Elementary 505 481 487 461 413 368 373 393 416 424 566 74.91%Hickory Elementary 674 693 693 667 696 664 693 702 687 720 655 109.92%Homestead-Wakefield Elementary 992 982 992 970 958 934 919 905 937 937 907 103.31%Jarrettsville Elementary 480 480 470 455 455 423 443 414 416 434 548 79.20%Joppatowne Elementary 568 593 564 567 581 522 515 546 548 581 653 88.97%Magnolia Elementary 596 589 566 574 515 512 526 536 563 466 518 89.96%Meadowvale Elementary 577 588 602 574 603 571 549 545 538 512 568 90.14%Norrisville Elementary 192 191 194 184 207 221 206 192 170 181 252 71.83%North Bend Elementary 503 500 481 470 449 428 399 402 389 401 500 80.20%North Harford Elementary 498 532 539 534 551 518 502 469 490 453 500 90.60%Prospect Mill Elementary 839 911 879 907 976 1,008 980 951 931 902 680 132.65%Ring Factory Elementary 619 596 567 555 541 530 527 500 513 511 548 93.25%Riverside Elementary 559 544 564 559 554 568 547 504 502 523 522 100.19%Roye-Williams Elementary 630 620 563 641 577 546 493 426 440 388 683 56.81%William Paca/Old Post Road Elementa 1,066 1,055 1,033 1,026 1,052 1,044 1,010 1,020 1,005 845 954 88.57%William S. James Elementary 589 560 526 520 498 496 501 487 481 521 522 99.81%Youths Benefit Elementary 1,014 1,003 985 1,008 1,029 1,044 1,067 1,072 1,041 1,029 958 107.41%
Total Elementary Schools 18,675 18,634 18,477 18,528 18,364 17,933 17,747 17,574 17,609 17,525 18,723 93.60%
Aberdeen Middle 1,265 1,299 1,293 1,301 1,247 1,207 1,095 1,120 1,095 1,087 1,444 75.28%Bel Air Middle 1,265 1,429 1,461 1,402 1,434 1,403 1,244 1,249 1,267 1,291 1,318 97.95%Edgewood Middle 1,331 1,349 1,346 1,275 1,216 1,164 1,151 1,028 1,046 1,022 1,370 74.60%Fallston Middle 1,118 1,274 1,228 1,224 1,212 1,180 925 905 892 887 1,105 80.27%Havre de Grace Middle 624 657 650 605 589 599 609 613 584 530 775 68.39%Magnolia Middle 912 935 903 913 916 869 874 785 795 735 1,073 68.50%North Harford Middle 1,129 1,226 1,200 1,118 1,123 1,085 1,153 1,134 1,113 1,056 1,243 84.96%Patterson Mill Middle - - - - - - 735 763 775 753 733 102.73%Southampton Middle 2,008 1,613 1,541 1,528 1,535 1,549 1,252 1,295 1,256 1,270 1,540 82.47%
Total Middle Schools 9,652 9,782 9,622 9,366 9,272 9,056 9,038 8,892 8,823 8,631 10,601 81.42%
Aberdeen High 1,220 1,250 1,250 1,357 1,543 1,589 1,569 1,504 1,464 1,459 1,370 106.50%Bel Air High 1,573 1,573 1,649 1,636 1,639 1,683 1,403 1,380 1,431 1,574 1,668 94.36%C. Milton Wright High 1,840 1,793 1,789 1,911 1,834 1,850 1,746 1,587 1,591 1,555 1,678 92.67%Edgewood High 1,183 1,226 1,327 1,357 1,316 1,261 1,177 1,123 1,194 1,226 1,380 88.84%Fallston High 1,651 1,656 1,672 1,635 1,643 1,606 1,453 1,365 1,209 1,113 1,529 72.79%Harford Technical High 1,014 1,054 1,070 1,069 1,052 1,056 1,056 1,040 1,026 1,024 920 111.30%Havre de Grace High 663 690 687 705 721 717 769 764 775 745 850 87.65%Joppatowne High 1,074 1,052 1,051 1,108 1,118 1,063 1,004 969 952 940 1,126 83.48%North Harford High 1,270 1,370 1,425 1,447 1,445 1,437 1,385 1,367 1,393 1,383 1,603 86.28%
Patterson Mill High - - - - - - 436 701 949 964 1,030 93.59%
Total High Schools 11,488 11,664 11,920 12,225 12,311 12,262 11,998 11,800 11,984 11,983 13,154 91.10%
Total Secondary Schools 21,140 21,446 21,542 21,591 21,583 21,318 21,036 20,692 20,807 20,614 23,755 86.78%
Alternative Education 15 20 30 17 113 139 155 106 76 112 250 44.80%Restoration Academy (Charter) - - - - - 21 78 79 - - - -John Archer 165 164 154 158 152 160 159 159 147 143 210 68.10%
Total Special Schools 180 184 184 175 265 320 392 344 223 255 460 55.43%
Total All Schools 39,995 40,264 40,203 40,294 40,212 39,571 39,175 38,610 38,639 38,394 42,938 89.42%
Teachers & Therapists Staff (1) 2,486 2,579 2,590 2,357 2,437 2,589 2,809 2,835 2,778 2,789 2,827
Student/Teacher Ratio 16.09 15.61 15.52 17.10 16.50 15.28 13.95 13.62 13.91 13.77 15.19
Source: Monthly Report on Enrollment at September 30.
Source (1): Maryland State Department of Education Fact Book for relevant year, estimated for 2011
Note: September 30 is the State's official enrollment date for the school year.
Restoration Academy's charter was revoked after the 2008 school year.
70
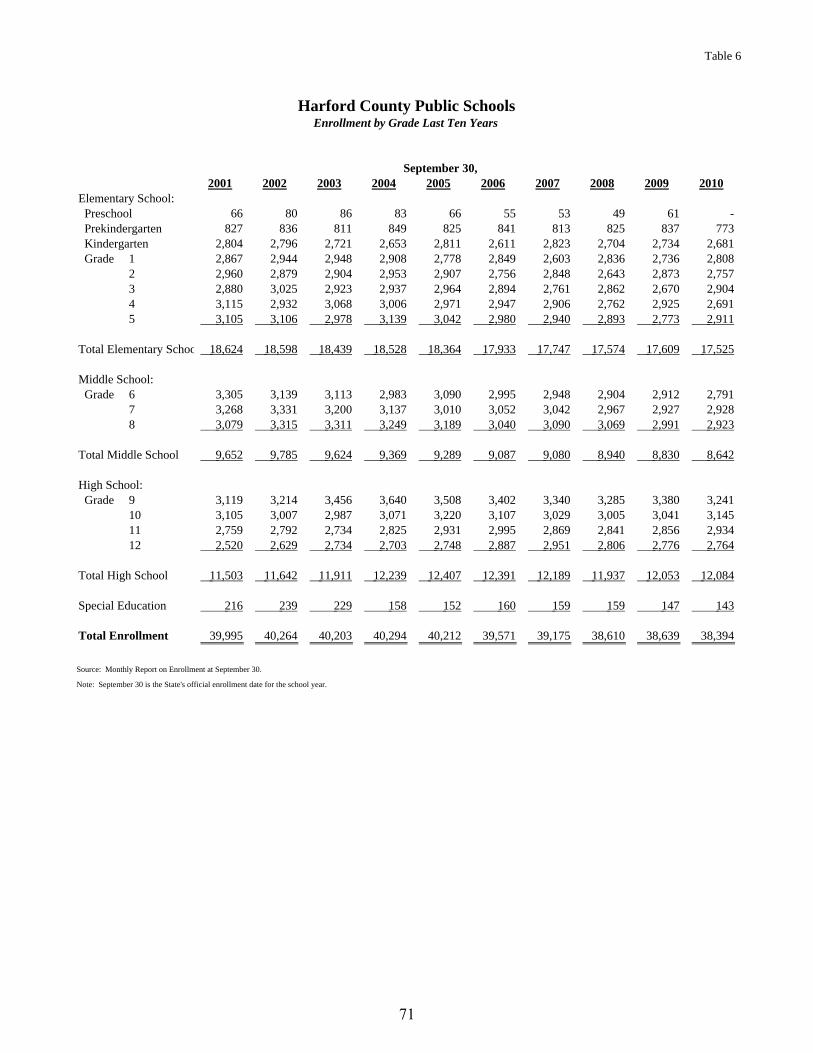
Table 6
Harford County Public SchoolsEnrollment by Grade Last Ten Years
2001 2002 2003 2004 2005 2006 2007 2008 2009 2010Elementary School: Preschool 66 80 86 83 66 55 53 49 61 - Prekindergarten 827 836 811 849 825 841 813 825 837 773 Kindergarten 2,804 2,796 2,721 2,653 2,811 2,611 2,823 2,704 2,734 2,681 Grade 1 2,867 2,944 2,948 2,908 2,778 2,849 2,603 2,836 2,736 2,808
2 2,960 2,879 2,904 2,953 2,907 2,756 2,848 2,643 2,873 2,757 3 2,880 3,025 2,923 2,937 2,964 2,894 2,761 2,862 2,670 2,904 4 3,115 2,932 3,068 3,006 2,971 2,947 2,906 2,762 2,925 2,691 5 3,105 3,106 2,978 3,139 3,042 2,980 2,940 2,893 2,773 2,911
Total Elementary Schoo 18,624 18,598 18,439 18,528 18,364 17,933 17,747 17,574 17,609 17,525
Middle School: Grade 6 3,305 3,139 3,113 2,983 3,090 2,995 2,948 2,904 2,912 2,791
7 3,268 3,331 3,200 3,137 3,010 3,052 3,042 2,967 2,927 2,928 8 3,079 3,315 3,311 3,249 3,189 3,040 3,090 3,069 2,991 2,923
Total Middle School 9,652 9,785 9,624 9,369 9,289 9,087 9,080 8,940 8,830 8,642
High School: Grade 9 3,119 3,214 3,456 3,640 3,508 3,402 3,340 3,285 3,380 3,241
10 3,105 3,007 2,987 3,071 3,220 3,107 3,029 3,005 3,041 3,145 11 2,759 2,792 2,734 2,825 2,931 2,995 2,869 2,841 2,856 2,934 12 2,520 2,629 2,734 2,703 2,748 2,887 2,951 2,806 2,776 2,764
Total High School 11,503 11,642 11,911 12,239 12,407 12,391 12,189 11,937 12,053 12,084
Special Education 216 239 229 158 152 160 159 159 147 143
Total Enrollment 39,995 40,264 40,203 40,294 40,212 39,571 39,175 38,610 38,639 38,394
Source: Monthly Report on Enrollment at September 30.
Note: September 30 is the State's official enrollment date for the school year.
September 30,
71
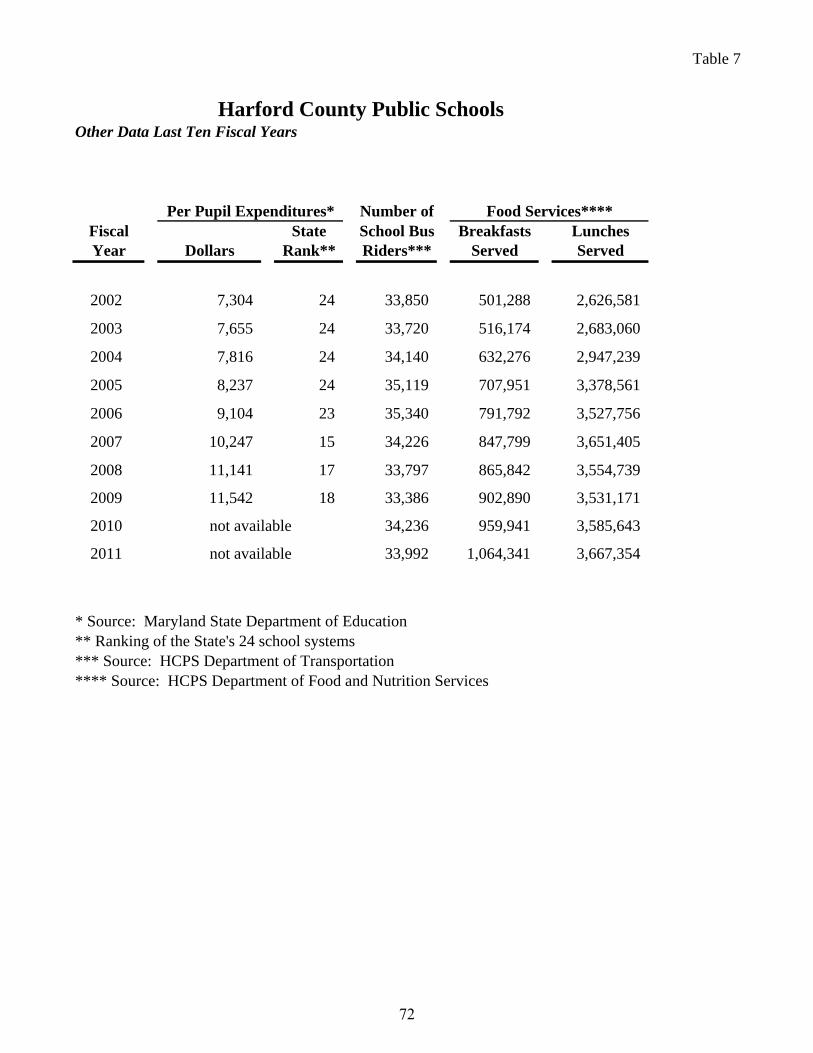
Table 7
Harford County Public SchoolsOther Data Last Ten Fiscal Years
Number ofFiscal State School Bus Breakfasts LunchesYear Dollars Rank** Riders*** Served Served
2002 7,304 24 33,850 501,288 2,626,581
2003 7,655 24 33,720 516,174 2,683,060
2004 7,816 24 34,140 632,276 2,947,239
2005 8,237 24 35,119 707,951 3,378,561
2006 9,104 23 35,340 791,792 3,527,756
2007 10,247 15 34,226 847,799 3,651,405
2008 11,141 17 33,797 865,842 3,554,739
2009 11,542 18 33,386 902,890 3,531,171
2010 34,236 959,941 3,585,643
2011 33,992 1,064,341 3,667,354
* Source: Maryland State Department of Education** Ranking of the State's 24 school systems*** Source: HCPS Department of Transportation**** Source: HCPS Department of Food and Nutrition Services
Food Services****Per Pupil Expenditures*
not available
not available
72
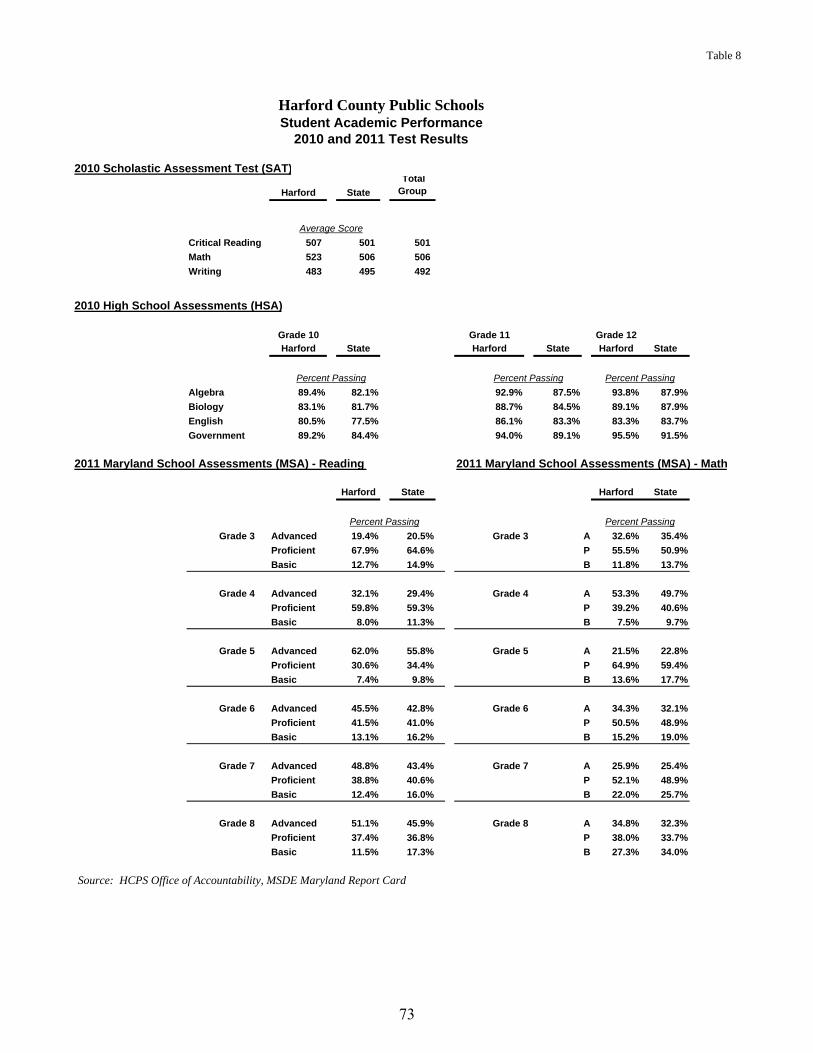
Table 8
Harford County Public SchoolsStudent Academic Performance
2010 and 2011 Test Results
2010 Scholastic Assessment Test (SAT)
Harford State
Total Group
Average Score
Critical Reading 507 501 501
Math 523 506 506
Writing 483 495 492
2010 High School Assessments (HSA)
Grade 10 Grade 11 Grade 12
Harford State Harford State Harford State
Percent Passing Percent Passing
Algebra 89.4% 82.1% 92.9% 87.5% 93.8% 87.9%
Biology 83.1% 81.7% 88.7% 84.5% 89.1% 87.9%
English 80.5% 77.5% 86.1% 83.3% 83.3% 83.7%
Government 89.2% 84.4% 94.0% 89.1% 95.5% 91.5%
2011 Maryland School Assessments (MSA) - Reading 2011 Maryland School Assessments (MSA) - Math
Harford State Harford State
Percent Passing
Grade 3 Advanced 19.4% 20.5% Grade 3 A 32.6% 35.4%
Proficient 67.9% 64.6% Pr 55.5% 50.9%
Basic 12.7% 14.9% B 11.8% 13.7%
Grade 4 Advanced 32.1% 29.4% Grade 4 A 53.3% 49.7%
Proficient 59.8% 59.3% Pr 39.2% 40.6%
Basic 8.0% 11.3% B 7.5% 9.7%
Grade 5 Advanced 62.0% 55.8% Grade 5 A 21.5% 22.8%
Proficient 30.6% 34.4% Pr 64.9% 59.4%
Basic 7.4% 9.8% B 13.6% 17.7%
Grade 6 Advanced 45.5% 42.8% Grade 6 A 34.3% 32.1%
Proficient 41.5% 41.0% Pr 50.5% 48.9%
Basic 13.1% 16.2% B 15.2% 19.0%
Grade 7 Advanced 48.8% 43.4% Grade 7 A 25.9% 25.4%
Proficient 38.8% 40.6% Pr 52.1% 48.9%
Basic 12.4% 16.0% B 22.0% 25.7%
Grade 8 Advanced 51.1% 45.9% Grade 8 A 34.8% 32.3%
Proficient 37.4% 36.8% Pr 38.0% 33.7%
Basic 11.5% 17.3% B 27.3% 34.0%
Source: HCPS Office of Accountability, MSDE Maryland Report Card
Percent Passing
Percent Passing
73
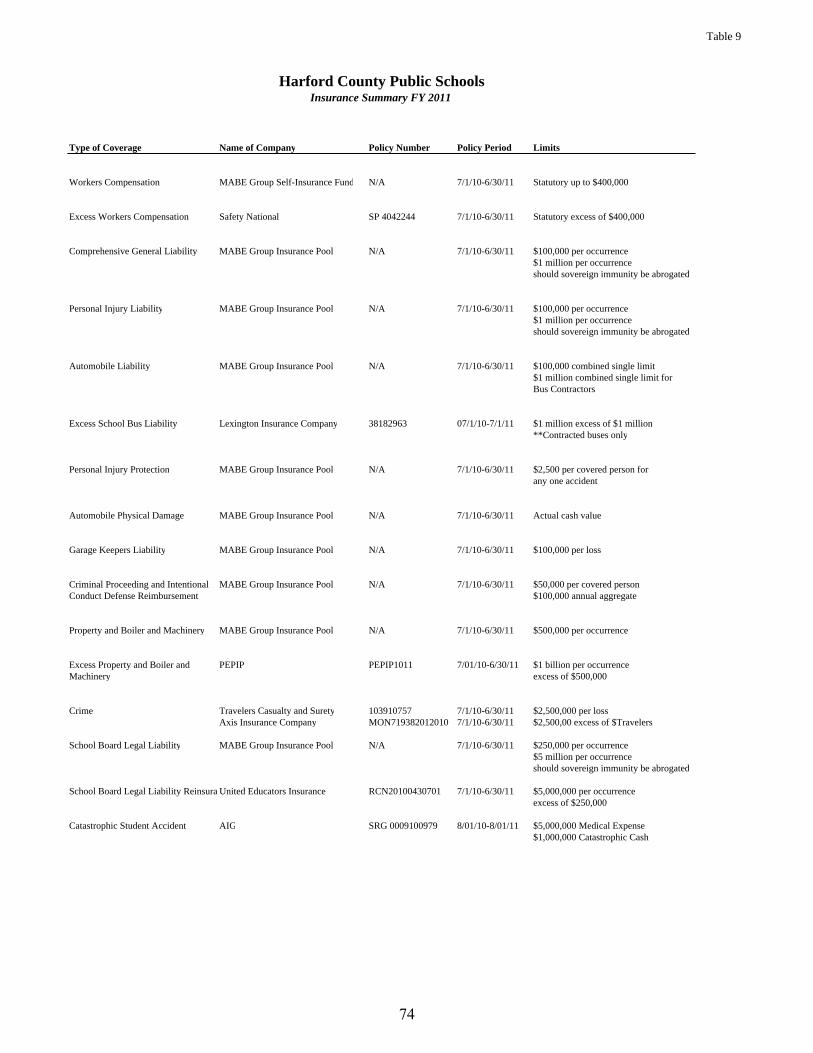
Table 9
Harford County Public SchoolsInsurance Summary FY 2011
Type of Coverage Name of Company Policy Number Policy Period Limits
Workers Compensation MABE Group Self-Insurance Fund N/A 7/1/10-6/30/11 Statutory up to $400,000
Excess Workers Compensation Safety National SP 4042244 7/1/10-6/30/11 Statutory excess of $400,000
Comprehensive General Liability MABE Group Insurance Pool N/A 7/1/10-6/30/11 $100,000 per occurrence$1 million per occurrenceshould sovereign immunity be abrogated
Personal Injury Liability MABE Group Insurance Pool N/A 7/1/10-6/30/11 $100,000 per occurrence$1 million per occurrenceshould sovereign immunity be abrogated
Automobile Liability MABE Group Insurance Pool N/A 7/1/10-6/30/11 $100,000 combined single limit$1 million combined single limit for Bus Contractors
Excess School Bus Liability Lexington Insurance Company 38182963 07/1/10-7/1/11 $1 million excess of $1 million**Contracted buses only
Personal Injury Protection MABE Group Insurance Pool N/A 7/1/10-6/30/11 $2,500 per covered person forany one accident
Automobile Physical Damage MABE Group Insurance Pool N/A 7/1/10-6/30/11 Actual cash value
Garage Keepers Liability MABE Group Insurance Pool N/A 7/1/10-6/30/11 $100,000 per loss
Criminal Proceeding and Intentional MABE Group Insurance Pool N/A 7/1/10-6/30/11 $50,000 per covered personConduct Defense Reimbursement $100,000 annual aggregate
Property and Boiler and Machinery MABE Group Insurance Pool N/A 7/1/10-6/30/11 $500,000 per occurrence
Excess Property and Boiler and PEPIP PEPIP1011 7/01/10-6/30/11 $1 billion per occurrenceMachinery excess of $500,000
Crime Travelers Casualty and Surety 103910757 7/1/10-6/30/11 $2,500,000 per lossAxis Insurance Company MON719382012010 7/1/10-6/30/11 $2,500,00 excess of $Travelers
School Board Legal Liability MABE Group Insurance Pool N/A 7/1/10-6/30/11 $250,000 per occurrence$5 million per occurrenceshould sovereign immunity be abrogated
School Board Legal Liability Reinsura United Educators Insurance RCN20100430701 7/1/10-6/30/11 $5,000,000 per occurrenceexcess of $250,000
Catastrophic Student Accident AIG SRG 0009100979 8/01/10-8/01/11 $5,000,000 Medical Expense$1,000,000 Catastrophic Cash
74
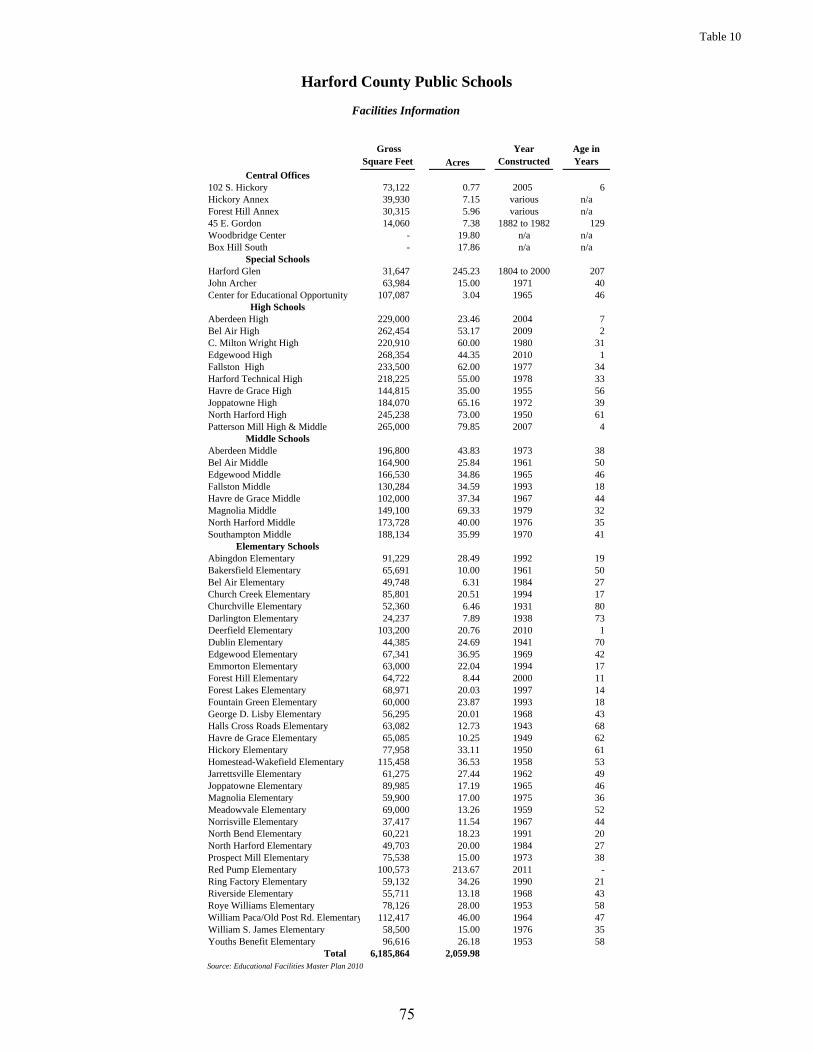
Table 10
Harford County Public Schools
Facilities Information
Gross Square Feet Acres
Year Constructed
Age in Years
Central Offices102 S. Hickory 73,122 0.77 2005 6 Hickory Annex 39,930 7.15 various n/aForest Hill Annex 30,315 5.96 various n/a45 E. Gordon 14,060 7.38 1882 to 1982 129 Woodbridge Center - 19.80 n/a n/aBox Hill South - 17.86 n/a n/a
Special SchoolsHarford Glen 31,647 245.23 1804 to 2000 207 John Archer 63,984 15.00 1971 40 Center for Educational Opportunity 107,087 3.04 1965 46
High SchoolsAberdeen High 229,000 23.46 2004 7 Bel Air High 262,454 53.17 2009 2 C. Milton Wright High 220,910 60.00 1980 31 Edgewood High 268,354 44.35 2010 1 Fallston High 233,500 62.00 1977 34 Harford Technical High 218,225 55.00 1978 33 Havre de Grace High 144,815 35.00 1955 56 Joppatowne High 184,070 65.16 1972 39 North Harford High 245,238 73.00 1950 61 Patterson Mill High & Middle 265,000 79.85 2007 4
Middle SchoolsAberdeen Middle 196,800 43.83 1973 38 Bel Air Middle 164,900 25.84 1961 50 Edgewood Middle 166,530 34.86 1965 46 Fallston Middle 130,284 34.59 1993 18 Havre de Grace Middle 102,000 37.34 1967 44 Magnolia Middle 149,100 69.33 1979 32 North Harford Middle 173,728 40.00 1976 35 Southampton Middle 188,134 35.99 1970 41
Elementary SchoolsAbingdon Elementary 91,229 28.49 1992 19 Bakersfield Elementary 65,691 10.00 1961 50 Bel Air Elementary 49,748 6.31 1984 27 Church Creek Elementary 85,801 20.51 1994 17 Churchville Elementary 52,360 6.46 1931 80 Darlington Elementary 24,237 7.89 1938 73 Deerfield Elementary 103,200 20.76 2010 1 Dublin Elementary 44,385 24.69 1941 70 Edgewood Elementary 67,341 36.95 1969 42 Emmorton Elementary 63,000 22.04 1994 17 Forest Hill Elementary 64,722 8.44 2000 11 Forest Lakes Elementary 68,971 20.03 1997 14 Fountain Green Elementary 60,000 23.87 1993 18 George D. Lisby Elementary 56,295 20.01 1968 43 Halls Cross Roads Elementary 63,082 12.73 1943 68 Havre de Grace Elementary 65,085 10.25 1949 62 Hickory Elementary 77,958 33.11 1950 61 Homestead-Wakefield Elementary 115,458 36.53 1958 53 Jarrettsville Elementary 61,275 27.44 1962 49 Joppatowne Elementary 89,985 17.19 1965 46 Magnolia Elementary 59,900 17.00 1975 36 Meadowvale Elementary 69,000 13.26 1959 52 Norrisville Elementary 37,417 11.54 1967 44 North Bend Elementary 60,221 18.23 1991 20 North Harford Elementary 49,703 20.00 1984 27 Prospect Mill Elementary 75,538 15.00 1973 38 Red Pump Elementary 100,573 213.67 2011 - Ring Factory Elementary 59,132 34.26 1990 21 Riverside Elementary 55,711 13.18 1968 43 Roye Williams Elementary 78,126 28.00 1953 58 William Paca/Old Post Rd. Elementary 112,417 46.00 1964 47 William S. James Elementary 58,500 15.00 1976 35 Youths Benefit Elementary 96,616 26.18 1953 58
Total 6,185,864 2,059.98Source: Educational Facilities Master Plan 2010
75

Table 11
Largest Employees
Government Sector:
Aberdeen Proving Ground 16,944Harford County Public Schools 5,349Harford County Government 1,938Harford County Public Library 396
Private Sector:
Upper Chesapeake Health Systems 2,720Harford Community College 1,219Rite Aid Mid-Atlantic Customer Distribution Center 1.198SAIC 788Jacobs Technology, Inc. 785Sephora Central Distribution 700Saks Fifth Avenue 525Frito-Lay, Inc. 435CSC 410American Infrastructure 352Constar 343
Source: Harford County Chamber of Commerce January 2011
Harford County Public Schools
76

Compliance Section
Student: Trinity Sprague Grade 9 Harford Technical High School, Teacher Judy Demond
77
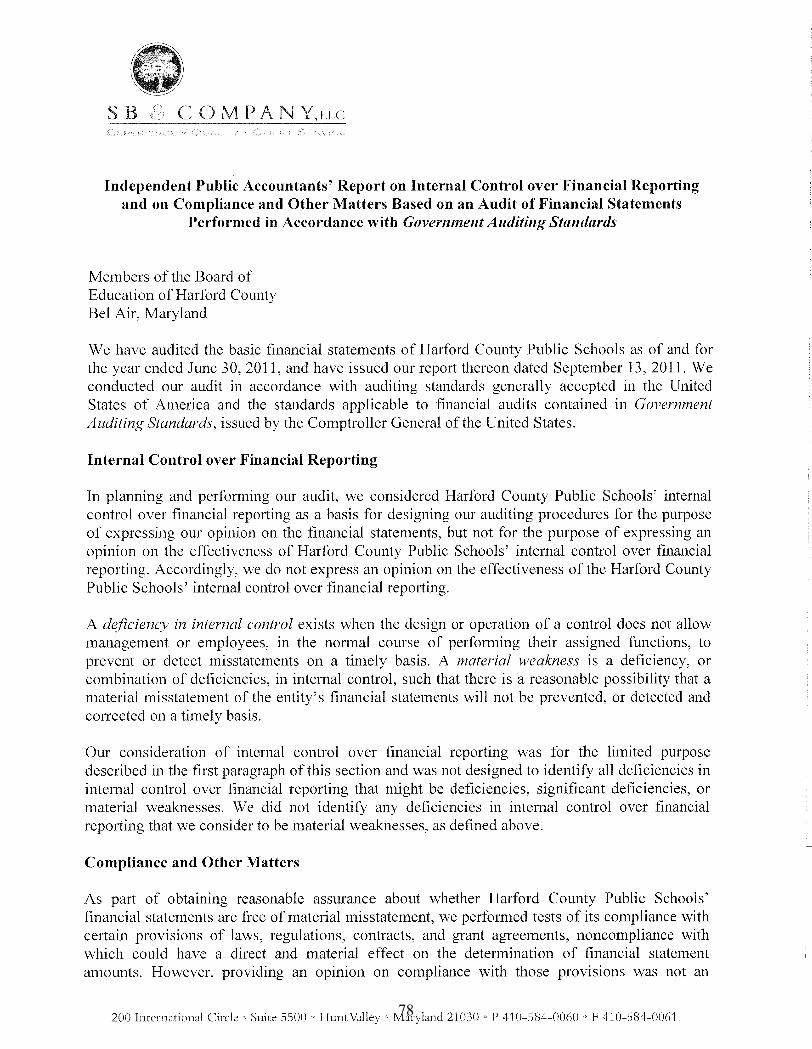
78

79

Student: Tyler Dameron Grade 10 C Milton Wright High School, Teacher Jana Thomas
Student: Marc Badger Grade 10 Fallston High School, Teacher Diane Heuston
80