Embed Size (px)
Citation preview

Asset Integrity Management with the methodology / tools of PIMS International
© PIMS International
Amsterdam
Haren

Why Pipeline Integrity Management?Dutch Act’s on External Safety of high pressure Pipelines
1. WION: 20081. Ground movement > 50 cm have to be reported.2. Pipeline operator and contractor (excavation, ram piling) have to prevent 3rd party
damage by joint effort
1. BEVB: 20111. Inspection by VROM ILT to verify risk & integrity managent practice2. Assets & Proces descriptions (from design – abandonment). Major element:
transparency in integrity management3. Risk based maintenance & inspection planning and above all: PDCA loop4. Condition report and Management review5. PIMS Focal Point in Company6. NTA 8000 code > NEN 3655 fullfils Dutch legal requirements
© PIMS International

Customer PM PIMSImplementation(ASME B31.8S)
PM PIMSImplementationNTA 8000
PM Risk Assessment with Bowstar Methodology / Software
Gasunie 2003-2004 2009 2010: Onshore pipelines, Compressor Stations, Export Stations,Blending Stations, Sub-surface Valve Stations (HP and LP), GasSupply Stations, IT & Physical Security of vital infrastructure
2013: Expansion current Comparison Bench Mark2015: N2-Plant, Update all bowties, KPI-s retrieval with Bowstar
Sasol Gas (South Africa) 2004-20052012 (Revitalisation)
2012: Land Pipelines
Geoplin (Slovenia) 2006
Total (TIGF, France) 2008 2010: Development Inspection Procedure
PTT (Thailand) 2008 2009 2014: LNG-plant (investment decision Ministry of Energy)
Total EP NL 2010 2009: Offshore pipelines
ENGIE 2010 2011: Offshore Pipelines (trunk), Platforms, Risers (flexible andsteel), Onshore Pipelines, Gas processing plants (NOGAT andNGT)
2013: Wax Deposition in Oil Pipelines, Revision Permit NGT Pipelinein Environmental sensitive area (Waddenzee)
2014: Fatigue Load pipelines2015: Effectiveness and efficiency of ILI pigrun for offshore interfiled
pipelines, KPI-s retrieval with Bowstar (NOGAT Assets withCOSO model)
2016: Update all bowties
TAQA 2012 2012: Gap analysis Pipeline Integrity Management manual2013: Gas Storage Plant Bergermeer2014: Fibre Cable application
Teijin Aramid (NL) 2013: Validation Risk Policy
NAM, SHELL 2011: Gab analyses PIMS Manual
NEN 2010: Lecturing NTA 8000 in cooperation with regulator
NUON 2011: Onshore Pipeline
TENNET 2015: High Voltage Power Lines (220-380 KV)
BBL Company 2015: Onshore Pipeline
PIMS International records: PIMS implementation & Risk Management Projects
© PIMS International
Meridian--------------------
ArcGis
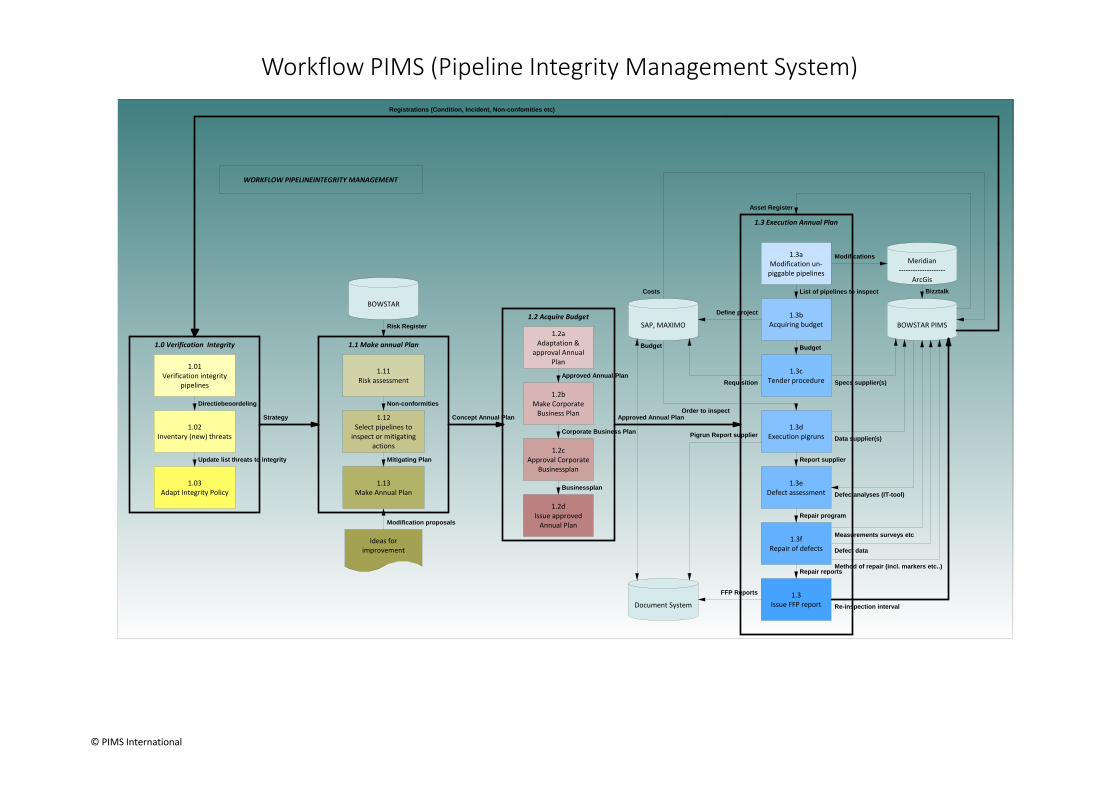
1.3 Execution Annual Plan
1.1 Make annual Plan1.0 Verification Integrity
1.13Make Annual Plan
1.11Risk assessment
1.12Select pipelines to
inspect or mitigatingactions
Ideas forimprovement
Document System
1.3aModification un-
piggable pipelines
1.2 Acquire Budget
1.2aAdaptation &
approval AnnualPlan
1.2bMake Corporate
Business Plan
1.2cApproval Corporate
Businessplan
1.2dIssue approved
Annual Plan
WORKFLOW PIPELINEINTEGRITY MANAGEMENT
1.3bAcquiring budget
1.3cTender procedure
1.3dExecution pigruns
1.3eDefect assessment
1.3fRepair of defects
1.3Issue FFP report
SAP, MAXIMO
1.03Adapt Integrity Policy
1.01Verification integrity
pipelines
1.02Inventary (new) threats
BOWSTAR
BOWSTAR PIMS
Approved Annual Plan
Corporate Business Plan
Businessplan
Approved Annual Plan
List of pipelines to inspect
Budget
Report supplier
Repair program
Repair reports
Modifications
FFP Reports
Pigrun Report supplier
Requisition
Define project
Order to inspect
Costs
Asset Register
Budget
Non-conformities
Mitigating Plan
Concept Annual Plan
Modification proposals
Directiebeoordeling
Update list threats to integrity
Strategy
Registrations (Condition, Incident, Non-confomities etc)
Data supplier(s)
Defectanalyses (IT-tool)
Re-inspection interval
Measurements surveys etc
Defect data
Bizztalk
Specs supplier(s)
Method of repair (incl. markers etc..)
Risk Register
Workflow PIMS (Pipeline Integrity Management System)
© PIMS International

How our IT-solutions can assist Asset Integrity Management
Bowstar Risk Assessment
Meridian--------------------
ArcGis
SAP, MAXIMOMaintenance Plan
Bowstar GIS
Prioritization Inspection & Maintenance Plan
Asset with unacceptable risk level
Incident & maintenance reports
Asset scope
Asset data
Asset changes
Threat & Mitigation Scheme
New and Improved Mitigations
© PIMS International
ROV, ROTV, AUVand acoustic
data
Incident analyses report, required mitigating actions
Inspection schedule (program)
Video data
Alignment /cross checking all data pipeline
Request for repair / modification
Inspection, maintenance and repair policy (e.g. interval change)
Request for maintenance (e.g. tuning rectifier)
Request for inspection & repair (e.g. repair incl. dig up sheets)
ArcGIS
Executionwork(orders)
Pigrun data
DocumentManagement
System
AppropriateCorporate &Legal reports
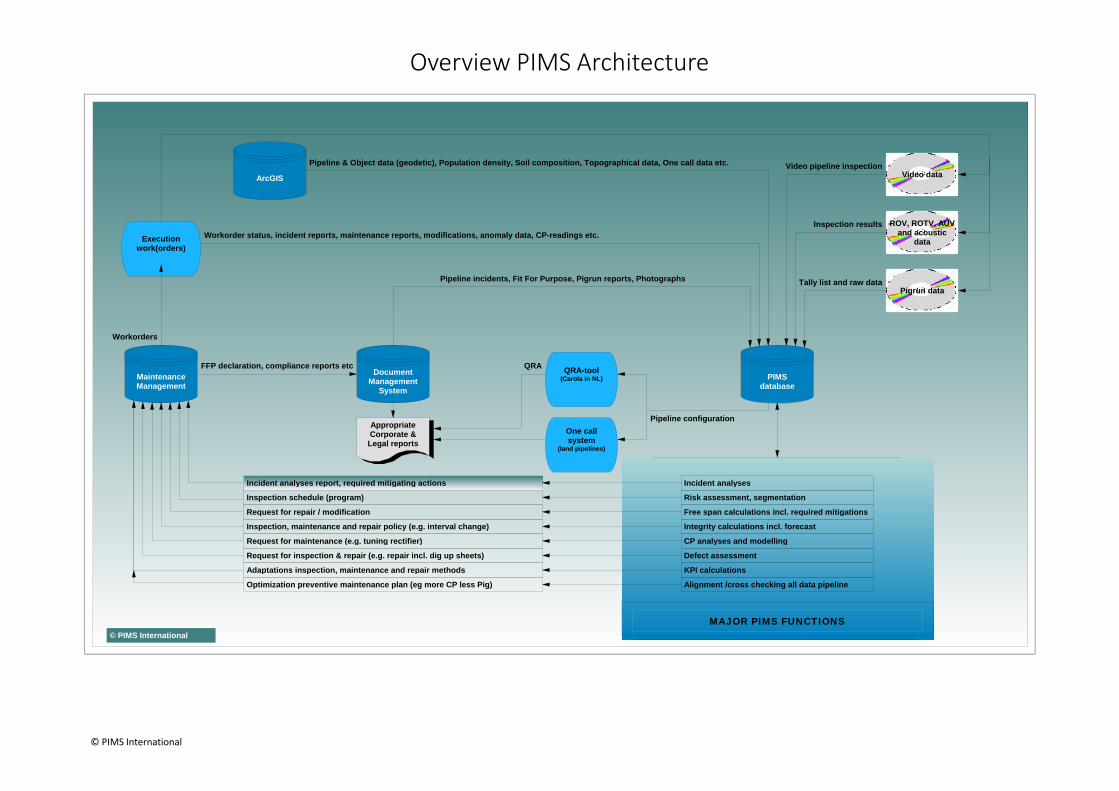
MAJOR PIMS FUNCTIONS
MaintenanceManagement
Adaptations inspection, maintenance and repair methods
© PIMS International
Optimization preventive maintenance plan (eg more CP less Pig)
QRA-tool(Carola in NL)
One callsystem
(land pipelines)
PIMSdatabase
Incident analyses
Free span calculations incl. required mitigations
Risk assessment, segmentation
Integrity calculations incl. forecast
CP analyses and modelling
Defect assessment
KPI calculations
FFP declaration, compliance reports etc
Workorder status, incident reports, maintenance reports, modifications, anomaly data, CP-readings etc.
Pipeline incidents, Fit For Purpose, Pigrun reports, Photographs
Video pipeline inspection
Inspection results
Pipeline & Object data (geodetic), Population density, Soil composition, Topographical data, One call data etc.
Workorders
Pipeline configuration
QRA
Tally list and raw data
Overview PIMS Architecture
© PIMS International
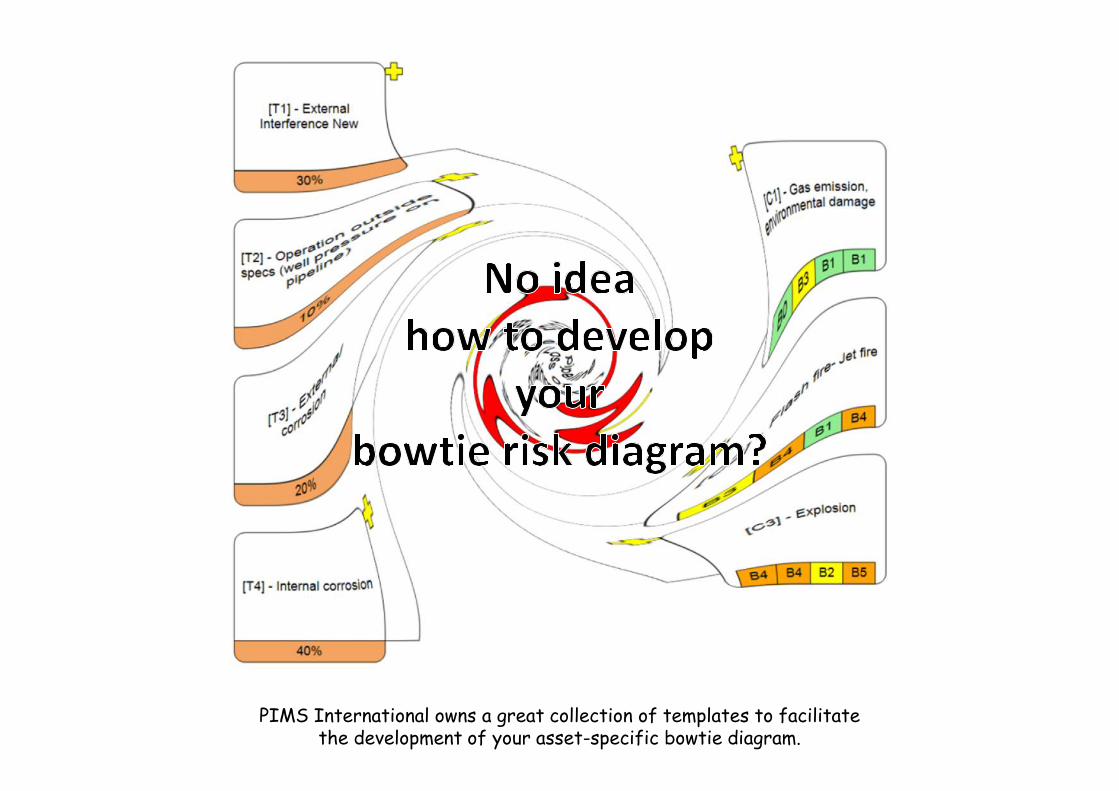
PIMS International owns a great collection of templates to facilitatethe development of your asset-specific bowtie diagram.
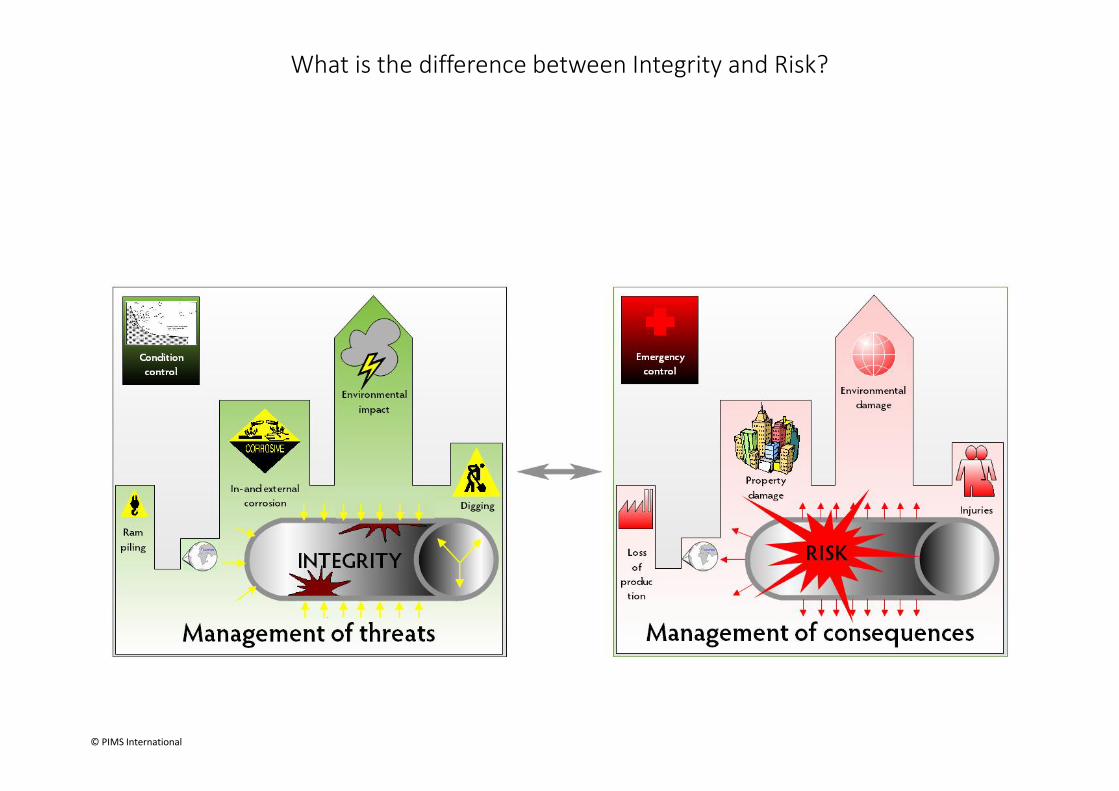
What is the difference between Integrity and Risk?
© PIMS International
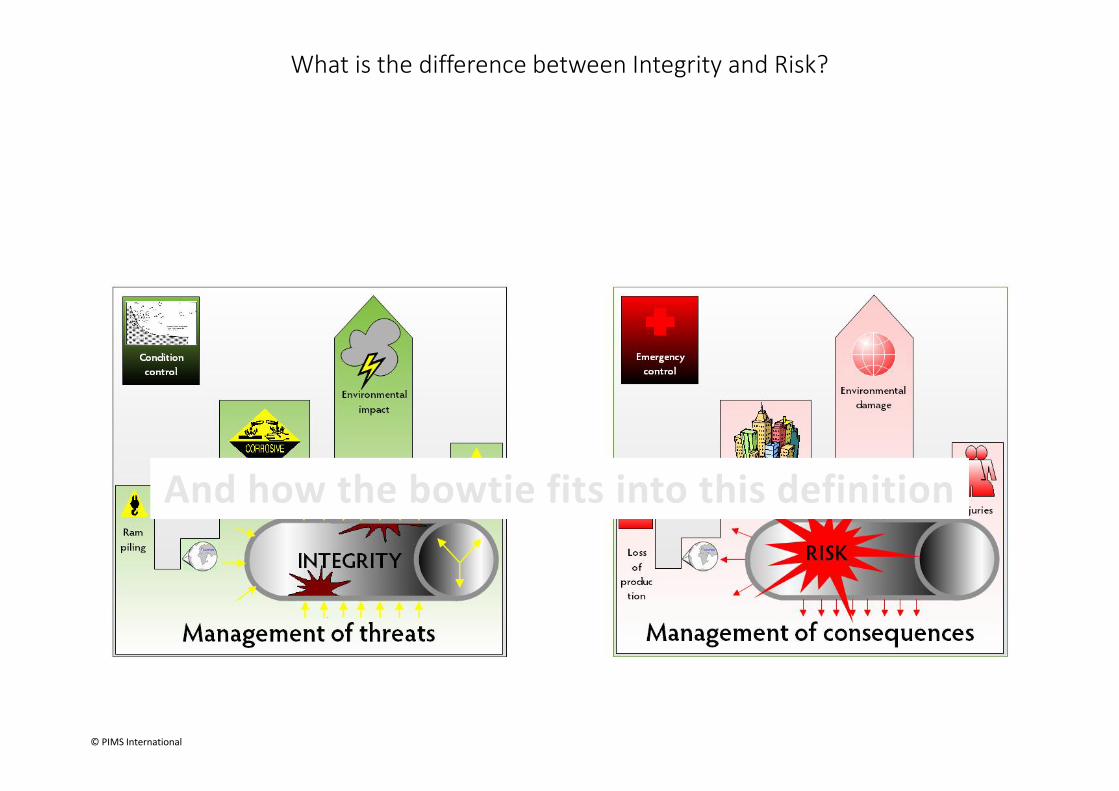
What is the difference between Integrity and Risk?
And how the bowtie fits into this definition
© PIMS International
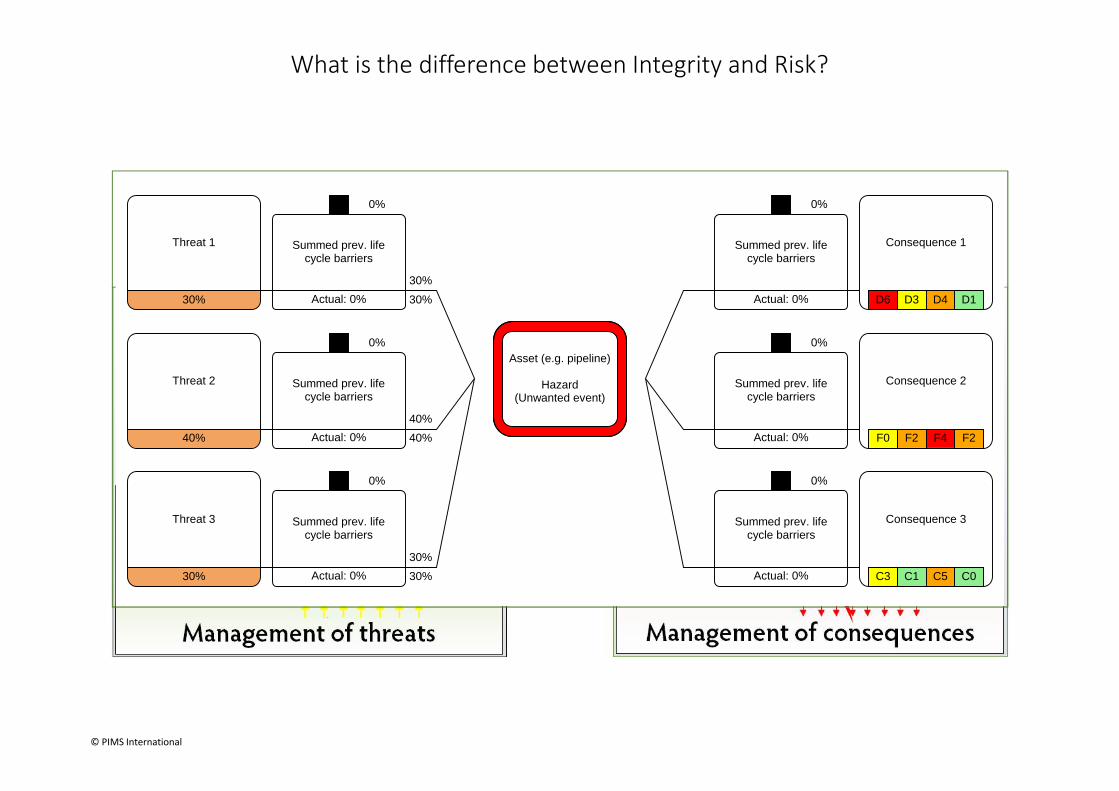
What is the difference between Integrity and Risk?
And how the bowtie fits into this definition
30%
30%
40%40%
30%30%
Asset (e.g. pipeline)
Hazard(Unwanted event)
Threat 1
30%
Summed prev. lifecycle barriers
Actual: 0%
0%
Threat 2
40%
Summed prev. lifecycle barriers
Actual: 0%
0%
Threat 3
30%
Summed prev. lifecycle barriers
Actual: 0%
0%
D6 D3 D4 D1
Consequence 1Summed prev. lifecycle barriers
Actual: 0%
0%
F0 F2 F4 F2
Consequence 2Summed prev. lifecycle barriers
Actual: 0%
0%
C3 C1 C5 C0
Consequence 3Summed prev. lifecycle barriers
Actual: 0%
0%
© PIMS International

Bowtie analyses PIMS International
Risk assessment workshop
2Selection of the Expert Team
of company
4Inventory threats for each
unwanted event
3Definition scope:
asset category andunwanted events
5Inventory consequences for
each unwanted event
6Ranking the risk matrix for
each consequence
7Inventory escalations for
each threat andconsequence per life cycle
Including the effectiveness and costs of eachexisting, improved and new mitigation
8Inventory mitigations for
each escalation (incl. optionsfor improvement)
Including the proportional contribution of eachthreat to that specific unwanted event
Unwanted event (e.g.):1. Pinhole2. Leak3. Rupture4. No flow
Including the proportional contribution of eachescalation to that specific threat
1Validation Risk Policy
(Benchmark risk matrix)
9Risk analyses
(Bowstar)
Final Report1. Bowtie diagram
2. Risk analyses incl mitigationeffectiveness
3. Conclusions4. Recommendations
10Concept Report
1. Bowtie diagram2. Risk analyses incl mitigation
effectiveness
11. Conclusions & Recommendations Expert Team
Bowtie diagram
Validation
Roadmap to a succesfull risk assessment with Bowstar
1. Used by key players in the industry,
2. Lots of templates from these key players thatsimplify your risk assessment and guaranteesoptimal results,
3. Maximum support by the very user friendlysoftware package,
4. The results are automatically transported to the:
1. Risk Register of Bowstar to control the risk mitigationprogram,
2. GIS-environment of Bowstar to find the high risk sectionsof the linear assets by dynamic segmentation (e.g.pipelines, high voltage power lines, dikes, railroads, watersupply etc.).
5. Full integration with Microsoft Office:
1. Generation of detailed Diagram Report in MS Word, usinga company specific template,
2. MS Excel up- and download of the diagram, analysesresults etc.,
3. Clipboard function to copy diagram, results, graphs etc.to your own text file.
6. Professional software package. Compatible withWindows, OSX, Linux etc. developed in C-Sharp
© PIMS International

Ranking risk matrix:1. People2. Assets3. Environment4. Reputation
Hazard: Highpressure
Unwanted event
Threats that can result inthe unwanted event incl. percentage
contribution (total = 100%)
It all starts with the setup of the basic bowtie diagram
Consequences that can result fromthe unwanted event
incl. ranking risk issues
© PIMS International

Subsea Pipelines
High gas pressure(Leak)
[T1] - ExternalInterference
34%
[T2] - Externalcorrosion
10%
[T3] - Internalcorrosion
51%
[T3.1] - Design
Actual: 19%
20%
[T3.2] - Construction
Actual: 10%
10%
[T3.3] -Commissioning
Actual: 0%
0%
[T3.4] - Operations
Actual: 60%
65%
[T3.5] - Maintenance
Actual: 5%
5%
[T3.5.1] - Severecorrosion is not
identified
100%
[T3.5.1.1] - Inlineinspection (ILI) to
indicate/verifyservere corrosion (≥
50% metal loss)1,45 MEur
90%90%
[T3.5.1.2] - Corrosioncoupons samplepoints to detectcorrosion rate
0,02 MEur
80%0%
[T3.5.1.3] - Spotmeasurement in accessible
area's (at suspiciousarea's) have indicated that
corrosion is minimal
0 MEur
90%90%
[T3.6] - 3rd Partyinterferenceprevention
Actual: 0%
0%
[T3.7] - Mothballing /removal
Actual: 0%
0%
[T4] - Erosion
5%
Life cycle barrier incl. percentageof total life cycle barriers
(total all life cycle barriers = 100%)
Threat that can result inthe unwanted event incl. percentage
contribution (total = 100%)
Mitigating measures incl costs:Green: implemented, no improvement possibleBlue: implemented, can be improvedRed: new mitigation, not implemented
Escalation factorincl. percentage contribution
to life cycle, mostly > 1(total = 100%)
Unwanted event
Threat incl. hiddenlife cycle barriers
Actual effectiveness life cyclebarrier
Hidden consequencesincl. hidden
life cycle barriers
Effectiveness mitigations:1. Potential2. Actual
The next step is the inventory of all threats (escalations) for all life cyclesFirst the preventive threats & mitigations
Hazard: Highpressure
(Loss ofcontainment)
© PIMS International
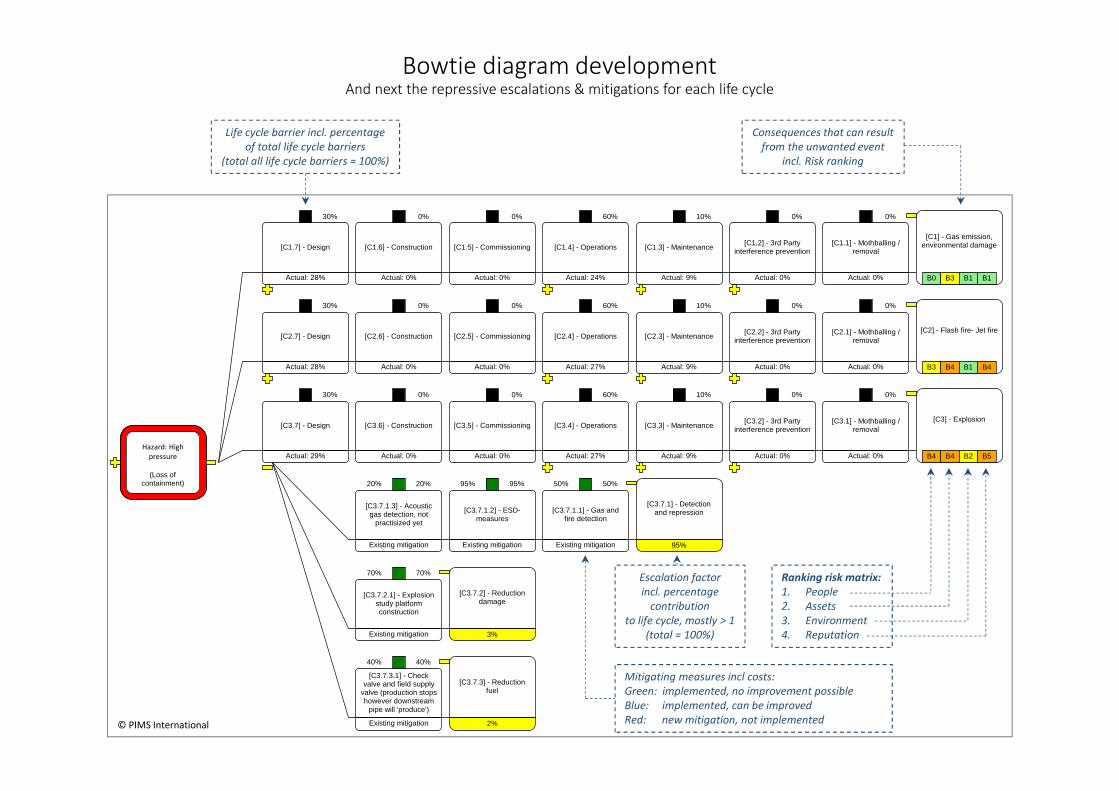
Bowtie diagram developmentAnd next the repressive escalations & mitigations for each life cycle
GdF Suez Assets2011
Sea pipeline(Loss of
containment)
B0 B3 B1 B1
[C1] - Gas emission,environmental damage[C1.1] - Mothballing /
removal
Actual: 0%
0%
[C1.2] - 3rd Partyinterference prevention
Actual: 0%
0%
[C1.3] - Maintenance
Actual: 9%
10%
[C1.4] - Operations
Actual: 24%
60%
[C1.5] - Commissioning
Actual: 0%
0%
[C1.6] - Construction
Actual: 0%
0%
[C1.7] - Design
Actual: 28%
30%
B3 B4 B1 B4
[C2] - Flash fire- Jet fire[C2.1] - Mothballing /removal
Actual: 0%
0%
[C2.2] - 3rd Partyinterference prevention
Actual: 0%
0%
[C2.3] - Maintenance
Actual: 9%
10%
[C2.4] - Operations
Actual: 27%
60%
[C2.5] - Commissioning
Actual: 0%
0%
[C2.6] - Construction
Actual: 0%
0%
[C2.7] - Design
Actual: 28%
30%
B4 B4 B2 B5
[C3] - Explosion[C3.1] - Mothballing /removal
Actual: 0%
0%
[C3.2] - 3rd Partyinterference prevention
Actual: 0%
0%
[C3.3] - Maintenance
Actual: 9%
10%
[C3.4] - Operations
Actual: 27%
60%
[C3.5] - Commissioning
Actual: 0%
0%
[C3.6] - Construction
Actual: 0%
0%
[C3.7] - Design
Actual: 29%
30%
[C3.7.1] - Detectionand repression
95%
[C3.7.1.1] - Gas andfire detection
Existing mitigation
50%50%
[C3.7.1.2] - ESD-measures
Existing mitigation
95%95%
[C3.7.1.3] - Acousticgas detection, not
practisized yet
Existing mitigation
20%20%
[C3.7.2] - Reductiondamage
3%
[C3.7.2.1] - Explosionstudy platformconstruction
Existing mitigation
70%70%
[C3.7.3] - Reductionfuel
2%
[C3.7.3.1] - Checkvalve and field supply
valve (production stopshowever downstream
pipe will 'produce')
Existing mitigation
40%40%
Life cycle barrier incl. percentageof total life cycle barriers
(total all life cycle barriers = 100%)
Consequences that can resultfrom the unwanted event
incl. Risk ranking
Ranking risk matrix:1. People2. Assets3. Environment4. Reputation
Mitigating measures incl costs:Green: implemented, no improvement possibleBlue: implemented, can be improvedRed: new mitigation, not implemented
Escalation factorincl. percentage
contributionto life cycle, mostly > 1
(total = 100%)
Hazard: Highpressure
© PIMS International
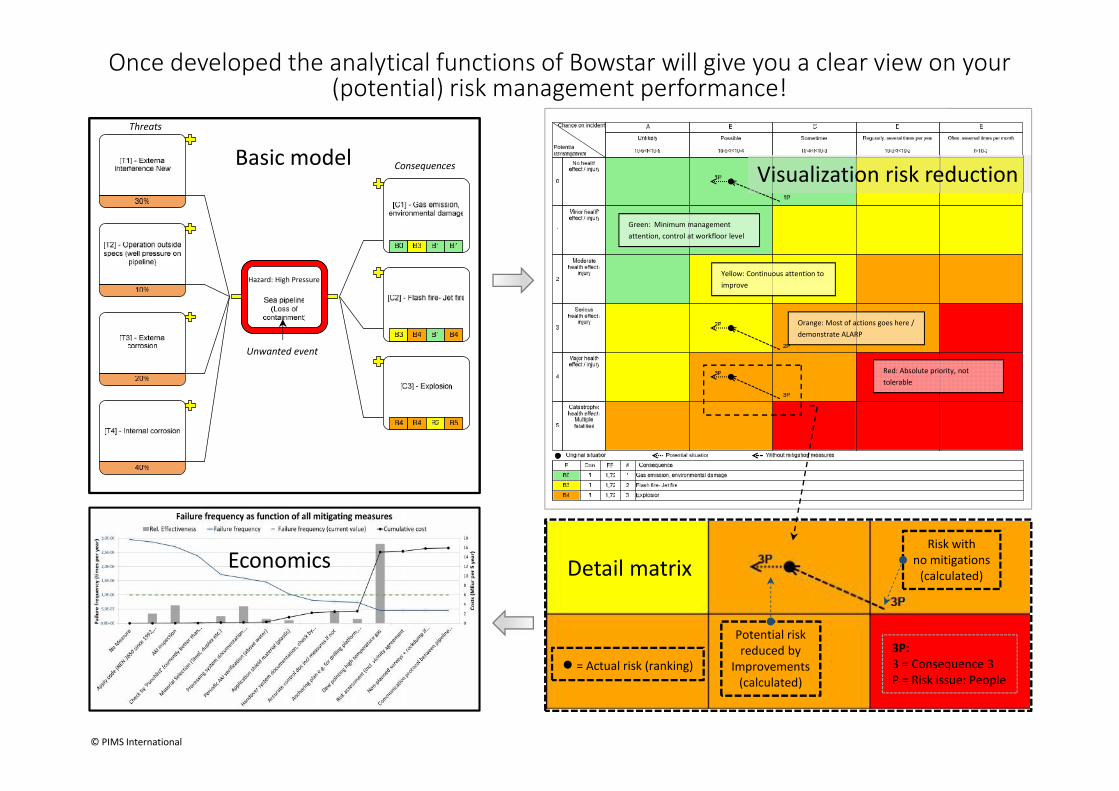
Potential riskreduced by
Improvements(calculated)
● = Actual risk (ranking)
Risk withno mitigations
(calculated)
3P:3 = Consequence 3P = Risk issue: People
Consequences
Unwanted event
Hazard: High Pressure
Threats
Basic model
Green: Minimum managementattention, control at workfloor level
Yellow: Continuous attention toimprove
Orange: Most of actions goes here /demonstrate ALARP
Red: Absolute priority, nottolerable
Visualization risk reduction
Detail matrix
Once developed the analytical functions of Bowstar will give you a clear view on your(potential) risk management performance!
© PIMS International
Economics

6%
6%
1%
1%
6%
6%
13%
3%
GdF Suez Assets2011
Sea pipeline(Loss of
containment)
[T1] - ExternalInterference New
30%
Summed prev. lifecycle barriers
Actual: 81%
81%
[T2] - Operation outsidespecs (well pressure on
pipeline)
10%
Summed prev. lifecycle barriers
Actual: 94%
94%
[T3] - Externalcorrosion
20%
Summed prev. lifecycle barriers
Actual: 69%
69%
[T4] - Internal corrosion
40%
Summed prev. lifecycle barriers
Actual: 67%
93%
B0 B3 B1 B1
[C1] - Gas emission,environmental damageSummed prev. life
cycle barriers
Actual: 61%
61%
B3 B4 B1 B4
[C2] - Flash fire- Jet fireSummed prev. lifecycle barriers
Actual: 64%
64%
B4 B4 B2 B5
[C3] - ExplosionSummed prev. lifecycle barriers
Actual: 64%
64%
Maximum summed barrier valueof all life cycles that can be achieved by the
implementation of all improvements
Current contribution threatto unwanted event
Potential contribution threatto unwanted event
Ranking risk matrix:1. People2. Assets3. Environment4. Reputation
Unwanted event
Actual summed barrier valueof all life cycles
Threat that can result inthe unwanted event incl.
percentagecontribution (total = 100%)
The condensed bowtie diagram delivers all informationon actual and potential mitigation performance
Hazard: Highpressure
Consequences that can resultFrom the unwanted event
incl. Risk ranking
© PIMS International

Full understanding and monitoring of your risk mitigation is provided by the Risk Register
© PIMS International
Actual risk level achieved bycompleted mitigations
Risk reduction potential
Risk levelwithoutmitigations
Maintenance department not involved in design criteria
© PIMS International

KPI-s: mitigation & life cycle performance are generated automatically
© PIMS International
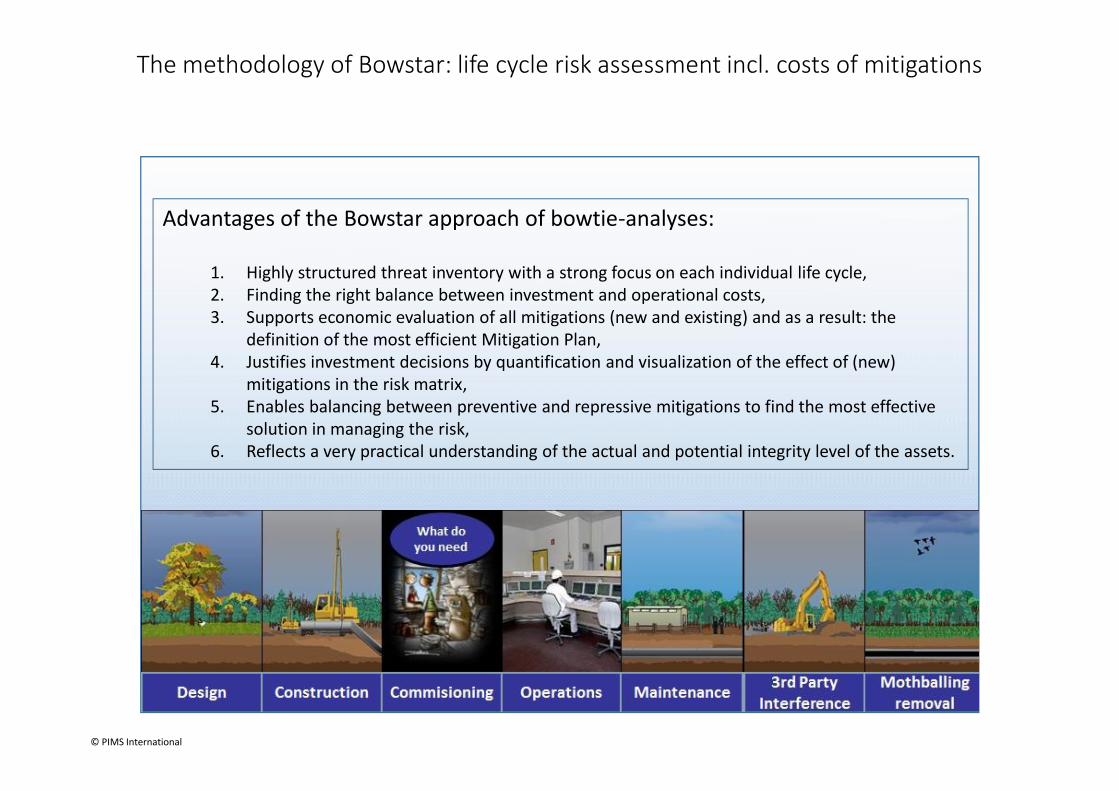
The methodology of Bowstar: life cycle risk assessment incl. costs of mitigations
© PIMS International
Advantages of the Bowstar approach of bowtie-analyses:
1. Highly structured threat inventory with a strong focus on each individual life cycle,2. Finding the right balance between investment and operational costs,3. Supports economic evaluation of all mitigations (new and existing) and as a result: the
definition of the most efficient Mitigation Plan,4. Justifies investment decisions by quantification and visualization of the effect of (new)
mitigations in the risk matrix,5. Enables balancing between preventive and repressive mitigations to find the most effective
solution in managing the risk,6. Reflects a very practical understanding of the actual and potential integrity level of the assets.

Bowstar GIS Functions
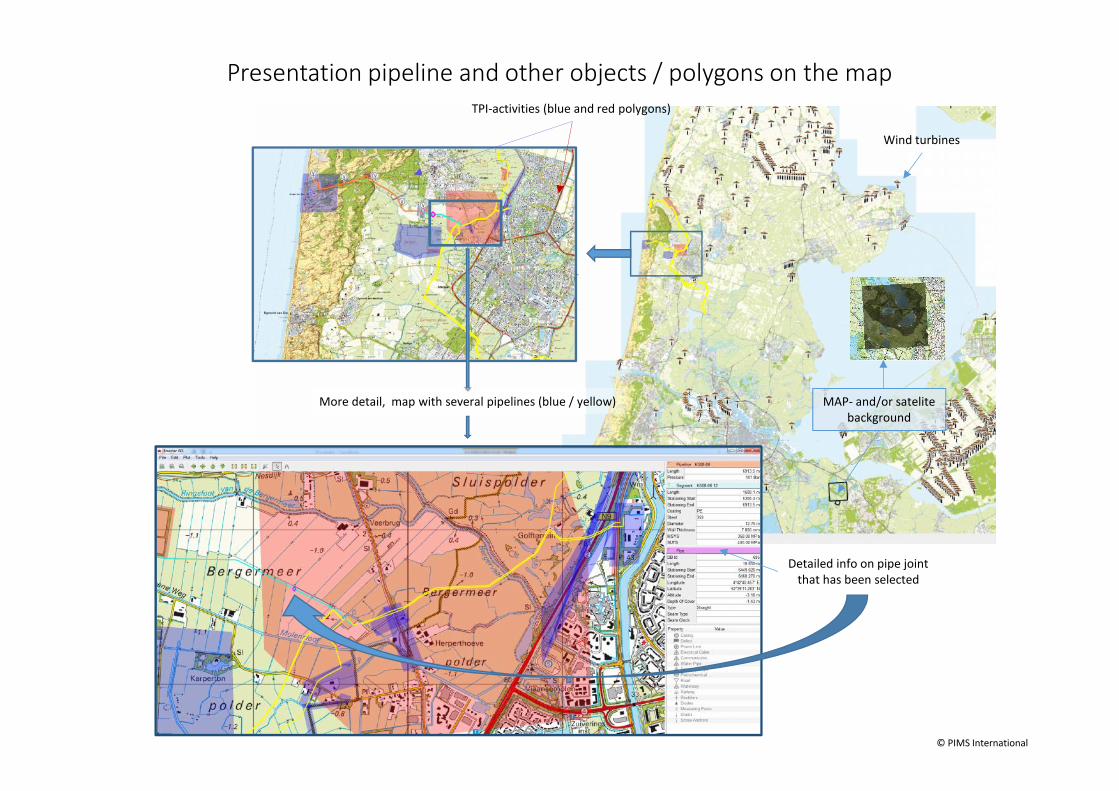
Presentation pipeline and other objects / polygons on the map
Wind turbines
TPI-activities (blue and red polygons)
More detail, map with several pipelines (blue / yellow)
Detailed info on pipe jointthat has been selected
MAP- and/or satelitebackground
© PIMS International

Flexible Map-layer selection and settings(incl. detailed information of selected objects)
Test
© PIMS International
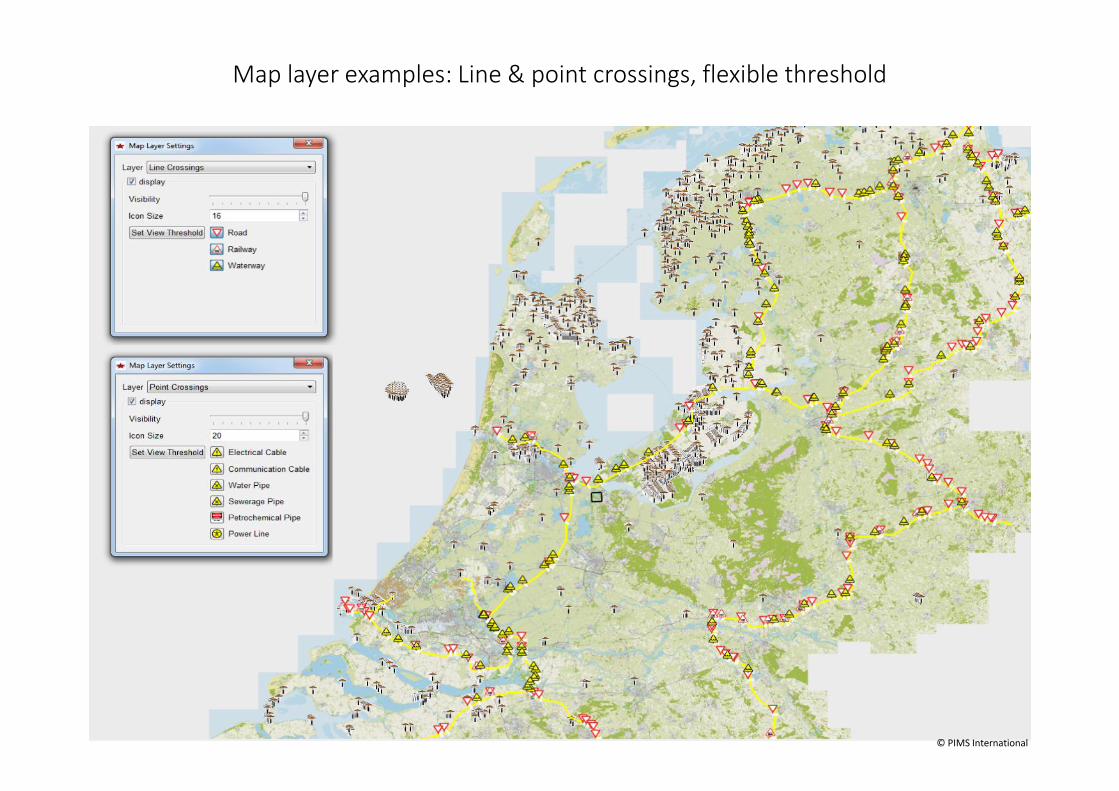
Map layer examples: Line & point crossings, flexible threshold
© PIMS International
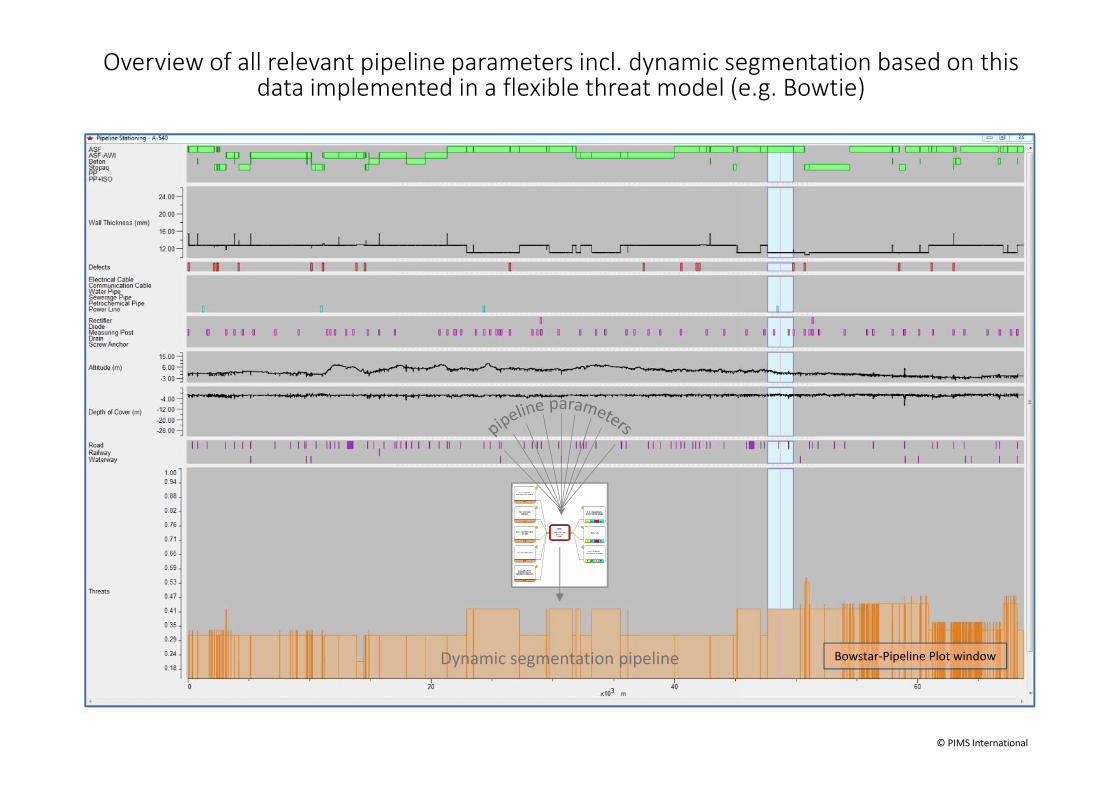
Overview of all relevant pipeline parameters incl. dynamic segmentation based on thisdata implemented in a flexible threat model (e.g. Bowtie)
Dynamic segmentation pipeline Bowstar-Pipeline Plot window
© PIMS International

All windows interconnected!
Bowstar-Risk window
Bowstar-GIS window
Selected segment
Individual threat contributions
Bowstar-Pipeline Plot window
© PIMS International
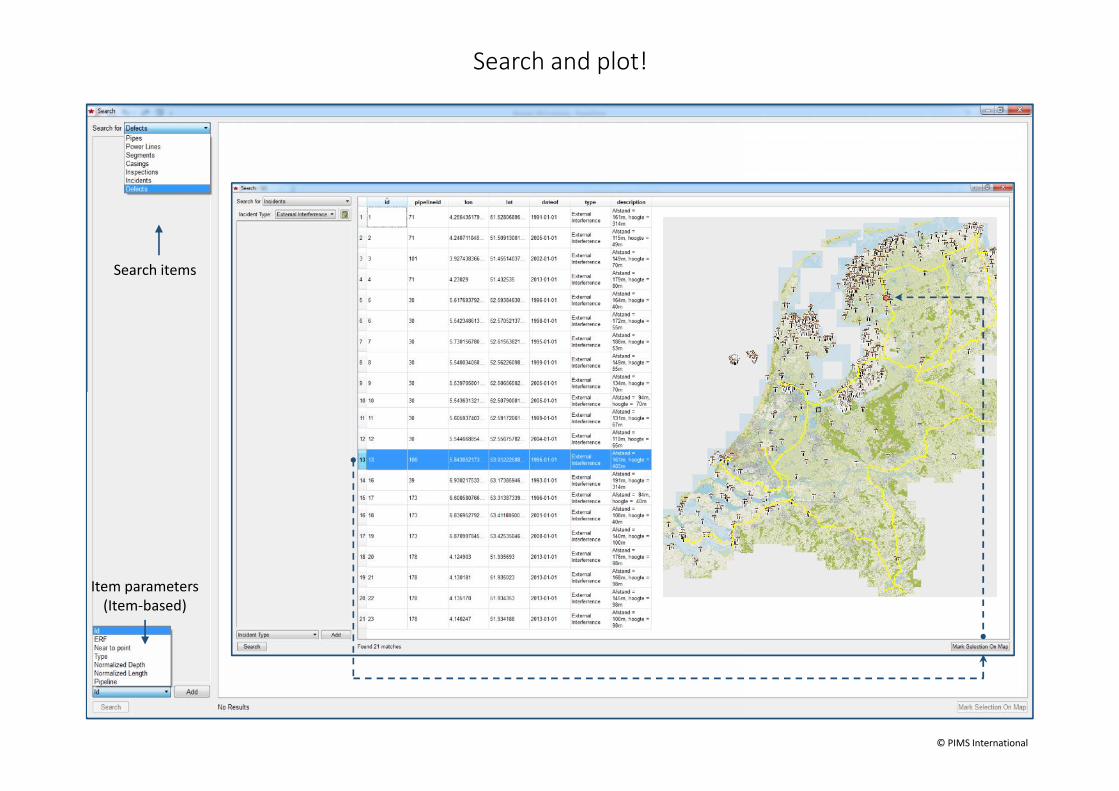
Search and plot!
Search items
Item parameters(Item-based)
© PIMS International

Flexible interface / user settings!
Example selection options
© PIMS International

Interface Bowstar – Bowstar GIS, options menu: Export function
© PIMS International

Import Bowstar file in Bowstar GIS – Risk module
© PIMS International

Bowtie presentation in Bowstar GIS (90 degree rotation)
© PIMS International

Each bar represents the overallthreat level of a pipeline. The threatlevel of the pipelines increases fromleft to right, the pipeline presentedat the right hand side of the picturehas the highest threat level =highest priority.
Threat profile along thepipeline route
The risk model from Bowstar bowtie is downloaded as a threat scheme in the Bowstar GIS Risk module.Additional algorithms are added in order to translate the generic risk analysis to a threat profile alongthe pipeline route on the basis of all relevant parameters. The Bowstar GIS module will calculate theoverall threat level of the pipeline (left picture) next to the threat profile of the pipeline (righ picture):
Risk ranking and dynamic segmentation with the Bowstar GIS – Risk module
Remark: If requested, any risk scheme (independent of the bowtie scheme) can be added to theBowstar GIS Risk module to enable dynamic segmentation of the pipelines.
© PIMS International
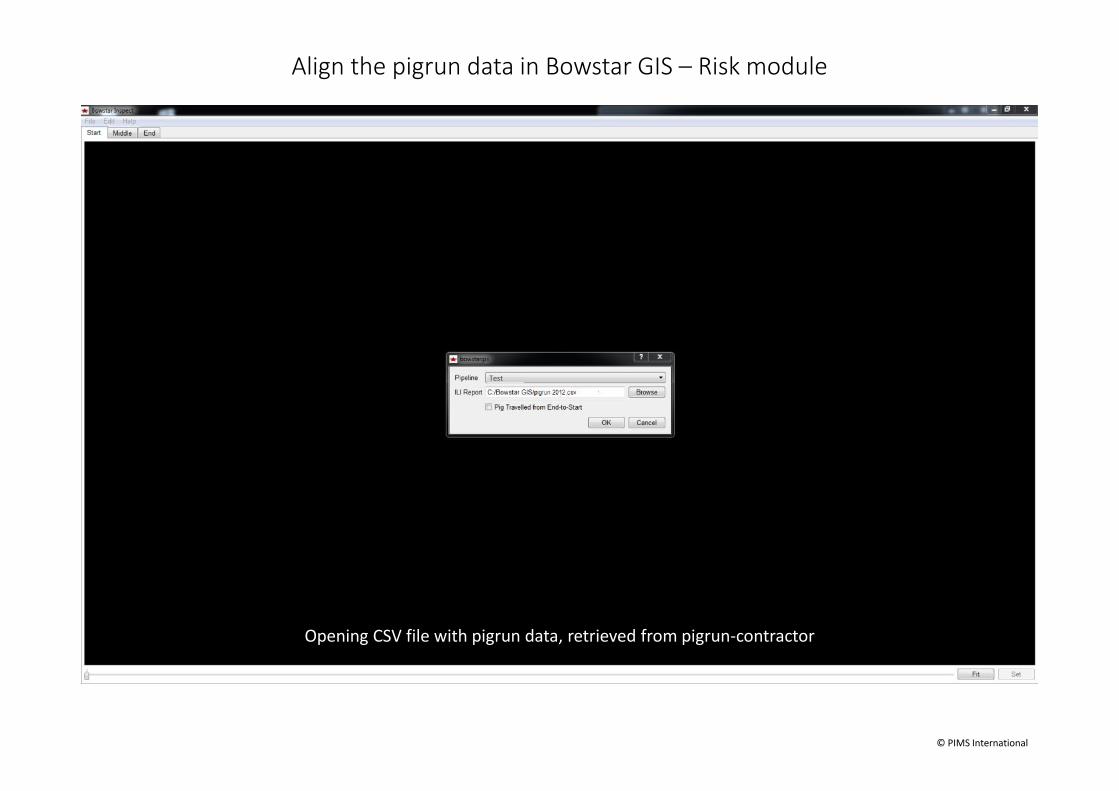
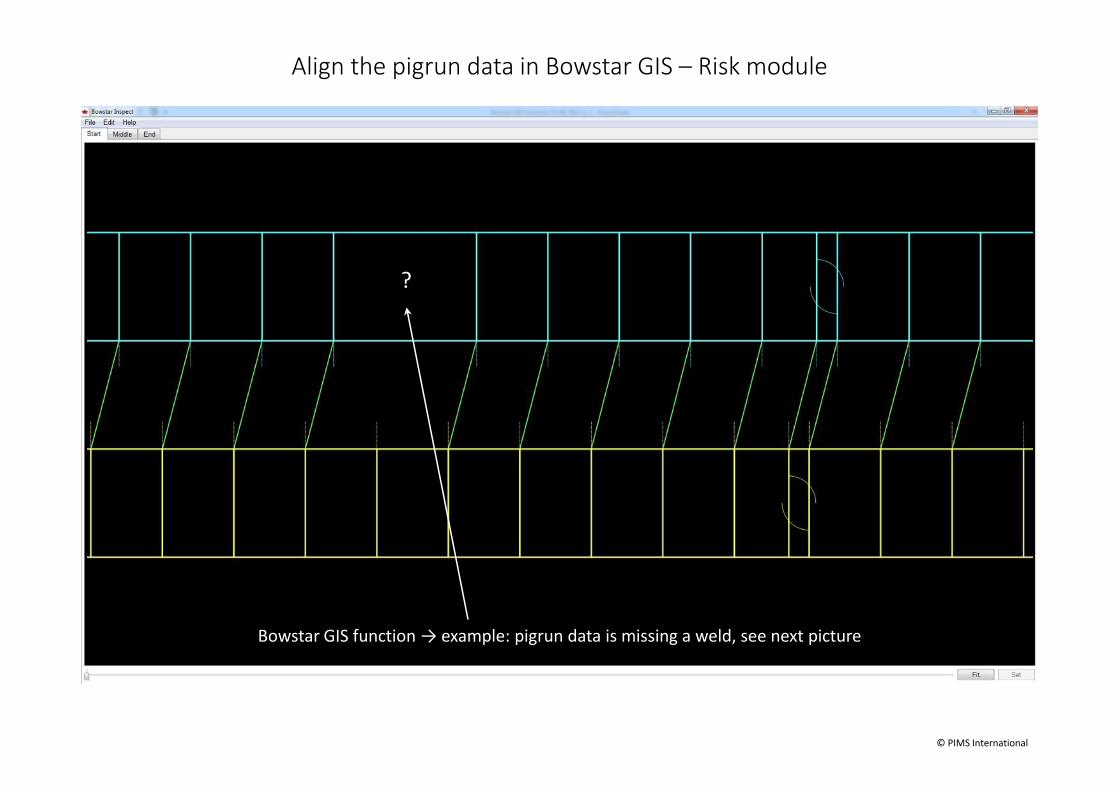
Align the pigrun data in Bowstar GIS – Risk module
Opening CSV file with pigrun data, retrieved from pigrun-contractor
Test
© PIMS International

Align the pigrun data in Bowstar GIS – Risk module
Bowstar GIS view → upper picture = pigrun data incl. welds; lower picture = pipeline joints from as built
© PIMS International

Align the pigrun data in Bowstar GIS – Risk module
Bowstar GIS function → matching joints, fine tuning and approval by hand
© PIMS International
Align the pigrun data in Bowstar GIS – Risk module
Bowstar GIS function → example: pigrun data is missing a weld, see next picture
?
© PIMS International
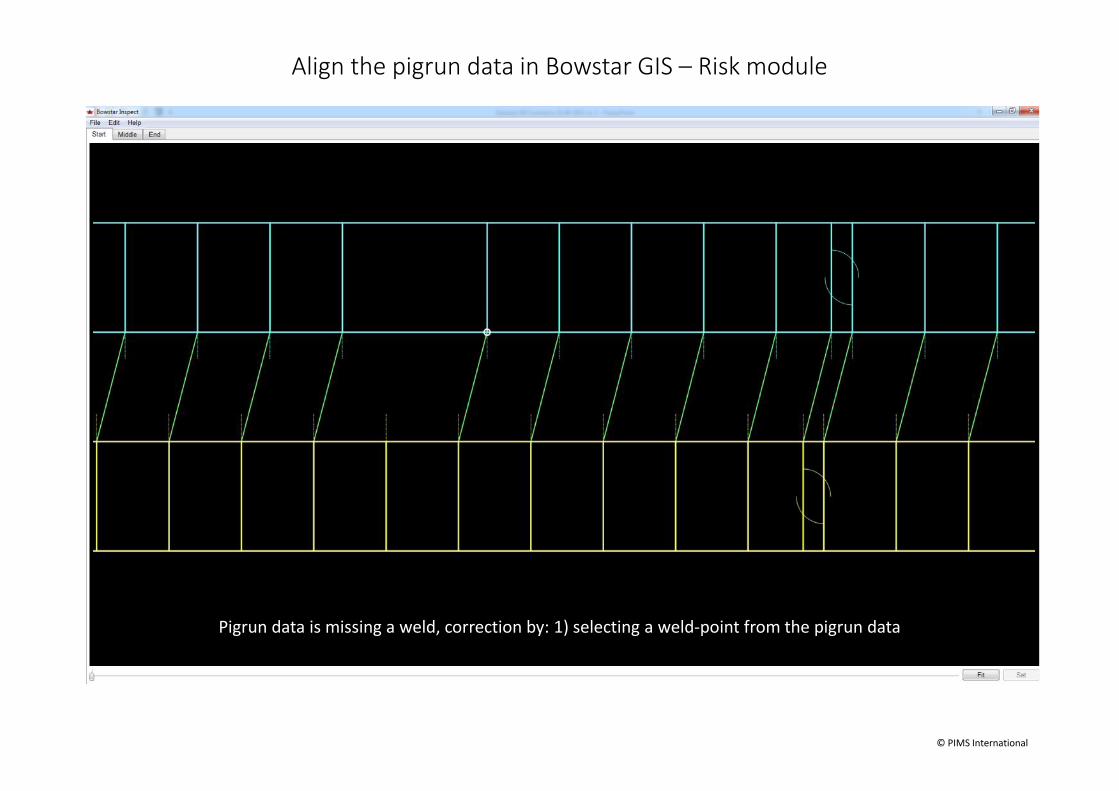
Align the pigrun data in Bowstar GIS – Risk module
Pigrun data is missing a weld, correction by: 1) selecting a weld-point from the pigrun data
© PIMS International

Align the pigrun data in Bowstar GIS – Risk module
Pigrun data is missing a weld, correction by: 2) drag weld-point to the correct position
© PIMS International

Align the pigrun data in Bowstar GIS – Risk module
Pigrun data is missing a weld, correction by: 3) Bowstar executes automatic re-ordening of the welds
© PIMS International

Align the pigrun data in Bowstar GIS – Risk module
Bowstar GIS function → 2nd example: pigrun data is missing a weld, short section needs positioning by the selecting theright weld-point
© PIMS International

Alignthe pigrun data in Bowstar GIS – Risk module
Bowstar GIS function → 2nd example: pigrun data is missing a weld, Bowstar executes automatic repositioning
© PIMS International

Align the pigrun data in Bowstar GIS – Risk module
Bowstar GIS function → once all welds are right positioned the corrected pigrun file is transferred to the Bowstar database
© PIMS International
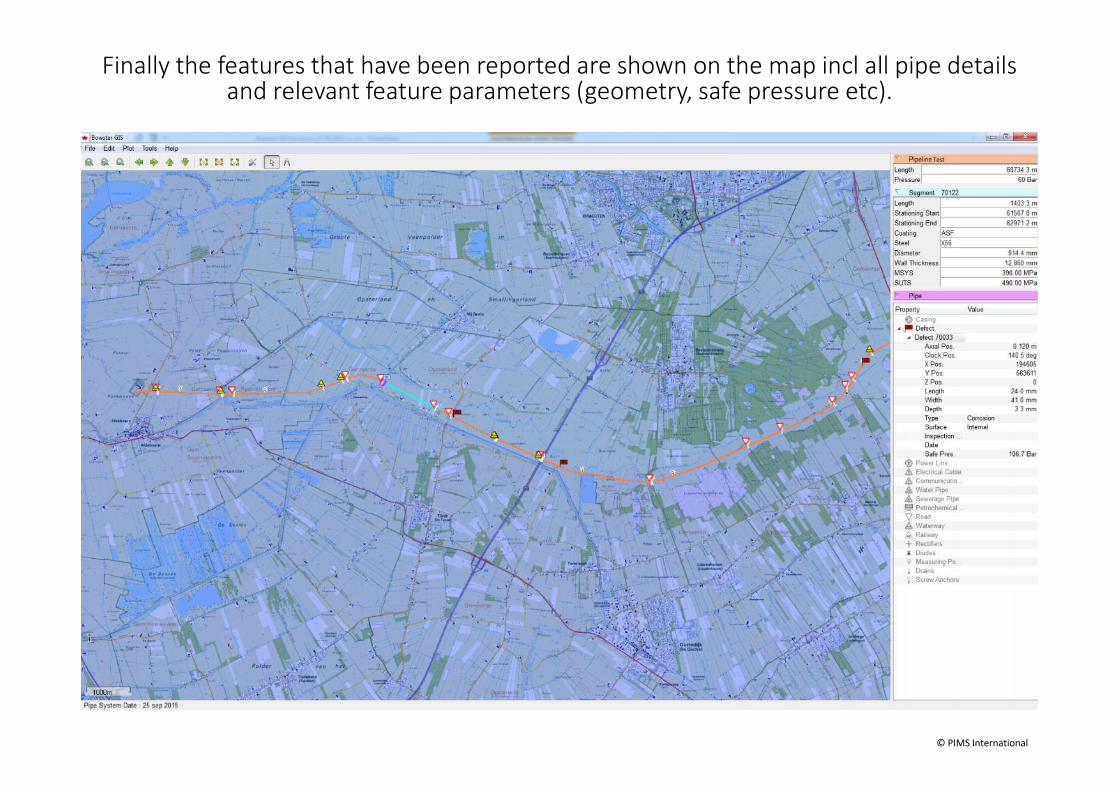
Finally the features that have been reported are shown on the map incl all pipe detailsand relevant feature parameters (geometry, safe pressure etc).
Test
© PIMS International
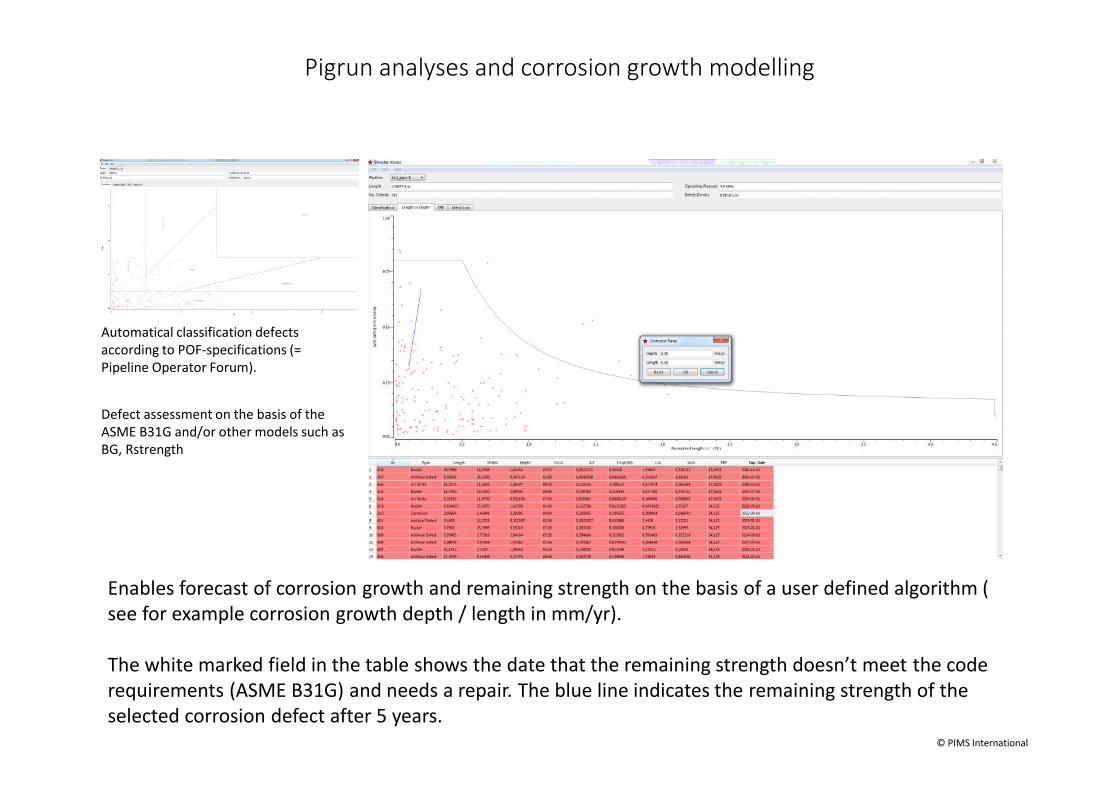
Pigrun analyses and corrosion growth modelling
Enables forecast of corrosion growth and remaining strength on the basis of a user defined algorithm (see for example corrosion growth depth / length in mm/yr).
The white marked field in the table shows the date that the remaining strength doesn’t meet the coderequirements (ASME B31G) and needs a repair. The blue line indicates the remaining strength of theselected corrosion defect after 5 years.
Automatical classification defectsaccording to POF-specifications (=Pipeline Operator Forum).
Defect assessment on the basis of theASME B31G and/or other models such asBG, Rstrength
© PIMS International
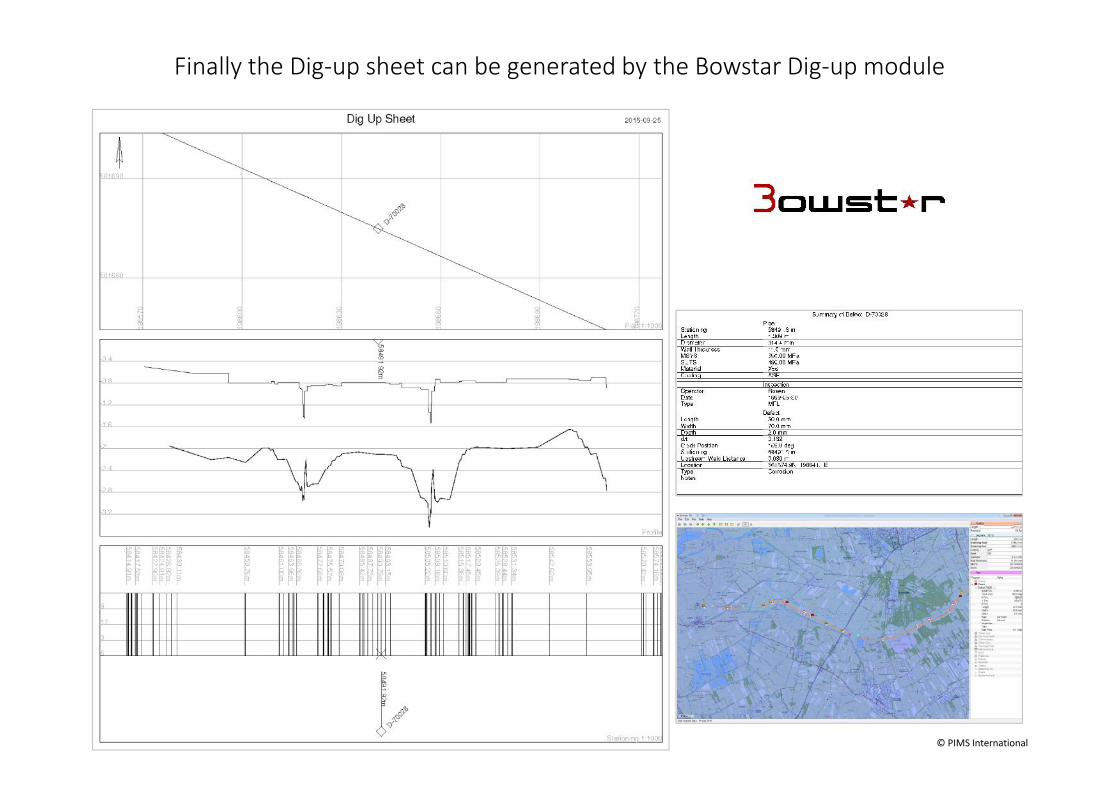
Finally the Dig-up sheet can be generated by the Bowstar Dig-up module
© PIMS International

Our customers and publications
PUBLICATIONS

© PIMS International