Embed Size (px)
Citation preview
Hardness and Density Distributions of Pharmaceutical TabletsMeasured by Terahertz Pulsed Imaging
ROBERT K. MAY,1 KE SU,1 LIANGHAO HAN,2 SHUNCONG ZHONG,3 JAMES A. ELLIOTT,2 LYNN F. GLADDEN,1 MIKE EVANS,4
YAOCHUN SHEN,3 J. AXEL ZEITLER1
1Department of Chemical Engineering and Biotechnology, University of Cambridge, Cambridge CB2 3RA, UK
2Department of Materials Science and Metallurgy, University of Cambridge, Cambridge CB2 3QZ, UK
3Department of Electrical Engineering and Electronics, University of Liverpool, Liverpool L69 3GJ, UK
4TeraView Ltd., St John’s Innovation Park, Cambridge, CB4 0WS, UK
Received 21 February 2013; revised 4 April 2013; accepted 4 April 2013
Published online 22 April 2013 in Wiley Online Library (wileyonlinelibrary.com). DOI 10.1002/jps.23560
ABSTRACT: We present terahertz pulsed imaging (TPI) as a novel tool to quantify the hard-ness and surface density distribution of pharmaceutical tablets. Good agreement between thesurface refractive index (SRI) measured by TPI and the crushing force measured from diametralcompression tests was found using a set of tablets that were compacted at various compressionforces. We also found a strong correlation between TPI results and tablet bulk density, andhow these relate to tablet hardness. Numerical simulations of tablet surface density distribu-tion by finite element analysis exhibit excellent agreement with the TPI measured SRI maps.These results show that TPI has an advantage over traditional diametral compression andis more suitable for nondestructive hardness and density distribution monitoring and controlof pharmaceutical manufacturing processes. © 2013 Wiley Periodicals, Inc. and the AmericanPharmacists Association J Pharm Sci 102:2179–2186, 2013Keywords: Mechanical properties; compaction; tableting; imaging methods; processing; tera-hertz pulsed imaging (TPI); tablet hardness testing; density distribution; finite element analysis(FEA); diametral compression test (DCT)
INTRODUCTION
Recently, terahertz pulsed imaging (TPI) has at-tracted increased attention due to a vast range ofpotential applications, especially in the field of phar-maceutical analysis such as tablet coating thick-ness measurement,1–4 dissolution testing,5 and solid-state characterization (e.g., polymorphism,6,7 phasetransitions,8,9 and hydrate forms10). An importantparameter in solid dosage form processing that re-quires precise detection and control is the hardness(tensile strength) of a compressed tablet. Hardnesstesting of solid oral dosage forms is important be-
Correspondence to: J. Axel Zeitler (Telephone: +44-1223-334783; Fax: +44-1223-334796; E-mail: [email protected])
Robert K. May’s present address is TeraView Ltd., St John’sInnovation Park, Cambridge CB4 0WS, UK.
Shuncong Zhong’s present address is School of Mechanical En-gineering and Automation, Fuzhou University, Fuzhou City, PRChina.Journal of Pharmaceutical Sciences, Vol. 102, 2179–2186 (2013)© 2013 Wiley Periodicals, Inc. and the American Pharmacists Association
cause it provides a quantitative estimate of the inter-nal bonding strength of the powder compact, which iswhat gives the tablet sufficient mechanical strengthto maintain its internal structure and geometry underapplied external forces. Variations in tablet hardnessare hence known to correlate with differences in dis-solution or mechanical response during any postcom-pression operations such as tablet coating, handling,packaging, storage, or shipping. In addition to thesefactors, there are more immediate consequences dur-ing processing: compaction of cylindrical tablets withan excessive compression force can result in tabletfailure due to a phenomenon called capping, whichis caused by internal stress relaxation following thetablet compaction.11
Traditionally hardness has been determined us-ing mechanical methods12 such as diametral com-pression test (DCT)13 whereby an increasing force isapplied to opposite sides of a tablet until the tabletfractures. However, this testing method is destruc-tive in nature and provides only an approximation of
JOURNAL OF PHARMACEUTICAL SCIENCES, VOL. 102, NO. 7, JULY 2013 2179
2180 MAY ET AL.
crushing strength. Furthermore, all mechanical test-ing methods are geometry dependent and cannot pro-vide any information regarding the spatial distribu-tion of tensile strength. To reduce process time andimprove measurement accuracy, a number of alterna-tive techniques, such as, near infrared spectroscopy(NIRS),14–16 Raman spectroscopy,17 and ultrasoundtesting18 have been developed to evaluate tablet hard-ness. All commonly used NIRS techniques are basedon multivariate spectral analysis, which is used toquantify the shift in spectral baseline due to a changein the scattering losses as a result of a change inporosity and hence density. The NIR light is reflectedfrom the surface of the tablets and harder tablets wereshown to have a smoother surface and hence higherreflectivity. The method requires careful calibrationand the development and validation of such modelsare often time consuming and have their own limi-tations. Given that the method largely depends on achange in the scattering losses with tablet hardnessthe NIRS method, as well as the Raman method, areinherently sensitive to changes in particle size of theformulation. In practice, this means that a new cali-bration is required if any of the formulation ingredi-ents change between batches, if demixing occurs or,in the case of granulated products, if the process con-ditions during the granulation step change. However,NIRS methods have been widely used in the com-munity to quantify tablet hardness for almost twodecades. Virtanen et al.17 have utilized Raman spec-troscopy to measure the crushing forces of tablets.The surface roughness of tablets is related to thecrushing force of tablets. As the Raman method issensitive to surface texture, it can be used only whenthe surfaces of the tablets are unaltered. Similar tothe NIRS method the Raman technique is typicallya pure surface measurement with a sampling depthof no more than a few micrometers. However, it ispossible in principle to obtain some depth resolvedmeasurements or to increase the sampling depth bychanging the sampling optics to collimate the exci-tation beam to a larger spot rather than focusing ittightly18 or by performing time-resolved or spatiallyoffset measurements.19,20 All these approaches havein common that the sampling volume is increaseddue to collecting photons that have diffused througha larger sample volume. However, it would be diffi-cult to use these techniques for imaging applicationsas the photon diffusion process in an inhomogeneousgranular medium would make it almost impossible toachieve a defined spatial resolution. Simonaho et al.21
have applied ultrasound transmission measurementsto evaluate the tensile strength of tablets. A goodcorrelation between the speed of sound and tensilestrength has been found. Terahertz-based measure-ment systems recently have been introduced in phar-maceutical tablet hardness measurement research.
The effect of compression force on the refractive in-dex of the solid oral dosage forms is quantified usingTPI by Palermo et al.22 However, to the best of ourknowledge, no experimental study of the relationshipbetween TPI results and tensile strength (crushingforce) has been published. We focus here on tabletsurface refractive index (SRI) by TPI and correlationbetween the TPI results with traditional DCT andfinite element analysis (FEA) simulation.
In this paper, the TPI method is used to evaluatethe hardness of both flat-faced and biconvex tablets.For this purpose, two sample sets with different ge-ometries are compressed at varying forces and theSRI is measured using TPI. After the TPI measure-ment, the tablet hardness (crushing force) is deter-mined using a destructive mechanical method (DCT)and compared with SRI values. In addition, surfacedensity distributions are calculated using the FEAmethod, and the numerical results are compared withTPI measured SRI maps.
MATERIALS AND METHODS
Materials
For these experiments, two batches of pharmaceuticaltablet cores with different geometries are prepared bydirect compression on a rotary tablet press (double-sided compression, XSpress R&D, Oystar-Manesty,Merseyside, UK) using lactose monohydrate powderunder eight different compression forces. Ten tabletswere sampled randomly for each compression force.The first batch consists of tablets with flat upper andlower surfaces and beveled edges (flat-faced, Fig. 1a).The second batch of tablets has convex upper andlower surfaces (biconvex, Fig. 1b). The thickness ofthe tablet is inversely proportional to the compressionforce. Before testing commenced, the tablets were leftfor one week to allow for relaxation of the compressedpowders. In addition, each tablet was weighed andits dimensions were measured with a micrometer toestimate the density of the tablets.
TPI Measurements
Terahertz pulsed imaging reflection measurements ofsample tablets were acquired using a TPI Imaga 2000(TeraView Ltd., Cambridge, UK). A detailed descrip-tion of the measurement technique was presentedearlier.23 The system has a useful spectral range of60 GHz to 3 THz, corresponding to a wavelength rangeof 0.09–5 mm. A pair of high resistivity silicon lensesin combination with silicon probe optics focus the THzradiation to a diffraction-limited spot (7 mm in frontof the silicon optics) at which the solid tablet is placedusing a six-axis robotic arm. All terahertz generationand detection components together with the optics areassembled into a probe unit. The surface height map
JOURNAL OF PHARMACEUTICAL SCIENCES, VOL. 102, NO. 7, JULY 2013 DOI 10.1002/jps
DISTRIBUTIONS OF PHARMACEUTICAL TABLETS MEASURED BY TERAHERTZ PULSED IMAGING 2181
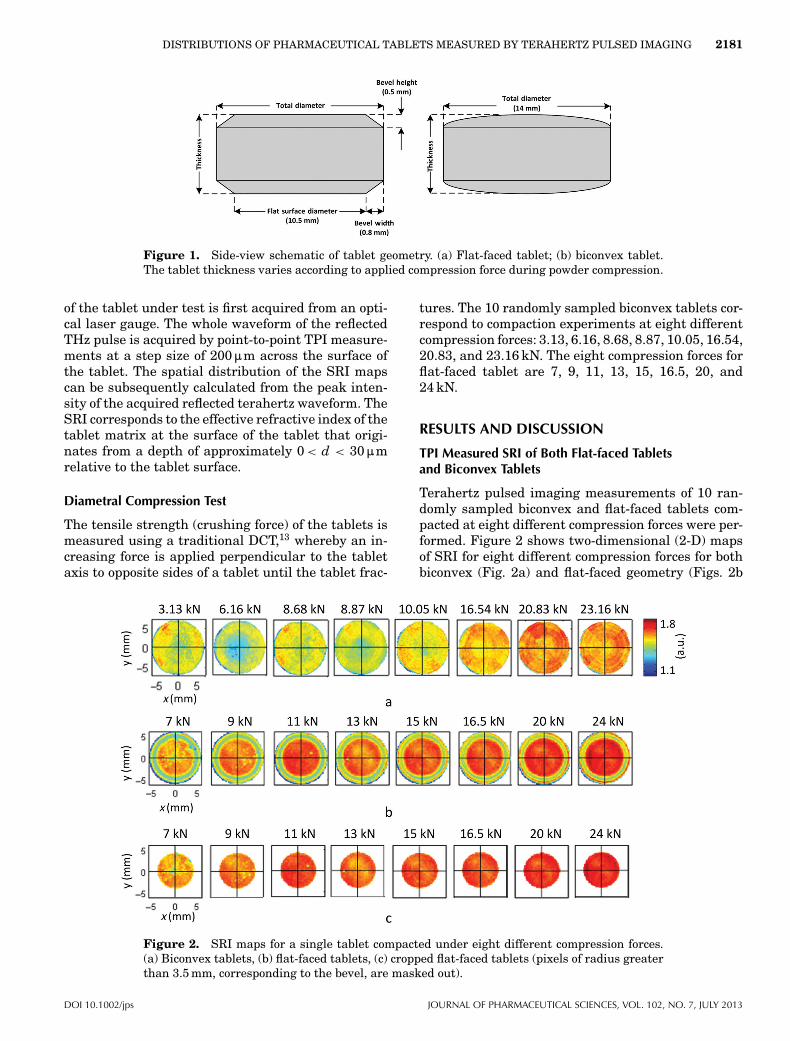
Figure 1. Side-view schematic of tablet geometry. (a) Flat-faced tablet; (b) biconvex tablet.The tablet thickness varies according to applied compression force during powder compression.
of the tablet under test is first acquired from an opti-cal laser gauge. The whole waveform of the reflectedTHz pulse is acquired by point-to-point TPI measure-ments at a step size of 200:m across the surface ofthe tablet. The spatial distribution of the SRI mapscan be subsequently calculated from the peak inten-sity of the acquired reflected terahertz waveform. TheSRI corresponds to the effective refractive index of thetablet matrix at the surface of the tablet that origi-nates from a depth of approximately 0 < d < 30:mrelative to the tablet surface.
Diametral Compression Test
The tensile strength (crushing force) of the tablets ismeasured using a traditional DCT,13 whereby an in-creasing force is applied perpendicular to the tabletaxis to opposite sides of a tablet until the tablet frac-
tures. The 10 randomly sampled biconvex tablets cor-respond to compaction experiments at eight differentcompression forces: 3.13, 6.16, 8.68, 8.87, 10.05, 16.54,20.83, and 23.16 kN. The eight compression forces forflat-faced tablet are 7, 9, 11, 13, 15, 16.5, 20, and24 kN.
RESULTS AND DISCUSSION
TPI Measured SRI of Both Flat-faced Tabletsand Biconvex Tablets
Terahertz pulsed imaging measurements of 10 ran-domly sampled biconvex and flat-faced tablets com-pacted at eight different compression forces were per-formed. Figure 2 shows two-dimensional (2-D) mapsof SRI for eight different compression forces for bothbiconvex (Fig. 2a) and flat-faced geometry (Figs. 2b
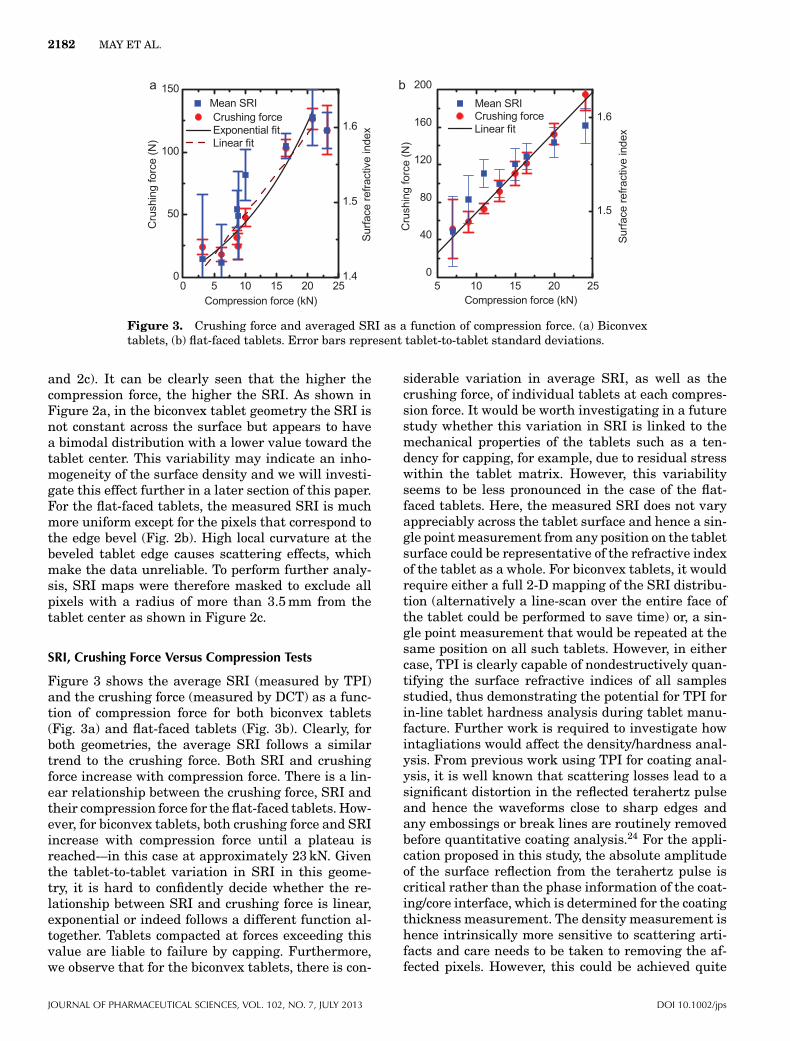
Figure 2. SRI maps for a single tablet compacted under eight different compression forces.(a) Biconvex tablets, (b) flat-faced tablets, (c) cropped flat-faced tablets (pixels of radius greaterthan 3.5 mm, corresponding to the bevel, are masked out).
DOI 10.1002/jps JOURNAL OF PHARMACEUTICAL SCIENCES, VOL. 102, NO. 7, JULY 2013
2182 MAY ET AL.
Figure 3. Crushing force and averaged SRI as a function of compression force. (a) Biconvextablets, (b) flat-faced tablets. Error bars represent tablet-to-tablet standard deviations.
and 2c). It can be clearly seen that the higher thecompression force, the higher the SRI. As shown inFigure 2a, in the biconvex tablet geometry the SRI isnot constant across the surface but appears to havea bimodal distribution with a lower value toward thetablet center. This variability may indicate an inho-mogeneity of the surface density and we will investi-gate this effect further in a later section of this paper.For the flat-faced tablets, the measured SRI is muchmore uniform except for the pixels that correspond tothe edge bevel (Fig. 2b). High local curvature at thebeveled tablet edge causes scattering effects, whichmake the data unreliable. To perform further analy-sis, SRI maps were therefore masked to exclude allpixels with a radius of more than 3.5 mm from thetablet center as shown in Figure 2c.
SRI, Crushing Force Versus Compression Tests
Figure 3 shows the average SRI (measured by TPI)and the crushing force (measured by DCT) as a func-tion of compression force for both biconvex tablets(Fig. 3a) and flat-faced tablets (Fig. 3b). Clearly, forboth geometries, the average SRI follows a similartrend to the crushing force. Both SRI and crushingforce increase with compression force. There is a lin-ear relationship between the crushing force, SRI andtheir compression force for the flat-faced tablets. How-ever, for biconvex tablets, both crushing force and SRIincrease with compression force until a plateau isreached-–in this case at approximately 23 kN. Giventhe tablet-to-tablet variation in SRI in this geome-try, it is hard to confidently decide whether the re-lationship between SRI and crushing force is linear,exponential or indeed follows a different function al-together. Tablets compacted at forces exceeding thisvalue are liable to failure by capping. Furthermore,we observe that for the biconvex tablets, there is con-
siderable variation in average SRI, as well as thecrushing force, of individual tablets at each compres-sion force. It would be worth investigating in a futurestudy whether this variation in SRI is linked to themechanical properties of the tablets such as a ten-dency for capping, for example, due to residual stresswithin the tablet matrix. However, this variabilityseems to be less pronounced in the case of the flat-faced tablets. Here, the measured SRI does not varyappreciably across the tablet surface and hence a sin-gle point measurement from any position on the tabletsurface could be representative of the refractive indexof the tablet as a whole. For biconvex tablets, it wouldrequire either a full 2-D mapping of the SRI distribu-tion (alternatively a line-scan over the entire face ofthe tablet could be performed to save time) or, a sin-gle point measurement that would be repeated at thesame position on all such tablets. However, in eithercase, TPI is clearly capable of nondestructively quan-tifying the surface refractive indices of all samplesstudied, thus demonstrating the potential for TPI forin-line tablet hardness analysis during tablet manu-facture. Further work is required to investigate howintagliations would affect the density/hardness anal-ysis. From previous work using TPI for coating anal-ysis, it is well known that scattering losses lead to asignificant distortion in the reflected terahertz pulseand hence the waveforms close to sharp edges andany embossings or break lines are routinely removedbefore quantitative coating analysis.24 For the appli-cation proposed in this study, the absolute amplitudeof the surface reflection from the terahertz pulse iscritical rather than the phase information of the coat-ing/core interface, which is determined for the coatingthickness measurement. The density measurement ishence intrinsically more sensitive to scattering arti-facts and care needs to be taken to removing the af-fected pixels. However, this could be achieved quite
JOURNAL OF PHARMACEUTICAL SCIENCES, VOL. 102, NO. 7, JULY 2013 DOI 10.1002/jps
DISTRIBUTIONS OF PHARMACEUTICAL TABLETS MEASURED BY TERAHERTZ PULSED IMAGING 2183
fit
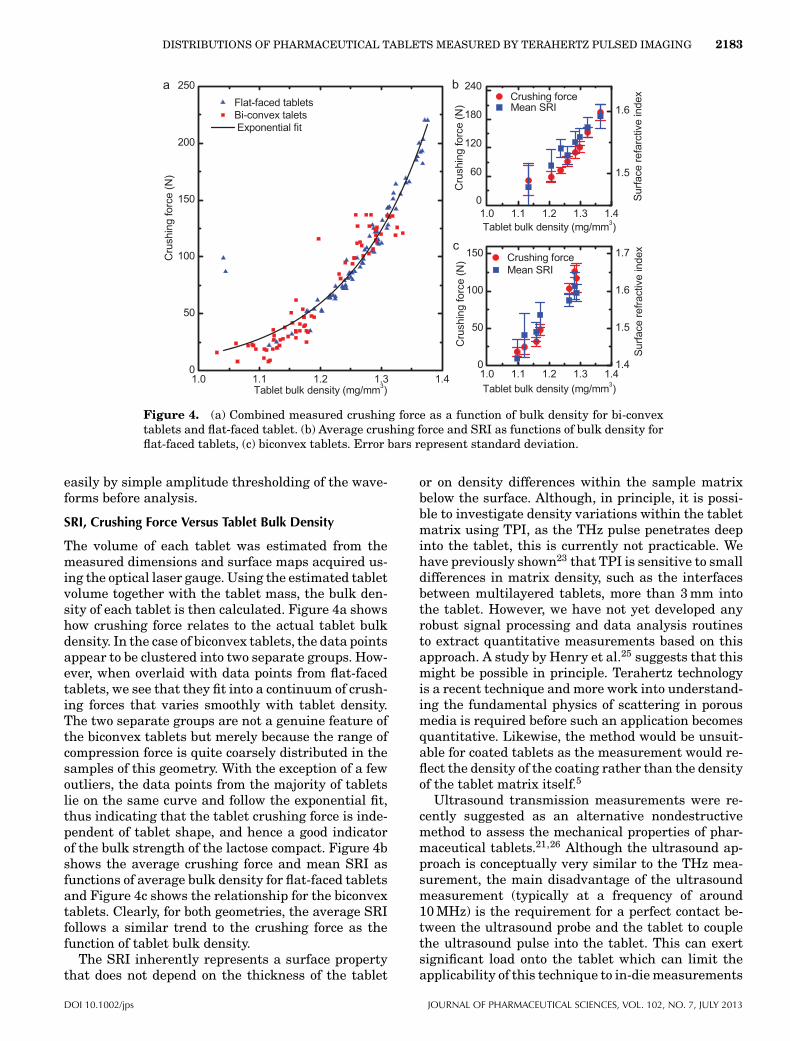
Figure 4. (a) Combined measured crushing force as a function of bulk density for bi-convextablets and flat-faced tablet. (b) Average crushing force and SRI as functions of bulk density forflat-faced tablets, (c) biconvex tablets. Error bars represent standard deviation.
easily by simple amplitude thresholding of the wave-forms before analysis.
SRI, Crushing Force Versus Tablet Bulk Density
The volume of each tablet was estimated from themeasured dimensions and surface maps acquired us-ing the optical laser gauge. Using the estimated tabletvolume together with the tablet mass, the bulk den-sity of each tablet is then calculated. Figure 4a showshow crushing force relates to the actual tablet bulkdensity. In the case of biconvex tablets, the data pointsappear to be clustered into two separate groups. How-ever, when overlaid with data points from flat-facedtablets, we see that they fit into a continuum of crush-ing forces that varies smoothly with tablet density.The two separate groups are not a genuine feature ofthe biconvex tablets but merely because the range ofcompression force is quite coarsely distributed in thesamples of this geometry. With the exception of a fewoutliers, the data points from the majority of tabletslie on the same curve and follow the exponential fit,thus indicating that the tablet crushing force is inde-pendent of tablet shape, and hence a good indicatorof the bulk strength of the lactose compact. Figure 4bshows the average crushing force and mean SRI asfunctions of average bulk density for flat-faced tabletsand Figure 4c shows the relationship for the biconvextablets. Clearly, for both geometries, the average SRIfollows a similar trend to the crushing force as thefunction of tablet bulk density.
The SRI inherently represents a surface propertythat does not depend on the thickness of the tablet
or on density differences within the sample matrixbelow the surface. Although, in principle, it is possi-ble to investigate density variations within the tabletmatrix using TPI, as the THz pulse penetrates deepinto the tablet, this is currently not practicable. Wehave previously shown23 that TPI is sensitive to smalldifferences in matrix density, such as the interfacesbetween multilayered tablets, more than 3 mm intothe tablet. However, we have not yet developed anyrobust signal processing and data analysis routinesto extract quantitative measurements based on thisapproach. A study by Henry et al.25 suggests that thismight be possible in principle. Terahertz technologyis a recent technique and more work into understand-ing the fundamental physics of scattering in porousmedia is required before such an application becomesquantitative. Likewise, the method would be unsuit-able for coated tablets as the measurement would re-flect the density of the coating rather than the densityof the tablet matrix itself.5
Ultrasound transmission measurements were re-cently suggested as an alternative nondestructivemethod to assess the mechanical properties of phar-maceutical tablets.21,26 Although the ultrasound ap-proach is conceptually very similar to the THz mea-surement, the main disadvantage of the ultrasoundmeasurement (typically at a frequency of around10 MHz) is the requirement for a perfect contact be-tween the ultrasound probe and the tablet to couplethe ultrasound pulse into the tablet. This can exertsignificant load onto the tablet which can limit theapplicability of this technique to in-die measurements
DOI 10.1002/jps JOURNAL OF PHARMACEUTICAL SCIENCES, VOL. 102, NO. 7, JULY 2013
2184 MAY ET AL.
or relatively hard tablets only. In contrast, at THz fre-quencies the difference in refractive index between airand tablet is sufficiently low and coupling from freespace is no problem, hence the THz technique is a non-contact method. However, the ultrasound techniquehas the advantage of even greater penetration depthdue to the much higher power of currently availablesensors.
Radial Distribution in Surface Tablet Density andRefractive Index as Measured by TPI and Simulatedby FEA in Biconvex Tablets
As illustrated by the SRI maps shown in Figure 2a,the spatial distribution of SRI across the surface of bi-convex tablets is inhomogeneous. We will investigatethe relationship between SRI and surface density (assimulated by FEA) as a function of tablet radius inthis section.
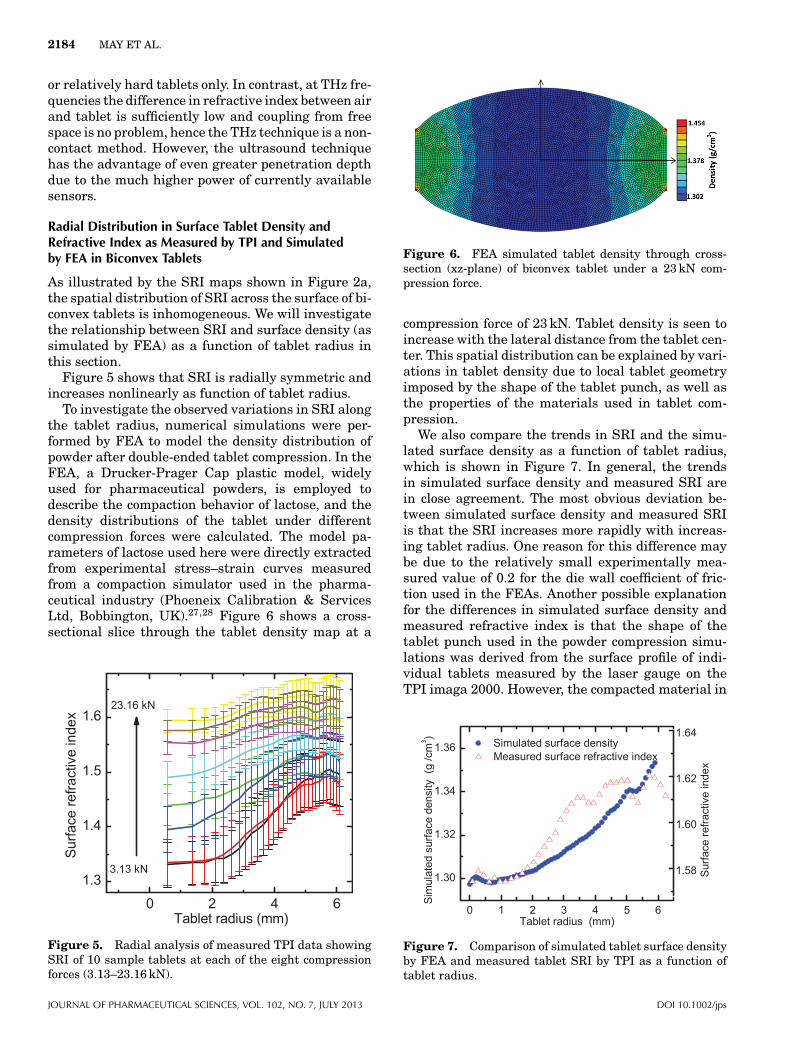
Figure 5 shows that SRI is radially symmetric andincreases nonlinearly as function of tablet radius.
To investigate the observed variations in SRI alongthe tablet radius, numerical simulations were per-formed by FEA to model the density distribution ofpowder after double-ended tablet compression. In theFEA, a Drucker-Prager Cap plastic model, widelyused for pharmaceutical powders, is employed todescribe the compaction behavior of lactose, and thedensity distributions of the tablet under differentcompression forces were calculated. The model pa-rameters of lactose used here were directly extractedfrom experimental stress–strain curves measuredfrom a compaction simulator used in the pharma-ceutical industry (Phoeneix Calibration & ServicesLtd, Bobbington, UK).27,28 Figure 6 shows a cross-sectional slice through the tablet density map at a
Figure 5. Radial analysis of measured TPI data showingSRI of 10 sample tablets at each of the eight compressionforces (3.13–23.16 kN).
Figure 6. FEA simulated tablet density through cross-section (xz-plane) of biconvex tablet under a 23 kN com-pression force.
compression force of 23 kN. Tablet density is seen toincrease with the lateral distance from the tablet cen-ter. This spatial distribution can be explained by vari-ations in tablet density due to local tablet geometryimposed by the shape of the tablet punch, as well asthe properties of the materials used in tablet com-pression.
We also compare the trends in SRI and the simu-lated surface density as a function of tablet radius,which is shown in Figure 7. In general, the trendsin simulated surface density and measured SRI arein close agreement. The most obvious deviation be-tween simulated surface density and measured SRIis that the SRI increases more rapidly with increas-ing tablet radius. One reason for this difference maybe due to the relatively small experimentally mea-sured value of 0.2 for the die wall coefficient of fric-tion used in the FEAs. Another possible explanationfor the differences in simulated surface density andmeasured refractive index is that the shape of thetablet punch used in the powder compression simu-lations was derived from the surface profile of indi-vidual tablets measured by the laser gauge on theTPI imaga 2000. However, the compacted material in
Figure 7. Comparison of simulated tablet surface densityby FEA and measured tablet SRI by TPI as a function oftablet radius.
JOURNAL OF PHARMACEUTICAL SCIENCES, VOL. 102, NO. 7, JULY 2013 DOI 10.1002/jps
DISTRIBUTIONS OF PHARMACEUTICAL TABLETS MEASURED BY TERAHERTZ PULSED IMAGING 2185
the biconvex tablets will undergo the relaxation af-ter ejection from the die, which is nonuniform due tothe density variation within the tablet; therefore, theshape of the compressed tablet may not be a true rep-resentation of the punch used in pressing the tablets.
The results support the findings by Palermo et al.,22
where a casual correlation between surface densityand THz refractive index was proposed. In addition,the good correlation between surface density and SRIagrees well with the concept of an effective refractiveindex, which is strongly dependent on the porosity ofthe material.29–33 With an increase in porosity, theeffective refractive index decreases due to the lowerdensity of the material. This is conceptually quite dif-ferent to the NIRS and Raman methods that havebeen used to quantify tablet hardness measurements.In these methods, the surface hardness is correlatedto a change in scattering losses: harder tablets havea smoother surface and hence exhibit a higher reflec-tivity as scattering from pores of length scales on thewavelength of the light used (typically 500–1100 nm)is reduced. In contrast, the pulses of THz radiationspan wavelengths from 100:m to 3 mm and hencethe contrast mechanism in this technique is not pri-marily scattering but rather the change in density ofthe bulk matrix itself, albeit in this study still directlybelow the surface rather than in the core of the tabletmatrix. Because of the increase in porosity the tabletmedium becomes an optically less dense medium asair is exhibiting negligible absorption compared withthe drug and excipient matrix. It is this ability toprobe the bulk microstructure of the tablet matrix,which gives the THz technique particular sensitivityto the mechanical strength of the material becausethe cohesive strength of the tablet is governed by theinterparticulate bonding, which, in turn, is closely re-lated to, though not exclusively dependent on, theresulting particle and pore sizes in the drug excipi-ent matrix. However, it remains to be investigated infuture studies how much the sensitivity of the THztechnique is affected by lubricants and other formu-lation components, such as API, which might have adirect impact on the cohesive strength between parti-cles beyond the resolution of this technique.
It is important to stress that we do not consider thatthe TPI technique as a suitable replacement methodfor diametral hardness testing. The physical proper-ties that are tested for in both methods are different:although the diametral hardness test directly mea-sures the mechanical strength of the powder com-pact, the TPI method measures the effective refrac-tive index of the sample. Both parameters are linkedthrough the microstructure of the tablet matrix, butalthough the hardness testing measures the bulk me-chanical response, the TPI measurement currentlyonly represents a much smaller sampling volume, pre-dominantly at the surface of the tablet. The ability to
spatially map out the density inhomogeneity over thesurface of the tablet is unique to the TPI method andit could be of interest during the optimization of theformulation or the fine tuning of the tableting process.
CONCLUSIONS
Tablets with two geometries (flat-surface and bicon-vex) are compacted at various compression forces andTPI technique is used to determine the SRI spatialdistribution map. These SRI values are comparedwith the crushing force, which indicates the hardnessof the tablet. In this proof-of-principle study, we havefound that SRI increases with compaction force andhas a strong correlation with the crushing force forboth geometries. We also found a strong correlationbetween the TPI results (SRI) and tablet bulk densityand how this relates to tablet hardness. Thus, TPI is apotential tool for nondestructive evaluation of tablethardness. We have previously demonstrated3 that itis possible to acquire THz measurements of movingtablets under process conditions in less than 10 ms.Therefore, this technique might have potential for in-line hardness testing applications where the hardnessof all, or at least a significant proportion of tablets,can be tested nondestructively after compaction inreal time. Such a measurement sensor would not re-place the need for diametral hardness testing but itcould complement it for process monitoring and PATapplications. However, further work will need to sys-tematically evaluate the influence of the formulation,and the presence of API in particular, on the sensi-tivity of the method to tablet hardness. The surfacedensity of the biconvex tablets map along the tabletradius is explored through numerical simulation byFEA and found to agree with the TPI measured SRImaps, which explained the inhomogeneity of the SRIspatial distribution of the biconvex tablets.
ACKNOWLEDGMENTS
The authors would like to acknowledge Dipankar Deyand Ian Warr at Oystar-Manesty for the preparationof the tablets as well as the DCT. This work was con-ducted with financial support from the UK Technol-ogy Strategy Board (AB293H).
REFERENCES
1. Fitzgerald AJ, Cole BE, Taday PF. 2005. Nondestructive anal-ysis of tablet coating thicknesses using terahertz pulsed imag-ing. J Pharm Sci 94(1):177–183.
2. Ho L, Muller R, Gordon KC, Kleinebudde P, Pepper M, RadesT, Shen Y-C, Taday PF, Zeitler JA. 2009. Terahertz pulsedimaging as an analytical tool for sustained-release tablet filmcoating. Eur J Pharm Biopharm 71(1):117–123.
3. May RK, Evans MJ, Zhong S, Warr I, Gladden LF, Shen Y,Zeitler JA. 2011. Terahertz in-line sensor for direct coating
DOI 10.1002/jps JOURNAL OF PHARMACEUTICAL SCIENCES, VOL. 102, NO. 7, JULY 2013
2186 MAY ET AL.
thickness measurement of individual tablets during film coat-ing in real-time. J Pharm Sci 100(4):1535–1544.
4. Zhong S, Shen Y-C, Ho L, May RK, Zeitler JA, Evans M, TadayPF, Pepper M, Rades T, Gordon KC, Muller R, Kleinebudde P.2011. Non-destructive quantification of pharmaceutical tabletcoatings using terahertz pulsed imaging and optical coherencetomography. Opt Lasers Eng 49(3):361–365.
5. Ho L, Muller R, Gordon KC, Kleinebudde P, Pepper M, RadesT, Shen Y, Taday PF, Zeitler JA. 2009. Monitoring the filmcoating unit operation and predicting drug dissolution usingterahertz pulsed imaging. J Pharm Sci 98(12):4866–4876.
6. Strachan CJ, Rades T, Newnham DA, Gordon KC, PepperM, Taday PF. 2004. Using terahertz pulsed spectroscopy tostudy crystallinity of pharmaceutical materials. Chem PhysLett 390(1–3):20–24.
7. Strachan CJ, Taday PF, Newnham DA, Gordon KC, Zeitler JA,Pepper M, Rades T. 2005. Using terahertz pulsed spectroscopyto quantify pharmaceutical polymorphism and crystallinity.J Pharm Sci 94(4):837–846.
8. Zeitler JA, Newnham DA, Taday PF, Strachan CJ, PepperM, Gordon KC, Rades T. 2005. Temperature dependent tera-hertz pulsed spectroscopy of carbamazepine. Thermochim Acta436(1–2):71–77.
9. Zeitler JA, Newnham DA, Taday PF, Threlfall TL, LancasterRW, Berg RW, Strachan CJ, Pepper M, Gordon KC, Rades T.2006. Characterization of temperature-induced phase transi-tions in five polymorphic forms of sulfathiazole by terahertzpulsed spectroscopy and differential scanning calorimetry.J Pharm Sci 95(11):2486–2498.
10. Zeitler JA, Kogermann K, Rantanen J, Rades T, Taday PF,Pepper M, Aaltonen J, Strachan CJ. 2007. Drug hydrate sys-tems and dehydration processes studied by terahertz pulsedspectroscopy. Int J Pharm 334(1–2):78–84.
11. Shen Y-C. 2011. Terahertz pulsed spectroscopy and imag-ing for pharmaceutical applications: A review. Int J Pharm417(1–2):48–60.
12. Podczeck F. 2012. Methods for the practical determination ofthe mechanical strength of tablets—From empiricism to sci-ence. Int J Pharm 436(1–2):214–232.
13. Fell JT, Newton JM. 1970. Determination of tablet strength bythe diametral-compression test. J Pharm Sci 59(5):688–691.
14. Kirsch JD, Drennen JK. 1999. Nondestructive tablet hardnesstesting by near-infrared spectroscopy: A new and robust spec-tral best-fit algorithm. J Pharm Biomed Anal 19(3–4):351–362.
15. Otsuka M, Yamane I. 2006. Prediction of tablet hardness basedon near infrared spectra of raw mixed powders by chemomet-rics. J Pharm Sci 95(7):1425–1433.
16. Short SM, Cogdill RP, Wildfong PLD, Drennen JK, AndersonCA. 2009. A near-infrared spectroscopic investigation of rel-ative density and crushing strength in four-component com-pacts. J Pharm Sci 98(3):1095–1109.
17. Virtanen S, Antikainen O, Yliruusi J. 2008. Determinationof the crushing strength of intact tablets using Raman spec-troscopy. Int J Pharm 360(1–2):40–46.
18. Wikstrom H, Lewis IR, Taylor LS. 2005. Comparison of sam-pling techniques for in-line monitoring using Raman spec-troscopy. Appl Spectrosc 59(7):934–941.
19. Matousek P, Clark IP, Draper ERC, Morris MD, Goodship AE,Everall N, Towrie M, Finney WF, Parker AW. 2005. Subsur-face probing diffusely scattering media using spatially offsetRaman spectroscopy. Appl Spectrosc 59(4):393–400.
20. Matousek P, Morris MD, Everall N, Clark IP, Towrie M,Draper ERC, Goodship AE, Parker AW. 2005. Numerical sim-ulations of subsurface probing in diffusely scattering mediausing spatially offset Raman spectroscopy. Appl Spectrosc59(12):1485–92.
21. Simonaho S-P, Takala TA, Kuosmanen M, Ketolainen J. 2011.Ultrasound transmission measurements for tensile strengthevaluation of tablets. Int J Pharm 409(1–2):104–110.
22. Palermo R, Cogdill RP, Short SM, Drennen Iii JK, Taday PF.2008. Density mapping and chemical component calibrationdevelopment of four-component compacts via terahertz pulsedimaging. J Pharm Biomed Anal 46(1):36–44.
23. Zeitler JA, Shen Y, Baker C, Taday PF, Pepper M, Rades T.2007. Analysis of coating structures and interfaces in solid oraldosage forms by three dimensional terahertz pulsed imaging.J Pharm Sci 96(2):330–340.
24. Russe I-S, Brock D, Knop K, Kleinebudde P, Zeitler JA. 2012.Validation of terahertz coating thickness measurements usingX-ray microtomography. Mol Pharm 9(12):3551–3559.
25. Henry SC, Zurk LM, Schecklman S, Duncan DD. 2012. Three-dimensional broadband terahertz synthetic aperture imaging.Opt Eng 51(9):091603–091601.
26. Akseli I, Hancock BC, Cetinkaya C. 2009. Non-destructive de-termination of anisotropic mechanical properties of pharma-ceutical solid dosage forms. Int J Pharm 377(1–2):35–44.
27. Wu CY, Ruddy OM, Bentham AC, Hancock BC, Best SM,Elliott JA. 2005. Modelling the mechanical behaviour ofpharmaceutical powders during compaction. Powder Technol152(1–3):107–117.
28. Han LH, Elliott JA, Bentham AC, Mills A, Amidon GE,Hancock BC. 2008. A modified Drucker-Prager Cap model fordie compaction simulation of pharmaceutical powders. Int JSolids Struct 45(10):3088–3106.
29. Parrott EP, Zeitler JA, Gladden LF. 2009. Accurate determi-nation of optical coefficients from chemical samples using tera-hertz time-domain spectroscopy and effective medium theory.Opt Lett 34(23):3722–3724.
30. Peiponen K-E, Gornov E. 2006. Description of Wiener boundsof multicomponent composites by barycentric coordinates. OptLett 31(14):2202–2204.
31. Tuononen H, Gornov E, Zeitler JA, Aaltonen J, PeiponenKE. 2010. Using modified Kramers–Kronig relations to testtransmission spectra of porous media in THz-TDS. Opt Lett35(5):631–633.
32. Tuononen H, Fukunaga K, Kuosmanen M, Ketolainen J,Peiponen K-E. 2010. Wiener bounds for complex permittivityin terahertz spectroscopy: Case study of two-phase pharma-ceutical tablets. Appl Spectrosc 64(1):127–131.
33. Juuti M, Tuononen H, Prykari T, Kontturi V, Kuosmanen M,Alarousu E, Ketolainen J, Myllyla R, Peiponen K. 2009. Opti-cal and terahertz measurement techniques for flat-faced phar-maceutical tablets: A case study of gloss, surface roughnessand bulk properties of starch acetate tablets. Meas Sci Tech-nol 20(1):015301.
JOURNAL OF PHARMACEUTICAL SCIENCES, VOL. 102, NO. 7, JULY 2013 DOI 10.1002/jps