Embed Size (px)
Citation preview
DRAFTHard Cash and Soft Skills:
Experimental Evidence on Combining Scholarshipsand Mentoring in Argentina∗
Alejandro J. Ganimian†
Felipe Barrera-Osorio‡
María Loreto Biehl§
María Cortelezzi¶
Daniela Valencia‖
February 29, 2016
∗We gratefully acknowledge the funding provided by the Inter-American Development Bankand Fundación Cimientos for this project. We thank Marina Bassi, Agustina Cavanagh, MercedesMateo Díaz, Costas Meghir, Hugo Ñopo, Ernesto Pais, Anahí Pissinis, and Emiliana Vegas fortheir input at different stages of this project. We also thank Ariel Fiszbein and Laura Trucco forcomments on earlier drafts of this paper. The usual disclaimers apply.†Education Post-Doctoral Fellow, Abdul Latif Jameel Poverty Action Lab (J-PAL) South Asia.
E-mail: [email protected].‡Associate Professor of Education and Economics, Harvard Graduate School of Education. E-
mail: [email protected].§Senior Education Specialist, Inter-American Development Bank. E-mail: [email protected].¶Evaluation Director, Fundación Cimientos. E-mail: [email protected].‖Evaluation Manager, Fundación Cimientos. E-mail: [email protected].
1
DRAFTAbstract
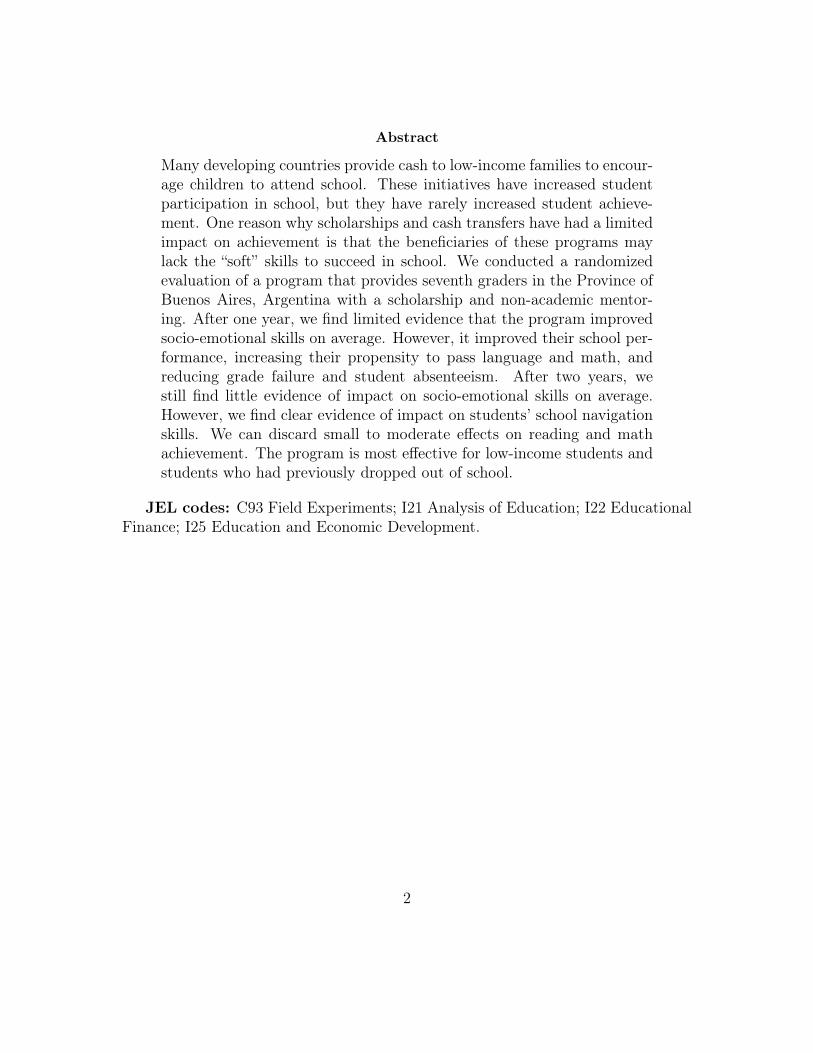
Many developing countries provide cash to low-income families to encour-age children to attend school. These initiatives have increased studentparticipation in school, but they have rarely increased student achieve-ment. One reason why scholarships and cash transfers have had a limitedimpact on achievement is that the beneficiaries of these programs maylack the “soft” skills to succeed in school. We conducted a randomizedevaluation of a program that provides seventh graders in the Province ofBuenos Aires, Argentina with a scholarship and non-academic mentor-ing. After one year, we find limited evidence that the program improvedsocio-emotional skills on average. However, it improved their school per-formance, increasing their propensity to pass language and math, andreducing grade failure and student absenteeism. After two years, westill find little evidence of impact on socio-emotional skills on average.However, we find clear evidence of impact on students’ school navigationskills. We can discard small to moderate effects on reading and mathachievement. The program is most effective for low-income students andstudents who had previously dropped out of school.
JEL codes: C93 Field Experiments; I21 Analysis of Education; I22 EducationalFinance; I25 Education and Economic Development.
2
DRAFT1 Introduction
Many developing countries provide cash to low-income families to encourage children
to attend school. Some of these initiatives are called “scholarships” and others “cash
transfers”, but they operate under the same theory of change. Low-income parents
may not send their children to school if they perceive that the costs of schooling
are too high, its benefits are too low (or take too long to materialize), or they lack
access to credit (Banerjee et al. 2013). Thus, these programs aim to cover the costs
of and raise the (immediate) returns to schooling, while relaxing credit constraints
by offering their beneficiaries cash to enroll and stay in school (Fiszbein et al. 2009).
Scholarships and cash transfers are among the most rigorously evaluated educa-
tional interventions in developing countries. According to a recent review, there are
47 impact evaluations of these programs in 20 countries (Ganimian and Murnane
2016). Nearly all of these initiatives have increased student participation in school,
but with few exceptions, they have not increased student achievement.
One potential reason why scholarships and cash transfers have had a limited
impact on student achievement is that the beneficiaries of these programs may lack
the requisite skills to succeed in school (Borghans et al. 2008; Farrington et al. 2012;
Gabrieli et al. 2015). If the lack of these “character”, “socio-emotional”, or “soft” skills
is a binding constraint for children, they could benefit from programs that combined
scholarships or cash transfers with support to develop such skills.
This paper reports the results of a randomized evaluation of a program that pro-
vides seventh graders in the Province of Buenos Aires, Argentina with a scholarship
and non-academic mentoring. To our knowledge, this is the first study to rigorously
3
DRAFTassess the effect of combining financial incentives with non-academic mentoring on
school performance in a developing country.
After one year, we find limited evidence that the program improved socio-
emotional skills on average. However, it improved their school performance, in-
creasing their propensity to pass language and math, and reducing grade failure
and student absenteeism. After two years, we still find little evidence of impact on
socio-emotional skills on average. However, we find clear evidence of impact on stu-
dents’ school navigation skills. We can discard small to moderate effects on reading
and math achievement. The program is most effective for low-income students and
students who had previously dropped out of school.
The paper is organized as follows. Section 2 reviews prior research. Section 3
describes the context, intervention, sampling strategy, and randomization. Section 4
presents the data collected for this study. Section 5 discusses the empirical strategy.
Section 6 reports the results. Section 7 discusses the policy implications.
2 Prior Research
There are three common obstacles that low-income parents face when deciding
whether to send their children to school (Banerjee et al. 2013). First, the costs
of doing so may be too high. These include the direct costs (e.g., fees) (Barrera-
Osorio et al. 2007; Borkum 2012; Liu et al. 2012; Lucas and Mbiti 2012), the costs of
complements to schooling (e.g., transportation, uniforms, or textbooks) (Evans et al.
2009; Glewwe et al. 2009; Muralidharan and Prakash 2013), and the opportunity costs
4
DRAFTof not employing children at home or in the informal labor market (Del Carpio and
Macours 2010; Skoufias et al. 2001). Second, the benefits from schooling may be too
low or take too long to accrue. Specifically, the returns that parents expect for their
children may be too low, given their private assessment of their children’s skills and
of their available schooling options (Jensen 2010, 2012; Loyalka et al. 2013). Third,
parents may lack access to credit to cover schooling costs (Karlan and Linden 2014).
Scholarships and cash transfers were conceived to tackle these common barriers
to schooling (Fiszbein et al. 2009). They provide cash to low-income parents for
enrolling and keeping their children in school. They aim to cover the costs of school-
ing, provide a short-term reward for a behavior that pays off over the long-term, and
relax (or lift altogether) existing credit constraints.
Nearly every one of these programs that has been rigorously evaluated has in-
creased schooling. Yet, their impact has depended on the design of such initiatives
and the characteristics of their beneficiaries (Ganimian and Murnane 2016).1
Scholarships and cash transfers, however, have been less successful in improving
student achievement. Several studies that measured the impact of such programs on
student learning found no effect (Baez and Camacho 2011; Filmer and Schady 2014).
There are two exceptions. There is some evidence that cash transfers may impact
student learning in the long-run (Barham et al. 2014). Merit-based scholarships
(i.e., scholarships awarded based on students’ performance on an exam) have also
1Some design features that make a difference are whether cash is made conditional (Baird et al.2011; Benhassine et al. 2013), the outcomes upon which it is made conditional (Barrera-Osorioet al. 2011), and treatment exposure (Behrman et al. 2009, 2011; Dammert 2009; Perova and Vakis2012). Some characteristics of beneficiaries that matter are the age of beneficiaries (Maluccio andFlores 2005; Schultz 2004) and their socio-economic status (Galiani and McEwan 2013).
5
DRAFTincreased students’ test scores (Barrera-Osorio and Filmer 2013; Kremer et al. 2004).
Admittedly, most scholarships and cash transfers were not designed to improve
student achievement. Yet, it seems reasonable to expect that if these programs
increase beneficiaries’ participation in school, they should also learn more.2 One
potential reason why these programs have had limited impact on student achievement
is that the beneficiaries of these programs may lack the “socio-emotional skills” to
succeed in school (e.g., the perseverance to work on a difficult homework problem,
the foresight to start studying early for an exam, or the self-control to resist getting
distracted during lessons).3 If the children and youth that these programs target
lack these skills, increasing their schooling is unlikely to improve their achievement.
Existing research suggests that improving students’ socio-emotional skills could
improve their academic achievement. In a recent review of the evidence, Farrington
et al. (2012) identify five ways in which this could occur: (a) academic behaviors
(e.g., going to class, doing homework, organizing materials) could improve academic
performance; (b) academic perseverance (e.g., grit, tenacity, delayed gratification,
self-discipline, and self-control) could improve academic behaviors, which could in
turn affect academic performance; (c) academic mindsets (e.g., sense of belonging,
growth mindset, self-beliefs about academics) could improve academic perseverance,
thus influencing academic behavior and performance; (d) learning strategies (e.g.,
2This expectation seems less reasonable in low-income countries where disadvantaged studentsalready lag far behind their peers by primary school and have little chance of understanding thematerial taught in school lessons (Muralidharan and Zieleniak 2014; Pritchett and Beatty 2015).Yet, it seems more reasonable in middle-income countries such as the one we study.
3There is a long-standing debate among economists, psychologists, and scholars in other fieldsover the correct label for such skills (Duckworth and Yeager 2015). In this paper, we use the termsocio-emotional skills to refer to “patterns of thought, feelings, and behavior” (Borghans et al. 2008)other than cognitive ability that lead to student success.
6
DRAFTstudy skills, metacognitive strategies, self-regulated learning, and goal-setting) could
improve academic perseverance, behavior, and performance; and (e) social skills
(e.g., interpersonal skills, empathy, cooperation, assertion, and responsibility) could
improve academic behaviors, which could in turn affect academic performance (see
also reviews by Borghans et al. 2008; Gabrieli et al. 2015).4 The authors conclude that
academic behaviors have the most immediate effect on academic performance, and
that academic behaviors can be improved mostly by influencing students’ academic
mindsets, and developing their metacognitive and self-regulatory skills, rather than
by trying to change students’ tendency to persevere.
Mentoring could potentially improve students’ socio-emotional skills, but there is
almost no rigorous evidence on its merits in developing countries. To our knowledge,
there is only exception. Huan et al. (2014) evaluated the impact of a government
program that designated a music, art, or physical exercise teacher to deliver 32 fully-
scripted, 45-minute school counseling sessions per week to students in grades 7 and
8 in Shaanxi, China in 2012. The intervention sought to help students deal with
“learning anxiety” and stressful relationships with teachers and peers.5 On average,
the intervention reduced learning anxiety and dropout rates after six months, but
the effects faded after a year. The authors argued that this fadeout is largely due
to decreasing student interest in the program. Importantly, however, students at
high-risk of dropping out still saw positive effects after a year.
4Farrington et al. (2012) focus exclusively on academic performance as measured by students’grades in school. However, their framework is useful to think about how socio-emotional skills mayimprove student achievement as measured by standardized tests.
5As the authors discuss, an important source of learning anxiety in this context is the importanceof competitive high school entrance exams.
7
DRAFTThis study raises a number of questions, including whether mentoring would be
more effective and engaging if it catered to the individual needs of each student, and
whether it could also affect school performance and student achievement. To our
knowledge, ours is the first study to address these questions in a developing country.
3 Experiment
3.1 Context
Schooling in Argentina is compulsory from 4 years of age until the completion of
secondary school. In 12 out the 24 provinces, including the Province of Buenos
Aires, primary school runs from first to sixth grades and secondary school from
seventh to twelfth grades DiNIECE (2013b).6 According to the latest official figures
from 2013, the Argentine school system serves nearly 11 million students, including
1.7 million in pre-school, 4.6 million in primary school, and 3.9 million in secondary
school (DiNIECE 2013a). The school calendar runs from February to December.
Education in Argentina is the shared responsibility of the national and sub-
national (provincial) governments. According to the National Education Law (LEN)
of 2006, the provinces are responsible for the provision of all education services ex-
cept for higher education, and the central government is responsible for financing
higher education and for providing the necessary financial and technical assistance
to the provinces to improve the quality of the system.
Argentina began expanding access to secondary education before most Latin6In the other 12 provinces, primary school runs from first to seventh grades and secondary
school from eighth to twelfth grades.
8
DRAFTAmerican countries. By the early 1990s, 60% of secondary school age youths were
enrolled on time in Argentina, compared to 45% in the average country in the region.
By the late 2000s, Argentina’s enrollment advantage remained virtually unchanged:
75% of secondary school age youths were enrolled on time, compared to 59% in the
average country in the region (Busso et al. 2013).
However, Argentina’s secondary school graduation lags behind those of other
middle-income countries in Latin America. In 2011, its graduation rate stood at
41%, compared to 64% in Brazil, 84% in Chile, and 44% in Mexico (OECD 2014).
Further, youths from low- and high-income families have very different chances of
graduating from secondary school. In 2011, 39% of secondary school age youths from
the lowest income quintile graduated from school, compared to 81% of their peers in
the highest income quintile (Alfonso et al. 2011).
Many secondary school students in Argentina do not reach national standards.
The latest national student assessment, the Operativo Nacional de Evaluación (ONE)
2013, found that 50% of eighth graders performed at the lowest level in math, 24%
in language, 29% in social studies, and 49% in science (Ganimian 2015).
In fact, the relative performance of Argentina’s secondary school students has
deteriorated. In 2000, Argentine 15-year-olds ranked second among Latin American
countries in reading achievement in the Program for International Student Assess-
ment (PISA), after Mexico. In 2012, Argentina ranked behind Chile, Costa Rica,
Mexico, Brazil, Uruguay, and Colombia, and it only outperformed Peru, which had
scored two grade levels behind Argentina in 2000 (Ganimian 2013).
Student achievement is highly unequal in Argentina. The achievement gap be-
9
DRAFTtween the lowest- and highest-performing regions of the country in PISA 2012 was as
wide as the one between the lowest- and highest-performing countries in Latin Amer-
ica (Ganimian 2014). Students in the lowest quartile of socio-economic and cultural
status in Argentina are two grade levels behind their peers in the highest quartile,
and they are the fourth-lowest performers when compared to their counterparts in
all other PISA-participating countries (Ganimian 2013).
3.2 Treatment
The Programa Futuros Egresados (PFE) is a scholarship and mentoring program
run by Fundación Cimientos (FC), the largest education non-profit in Argentina. It
is first offered to students when they are in seventh grade and it is meant to last
for six years (i.e., until students graduate from secondary school). It is the longest-
standing and largest scholarship run by a non-profit in the country. It has been in
place for over 15 years, and in 2014 it reached 2,713 students in 16 provinces and the
Autonomous City of Buenos Aires. The PFE has two components: (a) a scholarship
worth ARS 3,600 per year;7 and (b) monthly individual and group mentoring sessions
of about 30 and 60 minutes, respectively.8
3.2.1 Scholarship
The scholarship is disbursed in 10 monthly installments, from February to December
of each year. It is deposited in a bank account in the name of the parents or legal
7USD 414 per year. At the start of the study, USD 1 ≈ ARS 8.69: http://bit.ly/1fwTsW5.8All program participants are also invited to a day-long annual meeting every year.
10
DRAFTguardians of the beneficiaries. The funds from that account can be withdrawn at
any time and they can be used for any purpose.
3.2.2 Mentoring
The mentoring sessions are 10 individual or group meetings with a mentor, known
as Encargado de Acompañamiento (EA). These sessions are held from March to
December of each year, typically whenever students are not in class (i.e., if they go
to school in the morning, the meetings are held in the afternoon and vice versa).9
They are always held at the schools that the students attend. When they are group
meetings, they include PFE beneficiaries from the same grade and school. The ratio
of individual and group meetings is left up to each EA’s discretion.
Mentoring sessions have three parts: (a) an “icebreaker”, in which the EA seeks
to earn the trust of the students, and the students share their schoolwork, as well as
a number of reports from teachers and school staff required by the program;10 (b) a
“diagnosis”, in which students discuss their experience at school with the EA as well
as their strengths and weaknesses; and (c) an “action plan”, in which students and
the EA agree on specific goals (e.g., studying for an upcoming math exam).
In theory, these sessions are compulsory. If students miss them without justifica-
tion, FC may suspend the scholarship. In practice, scholarship suspensions are rare.
9Whenever it is not possible to meet students after school, they are pulled out of their classroomsto attend these meetings.
10Students are expected to show: (a) their folders, which contain their work on all the subjectsthat they take at school (monthly); (b) their attendance and discipline certificates, which arecompleted by a staff member of the school (every month; this form can be accessed at: http://bit.ly/1MgWRom); (c) a report from the same staff member (bi-annually; accessible at: http://bit.ly/1MgWRom); (d) their school report cards; and (e) a report from one of their teachers(bi-annually; accessible at: http://bit.ly/1DrcbaF).
11
DRAFTThey occur only after FC contacts the student and his/her parents and determines
that there were no impediments for the student to miss the mentoring session.
EAs typically have a bachelor’s in psychology, pedagogical psychology, social
work, or education, or they have graduated from a teacher-training program. When
EAs join FC, they undergo an induction process and receive a manual. Each year,
they also have two training sessions: a face-to-face and an online session. During the
year, they also draw resources from and exchange ideas at an online platform.
EAs vary widely in the number of students that they mentor. According to FC’s
records, in 2014 each EA mentored between 30 and 58 students. EAs also vary in
their tenure at FC. In 2014, EAs had between one month and ten years of experience
working for FC, and between two months and nine years working in their position.
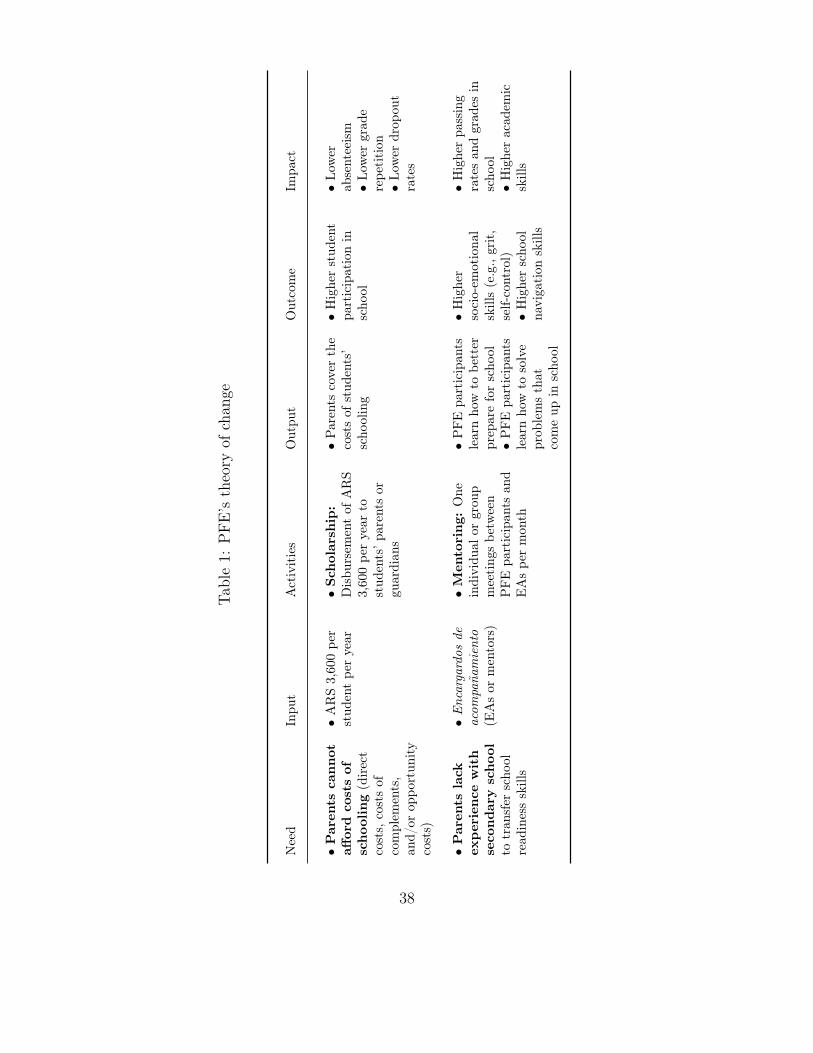
3.2.3 Theory of change
Table 1 presents the theory of change underlying the PFE. The program seeks to
address what FC perceives as two different problems keeping youths from low-income
families from enrolling, staying, and succeeding in school: (a) the costs of schooling;
and (b) the low socio-emotional skills of disadvantaged students to succeed in school.
[Insert Table 1 here.]
The two components of the PFE are meant to tackle each of these problems: (a)
the scholarship is supposed to relax or lift any cash constraints keeping low-income
parents from sending PFE beneficiaries to school; and (b) the mentoring sessions
are meant to improve students’ socio-emotional skills and their ability to “navigate”
12
DRAFTschool, and thus improve their school performance and academic skills.11
3.3 Sample
This study was conducted in the Province of Buenos Aires (PBA). The PBA offers
an ideal setting to study policies that could be scaled to the rest of Argentina.
First, it is the largest sub-national school system in the country. In 2012, it had
4,442 secondary schools and nearly 1.5 million students from eight to twelfth grades
(DiNIECE 2013a). Second, PBA students perform similarly to the average student in
the country on national exams. In 2010, 54% of eighth graders in the PBA performed
at the lowest level of the national math test, 26% in language, 30% in social studies,
and 50% in science (Ganimian 2015).
Ten schools from the PBA were invited to participate in the study, based on three
criteria: (a) they had to be public schools serving youths from low-income families;
(b) they had to have previously participated in the PFE; and (c) they could not
have any PFE participants in eighth grade on February 2014. The first criterion
was adopted to focus on the most disadvantaged students. The second criterion was
adopted to ensure that schools had familiarity with the PFE and its data collection
process. The third criterion was adopted to avoid having study participants, who
would be selected by lottery, in the same classroom with regular PFE participants,
who are selected through an admissions process. A representative of FC met with
each school’s principal to explain the main components of the evaluation.
11Importantly, the PFE does not provide any academic support (e.g., remedial lessons). Theexpectation is that the improvement in socio-emotional and school navigation skills will translateinto better performance in school and higher academic achievement.
13
DRAFTAll 10 schools accepted to participate in the study. Each was located in a different
locality of the PBA: Campana, Ensenada, Gregorio de Laferrere, Guernica, José C.
Paz, Merlo, Quilmes, Santos Lugares, Virrey del Pino, and Zárate.
Students who were eligible to participate in the evaluation were selected as follows.
The number of PFE slots at each school was set by the funds that FC had raised to
offer the scholarships at each site. Two seventh grade sections (i.e., divisiones) were
selected for recruitment at each school using a random number generator.
The students who participated in the lottery were recruited as follows. First, all
students in the randomly selected sections received a note in their communications
notebooks announcing the date and time of an information session for this study.
Then, a team from FC held the information session at each school and wrote down
the names of parents who were interested in participating in the evaluation. Finally,
representatives of FC met with all interested parents and their children to conduct
the baseline data collection described in Section 4. All 408 students who participated
in this baseline survey were entered into an applicant roster.
3.4 Lottery
Students in the lottery roster were assigned to the treatment or control groups as
follows. A lottery was held at each school to assign 204 students to the treatment
group and 204 to the control group. Thus, this was a multi-site (blocked) cluster
randomized trial, in which the point of random assignment was the student (level 2)
within each school (level 1). All lottery winners were offered a spot on the PFE. All
lottery winners who took up the offer signed a contract in which students and their
14
DRAFTparents committed to complying with the program.12 In exchange, FC committed
to providing the PFE for six years.13
4 Data
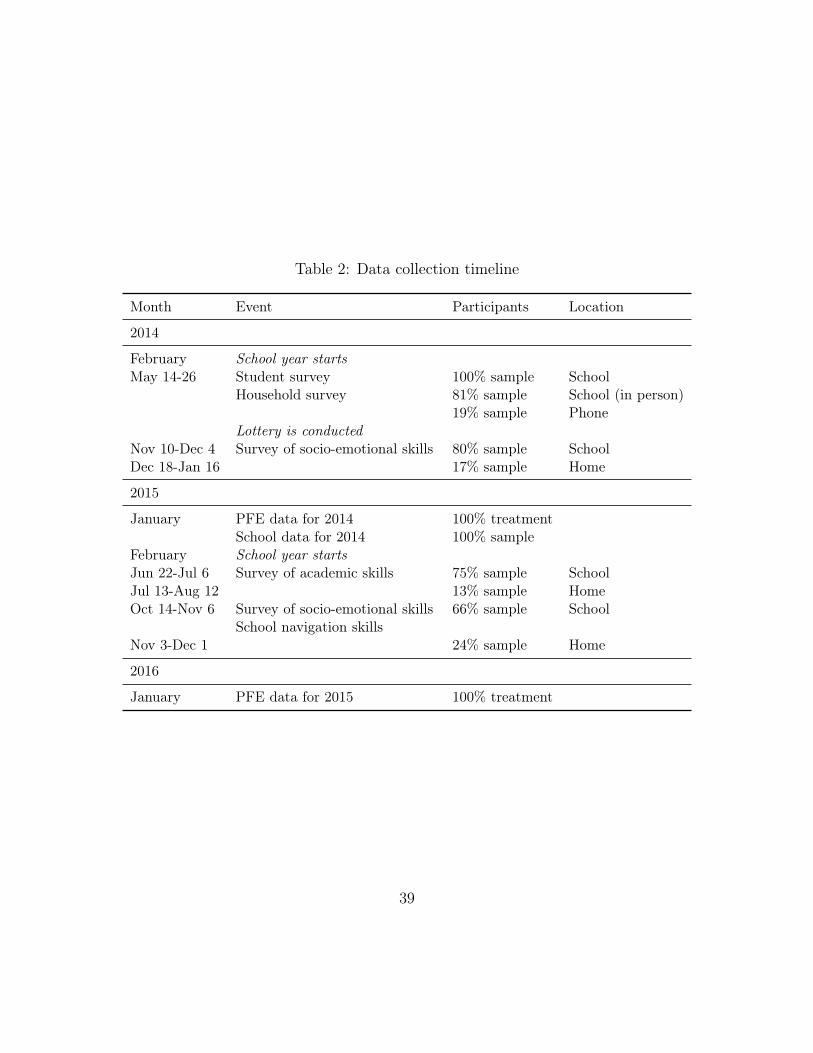
Table 2 offers an overview of all the rounds of data collection for this study. It
includes the dates, types of surveys, percent of sample that participated, and the
mode of administration (e.g., school- or home-based).
[Insert Table 2 here.]
4.1 Baseline
We administered two surveys prior to randomization: (a) a student survey; and (b) a
household survey. Both surveys were conducted during the meetings between the FC
representatives and the families in the applicant roster. The student survey asked
students about their demographics and schooling trajectory.14 The household survey
asked the adult accompanying the student (typically, the mother) about the assets
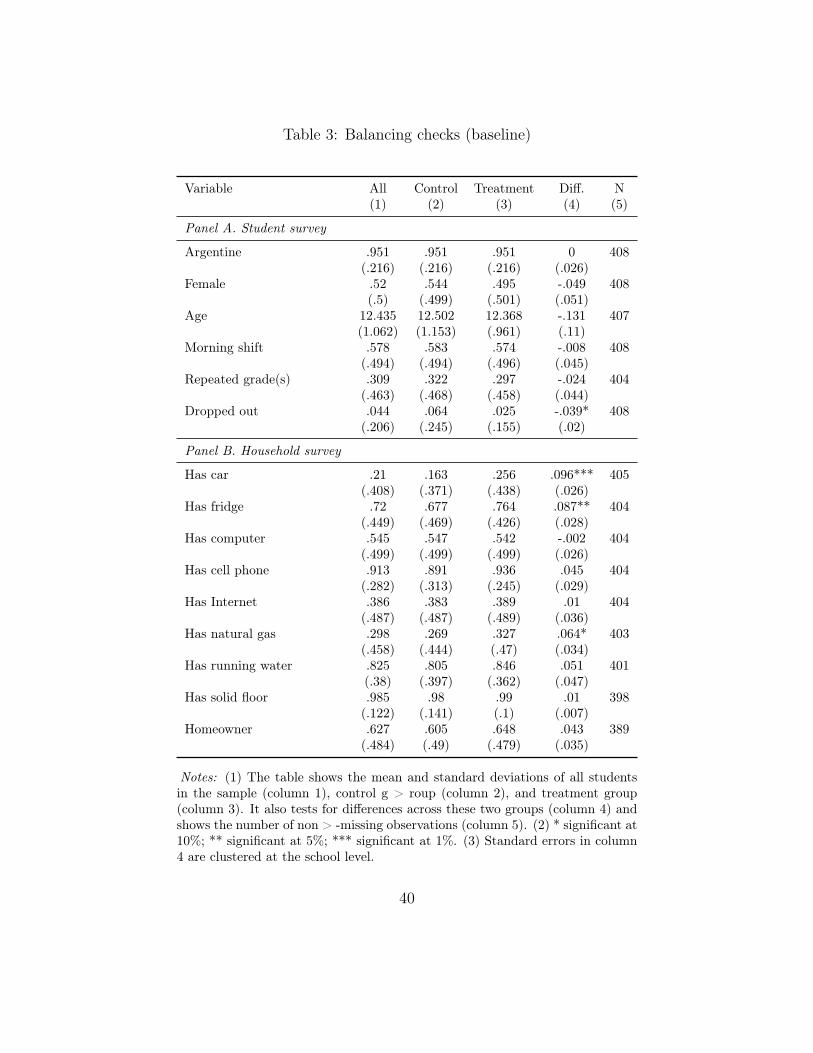
in the household and the housing conditions.15 Table 3 checks that the randomiza-
tion worked as expected, producing comparable treatment and control groups, using
12Students committed to attending school regularly, working hard and behaving well at school,attending the mentoring sessions and annual meetings, and passing their grade. Parents committedto supporting their children in all of these commitments. The acta de compromiso can be accessedat: http://bit.ly/1I9iP6w.
13FC conducts an annual review of all PFE participants to ensure that they meet the program’srequirements. In theory, FC could stop providing the scholarship to students who fail to meet theserequirements. In practice, this occurs very rarely.
14This survey is at: http://bit.ly/1TOZAXB (part 1) and http://bit.ly/1kZCMIw (part 2).15This survey is at: http://bit.ly/1ZfIPq0.
15
DRAFTselected variables from the student and household surveys.16
[Insert Table 3 here.]
Panel A shows that students in our sample were academically disadvantaged:
almost a third (31%) had repeated a grade and 4% had dropped out of school.
Panel B indicates that these students came from low-income families. They had
limited assets: only 21% of students had a car, 72% had a fridge, and 55% had
a computer. They also had substandard living conditions: only 30% had natural
gas, 83% had running water, and 63% was a homeowner. We find small differences
between experimental groups on a few variables, so in Section 6 we test the robustness
of our impact estimates to the inclusion of these variables.
4.2 Follow-up
We followed students for two years and collected data on their: (a) program partic-
ipation; (b) socio-emotional skills; (c) “school navigation” skills (defined below); (d)
school performance; and (e) academic skills.
4.2.1 Program participation
We collected data on the extent to which students in the treatment group participated
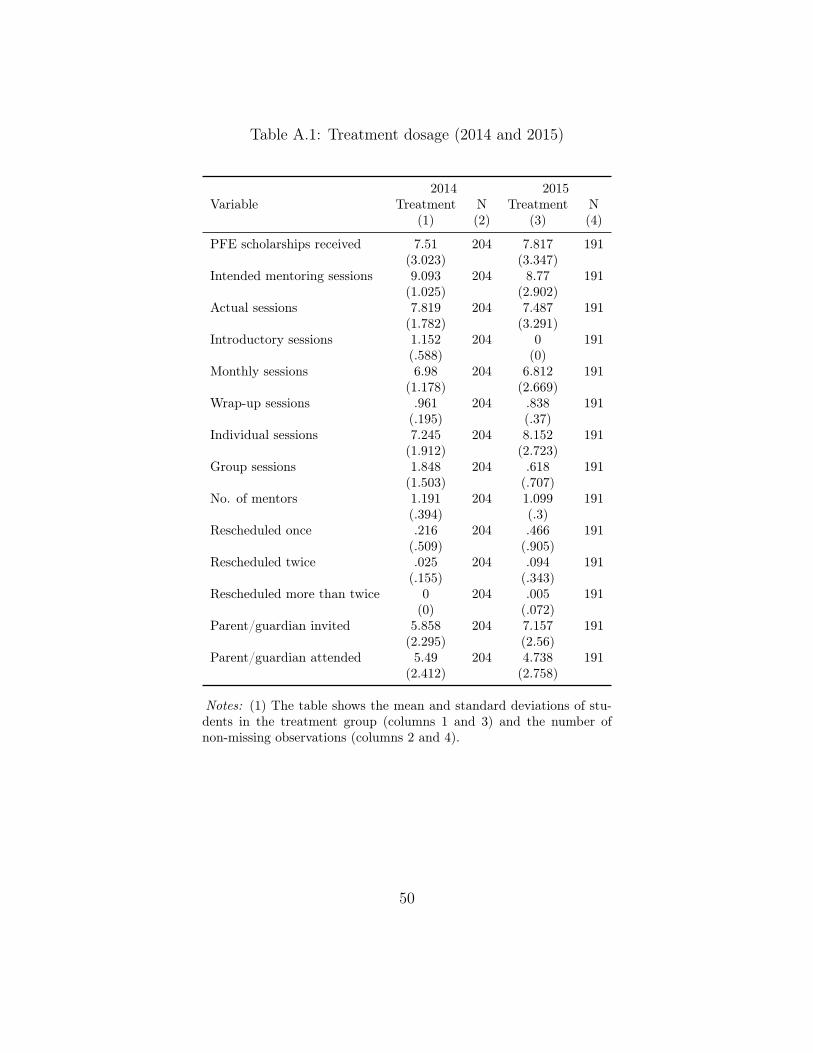
in the PFE during 2014 and 2015. The program was implemented as expected. As
Table A.1 in Appendix A shows, in 2014, these students received eight scholarship
payments, they were invited to participate in nine mentoring sessions, and they
16The balance checks for all other variables are available from the authors upon request.
16
DRAFTattended eight of them. The average student was offered one introductory mentoring
session, seven regular sessions, and one wrap-up session. On average, students were
offered seven individual sessions and two group sessions. The typical student had
one mentor. A small share of students rescheduled their sessions once or twice. On
average, parents were invited to about six sessions and attended five of them.
The figures for 2015 are similar, with two exceptions. First, there were no intro-
ductory mentoring sessions because this was the second year of the program. Second,
treatment students were more likely to reschedule mentoring sessions.
4.2.2 Socio-emotional skills
We also collected data on students’ socio-emotional skills during 2014 and 2015.17
Both rounds included the same six instruments: (a) a survey of self-beliefs about
academics, which measures students’ self-beliefs about their self-efficacy and per-
formance; (b) the Learning and Study Strategies Inventory (LASSI), which mea-
sures students’ organization and planning skills, as well as their motivation; (c) the
Short Grit Scale (GRIT-S); (d) the Domain-Specific Impulsivity Scale for Children
(DSISC), a survey of students’ self-control; (e) a section of the Wechsler Intelligence
Scale for Children Third Edition (WISC-III) called “LABS”, which measures students’
planning skills; (f) a written assessment of self-control (hereafter “CARAS”).18
Appendix B offers a brief description of each of these instruments. Importantly,
we combined instruments that rely on self-reports and performance tasks, as several
studies have highlighted the perils of relying on either method exclusively (Borghans
17We are planning to conduct a final round of data collection in 2016.18The surveys are at: http://bit.ly/1mQdA8A (part 1) http://bit.ly/1RwL4X4 (part 2).
17
DRAFTet al. 2008; Duckworth and Yeager 2015; West et al. 2014).
4.2.3 School navigation skills
We collected data on students’ ability to “navigate” specific aspects of schooling
during 2015.19 This includes students’ self-reported: (a) views on the importance of
school; (b) frequency of negative school-related habits (e.g., forgetting to do their
homework); (c) frequency of reaching out to others (e.g., principals, teachers, peers)
to discuss school-related problems; (d) general proactive behavior in school (e.g.,
asking teachers to explain confusing concepts again); (e) proactive behaviors related
to homework (e.g., checking homework answers with peers), tests (e.g., reviewing the
textbook before a test or going to a tutor), failing subjects (e.g., asking teachers for
extra work), skipping class (e.g., asking a peer for missed schoolwork), free periods
(e.g., using them to study); and (f) views on dropping out of school.20
4.2.4 School performance
We collected data on students’ performance in school during 2014.21 This includes
information on students’ final grades in math and language, the number of subjects
that they failed and had to take tests on during December and/or March,22 their
number of absences, whether they failed a grade, whether they dropped out, or
19We are planning another round of data collection in 2016.20This survey is at: http://bit.ly/1OdFnZZ.21Data for 2015 are forthcoming.22In Argentina, when students fail a subject, they need to take an exam to pass it in December.
If they fail this exam, they need to take another exam in March. They can fail up to two subjects inMarch. If they fail more, they can take these exams again once the school year begins. If they stillfail more than two of these subjects by then, they are supposed to repeat the grade. In practice,schools allow students who have failed more than two subjects to progress onto the next grade.
18
DRAFTwhether they transferred schools.
4.2.5 Academic skills
We also administered assessments of math and language during 2015.23 These tests
assessed what students should know and be able to do according to Argentina’s own
standards. They were based on: (a) the Núcleos de Aprendizaje Prioritario (NAPs),
the contents that the government has prioritized from the national curriculum; and
(b) the publicly-released items from the national assessment described in Section 3.
They were developed by the Centro de Medición de la Universidad Católica de Chile
(MIDE-UC). Appendix C offers a brief description of the design of the tests.
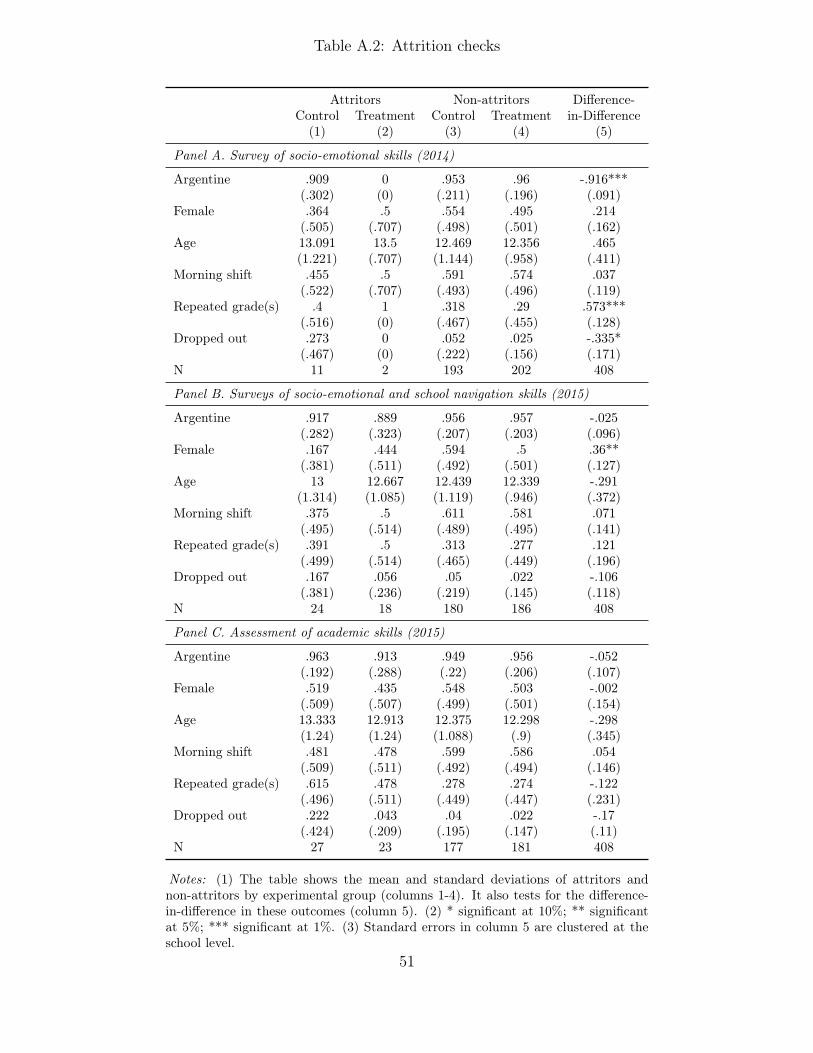
4.3 Attrition
We tracked students’ participation in each round of data collection. Table A.2 checks
that the treatment and control groups were comparable at each round, using selected
variables from the student and household surveys.24
As the table indicates, 13 students (i.e., 3% of the sample) did not participate in
the first round of surveys and assessments of socio-emotional skills, 42 students (i.e.,
10% of the sample) did not participate the second round, and 50 students (12%)
did not participate in the assessment of academic skills. We find small differences
between experimental groups on a few variables, so in Section 6 we test the robustness
of our impact estimates to the inclusion of these variables.
23We are planning to conduct another round of data collection in 2016.24The attrition checks for all other variables are available from the authors upon request. The
surveys of socio-emotional and school navigation skills in 2015 were administered on the same day.
19
DRAFT5 Empirical Strategy
We estimate the effect of the offer of a spot in the PFE (i.e., the intent-to-treat or
ITT), since only two students who were offered a spot did not take it.
The effect of the offer of a spot in the PFE is given by:
Yij = αj + βTij + γXij + εij (1)
where Yij represents the outcome of interest for student i at school j, Tij is a dummy
indicating whether each student was offered a spot in the PFE, Xij is a vector of
covariates collected at baseline,25 and αj are the school (i.e., randomization block)
fixed effects. All estimations are conducted with standard errors that account for
clustering at the school level. The coefficient of interest in this regression is β; it
indicates the magnitude of the effect of the offer of a spot in the PFE.
6 Results
We report the ITT effects of the program in the first and second years (2014 and
2015). We also report these effects on four sub-groups of students: girls, students
who had previously repeated a grade or dropped out, and low-income students.26
25When we estimate the first-year effects, we include the variables on which experimental groupswere unbalanced at baseline (whether students had dropped out, whether they had a car, a fridge,and natural gas). When we estimate the second-year effects, we include the same variables andthose in which experimental groups were not balanced during the 2015 data collection (students’age, whether they attended school in the morning, and whether they had repeated a grade).
26In our analyses, low-income students are those in the lowest quintile of an index of assets andhousing conditions. This index adds up dummies for students whose families have a car, fridge,computer, cell phone, Internet connection, natural gas, running water, solid floor, and are home-
20
DRAFT6.1 Year 1 effects (2014)
6.1.1 Socio-emotional skills
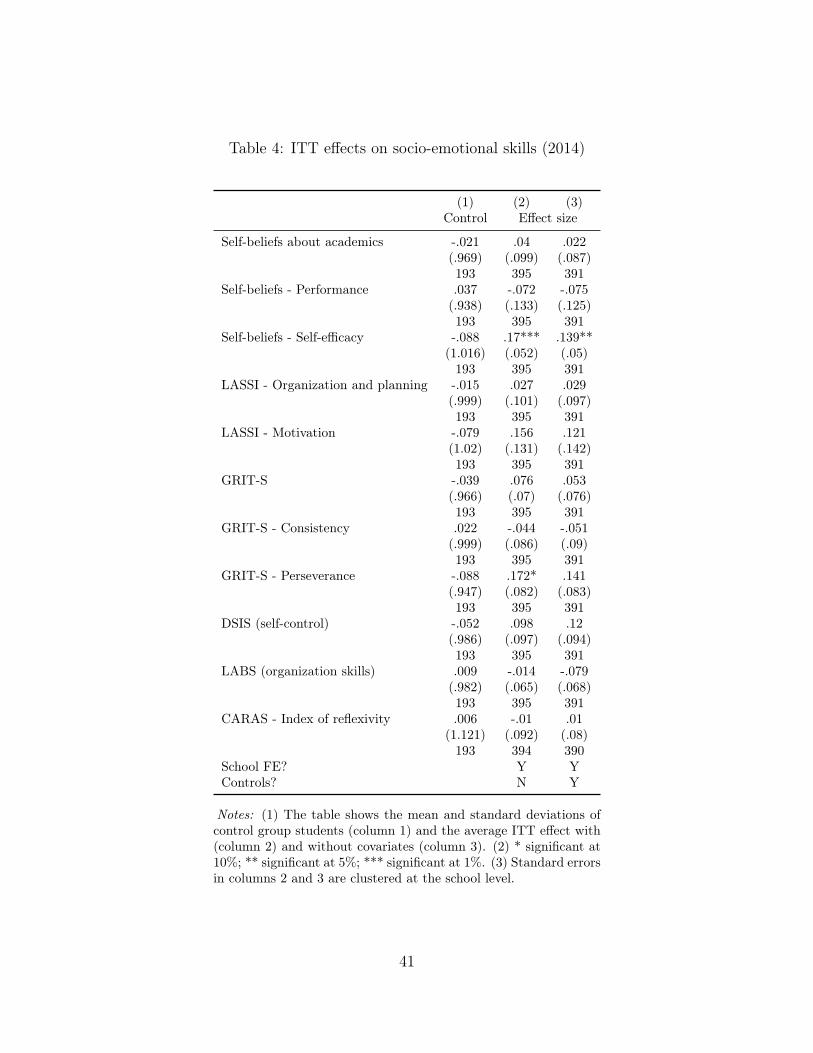
Table 4 shows the effects of the program on socio-emotional skills after six months.
The distributions of the raw scores on these skills are shown in Figure A.1. The
scores were standardized with the mean and standard deviation of the full sample.
[Insert Table 4 here.]
The offer of the program had a positive but statistically insignificant effect on
most socio-emotional skills during the first year. There were two exceptions. First, it
increased students’ self-beliefs about self-efficacy by .139 to .17 standard deviations
(SDs). Second, it also seems to have increased students’ perseverance by .172 SDs,
but this effect is statistically insignificant once we include covariates.
The rest of the coefficients are imprecisely estimated; we cannot discard large pos-
itive or negative effects. However, the effects on one of the performance assessments
(LABS) is consistently estimated to be around zero and negative.27
We find no evidence that the program differentially impacted girls or students
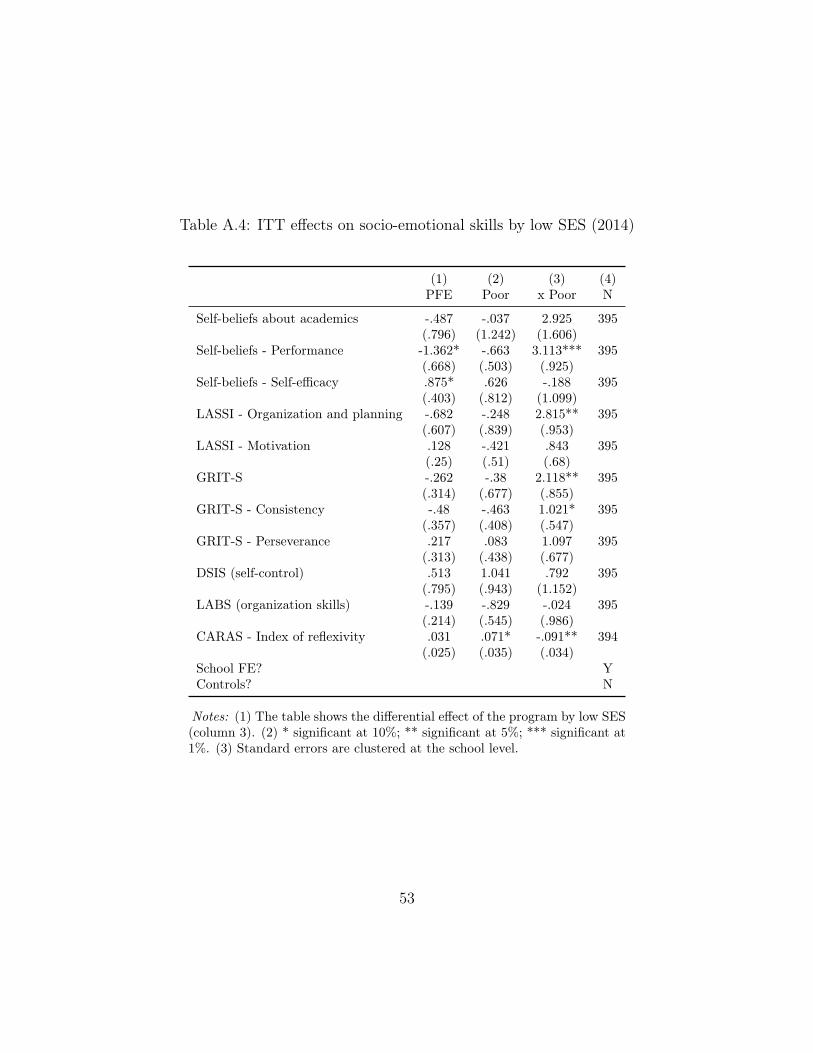
who had previously repeated a grade.28 It was however particularly beneficial for
students who had previously dropped out of school and low-income students. As
Table A.3 shows, the program had very large positive impacts on the self-beliefs
about academics, self-beliefs about self-efficacy, and motivation of previous dropouts.
owners. It is standardized using the overall mean and standard deviation in our full sample.27CARAS is also consistently estimated to be around zero and negative, but the way that it
should be coded, negative values are better.28These and all other results mentioned but not shown in this section are available from the
authors upon request.
21
DRAFTAs Table A.4 indicates, it also had large positive effects on the self-beliefs about
performance, organization and planning skills, grit, and self-control (as measured by
CARAS) of low-income students.29 It seems to have also increased their consistency,
but the coefficient on this estimate is only marginally statistically significant.
6.1.2 School performance
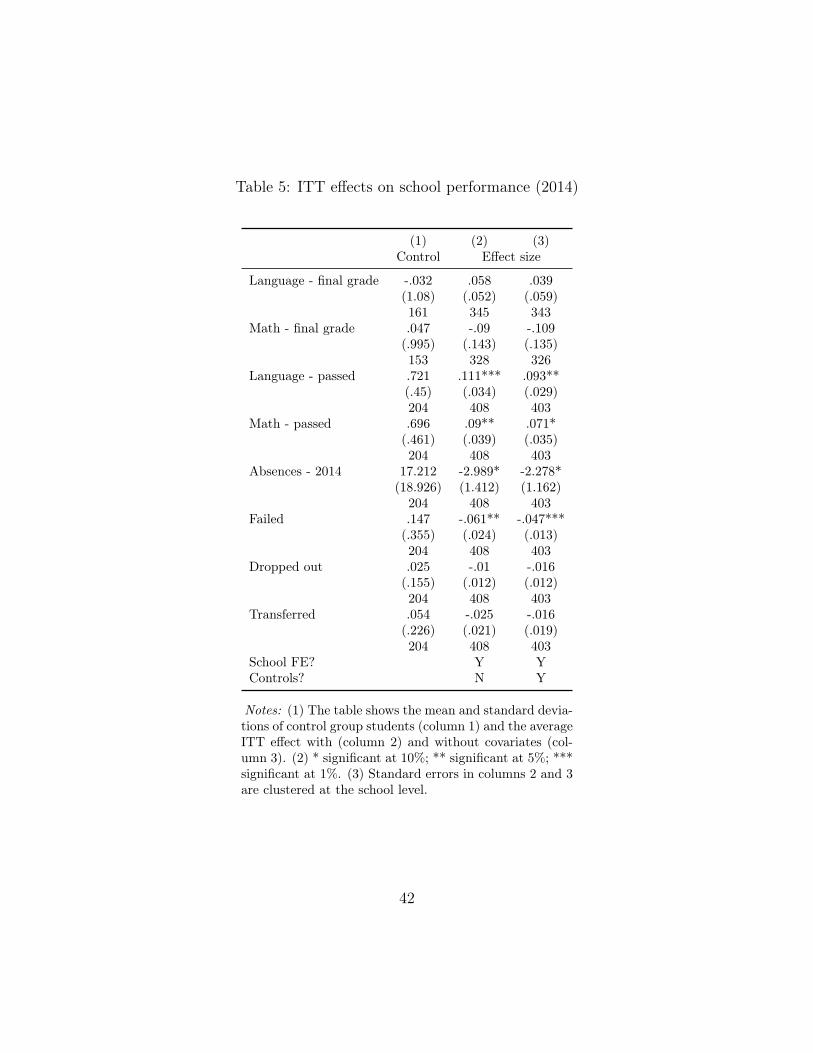
Table 5 shows the effects of the program on school performance after the first year.
Students’ grades were standardized using the mean and standard deviation of the
full sample.
[Insert Table 5 here.]
We can discard large effects of the offer of the program on students’ final grades
in language (larger than .18 SDs) and math (larger than .23 SDs). However, the
program increased the share of students who passed language by 9 to 11 percentage
points and the share who passed math by 7 to 9 percentage points. It also reduced
the share of students who failed the year by 5 to 6 percentage points. It seems to
have also reduced the number of absences by 2 to 3 days, but the effect is statisti-
cally insignificant once we include covariates. The program’s impact on the share
of students who dropped out or transferred schools is imprecisely estimated, but
consistently small and negative.
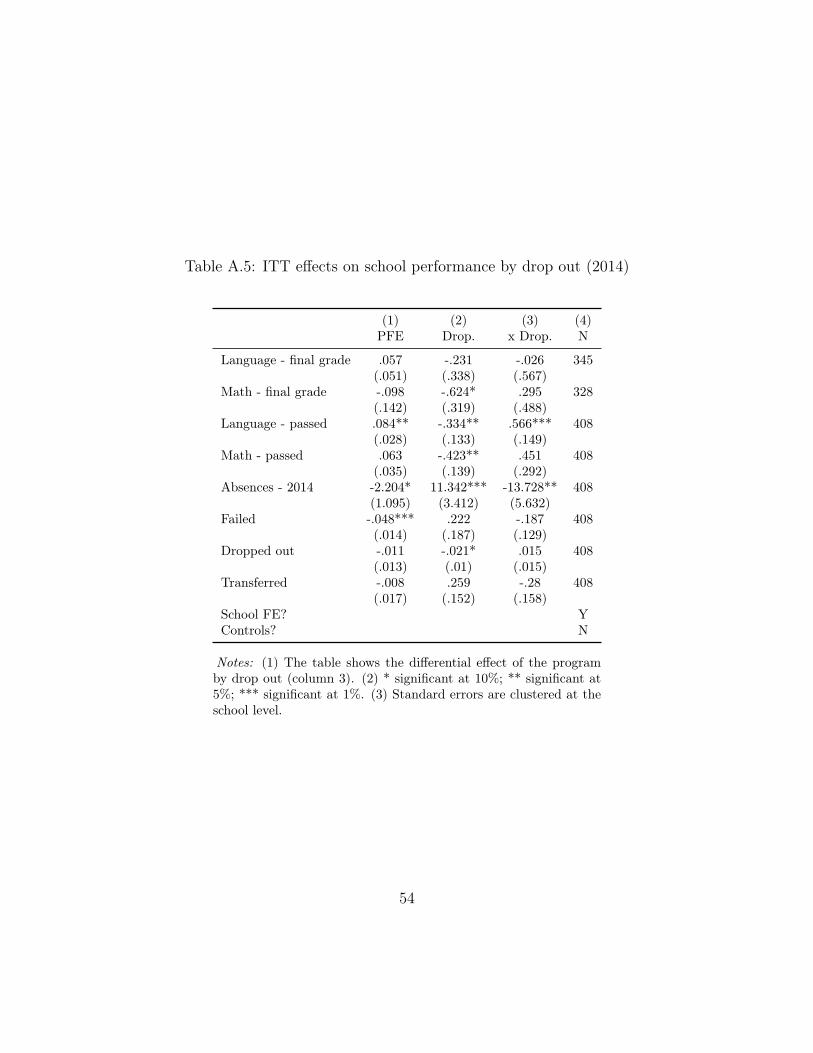
We find little evidence that the program differentially impacted girls, students
who had previously repeated a grade, or low-income students. Yet, we find that the
program was particularly beneficial for students who had previously dropped out.29As mentioned above, the way that CARAS is coded, a negatively signed effect is positive.
22
DRAFTAs Table A.5 shows, the program increased the share of these students who passed
language by 57 percentage points and it reduced their absences by 14 days.
6.2 Year 2 effects (2015)
6.2.1 Socio-emotional skills
Table 6 shows the effects of the program on socio-emotional skills after 17 months.
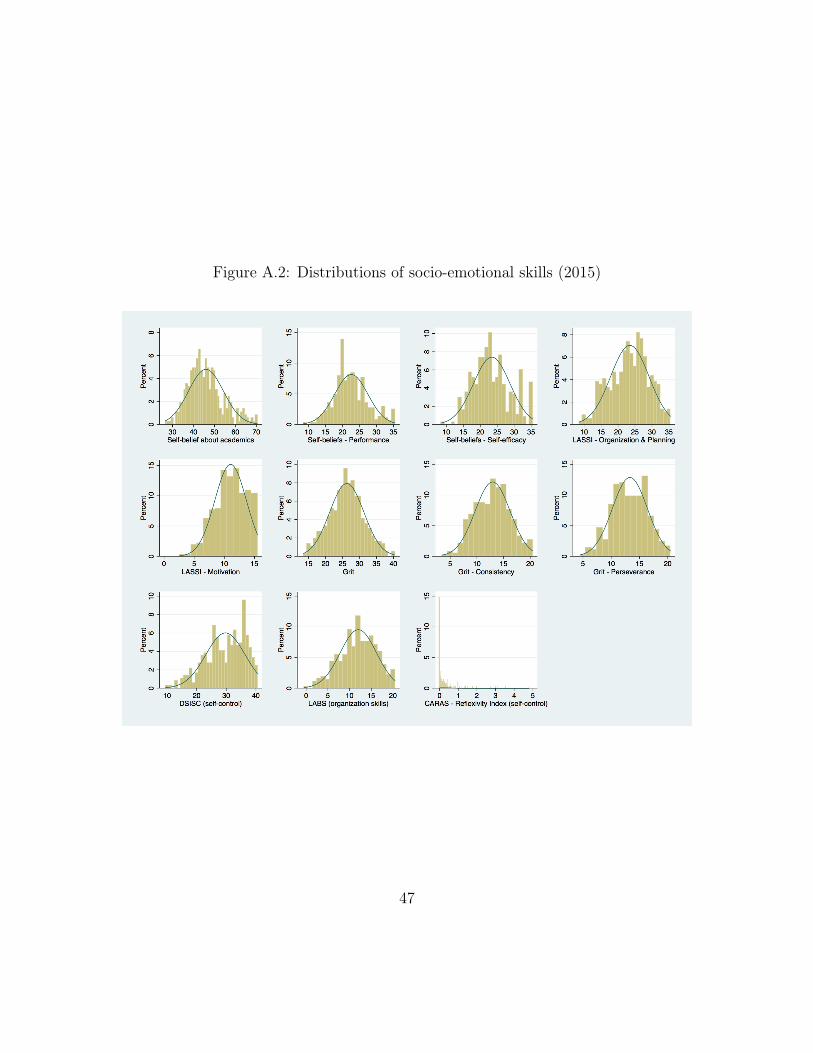
The distributions of the raw scores on these skills are shown in Figure A.2. The
scores were standardized with the mean and standard deviation of the full sample.
[Insert Table 6 here.]
Once again, the offer of the program had a positive but statistically insignificant
effect on most socio-emotional skills during the second year. There was one exception.
It increased students’ motivation by .171 to .177 SDs. It also seems to have increased
students’ self-beliefs about performance by .14 to .159 SDs, but this effect is only
marginally statistically significant. Similarly, the program appears to have increased
the perseverance of these students by .17 SDs, but these effects become statistically
insignificant once we include covariates.
The rest of the coefficients are imprecisely estimated. Again, we cannot discard
large positive or negative effects. The effects on one of the performance assessments
(LABS), however, is once again estimated to be negative.
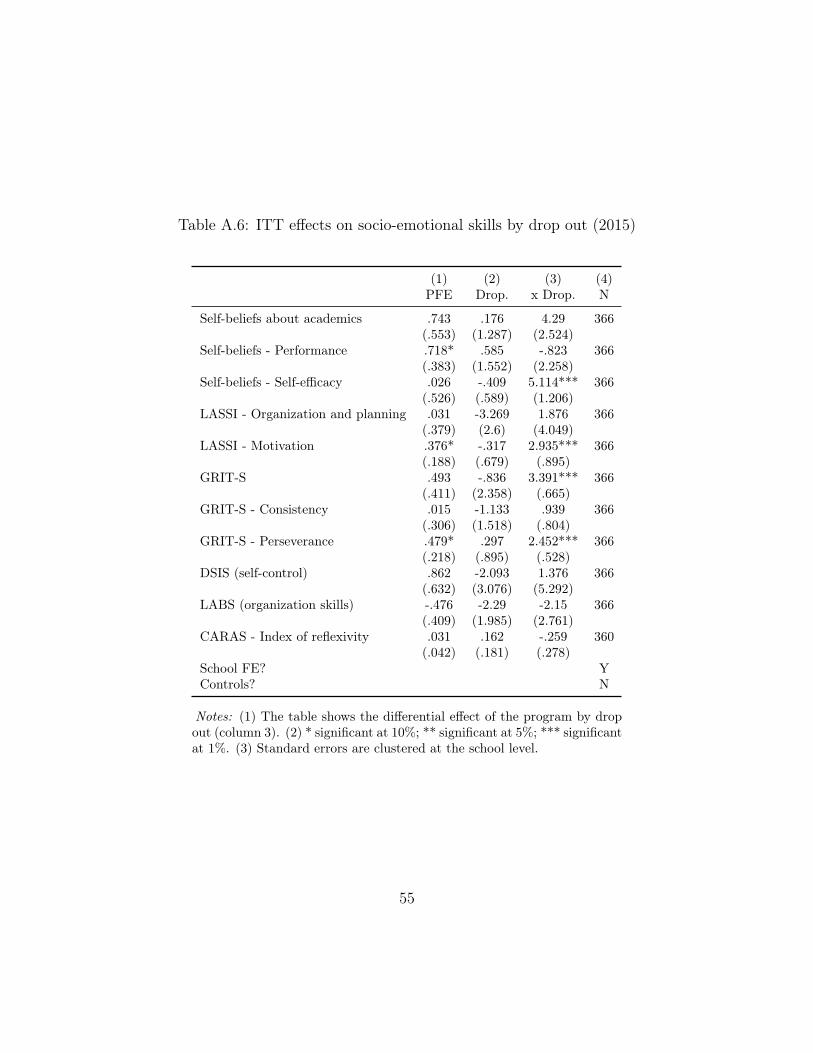
We find little evidence that the program differentially impacted girls or students
who had previously repeated a grade. Yet, it had a differential impact on students
who had dropped out and low-income students. As Table A.6 shows, it improved
23
DRAFTthe self beliefs about self-efficacy of prior dropouts, their motivation, grit, and perse-
verance. As Table A.7 indicates, the program had large impacts on the organization
and planning skills and perseverance of low-income students. It also seems to have
increased their grit and self-control (as measured by DSIS), but these effects are only
marginally statistically significant.
6.2.2 School navigation skills
Table 7 shows the effects of the program on academic skills after 17 months. We have
presented these effects in indices of students’ behaviors. The variables in each index
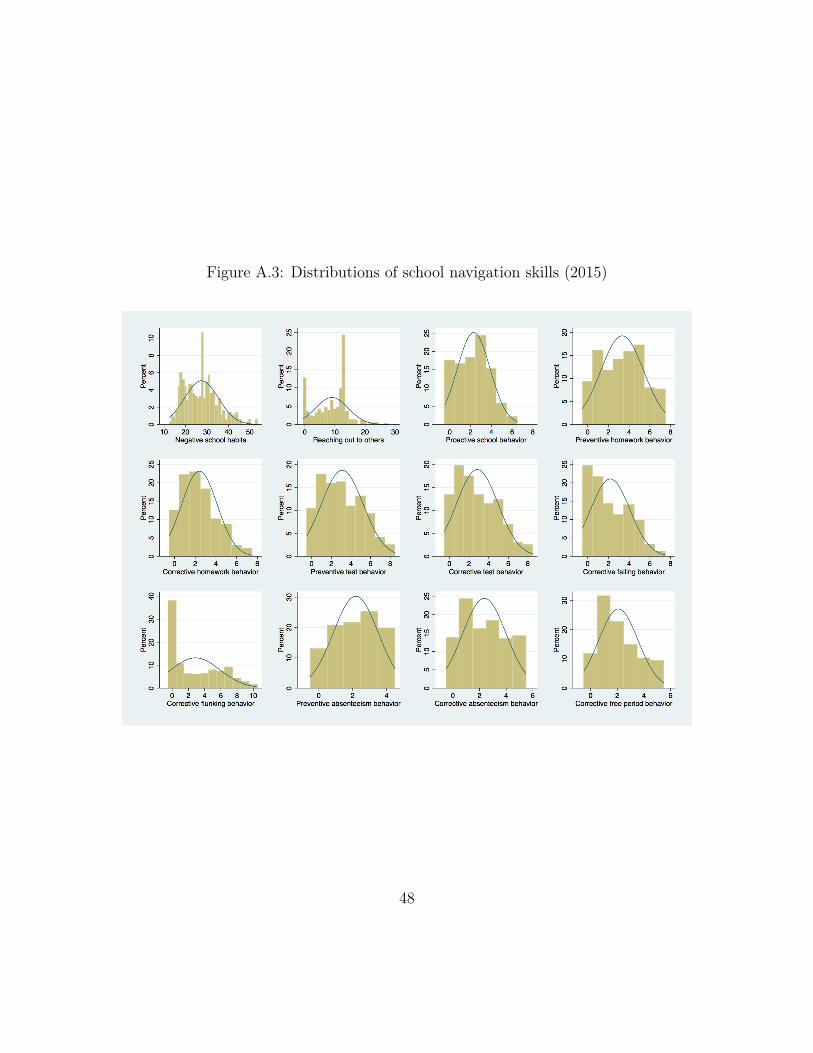
are shown in Appendix D. The distributions of the raw indices are in Figure A.3.
[Insert Table 7 here.]
The program reduced the extent to which students reached out for help with
negative school habits by .17 to .213 SDs. Yet, it positively impacted students’
corrective homework behavior (by .167 to .203 SDs), preventive test behavior (by .142
to .206 SDs), corrective failing behavior (by .201 to .261 SDs), corrective absenteeism
behavior (.214 to .254 SDs), and corrective free period behavior (by .226 to .254 SDs).
It also seems to have increased students preventive homework behavior (by .17 to
.231 SDs) and corrective test behavior (by .163 to .217 SDs), but such effects become
statistically insignificant once we include covariates.
We find little evidence that the program differentially impacted girls or students
who had previously repeated a grade. It was however particularly beneficial for
students who had previously dropped out and low-income students. As Table A.8
24
DRAFTshows, the program had very large positive impacts on the propensity of previous
dropouts to reach out to others, their proactive school behavior, and their preventive
test behavior. As Table A.9 indicates, it also had smaller negative effects on the
negative school habits low-income students (i.e., it purportedly reduce those habits).
Interestingly, however, it also reduced their corrective homework behavior. In fact,
the coefficients on the interaction between the treatment and the low-income dummy
is negative (although statistically insignificant) for most school navigation indices.
6.2.3 Academic skills
Table 8 shows the effects of the program on academic skills after 12 months. The
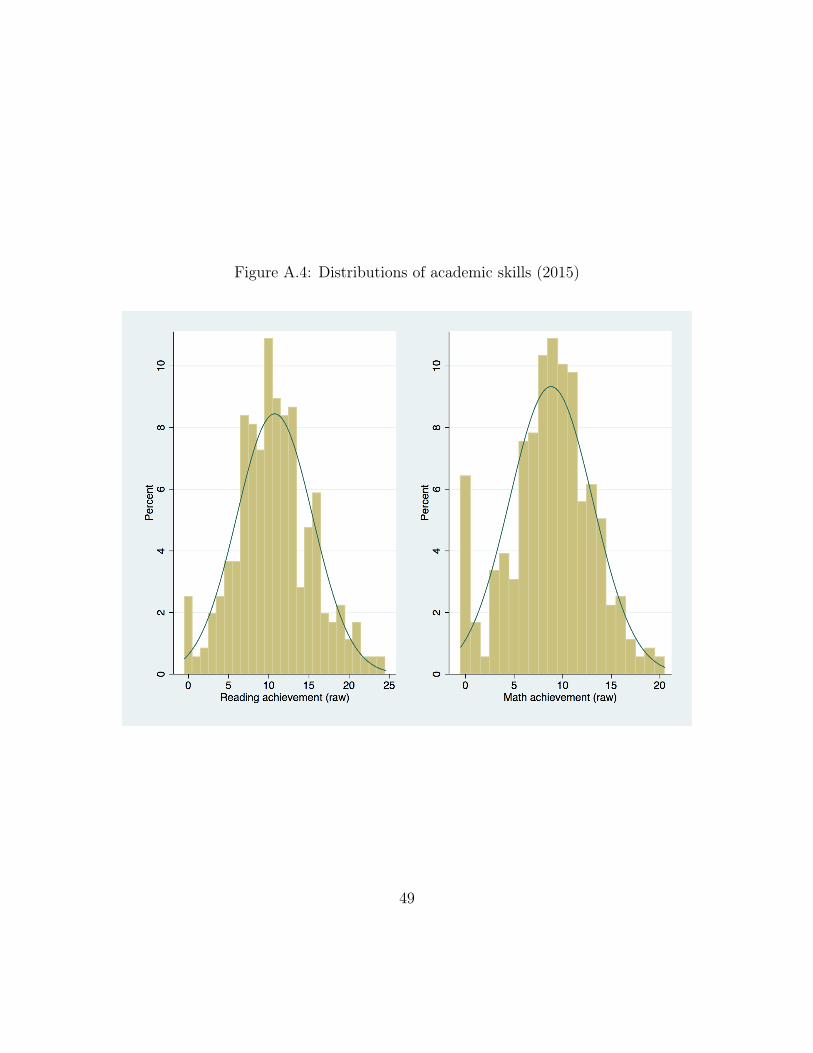
distributions of the raw scores on these skills are shown in Figure A.4. Below, these
scores are standardized with the mean and standard deviation of the full sample.
[Insert Table 8 here.]
We can discard small effects in reading (larger than .06 SDs) and moderate effects
in math (larger than .21 SDs). In fact, we find little evidence that the program
differentially impacted any sub-group of students.
7 Discussion
This papers presents the findings from the first two years of a three-year experimental
evaluation of a program that combines scholarships and mentoring for secondary
school students in the Province of Buenos Aires, Argentina. The program seeks to
25
DRAFTdirectly improve students’ participation in school, and to indirectly improve their
performance in school and academic skills by affecting their socio-emotional skills.
We find that the program had the intended effects, but mostly not through its
hypothesized mechanisms. On average, it reduced student absenteeism and grade
failure, but there is no evidence that it reduced drop out rates. It also improved
school performance and school navigation skills, but there is limited evidence that it
improved socio-emotional skills, and no evidence that it improved academic skills.
One way of interpreting these results is that instead of radically changing stu-
dents’ general socio-emotional skills, such as grit and self-control, the program helped
students succeed in school by marginally affecting more specific socio-emotional skills,
such as doing homework in advance and reviewing failed assignments. This interpre-
tation is consistent with the heterogeneous effects that we observe, since the program
was most beneficial for students who are least likely to have developed these habits,
such as students who had previously dropped out of school and students from low-
income families. It is also consistent with the position of some psychologists, who
have argued against conceptualizations of socio-emotional skills that apply to every
context, and in favor of constructs that are more context-specific (see Mischel 1968).
And it is also in agreement with the findings from the empirical literature summa-
rized in Section 2, which indicate that academic behaviors have the most immediate
effect on academic performance (see Farrington et al. 2012).
The results from the upcoming rounds of data collection will help us better un-
derstand how much empirical support there is behind this working hypotheses. In
mid 2016, we will collect data on students’ school performance in 2015, which will
26
DRAFTallow us to test for heterogenous effects in school performance by school naviga-
tion skills. In late 2016, we will also conduct a third round of data collection on
socio-emotional, school navigation, and academic skills, to understand whether the
program has affected these over the medium-term.
27
DRAFTReferences
Alfonso, M., M. S. Bos, J. Duarte, and C. Rondón (2011). Panorama general de la
educación en América Latina y el Caribe. In Cabrol, M. and Székely, M. (Eds.),
Educación para la transformación. Washington, DC: Banco Interamericano de De-
sarollo (BID).
Arán-Filipetti, V. (2012). Estrato socioeconómico y habilidades cognitivas en niños
escolarizados: Variables predictoras y mediadoras. PSYKE 21, 3–20.
Arán-Filipetti, V. and M. López (2013). Las funciones ejecutivas en la clínica neu-
ropsicológica infantil. Psicología desde el caribe 30, 380–415.
Arán-Filipetti, V. and M. Richaud de Minzi (2011). Efectos de un programa de
intervención para aumentar la reflexividad y la planificación en un ámbito escolar
de alto riesgo por pobreza. Universitas Psychologica 10, 341–354.
Baez, J. E. and A. Camacho (2011). Assessing the long-term effects of conditional
cash transfers on human capital: Evidence from Colombia. (World Bank Policy
Research Working Paper No. 5681). The World Bank. Washington, DC.
Baird, S., C. McIntosh, and B. Özler (2011). Cash or condition? Evidence from a
cash transfer experiment. The Quarterly Journal of Economics 126, 1709–1753.
Banerjee, A., P. Glewwe, S. Powers, and M. Wasserman (2013). Expanding access
and increasing student learning in post-primary education in developing countries:
A review of the evidence. Unpublished manuscript. Abdul Latif Jameel Latif
Poverty Action Lab (J-PAL). Cambridge, MA.
28
DRAFTBarham, T., K. Macours, and J. A. Maluccio (2014). Assessing long-term impacts
of conditional cash transfers on children and young adults in rural Nicaragua.
(Impact Evaluation Report No. 17). International Initiative for Impact Evaluation
(3ie). New Delhi, India.
Barrera-Osorio, F., M. Bertrand, L. L. Linden, and F. Perez-Calle (2011). Improving
the design of conditional transfer programs: Evidence from a randomized education
experiment in Colombia. American Economic Journal: Applied Economics , 167–
195.
Barrera-Osorio, F. and D. Filmer (2013). Incentivizing schooling for learning: Ev-
idence on the impact of alternative targeting approaches. (World Bank Policy
Research Working Paper No. 6541). The World Bank. Washington, DC.
Barrera-Osorio, F., L. L. Linden, and M. Urquiola (2007). The effects of user
fee reductions on enrollment: Evidence from a quasi-experiment. Unpublished
manuscript. Department of Economics at The University of Texas at Austin.
Austin, TX.
Behrman, J. R., S. W. Parker, and P. E. Todd (2009). Schooling impacts of condi-
tional cash transfers on young children: Evidence from Mexico. Economic Devel-
opment and Cultural Change 57 (3), 439–477.
Behrman, J. R., S. W. Parker, and P. E. Todd (2011). Do conditional cash
transfers for schooling generate lasting benefits? A five-year followup of PRO-
GRESA/Oportunidades. Journal of Human Resources 46 (1), 93–122.
29
DRAFTBenhassine, N., F. Devoto, E. Duflo, P. Dupas, and V. Pouliquen (2013). Turning
a shove into a nudge? A “labeled cash transfer” for education. (NBER Working
Paper No. 19227). National Bureau of Economic Research (NBER). Cambridge,
MA.
Borghans, L., A. L. Duckworth, J. J. Heckman, and B. Ter Weel (2008). The eco-
nomics and psychology of personality traits. Journal of Human Resources 43 (4),
972–1059.
Borkum, E. (2012). Can eliminating school fees in poor districts boost enrollment?
Evidence from South Africa. Economic Development and Cultural Change 60 (2),
359–398.
Busso, M., M. Bassi, and J. S. Muñoz (2013). Is the glass half empty or half full?
School enrollment, graduation, and dropout rates in Latin America. (IDB Working
Paper No. 462). Inter-American Development Bank. Washington, DC.
Cayssials, A. N. (2003). La escala de inteligencia WISC-III en la evaluación psi-
cológica infanto-juvenil. Buenos Aires, Argentina.
Dammert, A. C. (2009). Heterogeneous impacts of conditional cash transfers: Evi-
dence from Nicaragua. Economic Development and Cultural Change 58 (1), 53–83.
Del Carpio, X. V. and K. Macours (2010). Leveling the intra-household playing
field: Compensation and specialization in child labor allocation. Research in Labor
Economics 31, 259–295.
30
DRAFTDiNIECE (2013a). Anuario Estadístico 2013. Buenos Aires, Argentina: Dirección
Nacional de Información de la Calidad Educativa (DiNIECE).
DiNIECE (2013b). Redefiniciones normativas y desafíos de la educación secundaria
en Argentina. Acuerdos federales en un sistema descentralizado. La educación en
debate. Buenos Aires, Argentina: Dirección Nacional de Información y Evaluación
de la Calidad Educativa (DiNIECE).
Duckworth, A. L. and P. D. Quinn (2009). Development and validation of the short
Grit scale (GRIT–S). Journal of Personality Assessment 91, 166–174.
Duckworth, A. L. and D. S. Yeager (2015). Measurement matters: Assessing per-
sonal qualities other than cognitive ability for educational purposes. Educational
Researcher 44 (4), 237–251.
Evans, D., M. Kremer, and M. Ngatia (2009). The impact of distributing school
uniforms on children’s education in Kenya. Unpublished manuscript. The World
Bank. Washington, DC.
Farrington, C. A., M. Roderick, E. Allensworth, J. Nagaoka, T. S. Keyes, D. W.
Johnson, and N. O. Beechum (2012). Teaching adolescents to become learners:
The role of noncognitive factors in shaping school performance–A critical litera-
ture review. Unpublished manuscript. The Unviersity of Chicago Consortium on
Chicago School Research (CCSR). Chicago, IL.
Fernandez Liporace, M. M. and M. M. Casullo (2009). Factores salugénicos, ajuste
psicológico y rendimiento académico en estudiantes de nivel medio y universitar-
31
DRAFTios. Unpublished manuscript. Universidad de Buenos Aires (UBA). Buenos Aires,
Argentina.
Filmer, D. and N. Schady (2014). The medium-term effects of scholarships in a
low-income country. Journal of Human Resources 49 (3), 663–694.
Fiszbein, A., N. R. Schady, F. H. Ferreira, M. Grosh, N. Kelleher, P. Olinto,
and E. Skoufias (2009). Conditional cash transfers: Reducing present and future
poverty. Washington, DC: The World Bank.
Gabrieli, C., D. Ansel, and S. Bartolino Krachman (2015). Ready to be counted:
The research case for education policy action on non-cognitive skills. Unpublished
manuscript. Transforming Education. Boston, MA.
Galiani, S. and P. J. McEwan (2013). The heterogeneous impact of conditional cash
transfers. Journal of Public Economics 103, 85–96.
Ganimian, A. J. (2013). No logramos mejorar: Informe sobre el desempeño de Ar-
gentina en el Programa para la Evaluación Internacional de Alumnos (PISA) 2012.
Buenos Aires, Argentina: Proyecto Educar 2050.
Ganimian, A. J. (2014). El aprendizaje desigual ¿Cómo difiere el desempeño de los
alumnos de las regiones argentinas en el Programa para la Evaluación Interna-
cional de Alumnos (PISA) 2012? Buenos Aires, Argentina: Proyecto Educar
2050.
Ganimian, A. J. (2015). El termómetro educativo: Informe sobre el desempeño de
32
DRAFTArgentina en los Operativos Nacionales de Evaluación (ONE) 2005-2013. Buenos
Aires, Argentina: Proyecto Educar 2050.
Ganimian, A. J. and R. J. Murnane (2016). Improving educational outcomes in devel-
oping countries: Lessons from rigorous impact evaluations. Review of Educational
Research.
Glewwe, P., M. Kremer, and S. Moulin (2009). Many children left behind? Textbooks
and test scores in Kenya. American Economic Journal: Applied Economics 1 (1),
112–135.
Huan, W., J. Chu, P. Loyalka, X. Tao, and Q. Y. C. R. S. Shi, Yaojiang Qu (2014).
Can school counseling reduce school dropout in developing countries? (REAP
Working Paper No. 275). Rural Education Action Program (REAP). Stanford,
CA.
Jensen, R. (2010). The (perceived) returns to education and the demand for school-
ing. The Quarterly Journal of Economics 125 (2), 515–548.
Jensen, R. (2012). Do labor market opportunities affect young women’s work and
family decisions? Experimental evidence from India. The Quarterly Journal of
Economics 127 (2), 753–792.
Karlan, D. and L. L. Linden (2014). Loose knots: Strong versus weak commitments
to save for education in uganda. (NBER Working Paper No. 19863). National
Bureau of Economic Research (NBER). Cambridge, MA.
33
DRAFTKremer, M. R., E. A. Miguel, and R. L. Thorton (2004). Incentives to learn. The
Review of Economics and Statistics 91, 437–456.
Liu, C., H. Yi, L. Zhang, R. Luo, Y. Shi, J. Chu, and S. Rozelle (2012). The effect
of early commitment of financial aid on matriculation to senior high school among
poor junior high students in rural China. (REAP Working Paper No. 254). Rural
Education Action Program (REAP). Stanford, CA.
Loyalka, P., C. Liu, Y. Song, H. Yi, X. Huang, J. Wei, L. Zhang, Y. Shi, J. Chu,
and S. Rozelle (2013). Can information and counseling help students from poor
rural areas go to high school? Evidence from China. Journal of Comparative
Economics 41 (4), 1012–1025.
Lucas, A. M. and I. M. Mbiti (2012). Access, sorting, and achievement: the short-run
effects of free primary education in Kenya. American Economic Journal: Applied
Economics 4, 226–253.
Maluccio, J. and R. Flores (2005). Impact evaluation of a conditional cash transfer
program: The Nicaraguan Red de Protección Social. Unpublished manuscript.
International Food Policy Research Institute.
Martos Mula, A., O. Saavedra, N. Wierna, M. Ruggeri, J. Tschambler, N. Ávila Car-
reras, M. Bonillo, and M. Bovi Mitre (2013). Afectación de las funciones cogni-
tivas y motoras en niños residentes de zonas rurales de Jujuy y su relación con
plaguicidas inhibidores de la colinesterasa. Un estudio piloto. Acta toxicológica
Argentina 21, 15–24.
34
DRAFTMischel, W. (1968). Personality and assessment. New York, NY: Wiley.
Muralidharan, K. and N. Prakash (2013). Cycling to school: Increasing secondary
school enrollment for girls in India. (Working Paper No. 19305). National Bureau
of Economic Research (NBER). Cambridge, MA.
Muralidharan, K. and Y. Zieleniak (2014). Chasing the syllabus: Measuring learn-
ing trajectories in developing countries with longitudinal data and item response
theory. Unpublished manuscript. University of California, San Diego. San Diego,
CA.
OECD (2014). Education at a Glance 2014: OECD Indicators. Paris, France: Or-
ganisation for Economic Co-operation and Deveopment.
Pais, E. F. (2015). Informe de evaluación de impacto en habilidades socioemocionales
del programa extra-clase, Año 2014, Argentina y México. Unpublished manuscript.
Techint. Buenos Aires, Argentina.
Pais, E. F., M. Cortelezzi, and D. Valencia (2013). El desarrollo de habilidades
socioemocionales en estudiantes secundarios a través de una estrategia de acom-
pañamiento. Resultados de una evaluación sobre alumnos de 1er año del nivel
secundario. In V Congreso Internacional de Investigación y Práctica Profesional
en Psicología. Facultad de Psicología, Universidad de Buenos Aires. Buenos Aires,
Argentina.
Perova, E. and R. Vakis (2012). 5 years in Juntos: New evidence on the program’s
short and long-term impacts. Economía 35 (69), 53–82.
35
DRAFTPritchett, L. and A. Beatty (2015). Slow down, you’re going too fast: Matching cur-
ricula to student skill levels. International Journal of Educational Development 40,
276–288.
Schmidt, V., N. Messoulam, and F. Molina (2008). Autoconcepto académico en ado-
lescentes de escuelas medias: Presentación de un instrumento para su evaluación.
Revista Iberoamericana de Diagnóstico y Evaluación Psicológica 25 (81-106).
Schultz, T. P. (2004). School subsidies for the poor: Evaluating the Mexican Progresa
poverty program. Journal of development Economics 74 (1), 199–250.
Skoufias, E., S. W. Parker, J. R. Behrman, and C. Pessino (2001). Conditional
cash transfers and their impact on child work and schooling: Evidence from the
Progresa program in Mexico. Economia, 45–96.
Soprano, A. (2003). Evaluación de las funciones ejecutivas en el niño. Revista Neu-
rología 37 (44-50).
Thurstone, L. L. and M. Yela (2001). CARAS. Test de percepción de diferencias (9a
edición). Madrid, Spain: TEA Ediciones.
Tsukayama, E., A. L. Duckworth, and B. Kim (2013). Domain-specific impulsivity
in school-age children. Developmental Science 16 (879-893).
Wechsler, D. (1994). Test de inteligencia para niños WISC-III: manual. Buenos
Aires, Argentina: Paidós.
Weinstein, C. E. and D. R. Palmer (1988). LASSI: The learning and study strategies
inventory. Miami, FL: Publishing Company.
36
DRAFTWest, M. R., M. A. Kraft, A. S. Finn, R. Martin, A. L. Duckworth, C. F. Gabrieli,
J. D. Gabrieli, et al. (2014). Promise and paradox: Measuring students’ non-
cognitive skills and the impact of schooling. Unpublished manuscript. Harvard
Graduate School of Education. Cambridge, MA.
37
DRAFTTa
ble1:
PFE’s
theory
ofchan
ge
Need
Inpu
tActivities
Outpu
tOutcome
Impa
ct
•Parents
cannot
affordcostsof
schoo
ling(direct
costs,
costsof
complem
ents,
and/
orop
portun
ity
costs)
•ARS3,600pe
rstud
entpe
ryear
•Scholarship:
Disbu
rsem
entof
ARS
3,600pe
ryear
tostud
ents’p
arents
orgu
ardian
s
•Parents
coverthe
costsof
stud
ents’
scho
oling
•Higherstud
ent
participationin
scho
ol
•Lo
wer
absenteeism
•Lo
wer
grad
erepe
tition
•Lo
wer
drop
out
rates
•Parents
lack
experience
with
secondaryschoo
lto
tran
sfer
scho
olread
inessskills
•Enc
arga
rdos
deac
ompa
ñam
ient
o(E
Asor
mentors)
•Mentoring:
One
individu
alor
grou
pmeeting
sbe
tween
PFE
participan
tsan
dEAspe
rmon
th
•PFE
participan
tslearnho
wto
better
prepareforscho
ol•PFE
participan
tslearnho
wto
solve
prob
lemsthat
comeup
inscho
ol
•Higher
socio-em
otiona
lskills(e.g.,grit,
self-control)
•Higherscho
olna
vigation
skills
•Higherpa
ssing
ratesan
dgrad
esin
scho
ol•Higheracad
emic
skills
38
DRAFTTable 2: Data collection timeline
Month Event Participants Location
2014
February School year startsMay 14-26 Student survey 100% sample School
Household survey 81% sample School (in person)19% sample Phone
Lottery is conductedNov 10-Dec 4 Survey of socio-emotional skills 80% sample SchoolDec 18-Jan 16 17% sample Home
2015
January PFE data for 2014 100% treatmentSchool data for 2014 100% sample
February School year startsJun 22-Jul 6 Survey of academic skills 75% sample SchoolJul 13-Aug 12 13% sample HomeOct 14-Nov 6 Survey of socio-emotional skills 66% sample School
School navigation skillsNov 3-Dec 1 24% sample Home
2016
January PFE data for 2015 100% treatment
39
DRAFTTable 3: Balancing checks (baseline)
Variable All Control Treatment Diff. N(1) (2) (3) (4) (5)
Panel A. Student survey
Argentine .951 .951 .951 0 408(.216) (.216) (.216) (.026)
Female .52 .544 .495 -.049 408(.5) (.499) (.501) (.051)
Age 12.435 12.502 12.368 -.131 407(1.062) (1.153) (.961) (.11)
Morning shift .578 .583 .574 -.008 408(.494) (.494) (.496) (.045)
Repeated grade(s) .309 .322 .297 -.024 404(.463) (.468) (.458) (.044)
Dropped out .044 .064 .025 -.039* 408(.206) (.245) (.155) (.02)
Panel B. Household survey
Has car .21 .163 .256 .096*** 405(.408) (.371) (.438) (.026)
Has fridge .72 .677 .764 .087** 404(.449) (.469) (.426) (.028)
Has computer .545 .547 .542 -.002 404(.499) (.499) (.499) (.026)
Has cell phone .913 .891 .936 .045 404(.282) (.313) (.245) (.029)
Has Internet .386 .383 .389 .01 404(.487) (.487) (.489) (.036)
Has natural gas .298 .269 .327 .064* 403(.458) (.444) (.47) (.034)
Has running water .825 .805 .846 .051 401(.38) (.397) (.362) (.047)
Has solid floor .985 .98 .99 .01 398(.122) (.141) (.1) (.007)
Homeowner .627 .605 .648 .043 389(.484) (.49) (.479) (.035)
Notes: (1) The table shows the mean and standard deviations of all studentsin the sample (column 1), control g > roup (column 2), and treatment group(column 3). It also tests for differences across these two groups (column 4) andshows the number of non > -missing observations (column 5). (2) * significant at10%; ** significant at 5%; *** significant at 1%. (3) Standard errors in column4 are clustered at the school level.
40
DRAFTTable 4: ITT effects on socio-emotional skills (2014)
(1) (2) (3)Control Effect size
Self-beliefs about academics -.021 .04 .022(.969) (.099) (.087)193 395 391
Self-beliefs - Performance .037 -.072 -.075(.938) (.133) (.125)193 395 391
Self-beliefs - Self-efficacy -.088 .17*** .139**(1.016) (.052) (.05)193 395 391
LASSI - Organization and planning -.015 .027 .029(.999) (.101) (.097)193 395 391
LASSI - Motivation -.079 .156 .121(1.02) (.131) (.142)193 395 391
GRIT-S -.039 .076 .053(.966) (.07) (.076)193 395 391
GRIT-S - Consistency .022 -.044 -.051(.999) (.086) (.09)193 395 391
GRIT-S - Perseverance -.088 .172* .141(.947) (.082) (.083)193 395 391
DSIS (self-control) -.052 .098 .12(.986) (.097) (.094)193 395 391
LABS (organization skills) .009 -.014 -.079(.982) (.065) (.068)193 395 391
CARAS - Index of reflexivity .006 -.01 .01(1.121) (.092) (.08)193 394 390
School FE? Y YControls? N Y
Notes: (1) The table shows the mean and standard deviations ofcontrol group students (column 1) and the average ITT effect with(column 2) and without covariates (column 3). (2) * significant at10%; ** significant at 5%; *** significant at 1%. (3) Standard errorsin columns 2 and 3 are clustered at the school level.
41
DRAFTTable 5: ITT effects on school performance (2014)
(1) (2) (3)Control Effect size
Language - final grade -.032 .058 .039(1.08) (.052) (.059)161 345 343
Math - final grade .047 -.09 -.109(.995) (.143) (.135)153 328 326
Language - passed .721 .111*** .093**(.45) (.034) (.029)204 408 403
Math - passed .696 .09** .071*(.461) (.039) (.035)204 408 403
Absences - 2014 17.212 -2.989* -2.278*(18.926) (1.412) (1.162)
204 408 403Failed .147 -.061** -.047***
(.355) (.024) (.013)204 408 403
Dropped out .025 -.01 -.016(.155) (.012) (.012)204 408 403
Transferred .054 -.025 -.016(.226) (.021) (.019)204 408 403
School FE? Y YControls? N Y
Notes: (1) The table shows the mean and standard devia-tions of control group students (column 1) and the averageITT effect with (column 2) and without covariates (col-umn 3). (2) * significant at 10%; ** significant at 5%; ***significant at 1%. (3) Standard errors in columns 2 and 3are clustered at the school level.
42
DRAFTTable 6: ITT effects on socio-emotional skills (2015)
(1) (2) (3)Control Effect size
Self-beliefs about academics -.047 .1 .098(.941) (.068) (.068)180 366 362
Self-beliefs - Performance -.069 .14* .159*(.974) (.071) (.076)180 366 362
Self-beliefs - Self-efficacy -.01 .028 .008(.989) (.103) (.093)180 366 362
LASSI - Organization and planning -.013 .028 .025(.94) (.074) (.061)180 366 362
LASSI - Motivation -.084 .171** .177*(.988) (.073) (.084)180 366 362
GRIT-S -.059 .117 .101(1.023) (.09) (.086)180 366 362
GRIT-S - Consistency -.011 .02 .011(1.026) (.095) (.091)180 366 362
GRIT-S - Perseverance -.083 .17* .153(1.029) (.078) (.085)180 366 362
DSIS (self-control) -.076 .142 .144(1.071) (.082) (.082)180 366 362
LABS (organization skills) .057 -.111 -.155(.978) (.107) (.107)180 366 362
CARAS - Index of reflexivity -.025 .044 .102(1.006) (.082) (.083)176 360 356
School FE? Y YControls? N Y
Notes: (1) The table shows the mean and standard deviations ofcontrol group students (column 1) and the average ITT effect with(column 2) and without covariates (column 3). (2) * significantat 10%; ** significant at 5%; *** significant at 1%. (3) Standarderrors in columns 2 and 3 are clustered at the school level.
43
DRAFT
Table 7: ITT effects on school navigation skills (2015)
(1) (2) (3)Index Control Effect size
Negative school habits .019 -.032 -.038(1.017) (.103) (.102)180 366 362
Reaching out to others .088 -.17* -.213**(1.029) (.077) (.087)180 366 362
Proactive school behavior -.062 .114 .048(.99) (.16) (.14)180 366 362
Preventive homework behavior -.123 .231* .17(.982) (.123) (.105)180 366 362
Corrective homework behavior -.109 .203** .167*(.989) (.08) (.081)180 366 362
Preventive test behavior -.11 .206** .142*(.984) (.069) (.064)180 366 362
Corrective test behavior -.116 .217** .163(1.008) (.082) (.089)180 366 362
Corrective failing behavior -.138 .261** .201**(.989) (.083) (.085)180 366 362
Corrective flunking behavior -.064 .119 .069(.986) (.086) (.091)180 366 362
Preventive absenteeism behavior -.095 .179 .133(1.015) (.098) (.09)180 366 362
Corrective absenteeism behavior -.132 .254** .214**(.997) (.088) (.093)180 366 362
Corrective free period behavior -.133 .254** .226**(.971) (.097) (.099)180 366 362
School FE? Y YControls? N Y
Notes: (1) The table shows the mean and standard deviations ofcontrol group students (column 1) and the average ITT effect with(column 2) and without covariates (column 3). (2) * significantat 10%; ** significant at 5%; *** significant at 1%. (3) Standarderrors in columns 2 and 3 are clustered at the school level.
44
DRAFTTable 8: ITT effects on academic skills (2015)
(1) (2) (3)Control Effect size
Reading achievement (std.) .072 -.129 -.158(.986) (.084) (.089)177 358 356
Math achievement (std.) .005 .009 -.046(1.075) (.092) (.092)177 358 356
School FE? Y YControls? N Y
Notes: (1) The table shows the mean and standard devia-tions of control group students (column 1) and the averageITT effect with (column 2) and without covariates (column3). (2) * significant at 10%; ** significant at 5%; *** sig-nificant at 1%. (3) Standard errors in columns 2 and 3 areclustered at the school level.
45
DRAFTAppendix A
Figure A.1: Distributions of socio-emotional skills (2014)
46
DRAFTFigure A.2: Distributions of socio-emotional skills (2015)
47
DRAFTFigure A.3: Distributions of school navigation skills (2015)
48
DRAFTFigure A.4: Distributions of academic skills (2015)
49
DRAFTTable A.1: Treatment dosage (2014 and 2015)
2014 2015Variable Treatment N Treatment N
(1) (2) (3) (4)
PFE scholarships received 7.51 204 7.817 191(3.023) (3.347)
Intended mentoring sessions 9.093 204 8.77 191(1.025) (2.902)
Actual sessions 7.819 204 7.487 191(1.782) (3.291)
Introductory sessions 1.152 204 0 191(.588) (0)
Monthly sessions 6.98 204 6.812 191(1.178) (2.669)
Wrap-up sessions .961 204 .838 191(.195) (.37)
Individual sessions 7.245 204 8.152 191(1.912) (2.723)
Group sessions 1.848 204 .618 191(1.503) (.707)
No. of mentors 1.191 204 1.099 191(.394) (.3)
Rescheduled once .216 204 .466 191(.509) (.905)
Rescheduled twice .025 204 .094 191(.155) (.343)
Rescheduled more than twice 0 204 .005 191(0) (.072)
Parent/guardian invited 5.858 204 7.157 191(2.295) (2.56)
Parent/guardian attended 5.49 204 4.738 191(2.412) (2.758)
Notes: (1) The table shows the mean and standard deviations of stu-dents in the treatment group (columns 1 and 3) and the number ofnon-missing observations (columns 2 and 4).
50
DRAFT
Table A.2: Attrition checks
Attritors Non-attritors Difference-Control Treatment Control Treatment in-Difference
(1) (2) (3) (4) (5)
Panel A. Survey of socio-emotional skills (2014)
Argentine .909 0 .953 .96 -.916***(.302) (0) (.211) (.196) (.091)
Female .364 .5 .554 .495 .214(.505) (.707) (.498) (.501) (.162)
Age 13.091 13.5 12.469 12.356 .465(1.221) (.707) (1.144) (.958) (.411)
Morning shift .455 .5 .591 .574 .037(.522) (.707) (.493) (.496) (.119)
Repeated grade(s) .4 1 .318 .29 .573***(.516) (0) (.467) (.455) (.128)
Dropped out .273 0 .052 .025 -.335*(.467) (0) (.222) (.156) (.171)
N 11 2 193 202 408
Panel B. Surveys of socio-emotional and school navigation skills (2015)
Argentine .917 .889 .956 .957 -.025(.282) (.323) (.207) (.203) (.096)
Female .167 .444 .594 .5 .36**(.381) (.511) (.492) (.501) (.127)
Age 13 12.667 12.439 12.339 -.291(1.314) (1.085) (1.119) (.946) (.372)
Morning shift .375 .5 .611 .581 .071(.495) (.514) (.489) (.495) (.141)
Repeated grade(s) .391 .5 .313 .277 .121(.499) (.514) (.465) (.449) (.196)
Dropped out .167 .056 .05 .022 -.106(.381) (.236) (.219) (.145) (.118)
N 24 18 180 186 408
Panel C. Assessment of academic skills (2015)
Argentine .963 .913 .949 .956 -.052(.192) (.288) (.22) (.206) (.107)
Female .519 .435 .548 .503 -.002(.509) (.507) (.499) (.501) (.154)
Age 13.333 12.913 12.375 12.298 -.298(1.24) (1.24) (1.088) (.9) (.345)
Morning shift .481 .478 .599 .586 .054(.509) (.511) (.492) (.494) (.146)
Repeated grade(s) .615 .478 .278 .274 -.122(.496) (.511) (.449) (.447) (.231)
Dropped out .222 .043 .04 .022 -.17(.424) (.209) (.195) (.147) (.11)
N 27 23 177 181 408
Notes: (1) The table shows the mean and standard deviations of attritors andnon-attritors by experimental group (columns 1-4). It also tests for the difference-in-difference in these outcomes (column 5). (2) * significant at 10%; ** significantat 5%; *** significant at 1%. (3) Standard errors in column 5 are clustered at theschool level.
51

DRAFTTable A.3: ITT effects on socio-emotional skills by drop out (2014)
(1) (2) (3) (4)PFE Drop. x Drop. N
Self-beliefs about academics .103 -4.133*** 5.316* 395(.841) (.755) (2.88)
Self-beliefs - Performance -.452 -1.812 -.319 395(.805) (1.255) (2.526)
Self-beliefs - Self-efficacy .555** -2.321*** 5.635*** 395(.228) (.548) (1.121)
LASSI - Organization and planning .161 -.978 -1.84 395(.578) (2.434) (4.063)
LASSI - Motivation .366 .023 1.821** 395(.358) (.402) (.608)
GRIT-S .431 .029 -2.159 395(.393) (1.818) (2.352)
GRIT-S - Consistency -.123 -.574 -1.395 395(.305) (1.485) (1.777)
GRIT-S - Perseverance .554* .602 -.764 395(.269) (.366) (.808)
DSIS (self-control) .652 -1.247 -2.243 395(.671) (1.551) (2.191)
LABS (organization skills) -.036 -1.389 -2.421 395(.242) (2.188) (2.002)
CARAS - Index of reflexivity .001 .039 -.109 394(.024) (.077) (.117)
School FE? YControls? N
Notes: (1) The table shows the differential effect of the program by drop out(column 3). (2) * significant at 10%; ** significant at 5%; *** significant at1%. (3) Standard errors are clustered at the school level.
52
DRAFTTable A.4: ITT effects on socio-emotional skills by low SES (2014)
(1) (2) (3) (4)PFE Poor x Poor N
Self-beliefs about academics -.487 -.037 2.925 395(.796) (1.242) (1.606)
Self-beliefs - Performance -1.362* -.663 3.113*** 395(.668) (.503) (.925)
Self-beliefs - Self-efficacy .875* .626 -.188 395(.403) (.812) (1.099)
LASSI - Organization and planning -.682 -.248 2.815** 395(.607) (.839) (.953)
LASSI - Motivation .128 -.421 .843 395(.25) (.51) (.68)
GRIT-S -.262 -.38 2.118** 395(.314) (.677) (.855)
GRIT-S - Consistency -.48 -.463 1.021* 395(.357) (.408) (.547)
GRIT-S - Perseverance .217 .083 1.097 395(.313) (.438) (.677)
DSIS (self-control) .513 1.041 .792 395(.795) (.943) (1.152)
LABS (organization skills) -.139 -.829 -.024 395(.214) (.545) (.986)
CARAS - Index of reflexivity .031 .071* -.091** 394(.025) (.035) (.034)
School FE? YControls? N
Notes: (1) The table shows the differential effect of the program by low SES(column 3). (2) * significant at 10%; ** significant at 5%; *** significant at1%. (3) Standard errors are clustered at the school level.
53
DRAFTTable A.5: ITT effects on school performance by drop out (2014)
(1) (2) (3) (4)PFE Drop. x Drop. N
Language - final grade .057 -.231 -.026 345(.051) (.338) (.567)
Math - final grade -.098 -.624* .295 328(.142) (.319) (.488)
Language - passed .084** -.334** .566*** 408(.028) (.133) (.149)
Math - passed .063 -.423** .451 408(.035) (.139) (.292)
Absences - 2014 -2.204* 11.342*** -13.728** 408(1.095) (3.412) (5.632)
Failed -.048*** .222 -.187 408(.014) (.187) (.129)
Dropped out -.011 -.021* .015 408(.013) (.01) (.015)
Transferred -.008 .259 -.28 408(.017) (.152) (.158)
School FE? YControls? N
Notes: (1) The table shows the differential effect of the programby drop out (column 3). (2) * significant at 10%; ** significant at5%; *** significant at 1%. (3) Standard errors are clustered at theschool level.
54
DRAFTTable A.6: ITT effects on socio-emotional skills by drop out (2015)
(1) (2) (3) (4)PFE Drop. x Drop. N
Self-beliefs about academics .743 .176 4.29 366(.553) (1.287) (2.524)
Self-beliefs - Performance .718* .585 -.823 366(.383) (1.552) (2.258)
Self-beliefs - Self-efficacy .026 -.409 5.114*** 366(.526) (.589) (1.206)
LASSI - Organization and planning .031 -3.269 1.876 366(.379) (2.6) (4.049)
LASSI - Motivation .376* -.317 2.935*** 366(.188) (.679) (.895)
GRIT-S .493 -.836 3.391*** 366(.411) (2.358) (.665)
GRIT-S - Consistency .015 -1.133 .939 366(.306) (1.518) (.804)
GRIT-S - Perseverance .479* .297 2.452*** 366(.218) (.895) (.528)
DSIS (self-control) .862 -2.093 1.376 366(.632) (3.076) (5.292)
LABS (organization skills) -.476 -2.29 -2.15 366(.409) (1.985) (2.761)
CARAS - Index of reflexivity .031 .162 -.259 360(.042) (.181) (.278)
School FE? YControls? N
Notes: (1) The table shows the differential effect of the program by dropout (column 3). (2) * significant at 10%; ** significant at 5%; *** significantat 1%. (3) Standard errors are clustered at the school level.
55

DRAFTTable A.7: ITT effects on socio-emotional skills by low SES (2015)
(1) (2) (3) (4)PFE Poor x Poor N
Self-beliefs about academics .406 .223 1.642 366(.942) (1.221) (2.683)
Self-beliefs - Performance .296 .344 1.54 366(.594) (.536) (1.05)
Self-beliefs - Self-efficacy .11 -.121 .103 366(.644) (1.032) (1.994)
LASSI - Organization and planning -.803* -.428 3.301*** 366(.42) (.68) (.94)
LASSI - Motivation .319 .181 .546 366(.224) (.446) (.691)
GRIT-S -.108 -.59 2.291* 366(.387) (.638) (1.059)
GRIT-S - Consistency -.11 -.054 .61 366(.288) (.302) (.405)
GRIT-S - Perseverance .002 -.536 1.681** 366(.252) (.451) (.726)
DSIS (self-control) .119 -.534 2.777* 366(.66) (.989) (1.453)
LABS (organization skills) -.878* -.986 1.101 366(.427) (.63) (1.124)
CARAS - Index of reflexivity .015 .125 .074 360(.026) (.094) (.147)
School FE? YControls? N
Notes: (1) The table shows the differential effect of the program by low SES(column 3). (2) * significant at 10%; ** significant at 5%; *** significantat 1%. (3) Standard errors are clustered at the school level.
56
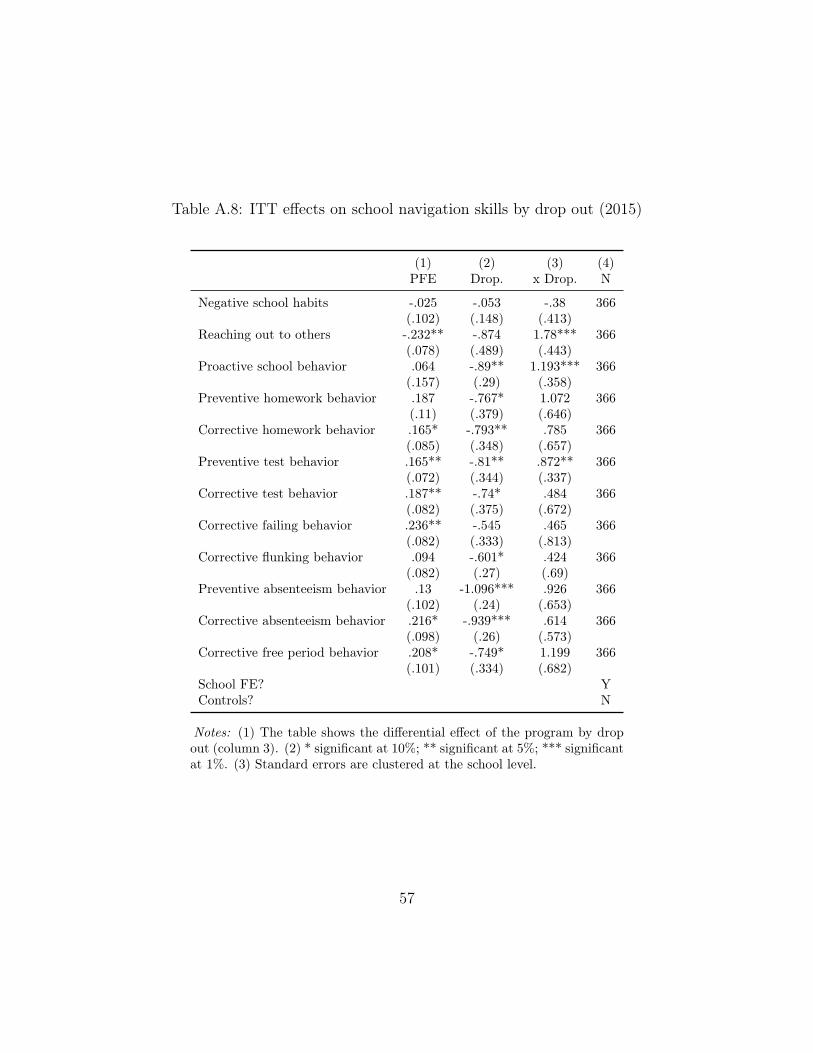
DRAFTTable A.8: ITT effects on school navigation skills by drop out (2015)
(1) (2) (3) (4)PFE Drop. x Drop. N
Negative school habits -.025 -.053 -.38 366(.102) (.148) (.413)
Reaching out to others -.232** -.874 1.78*** 366(.078) (.489) (.443)
Proactive school behavior .064 -.89** 1.193*** 366(.157) (.29) (.358)
Preventive homework behavior .187 -.767* 1.072 366(.11) (.379) (.646)
Corrective homework behavior .165* -.793** .785 366(.085) (.348) (.657)
Preventive test behavior .165** -.81** .872** 366(.072) (.344) (.337)
Corrective test behavior .187** -.74* .484 366(.082) (.375) (.672)
Corrective failing behavior .236** -.545 .465 366(.082) (.333) (.813)
Corrective flunking behavior .094 -.601* .424 366(.082) (.27) (.69)
Preventive absenteeism behavior .13 -1.096*** .926 366(.102) (.24) (.653)
Corrective absenteeism behavior .216* -.939*** .614 366(.098) (.26) (.573)
Corrective free period behavior .208* -.749* 1.199 366(.101) (.334) (.682)
School FE? YControls? N
Notes: (1) The table shows the differential effect of the program by dropout (column 3). (2) * significant at 10%; ** significant at 5%; *** significantat 1%. (3) Standard errors are clustered at the school level.
57
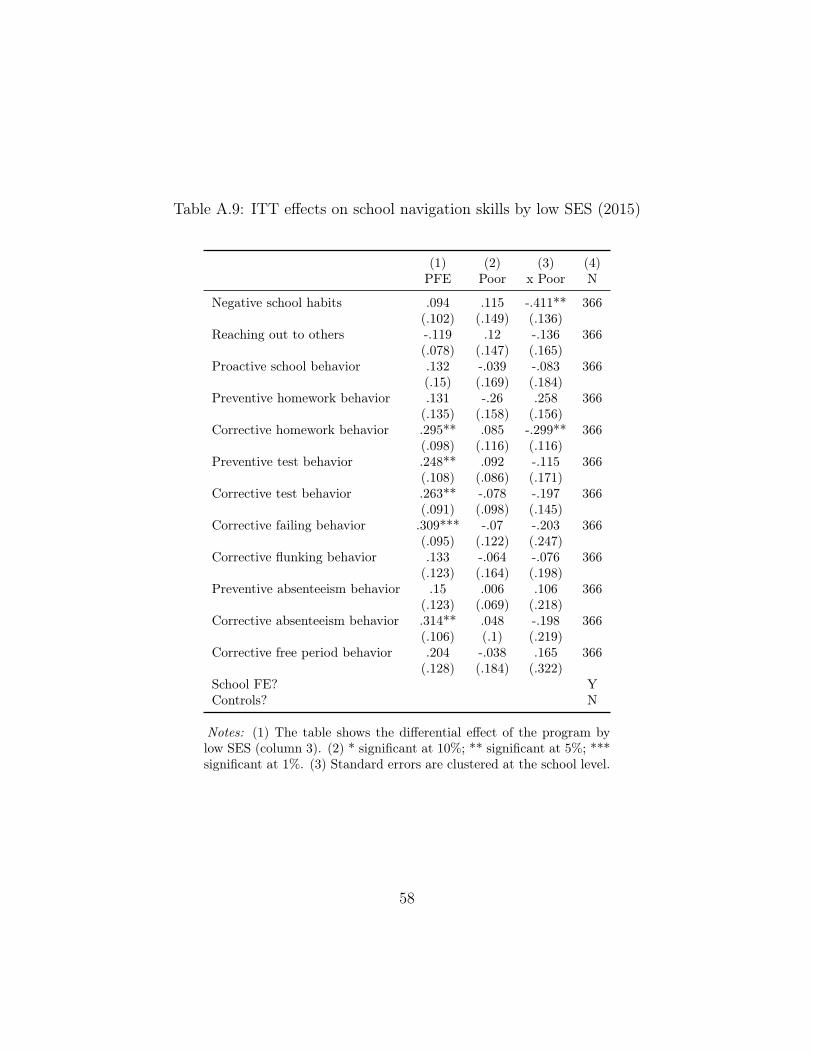
DRAFTTable A.9: ITT effects on school navigation skills by low SES (2015)
(1) (2) (3) (4)PFE Poor x Poor N
Negative school habits .094 .115 -.411** 366(.102) (.149) (.136)
Reaching out to others -.119 .12 -.136 366(.078) (.147) (.165)
Proactive school behavior .132 -.039 -.083 366(.15) (.169) (.184)
Preventive homework behavior .131 -.26 .258 366(.135) (.158) (.156)
Corrective homework behavior .295** .085 -.299** 366(.098) (.116) (.116)
Preventive test behavior .248** .092 -.115 366(.108) (.086) (.171)
Corrective test behavior .263** -.078 -.197 366(.091) (.098) (.145)
Corrective failing behavior .309*** -.07 -.203 366(.095) (.122) (.247)
Corrective flunking behavior .133 -.064 -.076 366(.123) (.164) (.198)
Preventive absenteeism behavior .15 .006 .106 366(.123) (.069) (.218)
Corrective absenteeism behavior .314** .048 -.198 366(.106) (.1) (.219)
Corrective free period behavior .204 -.038 .165 366(.128) (.184) (.322)
School FE? YControls? N
Notes: (1) The table shows the differential effect of the program bylow SES (column 3). (2) * significant at 10%; ** significant at 5%; ***significant at 1%. (3) Standard errors are clustered at the school level.
58
DRAFTAppendix B
B.1 Self-Beliefs about Academics
The survey of self-beliefs about academics asks students to report the extent to which
they agree with 14 statements about themselves using a scale that ranges from 1
(“totally disagree”) to 5 (“totally agree”). A confirmatory factor analysis indicates
that it measures two distinct types of self-beliefs: those about performance (e.g., “I
think I will get good grades this year”) and about self-efficacy (e.g., “I am capable of
doing school assignments well, even if they are difficult”). The survey was developed
by a team of Argentine psychologists at the University of Buenos Aires (UBA), and
it had already administered to secondary school students in the PBA (Schmidt et al.
2008). Additionally, FC had also administered it to a panel of PFE participants on
a previous study (Pais et al. 2013).
B.2 Learning and Study Strategies Inventory
The Learning and Study Strategies Inventory (LASSI) asks students to report the
extent to which how frequently they find themselves in 10 different situations, from
1 (“Never”) to 5 (“Always”). According to a factor analysis, seven of these situations
measure students’ organization and planning skills (e.g., “I have trouble putting
together a study plan and sticking to it”) and three measure their motivation (e.g.,
“I try hard to get good grades, even in subjects that I do not like”). This inventory
was developed by psychologists at the University of Texas at Austin (Weinstein and
Palmer 1988) and it was later adjusted for and administered to Argentine teenagers
59
DRAFTand adults by psychologists at the UBA (Fernandez Liporace and Casullo 2009). It
had also been administered to PFE participants (Pais et al. 2013).
B.3 Short Grit Scale
The Short Grit Scale (GRIT-S) consists of eight questions that ask students how
frequently they find themselves in a given situation, from 1 (“Almost never”) to 5
(“At least once a day”). According to prior factor analyses, four items in this survey
measure students’ consistency (e.g., “I forget some of the things I need for school”)
and three measure students’ perseverance (e.g., “I interrupt others while they are
speaking”). It was developed by psychologist Angela Duckworth at the University of
Pennsylvania (UPenn) (Duckworth and Quinn 2009). To our knowledge, this is the
first time that this survey has been administered in Argentina.
B.4 Domain-Specific Impulsivity Scale for Children
The Domain-Specific Impulsivity Scale for Children (DSISC) describes eight traits
or situations to students (e.g., “I am very diligent” or “I have been obsessed with an
idea or project for a short period of time, but I later lost interest”) and asks them
to indicate whether these descriptions match them, from 1 (“Not at all like me”) to
5 (“Very much like me”). It was developed by a team of psychologists at UPenn
(Tsukayama et al. 2013) and it has previously been administered in Argentina (Pais
2015).
60
DRAFTB.5 LABS
The LABS assessment asks students to make their way out of 10 increasingly difficult
labyrinths without lifting their pencil. Each student’s score is determined based on
the number of mistakes he or she made (i.e., “dead ends” in the labyrinth that they
encountered while trying to solve it) as well as the number of labyrinths he or she
solved. This assessment was developed by psychologist David Wechsler (Wechsler
1994), and it has previously been administered in Argentina (Arán-Filipetti 2012;
Arán-Filipetti and López 2013; Arán-Filipetti and Richaud de Minzi 2011; Cayssials
2003; Martos Mula et al. 2013; Soprano 2003).
B.6 CARAS
The CARAS assessment shows students many sets of three smileys and asks them to
cross out the smiley that is not like the others. For each student, the metric of interest
is the “reflexivity index”: the number of net correct answers (correct minus incorrect
answers) over the number of incorrect answers. This assessment was developed by
an American and a Spanish psychologists (Thurstone and Yela 2001) and it has
previously been administered in Argentina (Arán-Filipetti 2012; Arán-Filipetti and
López 2013; Arán-Filipetti and Richaud de Minzi 2011).
61
DRAFTAppendix C
C.1 Reading test
The reading test assessed students’ capacity to extract information from, interpret,
and reflect on texts. It asked students to: locate information in the text, understand
the relationship between two parts of a text, identify the main idea of a text, or
interpret the meaning of words from context. It featured different types of texts: a
historical passage, a descriptive passage, a poem, two movie reviews, and an excerpt
from a fiction book. It included 30 multiple choice questions: nine questions of low
difficulty, 12 questions of medium difficulty, and nine questions of high difficulty. The
specifications table is available from the authors upon request.
C.2 Math test
The math test assessed students’ capacity to identify mathematical concepts, under-
stand and utilize symbolic math, perform calculations using various strategies, and
solve mathematical and applied problems. It featured a different topics, including:
number properties, equations, probability, measurement, trigonometry, and statis-
tics. It included 30 multiple choice questions: eight questions of low difficulty, 12
questions of medium difficulty, and 10 questions of high difficulty. The specifications
table is available from the authors upon request.
62
DRAFTAppendix D
D.1 Negative school habits
This index indicates how frequently students have: (a) incorrectly noted the date of
an exam; (b) incorrectly noted the duedate of a homework assignment; (c) forgot to
do their homework; (d) forgot to study for an exam; (e) forgot a folder for a subject;
(f) been told off for speaking during class; (g) fought with a peer at school; (h) been
mocked by a peer; (i) been hit by a peer; (j) misunderstood something taught in
class; (k) failed a test; (l) failed a term; (m) failed a subject. The score for each item
ranges from 1 (“Never”) to 5 (“Everyday”). The score for the index ranges from 13
to 65.
D.2 Reaching out to others
This index indicates whether students have reached out to others about any of the
problems in the “Negative school habits” index. The options include: (a) the prin-
cipal; (b) teachers; (c) the preceptor (disciplinarian); (d) peers; (e) psicopedagogo
(school counselor); (f) secretaries; (g) alumni. The score for each item ranges from
0 (if a student did not reach out to anyone about a problem) to 7 (if the student
reached out to everyone in this list about the problem). The score for the index
ranges from 0 to 91.
63
DRAFTD.3 Proactive school behavior
This index indicates whether students did any of the following when they did not
understand something in class: (a) asked their teacher to explain a topic again; (b)
asked someone in their family to explain it; (c) asked help from a peer; (d) consulted
a book/Internet on the topic; (e) sought a private tutor; or (f) sought after-school
support. The score for each item is a dummy that equals 0 if the student did not do
something and 1 if he/she did. The score for the index ranges from 0 to 6.
D.4 Preventive homework behavior
This index measures how frequently students have taken certain steps before turning
in their homework, including: (a) starting to do it more than one day before it was
due; (b) getting together with a classmate to do it; (c) asking the teacher clarifying
questions about it; (d) asking the teacher about the resources that could be used to
do it (e.g., textbooks, calculators); (e) checking with the teacher if answers were “on
the right track” before turning it in; (f) checking with the teacher if a given answer
was correct; or (g) checking answers with a classmate. The score for each item is a
dummy that equals 0 if the student did not do something and 1 if he/she did. The
score for the index ranges from 0 to 7.
D.5 Corrective homework behavior
This index measures how frequently students have taken certain steps after receiving
their graded homework, including: (a) asking the teacher why some answers were
64
DRAFTincorrect; (b) asking the teacher to explain a topic again; (c) asking the teacher to
give more credit for correct answers; (d) asking a relative to explain a related topic;
(e) checking answers with a classmate; (f) attending a session with an academic
tutor; or (g) attending after-school lessons. The score for each item is a dummy that
equals 0 if the student did not do something and 1 if he/she did. The score for the
index ranges from 0 to 7.
D.6 Preventive test behavior
This index measures how frequently students have taken certain steps before taking
a test, including: (a) starting to study more than one day in advance; (b) getting to-
gether with a classmate to study; (c) asking a relative for help studying; (d) checking
the folder to see which topics will be included in the test; (e) checking a textbook
to see which topics will be included in the test; (f) asking the teacher about difficult
topics; (g) attending a session with an academic tutor; or (h) attending after-school
lessons. The score for each item is a dummy that equals 0 if the student did not do
something and 1 if he/she did. The score for the index ranges from 0 to 8.
D.7 Corrective test behavior
This index measures how frequently students have taken certain steps after receiving
their graded test, including: (a) asking the teacher why some answers were incorrect;
(b) asking the teacher to explain a topic again; (c) asking the teacher to give more
credit for correct answers; (d) asking the teacher for opportunities to make up a low
grade; (e) asking a relative to explain a related topic; (f) asking a classmate for help
65
DRAFT(e.g., looking at their folder); (g) attending a session with an academic tutor; or (h)
attending after-school lessons. The score for each item is a dummy that equals 0 if
the student did not do something and 1 if he/she did. The score for the index ranges
from 0 to 8.
D.8 Corrective failing behavior
This index measures how frequently students have taken certain steps after failing a
subject on a given term, including: (a) asking the teacher to explain a topic again;
(b) asking the teacher to consider granting a pass based on performance on specific
lessons or projects; (c) asking the teacher for opportunities to make up the low
grade; (d) asking a relative to explain a related topic; (e) asking a classmate for help
(e.g., looking at their folder); (f) attending a session with an academic tutor; or (g)
attending after-school lessons. The score for each item is a dummy that equals 0 if
the student did not do something and 1 if he/she did. The score for the index ranges
from 0 to 8.
D.9 Corrective flunking behavior
This index measures how frequently students have taken certain steps after failing a
subject on a given year, including: (a) asking the teacher to explain a topic again;
(b) asking the teacher to consider granting a pass based on performance on specific
lessons or projects; (c) asking the teacher for opportunities to make up the low grade;
(d) asking a relative to explain a related topic; (e) asking the teacher which topics
will be covered in the December/March exam; (f) asking the teacher which types
66
DRAFTof questions will be included in the December/March exam; (g) asking the teacher
which teachers will be present in the December/March exam; (h) asking the teacher
for the date of the December/March exam; (i) attending a session with an academic
tutor; or (j) attending after-school lessons. The score for each item is a dummy that
equals 0 if the student did not do something and 1 if he/she did. The score for the
index ranges from 0 to 11.
D.10 Preventive absenteeism behavior
This index measures how frequently students have taken certain steps after missing
a schoolday but before returning to school, including: (a) asking a classmate what
was covered in class; (b) catching up on reading done in class; (c) asking a classmate
for the homework assigned in class; or (d) asking a classmate for his/her folder to
copy what was done in class. The score for each item is a dummy that equals 0 if
the student did not do something and 1 if he/she did. The score for the index ranges
from 0 to 4.
D.11 Corrective absenteeism behavior
This index measures how frequently students have taken certain steps after missing
a schoolday once they returned to school, including: (a) asking a classmate what was
covered in class; (b) asking the teacher what was covered in class; (c) catching up on
reading done in class; (d) asking a classmate for the homework assigned in class; or
(e) asking a classmate for his/her folder to copy what was done in class. The score
for each item is a dummy that equals 0 if the student did not do something and 1 if
67
DRAFThe/she did. The score for the index ranges from 0 to 5.
D.12 Corrective free period behavior
This index measures how frequently students have taken certain steps the last time
they had a free period in school, including: (a) doing homework; (b) studying for
a test; (c) read for a class; (d) talked to a friend (reverse-coded); or (e) went home
(reverse-coded). The score for each item is a dummy that equals 0 if the student did
not do something and 1 if he/she did. The score for the index ranges from 0 to 5.
68