Embed Size (px)
Citation preview

Chapter 14 Haryana
Livestock Population
The following table shows the changes in the total number of livestock in Haryana
during the two inter censual period.
Table 14.1: Total Livestock Population
18th Livestock Census 2007 ( in Millions)
19th Livestock Census 2012
( in Millions)
8.85 8.81
There is decrease in livestock population over 2007 to 2012 from 8.85 million to 8.81
million (excluding 0.18 million stray cattle) registering a negative growth of 0.44% in
the total number of animals of various species. In Census 2012, the total livestock
population has been distributed under various species as per diagram given below:
Graph 14.1: Distribution of Livestock Goat Pigs
Sheep 4.19% 1.44%
The diagram above shows that among the total livestock, Buffalo contributes highest
with 69% followed by Cattle 20.50%, Goat 4.19%, Sheep 4.11% and Pigs 1.44% besides
marginal contribution is attributed by other livestock species such as Camel, Mithun,
Yak, Mules, Donkeys, Horses and Ponies. The variation in the number of animals in
different species of Livestock in comparison to the previous census is shown in the
table 13.2:
2
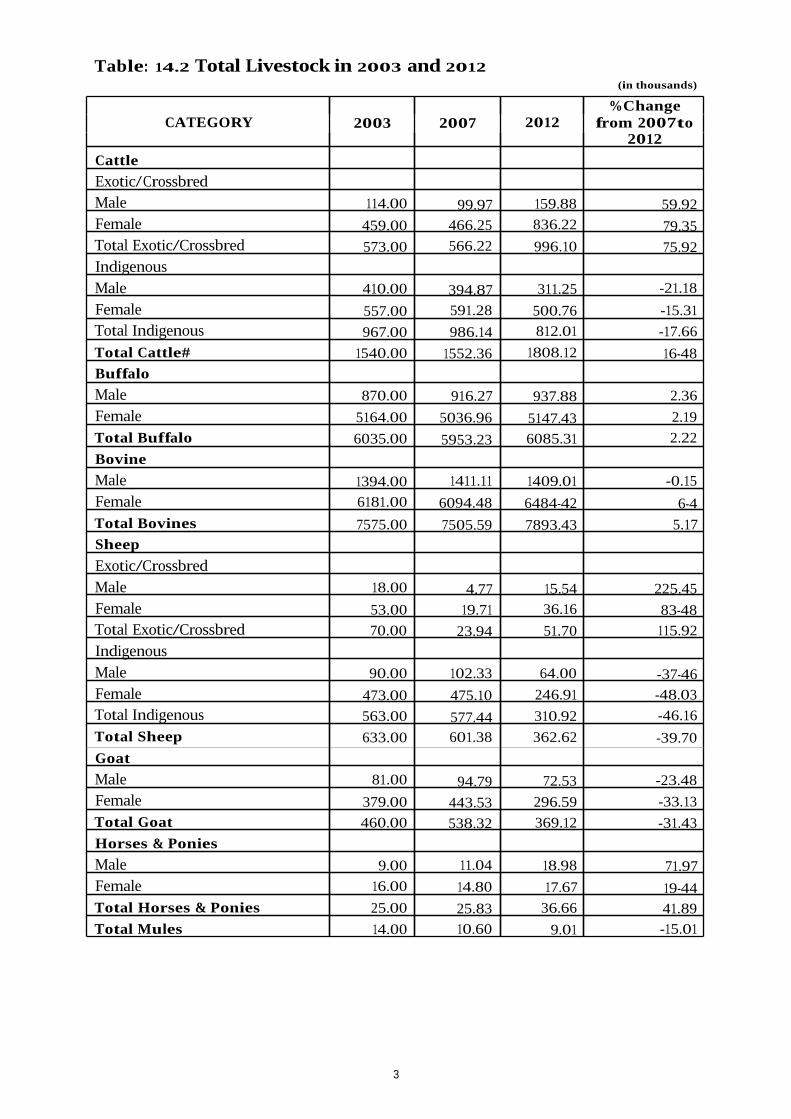
Table: 14.2 Total Livestock in 2003 and 2012 (in thousands)
CATEGORY 2003 2007 2012 %Change
from 2007to 2012
Cattle Exotic/Crossbred Male 114.00 99.97 159.88 59.92 Female 459.00 466.25 836.22 79.35 Total Exotic/Crossbred 573.00 566.22 996.10 75.92 Indigenous Male 410.00 394.87 311.25 -21.18 Female 557.00 591.28 500.76 -15.31 Total Indigenous 967.00 986.14 812.01 -17.66 Total Cattle# 1540.00 1552.36 1808.12 16-48 Buffalo Male 870.00 916.27 937.88 2.36 Female 5164.00 5036.96 5147.43 2.19 Total Buffalo 6035.00 5953.23 6085.31 2.22 Bovine Male 1394.00 1411.11 1409.01 -0.15 Female 6181.00 6094.48 6484-42 6-4 Total Bovines 7575.00 7505.59 7893.43 5.17 Sheep Exotic/Crossbred Male 18.00 4.77 15.54 225.45 Female 53.00 19.71 36.16 83-48 Total Exotic/Crossbred 70.00 23.94 51.70 115.92 Indigenous Male 90.00 102.33 64.00 -37-46 Female 473.00 475.10 246.91 -48.03 Total Indigenous 563.00 577.44 310.92 -46.16 Total Sheep 633.00 601.38 362.62 -39.70 Goat Male 81.00 94.79 72.53 -23.48 Female 379.00 443.53 296.59 -33.13 Total Goat 460.00 538.32 369.12 -31.43 Horses & Ponies Male 9.00 11.04 18.98 71.97 Female 16.00 14.80 17.67 19-44 Total Horses & Ponies 25.00 25.83 36.66 41.89 Total Mules 14.00 10.60 9.01 -15.01
3
(in thousands)
CATEGORY 2003 2007 2012 %Change
from 2007to 2012
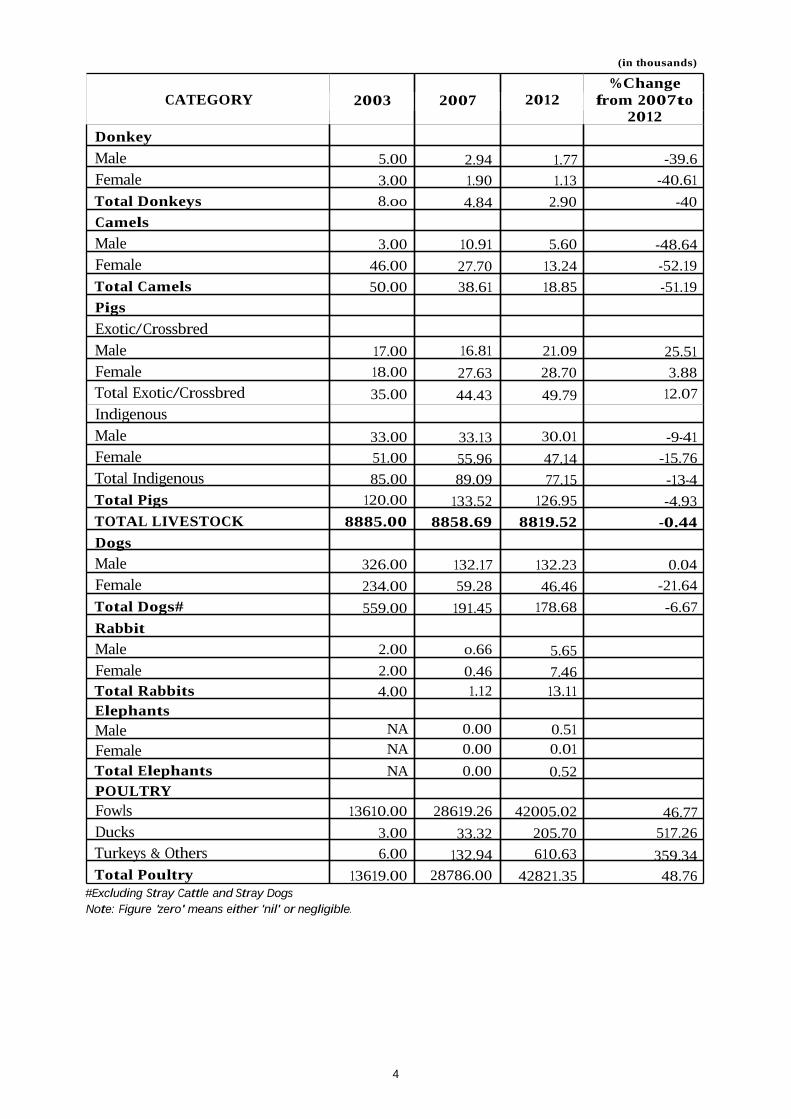
Donkey Male 5.00 2.94 1.77 -39.6 Female 3.00 1.90 1.13 -40.61 Total Donkeys 8.oo 4.84 2.90 -40 Camels Male 3.00 10.91 5.60 -48.64 Female 46.00 27.70 13.24 -52.19 Total Camels 50.00 38.61 18.85 -51.19 Pigs Exotic/Crossbred Male 17.00 16.81 21.09 25.51 Female 18.00 27.63 28.70 3.88 Total Exotic/Crossbred 35.00 44.43 49.79 12.07 Indigenous Male 33.00 33.13 30.01 -9-41 Female 51.00 55.96 47.14 -15.76 Total Indigenous 85.00 89.09 77.15 -13-4 Total Pigs 120.00 133.52 126.95 -4.93 TOTAL LIVESTOCK 8885.00 8858.69 8819.52 -0.44 Dogs Male 326.00 132.17 132.23 0.04 Female 234.00 59.28 46.46 -21.64 Total Dogs# 559.00 191.45 178.68 -6.67 Rabbit Male 2.00 o.66 5.65 Female 2.00 0.46 7.46 Total Rabbits 4.00 1.12 13.11 Elephants Male NA 0.00 0.51 Female NA 0.00 0.01 Total Elephants NA 0.00 0.52 POULTRY Fowls 13610.00 28619.26 42005.02 46.77 Ducks 3.00 33.32 205.70 517.26 Turkeys & Others 6.00 132.94 610.63 359.34 Total Poultry 13619.00 28786.00 42821.35 48.76
#Excluding Stray Cattle and Stray Dogs Note: Figure 'zero' means either 'nil' or negligible.
4
0
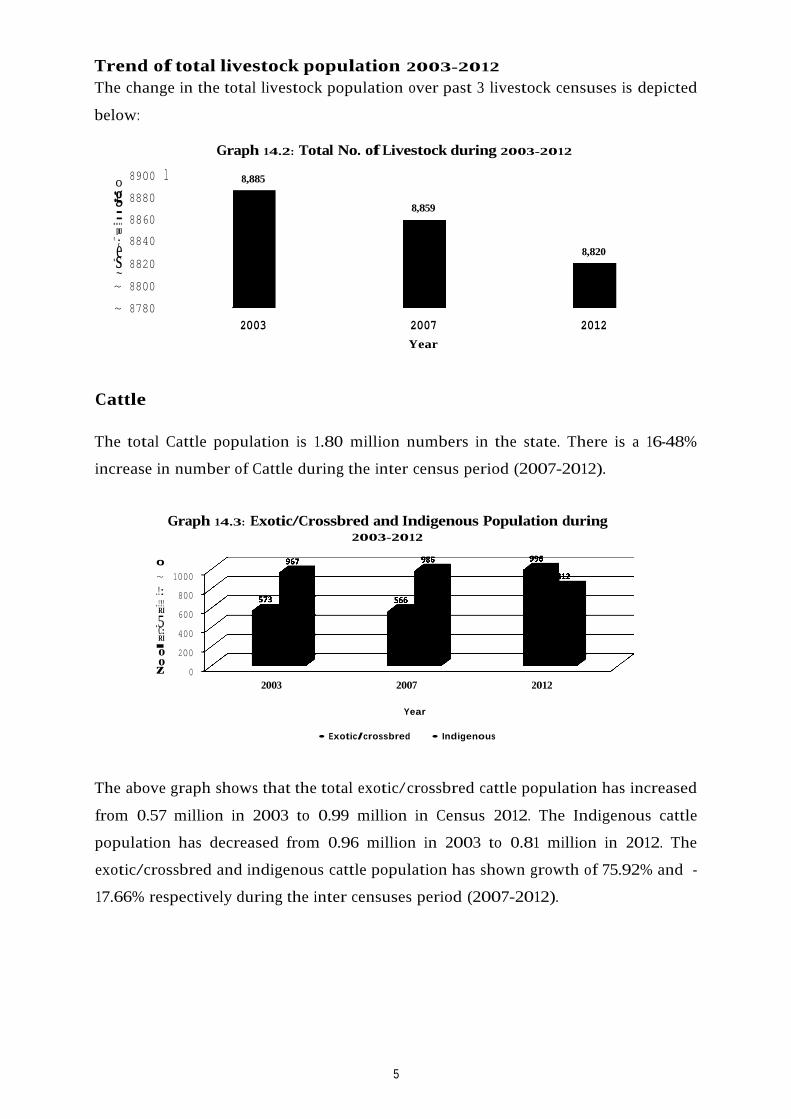
Trend of total livestock population 2003-2012 The change in the total livestock population over past 3 livestock censuses is depicted
below:
Graph 14.2: Total No. ofLivestock during 2003-2012
8900 l 8,885
:g 8880 8,859
..= .. 8860 "; [IJ
8840 8,820e·s 8820
~ ~ 8800
~ 8780 2003 2007 2012
Year
Cattle
The total Cattle population is 1.80 million numbers in the state. There is a 16-48%
increase in number of Cattle during the inter census period (2007-2012).
Graph 14.3: Exotic/Crossbred and Indigenous Population during 2003-2012
0
~ 1000 .!: 800 ..!!! RI 600 .5C: 400RI -0 200 0 z 0
2003 2007 2012
Year
• Exotic/crossbred • Indigenous
The above graph shows that the total exotic/crossbred cattle population has increased
from 0.57 million in 2003 to 0.99 million in Census 2012. The Indigenous cattle
population has decreased from 0.96 million in 2003 to 0.81 million in 2012. The
exotic/crossbred and indigenous cattle population has shown growth of 75.92% and -
17.66% respectively during the inter censuses period (2007-2012).
5
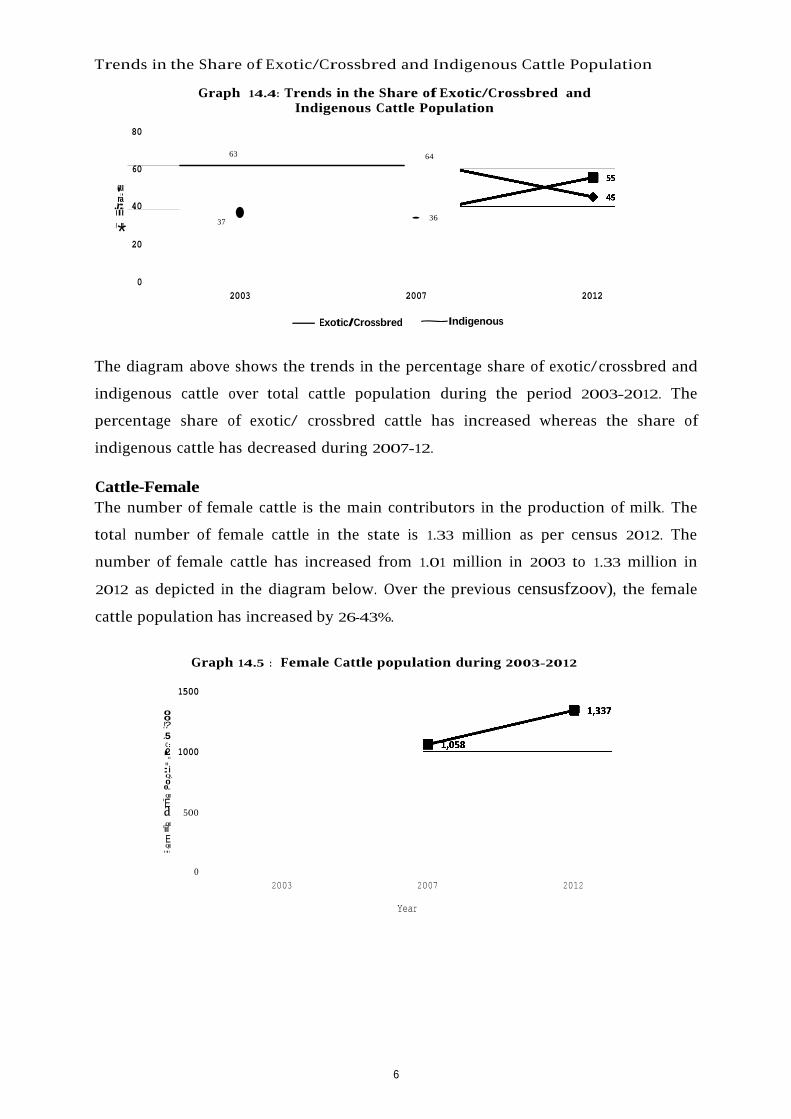
Trends in the Share of Exotic/Crossbred and Indigenous Cattle Population
Graph 14.4: Trends in the Share of Exotic/Crossbred and Indigenous Cattle Population
80
63 64 60
•.. ra .r:. 40 Ill • 3637 '*
cu
' • 20
0 2003 2007 2012
-Exotic/Crossbred ~Indigenous
The diagram above shows the trends in the percentage share of exotic/crossbred and
indigenous cattle over total cattle population during the period 2003-2012. The
percentage share of exotic/ crossbred cattle has increased whereas the share of
indigenous cattle has decreased during 2007-12.
Cattle-Female The number of female cattle is the main contributors in the production of milk. The
total number of female cattle in the state is 1.33 million as per census 2012. The
number of female cattle has increased from 1.01 million in 2003 to 1.33 million in
2012 as depicted in the diagram below. Over the previous censusfzoov), the female
cattle population has increased by 26-43%.
Graph 14.5 : Female Cattle population during 2003-2012
1500
0 0 !? .5 .2 1000•C.: . :"' i Q. 00..
'EQI
a 500 QI"iii E QI...
0 2003 2007 2012
Year
6

District-wise Cattle Population The Graph below shows that the District of Sirsa has the highest contribution in Cattle Population with 11.85%. The second and third highest contributors are Hisar and Karnal with share of cattle population of 8.94% and 8.29% respectively.
Graph 14.6: Percentage share of Cattle Population - 2012
14.00 l11.s5
12.00
- - 8.2910.00 II -
~ 8.00n:J -- -..c:"' 6.00'?le.
4.00
2.00
0.00
I r ~6:58 6.49 liiiiil .-. ~ 5.76 5.56
Buffalo The total Buffalo population in the State is 6.08 million numbers as per census 2012. There is an increase in number of Buffaloes with 2.22% during the inter censuses period (2007-2012).
Graph 14.7: Male and Female Buffaloes during 2003-2012 6000
5,164 5,1475,037 5000
0 0 0~= 4000
"ii"' iE 3000 ·c ro 0 2000 c:i C
1000
0
• Female • Male
2003 2007
Year 2012
As per the above diagram it is evident that the female buffalo population has decreased from 5.16 million in 2003 to 5.14 million in 2012. However, the female buffalo population has increased by 2.19% during the inter censuses period (2007-2012).
7
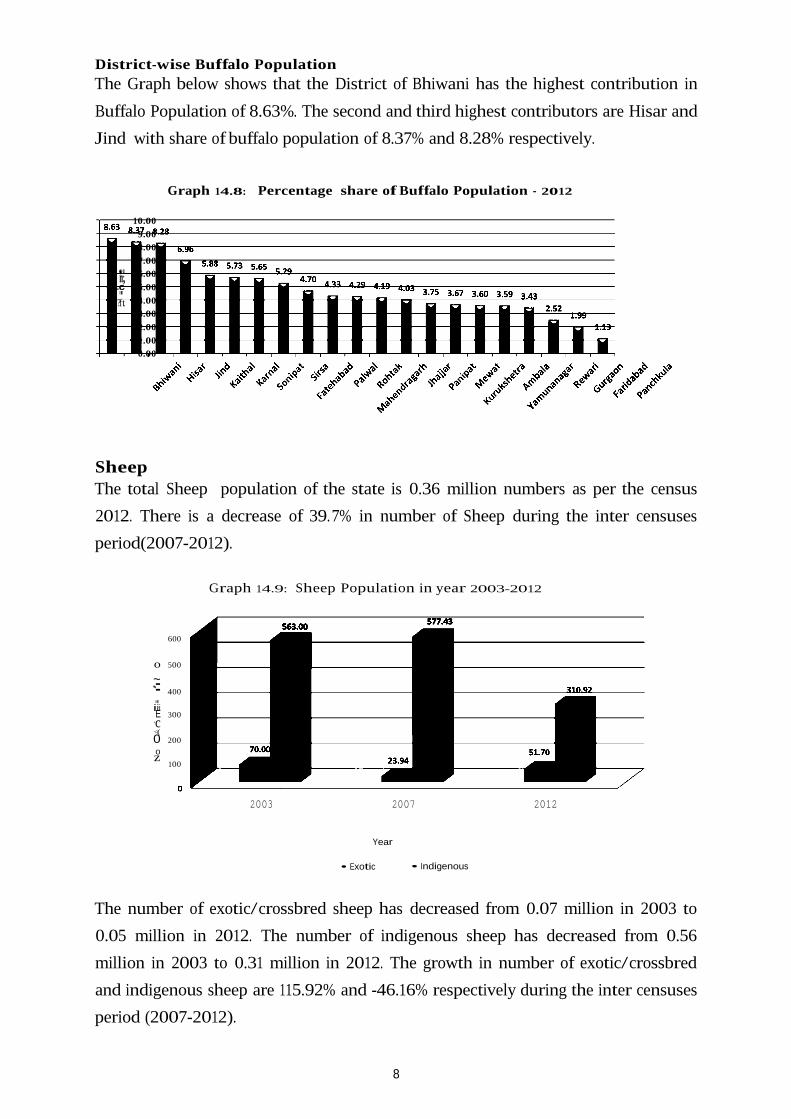
District-wise Buffalo Population The Graph below shows that the District of Bhiwani has the highest contribution in Buffalo Population of 8.63%. The second and third highest contributors are Hisar and Jind with share of buffalo population of 8.37% and 8.28% respectively.
Graph 14.8: Percentage share of Buffalo Population - 2012
10.00 9.00 8.00 7.00
QI•.n., ..c"'
6.00 5.00
?ft. 4.00 3.00 2.00 1.00 0.00
Sheep The total Sheep population of the state is 0.36 million numbers as per the census 2012. There is a decrease of 39.7% in number of Sheep during the inter censuses period(2007-2012).
Graph 14.9: Sheep Population in year 2003-2012
600
o 500
~ ~= 400
"' iiiE 300 ·c <(0 200 0 z
100
2003 2007 2012
Year
• Exotic • Indigenous
The number of exotic/crossbred sheep has decreased from 0.07 million in 2003 to 0.05 million in 2012. The number of indigenous sheep has decreased from 0.56 million in 2003 to 0.31 million in 2012. The growth in number of exotic/crossbred and indigenous sheep are 115.92% and -46.16% respectively during the inter censuses period (2007-2012).
8

District-wise Sheep Population The Graph below shows that the District of Bhiwani has the highest contribution in Sheep Population of 13.86%. The second and third highest contributors are Hisar and Sirsa with share of sheep population of 13.52% and 11.55% respectively.
Graph 14.10: Percentage share of Total Sheep Population - 2012
16.00 113.86 13.52
14.00 liiiiiil Iii.iii 1111.55 12.00
~ 10.00
l 8.00 Ill* 6.00
4.00
2.00
0.00
Goat The total number of Goat in the state as per Census 2012 is 0.36 million numbers. The number of Goat population has decreased by 31.43% during the inter censuses period (2007-2012).
Graph 14.11: Goat Population 2003-2012
500 444 0 379 ~ 400 .5
1
297 .!!! 300 "' E 'i: 200
"' 0 1000 C
o~-------2003 2007 2012
Year
II Female II Male
The diagram above shows that the total number of female Goat population has decreased from 0.37 million in 2003 to 0.29 million in 2012. The female goat population has decreased by 33.13% over the previous census. The male goat population has decreased from 0.081 million in 2003 to 0.073 million in 2012. The population of male goat has decreased by 23-48% during the inter censuses period (2007-2012).
9

District-wise Goat Population The Graph below shows that the District of Mahendragarh has the highest contribution in Goat Population of 14.82%. The second and third highest contributors are Bhiwani and Sirsa with share of goat population of 13. 79% and 11.30%
respectively.
Graph 14.12: Percentage share of Goat Population - 2012
16.00 13.79
12.00 l 1 Iii 11
· 103-' =- =- --- -- _ _ _- _ _- _ _ _14.00 Liii~-30 -=---- ----=----- ----=- -=----_--_- _--_- _--_--_--_-_____,
5r:: 11111 ::~ -=::.-----------
~11.1,1,1,1,1,1,i,i,i,i,i,~.1,i,i,i,i,i,i,:,
Horses & ponies The total number of Horses & Ponies in the state as per 2012 Census is 0.03 million numbers. There is 41.89% increase in number of horses & ponies during the inter censuses period (2007-2012).
Graph 14.13: Total Horses & Ponies during 2003-2012 40 ,--- 36.66
0O 35 0
25.83~= 30 25.00 .!!! 25 "E' 20 ·~ 15 0 10 g 5
o~-----2003 2007 2012
Vear
• Horses & ponies
District-wise Horses & Ponies Population The graph below shows that the District Arnbala has the highest contribution m horses & ponies population of 31.48%. The second and third highest contributors are Karnal and Kaithal with share of horses & ponies of 8.08% and 6.66% respectively.
10

Graph 14.14: Percentage Share of Horses & Ponies Population - 2012
35.00 131.48 30.00 +·-11-------------------------------------
25.00 +-1----------------------------------------CIJ
1 20.00 I I "' 15.00 +·-1----------------------------------------'#.
10.00
5.00
0.00
I - -·-- r,,
Mules, donkeys The total number of mules & donkeys in the country as per 2012 census 1s 0.01 million numbers. The number of total mules & donkeys population has decreased by 22.86% during the inter census period (2007-2012).
Graph 14.15: Mules and Donkeys during 2003-2012
16 14 g 14
11~0= 12 9 .l!? 10
111E 8 -~ 6
0 4 g 2
0 2003 2007 2012
Year
• mules • Donkeys
As per the diagram above the total mules population has decreased from 0.014 million in 2003 to 0.009 million numbers in 2012. The donkey population has also decreased from 0.008 million in 2003 to 0.003 million numbers in 2012. The growth in number of mules and donkeys are -15.01% and -40.00% respectively during the inter censuses period (2007-2012).
District-wise Mules Population The graph below shows that the Bhiwani has the highest contribution in mule population of 11.61%. The second and third highest contributors are Jhajjar and Rewari with share of mules population 10.18% and 9.31% respectively.
11

Graph 14.16: Percentage share of Mules Population -2012
•••00 .,_.,
12.00 10 18
10.00 1 Iii ~ · 811 I I 9 31 I~ 8.00 7.34 7.24 6.07 5.51 6.00 Iii Iii .::::. 4.72 4.
~ 0
::: 11. 1. 1. 1. 1. 1. 1. 1. 1. 1.·1. i.i .i.i.'i.'1'.i'.'i. ;,;:
Camels The total number of camels in the state as per 2012 census is 0.018 million numbers. The changes in the camel population over the previous 3 census are depicted in the graph below.
Graph 14.17: Camels during 2003-2012
60.00 50.00
~ 50.00 38.61 .!: 40 00 "' .iij
E 30.00 'i: 18.85 111 20.00 0
10.000 C
0.00 "'-------'
2003 2007 2012 Year •Camels
The total camel population has decreased from 0.050 million in 2003 to 0.018 million in 2012. There is decrease of 51.19% in number of camels during the inter census period (2007-2012).
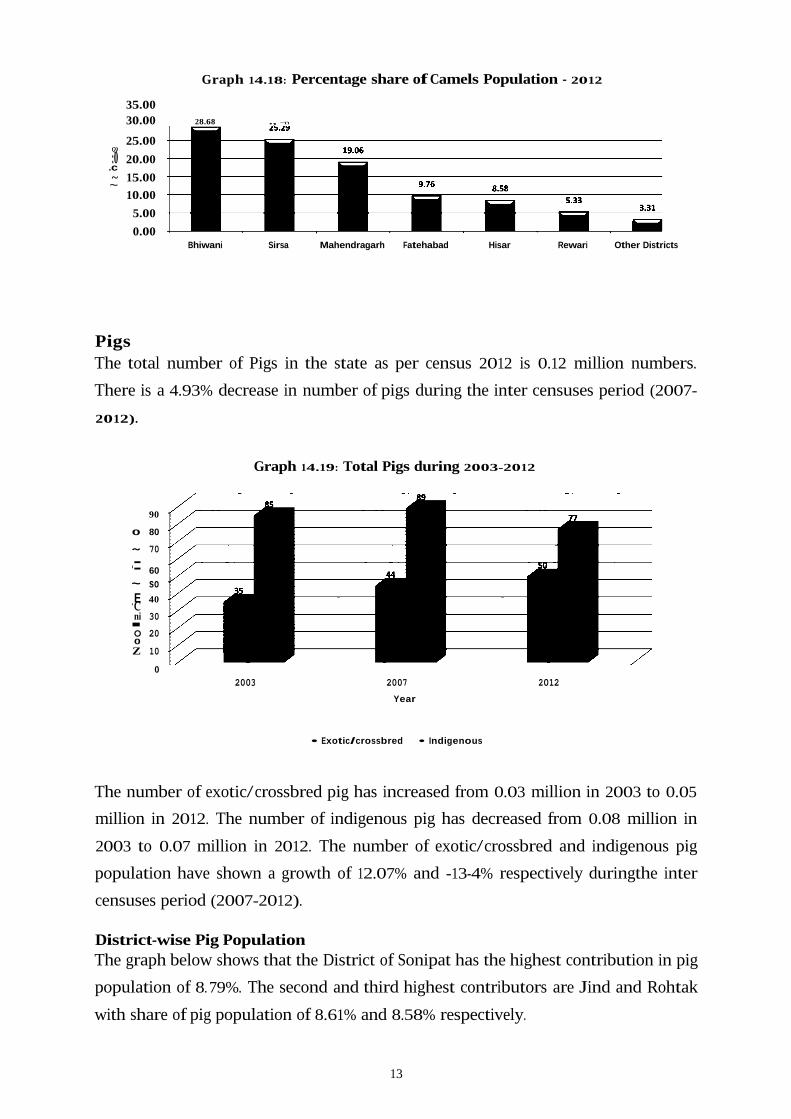
District-wise Camels Population The graph below shows that District of Bhiwani has the highest contribution in camel population of 28.68%. The second and third highest contributors are Sirsa and Mahendragarh with share of camels population 25.29% and 19.06% respectively.
12
30.00 28.68 ., ~n
25.00 Q)
:0 20.00 ..c ~ 15.00 ~
10.00 5.00 0.00
Graph 14.18: Percentage share ofCamels Population - 2012
35.00
Bhiwani Sirsa Mahendragarh Fatehabad Hisar Rewari Other Districts
Pigs The total number of Pigs in the state as per census 2012 is 0.12 million numbers. There is a 4.93% decrease in number of pigs during the inter censuses period (2007-2012).
Graph 14.19: Total Pigs during 2003-2012
90
0 80
~ 70
·= 60 ~ so E 40·c ni 30 -O 20 0 Z 10
0 2003 2007 2012
Year
• Exotic/crossbred • Indigenous
The number of exotic/crossbred pig has increased from 0.03 million in 2003 to 0.05 million in 2012. The number of indigenous pig has decreased from 0.08 million in 2003 to 0.07 million in 2012. The number of exotic/crossbred and indigenous pig population have shown a growth of 12.07% and -13-4% respectively duringthe inter censuses period (2007-2012).
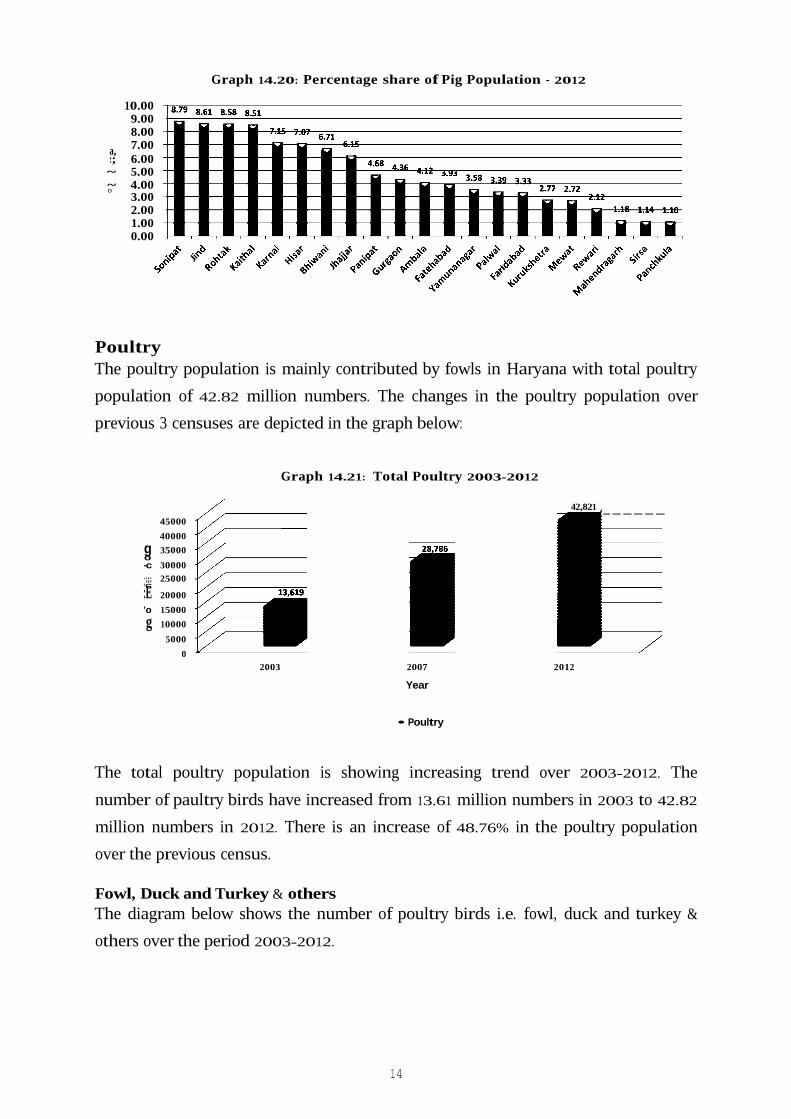
District-wise Pig Population The graph below shows that the District of Sonipat has the highest contribution in pig population of 8. 79%. The second and third highest contributors are Jind and Rohtak with share of pig population of 8.61% and 8.58% respectively.
13
Graph 14.20: Percentage share of Pig Population - 2012
10.00 9.00 8.00 7.00a,
:; 6.00 ~ 5.00 ~ 4.000
3.00 2.00 1.00 0.00
Poultry The poultry population is mainly contributed by fowls in Haryana with total poultry population of 42.82 million numbers. The changes in the poultry population over previous 3 censuses are depicted in the graph below:
Graph 14.21: Total Poultry 2003-2012
42,821 45000 40000
g 35000 0 -c 30000 ·;;; 25000 "C:E 20000 'o 15000 g 10000
5000 0
2003 2007 2012
Year
• Poultry
The total poultry population is showing increasing trend over 2003-2012. The number of paultry birds have increased from 13.61 million numbers in 2003 to 42.82 million numbers in 2012. There is an increase of 48.76% in the poultry population over the previous census.
Fowl, Duck and Turkey & others The diagram below shows the number of poultry birds i.e. fowl, duck and turkey &
others over the period 2003-2012.
f------
14
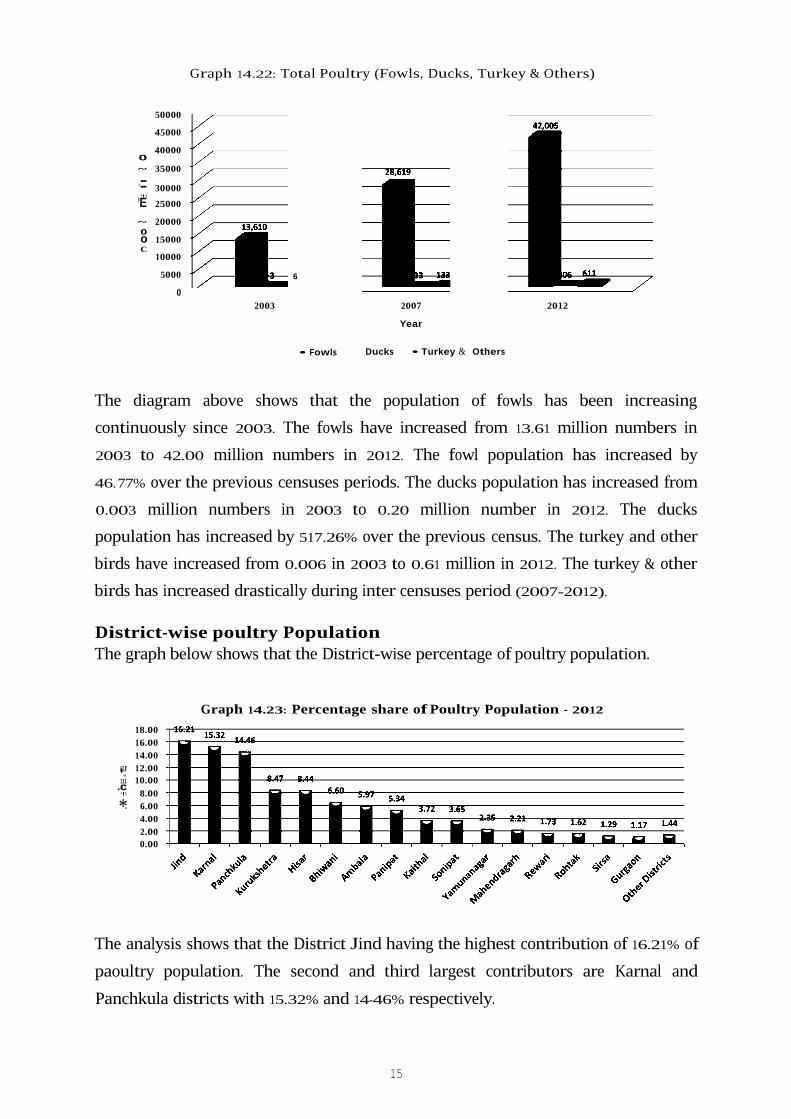
Graph 14.22: Total Poultry (Fowls, Ducks, Turkey & Others)
50000
45000
40000 0 ~ 35000
·= 30000.,,°E 25000
~ 20000 0 o 15000 C
10000
5000 6
0 2003 2007
Year
• Fowls Ducks • Turkey & Others
The diagram above shows that the population of fowls has been increasing continuously since 2003. The fowls have increased from 13.61 million numbers in 2003 to 42.00 million numbers in 2012. The fowl population has increased by 46.77% over the previous censuses periods. The ducks population has increased from 0.003 million numbers in 2003 to 0.20 million number in 2012. The ducks population has increased by 517.26% over the previous census. The turkey and other birds have increased from 0.006 in 2003 to 0.61 million in 2012. The turkey & other birds has increased drastically during inter censuses period (2007-2012).
District-wise poultry Population The graph below shows that the District-wise percentage of poultry population.
Graph 14.23: Percentage share of Poultry Population - 2012
2012
18.00 16.00 14.00
CIJ 12.00•.. 111 10.00 ..c
8.00.,,*- 6.00
4.00 2.00 0.00
The analysis shows that the District Jind having the highest contribution of 16.21% of paoultry population. The second and third largest contributors are Karnal and Panchkula districts with 15.32% and 14-46% respectively.
15
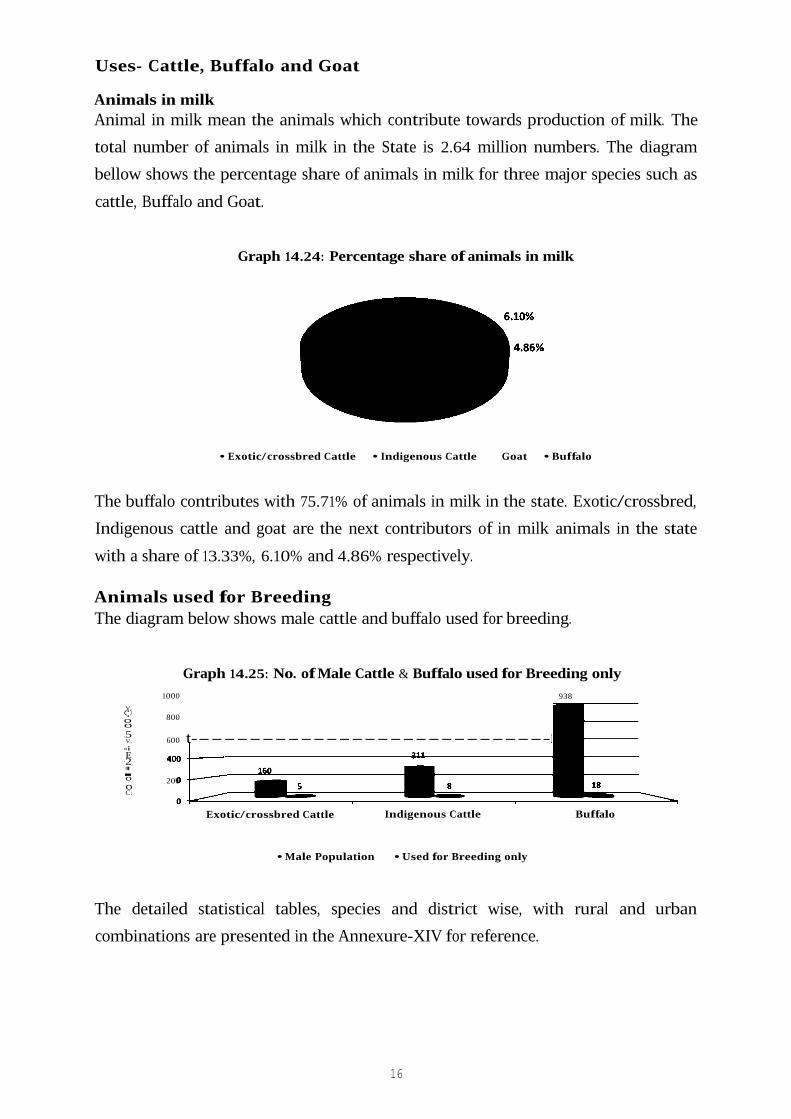
Uses- Cattle, Buffalo and Goat
Animals in milk Animal in milk mean the animals which contribute towards production of milk. The total number of animals in milk in the State is 2.64 million numbers. The diagram bellow shows the percentage share of animals in milk for three major species such as cattle, Buffalo and Goat.
Graph 14.24: Percentage share of animals in milk
• Exotic/crossbred Cattle • Indigenous Cattle Goat • Buffalo
The buffalo contributes with 75.71% of animals in milk in the state. Exotic/crossbred, Indigenous cattle and goat are the next contributors of in milk animals in the state with a share of 13.33%, 6.10% and 4.86% respectively.
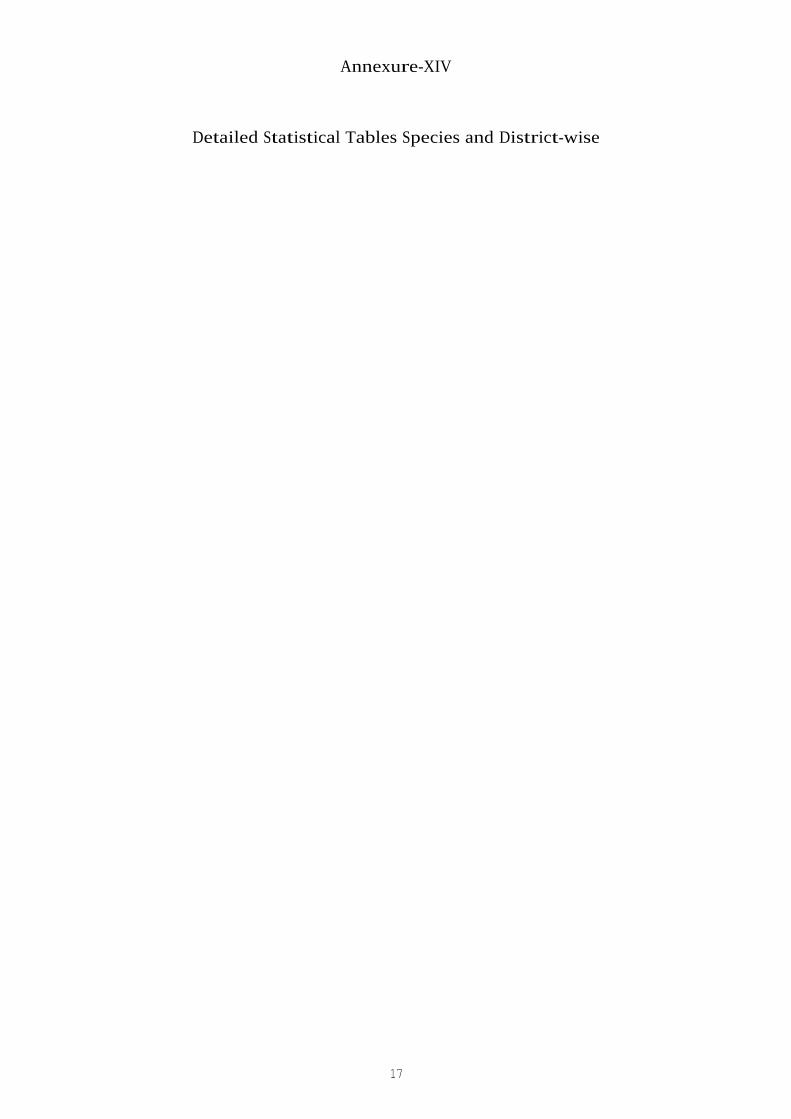
Animals used for Breeding The diagram below shows male cattle and buffalo used for breeding.
Graph 14.25: No. ofMale Cattle & Buffalo used for Breeding only
V,<:> 0 0
.5 V, «i E ·2 "'-0 0 C:
1000
800
600 t-----------------------------1
200
938
Exotic/crossbred Cattle Indigenous Cattle Buffalo
• Male Population • Used for Breeding only
The detailed statistical tables, species and district wise, with rural and urban combinations are presented in the Annexure-XIV for reference.
16
Annexure-XIV
Detailed Statistical Tables Species and District-wise
17
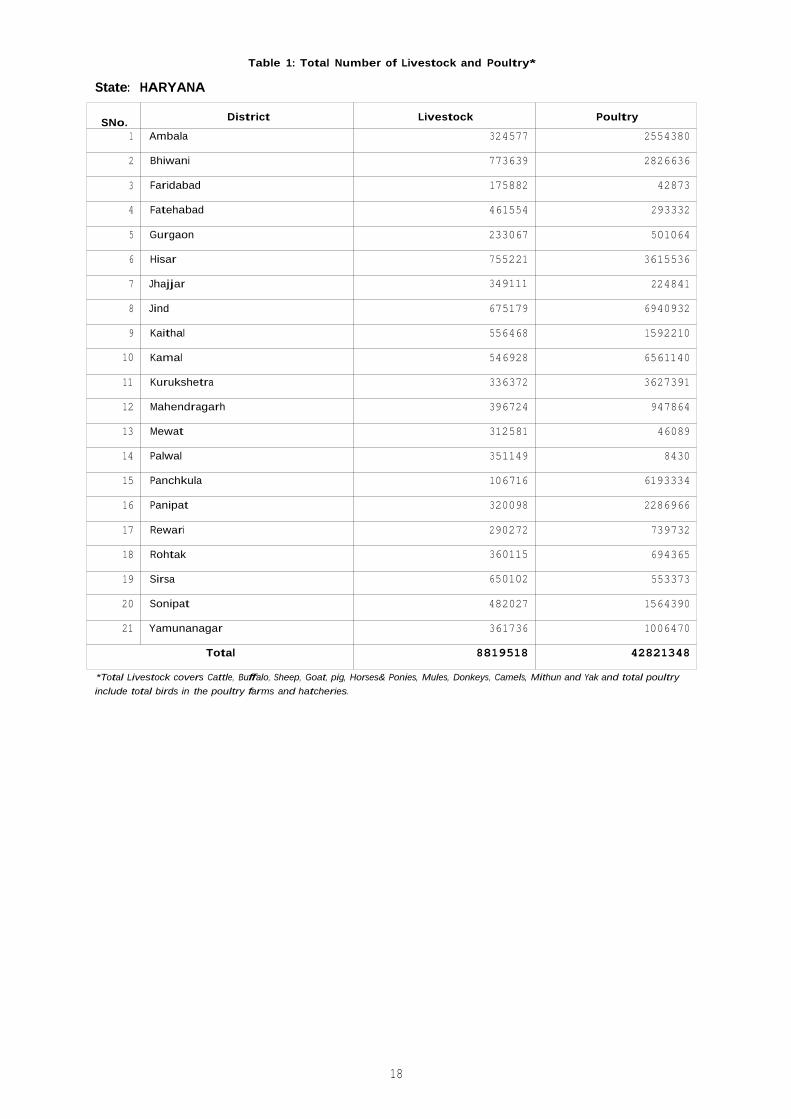
Table 1: Total Number of Livestock and Poultry*
State: HARYANA
SNo. District Livestock Poultry
1 Ambala 324577 2554380
2 Bhiwani 773639 2826636
3 Faridabad 175882 42873
4 Fatehabad 461554 293332
5 Gurgaon 233067 501064
6 Hisar 755221 3615536
7 Jhajjar 349111 224841
8 Jind 675179 6940932
9 Kaithal 556468 1592210
10 Kamal 546928 6561140
11 Kurukshetra 336372 3627391
12 Mahendragarh 396724 947864
13 Mewat 312581 46089
14 Palwal 351149 8430
15 Panchkula 106716 6193334
16 Panipat 320098 2286966
17 Rewari 290272 739732
18 Rohtak 360115 694365
19 Sirsa 650102 553373
20 Sonipat 482027 1564390
21 Yamunanagar 361736 1006470
Total 8819518 42821348
*Total Livestock covers Cattle, Buffalo, Sheep, Goat, pig, Horses& Ponies, Mules, Donkeys, Camels, Mithun and Yak and total poultry include total birds in the poultry farms and hatcheries.
18

Table 2: Details of Bovines by Sex
State: HARYANA
SNo. District Male Female Total
(1) (2) (3) (4)
1 Ambala 45183 241904 287087
2 Bhiwani 105369 549835 655204
3 Faridabad 23652 132979 156631
4 Fatehabad 72497 350076 422573
5 Gurgaon 32252 179425 211677
6 Hisar 147982 523233 671215
7 Jhajjar 49196 260012 309208
8 Jind 146407 476534 622941
9 Kaithal 98796 418244 517040
10 Karnal 87867 419729 507596
11 Kurukshetra 48666 267798 316464
12 Mahendragarh 37399 273873 311272
13 Mewat 39165 223041 262206
14 Palwal 50579 274472 325051
15 Panchkula 16532 76486 93018
16 Panipat 63206 236951 300157
17 Rewari 35378 217800 253178
18 Rohtak 71098 253835 324933
19 Sirsa 93661 464163 557824
20 Sonipat 89716 362891 452607
21 Yamunanagar 54410 281136 335546
Total 1409011 6484417 7893428
19
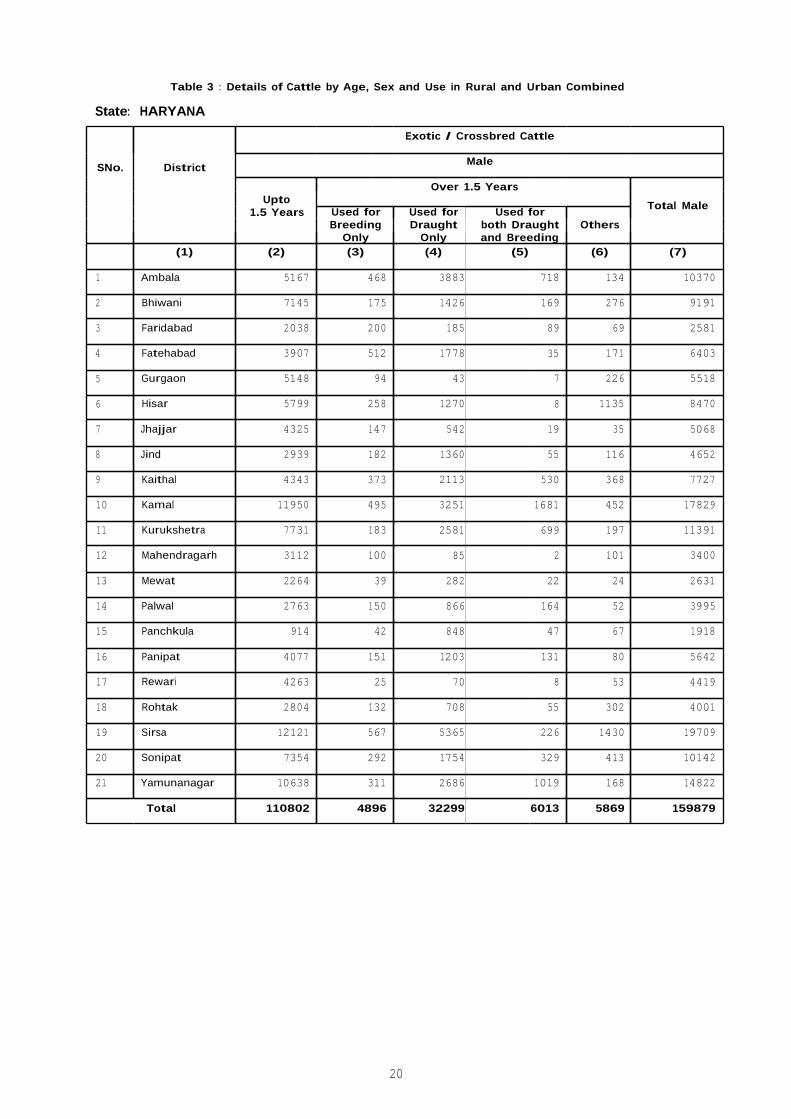
Table 3 : Details of Cattle by Age, Sex and Use in Rural and Urban Combined
State: HARYANA
SNo. District
Exotic / Crossbred Cattle
Male
Upto 1.5 Years
Over 1.5 Years Total MaleUsed for
Breeding Only
Used for Draught Only
Used for both Draught and Breeding
Others
(1) (2) (3) (4) (5) (6) (7)
1 Ambala 5167 468 3883 718 134 10370
2 Bhiwani 7145 175 1426 169 276 9191
3 Faridabad 2038 200 185 89 69 2581
4 Fatehabad 3907 512 1778 35 171 6403
5 Gurgaon 5148 94 43 7 226 5518
6 Hisar 5799 258 1270 8 1135 8470
7 Jhajjar 4325 147 542 19 35 5068
8 Jind 2939 182 1360 55 116 4652
9 Kaithal 4343 373 2113 530 368 7727
10 Kamal 11950 495 3251 1681 452 17829
11 Kurukshetra 7731 183 2581 699 197 11391
12 Mahendragarh 3112 100 85 2 101 3400
13 Mewat 2264 39 282 22 24 2631
14 Palwal 2763 150 866 164 52 3995
15 Panchkula 914 42 848 47 67 1918
16 Panipat 4077 151 1203 131 80 5642
17 Rewari 4263 25 70 8 53 4419
18 Rohtak 2804 132 708 55 302 4001
19 Sirsa 12121 567 5365 226 1430 19709
20 Sonipat 7354 292 1754 329 413 10142
21 Yamunanagar 10638 311 2686 1019 168 14822
Total 110802 4896 32299 6013 5869 159879
20
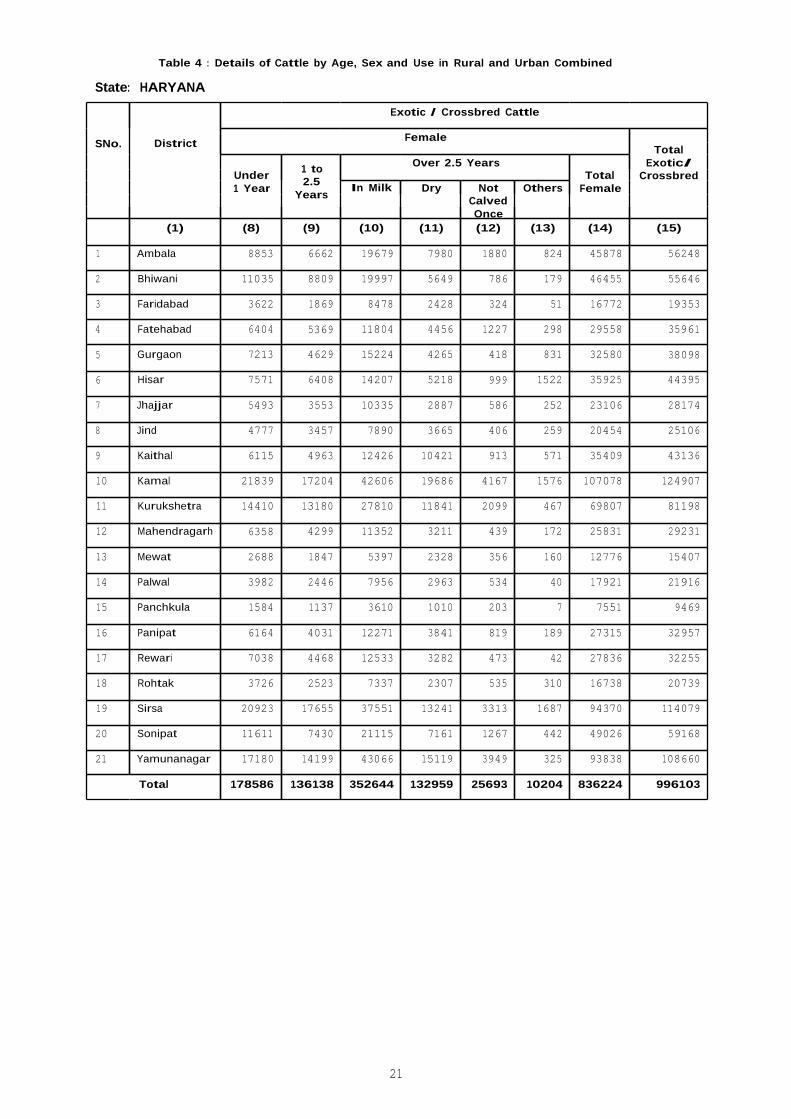
Table 4 : Details of Cattle by Age, Sex and Use in Rural and Urban Combined
State: HARYANA
SNo. District
Exotic / Crossbred Cattle
Female Total
Exotic/ CrossbredUnder
1 Year
1 to 2.5
Years
Over 2.5 Years Total
Female In Milk Dry Not Calved Once
Others
(1) (8) (9) (10) (11) (12) (13) (14) (15)
1 Ambala 8853 6662 19679 7980 1880 824 45878 56248
2 Bhiwani 11035 8809 19997 5649 786 179 46455 55646
3 Faridabad 3622 1869 8478 2428 324 51 16772 19353
4 Fatehabad 6404 5369 11804 4456 1227 298 29558 35961
5 Gurgaon 7213 4629 15224 4265 418 831 32580 38098
6 Hisar 7571 6408 14207 5218 999 1522 35925 44395
7 Jhajjar 5493 3553 10335 2887 586 252 23106 28174
8 Jind 4777 3457 7890 3665 406 259 20454 25106
9 Kaithal 6115 4963 12426 10421 913 571 35409 43136
10 Kamal 21839 17204 42606 19686 4167 1576 107078 124907
11 Kurukshetra 14410 13180 27810 11841 2099 467 69807 81198
12 Mahendragarh 6358 4299 11352 3211 439 172 25831 29231
13 Mewat 2688 1847 5397 2328 356 160 12776 15407
14 Palwal 3982 2446 7956 2963 534 40 17921 21916
15 Panchkula 1584 1137 3610 1010 203 7 7551 9469
16 Panipat 6164 4031 12271 3841 819 189 27315 32957
17 Rewari 7038 4468 12533 3282 473 42 27836 32255
18 Rohtak 3726 2523 7337 2307 535 310 16738 20739
19 Sirsa 20923 17655 37551 13241 3313 1687 94370 114079
20 Sonipat 11611 7430 21115 7161 1267 442 49026 59168
21 Yamunanagar 17180 14199 43066 15119 3949 325 93838 108660
Total 178586 136138 352644 132959 25693 10204 836224 996103
21
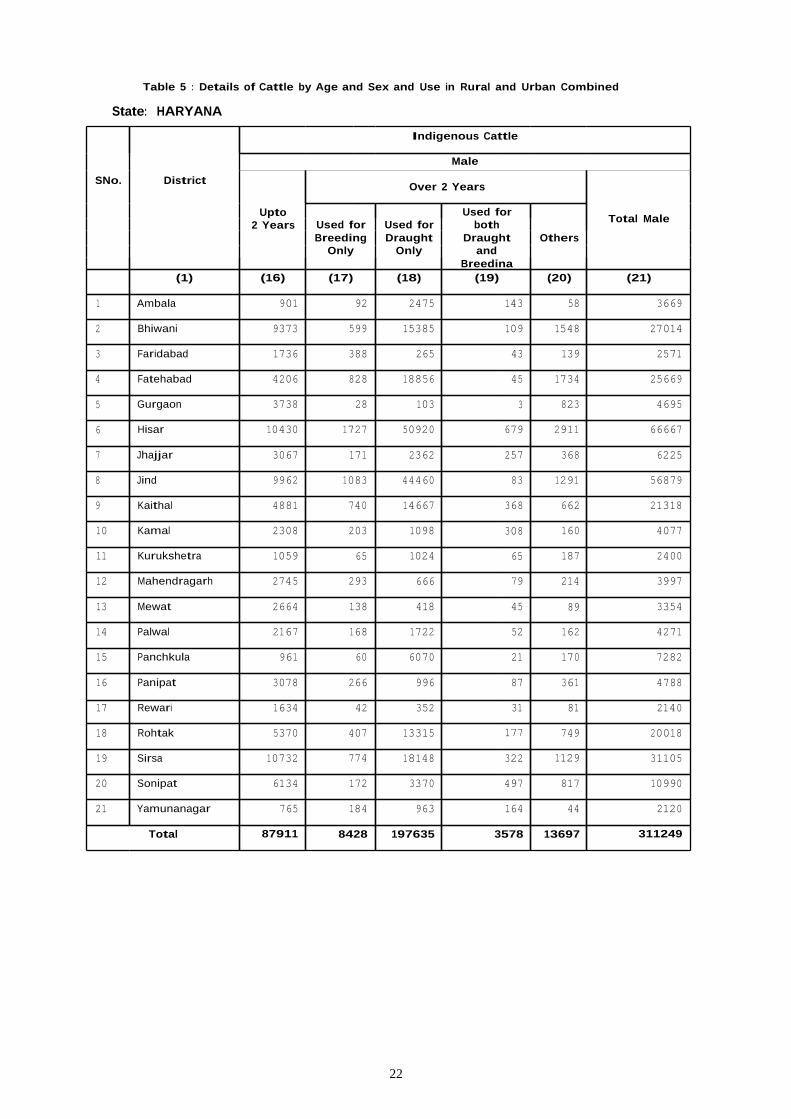
Table 5 : Details of Cattle by Age and Sex and Use in Rural and Urban Combined
State: HARYANA
SNo. District
Indigenous Cattle
Male
Upto 2 Years
Over 2 Years
Total Male Used for Breeding
Only
Used for Draught Only
Used for both
Draught and
Breedina
Others
(1) (16) (17) (18) (19) (20) (21)
1 Ambala 901 92 2475 143 58 3669
2 Bhiwani 9373 599 15385 109 1548 27014
3 Faridabad 1736 388 265 43 139 2571
4 Fatehabad 4206 828 18856 45 1734 25669
5 Gurgaon 3738 28 103 3 823 4695
6 Hisar 10430 1727 50920 679 2911 66667
7 Jhajjar 3067 171 2362 257 368 6225
8 Jind 9962 1083 44460 83 1291 56879
9 Kaithal 4881 740 14667 368 662 21318
10 Kamal 2308 203 1098 308 160 4077
11 Kurukshetra 1059 65 1024 65 187 2400
12 Mahendragarh 2745 293 666 79 214 3997
13 Mewat 2664 138 418 45 89 3354
14 Palwal 2167 168 1722 52 162 4271
15 Panchkula 961 60 6070 21 170 7282
16 Panipat 3078 266 996 87 361 4788
17 Rewari 1634 42 352 31 81 2140
18 Rohtak 5370 407 13315 177 749 20018
19 Sirsa 10732 774 18148 322 1129 31105
20 Sonipat 6134 172 3370 497 817 10990
21 Yamunanagar 765 184 963 164 44 2120
Total 87911 8428 197635 3578 13697 311249
22
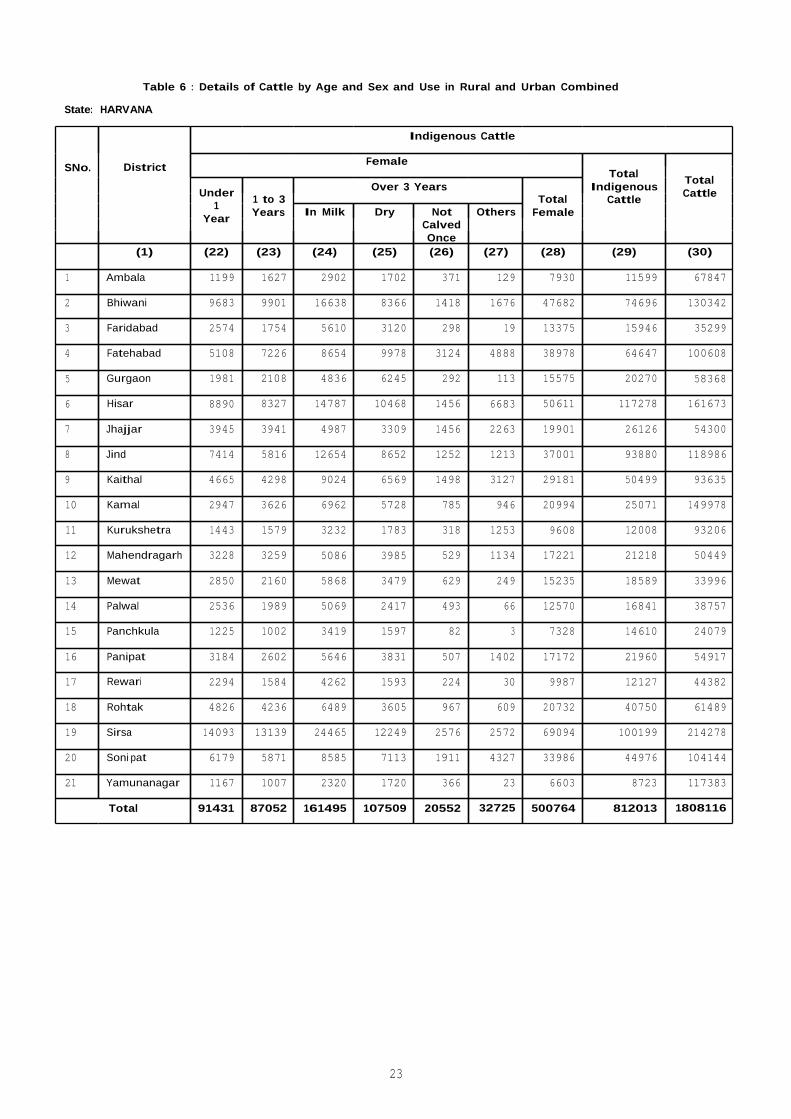
Table 6 : Details of Cattle by Age and Sex and Use in Rural and Urban Combined
State: HARVANA
SNo. District
Indigenous Cattle
Female Total
Indigenous Cattle
Total CattleUnder
1 Year
1 to 3 Years
Over 3 Years Total
FemaleIn Milk Dry Not Calved Once
Others
(1) (22) (23) (24) (25) (26) (27) (28) (29) (30)
1 Ambala 1199 1627 2902 1702 371 129 7930 11599 67847
2 Bhiwani 9683 9901 16638 8366 1418 1676 47682 74696 130342
3 Faridabad 2574 1754 5610 3120 298 19 13375 15946 35299
4 Fatehabad 5108 7226 8654 9978 3124 4888 38978 64647 100608
5 Gurgaon 1981 2108 4836 6245 292 113 15575 20270 58368
6 Hisar 8890 8327 14787 10468 1456 6683 50611 117278 161673
7 Jhajjar 3945 3941 4987 3309 1456 2263 19901 26126 54300
8 Jind 7414 5816 12654 8652 1252 1213 37001 93880 118986
9 Kaithal 4665 4298 9024 6569 1498 3127 29181 50499 93635
10 Kamal 2947 3626 6962 5728 785 946 20994 25071 149978
11 Kurukshetra 1443 1579 3232 1783 318 1253 9608 12008 93206
12 Mahendragarh 3228 3259 5086 3985 529 1134 17221 21218 50449
13 Mewat 2850 2160 5868 3479 629 249 15235 18589 33996
14 Palwal 2536 1989 5069 2417 493 66 12570 16841 38757
15 Panchkula 1225 1002 3419 1597 82 3 7328 14610 24079
16 Panipat 3184 2602 5646 3831 507 1402 17172 21960 54917
17 Rewari 2294 1584 4262 1593 224 30 9987 12127 44382
18 Rohtak 4826 4236 6489 3605 967 609 20732 40750 61489
19 Sirsa 14093 13139 24465 12249 2576 2572 69094 100199 214278
20 Soni pat 6179 5871 8585 7113 1911 4327 33986 44976 104144
21 Yamunanagar 1167 1007 2320 1720 366 23 6603 8723 117383
Total 91431 87052 161495 107509 20552 32725 500764 812013 1808116
23
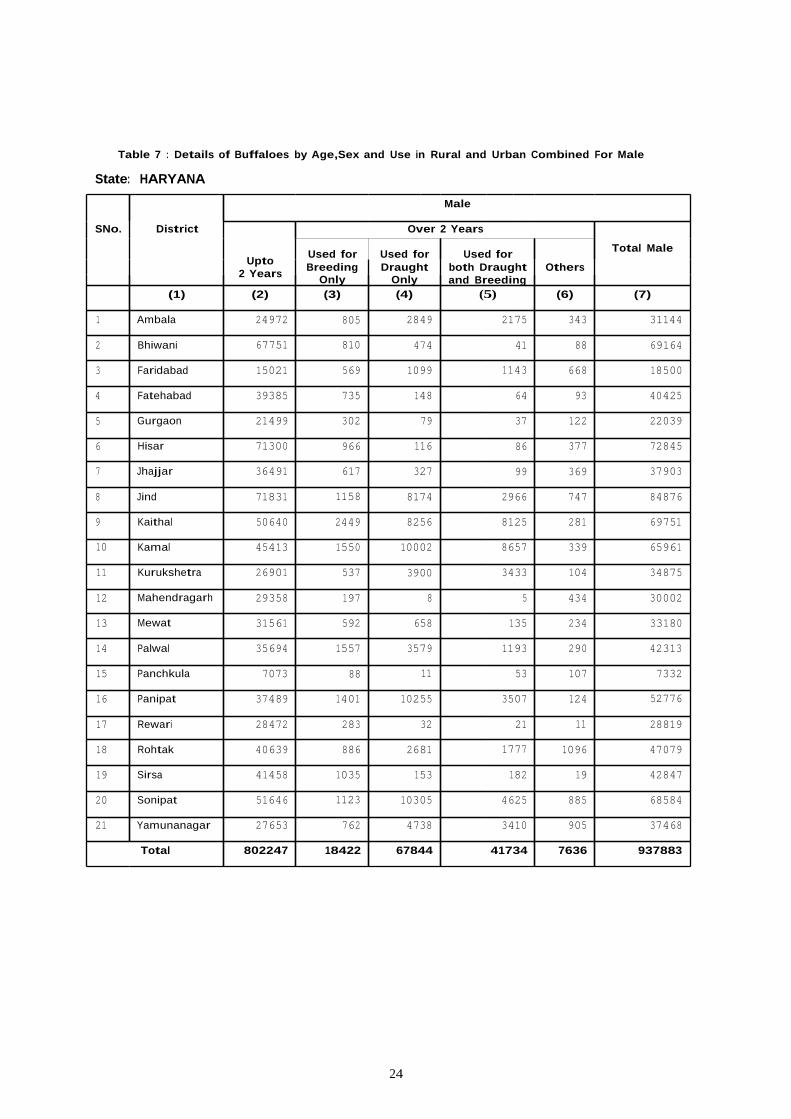
Table 7 : Details of Buffaloes by Age,Sex and Use in Rural and Urban Combined For Male
State: HARYANA
SNo. District
Male
Upto 2 Years
Over 2 Years
Total Male Used for Breeding
Only
Used for Draught Only
Used for both Draught and Breeding
Others
(1) (2) (3) (4) (5) (6) (7)
1 Ambala 24972 805 2849 2175 343 31144
2 Bhiwani 67751 810 474 41 88 69164
3 Faridabad 15021 569 1099 1143 668 18500
4 Fatehabad 39385 735 148 64 93 40425
5 Gurgaon 21499 302 79 37 122 22039
6 Hisar 71300 966 116 86 377 72845
7 Jhajjar 36491 617 327 99 369 37903
8 Jind 71831 1158 8174 2966 747 84876
9 Kaithal 50640 2449 8256 8125 281 69751
10 Kamal 45413 1550 10002 8657 339 65961
11 Kurukshetra 26901 537 3900 3433 104 34875
12 Mahendragarh 29358 197 8 5 434 30002
13 Mewat 31561 592 658 135 234 33180
14 Palwal 35694 1557 3579 1193 290 42313
15 Panchkula 7073 88 11 53 107 7332
16 Panipat 37489 1401 10255 3507 124 52776
17 Rewari 28472 283 32 21 11 28819
18 Rohtak 40639 886 2681 1777 1096 47079
19 Sirsa 41458 1035 153 182 19 42847
20 Sonipat 51646 1123 10305 4625 885 68584
21 Yamunanagar 27653 762 4738 3410 905 37468
Total 802247 18422 67844 41734 7636 937883
24

Table 8 : Details of Buffaloes by Age,Sex and Use in Rural and Urban Combined For Female
State: HARYANA
SNo. District
Female Total
BuffaloesUnder 1 Year
1 to 3 Years
Over 3 Years Total
FemaleIn Milk Dry Not Calved Once
Others
(1) (8) (9) (10) (11) (12) (13) (14) (15)
1 Ambala 39547 33134 79678 29014 6383 340 188096 219240
2 Bhiwani 98064 123777 165062 58364 10332 99 455698 524862
3 Faridabad 21873 14070 48316 15906 2539 128 102832 121332
4 Fatehabad 58574 70952 101327 43463 6713 511 281540 321965
5 Gurgaon 29864 21044 59503 19265 1553 41 131270 153309
6 Hisar 97707 106901 157064 61101 13537 387 436697 509542
7 Jhajjar 50941 42235 85139 32757 5793 140 217005 254908
8 Jind 92157 102488 151498 62999 9336 601 419079 503955
9 Kaithal 70929 73510 142632 53460 11038 2085 353654 423405
10 Kamal 60391 57911 112132 49744 10997 482 291657 357618
11 Kurukshetra 47461 36308 69263 28606 6133 612 188383 223258
12 Mahendragarh 50848 54179 87234 35098 2965 497 230821 260823
13 Mewat 44667 29084 75841 37871 7343 224 195030 228210
14 Palwal 53808 40322 102129 40664 6814 244 243981 286294
15 Panchkula 12907 10736 27910 8389 1632 33 61607 68939
16 Panipat 45942 34759 76158 27788 7054 763 192464 245240
17 Rewari 42680 38669 73810 22221 2503 94 179977 208796
18 Rohtak 50095 45752 85773 29401 4881 463 216365 263444
19 Sirsa 64202 75109 108723 41819 10413 433 300699 343546
20 Sonipat 63793 54207 117473 37937 5691 778 279879 348463
21 Yamunanagar 38498 33572 76223 26504 4953 945 180695 218163
Total 1134948 1098719 2002888 762371 138603 9900 5147429 6085312
25
Table 9: Details of Mithun by Age and Sex in Urban and rural combined
State: HARYANA
SNo. District Under 3 Years 3 Years and Above Total
MithunsMale Female Total Male Female Total
(1) (2) (3) (4) (5) (6) (7) (8)
1 Ambala 0 0 0 0 0 0 0
2 Bhiwani 0 0 0 0 0 0 0
3 Faridabad 0 0 0 0 0 0 0
4 Fate ha bad 0 0 0 0 0 0 0
5 Gurgaon 0 0 0 0 0 0 0
6 Hisar 0 0 0 0 0 0 0
7 Jhajjar 0 0 0 0 0 0 0
8 Jind 0 0 0 0 0 0 0
9 Kaithal 0 0 0 0 0 0 0
10 Karnal 0 0 0 0 0 0 0
11 Kurukshetra 0 0 0 0 0 0 0
12 Mahendragarh 0 0 0 0 0 0 0
13 Mewat 0 0 0 0 0 0 0
14 Palwal 0 0 0 0 0 0 0
15 Panchkula 0 0 0 0 0 0 0
16 Panipat 0 0 0 0 0 0 0
17 Rewari 0 0 0 0 0 0 0
18 Rohtak 0 0 0 0 0 0 0
19 Sirsa 0 0 0 0 0 0 0
20 Sonipat 0 0 0 0 0 0 0
21 Yamunanagar 0 0 0 0 0 0 0
Total 0 0 0 0 0 0 0
26
Table 10 : Details of Yaks by Age and Sex Rural and Urban Combined
State: HARYANA
SNo. District Under 3 Years 3 Years and Above
Total Yaks Male Female Total Male Female Total
(1) (2) (3) (4) (5) (6) (7) (8)
1 Ambala 0 0 0 0 0 0 0
2 Bhiwani 0 0 0 0 0 0 0
3 Faridabad 0 0 0 0 0 0 0
4 Fatehabad 0 0 0 0 0 0 0
5 Gurgaon 0 0 0 0 0 0 0
6 Hisar 0 0 0 0 0 0 0
7 Jhajjar 0 0 0 0 0 0 0
8 Jind 0 0 0 0 0 0 0
9 Kaithal 0 0 0 0 0 0 0
10 Karnal 0 0 0 0 0 0 0
11 Kurukshetra 0 0 0 0 0 0 0
12 Mahendragarh 0 0 0 0 0 0 0
13 Mewat 0 0 0 0 0 0 0
14 Palwal 0 0 0 0 0 0 0
15 Panchkula 0 0 0 0 0 0 0
16 Panipat 0 0 0 0 0 0 0
17 Rewari 0 0 0 0 0 0 0
18 Rohtak 0 0 0 0 0 0 0
19 Sirsa 0 0 0 0 0 0 0
20 Soni pat 0 0 0 0 0 0 0
21 Yamunanagar 0 0 0 0 0 0 0
Total 0 0 0 0 0 0 0
27

Table 11 : Details of Sheep by Age and Sex in Rural and Urban Combined For Exotic Crossbred
State: HARYANA
SNo. District
Exotic / Crossbred Sheep Total Exotic /
Crossbred Sheep
Male Female
Under 1
vear
1 Year and
Above Total Under
1 year
1 Year and
Above Total
(1) (2) (3) (4) (5) (6) (7) (8)
1 Ambala 481 315 796 911 2409 3320 4116
2 Bhiwani 436 271 707 745 2099 2844 3551
3 Faridabad 255 315 570 361 742 1103 1673
4 Fatehabad 55 62 117 110 452 562 679
5 Gurgaon 29 41 70 51 294 345 415
6 Hisar 768 418 1186 1594 5298 6892 8078
7 Jhajjar 433 365 798 485 780 1265 2063
8 Jind 223 144 367 252 789 1041 1408
9 Kaithal 703 659 1362 579 1260 1839 3201
10 Kamal 386 629 1015 641 1686 2327 3342
11 Kurukshetra 439 312 751 770 1788 2558 3309
12 Mahendragarh 192 111 303 291 787 1078 1381
13 Mewat 52 48 100 71 137 208 308
14 Palwal 208 174 382 199 438 637 1019
15 Panchkula 92 55 147 108 393 501 648
16 Panipat 204 240 444 302 1006 1308 1752
17 Rewari 89 135 224 208 582 790 1014
18 Rohtak 395 412 807 366 665 1031 1838
19 Sirsa 3558 284 3842 651 1401 2052 5894
20 Sonipat 189 202 391 254 545 799 1190
21 Yamunanagar 649 509 1158 926 2737 3663 4821
Total 9836 5701 15537 9875 26288 36163 51700
28

Table 12 : Details of Sheep by Age and Sex in Rural and Urban Combined For Indigenous
State: HARYANA
SNo. District
Indigenous Sheep Total
Indigenous Sheep
Total Sheep
Male Female
Under 1 year
1 Year and
Above
Total Indigenous
Sheep
Under 1 year
1 Year and
Above Total
(1) (9) (10) (11) (12) (13) (14) (15) (16)
1 Ambala 1161 745 1906 1816 4861 6677 8583 12699
2 Bhiwani 6219 3278 9497 9950 27272 37222 46719 50270
3 Faridabad 123 162 285 242 673 915 1200 2873
4 Fate ha bad 1745 1076 2821 3128 10626 13754 16575 17254
5 Gurgaon 251 212 463 449 1137 1586 2049 2464
6 Hisar 4773 2738 7511 8094 25360 33454 40965 49043
7 Jhajjar 2509 1339 3848 4532 9368 13900 17748 19811
8 Jind 2896 1872 4768 5505 16385 21890 26658 28066
9 Kaithal 1934 1405 3339 2539 7406 9945 13284 16485
10 Karnal 1457 1227 2684 2524 6545 9069 11753 15095
11 Kurukshetra 744 576 1320 1343 4072 5415 6735 10044
12 Mahendragarh 3162 1182 4344 4836 13821 18657 23001 24382
13 Mewat 883 741 1624 1704 4471 6175 7799 8107
14 Palwal 1325 1267 2592 2274 5737 8011 10603 11622
15 Panchkula 286 134 420 457 1942 2399 2819 3467
16 Panipat 582 589 1171 1254 2736 3990 5161 6913
17 Rewari 784 440 1224 1473 4973 6446 7670 8684
18 Rohtak 1579 1390 2969 2969 8346 11315 14284 16122
19 Sirsa 4280 4797 9077 7399 19518 26917 35994 41888
20 Sonipat 643 531 1174 1359 3699 5058 6232 7422
21 Yamunanagar 556 410 966 1142 2977 4119 5085 9906
Total 37892 26111 64003 64989 181925 246914 310917 362617
29

Table 13: Details of Goats by Age, Sex and Use in Rural and Urban Combined
State: HARYANA
SNo. District
Male Female
Total GoatsUnder
1 Year
1 Year and
Above
Total Under
1 Year
1 Year and Above
TotalIn Milk Dry Not Calved Once
(1) (2) (3) (4) (5) (6) (7) (8) (9) (10)
1 Ambala 979 562 1541 1414 3137 1377 331 6259 7800
2 Bhiwani 7041 2760 9801 10513 18204 10375 2014 41106 50907
3 Faridabad 1785 1377 3162 2243 3697 2259 336 8535 11697
4 Fatehabad 1347 819 2166 2522 4576 3300 398 10796 12962
5 Gurgaon 1401 720 2121 1909 4437 2817 271 9434 11555
6 Hisar 2641 1460 4101 4390 6677 5343 1449 17859 21960
7 Jhajjar 1358 853 2211 2144 3311 2148 567 8170 10381
8 Jind 1165 618 1783 2275 3378 2465 409 8527 10310
9 Kaithal 1156 986 2142 1834 2749 2065 357 7005 9147
10 Kamal 1192 1110 2302 2381 3711 2721 477 9290 11592
11 Kurukshetra 503 422 925 1043 1496 1112 185 3836 4761
12 Mahendragarh 8168 1770 9938 11782 19872 11771 1330 44755 54693
13 Mewat 5640 3397 9037 7203 12509 8258 1164 29134 38171
14 Palwal 1172 869 2041 1725 3147 2203 234 7309 9350
15 Panchkula 915 737 1652 1448 3147 1755 197 6547 8199
16 Panipat 650 626 1276 980 1719 1301 129 4129 5405
17 Rewari 2675 1005 3680 4525 9719 4486 827 19557 23237
18 Rohtak 767 510 1277 1289 2145 1467 303 5204 6481
19 Sirsa 4820 2429 7249 8596 14171 9826 1882 34475 41724
20 Sonipat 999 904 1903 1437 3247 1870 181 6735 8638
21 Yamunanagar 1260 961 2221 1920 3494 2245 266 7925 10146
Total 47634 24895 72529 73573 128543 81164 13307 296587 369116
Table 14: Details of Pigs by age and sex in Rural and Urban Combined For Exotic Crossbred
State: HARYANA
Exotic / Crossbred PigsSNo. District Total Exotic /
30
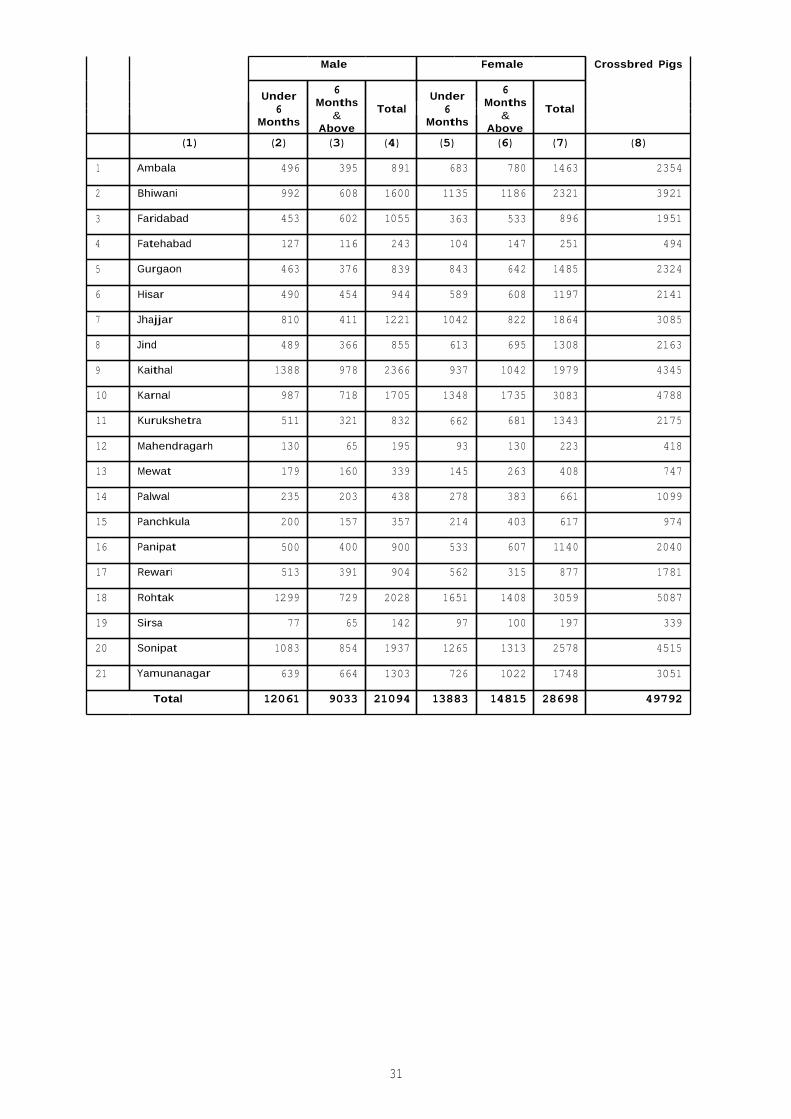
Male Female Crossbred Pigs
Under 6
Months
6 Months
& Above
Total Under
6 Months
6 Months
& Above
Total
(1) (2) (3) (4) (5) (6) (7) (8)
1 Ambala 496 395 891 683 780 1463 2354
2 Bhiwani 992 608 1600 1135 1186 2321 3921
3 Faridabad 453 602 1055 363 533 896 1951
4 Fatehabad 127 116 243 104 147 251 494
5 Gurgaon 463 376 839 843 642 1485 2324
6 Hisar 490 454 944 589 608 1197 2141
7 Jhajjar 810 411 1221 1042 822 1864 3085
8 Jind 489 366 855 613 695 1308 2163
9 Kaithal 1388 978 2366 937 1042 1979 4345
10 Karnal 987 718 1705 1348 1735 3083 4788
11 Kurukshetra 511 321 832 662 681 1343 2175
12 Mahendragarh 130 65 195 93 130 223 418
13 Mewat 179 160 339 145 263 408 747
14 Palwal 235 203 438 278 383 661 1099
15 Panchkula 200 157 357 214 403 617 974
16 Panipat 500 400 900 533 607 1140 2040
17 Rewari 513 391 904 562 315 877 1781
18 Rohtak 1299 729 2028 1651 1408 3059 5087
19 Sirsa 77 65 142 97 100 197 339
20 Sonipat 1083 854 1937 1265 1313 2578 4515
21 Yamunanagar 639 664 1303 726 1022 1748 3051
Total 12061 9033 21094 13883 14815 28698 49792
31

Table 15 : Details of Pigs by age and sex in Rural and Urban Combined For Indigenous
State: HARYANA
SNo. District
Indigenous Pigs Total
Indigenous Pigs
Total Pigs
Male Female
Under 6
Months
6 Months
& Above
Total Under
6 Months
6 Months
& Above
Total
(1) (9) (10) (11) (12) (13) (14) (15) (16)
1 Ambala 604 470 1074 964 835 1799 2873 5227
2 Bhiwani 1067 774 1841 1165 1587 2752 4593 8514
3 Faridabad 442 538 980 573 721 1294 2274 4225
4 Fatehabad 774 639 1413 1256 1832 3088 4501 4995
5 Gurgaon 562 757 1319 875 1019 1894 3213 5537
6 Hisar 1446 1048 2494 2172 2168 4340 6834 8975
7 Jhajjar 945 776 1721 1437 1561 2998 4719 7804
8 Jind 1788 1244 3032 2703 3031 5734 8766 10929
9 Kaithal 1611 1222 2833 1585 2037 3622 6455 10800
10 Karnal 919 714 1633 1292 1358 2650 4283 9071
11 Kurukshetra 286 229 515 354 474 828 1343 3518
12 Mahendragarh 249 198 447 286 349 635 1082 1500
13 Mewat 739 881 1620 528 558 1086 2706 3453
14 Palwal 497 630 1127 922 1160 2082 3209 4308
15 Panchkula 80 65 145 116 165 281 426 1400
16 Panipat 908 628 1536 1085 1284 2369 3905 5945
17 Rewari 200 149 349 290 268 558 907 2688
18 Rohtak 1222 932 2154 1740 1916 3656 5810 10897
19 Sirsa 238 266 504 272 338 610 1114 1453
20 Sonipat 1364 1366 2730 1907 2011 3918 6648 11163
21 Yamunanagar 258 286 544 460 488 948 1492 4543
Total 16199 13812 30011 21982 25160 47142 77153 126945
32

Table 16 : Details of Horses & Ponies by Age, Sex and Use in Rural and Urban Combined
State: HARVANA
SNo. District
Male Female Total Horses
& Ponies
Under 3
Year
3 Year and
Above
Total Under 3
Year
3 Year and
Above
Total
Used for Cart and Carriaae
Used for
Soort (1) (2) (3) (4) (5) (6) (7) (8) (9)
1 Ambala 10237 277 51 10565 213 761 974 11539
2 Bhiwani 227 365 24 616 318 993 1311 1927
3 Faridabad 14 63 4 81 37 139 176 257
4 Fatehabad 210 333 24 567 285 684 969 1536
5 Gurgaon 163 129 51 343 232 532 764 1107
6 Hisar 204 325 15 544 312 742 1054 1598
7 Jhajjar 59 107 11 177 133 378 511 688
8 Jind 220 551 19 790 312 963 1275 2065
9 Kaithal 359 556 66 981 488 974 1462 2443
10 Kamal 300 471 35 806 684 1471 2155 2961
11 Kurukshetra 143 274 16 433 239 742 981 1414
12 Mahendragarh 68 118 14 200 104 509 613 813
13 Mewat 48 60 0 108 53 120 173 281
14 Palwal 46 142 8 196 57 194 251 447
15 Panchkula 24 32 14 70 44 100 144 214
16 Panipat 150 270 19 439 300 768 1068 1507
17 Rewari 86 99 7 192 105 245 350 542
18 Rohtak 110 146 13 269 174 574 748 1017
19 Sirsa 137 269 69 475 242 607 849 1324
20 Soni pat 232 228 38 498 321 771 1092 1590
21 Yamunanagar 290 327 15 632 121 632 753 1385
Total 13327 5142 513 18982 4774 12899 17673 36655
33
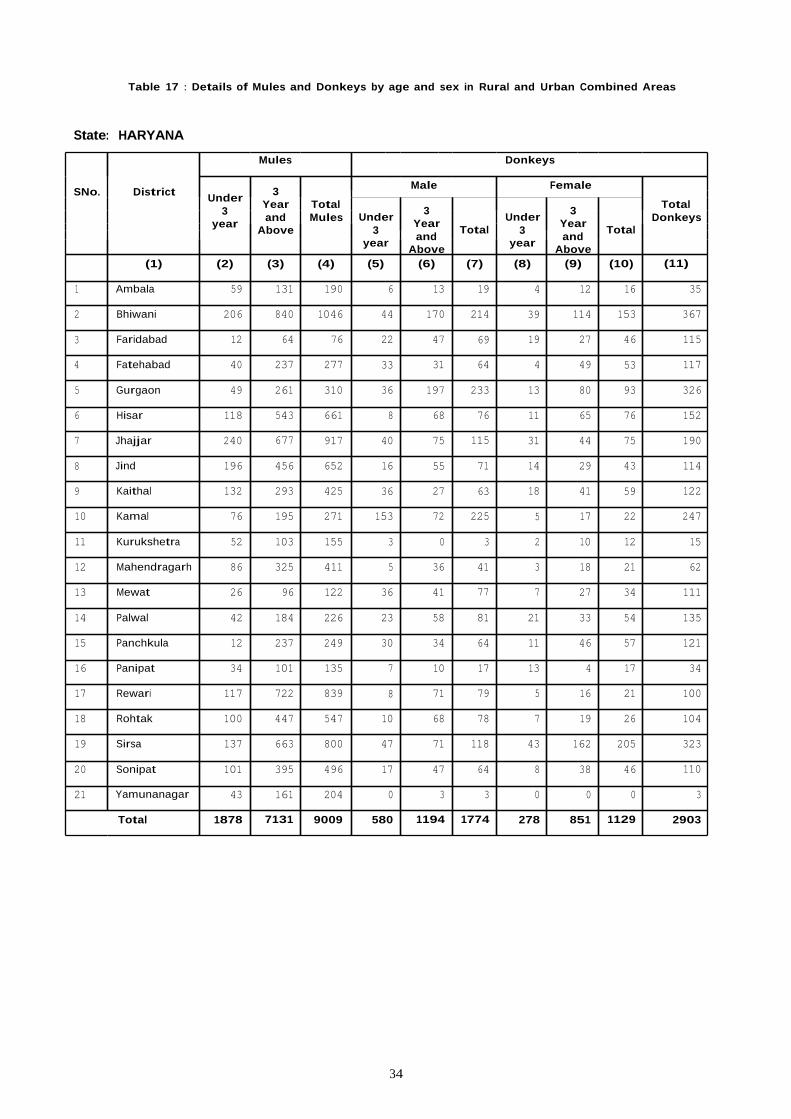
Table 17 : Details of Mules and Donkeys by age and sex in Rural and Urban Combined Areas
State: HARYANA
SNo. District
Mules Donkeys
Under 3
year
3 Year and
Above
Total Mules
Male Female
Total DonkeysUnder
3 year
3 Year and
Above
Total Under
3 year
3 Year and
Above
Total
(1) (2) (3) (4) (5) (6) (7) (8) (9) (10) (11)
1 Ambala 59 131 190 6 13 19 4 12 16 35
2 Bhiwani 206 840 1046 44 170 214 39 114 153 367
3 Faridabad 12 64 76 22 47 69 19 27 46 115
4 Fatehabad 40 237 277 33 31 64 4 49 53 117
5 Gurgaon 49 261 310 36 197 233 13 80 93 326
6 Hisar 118 543 661 8 68 76 11 65 76 152
7 Jhajjar 240 677 917 40 75 115 31 44 75 190
8 Jind 196 456 652 16 55 71 14 29 43 114
9 Kaithal 132 293 425 36 27 63 18 41 59 122
10 Kamal 76 195 271 153 72 225 5 17 22 247
11 Kurukshetra 52 103 155 3 0 3 2 10 12 15
12 Mahendragarh 86 325 411 5 36 41 3 18 21 62
13 Mewat 26 96 122 36 41 77 7 27 34 111
14 Palwal 42 184 226 23 58 81 21 33 54 135
15 Panchkula 12 237 249 30 34 64 11 46 57 121
16 Panipat 34 101 135 7 10 17 13 4 17 34
17 Rewari 117 722 839 8 71 79 5 16 21 100
18 Rohtak 100 447 547 10 68 78 7 19 26 104
19 Sirsa 137 663 800 47 71 118 43 162 205 323
20 Sonipat 101 395 496 17 47 64 8 38 46 110
21 Yamunanagar 43 161 204 0 3 3 0 0 0 3
Total 1878 7131 9009 580 1194 1774 278 851 1129 2903
34

Table 18 : Details of Camels by Age and Sex in Rural and Urban Combined
State: HARVANA
SNo. District
Male Female
Total Camel Under 4 Years
4 Years and
Above Total Under 4
Years
4 Years and
Above Total
(1) (2) (3) (4) (5) (6) (7) (8)
1 Ambala 0 0 0 0 0 0 0
2 Bhiwani 314 1234 1548 607 3249 3856 5404
3 Faridabad 1 7 8 0 0 0 8
4 Fatehabad 81 218 299 236 1305 1541 1840
5 Gurgaon 8 57 65 10 16 26 91
6 Hisar 23 150 173 159 1285 1444 1617
7 Jhajjar 3 33 36 12 64 76 112
8 Jind 13 22 35 12 55 67 102
9 Kaithal 1 5 6 0 0 0 6
10 Karna I 16 37 53 15 27 42 95
11 Kurukshetra 0 0 0 0 1 1 1
12 Mahendragarh 279 1557 1836 308 1447 1755 3591
13 Mewat 9 85 94 24 12 36 130
14 Palwal 0 10 10 0 0 0 10
15 Panchkula 7 41 48 0 0 0 48
16 Panipat 0 2 2 0 0 0 2
17 Rewari 104 434 538 77 389 466 1004
18 Rohtak 2 5 7 0 7 7 14
19 Sirsa 132 711 843 407 3516 3923 4766
20 Sonipat 0 1 1 0 0 0 1
21 Yamunanagar 0 0 0 1 2 3 3
Total 993 4609 5602 1868 11375 13243 18845
35

Table 19: Details of Dogs, Rabbits and Elephants in Rural and Urban Combined
State: HARYANA
SNo. District Dogs Rabbits Elephants
Male Female Total Male Female Total Male Female Total
(1) (2) (3) (4) (5) (6) (7) (8) (9) (10)
1 Ambala 6943 3478 10421 530 626 1156 1 0 1
2 Bhiwani 11110 4113 15223 538 742 1280 0 0 0
3 Faridabad 6651 1978 8629 159 123 282 1 0 1
4 Fatehabad 7569 1932 9501 154 288 442 0 0 0
5 Gurgaon 17731 5707 23438 153 140 293 0 0 0
6 Hisar 7094 2917 10011 38 41 79 0 0 0
7 Jhajjar 5617 2113 7730 75 60 135 0 0 0
8 Jind 2817 993 3810 809 234 1043 0 0 0
9 Kaithal 4996 1988 6984 269 235 504 120 0 120
10 Karnal 7433 2912 10345 833 1523 2356 177 0 177
11 Kurukshetra 5181 1649 6830 501 1459 1960 1 3 4
12 Mahendragarh 5356 2290 7646 175 53 228 0 0 0
13 Mewat 573 170 743 82 97 179 5 0 5
14 Palwal 1291 553 1844 43 40 83 0 11 11
15 Panchkula 3482 802 4284 20 0 20 0 0 0
16 Panipat 2310 676 2986 157 269 426 0 0 0
17 Rewari 4365 1931 6296 13 13 26 0 0 0
18 Rohtak 3825 1288 5113 53 146 199 0 0 0
19 Sirsa 16657 4834 21491 252 453 705 0 0 0
20 Soni pat 5230 2192 7422 73 36 109 0 0 0
21 Yamunanagar 5995 1941 7936 719 883 1602 205 0 205
Total 132226 46457 178683 5646 7461 13107 510 14 524
36
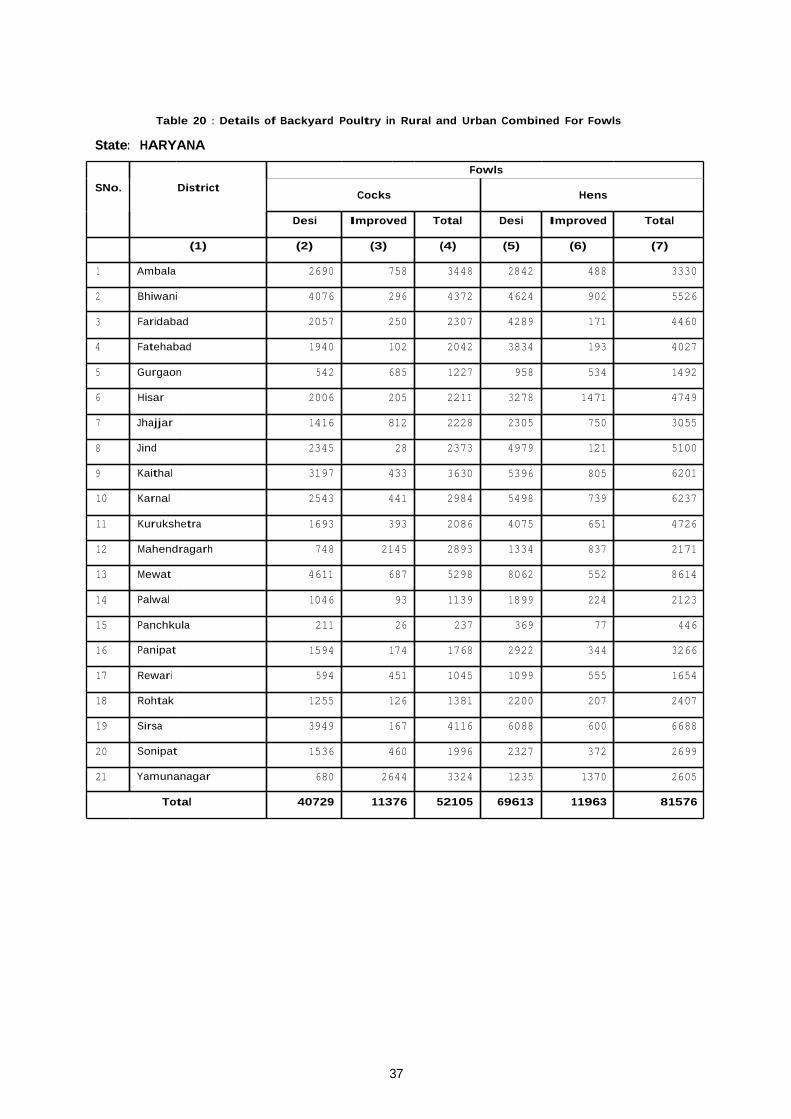
Table 20 : Details of Backyard Poultry in Rural and Urban Combined For Fowls
State: HARYANA
SNo. District Fowls
Cocks Hens
Desi Improved Total Desi Improved Total
(1) (2) (3) (4) (5) (6) (7)
1 Ambala 2690 758 3448 2842 488 3330
2 Bhiwani 4076 296 4372 4624 902 5526
3 Faridabad 2057 250 2307 4289 171 4460
4 Fatehabad 1940 102 2042 3834 193 4027
5 Gurgaon 542 685 1227 958 534 1492
6 Hisar 2006 205 2211 3278 1471 4749
7 Jhajjar 1416 812 2228 2305 750 3055
8 Jind 2345 28 2373 4979 121 5100
9 Kaithal 3197 433 3630 5396 805 6201
10 Karnal 2543 441 2984 5498 739 6237
11 Kurukshetra 1693 393 2086 4075 651 4726
12 Mahendragarh 748 2145 2893 1334 837 2171
13 Mewat 4611 687 5298 8062 552 8614
14 Palwal 1046 93 1139 1899 224 2123
15 Panchkula 211 26 237 369 77 446
16 Panipat 1594 174 1768 2922 344 3266
17 Rewari 594 451 1045 1099 555 1654
18 Rohtak 1255 126 1381 2200 207 2407
19 Sirsa 3949 167 4116 6088 600 6688
20 Sonipat 1536 460 1996 2327 372 2699
21 Yamunanagar 680 2644 3324 1235 1370 2605
Total 40729 11376 52105 69613 11963 81576
37
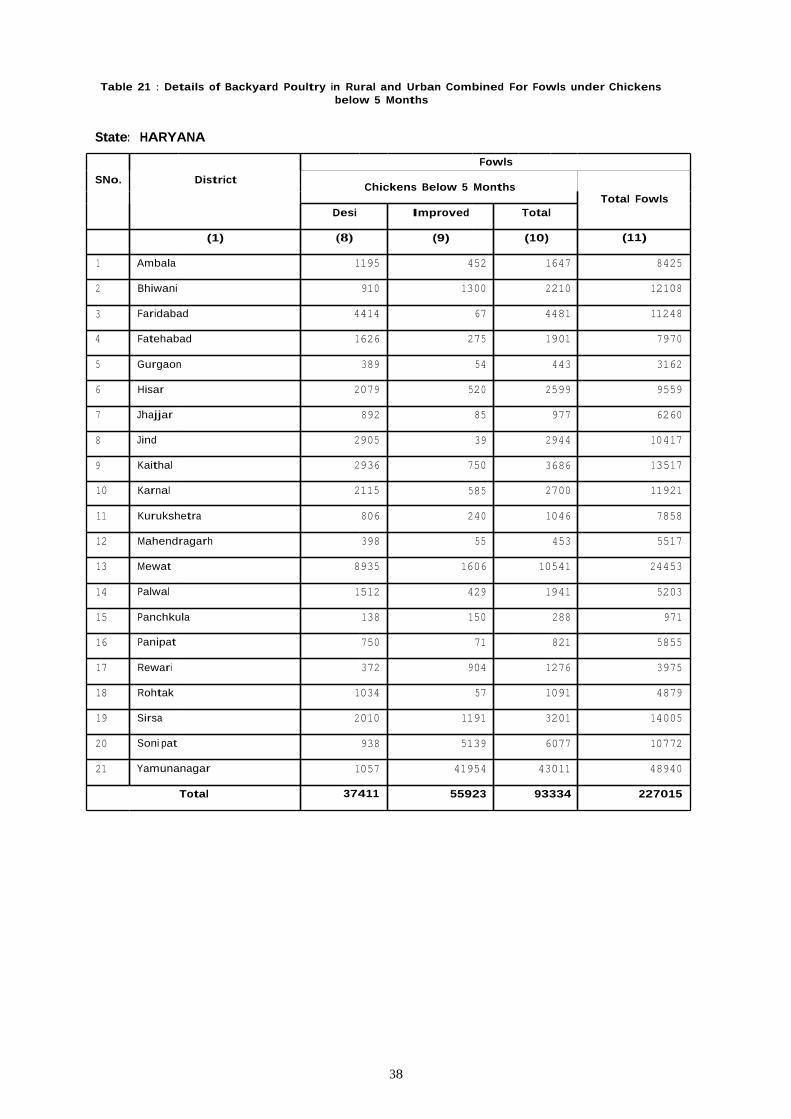
Table 21 : Details of Backyard Poultry in Rural and Urban Combined For Fowls under Chickens below 5 Months
State: HARYANA
SNo. District Fowls
Chickens Below 5 Months Total Fowls
Desi Improved Total
(1) (8) (9) (10) (11)
1 Ambala 1195 452 1647 8425
2 Bhiwani 910 1300 2210 12108
3 Faridabad 4414 67 4481 11248
4 Fatehabad 1626 275 1901 7970
5 Gurgaon 389 54 443 3162
6 Hisar 2079 520 2599 9559
7 Jhajjar 892 85 977 6260
8 Jind 2905 39 2944 10417
9 Kaithal 2936 750 3686 13517
10 Karnal 2115 585 2700 11921
11 Kurukshetra 806 240 1046 7858
12 Mahendragarh 398 55 453 5517
13 Mewat 8935 1606 10541 24453
14 Palwal 1512 429 1941 5203
15 Panchkula 138 150 288 971
16 Panipat 750 71 821 5855
17 Rewari 372 904 1276 3975
18 Rohtak 1034 57 1091 4879
19 Sirsa 2010 1191 3201 14005
20 Soni pat 938 5139 6077 10772
21 Yamunanagar 1057 41954 43011 48940
Total 37411 55923 93334 227015
38
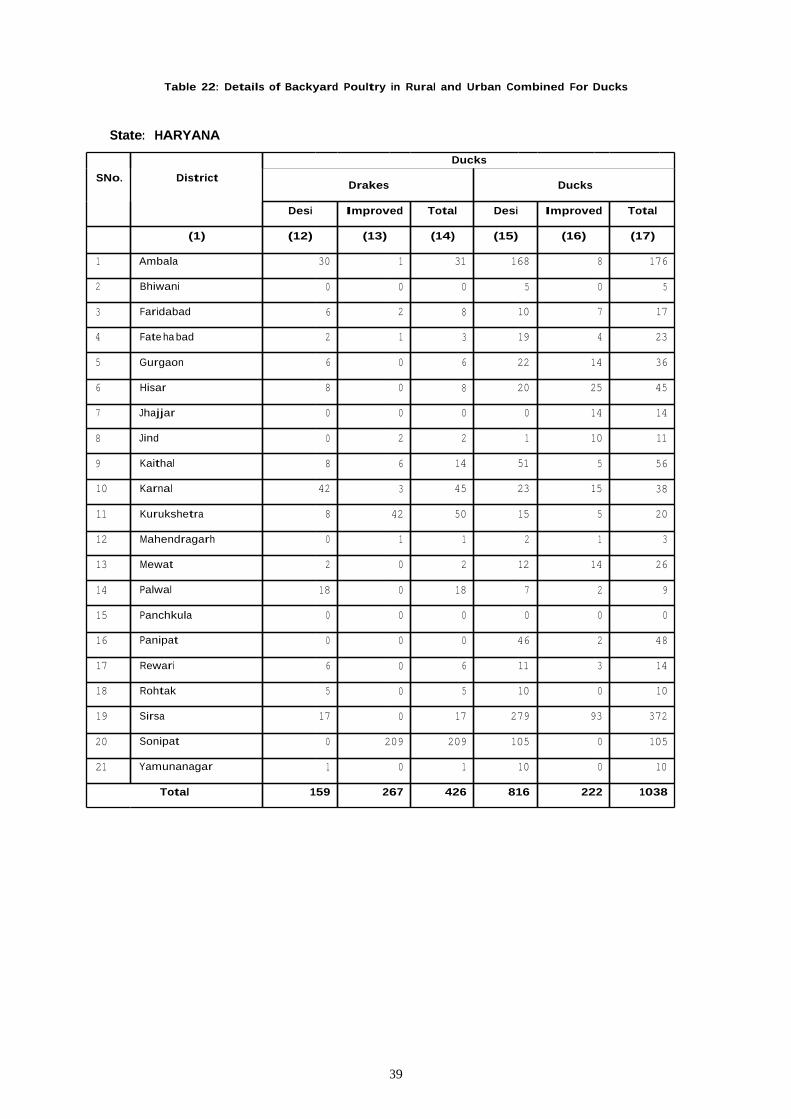
Table 22: Details of Backyard Poultry in Rural and Urban Combined For Ducks
State: HARYANA
SNo. District Ducks
Drakes Ducks
Desi Improved Total Desi Improved Total
(1) (12) (13) (14) (15) (16) (17)
1 Ambala 30 1 31 168 8 176
2 Bhiwani 0 0 0 5 0 5
3 Faridabad 6 2 8 10 7 17
4 Fate ha bad 2 1 3 19 4 23
5 Gurgaon 6 0 6 22 14 36
6 Hisar 8 0 8 20 25 45
7 Jhajjar 0 0 0 0 14 14
8 Jind 0 2 2 1 10 11
9 Kaithal 8 6 14 51 5 56
10 Karnal 42 3 45 23 15 38
11 Kurukshetra 8 42 50 15 5 20
12 Mahendragarh 0 1 1 2 1 3
13 Mewat 2 0 2 12 14 26
14 Palwal 18 0 18 7 2 9
15 Panchkula 0 0 0 0 0 0
16 Panipat 0 0 0 46 2 48
17 Rewari 6 0 6 11 3 14
18 Rohtak 5 0 5 10 0 10
19 Sirsa 17 0 17 279 93 372
20 Sonipat 0 209 209 105 0 105
21 Yamunanagar 1 0 1 10 0 10
Total 159 267 426 816 222 1038
39
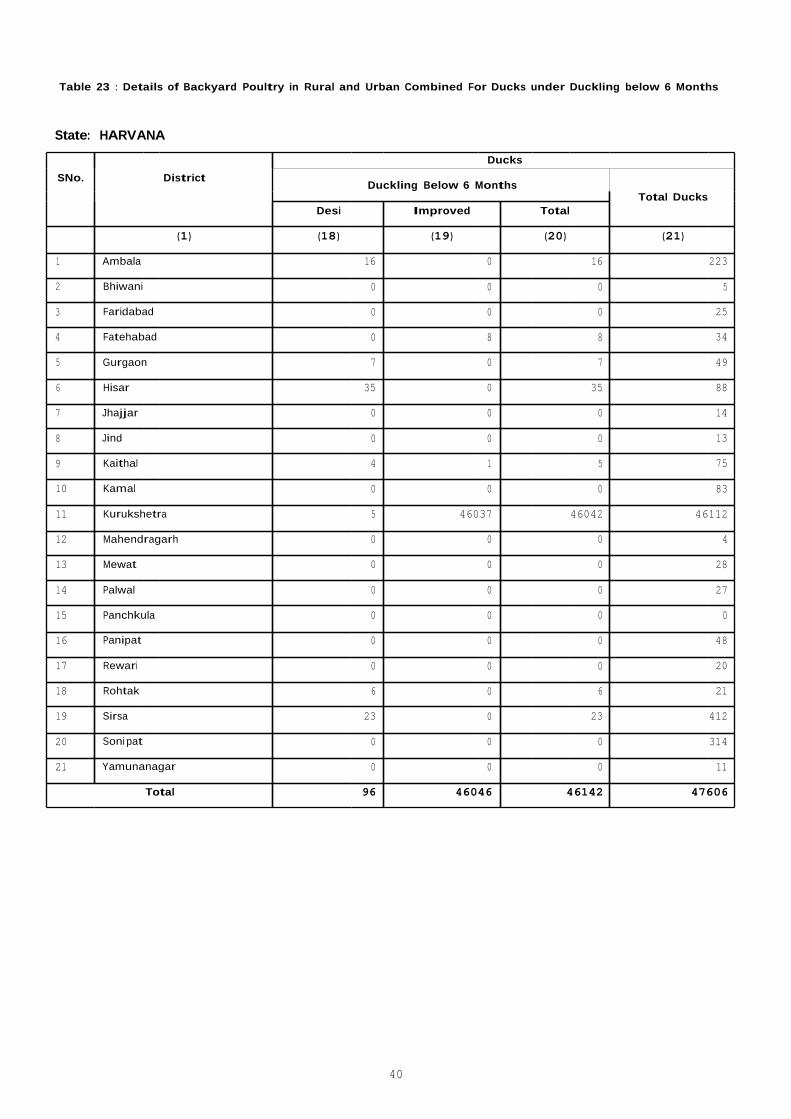
Table 23 : Details of Backyard Poultry in Rural and Urban Combined For Ducks under Duckling below 6 Months
State: HARVANA
SNo. District Ducks
Duckling Below 6 Months Total Ducks
Desi Improved Total
(1) (18) (19) (20) (21)
1 Ambala 16 0 16 223
2 Bhiwani 0 0 0 5
3 Faridabad 0 0 0 25
4 Fatehabad 0 8 8 34
5 Gurgaon 7 0 7 49
6 Hisar 35 0 35 88
7 Jhajjar 0 0 0 14
8 Jind 0 0 0 13
9 Kaithal 4 1 5 75
10 Kamal 0 0 0 83
11 Kurukshetra 5 46037 46042 46112
12 Mahendragarh 0 0 0 4
13 Mewat 0 0 0 28
14 Palwal 0 0 0 27
15 Panchkula 0 0 0 0
16 Panipat 0 0 0 48
17 Rewari 0 0 0 20
18 Rohtak 6 0 6 21
19 Sirsa 23 0 23 412
20 Soni pat 0 0 0 314
21 Yamunanagar 0 0 0 11
Total 96 46046 46142 47606
40
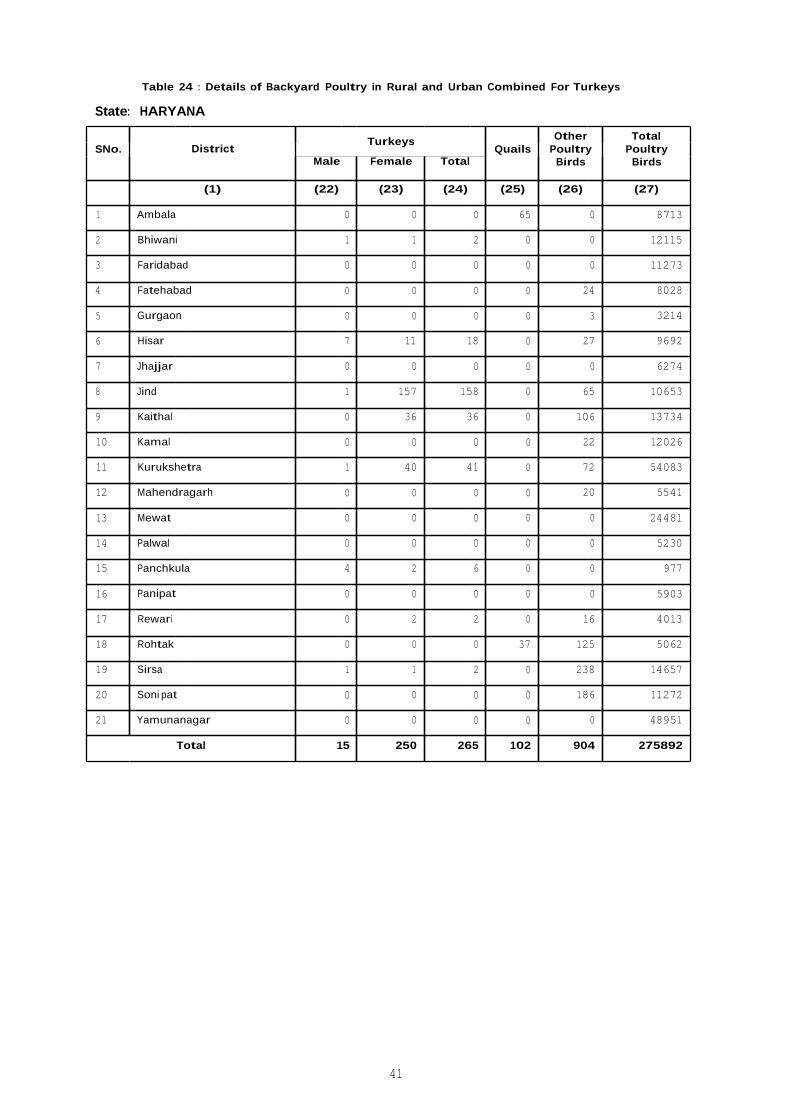
Table 24 : Details of Backyard Poultry in Rural and Urban Combined For Turkeys
State: HARYANA
SNo. District Turkeys Quails
Other Poultry Birds
Total Poultry Birds Male Female Total
(1) (22) (23) (24) (25) (26) (27)
1 Ambala 0 0 0 65 0 8713
2 Bhiwani 1 1 2 0 0 12115
3 Faridabad 0 0 0 0 0 11273
4 Fatehabad 0 0 0 0 24 8028
5 Gurgaon 0 0 0 0 3 3214
6 Hisar 7 11 18 0 27 9692
7 Jhajjar 0 0 0 0 0 6274
8 Jind 1 157 158 0 65 10653
9 Kaithal 0 36 36 0 106 13734
10 Kamal 0 0 0 0 22 12026
11 Kurukshetra 1 40 41 0 72 54083
12 Mahendragarh 0 0 0 0 20 5541
13 Mewat 0 0 0 0 0 24481
14 Palwal 0 0 0 0 0 5230
15 Panchkula 4 2 6 0 0 977
16 Panipat 0 0 0 0 0 5903
17 Rewari 0 2 2 0 16 4013
18 Rohtak 0 0 0 37 125 5062
19 Sirsa 1 1 2 0 238 14657
20 Soni pat 0 0 0 0 186 11272
21 Yamunanagar 0 0 0 0 0 48951
Total 15 250 265 102 904 275892
41

Table 25 : Poultry Birds in Farms / Hatcheries in Rural and Urban Combined
State: HARYANA
SNo. District Number of Birds in Farms / Hatcheries
Layer Broiler Duck Others*
(1) (2) (3) (4) (5)
1 Ambala 1376177 1164465 0 5025
2 Bhiwani 540068 2229351 0 45102
3 Faridabad 16400 15200 0 0
4 Fatehabad 13000 261100 36 11168
5 Gurgaon 182042 312897 1500 1411
6 Hisar 343850 3130700 130045 1249
7 Jhajjar 0 205797 0 12770
8 Jind 2995831 3934400 0 48
9 Kaithal 334788 1199909 0 43779
10 Karnal 4180820 2211000 6 157288
11 Kurukshetra 2243241 1274821 62 55184
12 Mahendragarh 104500 837525 0 298
13 Mewat 0 21608 0 0
14 Palwal 0 3200 0 0
15 Panchkula 6181170 11000 0 187
16 Panipat 871058 1178497 0 231508
17 Rewari 41000 689870 4000 849
18 Rohtak 310400 375400 3440 63
19 Sirsa 45500 490652 0 2564
20 Sonipat 605733 896780 19000 31605
21 Yamunanagar 113429 834830 0 9260
Total 20499007 21279002 158089 609358
* Others include Turkey, Emu, Ostrich etc
42
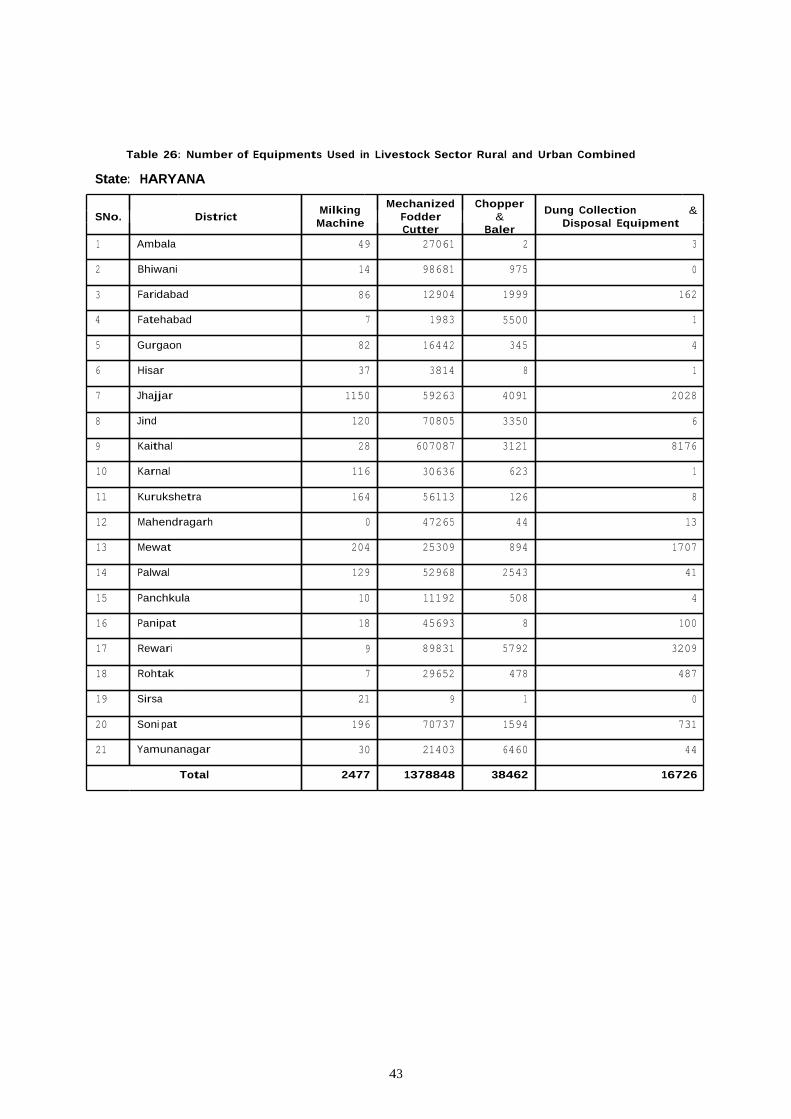
Table 26: Number of Equipments Used in Livestock Sector Rural and Urban Combined
State: HARYANA
SNo. District Milking Machine
Mechanized Fodder Cutter
Chopper &
Baler
Dung Collection & Disposal Equipment
1 Ambala 49 27061 2 3
2 Bhiwani 14 98681 975 0
3 Faridabad 86 12904 1999 162
4 Fatehabad 7 1983 5500 1
5 Gurgaon 82 16442 345 4
6 Hisar 37 3814 8 1
7 Jhajjar 1150 59263 4091 2028
8 Jind 120 70805 3350 6
9 Kaithal 28 607087 3121 8176
10 Karnal 116 30636 623 1
11 Kurukshetra 164 56113 126 8
12 Mahendragarh 0 47265 44 13
13 Mewat 204 25309 894 1707
14 Palwal 129 52968 2543 41
15 Panchkula 10 11192 508 4
16 Panipat 18 45693 8 100
17 Rewari 9 89831 5792 3209
18 Rohtak 7 29652 478 487
19 Sirsa 21 9 1 0
20 Soni pat 196 70737 1594 731
21 Yamunanagar 30 21403 6460 44
Total 2477 1378848 38462 16726
43

Table 27: Number Of Households And Households Enterprises Owning Animals/Poultry Birds in Rural and Urban Combined
State: HARYANA
SNo. District
Number of Households and Households Enterprises Having
Cattle Buffaloes Goats Sheep Pigs Backyard Poultry
Poultry Farm
& Hatcheries
(1) (2) (3) (4) (5) (6) (7) (8)
1 Ambala 28888 70421 1688 844 1537 1148 3416
2 Bhiwani 58751 193746 8429 5747 1127 2383 141630
3 Faridabad 14176 42879 3732 64 543 3277 1040
4 Fatehabad 40463 96613 2445 749 470 1044 11147
5 Gurgaon 19601 59975 1652 335 779 505 42521
6 Hisar 68808 157953 2564 1547 1494 1117 36972
7 Jhajjar 23160 101844 1441 2644 1315 1482 2037
8 Jind 64747 142557 1673 884 2140 1742 91464
9 Kaithal 40669 100842 1654 1662 1680 1984 75637
10 Karnal 60987 116712 2886 648 1984 2243 413533
11 Kurukshetra 40443 66198 1039 448 649 1178 200634
12 Mahendragarh 21233 105411 9759 1106 136 485 50272
13 Mewat 14435 96670 7742 930 373 4769 1720
14 Palwal 19113 106543 2280 367 674 873 1
15 Panchkula 9433 20513 880 66 166 137 20161
16 Panipat 22233 74533 1249 204 1306 1283 133121
17 Rewari 20839 82500 2507 207 212 316 1850
18 Rohtak 26705 86123 1017 529 1433 875 10046
19 Sirsa 86193 112387 8729 1456 234 1592 6103
20 Soni pat 38874 127087 1649 931 2600 1410 130553
21 Yamunanagar 51867 76423 2583 531 825 21055 94411
Total 771618 2037930 67598 21899 21677 50898 1468269
44
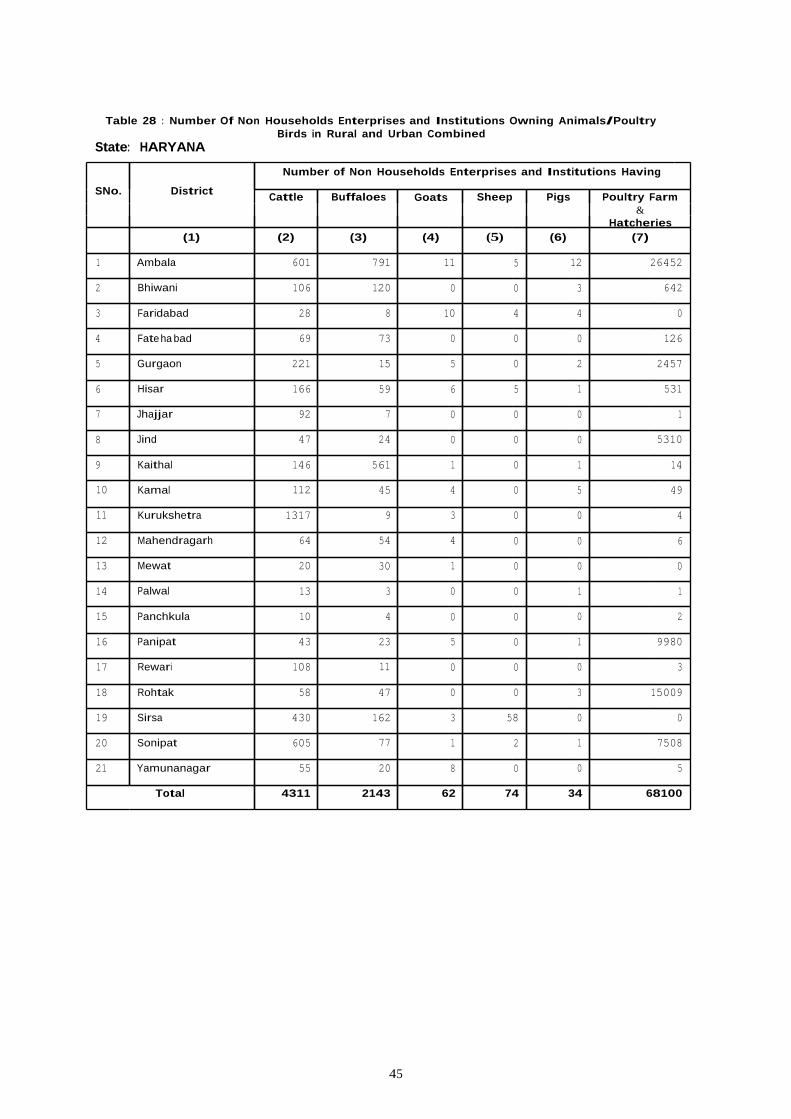
Table 28 : Number Of Non Households Enterprises and Institutions Owning Animals/Poultry Birds in Rural and Urban Combined
State: HARYANA
SNo. District
Number of Non Households Enterprises and Institutions Having
Cattle Buffaloes Goats Sheep Pigs Poultry Farm &
Hatcheries (1) (2) (3) (4) (5) (6) (7)
1 Ambala 601 791 11 5 12 26452
2 Bhiwani 106 120 0 0 3 642
3 Faridabad 28 8 10 4 4 0
4 Fate ha bad 69 73 0 0 0 126
5 Gurgaon 221 15 5 0 2 2457
6 Hisar 166 59 6 5 1 531
7 Jhajjar 92 7 0 0 0 1
8 Jind 47 24 0 0 0 5310
9 Kaithal 146 561 1 0 1 14
10 Kamal 112 45 4 0 5 49
11 Kurukshetra 1317 9 3 0 0 4
12 Mahendragarh 64 54 4 0 0 6
13 Mewat 20 30 1 0 0 0
14 Palwal 13 3 0 0 1 1
15 Panchkula 10 4 0 0 0 2
16 Panipat 43 23 5 0 1 9980
17 Rewari 108 11 0 0 0 3
18 Rohtak 58 47 0 0 3 15009
19 Sirsa 430 162 3 58 0 0
20 Sonipat 605 77 1 2 1 7508
21 Yamunanagar 55 20 8 0 0 5
Total 4311 2143 62 74 34 68100
45

Table 29: Number Of Stray Cattle and Dogs
State: HARYANA
SNo. District Stray Cattle Stray Dogs
(1) (2) (3)
1 Ambala 4624 17199
2 Bhiwani 15057 44846
3 Faridabad 4240 11881
4 Fatehabad 5442 17173
5 Gurgaon 6550 20803
6 Hisar 13218 49239
7 Jhajjar 4987 18184
8 Jind 7802 27243
9 Kaithal 6658 20737
10 Karna I 3767 21426
11 Kurukshetra 2907 12360
12 Mahendragarh 4334 19134
13 Mewat 755 15780
14 Palwal 2861 13743
15 Panchkula 1788 4684
16 Panipat 3668 12831
17 Rewari 4020 14008
18 Rohtak 4382 17929
19 Sirsa 10949 21734
20 Soni pat 6719 28201
21 Yamunanagar 2481 13339
Total 117209 422474
46
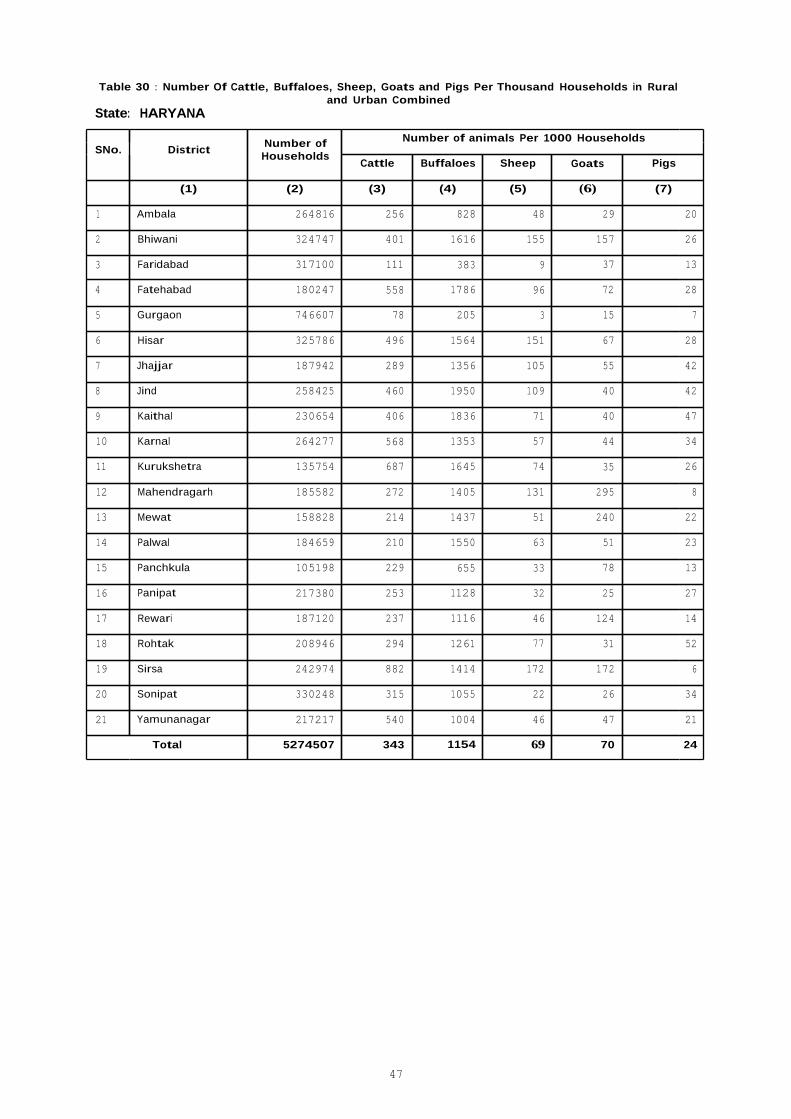
Table 30 : Number Of Cattle, Buffaloes, Sheep, Goats and Pigs Per Thousand Households in Rural and Urban Combined
State: HARYANA
SNo. District Number of Households
Number of animals Per 1000 Households
Cattle Buffaloes Sheep Goats Pigs
(1) (2) (3) (4) (5) (6) (7)
1 Ambala 264816 256 828 48 29 20
2 Bhiwani 324747 401 1616 155 157 26
3 Faridabad 317100 111 383 9 37 13
4 Fatehabad 180247 558 1786 96 72 28
5 Gurgaon 746607 78 205 3 15 7
6 Hisar 325786 496 1564 151 67 28
7 Jhajjar 187942 289 1356 105 55 42
8 Jind 258425 460 1950 109 40 42
9 Kaithal 230654 406 1836 71 40 47
10 Karnal 264277 568 1353 57 44 34
11 Kurukshetra 135754 687 1645 74 35 26
12 Mahendragarh 185582 272 1405 131 295 8
13 Mewat 158828 214 1437 51 240 22
14 Palwal 184659 210 1550 63 51 23
15 Panchkula 105198 229 655 33 78 13
16 Panipat 217380 253 1128 32 25 27
17 Rewari 187120 237 1116 46 124 14
18 Rohtak 208946 294 1261 77 31 52
19 Sirsa 242974 882 1414 172 172 6
20 Sonipat 330248 315 1055 22 26 34
21 Yamunanagar 217217 540 1004 46 47 21
Total 5274507 343 1154 69 70 24
47