Embed Size (px)
DESCRIPTION
HAPTER 3. Systems Development and Documentation Techniques. INTRODUCTION. Peralatan yang digunakan untuk melakukan dokumentasi adalah: Narasi (deskripsi tertulis) Flowcharts Diagram Material tertulis lain. INTRODUCTION. - PowerPoint PPT Presentation
Citation preview

© 2006 Prentice Hall Business Publishing Accounting Information Systems, 10/e Romney/Steinbart 1 of 138
C HAPTER 3
Systems Development and Documentation Techniques

© 2006 Prentice Hall Business Publishing Accounting Information Systems, 10/e Romney/Steinbart 2 of 138
INTRODUCTION
• Peralatan yang digunakan untuk melakukan dokumentasi adalah:– Narasi (deskripsi tertulis) – Flowcharts– Diagram– Material tertulis lain

© 2006 Prentice Hall Business Publishing Accounting Information Systems, 10/e Romney/Steinbart 3 of 138
INTRODUCTION
• Dokumentasi meliputi Siapa, Apa, Dimana, Kapan, Mengapa dan bagaimana:– Data entry– Processing– Storage– Information output– System controls

© 2006 Prentice Hall Business Publishing Accounting Information Systems, 10/e Romney/Steinbart 4 of 138
INTRODUCTION
• Bagaimana akuntan menggunakan dokumentasi – minimum, mereka dapat membaca dan mengerti
sistem bekerja.– Mereka harus mengevaluasi kekuatan dan
kelemahan dari pengendalian internal.• Sangat bergantung pada dokumentasi.
– Menyiapkan dokumnetasi:
. Memperlihatkan bagaimana sistem bekerja
. Memperlihatkan pemahaman mereka atas sistem pengendalian internal
© 2006 Prentice Hall Business Publishing Accounting Information Systems, 10/e Romney/Steinbart 5 of 138
INTRODUCTION
– Data flow diagrams
• Deskripsi grafis tentang sumber dan tujuan data. Yang diperlihatkan:– Dari mana data berasal
– Bagaimana data mengalirHow it flows
– Proses yang dilakukan atas data
– Kemana data akan pergi

© 2006 Prentice Hall Business Publishing Accounting Information Systems, 10/e Romney/Steinbart 6 of 138
INTRODUCTION
– Flowcharts
• Terdiri dari 3 tipe:– Document flowcharts memperlihatkan arus dokumen dan
informasi diantara departemen atau unit.
– System flowcharts memperlihatkan hubungan antara inputs, processing, dan outputs sebuah sistem.
– Program flowcharts memperlihatkan alur atau operasi logis yang dilakukan oleh program komputer.
© 2006 Prentice Hall Business Publishing Accounting Information Systems, 10/e Romney/Steinbart 7 of 138
DATA FLOW DIAGRAMS
• A data flow diagram (DFD) secara grafis memperlihatkan alur data dalam organisasi. Digunakan untuk:– Mendokumentasikan sistem yang ada – Merencanakan dan merancang sistem baru
• Tidak ada cara yang paling benar dalam mengembangkan DFD.

© 2006 Prentice Hall Business Publishing Accounting Information Systems, 10/e Romney/Steinbart 8 of 138
DATA FLOW DIAGRAMS
Customer1.0
ProcessPayment
2.0Update
A/R
CreditManager
Bank
AccountsReceivable
Customerpayment
Remittancedata
ReceivablesInformation
Deposit
• Example of a data flow diagram of the customer payment process from Figure 3-3 in your textbook

© 2006 Prentice Hall Business Publishing Accounting Information Systems, 10/e Romney/Steinbart 9 of 138
DATA FLOW DIAGRAMS
• DFD terdiri 4 elemen utama:– Sumber data dan Tujuan– Alur data – Proses transformasi– Penyimpanan data

© 2006 Prentice Hall Business Publishing Accounting Information Systems, 10/e Romney/Steinbart 10 of 138
DATA FLOW DIAGRAMS
• If two data elements flow together, then the use of one data flow line is appropriate.
CustomerProcessPayment
Cash Rec’t & Remittance Slip

© 2006 Prentice Hall Business Publishing Accounting Information Systems, 10/e Romney/Steinbart 11 of 138
DATA FLOW DIAGRAMS
• Data dictionary:– Arus data dan penyimpanan data umumnya
adalah kumpulan dari data elements.– EXAMPLE: A data flow labeled student
information berisikan such as student name, date of birth, ID number, address, phone number, and major.
– The data dictionary bersisikan deskripsi data elemen, penyimpanan data, dan alur data dalam sistem.

© 2006 Prentice Hall Business Publishing Accounting Information Systems, 10/e Romney/Steinbart 12 of 138
DATA FLOW DIAGRAMS
• Level tertinggi dari DFD adalah context diagram.– Memberikan rangkuman dari sistem .– Memperlihatkan sistem pemrosesan data dan
the external entities yang:• Sumber dari input• Tujuan dari output

© 2006 Prentice Hall Business Publishing Accounting Information Systems, 10/e Romney/Steinbart 13 of 138
DATA FLOW DIAGRAMS
PayrollProcessing
System
Depart-ments
HumanResources
Govt.Agencies
Employees
Bank
Manage-ment
Time cards
New employee form
Employee change form
Tax report &
payment
Employee checks
Payroll checkPayroll report
• This is the context diagram for the S&S payroll processing system (Figure 3-5 in your textbook).

© 2006 Prentice Hall Business Publishing Accounting Information Systems, 10/e Romney/Steinbart 14 of 138
DATA FLOW DIAGRAMS
1.0Updateempl.
Payrollfile
2.0Pay
Employ-ees
5.0Update
Gen.Ledger
4.0Pay
taxes
3.0Preparereports
Employee/Payroll file
GeneralLedger
HumanResources
Depart-ments Employees
Bank
Govt.Agencies
Manage-ment
EmployeeChange
form
New employeeform
Timecards
Employeepaychecks
Payrollcheck
PayrollDisburse-ment data
Payroll taxdisb. voucher
Tax report& payment
Payrollreport
This diagram shows the next level of detail for the context diagram in Figure 3-5.

© 2006 Prentice Hall Business Publishing Accounting Information Systems, 10/e Romney/Steinbart 15 of 138
DATA FLOW DIAGRAMS
• RULE 1: pahami sistem. Observasi arus informasi.
• RULE 2: abaikan proses pengendalian dan tindakan pengendalian (e.g., error corrections).
.

© 2006 Prentice Hall Business Publishing Accounting Information Systems, 10/e Romney/Steinbart 16 of 138
DATA FLOW DIAGRAMS
• RULE 4: buat terlebih dahulu context diagram first,
• RULE 5: identifikasikan dan beri label dari arus data.
• RULE 6: arus data yang memiliki alur yang sama harus dikelompokkan.

© 2006 Prentice Hall Business Publishing Accounting Information Systems, 10/e Romney/Steinbart 17 of 138
DATA FLOW DIAGRAMS
• RULE 7: Setiap proses seharusnya memiliki setidaknya sata arus data masuk dan satu arus data keluar.
• RULE 8: proses yang terjadi bersamaan dapat dikelompokkan dalam 1 lingkaran.
• RULE 9: berikan nomor pada setiap proses secara sikuensial.

© 2006 Prentice Hall Business Publishing Accounting Information Systems, 10/e Romney/Steinbart 18 of 138
DATA FLOW DIAGRAMS
• RULE 10: nama untuk proses harus menggunakan kata kerja update, prepare, etc.
• RULE 11: identifikasi dan beri labe pada penyimpanan data.
© 2006 Prentice Hall Business Publishing Accounting Information Systems, 10/e Romney/Steinbart 19 of 138
DATA FLOW DIAGRAMS
• RULE 13: gambar DFD dari atas ke bawah dan dari kiri ke kanan .

© 2006 Prentice Hall Business Publishing Accounting Information Systems, 10/e Romney/Steinbart 20 of 138
FLOWCHARTS
• A flowchart adalah teknik analitis yang menjelaskan beberapa aspek dari sistem informasi secara jelas dan logis.
• Flowcharts menggunakan simbol-simbol standar untuk memperlihatkan prosedur pemrosesan dan arus data.

© 2006 Prentice Hall Business Publishing Accounting Information Systems, 10/e Romney/Steinbart 21 of 138
FLOWCHARTS
• Terdapat 4 tipe simbol flowchart:– Input/output symbols– Processing symbols– Storage symbols– Flow and miscellaneous symbols

© 2006 Prentice Hall Business Publishing Accounting Information Systems, 10/e Romney/Steinbart 45 of 138
DOCUMENT FLOWCHARTS
• A document flowchart memperlihatkan arus dokumen dan informasi diantara beberapa bagian dari organisasi.
• Flowcharts ini melacak dokumen dan memperlihatkan :– Darimana dokumen berasal– Kemana didistribusikan – Bagaimana digunakan– Bagaimana disposisi akhirnya

© 2006 Prentice Hall Business Publishing Accounting Information Systems, 10/e Romney/Steinbart 46 of 138
This is part of the document flowchart from Figure 3-9 in your textbook.

© 2006 Prentice Hall Business Publishing Accounting Information Systems, 10/e Romney/Steinbart 47 of 138
GUIDELINES FOR PREPARING FLOWCHARTS
– Identifikasi:• Entitas yang akan dibuatkan bagan arus nya,
e.g., departments, functions, external parties• Arus Dokumen dan informasi• Proses

© 2006 Prentice Hall Business Publishing Accounting Information Systems, 10/e Romney/Steinbart 48 of 138
GUIDELINES FOR PREPARING FLOWCHARTS
– Gunakan kolum terpisah untuk setiap aktivitas.• Example: jika ada 3 departemen yang
memproses data maka akan ada 3 kolom

© 2006 Prentice Hall Business Publishing Accounting Information Systems, 10/e Romney/Steinbart 49 of 138
What are the entities in this flowchart?
© 2006 Prentice Hall Business Publishing Accounting Information Systems, 10/e Romney/Steinbart 50 of 138
GUIDELINES FOR PREPARING FLOWCHARTS
– Flowchart memperlihatkan proses yang normal dan pengecualian dibuatkan annotations.
– Alur dari atas ke bawah, dan dari kanan ke kiri.

© 2006 Prentice Hall Business Publishing Accounting Information Systems, 10/e Romney/Steinbart 51 of 138
GUIDELINES FOR PREPARING FLOWCHARTS
– flowchart harus jelas awalan dan akhirnya.• Memperlihatkan darimana dokumen berasal dan
ke mana berakhirnya.
– Satu pendekatan yang dapat digunakan adalah dengan membaca narasi dan untuk setiap langkah definisikan:
• Apa saja input nya • Apa proses yang dilaksanakan • Apa saja outputnya
© 2006 Prentice Hall Business Publishing Accounting Information Systems, 10/e Romney/Steinbart 52 of 138
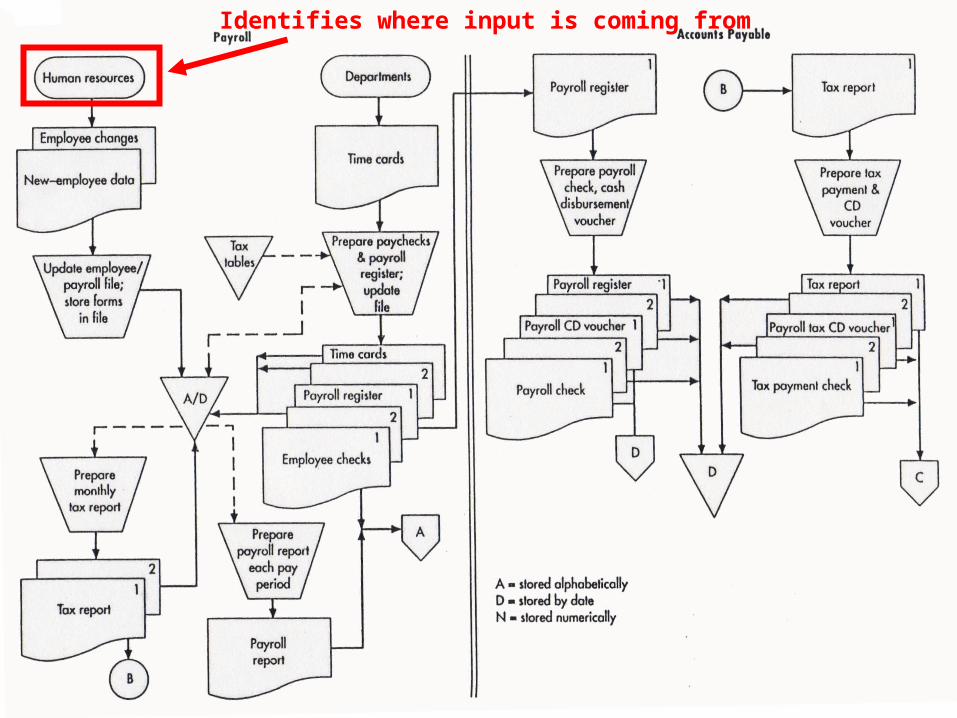
Identifies where input is coming from

© 2006 Prentice Hall Business Publishing Accounting Information Systems, 10/e Romney/Steinbart 53 of 138
Inputs

© 2006 Prentice Hall Business Publishing Accounting Information Systems, 10/e Romney/Steinbart 54 of 138
Process

© 2006 Prentice Hall Business Publishing Accounting Information Systems, 10/e Romney/Steinbart 55 of 138
Output tostorage

© 2006 Prentice Hall Business Publishing Accounting Information Systems, 10/e Romney/Steinbart 56 of 138
Input fornext
process

© 2006 Prentice Hall Business Publishing Accounting Information Systems, 10/e Romney/Steinbart 57 of 138
Process

© 2006 Prentice Hall Business Publishing Accounting Information Systems, 10/e Romney/Steinbart 58 of 138
Output
© 2006 Prentice Hall Business Publishing Accounting Information Systems, 10/e Romney/Steinbart 59 of 138
GUIDELINES FOR PREPARING FLOWCHARTS
– Setiap proses manual memiliki setidaknya satu input dan satu output.
– Perlihatkan semua data yang masuk atau diambil dari file komputer t.
– Jangan buat simbol proses untuk:• Mengantarkan dokumen ke entitas berikutnya • Menyimpan dokumen

© 2006 Prentice Hall Business Publishing Accounting Information Systems, 10/e Romney/Steinbart 60 of 138
Forwardinga document

© 2006 Prentice Hall Business Publishing Accounting Information Systems, 10/e Romney/Steinbart 61 of 138
Filinga document
© 2006 Prentice Hall Business Publishing Accounting Information Systems, 10/e Romney/Steinbart 62 of 138
GUIDELINES FOR PREPARING FLOWCHARTS
– Jika menggunakan beberapa dokumen, letakkan nomor dokumen di bagian kanan atas.

© 2006 Prentice Hall Business Publishing Accounting Information Systems, 10/e Romney/Steinbart 63 of 138
What happens to the document numbers as the documents
move to other locations?

© 2006 Prentice Hall Business Publishing Accounting Information Systems, 10/e Romney/Steinbart 64 of 138
GUIDELINES FOR PREPARING FLOWCHARTS
– Buat on-page connectors dan beri labe secara jelas untuk mencegah garis alur kerja yang berlebihan.

© 2006 Prentice Hall Business Publishing Accounting Information Systems, 10/e Romney/Steinbart 65 of 138

© 2006 Prentice Hall Business Publishing Accounting Information Systems, 10/e Romney/Steinbart 66 of 138
GUIDELINES FOR PREPARING FLOWCHARTS
– Gunakan off-page connectors jika alur berpindah ke halaman yang lain.

© 2006 Prentice Hall Business Publishing Accounting Information Systems, 10/e Romney/Steinbart 67 of 138
Are there other off-page connectors on
this flowchart?


![Z d v } ( Z v P o ] Z > v P µ P · 3 ontents ontents 3 the Structure hapter 01. the Tenses of the English Language 4 hapter 02. the Types of Verbs 14 hapter 03. the Main Verbs 15](https://img.pdfslide.us/doc/110x75/5e84c2143f839c3783323ce6/z-d-v-z-v-p-o-z-v-p-p-3-ontents-ontents-3-the-structure-hapter-01.jpg)