Embed Size (px)
Citation preview

The Greek Review of Social Research, 113, 2004, 145-165
INTRODUCTION
The debate on globalization and the associated processes of social andeconomic changes had given the study of internal differentiation of cities newlife. Moreover, the growth of immigrants in all West European countries and inparticular their concentration to specific neighbourhoods –often the poorestareas in the cities– has further raised attention to the social structure of bigcities. The widespread perception is obviously that globalization first of allmanifests itself through the economic sphere and thus puts a strong pressure onlocal economies. The latter are forced to adjust by trimming the labour marketregulation, by opening their markets in order to introduce more competitionand so on. The result is rising inequality either by exclusion of labour or bygrowing differentiation in earnings; the highly trained and competitivespecialists in the financial sector can raise their salaries strongly while theemployed in simpler services will experience a decline in real earnings as theyare exposed to global competition (Sassen, 1991; Mollenkopf and Castells,1991; Fainstein and Harloe, 1992). Finally, this will break the city up intosocial communities of quite different living conditions (cf. Lovering, 1997) andcities will experience growing segregation. The outcome has been labelled thedual city (Mollenkopf and Castells, 1991) or the divided city (Fainstein andHarloe, 1992; Musterd et al., 1999).
The dominant position was clearly promoted by the tempting book “TheGlobal City” (Sassen, 1991), which argues that economic restructuring andsocial change are part and parcel of the same process, namely that ofglobalization that leads to the emergence of a new hierarchy of leading
Hans Thor Andersen*
SPATIAL – NOT SOCIAL POLARISATION: SOCIAL CHANGE AND SEGREGATION
IN COPENHAGEN
* Department of Geography, University of Copenhagen, [email protected]
7. Andersen 27-06-07 10:43 Σελίδα 145

HANS THOR ANDERSEN
metropolises (“global cities”). The global orientation does also mean thatdifferent social and urban structures develop; the highly paid managers andfinancial specialists demand a large number of available services, wellprotected luxury apartments and shopping malls. Thus the physical structure ofthe city becomes marked by the globalization and polarisation processes.
However, while the argumentation for social polarisation was taken forgranted as a necessary consequence of adjustment to the global division oflabour, little empirical evidence has been provided except studies of incomethat demonstrated rising levels of inequality and thus seemed to confirm thepolarisation thesis. Most of the early studies were American, but despite this,polarisation and its causes were formulated as universal phenomena. However,it soon appeared to be difficult to find examples of income polarisation inEurope; in most cases income became more unequally distributed (cf. Hamnettin this volume). The reason for a different European social development wasfound in the construction of the welfare state. Thus welfare was understood asthe main reason for maintaining a higher level of social cohesion. Moreover,differences in welfare regimes were considered of major importance forsegregation in West European cities (cf. Musterd and Ostendorf, 1998).
The widely used concepts of polarisation, fragmentation and dual society(O’Loughlin and Friedrichs, 1996; Musterd and Ostendorf, 1998) does notbring much clarity; unless explicitly outlined, these concepts remains blurred:Pahl (1988) discussed possible changes of the social structure and found thatsocial polarisation could take different forms: A simple and most oftenassumed form is that of a growing upper and lower classes, while the middleclass is diminishing. But alternatively social polarisation can refer to a situationwhere a dominant middle class, based on double earnings and homeownership, separates itself from declining lower strata: They are sliced off andfind themselves outside normal life expectations.
This paper will focus on the issue of social change and discuss how validthe claim for social polarisation is; the first part of the article is thus adiscussion of social changes in major cities in relation to the processes ofglobalization. Then, after a brief introduction to the overall structure ofCopenhagen region, the article studies the changing social structure of GreaterCopenhagen and its earnings and income pattern during the last two decades inorder to discuss the social impact of globalization and economic restructuring.Moreover, the changes in the city’s spatial structure are discussed in relation tohousing tenure. The article concludes that there are no signs of socialpolarisation in Greater Copenhagen in terms of wage and income distribution.Yet, there are growing disparities between the various residential areas of the
146
7. Andersen 27-06-07 10:43 Σελίδα 146

SPATIAL – NOT SOCIAL POLARISATION
city and the observed social differences can mainly be traced in theresidualisation of the rented housing sector.
GLOBALIZATION AND SOCIAL CHANGE
Globalization is the result of gradual reductions of national barriers to economicactivities. This removes the possibility to maintain national monopolies byopening up to outside competitors. Globalization has also an impact on thelabour market; rising demand for flexibility, competence and efficiency haveled to a growing number of people marginalised in relation to the labourmarket. Marginalisation as a consequence of economic restructuring isconsidered to be the main cause behind social polarization: A rising number ofhigh income earners and a even faster growing number of excluded at the otherend of the scale. The latter are often understood as “new poverty” or excludedor “advanced marginalisation” (Wacquant, 1996) because this extreme formprimarily is found in the most developed or advanced countries. Thus thegrowth of poverty in such terms cannot be neglected as sign of “backwardness”that is bound to be overcome by future economic development. This change insocial conditions is reflected in intensified segregation (“hyper segregation”),where social differences between neighbourhoods are rising. Changes inWestern Europe has been more moderate than in Latin America, but the risingsocial differences are evidently reflected in the social landscape of the cities:While the inner cities represented earlier the poorest and least attractiveneighbourhoods, this role was in general taken over from the 1970s by newerestates at the periphery. These estates served well as providers of modernstandard dwellings for low income groups, workers and employees during the1960s and 1970s (Vestergaard, 1998). However, due to a massive out-migrationof middle class families with good income, many public housing estates haveprogressively turned into high concentrations of economically inactive people,single parents, immigrants and people on public benefits. To some the fate ofthese estates illuminates the fall of the welfare state.
All over the western world such social changes have produced a commonunderstanding and were linked to an overall process: globalization. The cities inWestern Europe now consider themselves as participants in a territorial orinterurban competition on the European level due to EU’s single market. Thelargest ones even consider themselves as global players. In the wake of theglobalization discourse, local policy is transformed in an attempt to meet thechallenges from territorial competition; still more localities invest in “placemaking”, i.e. in the promotion of specific advantages for investors in their locality.
147
7. Andersen 27-06-07 10:43 Σελίδα 147
HANS THOR ANDERSEN
Currently most localities are seeking to trim their labour market towardflexibility, to improve the general level of education and to support the extentand quality of research, in particular within expected fields of growth such asbio-tech, computing, communication, sometimes including also culturalproduction such as music, film production etc. In order to achieve this flexibleefficiency urban politics in most cities were transformed into networking,privatisation, joint public-private projects and partnerships (Andersen and vanKempen, 2001). Governance is not just a label but a kind of regulation officiallystrived for (cf. By-og. boligministeriet, 1999). The shift to governance is a signthat governments take a proactive role and attempt to increase their capacitythrough involving non-governmental partners in policy implementation.However, this does also mean that growth coalitions which stress “productive”investments (e.g. infrastructure development or place making) also change thepolitical agenda. The transformation of urban politics leads to a shifted focus asa consequence of inviting profit based organisations into politics; instead of apolitical combat between various political parties, urban politics has become aquestion of mobilising local resources in the struggle for investments andemployment. (Mayer, 1995).
Although the first thoughts about an emerging class of “world cities” wereformulated by Friedman and Wolf (1982) the discussions on globalization inrelation to cities were triggered by Sassen’s “The global city” (1991). Sheunderstood ongoing changes of the big cities as a result of a shift in theeconomy: Advanced communicational technology allows still more decisions tobe concentrated in the “command posts” of the global economy, i.e. New York,London and Tokyo. These cities have an over-average share of stock dealers,financial advisers, banking experts, consultancy, advanced services, politicaland economic decision makers in global leading corporations etc. The globalcities thus contain a unique concentration of economic and political power,expertise in business and research. However, this concentration did alsotransform the economy and the labour market to a dual structure; at the upperend long educated specialists with high incomes, whose daily routine is stressedand therefore need to “out source” whatever they can: Cleaning, washing,shopping and cooking and taking care of children. These functions are thencarried out by a number of low skilled, sometimes half way illegal groups, whooften lack basic rights and suffer from low wage and precarisation in the labourmarket. Restaurant attendants, guards, sales staff in shopping malls representalso a part of the labour market with few skilled and well paid workers. The cityis thus transformed according to the needs of the elite at the expense of themiddle and the working class.
148
7. Andersen 27-06-07 10:43 Σελίδα 148
SPATIAL - NOT SOCIAL POLARISATION
This deterministic vision of the global city has been criticised, most directlyby Hamnett (1994) who found signs of upgrading of former unskilled labourand not exclusion in his Amsterdam/Randstad Holland study. Althoughsomewhat reformulated later on (cf. Hamnett, 1996), the main conclusionremains: Contrary to what Sassen and other proponents of the “dual city”-thesis(e.g. Moellenkopf and Castells, 1991) have claimed, empirical evidence of anemergence of a dual social structure rooted in a polarisation of workingconditions within Western European cities is difficult to find. The share ofunskilled workers is declining, while the overall level of skills is rising.Combined with high unemployment and the debate on social exclusion, thesense of a society falling apart is an obvious conclusion. Some countries inWestern Europe have experienced rising income difficulties during the 1980sand 1990s, but others have not. However, none of the countries saw a decline inskills of the active population. A later round of debate has included theinstitutional settings and especially the welfare state regime to explain theclearly different outcome of globalisation on social relations in Europe (cf.Esping-Andersen, 1990 and 1999; Musterd and Ostendorf, 1998). The mainconclusion is that social change in the US and the European Union has differentforms and that these forms depend on institutional arrangements, historicaltraditions as well as present social conditions and government policy. Moreoverand most important here, globalisation is not a pre-defined destiny of risinginequalities that will transform all localities into US-like ones: globalization israther a set of processes performed by localities and thus reflecting local social,economic and political conditions. Instead of taking localities as defencelessvictims, they can be seen as having opportunities to react and even to influencethe pace and direction of globalization.
Thus, the relationship between globalisation and a corresponding socialchange within a locality is not a 1:1 relation (van Kempen, 1994): First of allbecause local institutional differences, e.g. welfare state arrangements andtraditions, influence how, and if, enforced economic competition will manifestitself through social inequality. Taxation and redistribution of costs and benefitsmay prevent rising social differentiation to occur at all. Hence, it is not externalprocesses that determine the outcome of economic restructuring, but politicalchoice or decision making. Second, even when globalisation has led tosignificant social changes, e.g. in terms of unemployment, rising incomedifferentiation etc, this is far from being identical to spatial polarisation. First ofall, the social patterns of cities are remarkably stable over long periods due toestablished patterns of housing quality, types of tenure and rent levels. Thus,changes within the labour market, that have a direct and important effect on
149
7. Andersen 27-06-07 10:43 Σελίδα 149

HANS THOR ANDERSEN
incomes, may not impact the housing market on short term: People whoseincome grows or falls are rarely forced to move, but have other opportunities asfinding additional income (perhaps part time work or loans) or reducing costs(e.g. selling their car, choosing cheaper holidays and so on). Thus, there is
150
FIGURE 1Metropolitan Copenhagen
7. Andersen 27-06-07 10:43 Σελίδα 150

SPATIAL - NOT SOCIAL POLARISATION
probably no sense in assuming a specific, spatial outcome of a vaguely definedconcept as globalization, which involves many intermediary levels ofdetermining factors and processes.
GLOBALISATION AND SOCIAL CHANGE IN COPENHAGEN
Social structure of Greater Copenhagen
The Greater Copenhagen Region has about 1,8 million inhabitants, or one-thirdof the population of Denmark. This gives the city a unique position within thecountry, as the national capital with many government functions as well asnational banking and business functions, but also as the one big city in Denmark.
Until 1940, when the population of Copenhagen first exceeded 1 million,the city had grown steadily by the continuous addition to the existing built-uparea of new concentric zones of industry, housing and institutions. The well-known “Fingerplan” of 1947 initiated large-scale planning for the region, basedon public transport provision. Most suburban growth only started after 1940,and it has been strongly influenced by the concept behind the Fingerplan -local community centres are located at railway stations, industry and denseresidential areas are close to these centres and less dense (often semi-detached)housing is found further away. This pattern was first broken in the late 1960swhen private car ownership became common and the areas between the“fingers” were partly developed for urban use. However, there was oneexception to this overall schema: already in the 1920s and 1930s the upper andupper-middle classes had started to be involved in suburbanization, and theywere massively concentrated in the northern suburbs. This in turn meant that
151
2000
1800
1600
1400
1200
1000
800
600
400
200
0
1900 1920 1940 1960 1980 2000
Copenhagen City
Central and Copenhagen County Mertopolitan Copenhagen
Central municipalities
(000)
FIGURE 2Metropolitan Copenhagen, population 1901-2000 (1000)
7. Andersen 27-06-07 10:43 Σελίδα 151

HANS THOR ANDERSEN
the northern suburban municipalities were fully built up by the late 1950s andthis, coupled with their relative administrative independence, prevented themfrom being the site of social housing construction (Andersen, 1991).
The urban growth of the 1950s and 1960s ended in the early 1970s by asudden stop of the economic boom due to the oil crisis of 1973-74. A numberof grand projects were postponed or reduced substantially such as theambitious regional plan which foresaw a fast expansion in the 1970s and1980s. In stead, there was stagnation in population growth, while a substantialdecline in manufacturing employment, which was not compensated by risingemployment in the public sector as elsewhere in the country, led to a sharp risein unemployment. A number of political struggles around the built environmentand in particular the renewal policy in the City of Copenhagen accentuated theeconomic decline of the capital. However, the cost of deindustrialisation wasmostly felt in the central boroughs that practically lost all of their manu-facturing industry: The suburban areas did not feel the negative consequencesof economic restructuring.
In the early 1990s, the City of Copenhagen went bankrupt; the debt washuge and growing, demands for social services rising and income throughtaxation declining. However, the national urban policy had taken a u-turn in thelate 1980s/ early 1990s; the leading parties in the parliament recognized thatCopenhagen had become one of the poorest areas with the highestunemployment rate. At the same time the central government had primarilydirected its infrastructure investments to the provinces. During the same periodthe government also realized that the emergent Single Market was leading toan intensified competition between regions and localities; in this competition
152
FIGURE 3Greater Copenhagen, employment by sector 1983-2001
Argicu
lture
etc.
Man
ufac
turin
g, co
nstru
ction
Who
lesa
le
Retail
Tran
spor
t and
com
munica
tion
Bank, fin
ance
and
bus
ines
s
Educa
tion
Health
Social
ser
vices
Public
adm
.
Other
s
perc
enta
ge
25
20
15
10
5
0
1983
1993
2001
7. Andersen 27-06-07 10:43 Σελίδα 152
SPATIAL - NOT SOCIAL POLARISATION
Copenhagen was the only truly international card the government could play(Hansen, Andersen and Clark, 2001).
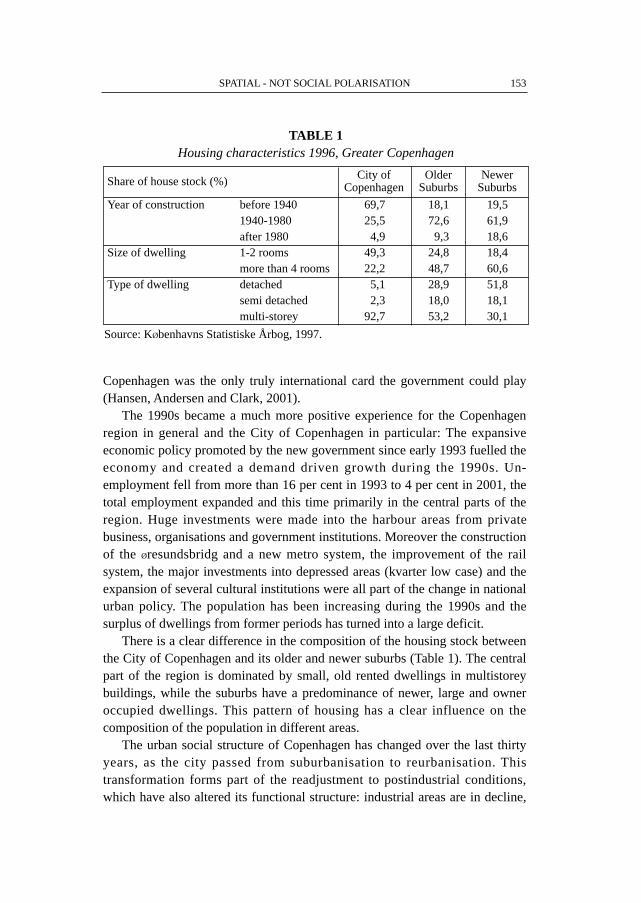
The 1990s became a much more positive experience for the Copenhagenregion in general and the City of Copenhagen in particular: The expansiveeconomic policy promoted by the new government since early 1993 fuelled theeconomy and created a demand driven growth during the 1990s. Un-employment fell from more than 16 per cent in 1993 to 4 per cent in 2001, thetotal employment expanded and this time primarily in the central parts of theregion. Huge investments were made into the harbour areas from privatebusiness, organisations and government institutions. Moreover the constructionof the Øresundsbridg and a new metro system, the improvement of the railsystem, the major investments into depressed areas (kvarter low case) and theexpansion of several cultural institutions were all part of the change in nationalurban policy. The population has been increasing during the 1990s and thesurplus of dwellings from former periods has turned into a large deficit.
There is a clear difference in the composition of the housing stock betweenthe City of Copenhagen and its older and newer suburbs (Table 1). The centralpart of the region is dominated by small, old rented dwellings in multistoreybuildings, while the suburbs have a predominance of newer, large and owneroccupied dwellings. This pattern of housing has a clear influence on thecomposition of the population in different areas.
The urban social structure of Copenhagen has changed over the last thirtyyears, as the city passed from suburbanisation to reurbanisation. Thistransformation forms part of the readjustment to postindustrial conditions,which have also altered its functional structure: industrial areas are in decline,
153
Share of house stock (%) City of Older NewerCopenhagen Suburbs Suburbs
Year of construction before 1940 69,7 18,1 19,51940-1980 25,5 72,6 61,9after 1980 4,9 9,3 18,6
Size of dwelling 1-2 rooms 49,3 24,8 18,4more than 4 rooms 22,2 48,7 60,6
Type of dwelling detached 5,1 28,9 51,8semi detached 2,3 18,0 18,1multi-storey 92,7 53,2 30,1
TABLE 1Housing characteristics 1996, Greater Copenhagen
Source: KØbenhavns Statistiske Årbog, 1997.
7. Andersen 27-06-07 10:43 Σελίδα 153

HANS THOR ANDERSEN
while new office and service development is taking place at the harbour, invarious inner-city locations, and in some favoured locations in the suburbs.
INCOME AND WAGE IN GREATER COPENHAGEN 1981-1999
Income and wages are concepts used by most people to describe anindividual’s or a household’s purchase power. The distinction between the twois not always clear and many people are not aware of it. However, in a straightstatistical sense the two concepts express different things which in turn make itnecessary to use them carefully. A simple definition is that wage or earnings isa payment of labour for work, usually on weekly, monthly or annually basis.
154
FIGURE 4Income change by decile 1981-1997 individuals
FIGURE 5Income change by decile 1981-1997 households
0
20
40
60
80
100
120
140
160
1. Decil 2. Decil 3. Decil 4. Decil 5. Decil 6. Decil 7. Decil 8. Decil 9. Decil
1981-89 1981-94 1981-97
0
50
100
150
200
250
1. Decil 2. Decil 3. Decil 4. Decil 5. Decil 6. Decil 7. Decil 8. Decil 9. Decil
1981-89 1981-94 1981-97
perc
enta
ge
perc
enta
ge
7. Andersen 27-06-07 10:43 Σελίδα 154

SPATIAL - NOT SOCIAL POLARISATION
Only employed people will have a wage. Income on the other hand includes allsorts of revenues-wages, profits, dividend, transfers from public authorities.The number of people having an income is much higher than the number ofemployed persons. Income can be measured in many ways; the simplest, as thesum of all sources, is the gross income. But other forms are possible, e.g.income after taxation, net income (after certain reductions before taxation).Thus any comparison has to acknowledge the type of revenue cautiously.Earnings and income are only indicators, but they seem relatively reliableindicators for differences in life options and the easiest available measure.
The two figures show the development of income in fixed prices in GreaterCopenhagen from 1981 to 1997 for individuals and households distributed bydecile. Both figures demonstrate a quite similar rate of income growth: Inparticular the individual incomes have developed at nearly identical ratesindependently of the deciles studied. During the 1980s income grew by 75-80per cent in Greater Copenhagen, while they increased between 110-125 percent during the whole period. The growth rate of the various deciles shows aremarkable pattern; the lower income deciles have the highest growth. Thesecond figure shows the pattern of income growth for household by decile.Household income growth reveals a different pattern; the higher the income thefaster the growth rate: In the 1980s the lowest decile presented an incomegrowth of about 50 per cent while the high incomes rose by approximately 80per cent. The growth rates of household income point at a rising, but stillmoderate, level of inequality. Most interestingly the lower individual incomespresented a faster increase than the higher and especially the middle incomes
155
FIGURE 6Greater Copenhagne, wage distribution 1981 and 1999, males, full time
Total employed, 1981 Total employed, 1999
0
5
10
15
20
25
30
p
0
1-24
,999
25,0
00-4
9,99
9
50,0
00-7
4,99
9
75,0
00-9
9,99
9
100,
000-
124,
999
125,
000-
149,
999
150,
000-
174,
999
175,
000-
199,
999
225,
000-
249,
999
200,
000-
224,
999
275,
000-
299,
999
325,
000-
349,
999
375,
000-
399,
999
350,
000-
374,
999
425,
000-
449,
999
400,
000-
424,
999
475,
000-
449,
999
250,
000-
274,
999
500,
000
300,
000-
324,
999
450,
000-
474-
999
perc
enta
ge
7. Andersen 27-06-07 10:44 Σελίδα 155

HANS THOR ANDERSEN
from the late 1980s: This trend, i.e. the lowest income groups having thehighest growth rates, is contrary to the trend generally assumed in theliterature. The reason behind this pattern of income growth in Copenhagen isprimarily income transfer from government; thus the pattern of incomedevelopment reveals the impact of the welfare state.
156
1981 1999
Males Females Males Females
N % N % N % N %
Full time 303.448 72,2 191.688 45,2 314.902 67,7 292.241 63,8
Part time 14.676 3,5 99.976 23,6 30.626 6,6 49.274 10,8
Unknown 102.364 24,3 132.453 31,2 119.932 25,8 116.625 25,5
Total 420.488 100,0 424.117 100,0 465.460 100,1 458.140 100,1
TABLE 2Greater Copenhagen; employed persons in full and part time work
1981 and 1999
Source: Danmarks Statistik.
FIGURE 7Greater Copenhagne, wage distribution by main sectors
1981 and 1999, males, full time
Manufacturing industry, 1999 Business services, 1999 All employed, 1981Manufacturing industry, 1981 Business services, 1981
0
5
10
15
20
25
30
35
0 9 9 9 9 9 9 9 9 9 9 9 9 9 9 9 9 9 9 9 9 +
pg
0
1-24
,999
25,0
00-4
9,99
9
50,0
00-7
4,99
9
75,0
00-9
9,99
9
100,
000-
124,
999
125,
000-
149,
999
150,
000-
174,
999
175,
000-
199,
999
225,
000-
249,
999
200,
000-
224,
999
275,
000-
299,
999
325,
000-
349,
999
375,
000-
399,
999
350,
000-
374,
999
425,
000-
449,
999
400,
000-
424,
999
475,
000-
449,
999
250,
000-
274,
999
500,
000
300,
000-
324,
999
450,
000-
474-
999
perc
enta
ge
7. Andersen 27-06-07 10:44 Σελίδα 156

SPATIAL - NOT SOCIAL POLARISATION
In contrast to income statistics, earnings statistics only include employedand self employed people and thus reflect changes only in the labour market.Figure 6 shows the earnings distribution in 1981 and 1999. The 1981distribution shows a pattern resembling to a normal distribution where adominant share of the employed had an income level close to the median. Thewage level in 1999, in fixed prices, was clearly above the 1981 level: Fewerpeople earned less in 1999 than in 1981, and a large number of the employedhad a bigger wage in 1999. In other words the overall income level has grown,but the wage distribution has become more spread with no signs of polarisationhowever.
Figure 7 shows the distribution of employed persons per wage interval(deflated figures) for 1981 and 1999 in two main sectors; manufacturing andbusiness services. Generally it is assumed that manufacturing industry is thearchetype of fordist production while business services represent thepostfordist production. The data show that manufacturing industry has a muchmore similar wage structure than business services (note that the data includeonly full time males). The strong labour unions and their ability to maintainegalitarian agreements on the labour market puts a clear mark on the earningdistribution. The share of the employed with income above median income ishigher in business services than in manufacturing. The changes 1981-99 showfirst of all a general trend towards a more spread wage distribution, but therelation between business and manufacturing in terms of earning distributionremains unchanged.
To sum up: although earnings have not been equally distributed during theperiod, and perhaps have become slightly more unequal, there is no sign ofwage polarisation due the economic restructuring. The wage distribution hasbecome more differentiated, but still with a marked peak value. Globalizationhas thus not created a dual or divided labour market in Greater Copenhagen.
The total number of the employed rose from 844.000 in 1981 to 923.000 in1999; most of the new jobs have been taken over by males. However, the mostinteresting fact is the decline of part time work; from about 115.000 to 80.000.This trend runs also against assumed changes; males have traditionally a quitelow share of part time employment which has slightly increased. On the otherhand females have substantially lowered their percentage in part timeemployment from 23,6 per cent in 1981 to less than 11 per cent in 1999.Altogether this seems to imply that “normal” forms of employment havesurvived as the dominant type of work, and that females have almost reachedmales’ rate of full time work.
157
7. Andersen 27-06-07 10:44 Σελίδα 157

HANS THOR ANDERSEN
SOCIAL CHANGE AND SEGREGATION IN GREATER COPENHAGEN
Social changes in the wake of globalization processes do not seem to haveproduced a polarized city in the Greater Copenhagen region. Economicrestructuring, which has completely deindustrialised the central parts of theregion and significantly reduced manufacturing in the suburban areas, has notproduced a dual wage structure or led to substantial rise in part time work. Andwomen have not been reduced to a marginal position at the labour market ingeneral; their labour market situation has become similar to males. Neither thewage nor the income distributions show signs of polarisation; there is agrowing concentration of earnings around the median throughout the period1981-99. However, the wage distribution has become less equal as aconsequence of a growing proportion of highearners. Nevertheless, incomeshave also become less equitably distributed at a sub-metropolitan level: whilethe overall income distribution at metropolitan and even at municipal level isstable throughout the last two decades, income differences betweenneighbourhoods have grown considerably.
The impact of the spatial dimension can be examined by a more detailedanalysis of changes between rather homogeneous residential entities, i.e. the160 neighbourhoods studied here that are scattered all over Greater
158
Designation of Decile quotient
Income Incomeneighbourhoods relations 1981 relations 1999
Extreme high income < 0,25 0,65 0,64
Very high income 0,25 - 0,5 7,79 25,64
High income 0,5 - 0,8 29,87 16,03
Above average 0,8 - 1,25 18,83 9,62
Below average 1,25 - 2,0 22,08 11,54
Low income 2,0 - 4,0 18,83 22,44
Very low income 4,0 - 10,0 1,94 12,82
Extreme low income > 10,0 0,0 1,28
TABLE 3Income characteristics of neighbourhoods in Greater Copenhagen
1981 and 1997
Number of neighbourhoods was 1981: 154 and 1997: 156. Source: Own calculations ondata from Statistiscs Denmark. Definition of decile quotient from Delade Städer,Stockholm, 1997
7. Andersen 27-06-07 10:44 Σελίδα 158
SPATIAL - NOT SOCIAL POLARISATION
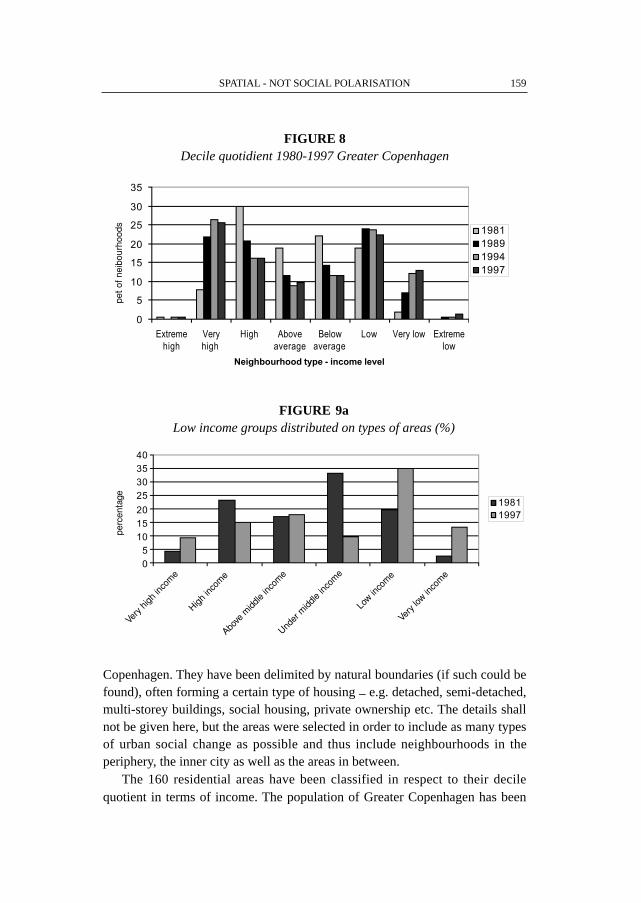
Copenhagen. They have been delimited by natural boundaries (if such could befound), often forming a certain type of housing – e.g. detached, semi-detached,multi-storey buildings, social housing, private ownership etc. The details shallnot be given here, but the areas were selected in order to include as many typesof urban social change as possible and thus include neighbourhoods in theperiphery, the inner city as well as the areas in between.
The 160 residential areas have been classified in respect to their decilequotient in terms of income. The population of Greater Copenhagen has been
159
FIGURE 8Decile quotidient 1980-1997 Greater Copenhagen
0
5
10
15
20
25
30
35
Extremehigh
Veryhigh
High Aboveaverage
Belowaverage
Low Very low Extremelow
Neighbourhood type - income level
1981198919941997
FIGURE 9aLow income groups distributed on types of areas (%)
05
101520
25303540
19811997
19811997
Above
midd
le in
com
e
Under
midd
le in
com
e
Low in
com
e
Very
low in
com
e
Very
high
inco
me
High
inco
me
pet
of n
eib
ourh
oods
perc
enta
ge
7. Andersen 27-06-07 10:44 Σελίδα 159

HANS THOR ANDERSEN
sorted according to income; the 10 per cent with the lowest income form decile1, the next 10 per cent decile 2 and so on. Then, the number of people havingan income belonging to decile 1, 2, 3 etc at the metropolitan level wascalculated for each neighbourhood. Finally, the decile quotient was calculatedas the number of income earners belonging to the lowest 20 per cent (deciles 1and 2) in relation to the highest 20 per cent (deciles 9 and 10). Residentialareas with a decile quotient around 1,0 are balanced, i.e. they have an equalnumber of people with high and low income. Where the decile quotient isabove or lower than 1,0 the neighbourhoods can be characterised as poor oraffluent areas respectively (Table 3).
160
FIGURE 9bHigh income groups distributed on types of areas (%)
05
101520
25303540
19811997
FIGURE 10Danish and Foreign citizens 1997 after neighbourhood income level
0
5
10
15
20
25
30
35
Very high High Above average Below average Low Very low Extreem low
Foreign citizens Danish citizens
High
inco
me
Above
midd
le in
com
e
Under
midd
le in
com
e
Low in
com
e
Very
low in
com
e
Very
high
inco
me
perc
enta
ge
perc
enta
ge
7. Andersen 27-06-07 10:44 Σελίδα 160

SPATIAL - NOT SOCIAL POLARISATION
The decile quotient is a simple indicator for social balance at the neigh-bourhood level. While the middle income group –the balanced type of areawhich includes the four middle categories in table 3 ranging from low income tohigh income– included 138 out of 156 areas in 1981 (i.e. 89 per cent), that sharewas down to 59 per cent in 1997. Thus, there is a clear indication that the middleis shrinking while the extremes are growing. The growth is particularlynoticeable at the upper end: Neighbourhoods classified as areas with very highincomes have trebled in number at the expense of neighbourhoods with averageincome. At the same time, the number of neighbourhoods with very low incomeswas also clearly rising. This trend is especially remarkable for the affluentcitizens who presumably have a choice in terms of residential location and whoseem to voluntarily follow the option of their social seclusion.
161
FIGURE 11aSocial housing tenants distributed by neigbourhood income level
0
10
20
30
40
50
60
70
Extreemhigh
Very high High Aboveaverage
Belowaverage
Low Very low Extreemlow
1981198919941997
FIGURE 11bDetachted housing tenants by neigbourhood income level
0
10
20
30
40
50
60
70
80
90
Extreemhigh
Very high High Aboveaverage
Belowaverage
Low Very low Extreemlow
1981198919941997
perc
enta
geperc
enta
ge
7. Andersen 27-06-07 10:44 Σελίδα 161

HANS THOR ANDERSEN
At the neighbourhood level the differences between the poorest and mostaffluent areas have increased. All areas contain adults with lower incomes, onereason being the presence of pensioners and students. As a consequence, thereare no areas consisting only of top earning people.
Figure 9 shows the income profile situation in 1981; in the more affluentareas (areas with very high and extremely high income) the share of highincome earners (deciles 9 and 10) ranged between 30 and 50 per cent of totalearners and in the poor neighbourhoods it was about 10 per cent. The share oflow income earners (deciles 1 and 2) was around 20 per cent at both ends ofthe scale. During the following 16 years (1997 is the last year of comparableincome data) two things happened: First, the share of low income earnersslightly rose in the neighbourhoods characterised as “very low income” and“extremely low income”. But as the absolute numbers are rather small, firmconclusions should be avoided. Second, the number of high income earners inpoor neighbourhoods has clearly diminished and the bulk of high incomeearners concentrated in the “high income” and “very high income” areas. Itshould be stressed that the decisive factor in this towards an increasing socialimbalance at the neighbourhood level is not the unequal distribution of lowincome earners between neighbourhoods, but that of high income earners.
Immigrants and refugees have concentrated in the poorest areas over time;
in 1981 immigrants accounted for 11 per cent of the population living in
neighbourhoods with low, very low or extremely low income. Their share
increased to nearly 16 per cent of the total population in 1997, but in the areas
characterised by very low and extremely low income their share was
respectively 21 and 51 per cent of the population. Figure 10 shows that in 1997
a significantly smaller share of Danes lives in the poorest areas, while the
immigrants are strongly under represented in the more affluent neighbour-
hoods.
Figure 11 shows detached housing tenants and tenants in public housing
distributed according to the income type of neighbourhood. The difference
between the two distributions is remarkable, as with few exceptions the
population of the detached housing is living in affluent areas while social
housing is predominately situated in neighbourhoods of low, very low and
extremely low income. These figures confirm that housing plays an important
role for the social structuration of cities in Western Europe; the residualisation
process was not avoided by the Scandinavian welfare states.
162
7. Andersen 27-06-07 10:44 Σελίδα 162

SPATIAL - NOT SOCIAL POLARISATION
CONCLUSION
Much in contrast to the debate on local consequences of globalization andsubsequent economic restructuring, earnings in Greater Copenhagen have notbecome polarized, and hardly more unequal during the last two decades.Although earnings from manufacturing had, as expected, a more concentrateddistribution than earnings from business services, the two distributions notdiffering radically however. The major changes can be summarised in thegrowth of the number of high wage earners and in the wider range in thedistribution of earnings. The result of the full integration of Copenhagen intoglobal markets has therefore not been a substantial redistribution of the wagepattern. The city has experienced economic and social problems in the wake ofthe transition from manufacturing to service economy, but the adjustment tothe new postindustrial condition has neither caused the deterioration ofwomen’s place in the labour market nor the significant growth of part timework. On the contrary, part time work for women substantially diminishedbetween 1981 and 1999.
The distribution of household income evolved more or less in the same wayas the distribution of individual earnings and remained relatively similar to thesituation in the early 1980s. There are however two interesting features; thefirst is that the lowest incomes presented the highest growth rate, and thesecond is that household income grew less for the middle income groups andmore for the upper ones as in other OECD countries.
The data presented in this paper demonstrate that Copenhagen has notexperienced changes in wage and income distribution that can justify the claimabout social polarisation in the 1980s and 1990s. However, the spatialdistribution of the social structure has shown clear signs of polarisation duringthe same period in terms of the changing distribution of residential areas(neighbourhoods) in different income profile types. A growing share ofresidential areas became either affluent or poor while the middle income areashave decreased markedly.
The welfare state regime has been argued as a dominant factor behinddifferent levels of inequality in the western countries. However, in the light ofthe data provided here on earnings and income, it is less obvious that welfarestates as such influence unequivocally the general level of social equality. Theearnings data show a remarkably egalitarian pattern of distribution generatedby the labour market and the welfare state impact is presumably reflected inthe higher growth rates for the lowest income groups. On the contrary, therising spatial inequality in Copenhagen does not seem to be occurring despite
163
7. Andersen 27-06-07 10:44 Σελίδα 163

HANS THOR ANDERSEN164
the welfare state, but rather appears as the by-product of the welfare state andof the Danish organization of the housing market in particular. Favourablearrangements for home ownership have caused middle and upper middle classhouseholds to abandon rented housing to the poorer households. The distressedneighbourhoods, in particular, have experienced a flight of middle classhouseholds during the last two decades. Detailed studies show the risingcorrelation between housing tenure and segregation; present developments cantherefore be described as residualisation or tenure polarisation.
REFERENCES
Andersen H.T., 1991, «The political urbanization. Fringe development in Copenhagen», EspacePopulations. Sociétés, 2, pp. 367-379.
Andersen H.T. and R. Van Kempen, 2001, «Social fragmentation, social exclusion and urbangovernance: An introduction», in H.T. Andersen and R. van Kempen (eds), Governingeuropean cities social fragmentation, social exclusion and urban governance, London,Ashgate, pp. 1-18.
By - og boligministeriet, 1999, Fremtidens by. Bypolitisk perspektiv- og handlingsplan,KØbenhavn (Ministry of Urban and Housing Affairs: Future Cities. Perspectives for urbanpolicy).
Esping-Andersen G., 1990, The three world of welfare capitalism, Cambridge, Polity Press.
Esping-Andersen G., 1999, Social foundations of postindustrial economics, Oxford, OxfordUniversity Press.
Fainstein S. and M. Harloe, 1992, «Conclusion: the divided cities», in Fainstein S., I. Gordon andM. Harloe (eds), Divided cities: New York and London in the contemporary world, Oxford,Blackwell, pp. 236-268.
Friedman J. and G. Wolf, 1982, «World city formation. An agenda for research and action»,International Journal of Urban and Regional Research, 6, pp. 309-344.
Friedrichs J. and J. O’Loughlin, 1996, Social polarisation in postindustrial metropolises, Berlin,Walther de Gruyter.
Hamnett C., 1994, «Social polarisation in global cities: theory and evidence», Urban Studies, 31,pp. 401-424.
Hamnett C., 1996, «Social polarisation, economic restructuring and welfare state regimes», UrbanStudies, 33, pp. 1407-1430.
Hansen A.L., H.T. Andersen and C. Clark, 2001, «Creative Copenhagen: Globalization, urbangovernance and social change», European Planning Studies, 9, 7, pp. 851-869.
Van Kempen E., 1994, «The dual city and the poor: social polarisation, social segregation and lifechances», Urban Studies, 31, pp. 995-1015.
Lovering J., 1997, «Global restructuring and local impact», in Pacione (ed.), Britain’s inner cities:Geographies of division in urban Britain, London, Routledge, pp. 63-87.
7. Andersen 27-06-07 10:44 Σελίδα 164

SPATIAL - NOT SOCIAL POLARISATION
Mayer M., 1995, «Post-fordist city politics», in Amin A. (ed.), Post-fordism. A reader, London,Blackwell, pp. 317-337.
Moellenkopf J. and M. Castells, 1991, Dual city. Restructuring New York, New York, Russel, SageFoundation.
Musterd S. and W. Ostendorf (eds), 1998, Urban segregation and the welfare state: inequality andexclusion in western cities, London, Routledge.
Musterd S., H. Priemus and R. Van Kempen, 1999, «Towards undivided cities: The potential ofeconomic revitalisation and housing redifferentiation», Housing Studies, 14, 5, pp. 573-584.
Pahl R.E., 1988, «Some remarks on informal work, social polarisation and the social structure»,International Journal of Urban and Regional Research, 12, 2, pp. 248-267.
Sassen S., 1991, The global city. New York, London, Tokyo, Princeton, Princeton University Press.
Vestergaard H., 1998, «Troubled housing estates in Denmark», in Madanipour, Cars and Allen(eds), Social exclusion in european cities. Processes, experiences and responses, London,Jessica Kingsley, pp. 115-130.
Wacquant L., 1996, «The rise of advanced marginality: notes on its nature and implications», ActaSociologica, 39, pp. 121-139.
165
7. Andersen 27-06-07 10:44 Σελίδα 165