Embed Size (px)
DESCRIPTION
The Precipitating Cloud Population of the Madden – Julian Oscillation over the Indian and West Pacific Oceans. Hannah C. Barnes. Dynamics Seminar 24 January 2013, University of Washington, Seattle, Washington. What is the Madden-Julian Oscillation?. Episodic convective burst Along equator - PowerPoint PPT Presentation
Citation preview

The Precipitating Cloud Population of the Madden –
Julian Oscillation over the Indian and West Pacific Oceans
Hannah C. Barnes
Dynamics Seminar
24 January 2013, University of Washington, Seattle, Washington
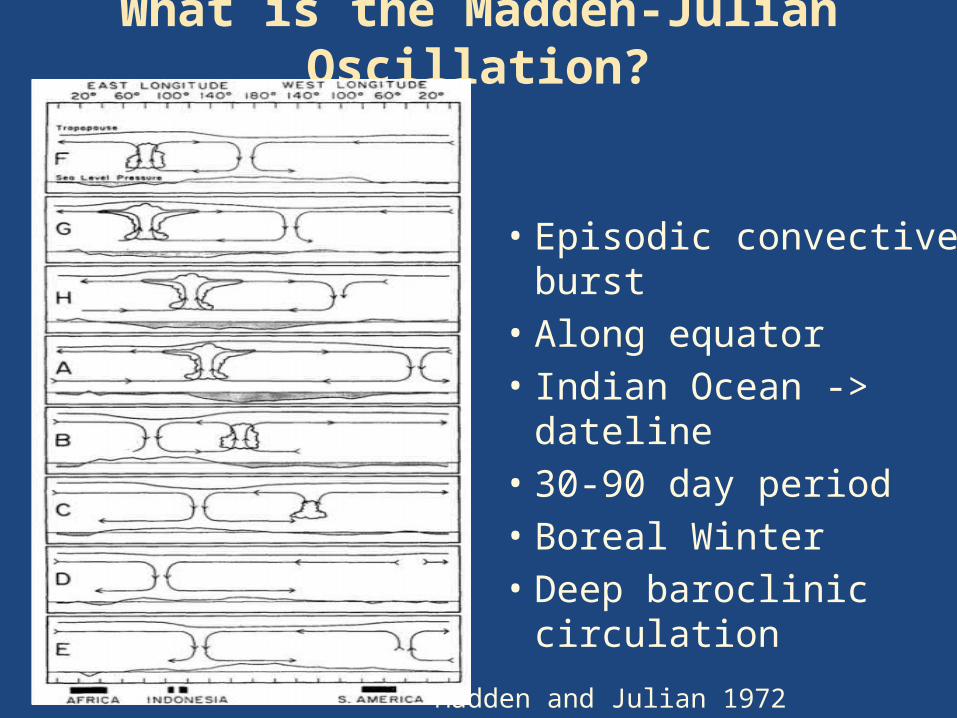
What is the Madden-Julian Oscillation?
Madden and Julian 1972
• Episodic convective burst• Along equator• Indian Ocean -> dateline• 30-90 day period• Boreal Winter• Deep baroclinic circulation
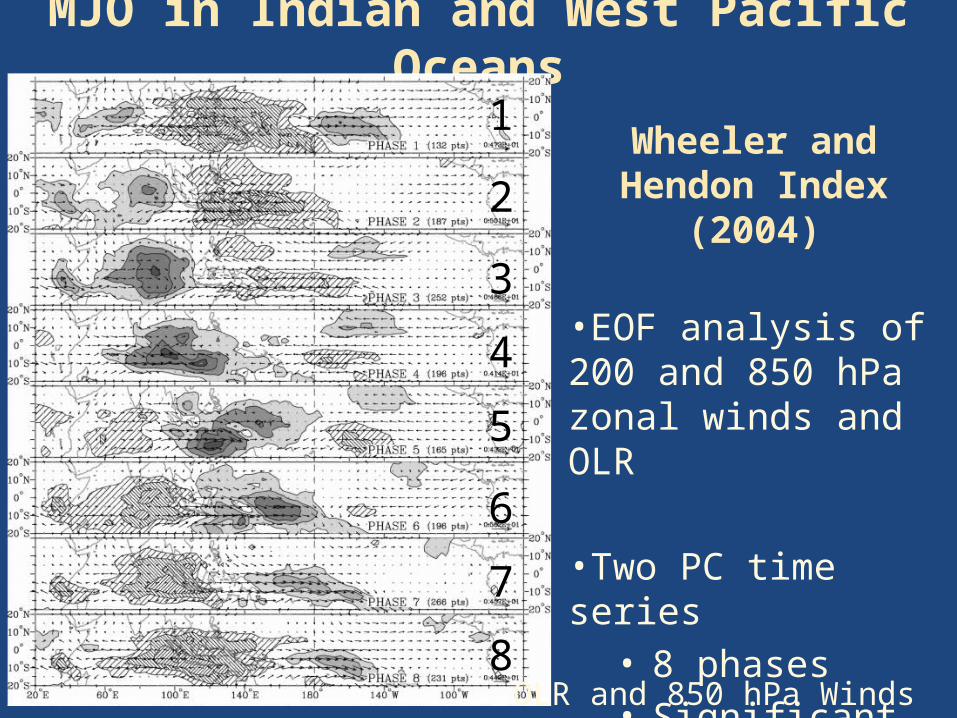
MJO in Indian and West Pacific Oceans
Wheeler and Hendon Index (2004)
•EOF analysis of 200 and 850 hPa zonal winds and OLR
•Two PC time series • 8 phases • Significant MJO
1
2
3
4
5
6
7
8OLR and 850 hPa Winds
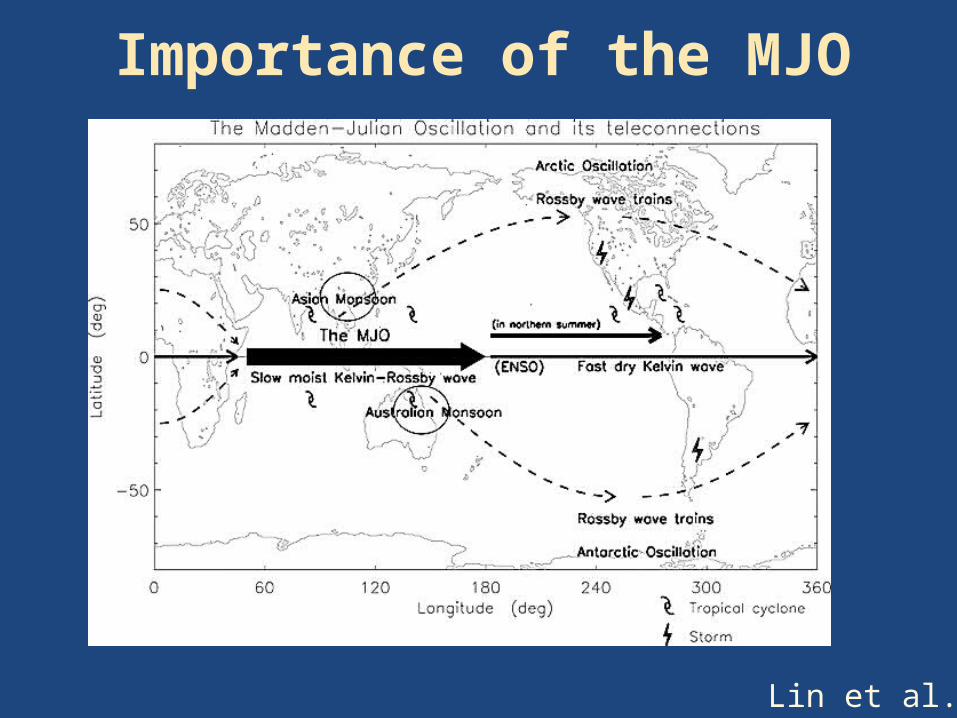
Importance of the MJO
Lin et al. 2006
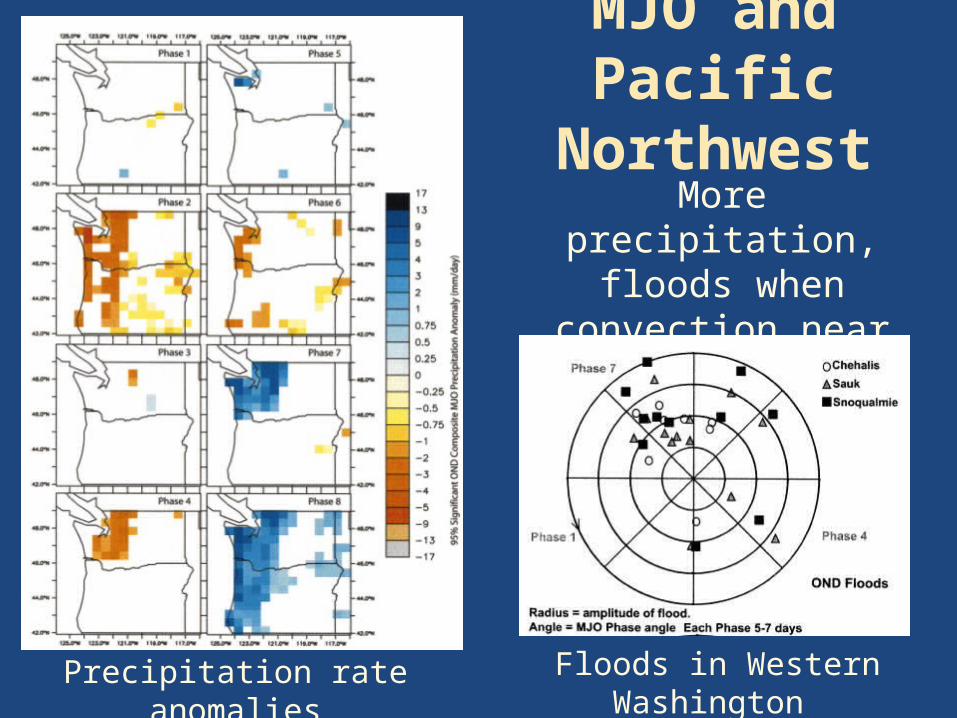
MJO and Pacific Northwest
Precipitation rate anomalies
More precipitation, floods when convection near
dateline
Floods in Western Washington (Bond and Vecchi 2003)
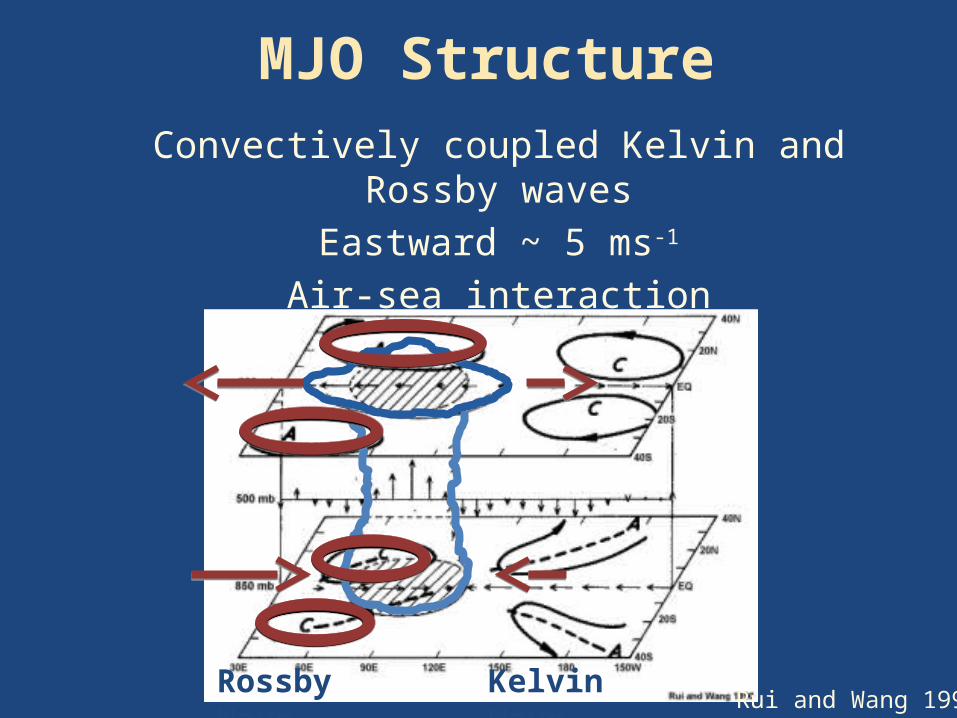
MJO StructureConvectively coupled Kelvin and Rossby waves
Eastward ~ 5 ms-1
Air-sea interaction
Rossby Wave Kelvin WaveRui and Wang 1990
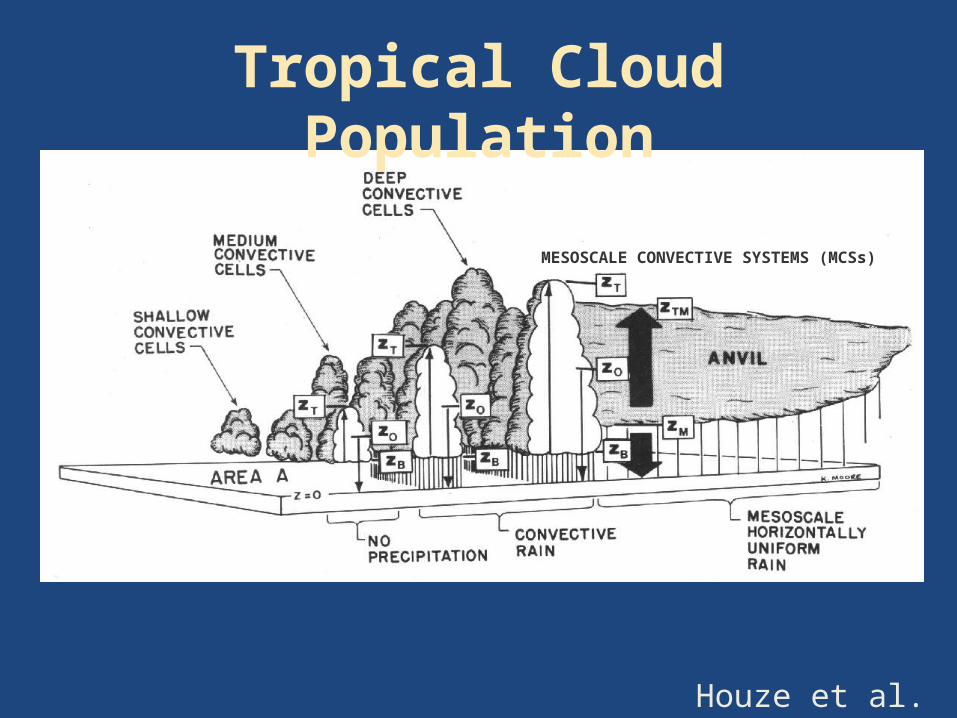
Houze et al. 1980
MESOSCALE CONVECTIVE SYSTEMS (MCSs)
Tropical Cloud Population

Importance of Cloud
Population
• Models unrealistic without including shallow convection (Zhang and Song 2009)
• MJO sensitive to deep and shallow heating (Haertel et al. 2008)
Entire population
No shallow
Satelliteobs.
Zhang and Song 2009

Objectives
• Variability of precipitating clouds in MJO using TRMM Precipitation Radar
• Associated humidity and wind shear
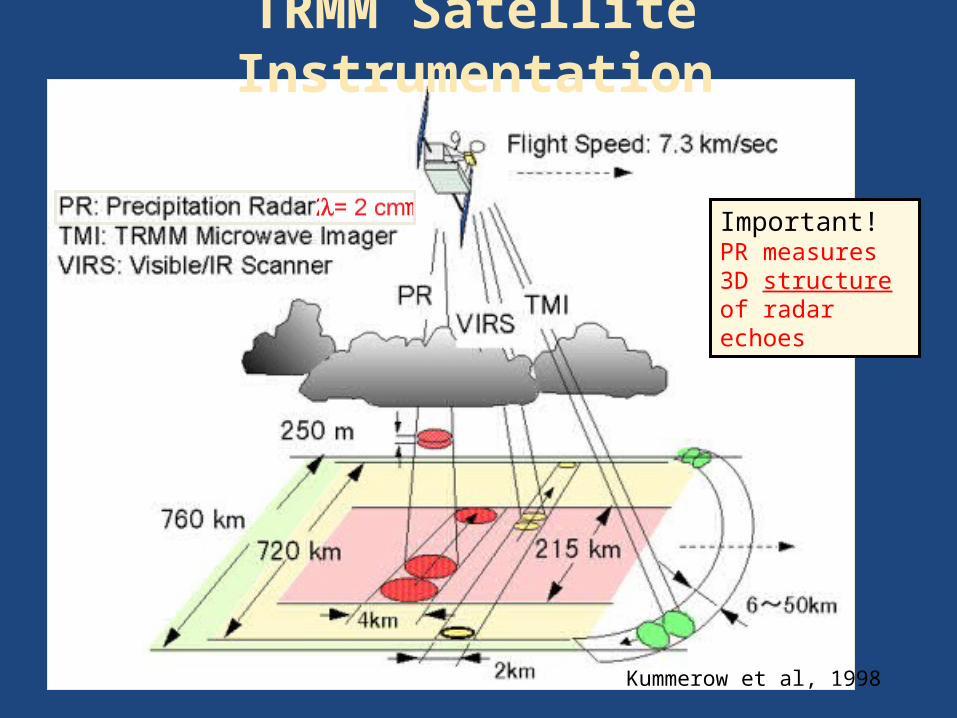
TRMM Satellite Instrumentation
Kummerow et al, 1998
λ= 2 cmImportant! PR measures 3D structure of radar echoes

Data and Methodology• TRMM PR
• 2A23 (rain type classification)
• 2A25 (attenuated corrected reflectivity)
• ERA-interim reanalysis
• 1999 – 2011, October – February, Wheeler and Hendon Index > 1
• Bootstrapping
TRMM orbit
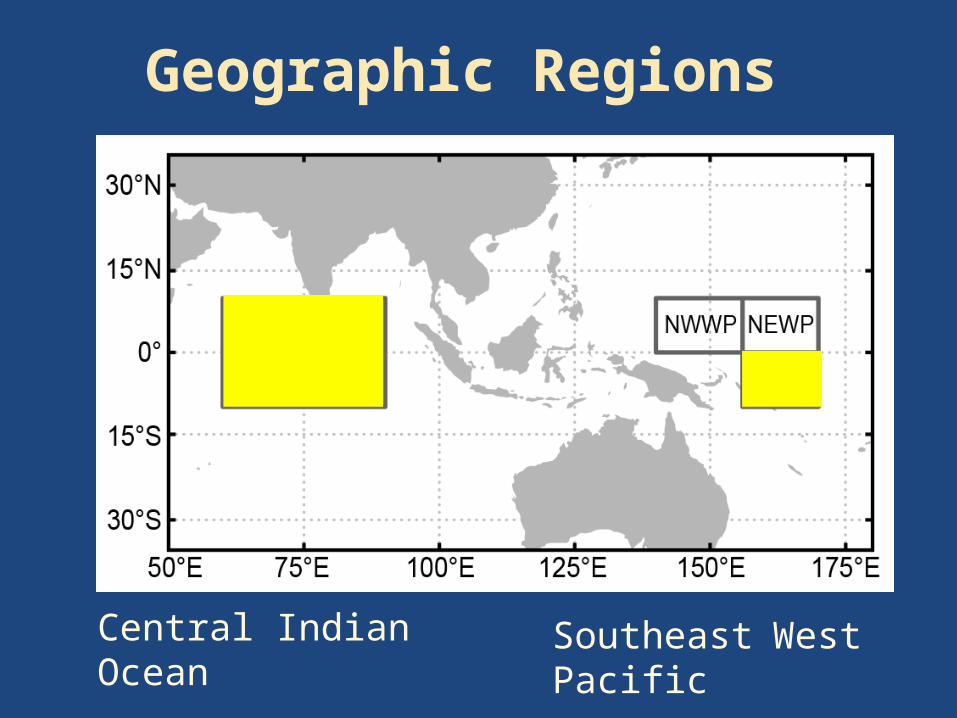
Geographic Regions
Central Indian Ocean Southeast West Pacific
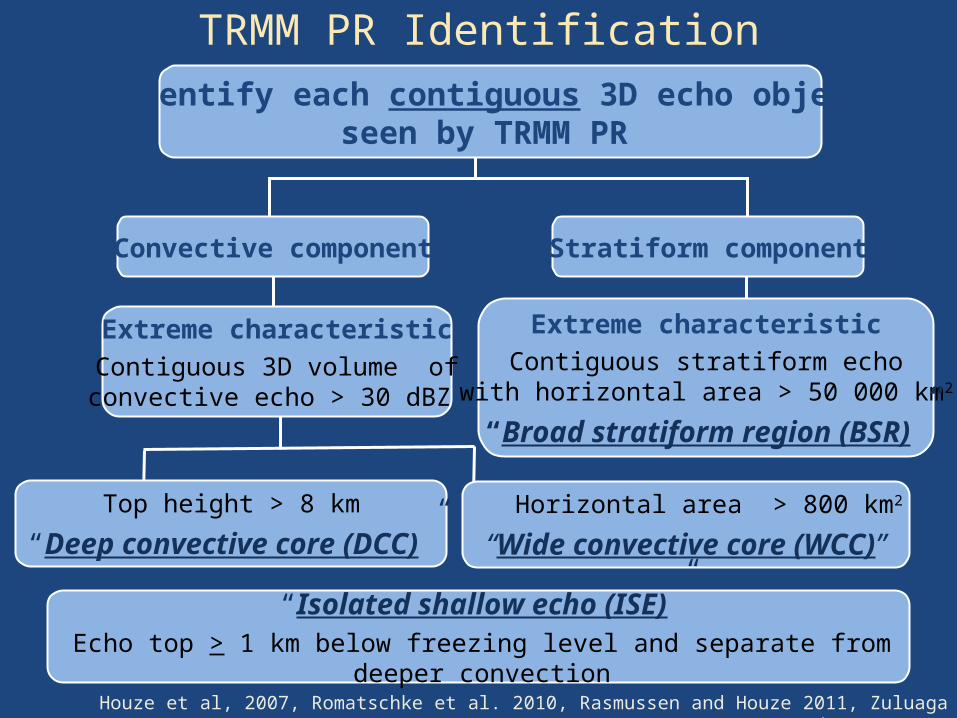
Identify each contiguous 3D echo objectseen by TRMM PR
Convective component Stratiform component
Extreme characteristicContiguous 3D volume ofconvective echo > 30 dBZ
Top height > 8 km
“Deep convective core (DCC)” Horizontal area > 800 km2
“Wide convective core (WCC)”
Extreme characteristicContiguous stratiform echo
with horizontal area > 50 000 km2
“Broad stratiform region (BSR)”
TRMM PR Identification
“Isolated shallow echo (ISE)”Echo top > 1 km below freezing level and separate from deeper convection
Houze et al, 2007, Romatschke et al. 2010, Rasmussen and Houze 2011, Zuluaga and Houze 2013

Central Indian Ocean (CIO) Analysis
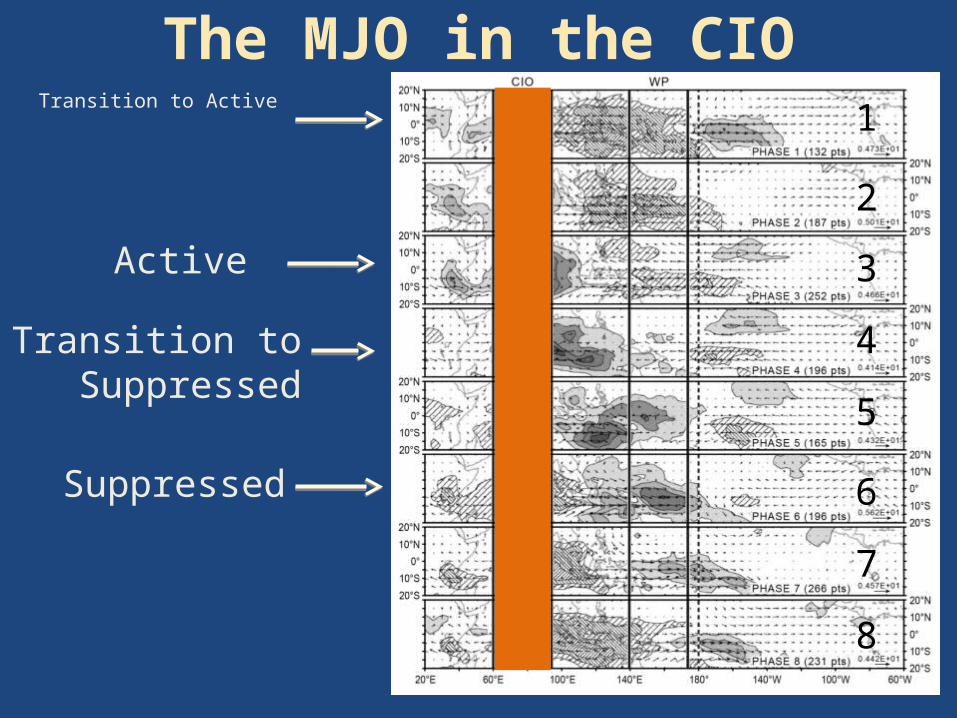
The MJO in the CIOTransition to Active 1
2
3
4
5
6
7
8
Active
Transition to Suppressed
Suppressed
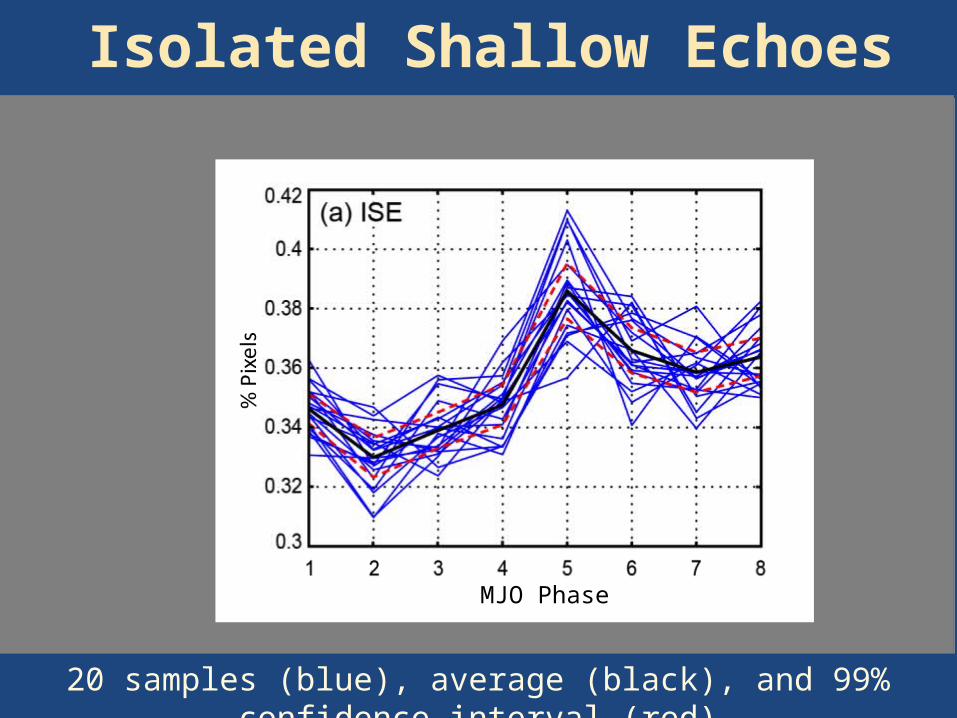
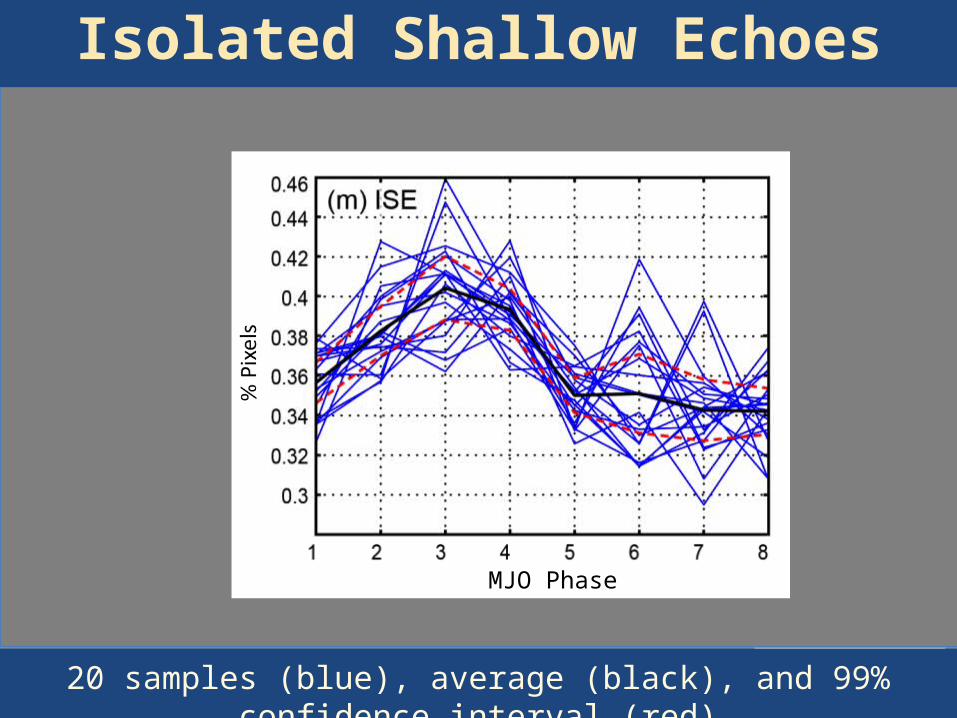
Isolated Shallow Echoes
90E60E10S
0
10N
%
Frequency (%)
MJO Phase
20 samples (blue), average (black), and 99% confidence interval (red)
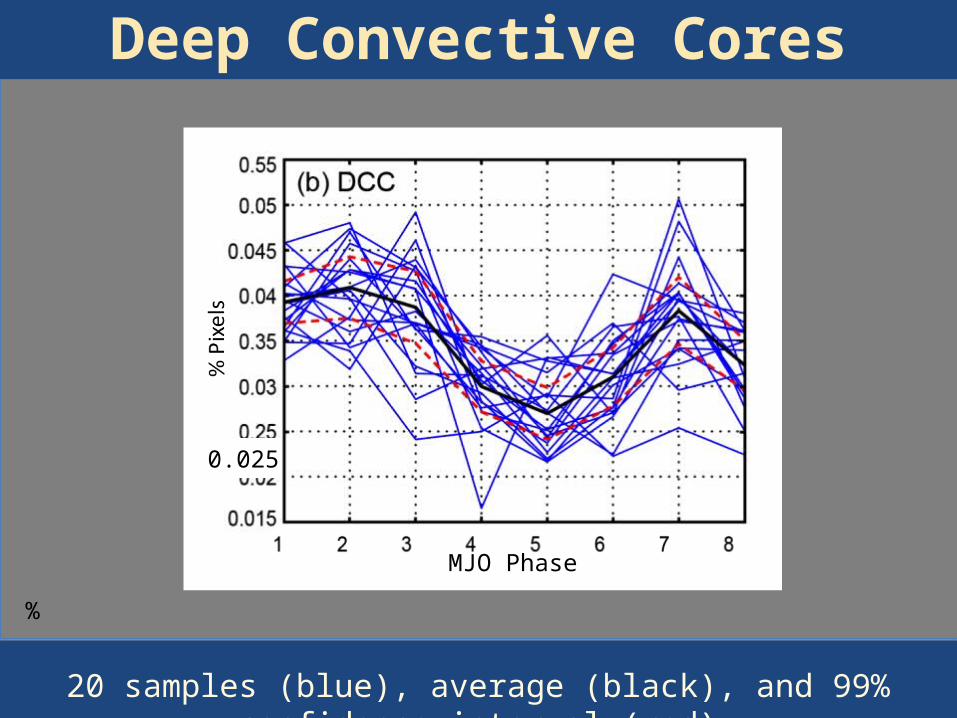
Deep Convective Cores
MJO Phase
%
Frequency (%)20 samples (blue), average (black), and 99% confidence interval (red)
0.025

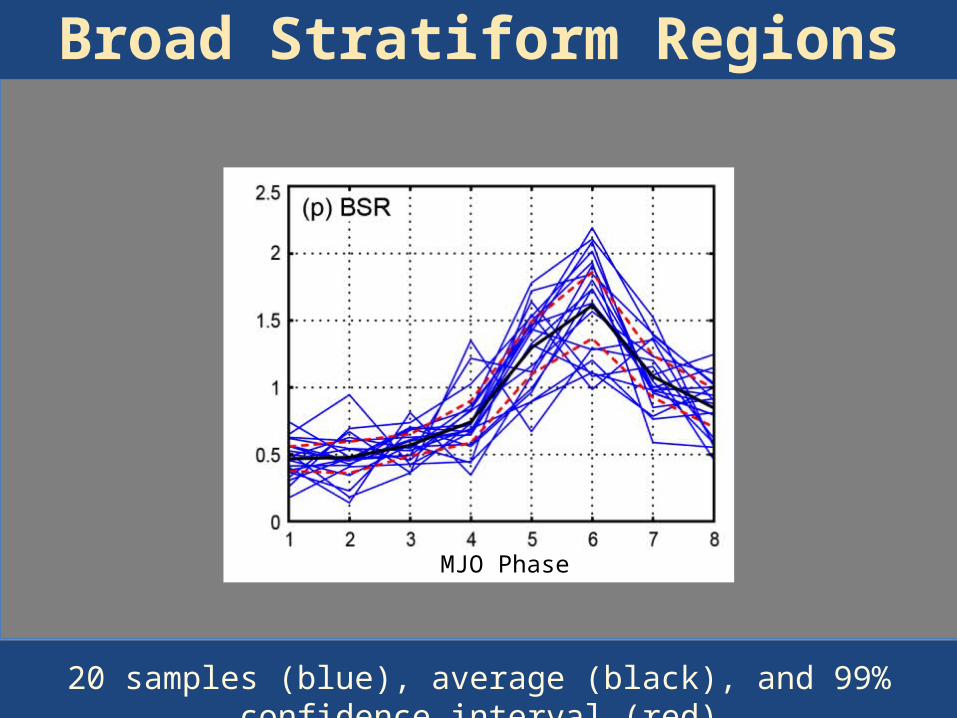
Broad Stratiform Regions
%
MJO Phase
Frequency (%)20 samples (blue), average (black), and 99% confidence interval (red)
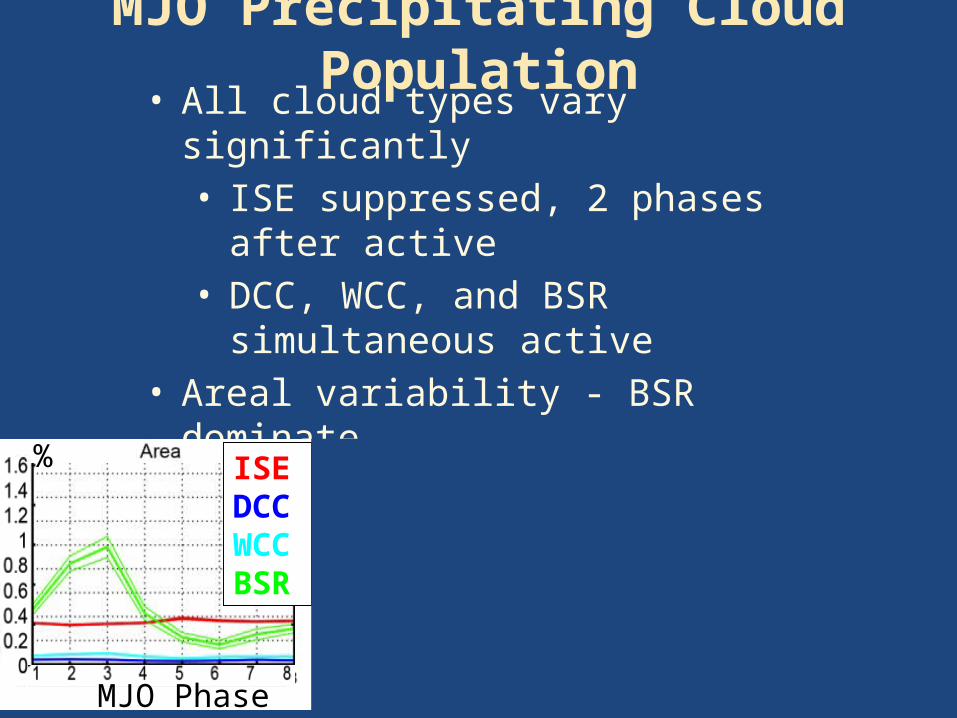
MJO Precipitating Cloud Population
250
• All cloud types vary significantly • ISE suppressed, 2 phases after active• DCC, WCC, and BSR simultaneous active
• Areal variability - BSR dominate• Number variability
• ISE dominate• WCC > DCC > BSR
x10^4ISE DCCWCC BSR
%
MJO PhaseMJO Phase
x104
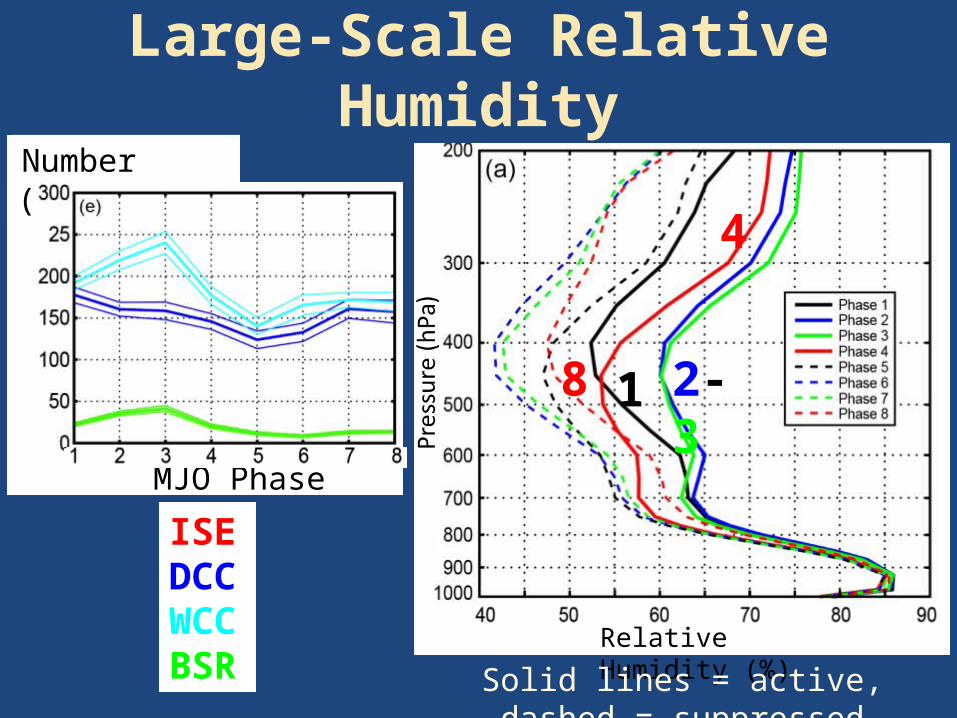
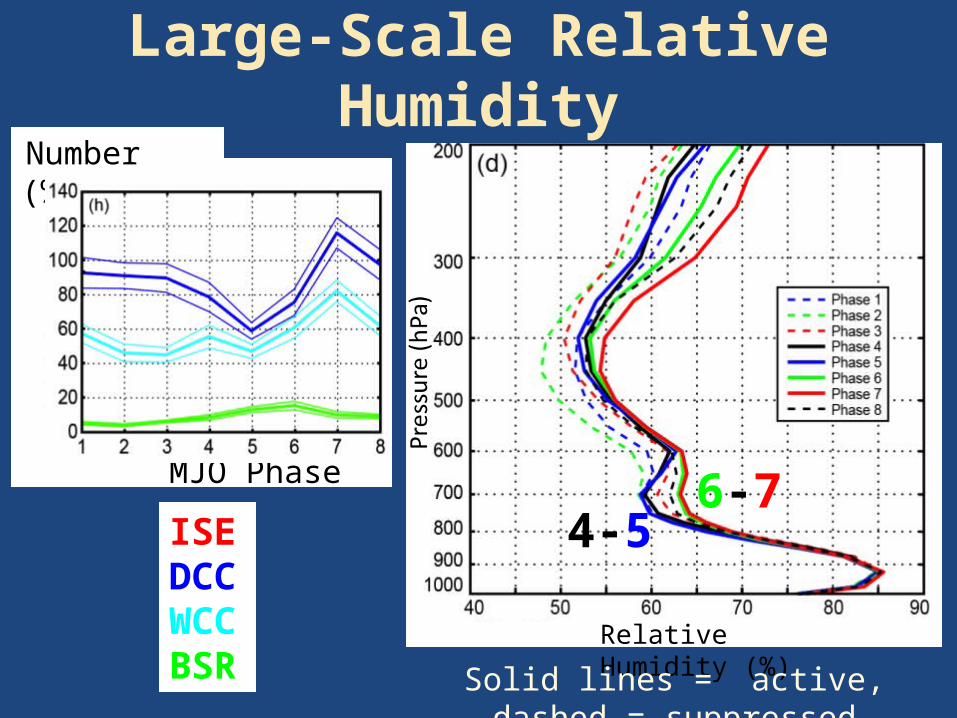
Large-Scale Relative Humidity
MJO Phase
Frequency (%)
Relative Humidity (%)
Solid lines = active, dashed = suppressed
Number
8 1 2-3
4
ISE DCC WCC BSR
MJO Phase
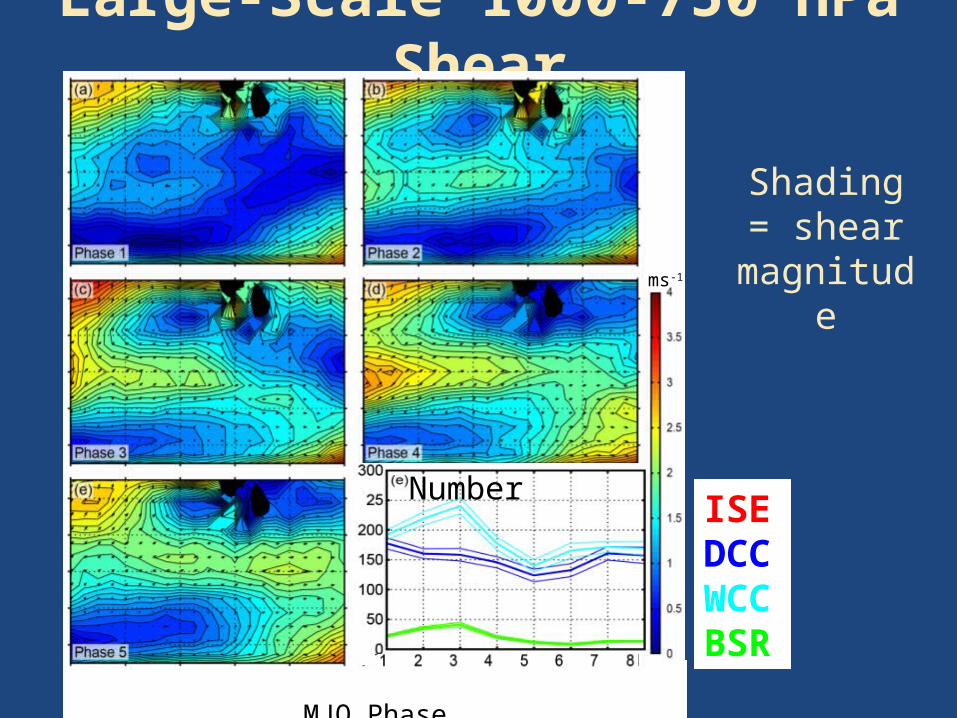
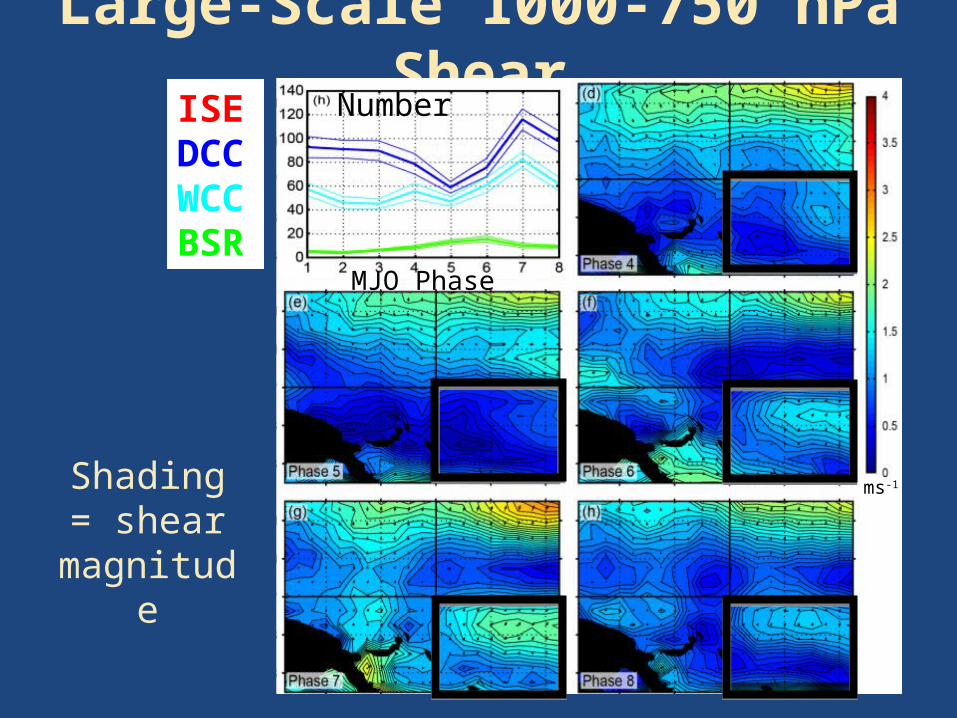
Large-Scale 1000-750 hPa Shear
ms-1
Frequency (%) ISE DCC WCC BSR
Number
Shading = shear
magnitude
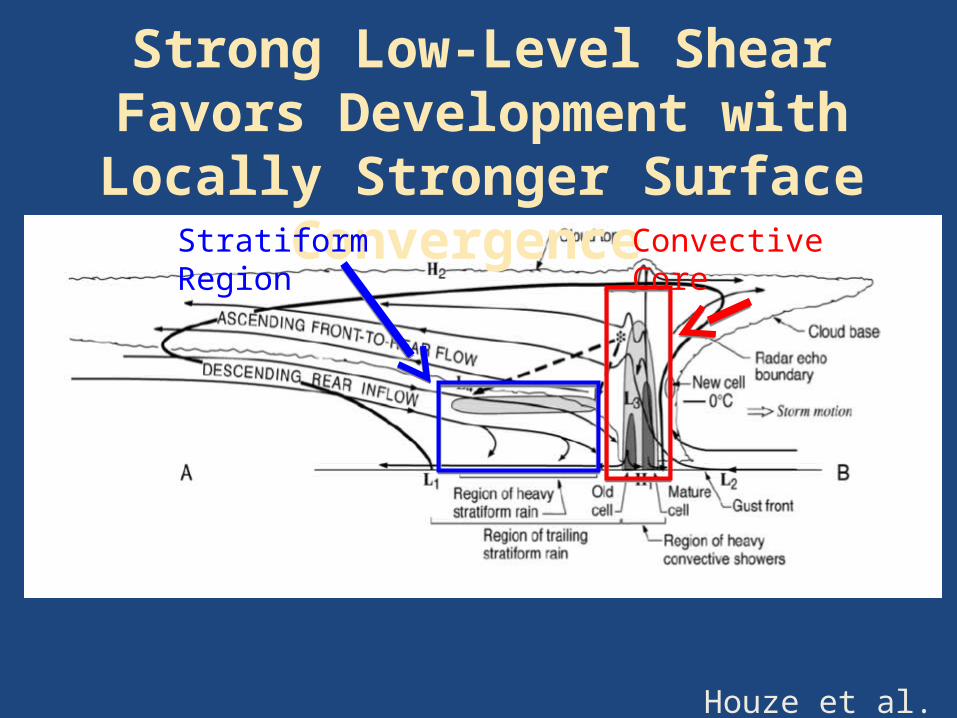
Strong Low-Level Shear Favors Development with Locally Stronger
Surface Convergence
Houze et al. 1989
Convective CoreStratiform Region
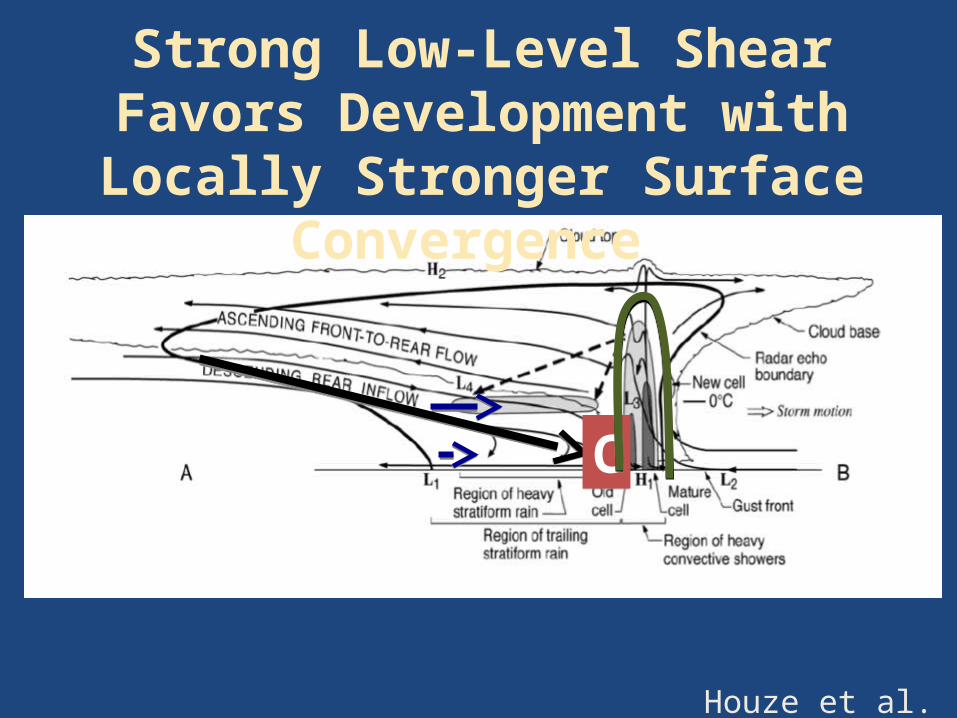
Strong Low-Level Shear Favors Development with Locally Stronger
Surface Convergence
CC
Houze et al. 1989

MJO Phase
Large-Scale 750-200 hPa Shear
ms-1
Frequency (%) ISE DCC WCC BSR
Shading = shear
magnitude
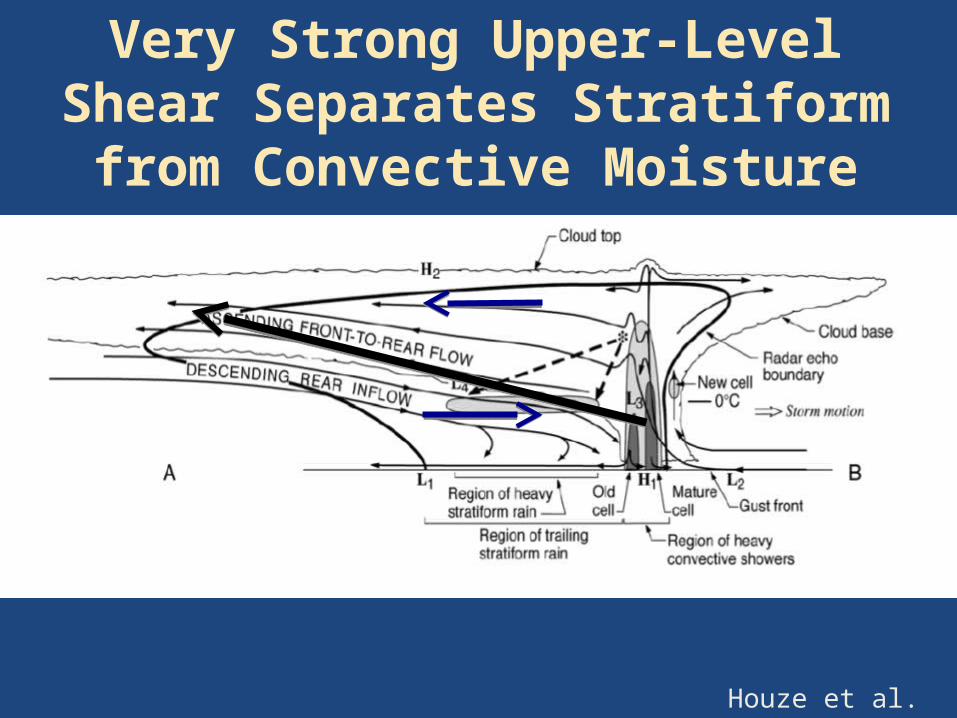
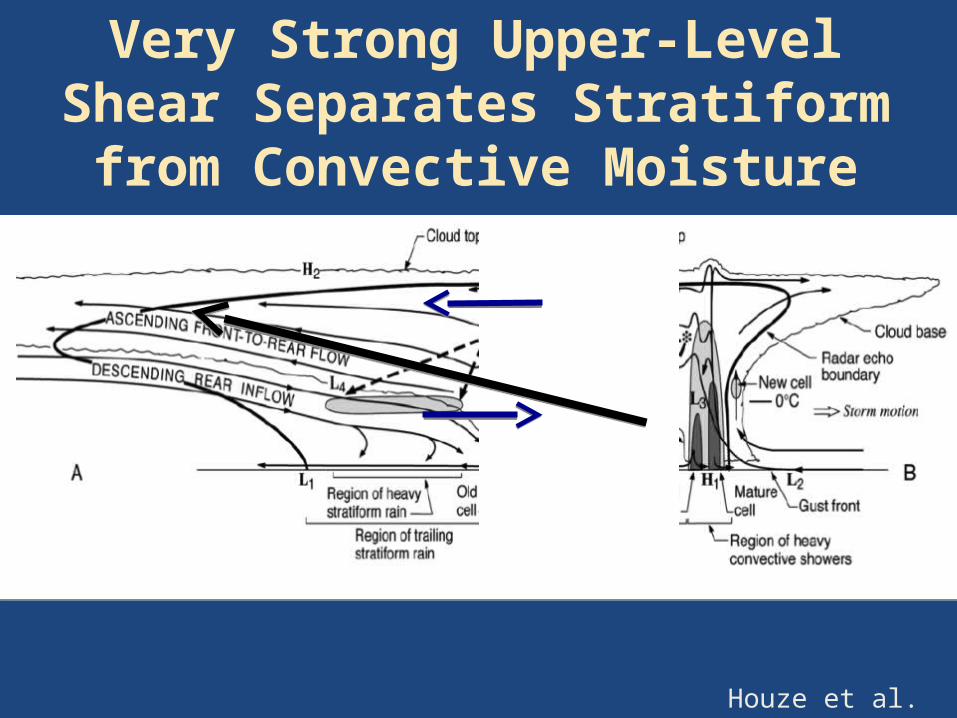
Very Strong Upper-Level Shear Separates Stratiform from
Convective Moisture
Houze et al. 1989
Houze et al. 1989
Very Strong Upper-Level Shear Separates Stratiform from
Convective Moisture
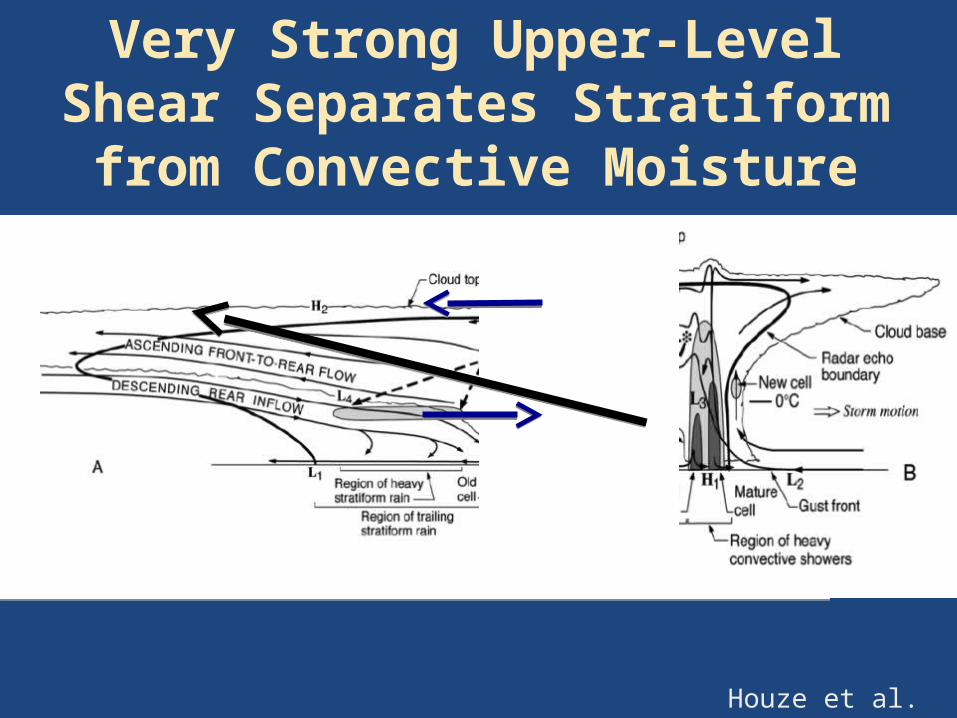
Houze et al. 1989
Very Strong Upper-Level Shear Separates Stratiform from
Convective Moisture
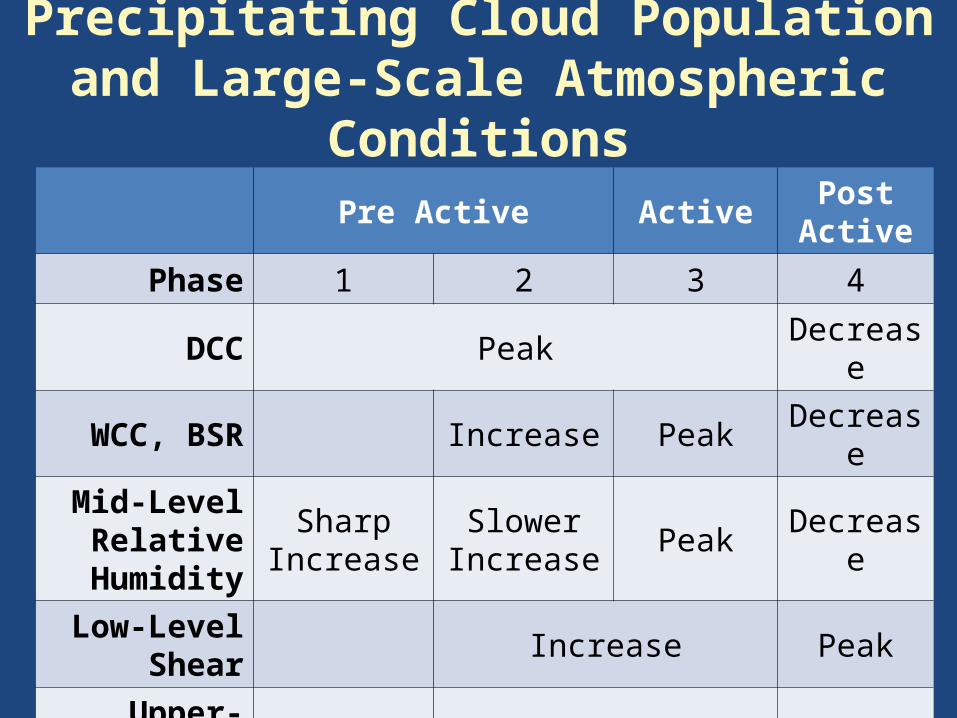
Precipitating Cloud Population and Large-Scale Atmospheric Conditions
Pre Active Active Post Active
Phase 1 2 3 4
DCC Peak Decrease
WCC, BSR Increase Peak Decrease
Mid-Level Relative
Humidity
Sharp Increase
Slower Increase Peak Decrease
Low-Level Shear Increase Peak
Upper-Level Shear Increase Peak

Southeast West Pacific (SEWP) Analysis
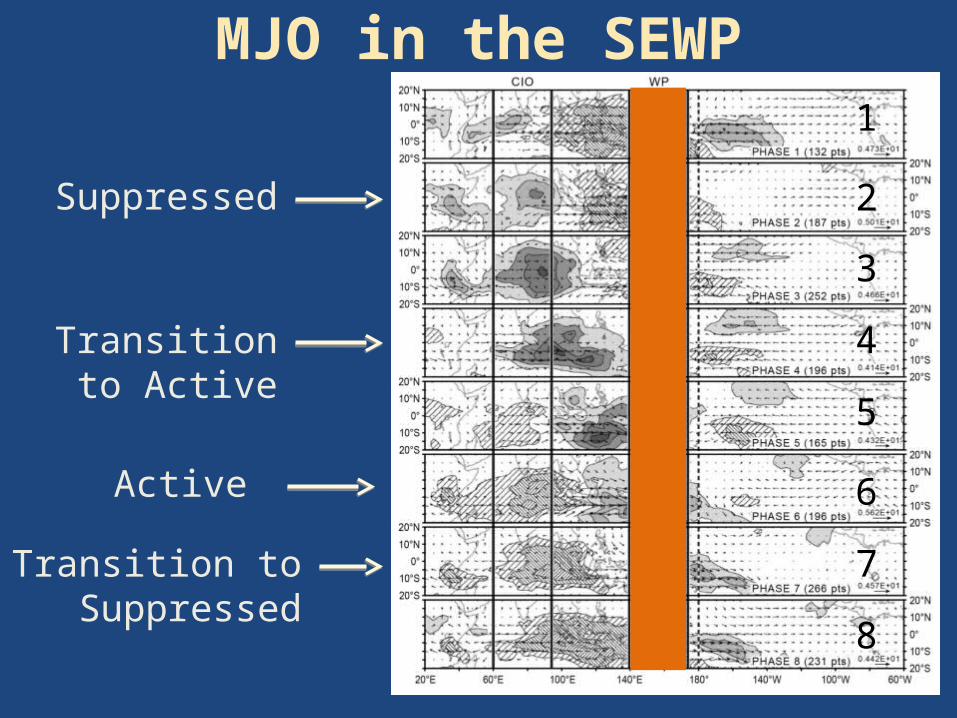
MJO in the SEWP1
2
3
4
5
6
7
8
Transition to Active
Active
Transition to Suppressed
Suppressed
Isolated Shallow Echoes
%
10N
10S
140E
0
170E
MJO Phase
Frequency (%)20 samples (blue), average (black), and 99% confidence interval (red)

Deep Convective Cores
%MJO Phase
Frequency20 samples (blue), average (black), and 99% confidence interval (red)
Broad Stratiform Regions
%
MJO Phase
Frequency (%)20 samples (blue), average (black), and 99% confidence interval (red)

MJO Precipitating Cloud Population• All cloud types significantly vary
• ISE suppressed, 3 phases before active • BSR one phase before DCC and WCC
• Areal variability - BSR dominate• Number variability
• ISE dominate
• DCC > WCC > BSRArea Number Number
MJO Phase
x10^4ISE DCCWCC BSR
%
MJO Phase
Large-Scale Relative Humidity
MJO Phase
Frequency (%)
Relative Humidity (%)
Number
Solid lines = active, dashed = suppressed
4-56-7
ISE DCC WCC BSR
Large-Scale 1000-750 hPa ShearFrequency (%)
ms-1
MJO Phase
ISE DCC WCC BSR
Number
Shading = shear
magnitude

Large-Scale 750-200 hPa Shear
ms-1
MJO Phase
Frequency (%)
ISE DCC WCC BSR
Shading = shear
magnitude

Precipitating Cloud Population and Large-Scale Atmospheric Conditions
Pre Active Active Post Active
Phases 5 6 7 8DCC, WCC Increase Peak Decrease
BSR Increase Peak DecreaseMid-Level
Relative Humidity
Increase Peak Decrease
Low-Level Shear Increase Peak DecreaseUpper-Level
Shear Increase Peak Decrease
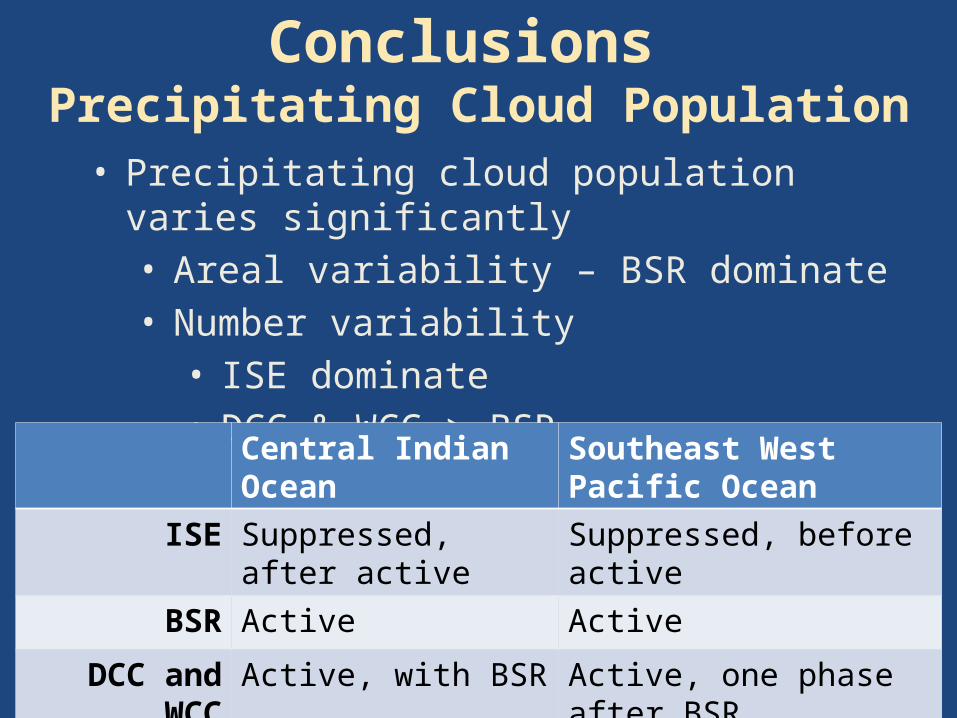
Conclusions Precipitating Cloud Population
• Precipitating cloud population varies significantly• Areal variability – BSR dominate• Number variability
• ISE dominate• DCC & WCC > BSR
Central Indian Ocean Southeast West Pacific Ocean
ISE Suppressed, after active
Suppressed, before active
BSR Active Active
DCC and WCC Active, with BSR Active, one phase after BSR
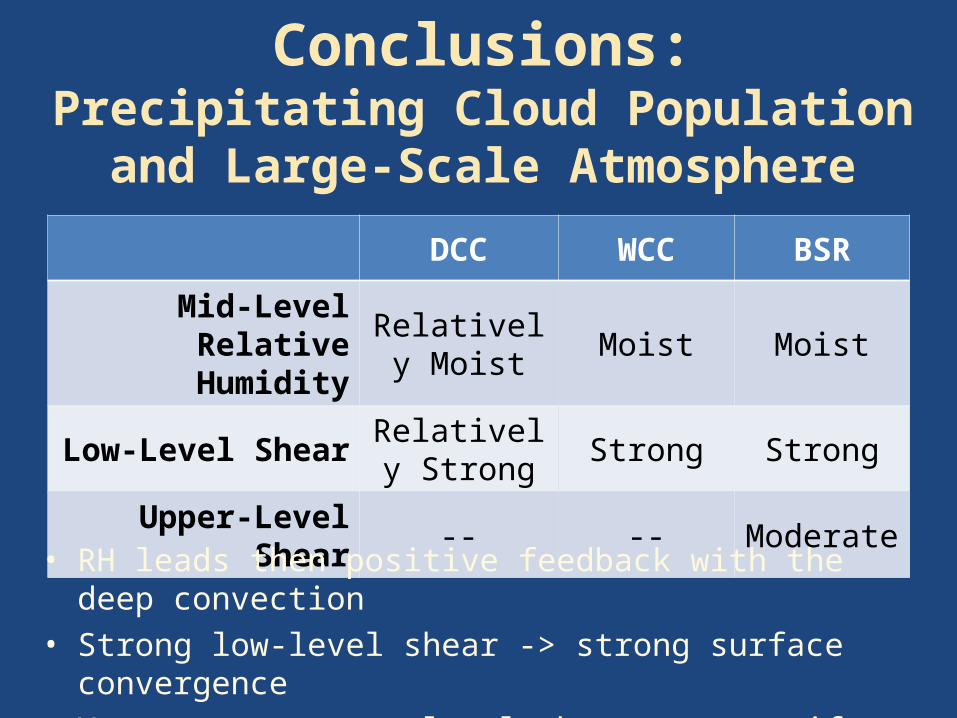
Conclusions:Precipitating Cloud Population and
Large-Scale Atmosphere
DCC WCC BSR
Mid-Level Relative Humidity
Relatively Moist Moist Moist
Low-Level Shear Relatively Strong Strong Strong
Upper-Level Shear -- -- Moderate
• RH leads then positive feedback with the deep convection• Strong low-level shear -> strong surface convergence• Very strong upper-level shear -> stratiform torn from convective
source
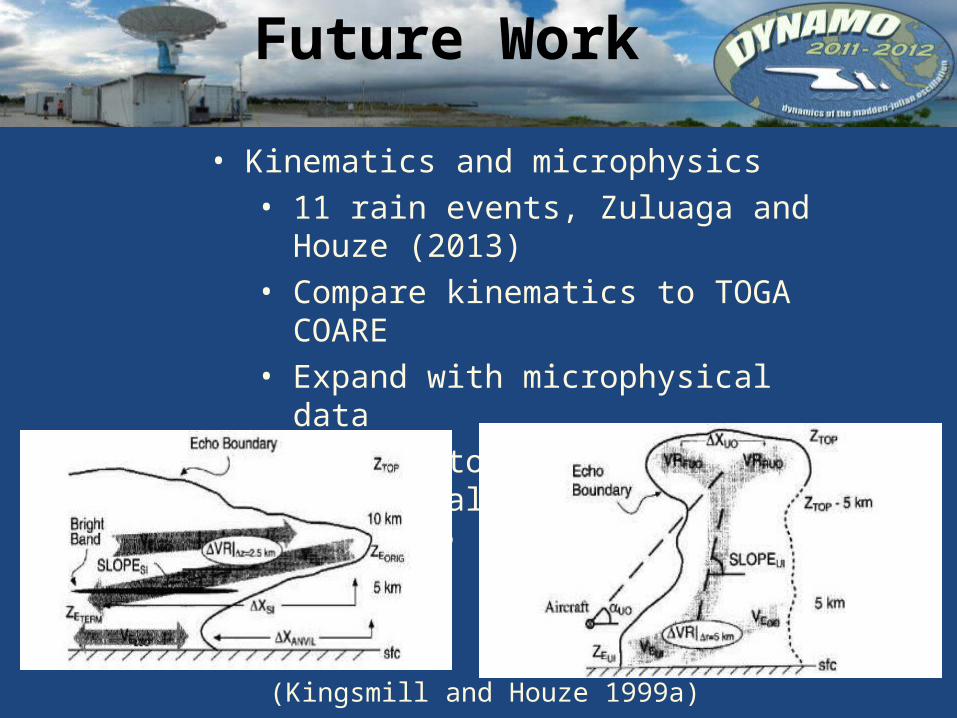
Future Work
• Kinematics and microphysics • 11 rain events, Zuluaga and Houze (2013)• Compare kinematics to TOGA COARE • Expand with microphysical data• Relate storm structure to large-scale
• Modeling???
(Kingsmill and Houze 1999a)
Acknowledgements• Bob Houze
• Committee
• Rob Wood and Mike Wallace
• Beth Tully
• Houze group
• 626 Officemates
• Grads 2010
• Family
• Funding• DOE DE-SC0001164 / ER-64752 and DE-SC0008452• DYNAMO – NSF AGS-1059611• PMM-NASA Grant NNX10AH70.


![On the Barnes function - Carnegie Mellon School of ...adamchik/articles/issac/issac01.pdf · On the Barnes function Victor Adamchik ... c c cccccccc 2k z \ ^]] where J is the Euler-Mascheroni](https://img.pdfslide.us/doc/110x75/5b096f947f8b9a5f6d8dea81/on-the-barnes-function-carnegie-mellon-school-of-adamchikarticlesissac.jpg)