Embed Size (px)
Citation preview
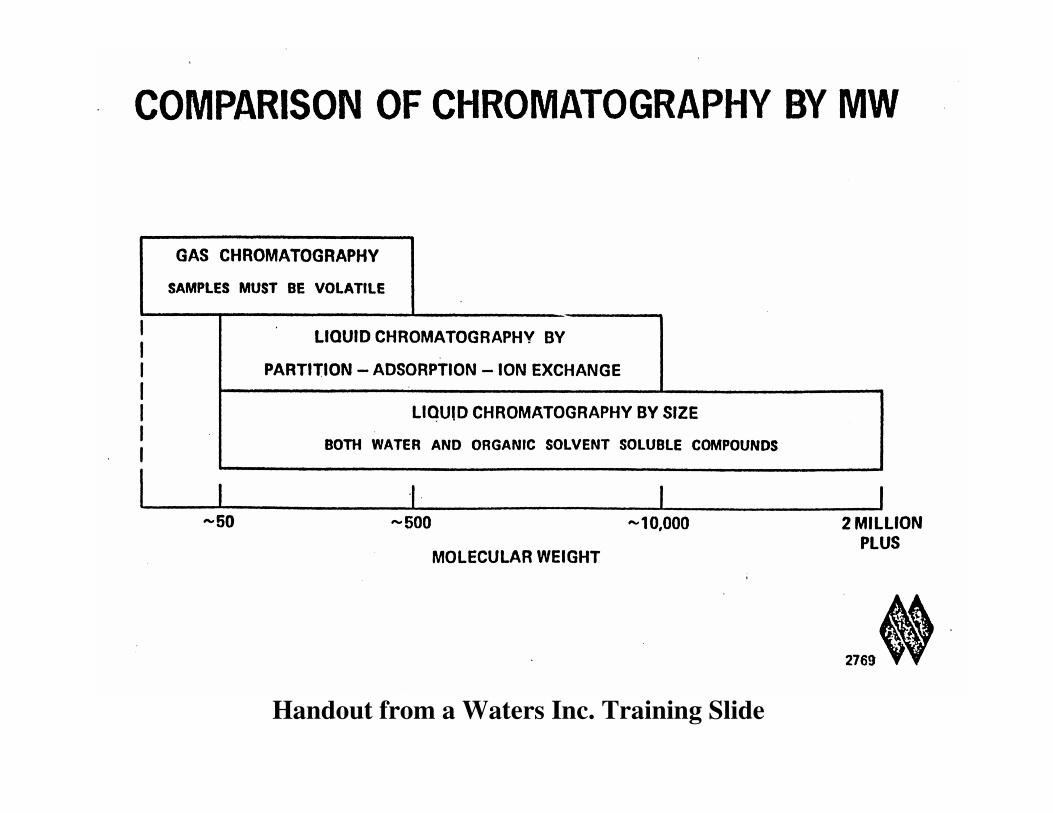
Handout from a Waters Inc. Training Slide
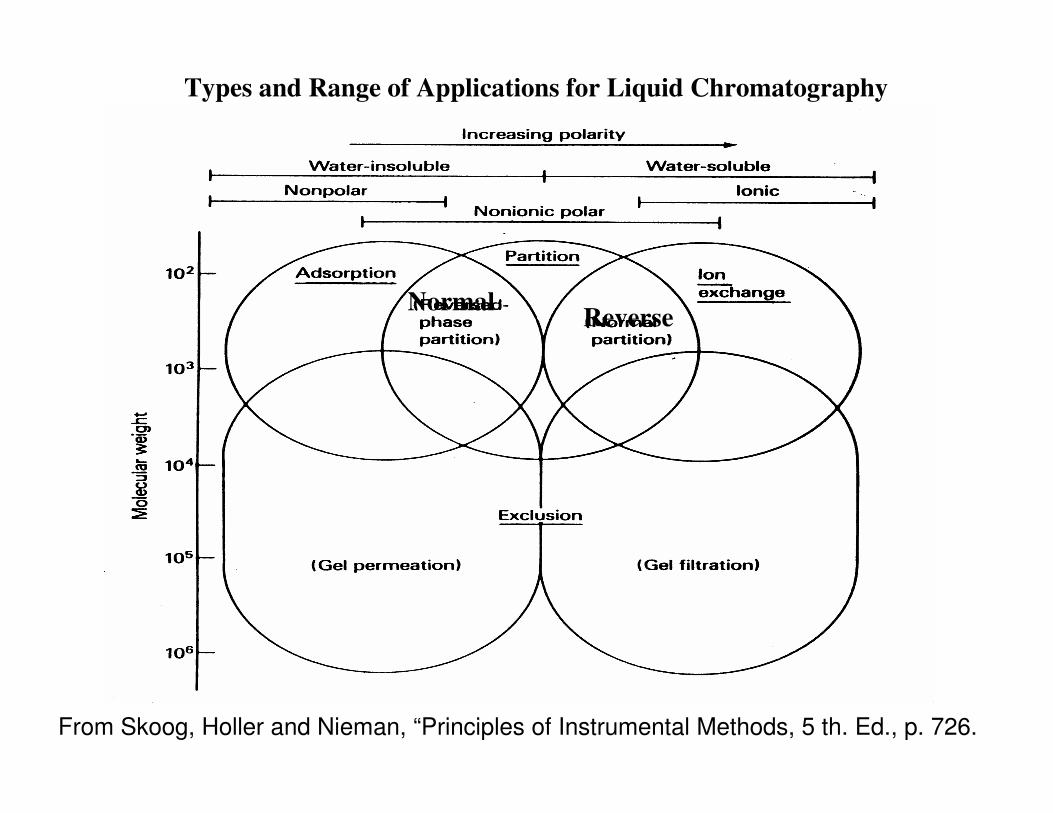
From Skoog, Holler and Nieman, “Principles of Instrumental Methods, 5 th. Ed., p. 726.
Types and Range of Applications for Liquid Chromatography
Normal Reverse
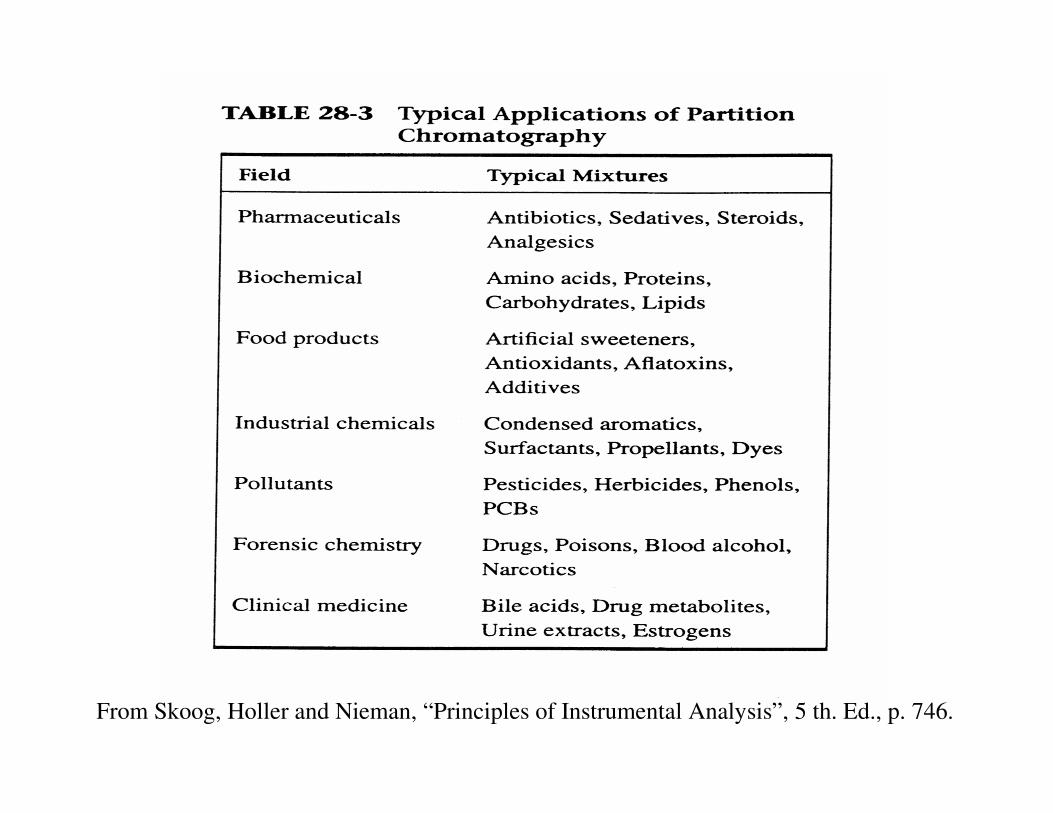
From Skoog, Holler and Nieman, “Principles of Instrumental Analysis”, 5 th. Ed., p. 746.
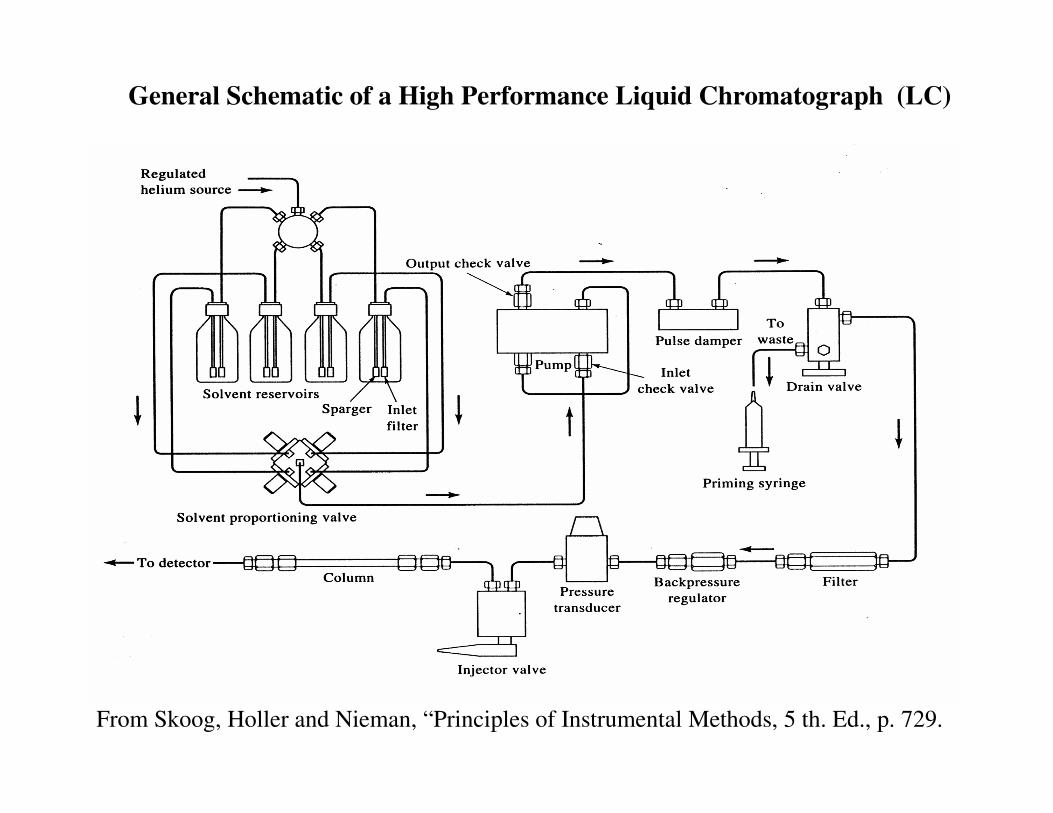
General Schematic of a High Performance Liquid Chromatograph (LC)
From Skoog, Holler and Nieman, “Principles of Instrumental Methods, 5 th. Ed., p. 729.
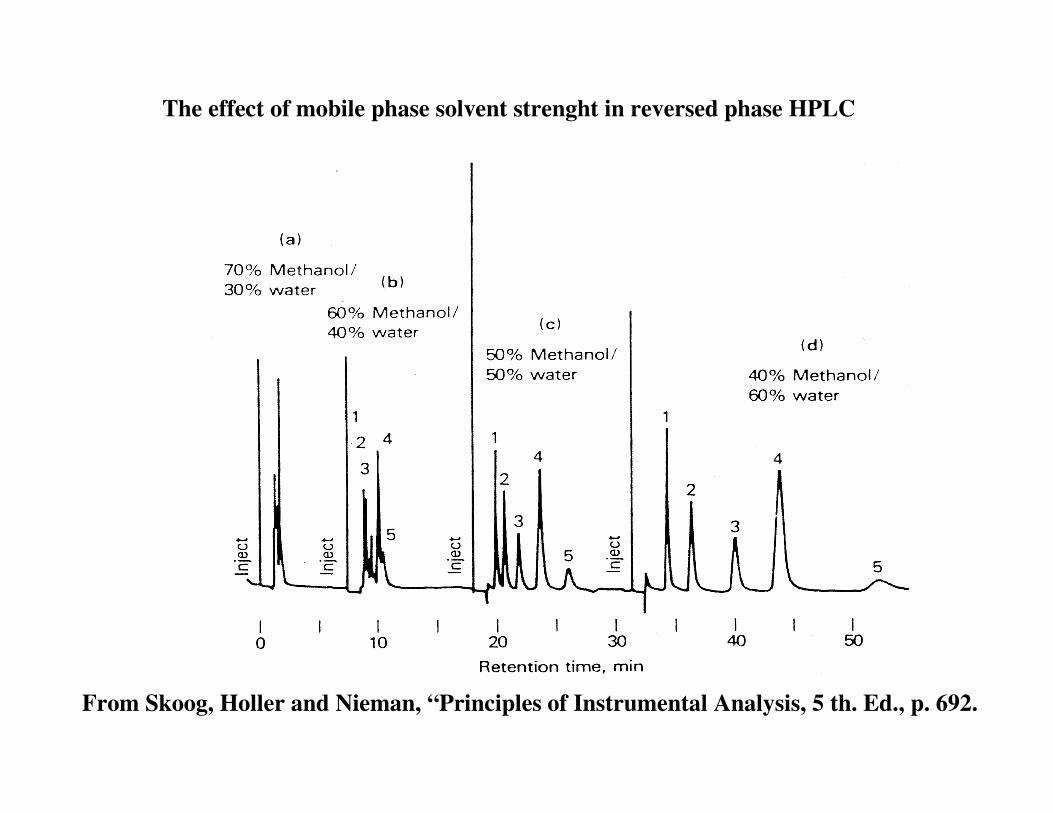
The effect of mobile phase solvent strenght in reversed phase HPLC
From Skoog, Holler and Nieman, “Principles of Instrumental Analysis, 5 th. Ed., p. 692.
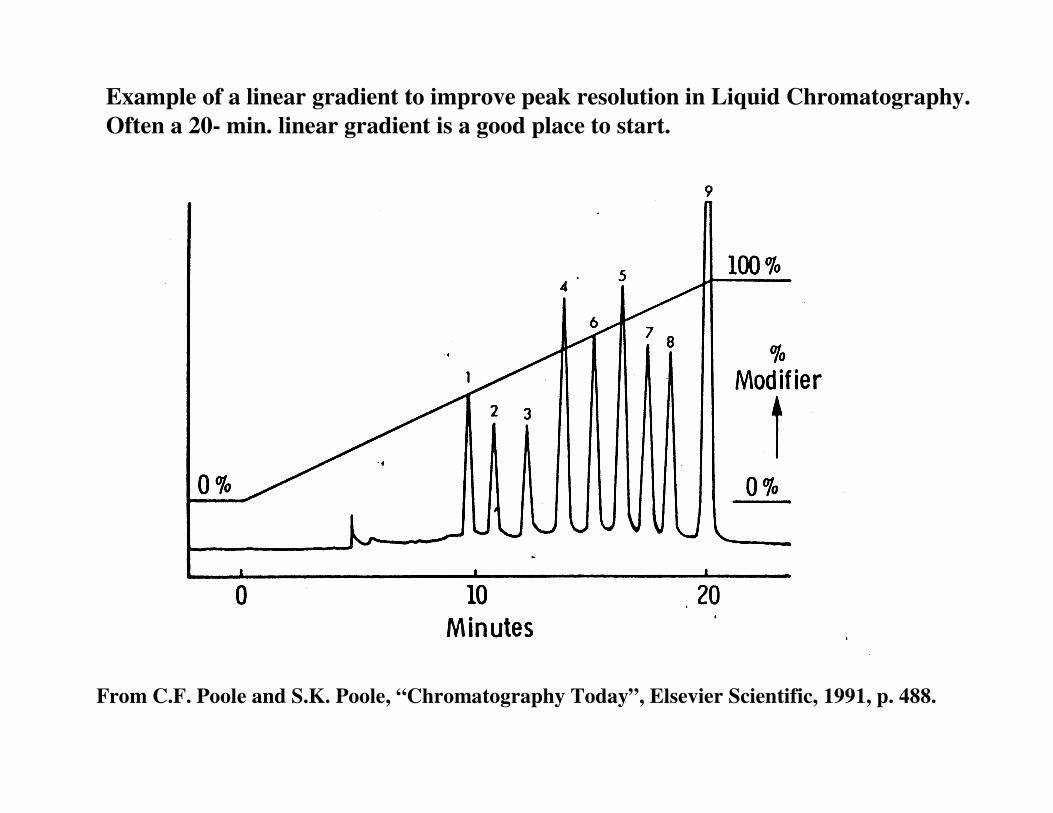
From C.F. Poole and S.K. Poole, “Chromatography Today”, Elsevier Scientific, 1991, p. 488.
Example of a linear gradient to improve peak resolution in Liquid Chromatography.Often a 20- min. linear gradient is a good place to start.
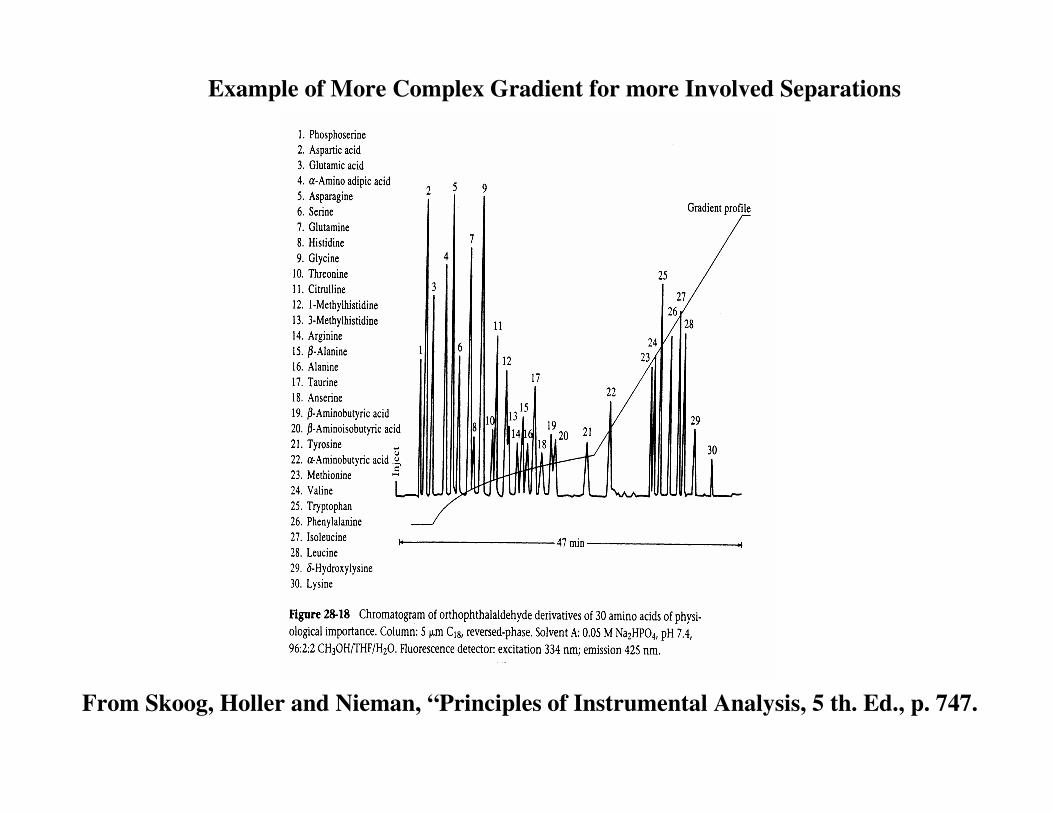
Example of More Complex Gradient for more Involved Separations
From Skoog, Holler and Nieman, “Principles of Instrumental Analysis, 5 th. Ed., p. 747.
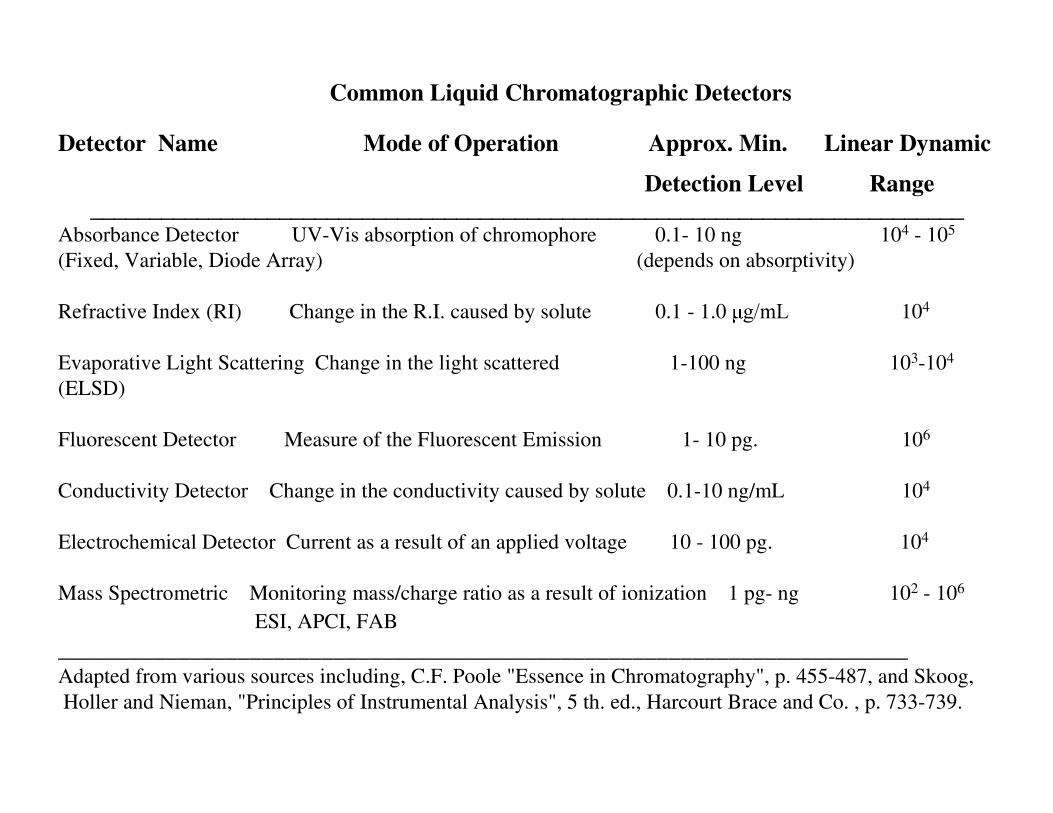
Common Liquid Chromatographic Detectors
Detector Name Mode of Operation Approx. Min. Linear Dynamic
Detection Level Range__________________________________________________________________________
Absorbance Detector UV-Vis absorption of chromophore 0.1- 10 ng 104 - 105
(Fixed, Variable, Diode Array) (depends on absorptivity)
Refractive Index (RI) Change in the R.I. caused by solute 0.1 - 1.0 J�P/ 104
Evaporative Light Scattering Change in the light scattered 1-100 ng 103-104
(ELSD)
Fluorescent Detector Measure of the Fluorescent Emission 1- 10 pg. 106
Conductivity Detector Change in the conductivity caused by solute 0.1-10 ng/mL 104
Electrochemical Detector Current as a result of an applied voltage 10 - 100 pg. 104
Mass Spectrometric Monitoring mass/charge ratio as a result of ionization 1 pg- ng 102 - 106
ESI, APCI, FAB_______________________________________________________________________Adapted from various sources including, C.F. Poole "Essence in Chromatography", p. 455-487, and Skoog,Holler and Nieman, "Principles of Instrumental Analysis", 5 th. ed., Harcourt Brace and Co. , p. 733-739.
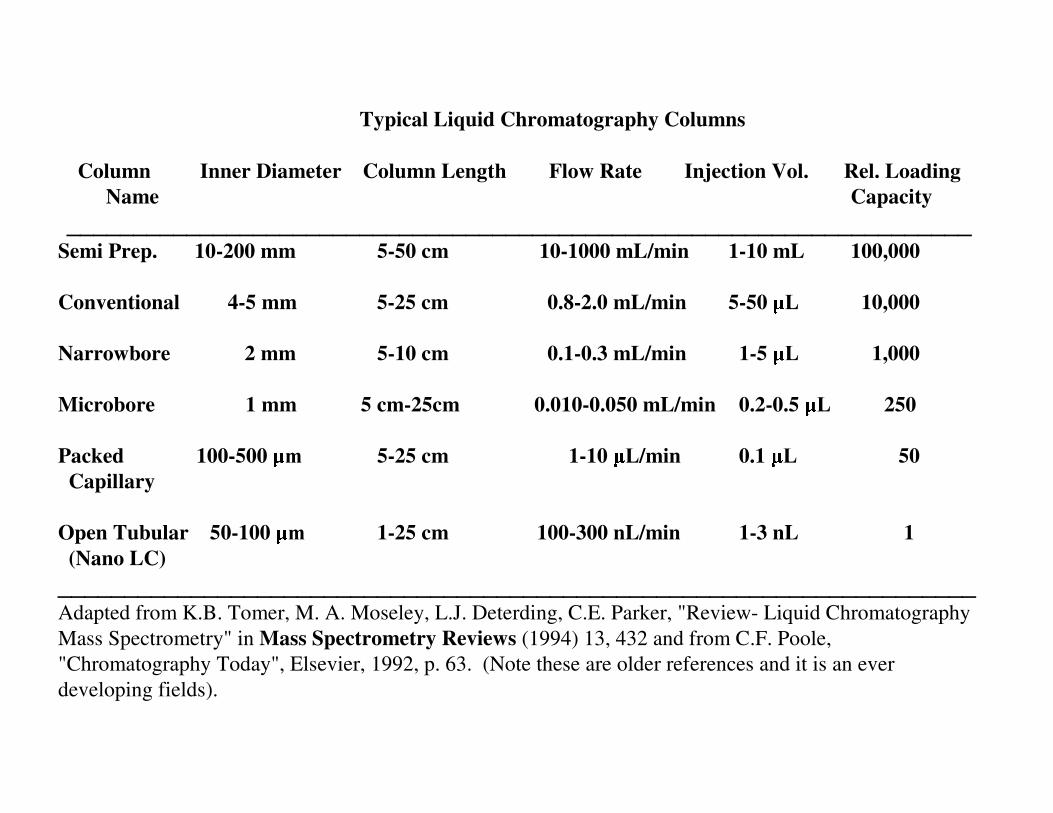
Typical Liquid Chromatography Columns
Column Inner Diameter Column Length Flow Rate Injection Vol. Rel. LoadingName Capacity
____________________________________________________________________Semi Prep. 10-200 mm 5-50 cm 10-1000 mL/min 1-10 mL 100,000
Conventional 4-5 mm 5-25 cm 0.8-2.0 mL/min 5-50 / 10,000
Narrowbore 2 mm 5-10 cm 0.1-0.3 mL/min 1-5 / 1,000
Microbore 1 mm 5 cm-25cm 0.010-0.050 mL/min 0.2-0.5 / 250
Packed 100-500 P 5-25 cm 1-10 //min 0.1 / 50Capillary
Open Tubular 50-100 P 1-25 cm 100-300 nL/min 1-3 nL 1(Nano LC)
_____________________________________________________________________Adapted from K.B. Tomer, M. A. Moseley, L.J. Deterding, C.E. Parker, "Review- Liquid Chromatography Mass Spectrometry" in Mass Spectrometry Reviews (1994) 13, 432 and from C.F. Poole,"Chromatography Today", Elsevier, 1992, p. 63. (Note these are older references and it is an ever developing fields).
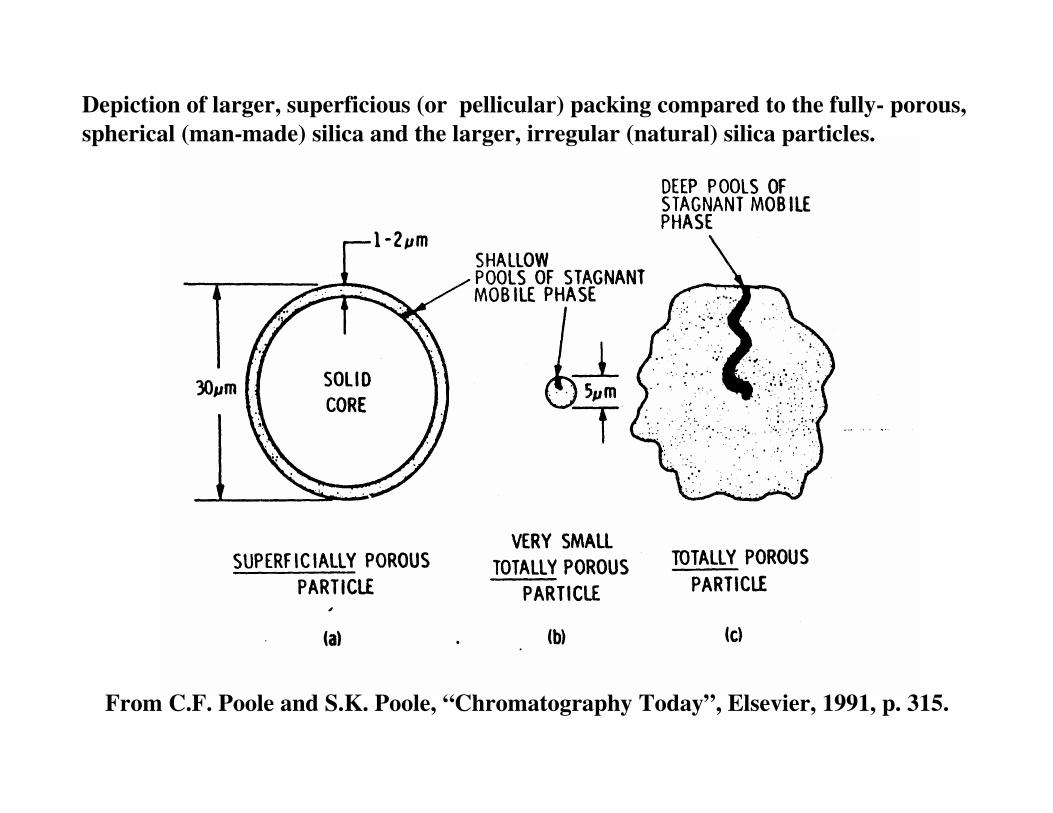
From C.F. Poole and S.K. Poole, “Chromatography Today”, Elsevier, 1991, p. 315.
Depiction of larger, superficious (or pellicular) packing compared to the fully- porous, spherical (man-made) silica and the larger, irregular (natural) silica particles.
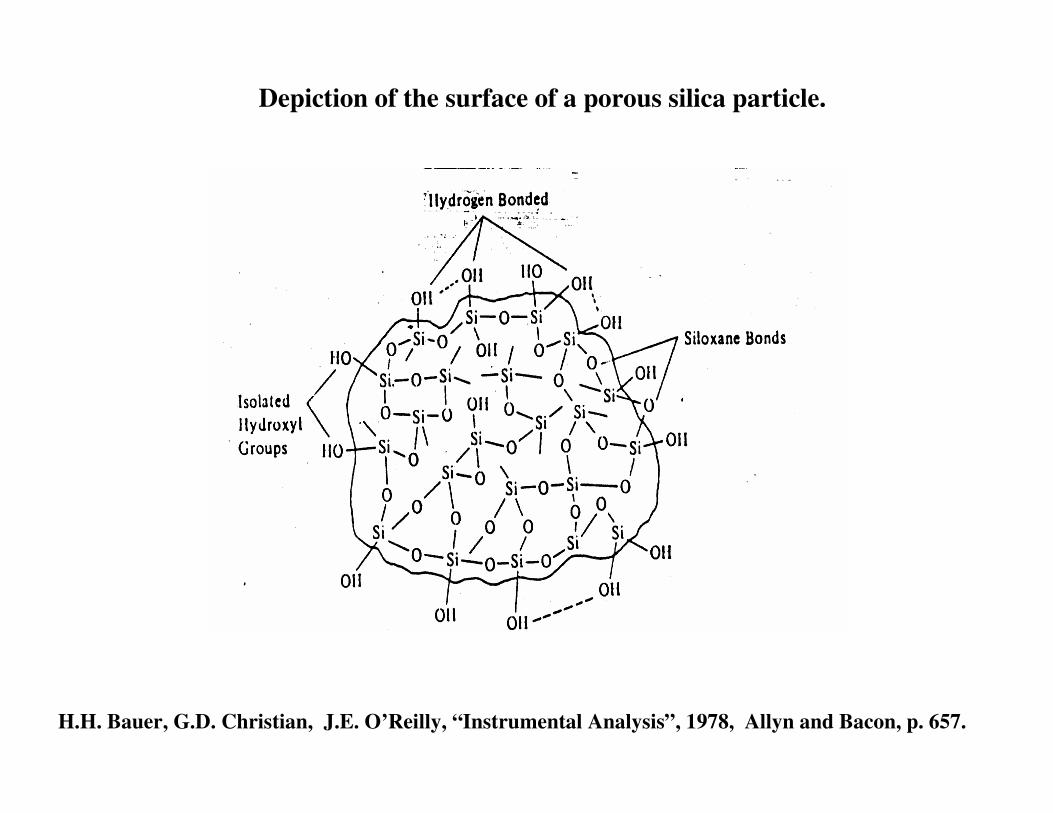
Depiction of the surface of a porous silica particle.
H.H. Bauer, G.D. Christian, J.E. O’Reilly, “Instrumental Analysis”, 1978, Allyn and Bacon, p. 657.
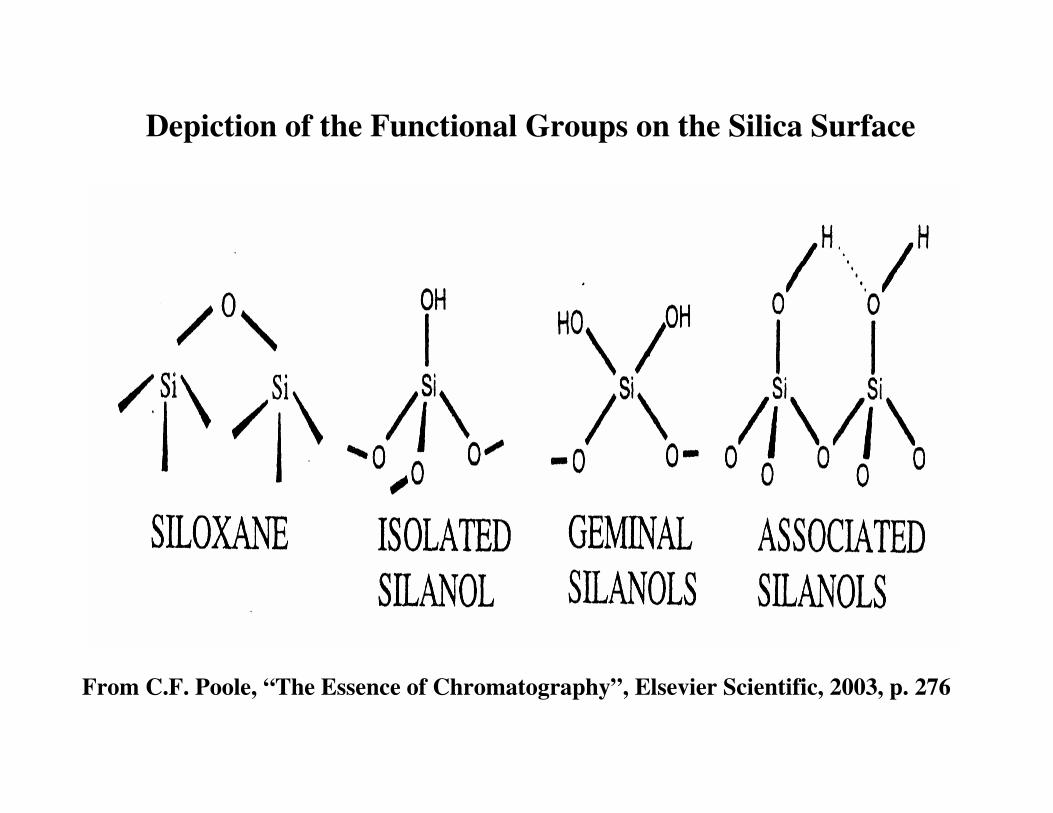
Depiction of the Functional Groups on the Silica Surface
From C.F. Poole, “The Essence of Chromatography”, Elsevier Scientific, 2003, p. 276
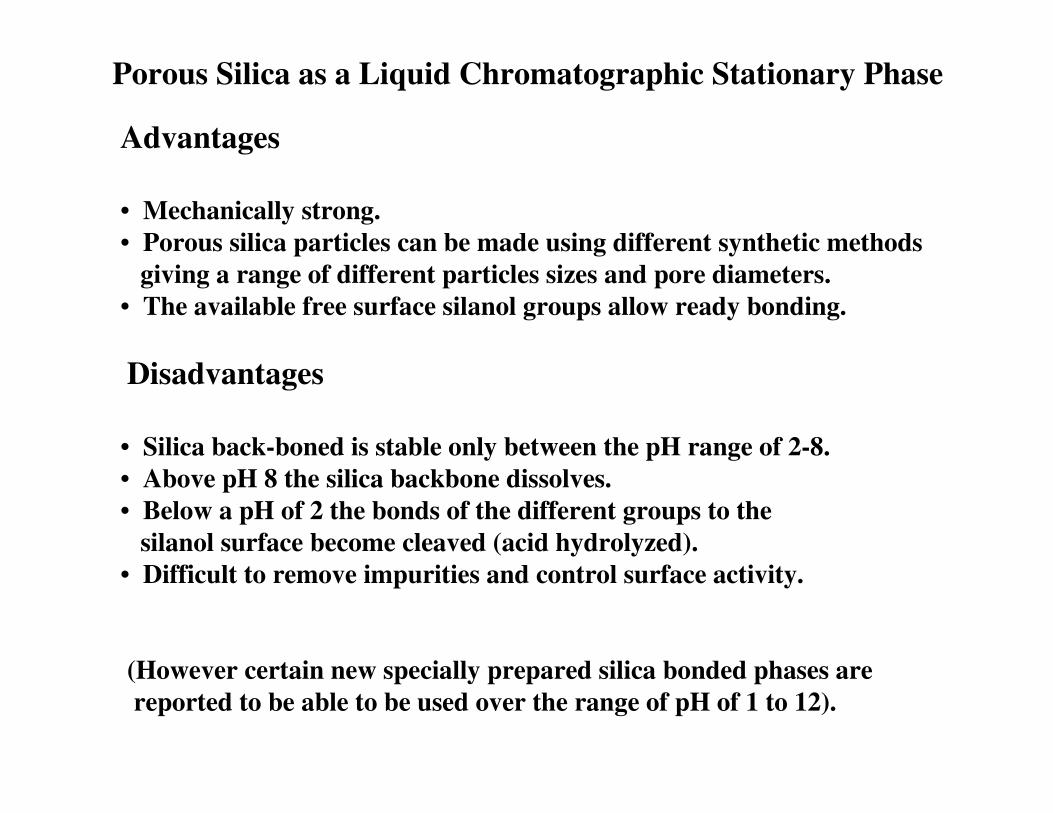
Porous Silica as a Liquid Chromatographic Stationary Phase
Advantages
• Mechanically strong.• Porous silica particles can be made using different synthetic methods
giving a range of different particles sizes and pore diameters.• The available free surface silanol groups allow ready bonding.
Disadvantages
• Silica back-boned is stable only between the pH range of 2-8.• Above pH 8 the silica backbone dissolves.• Below a pH of 2 the bonds of the different groups to the
silanol surface become cleaved (acid hydrolyzed).• Difficult to remove impurities and control surface activity.
(However certain new specially prepared silica bonded phases arereported to be able to be used over the range of pH of 1 to 12).
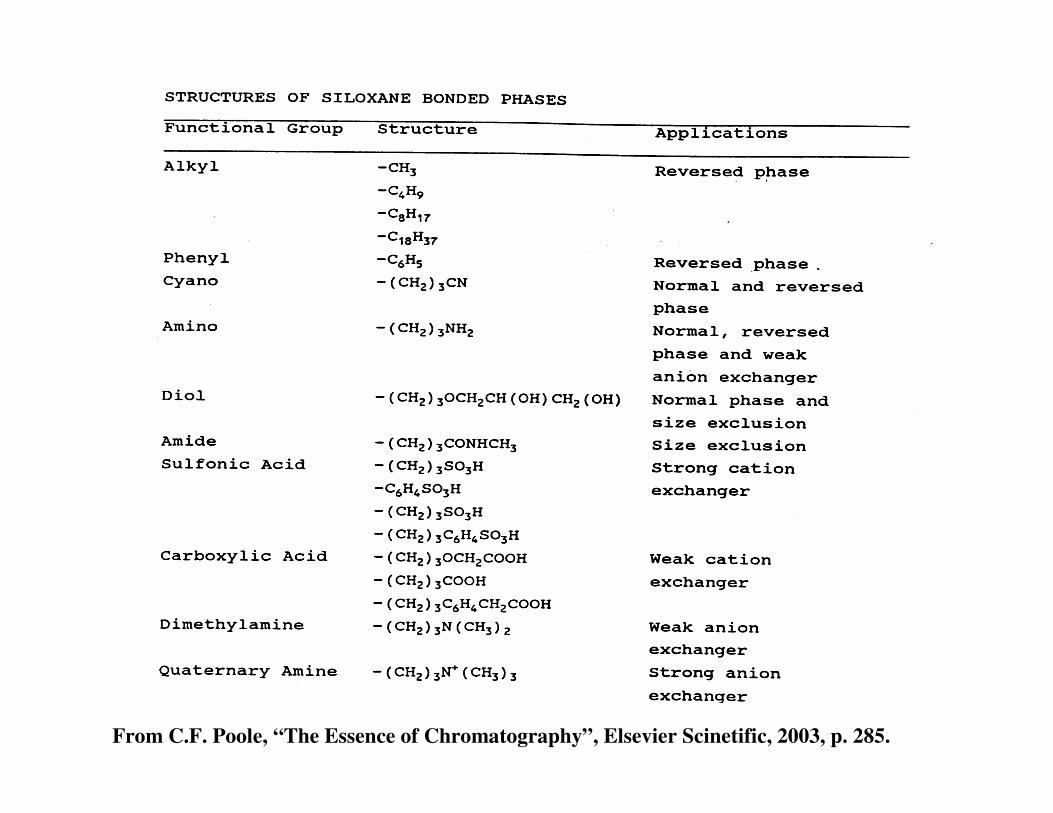
From C.F. Poole, “The Essence of Chromatography”, Elsevier Scinetific, 2003, p. 285.
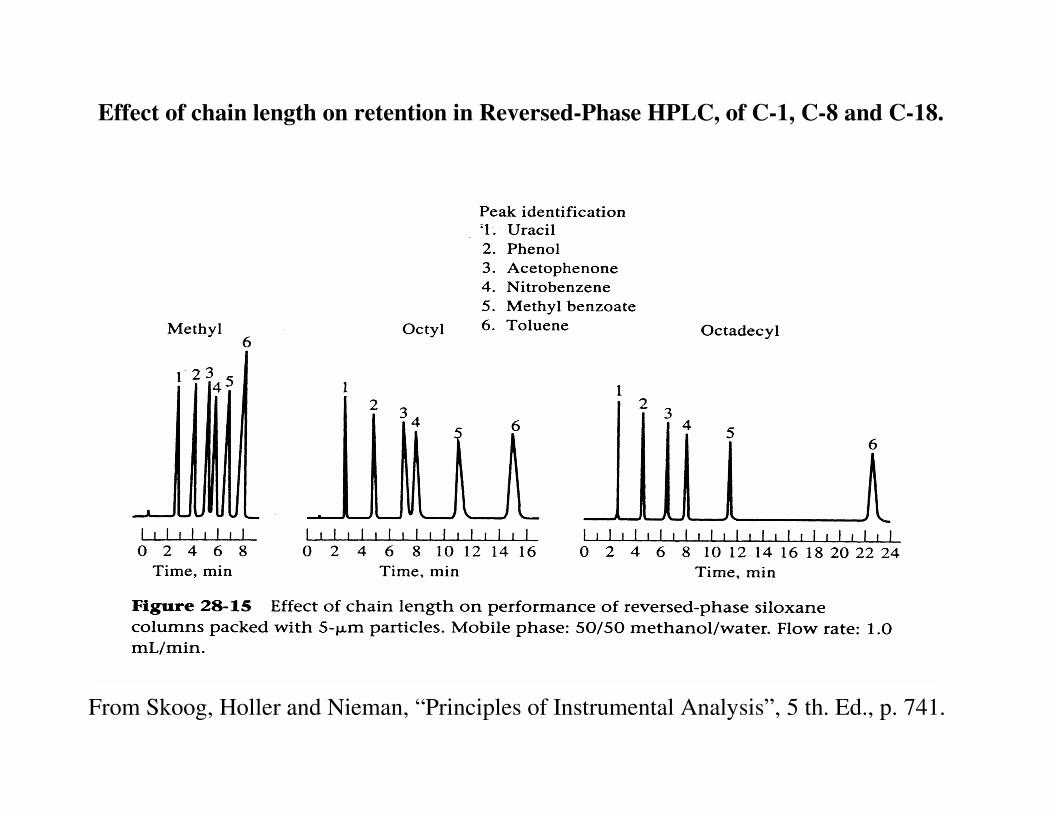
Effect of chain length on retention in Reversed-Phase HPLC, of C-1, C-8 and C-18.
From Skoog, Holler and Nieman, “Principles of Instrumental Analysis”, 5 th. Ed., p. 741.
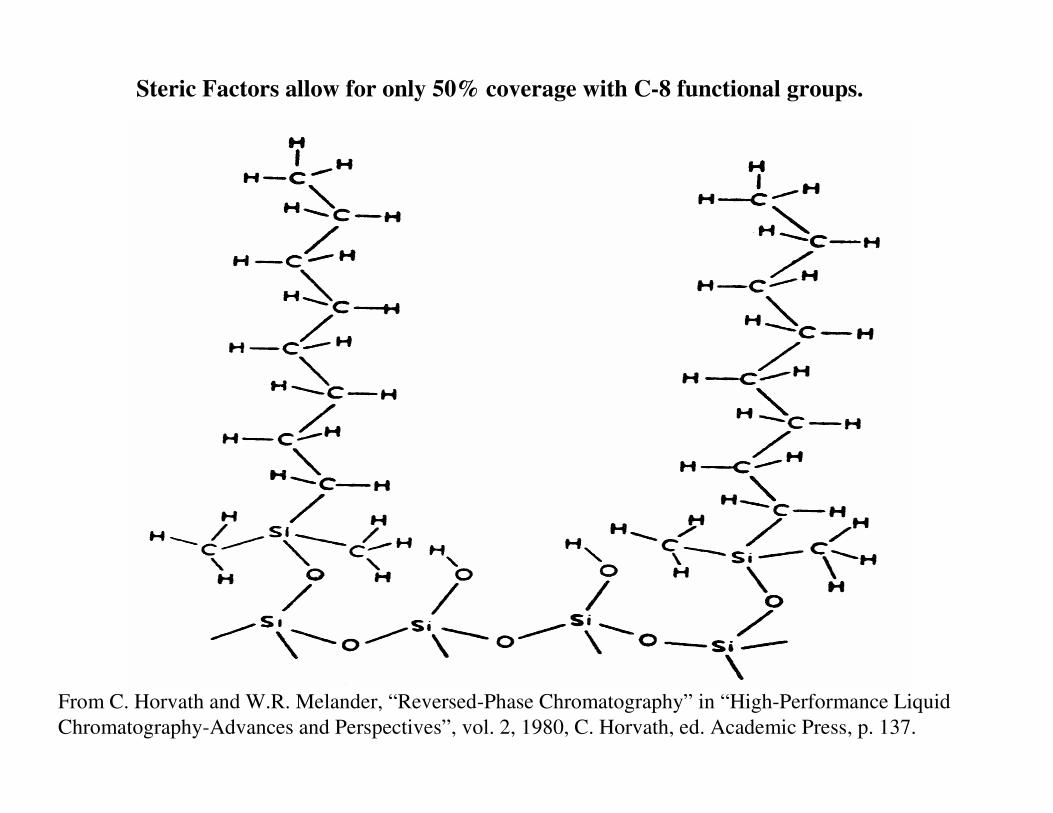
Steric Factors allow for only 50% coverage with C-8 functional groups.
From C. Horvath and W.R. Melander, “Reversed-Phase Chromatography” in “High-Performance LiquidChromatography-Advances and Perspectives”, vol. 2, 1980, C. Horvath, ed. Academic Press, p. 137.
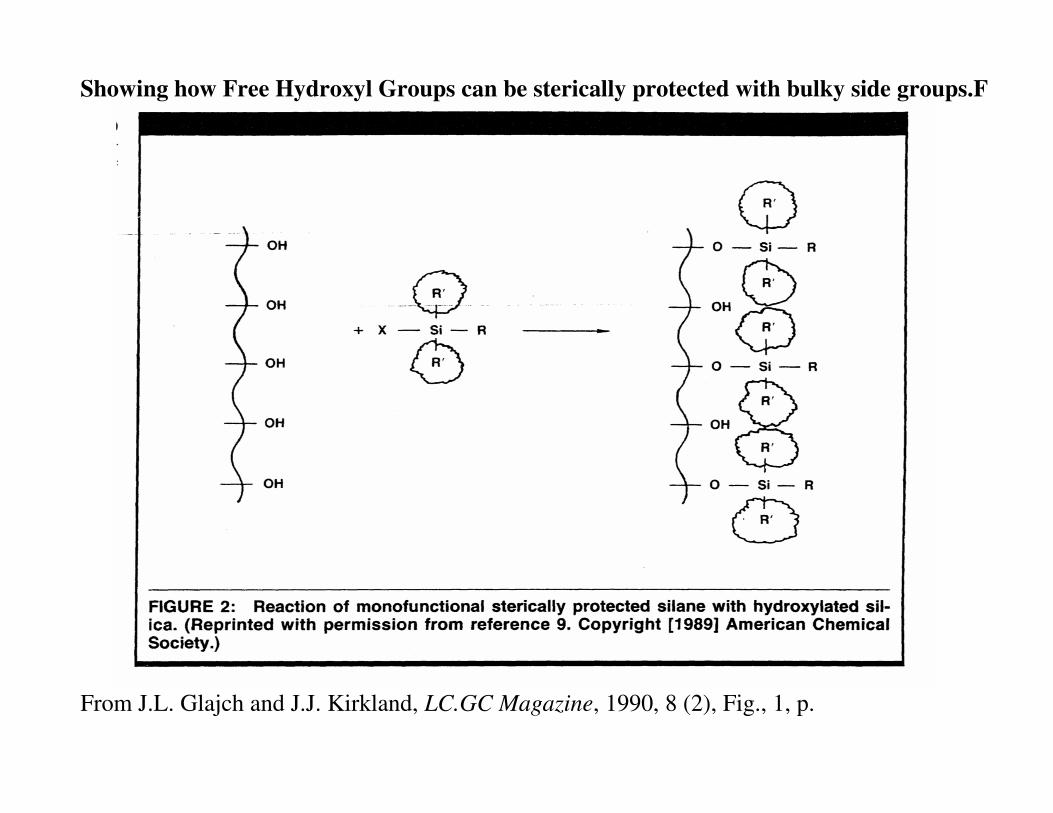
Showing how Free Hydroxyl Groups can be sterically protected with bulky side groups.F
From J.L. Glajch and J.J. Kirkland, LC.GC Magazine, 1990, 8 (2), Fig., 1, p.
From C. Horvath and W.R. Melander, “ Reversed-Phase Chromatography” in “ High-Performance LiquidChromatography-Advances and Perspectives” , vol. 2, 1980, C. Horvath, ed. Academic Press, p. 138.
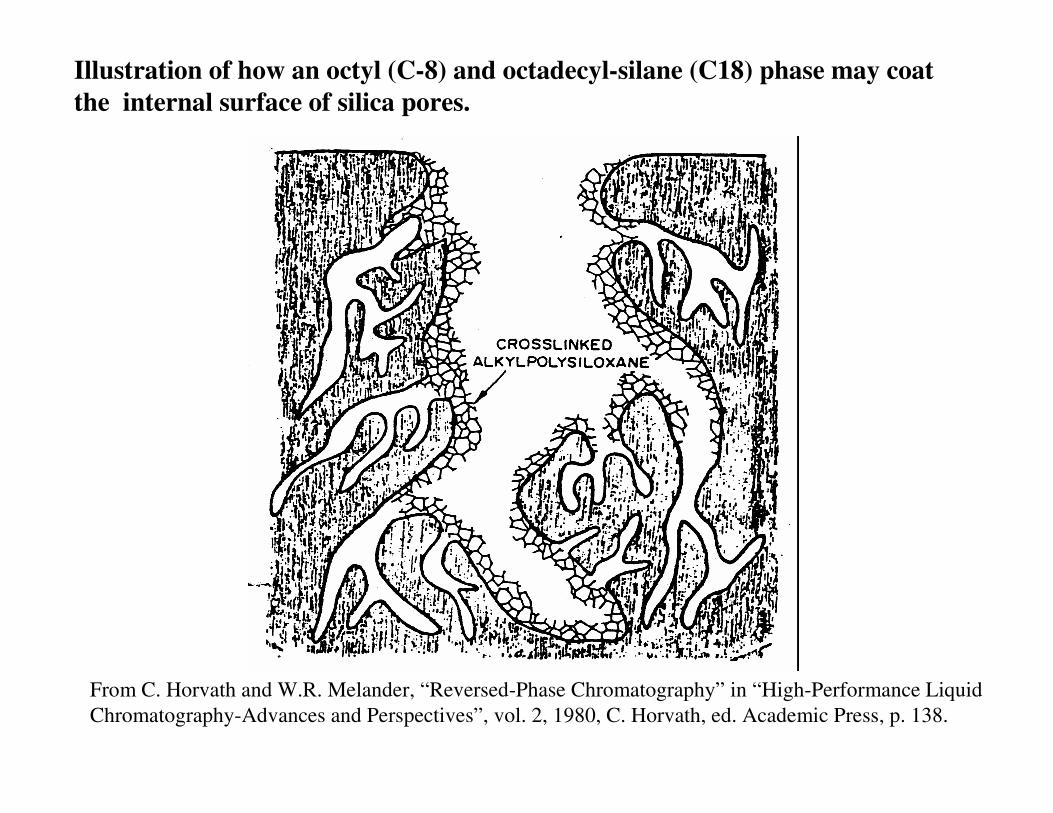
Illustration of how an octyl (C-8) and octadecyl-silane (C18) phase may coat the internal surface of silica pores.
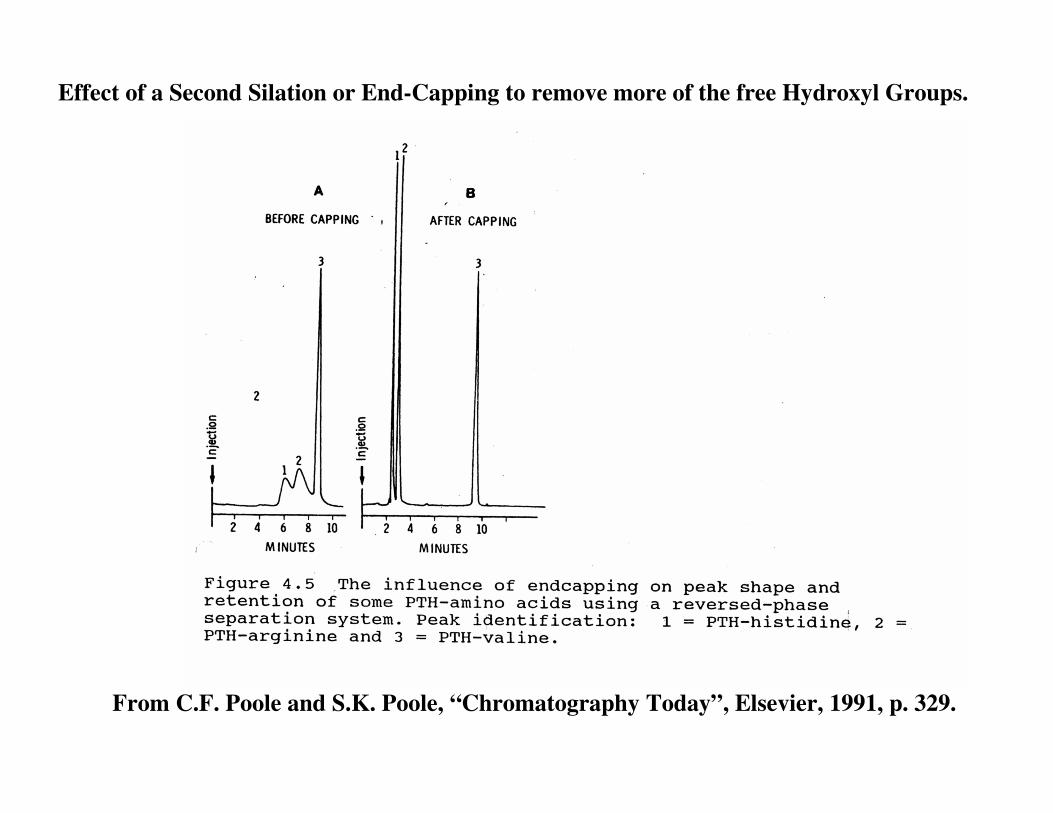
From C.F. Poole and S.K. Poole, “Chromatography Today”, Elsevier, 1991, p. 329.
Effect of a Second Silation or End-Capping to remove more of the free Hydroxyl Groups.
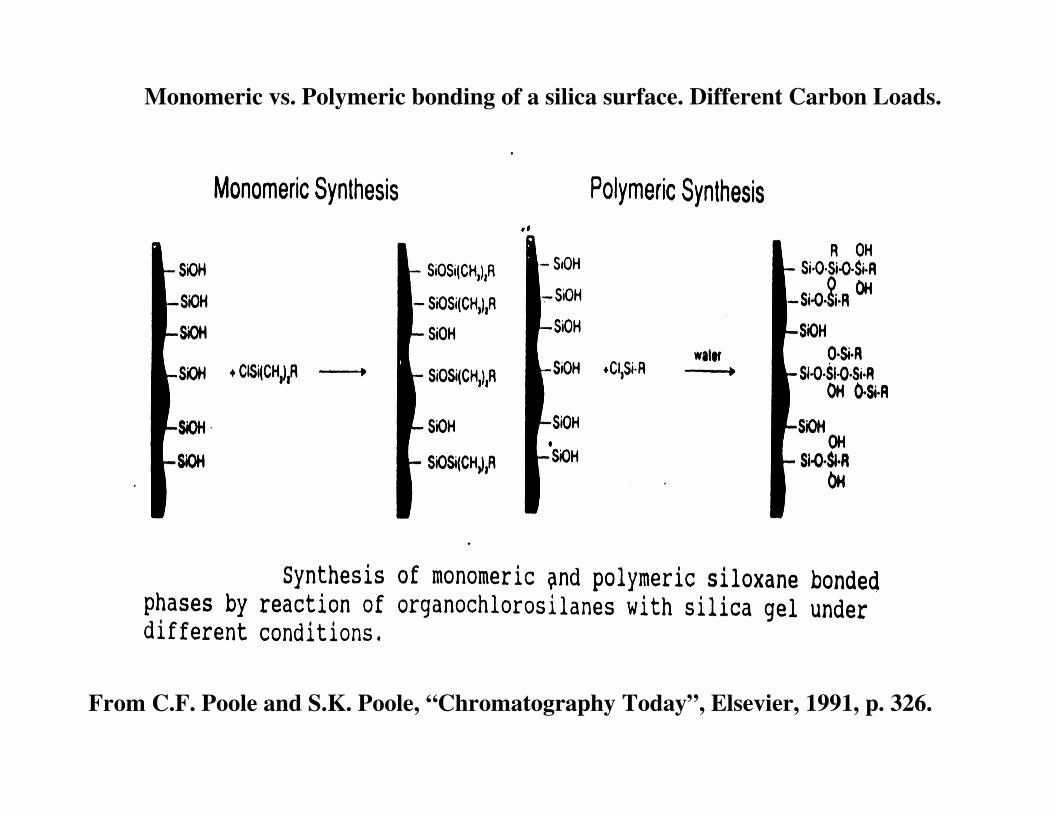
From C.F. Poole and S.K. Poole, “Chromatography Today”, Elsevier, 1991, p. 326.
Monomeric vs. Polymeric bonding of a silica surface. Different Carbon Loads.
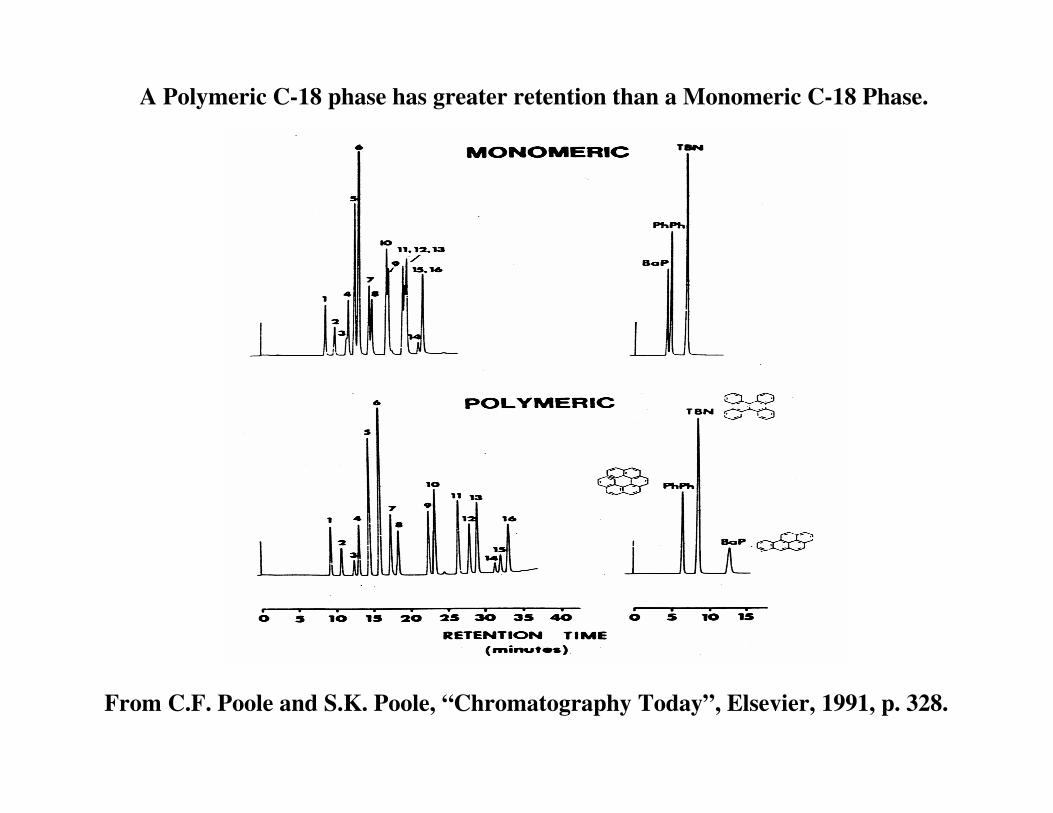
From C.F. Poole and S.K. Poole, “Chromatography Today”, Elsevier, 1991, p. 328.
A Polymeric C-18 phase has greater retention than a Monomeric C-18 Phase.
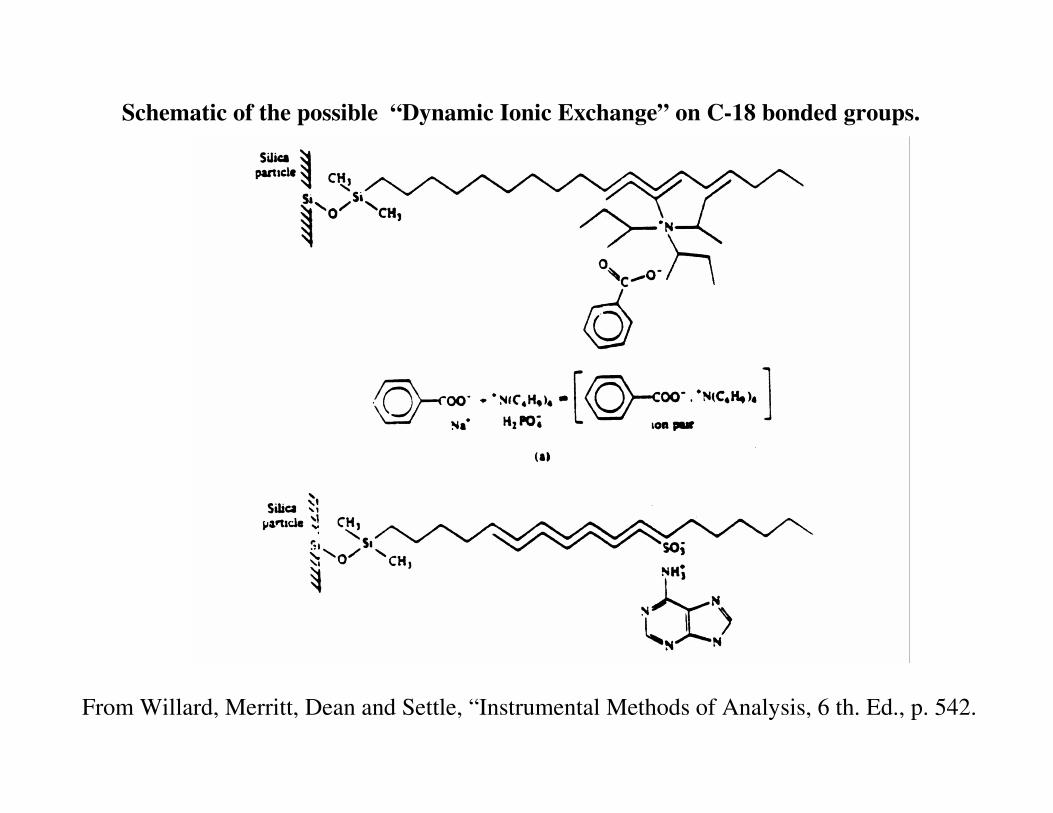
Schematic of the possible “Dynamic Ionic Exchange” on C-18 bonded groups.
From Willard, Merritt, Dean and Settle, “ Instrumental Methods of Analysis, 6 th. Ed., p. 542.
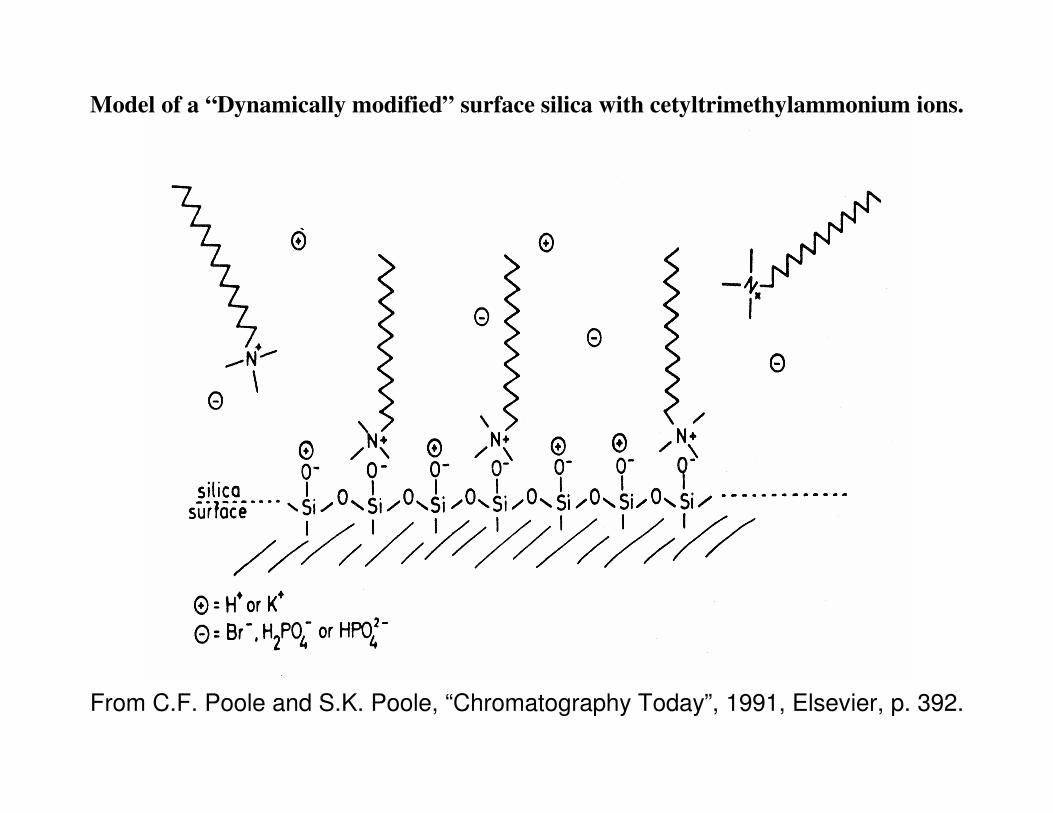
From C.F. Poole and S.K. Poole, “Chromatography Today”, 1991, Elsevier, p. 392.
Model of a “Dynamically modified” surface silica with cetyltrimethylammonium ions.
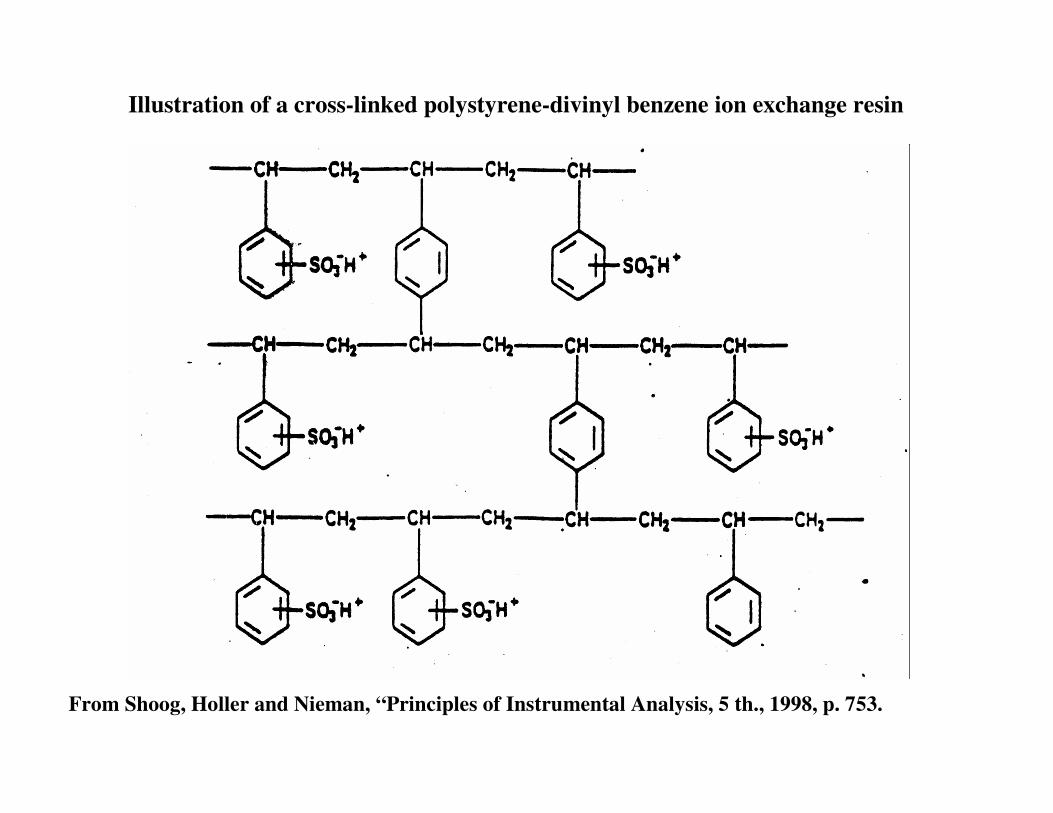
Illustration of a cross-linked polystyrene-divinyl benzene ion exchange resin
From Shoog, Holler and Nieman, “Principles of Instrumental Analysis, 5 th., 1998, p. 753.
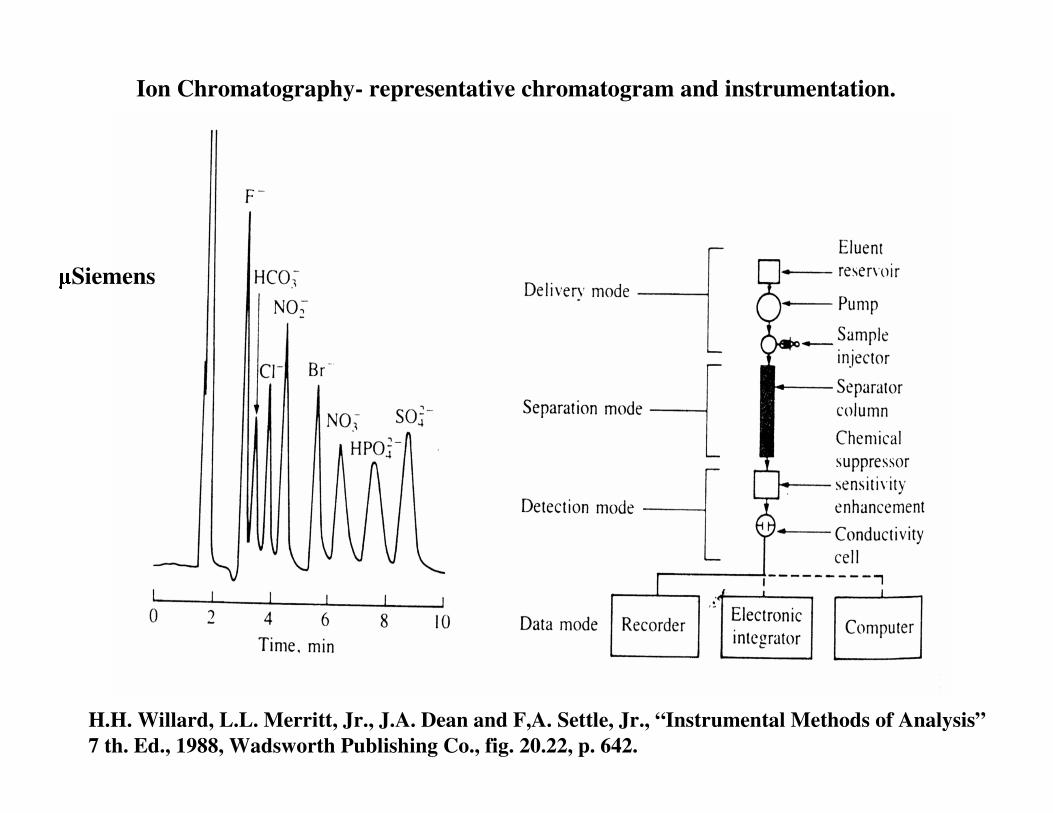
Ion Chromatography- representative chromatogram and instrumentation.
H.H. Willard, L.L. Merritt, Jr., J.A. Dean and F,A. Settle, Jr., “Instrumental Methods of Analysis”7 th. Ed., 1988, Wadsworth Publishing Co., fig. 20.22, p. 642.
Siemens
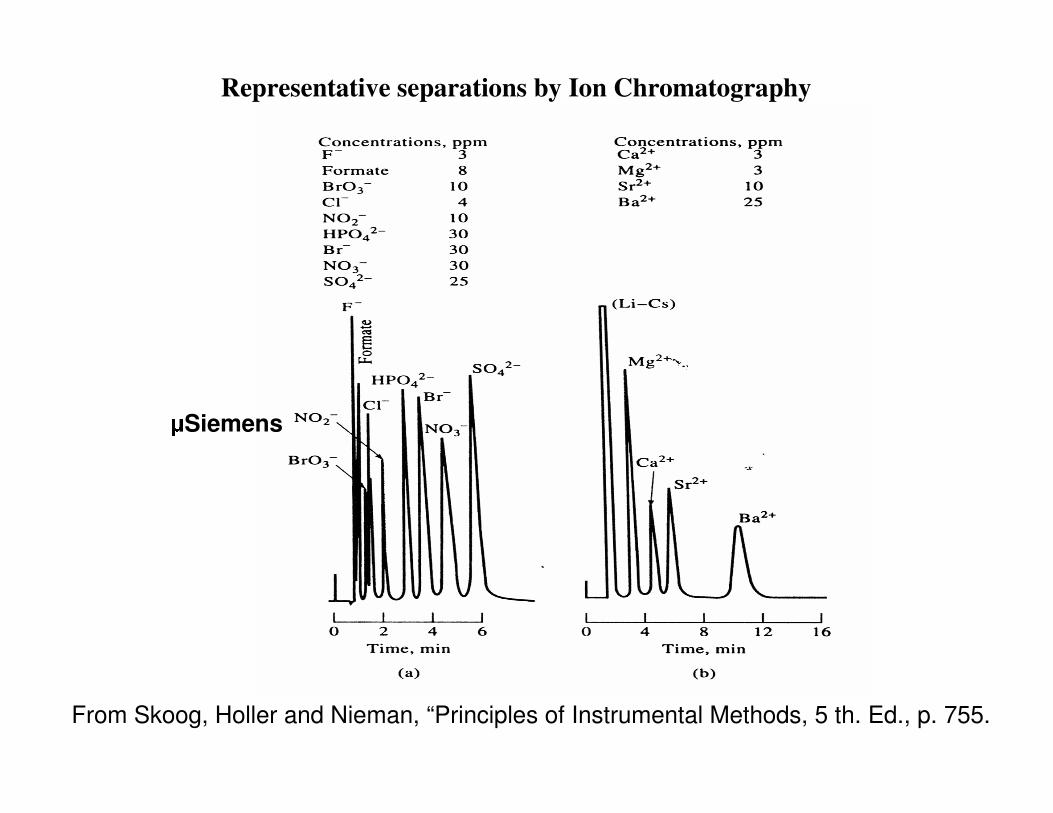
From Skoog, Holler and Nieman, “Principles of Instrumental Methods, 5 th. Ed., p. 755.
Representative separations by Ion Chromatography
Siemens
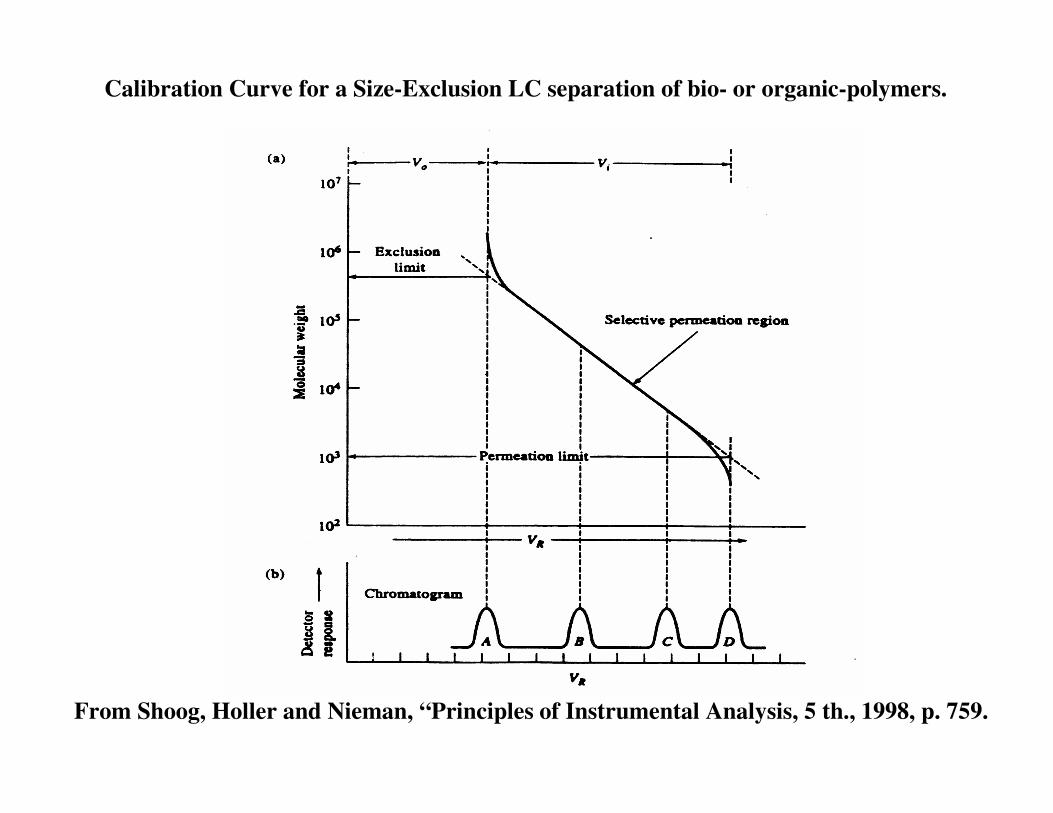
From Shoog, Holler and Nieman, “Principles of Instrumental Analysis, 5 th., 1998, p. 759.
Calibration Curve for a Size-Exclusion LC separation of bio- or organic-polymers.
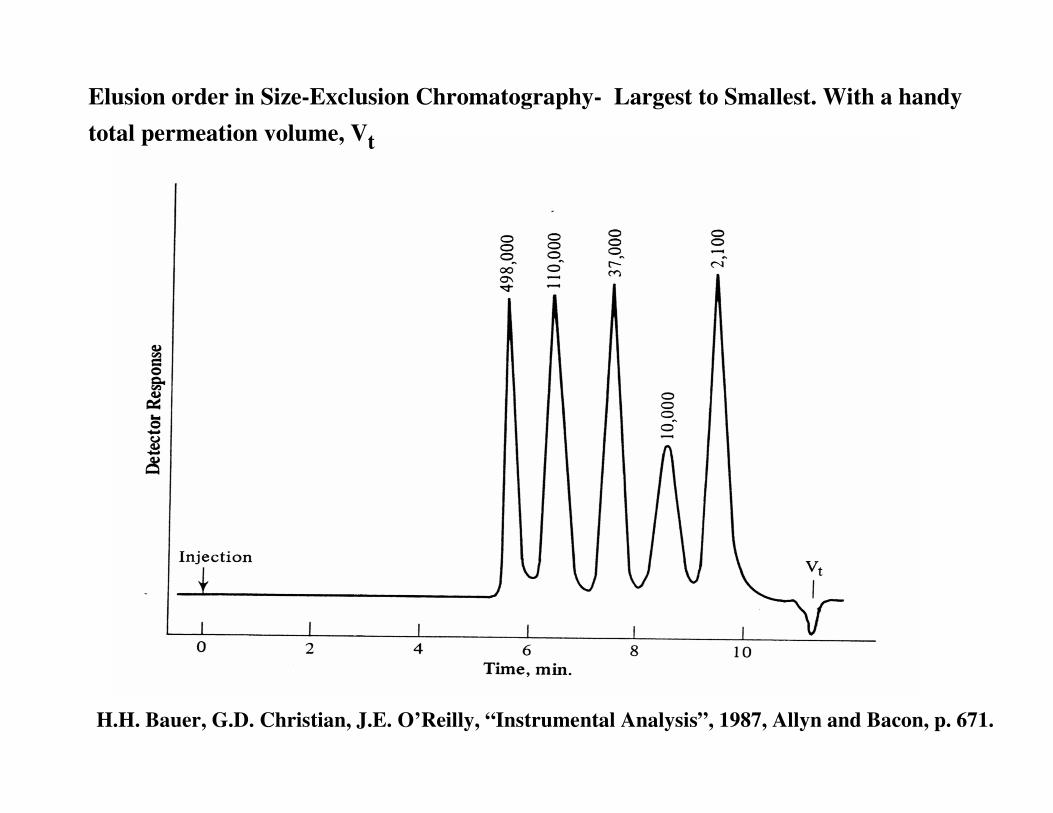
Elusion order in Size-Exclusion Chromatography- Largest to Smallest. With a handy total permeation volume, Vt
H.H. Bauer, G.D. Christian, J.E. O’Reilly, “Instrumental Analysis”, 1987, Allyn and Bacon, p. 671.
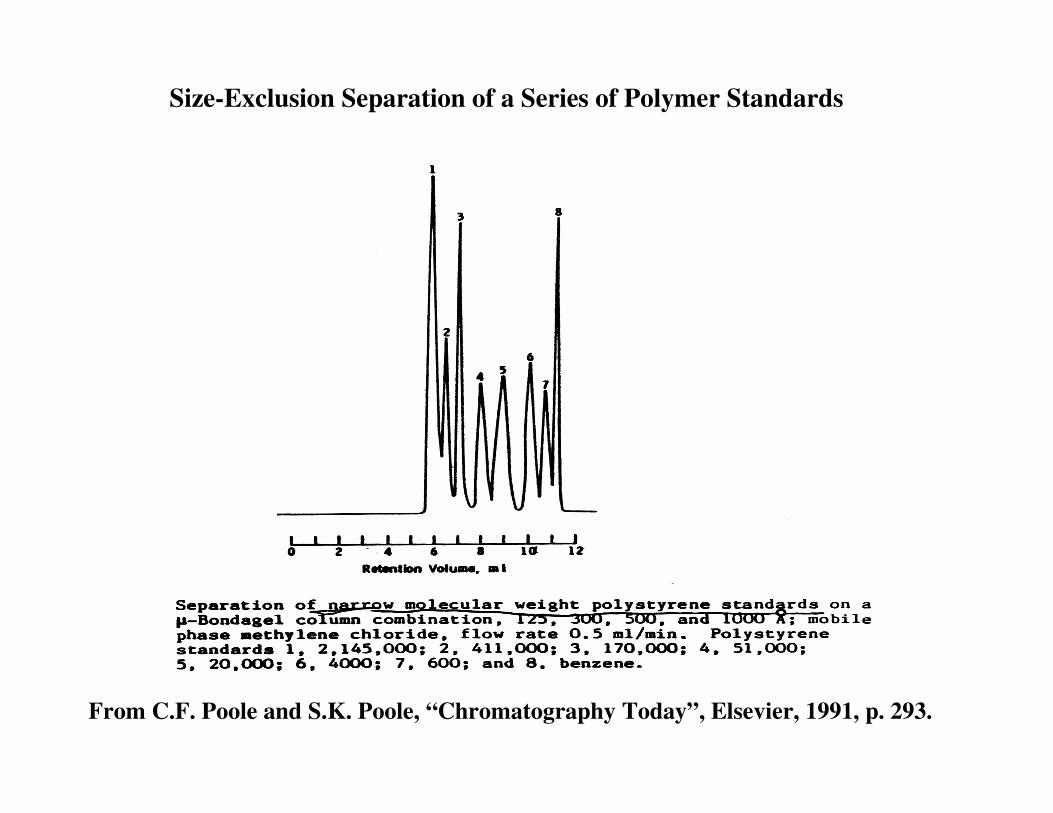
Size-Exclusion Separation of a Series of Polymer Standards
From C.F. Poole and S.K. Poole, “Chromatography Today”, Elsevier, 1991, p. 293.
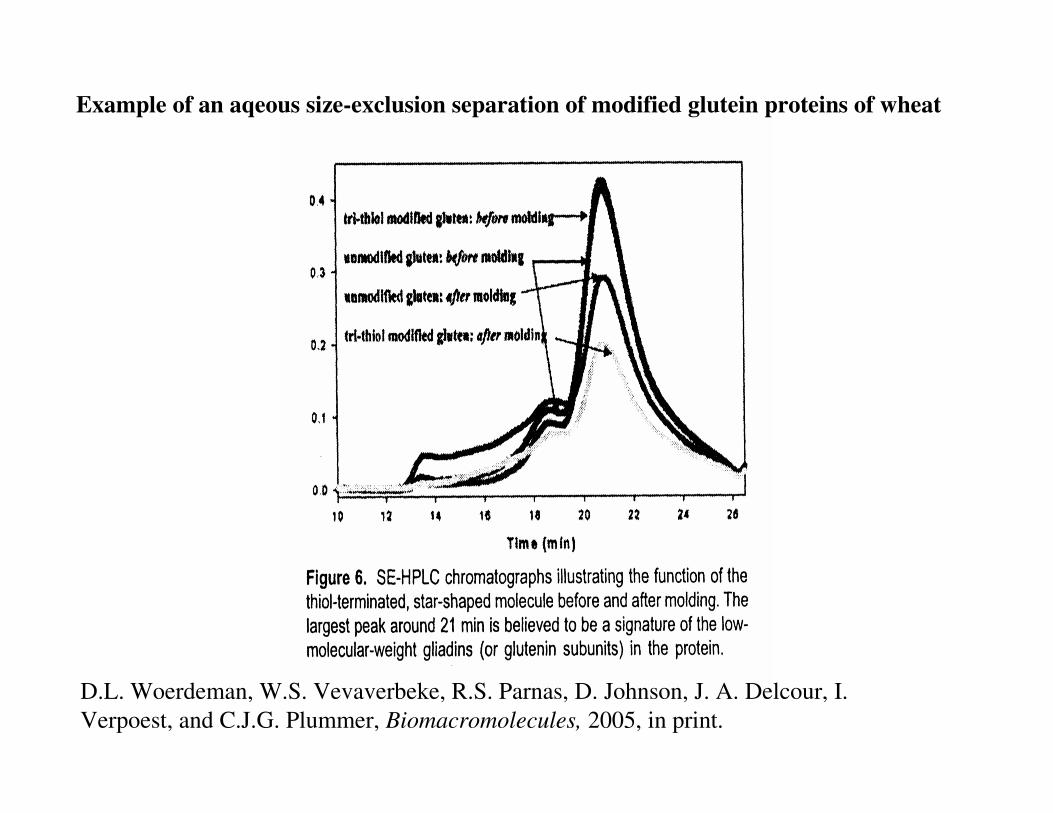
Example of an aqeous size-exclusion separation of modified glutein proteins of wheat
D.L. Woerdeman, W.S. Vevaverbeke, R.S. Parnas, D. Johnson, J. A. Delcour, I. Verpoest, and C.J.G. Plummer, Biomacromolecules, 2005, in print.