Embed Size (px)
Citation preview
Handelsbanken January – June 2016
15 July 2016

0
25
50
75
100
125
Q30
7Q
407
Q10
8Q
208
Q30
8Q
408
Q10
9Q
209
Q30
9Q
409
Q11
0Q
210
Q31
0Q
410
Q11
1Q
211
Q31
1Q
411
Q11
2Q
212
Q31
2Q
412
Q11
3Q
213
Q31
3Q
413
Q11
4Q
214
Q31
4Q
414
Q11
5Q
215
Q31
5Q
415
Q11
6Q
216
Adjusted equity per share Accumulated dividends since 2008
Average annual growth in equity
2
Dividends reinvested in ROE per quarter CAGR = Compounded annual growth rate
SEK/share
Including dividends
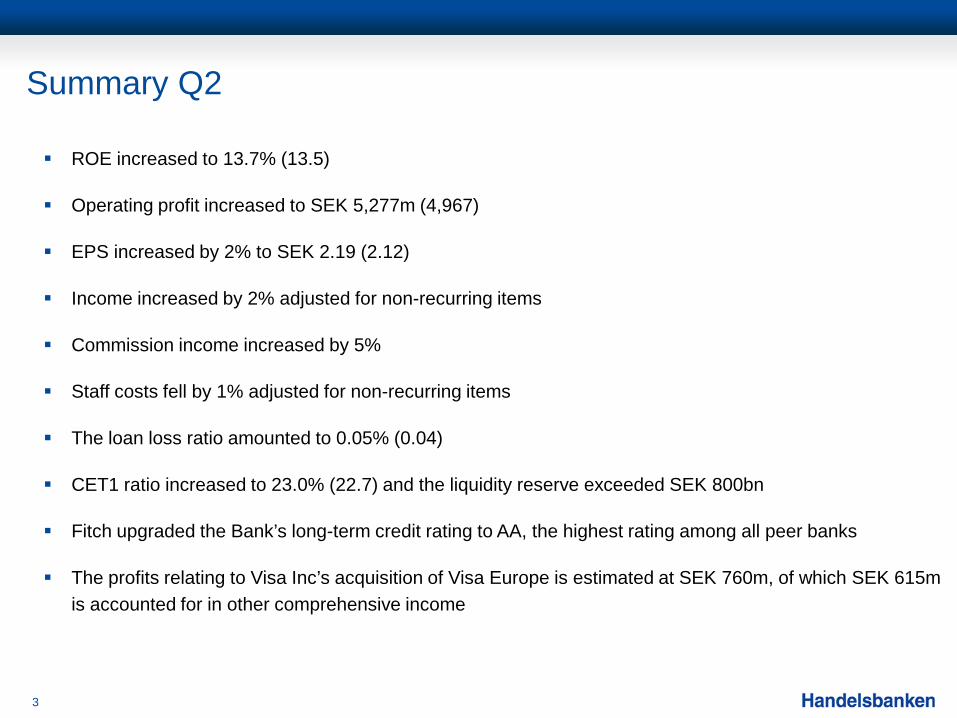
Summary Q2
3
ROE increased to 13.7% (13.5)
Operating profit increased to SEK 5,277m (4,967)
EPS increased by 2% to SEK 2.19 (2.12)
Income increased by 2% adjusted for non-recurring items
Commission income increased by 5%
Staff costs fell by 1% adjusted for non-recurring items
The loan loss ratio amounted to 0.05% (0.04)
CET1 ratio increased to 23.0% (22.7) and the liquidity reserve exceeded SEK 800bn
Fitch upgraded the Bank’s long-term credit rating to AA, the highest rating among all peer banks
The profits relating to Visa Inc’s acquisition of Visa Europe is estimated at SEK 760m, of which SEK 615m is accounted for in other comprehensive income
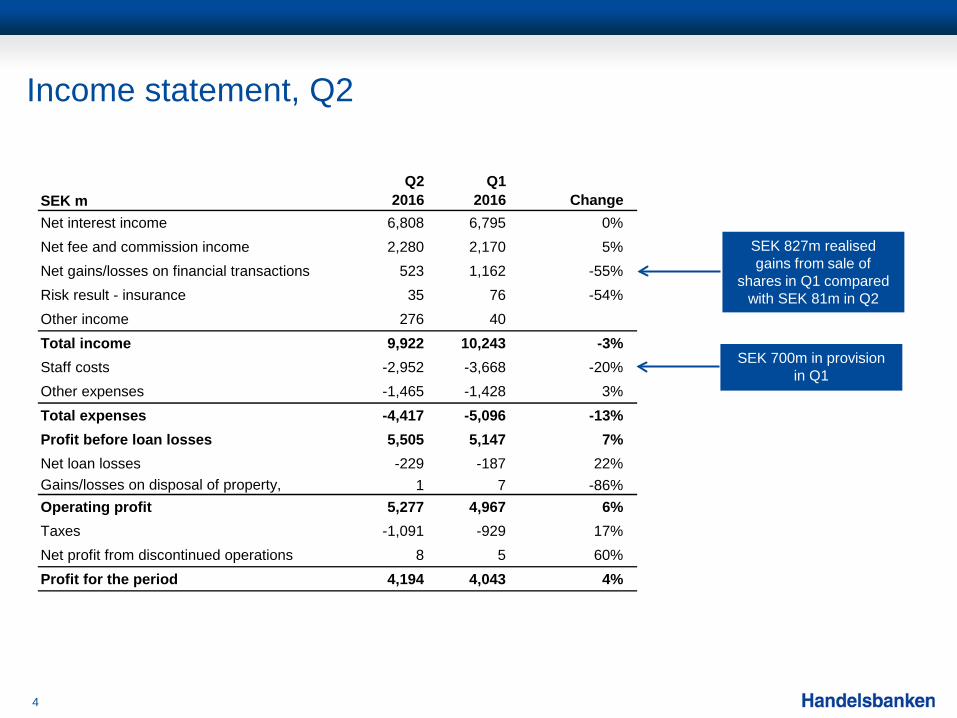
Income statement, Q2
4
SEK mQ2
2016Q1
2016 ChangeQ2
2015 ChangeNet interest income 6,808 6,795 0% 7,019 -3%Net fee and commission income 2,280 2,170 5% 2,359 -3%Net gains/losses on financial transactions 523 1,162 -55% 451 16%Risk result - insurance 35 76 -54% 55 -36%Other income 276 40 337 -18%Total income 9,922 10,243 -3% 10,221 -3%Staff costs -2,952 -3,668 -20% -3,149 -6%Other expenses -1,465 -1,428 3% -1,458 0%Total expenses -4,417 -5,096 -13% -4,607 -4%Profit before loan losses 5,505 5,147 7% 5,614 -2%Net loan losses -229 -187 22% -359 -36%Gains/losses on disposal of property,
1 7 -86% 1 0%
Operating profit 5,277 4,967 6% 5,256 0%Taxes -1,091 -929 17% -1,110 -2%Net profit from discontinued operations 8 5 60% 27 -70%Profit for the period 4,194 4,043 4% 4,173 1%
SEK 700m in provision in Q1
SEK 827m realised gains from sale of
shares in Q1 compared with SEK 81m in Q2
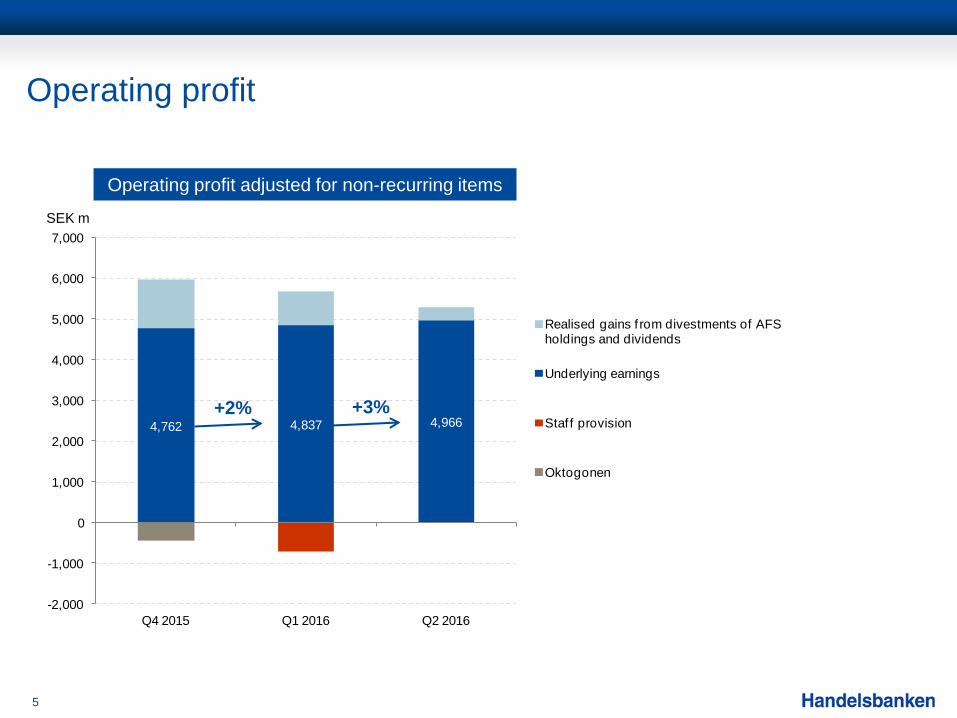
4,762 4,837 4,966
-2,000
-1,000
0
1,000
2,000
3,000
4,000
5,000
6,000
7,000
Q4 2015 Q1 2016 Q2 2016
Realised gains f rom divestments of AFS holdings and dividends
Underlying earnings
Staf f provision
Oktogonen
Operating profit
5
SEK m
Operating profit adjusted for non-recurring items
+3% +2%

1,550
1,600
1,650
1,700
1,750
1,800
1,850
1,900
1,950
2,000
Q413 Q114 Q214 Q314 Q414 Q115 Q215 Q315 Q415 Q116 Q216
Good volume growth in the Group
6
Loans to the public
Stable development of the lending operation
SEK bn
-0.5%
-0.4%
-0.3%
-0.2%
-0.1%
0.0%
0.1%
0.2%
0.3%
-250
-200
-150
-100
-50
0
50
100
150
Q413Q114Q214Q314Q414Q115Q215Q315Q415Q116Q216Q316Q416Q117Q217
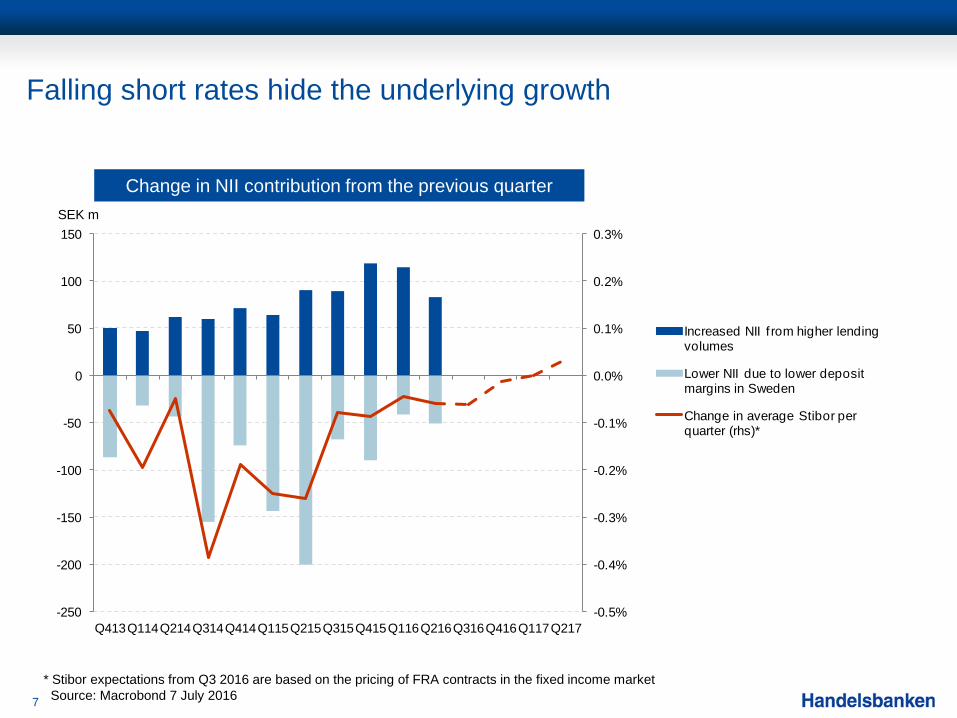
Increased NII f rom higher lending volumes
Lower NII due to lower deposit margins in Sweden
Change in average Stibor per quarter (rhs)*
Falling short rates hide the underlying growth
7
SEK m
Change in NII contribution from the previous quarter
* Stibor expectations from Q3 2016 are based on the pricing of FRA contracts in the fixed income market Source: Macrobond 7 July 2016
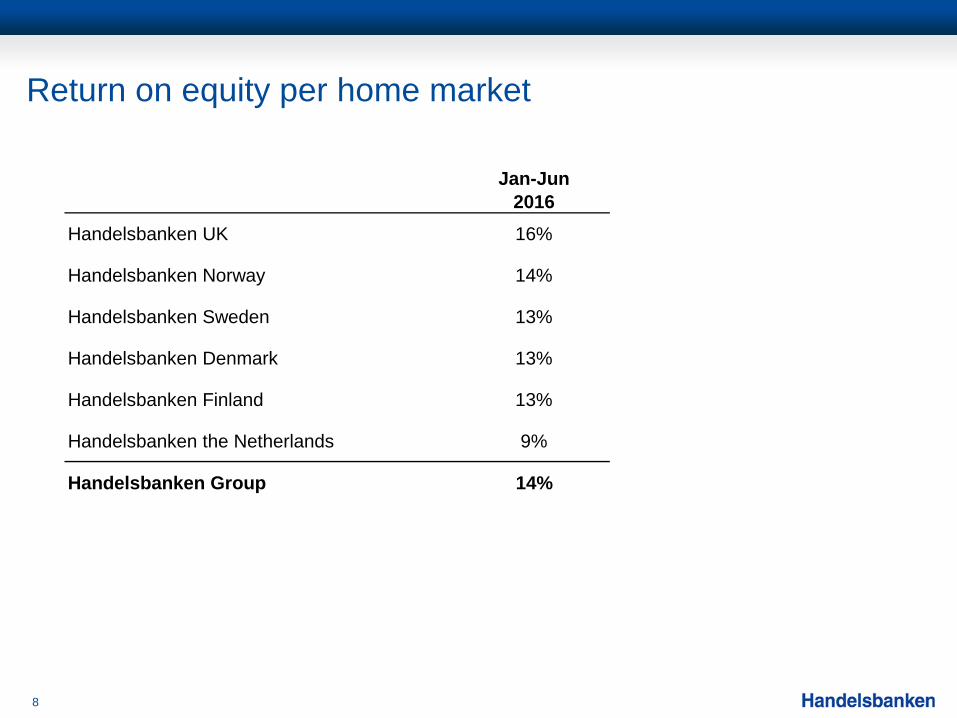
Return on equity per home market
8
Jan-Jun 2016
Handelsbanken UK 16%
Handelsbanken Norway 14%
Handelsbanken Sweden 13%
Handelsbanken Denmark 13%
Handelsbanken Finland 13%
Handelsbanken the Netherlands 9%
Handelsbanken Group 14%
0
5
10
15
20
25
30
30 Jun 2016
CET1 ratio Tier 1 ratio Capital ratio
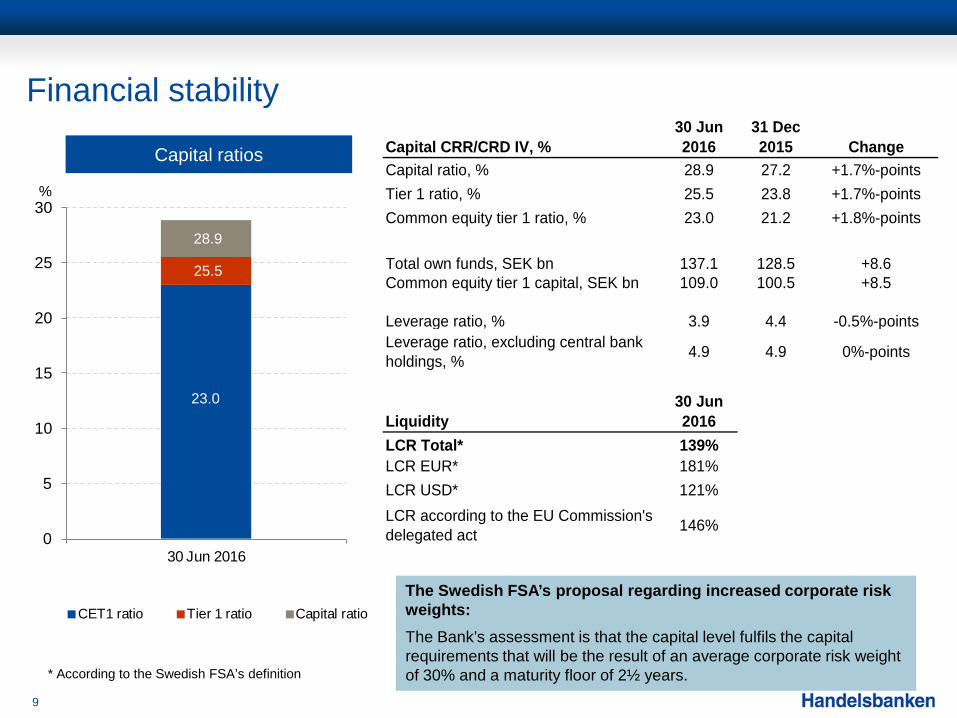
Financial stability
9
Capital ratios
%
25.5
28.9
23.0
The Swedish FSA’s proposal regarding increased corporate risk weights: The Bank’s assessment is that the capital level fulfils the capital requirements that will be the result of an average corporate risk weight of 30% and a maturity floor of 2½ years. * According to the Swedish FSA’s definition
Capital CRR/CRD IV, %30 Jun 2016
31 Dec 2015 Change
Capital ratio, % 28.9 27.2 +1.7%-pointsTier 1 ratio, % 25.5 23.8 +1.7%-pointsCommon equity tier 1 ratio, % 23.0 21.2 +1.8%-points
Total own funds, SEK bn 137.1 128.5 +8.6Common equity tier 1 capital, SEK bn 109.0 100.5 +8.5
Leverage ratio, % 3.9 4.4 -0.5%-pointsLeverage ratio, excluding central bank holdings, % 4.9 4.9 0%-points
Liquidity30 Jun 2016
LCR Total* 139%LCR EUR* 181%LCR USD* 121%LCR according to the EU Commission's delegated act 146%
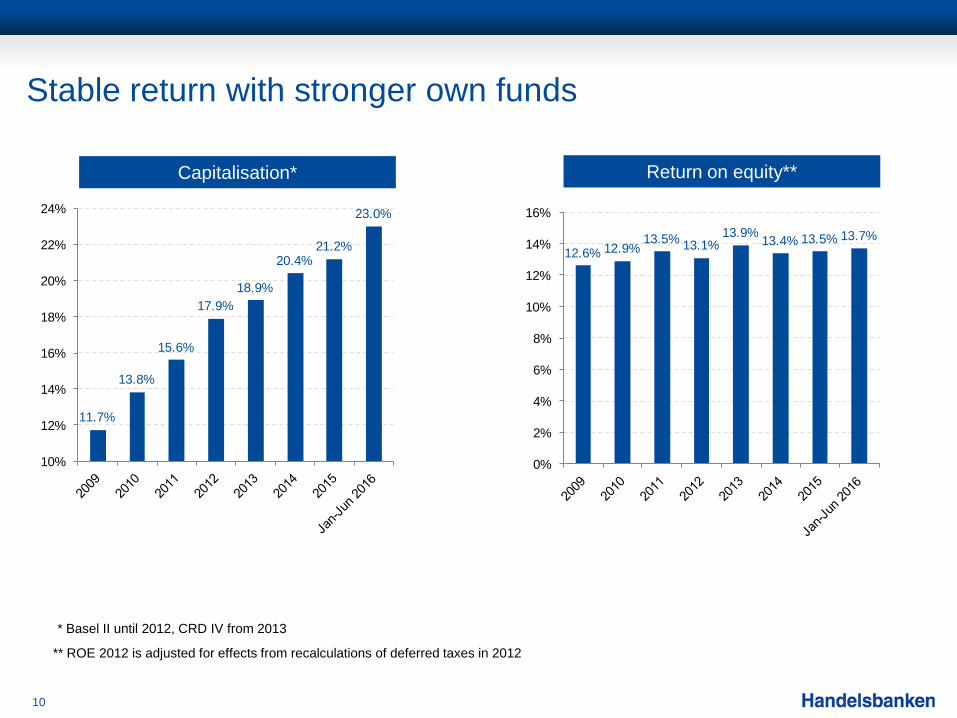
Stable return with stronger own funds
10
Capitalisation*
* Basel II until 2012, CRD IV from 2013
Return on equity**
** ROE 2012 is adjusted for effects from recalculations of deferred taxes in 2012
12.6% 12.9%13.5% 13.1%
13.9% 13.4% 13.5% 13.7%
0%
2%
4%
6%
8%
10%
12%
14%
16%
11.7%
13.8%
15.6%
17.9%18.9%
20.4%21.2%
23.0%
10%
12%
14%
16%
18%
20%
22%
24%
0
2
4
6
8
10
12
14
16
18
2007 2008 2009 2010 2011 2012 2013 2014 2015 Jan-Jun 2016
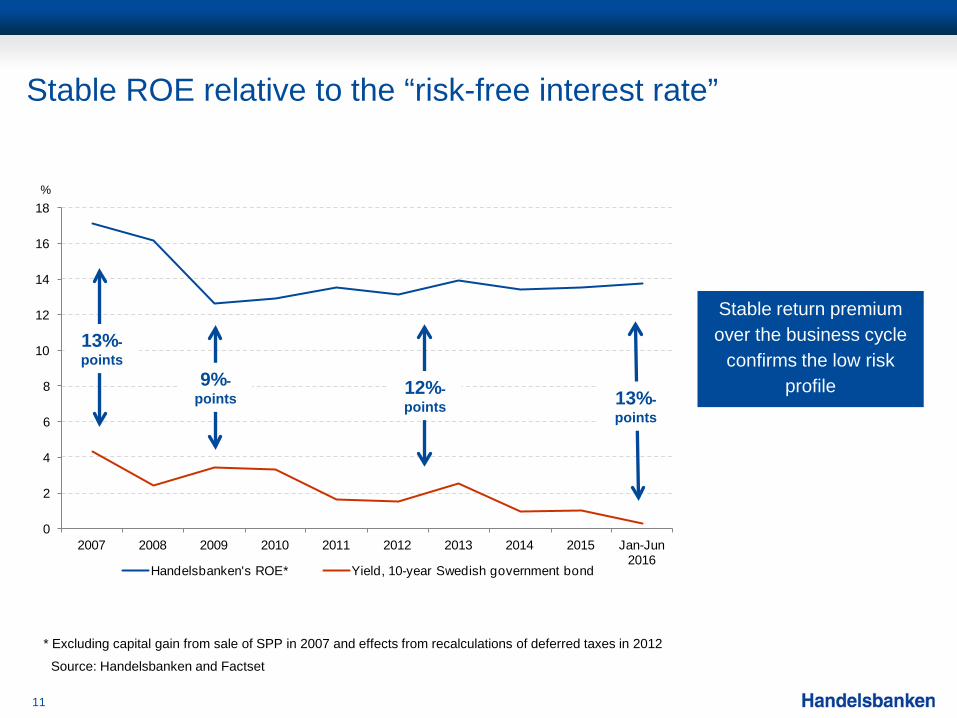
Handelsbanken's ROE* Yield, 10-year Swedish government bond
Stable ROE relative to the “risk-free interest rate”
11
%
Stable return premium over the business cycle
confirms the low risk profile 9%-
points
13%- points
13%- points
12%- points
Source: Handelsbanken and Factset
* Excluding capital gain from sale of SPP in 2007 and effects from recalculations of deferred taxes in 2012
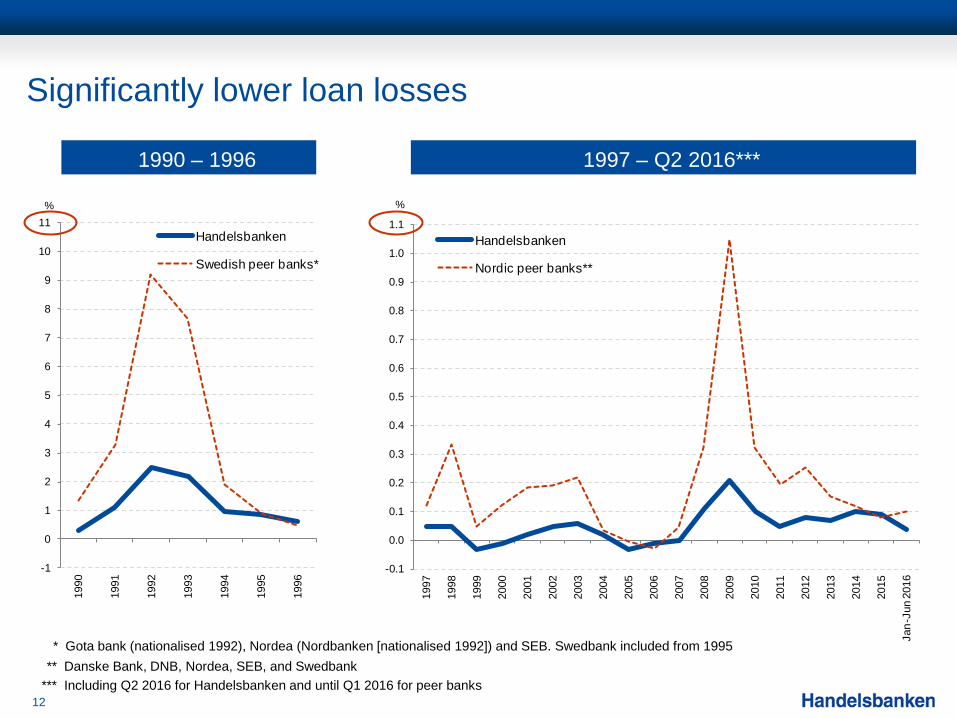
Significantly lower loan losses
12
-1
0
1
2
3
4
5
6
7
8
9
10
11
1990
1991
1992
1993
1994
1995
1996
Handelsbanken
Swedish peer banks*
-0.1
0.0
0.1
0.2
0.3
0.4
0.5
0.6
0.7
0.8
0.9
1.0
1.1
1997
1998
1999
2000
2001
2002
2003
2004
2005
2006
2007
2008
2009
2010
2011
2012
2013
2014
2015
Jan-
Jun
2016
Handelsbanken
Nordic peer banks**
* Gota bank (nationalised 1992), Nordea (Nordbanken [nationalised 1992]) and SEB. Swedbank included from 1995 ** Danske Bank, DNB, Nordea, SEB, and Swedbank
% %
1990 – 1996 1997 – Q2 2016***
*** Including Q2 2016 for Handelsbanken and until Q1 2016 for peer banks
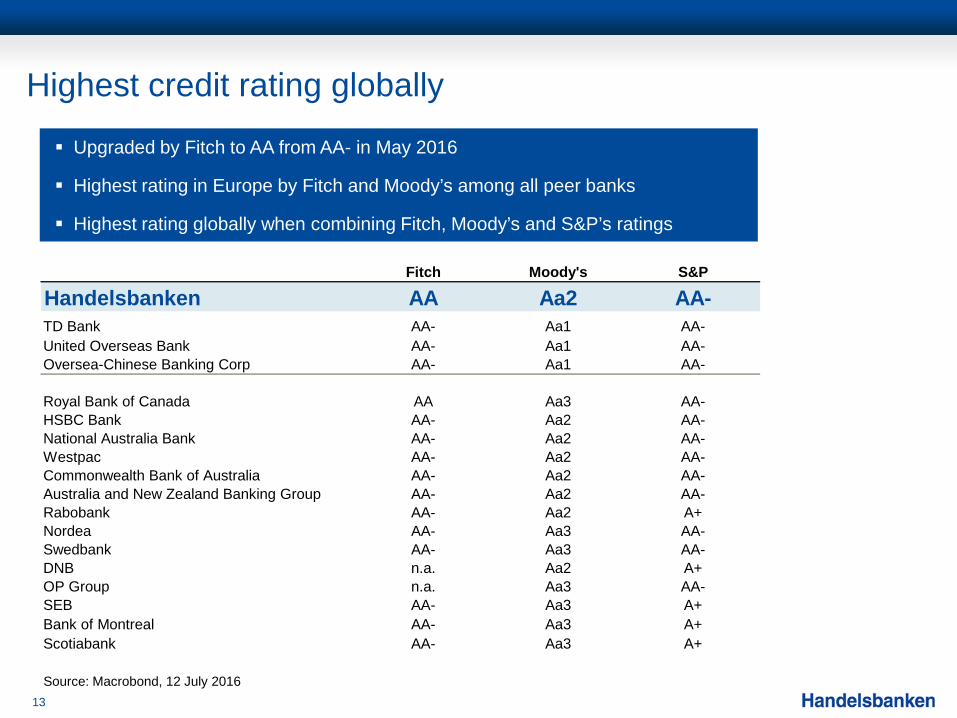
Highest credit rating globally
13
Upgraded by Fitch to AA from AA- in May 2016
Highest rating in Europe by Fitch and Moody’s among all peer banks
Highest rating globally when combining Fitch, Moody’s and S&P’s ratings
Fitch Moody's S&P
Handelsbanken AA Aa2 AA-TD Bank AA- Aa1 AA-United Overseas Bank AA- Aa1 AA-Oversea-Chinese Banking Corp AA- Aa1 AA-
Royal Bank of Canada AA Aa3 AA-HSBC Bank AA- Aa2 AA-National Australia Bank AA- Aa2 AA-Westpac AA- Aa2 AA-Commonwealth Bank of Australia AA- Aa2 AA-Australia and New Zealand Banking Group AA- Aa2 AA-Rabobank AA- Aa2 A+Nordea AA- Aa3 AA-Swedbank AA- Aa3 AA-DNB n.a. Aa2 A+OP Group n.a. Aa3 AA-SEB AA- Aa3 A+Bank of Montreal AA- Aa3 A+Scotiabank AA- Aa3 A+
Source: Macrobond, 12 July 2016

125
92
9 20 29
-20
0
20
40
60
80
100
120
140
2010 2011 2012 2013 2014 2015 Jan-Jun 2016
Handelsbanken
Bank 1
Bank 2
Bank 3
Bank 4
Largest institution for new savings in the Swedish fund market
Accumulated net inflows into Swedish mutual funds
SEK bn
14
SEK 5.5bn in net inflows during the first half of 2016
on a flat market (+0.2)
Handelsbanken’s market share of total outstanding mutual fund volumes in
Sweden is 11%*
Source: Moneymate. Mutual fund volumes include equity, mixed, hedge and fixed income funds. Competitor banks included are Danske Bank, Nordea, SEB and Swedbank * March 2016
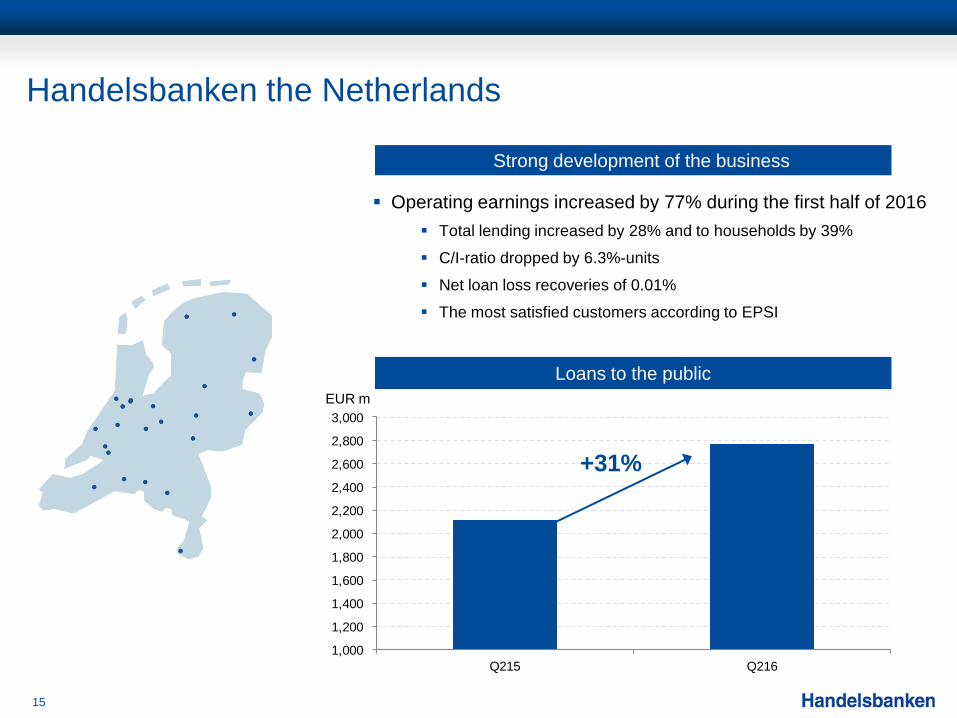
Handelsbanken the Netherlands
15
1,000
1,200
1,400
1,600
1,800
2,000
2,200
2,400
2,600
2,800
3,000
Q215 Q216
+31%
Loans to the public EUR m
Operating earnings increased by 77% during the first half of 2016 Total lending increased by 28% and to households by 39%
C/I-ratio dropped by 6.3%-units
Net loan loss recoveries of 0.01%
The most satisfied customers according to EPSI
Strong development of the business
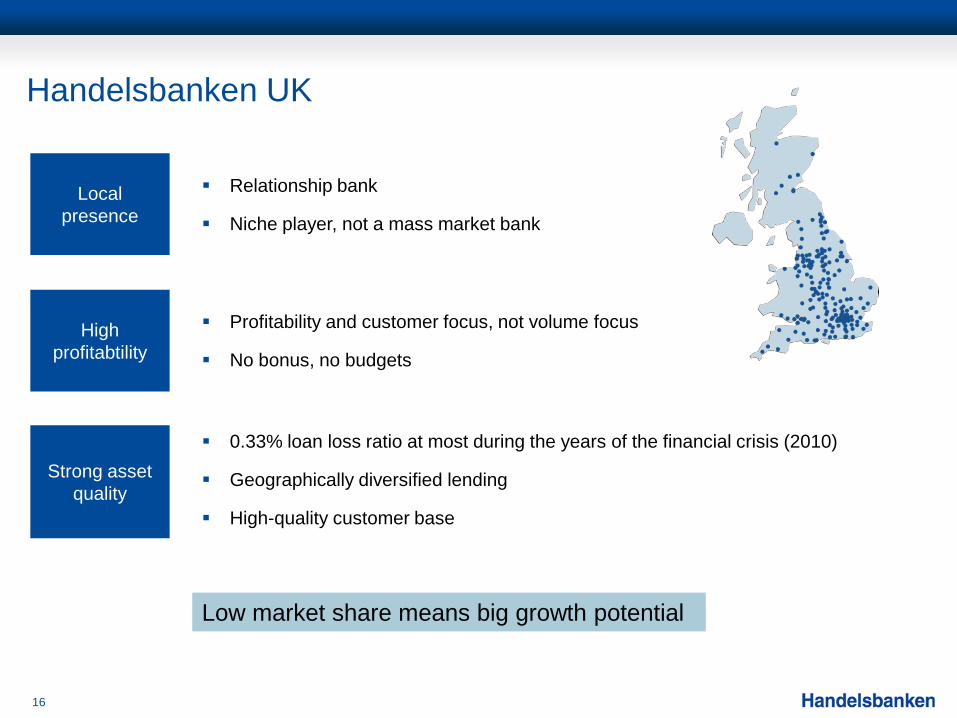
Handelsbanken UK
16
Relationship bank
Niche player, not a mass market bank Local
presence
High profitabtility
Profitability and customer focus, not volume focus
No bonus, no budgets
0.33% loan loss ratio at most during the years of the financial crisis (2010)
Geographically diversified lending
High-quality customer base
Strong asset quality
Low market share means big growth potential
0.00
0.50
1.00
1.50
2.00
2.50
2008 2009 2010 2011 2012 2013 2014 2015 Jan-Jun 2016**
Handelsbanken Peers*
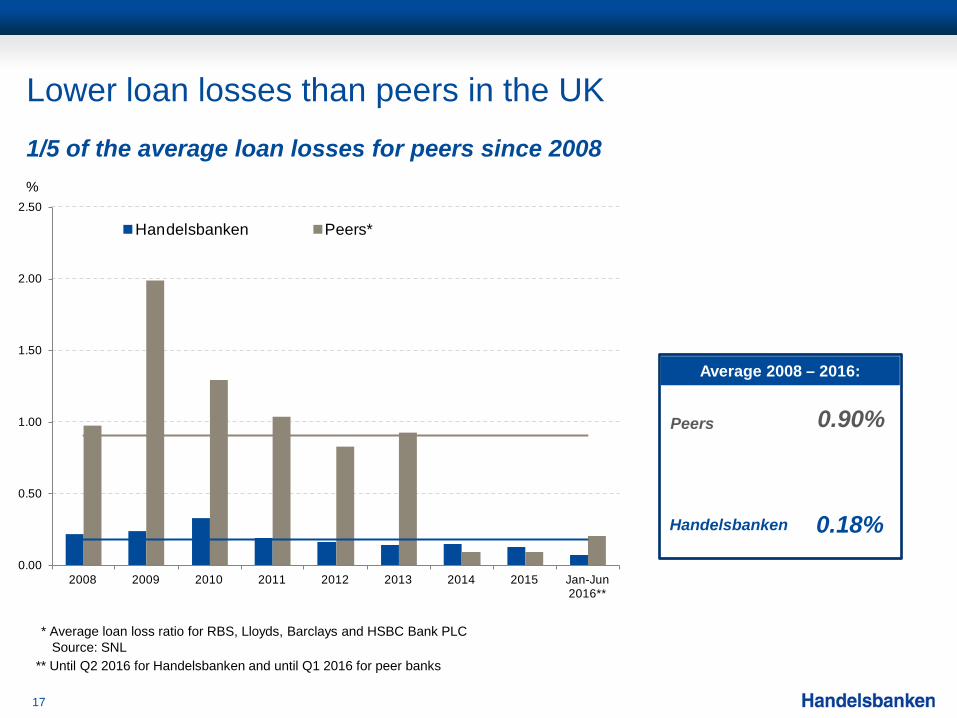
Lower loan losses than peers in the UK
17
Average 2008 – 2016:
1/5 of the average loan losses for peers since 2008 %
Peers
Handelsbanken
0.90%
0.18%
** Until Q2 2016 for Handelsbanken and until Q1 2016 for peer banks
* Average loan loss ratio for RBS, Lloyds, Barclays and HSBC Bank PLC Source: SNL
0
25
50
75
100
125
Q30
7Q
407
Q10
8Q
208
Q30
8Q
408
Q10
9Q
209
Q30
9Q
409
Q11
0Q
210
Q31
0Q
410
Q11
1Q
211
Q31
1Q
411
Q11
2Q
212
Q31
2Q
412
Q11
3Q
213
Q31
3Q
413
Q11
4Q
214
Q31
4Q
414
Q11
5Q
215
Q31
5Q
415
Q11
6Q
216
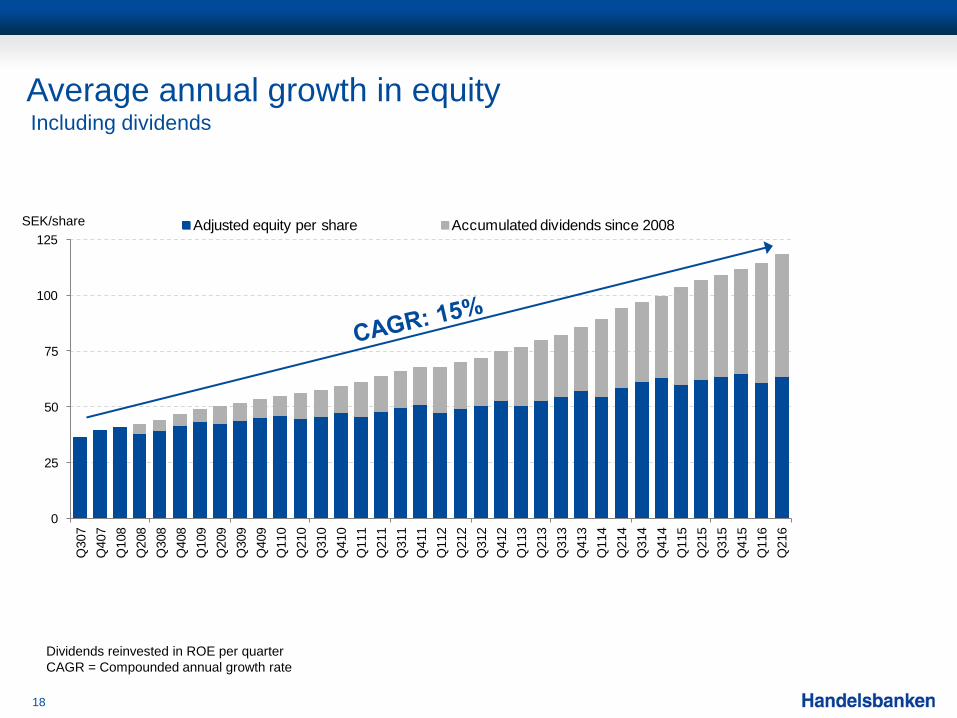
Adjusted equity per share Accumulated dividends since 2008
Average annual growth in equity
18
Dividends reinvested in ROE per quarter CAGR = Compounded annual growth rate
SEK/share
Including dividends
Appendix

Income statement, January – June
20
SEK mJan-Jun
2016Jan-Jun
2015 ChangeNet interest income 13,603 13,935 -2%Net fee and commission income 4,450 4,669 -5%Net gains/losses on financial transactions 1,685 879 92%Risk result - insurance 111 81 37%Other income 316 402 -21%Total income 20,165 19,966 1%Staff costs -6,620 -6,275 5%Other expenses -2,893 -2,813 3%Total expenses -9,513 -9,088 5%Profit before loan losses 10,652 10,878 -2%Net loan losses -416 -664 -37%Gains/losses on disposal of property,
8 -3
Operating profit 10,244 10,211 0%Taxes -2,020 -2,173 -7%Net profit from discontinued operations 13 46 -72%Profit for the period 8,237 8,084 2%
SEK 700m in provision in 2016
SEK 398m Oktogonen allocation in 2015
SEK 908m realised gains from sale of
shares in 2016
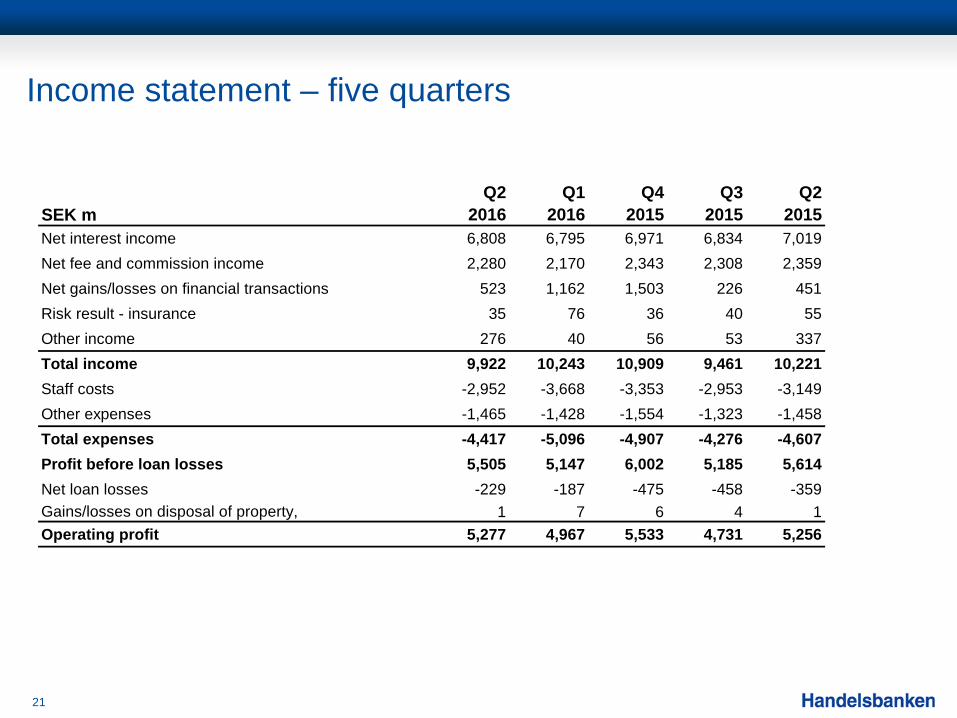
Income statement – five quarters
21
SEK mQ2
2016Q1
2016Q4
2015Q3
2015Q2
2015Net interest income 6,808 6,795 6,971 6,834 7,019Net fee and commission income 2,280 2,170 2,343 2,308 2,359Net gains/losses on financial transactions 523 1,162 1,503 226 451Risk result - insurance 35 76 36 40 55Other income 276 40 56 53 337Total income 9,922 10,243 10,909 9,461 10,221Staff costs -2,952 -3,668 -3,353 -2,953 -3,149Other expenses -1,465 -1,428 -1,554 -1,323 -1,458Total expenses -4,417 -5,096 -4,907 -4,276 -4,607Profit before loan losses 5,505 5,147 6,002 5,185 5,614Net loan losses -229 -187 -475 -458 -359Gains/losses on disposal of property,
1 7 6 4 1
Operating profit 5,277 4,967 5,533 4,731 5,256

Change in net interest income
22
NII Q1 2016 , SEK m 6,795 ChangeLending and deposits in Handelsbanken Sweden 34Deposit margins -51Deposit volumes -18Lending margins 63Lending volumes 40
Lending and deposits in home markets outside Sweden 21Deposit margins -8Deposit volumes 8Lending margins -22Lending volumes 43
Total lending and deposits in home markets 55 1%
Other in branch operations 85Mandatory government fees (deposit insur., stability fund etc.) 18Benchmark effect -64Day count effect 0Exchange rate movements -25Other -56
Other -42 -1%
NII Q2 2016 6,808 0%
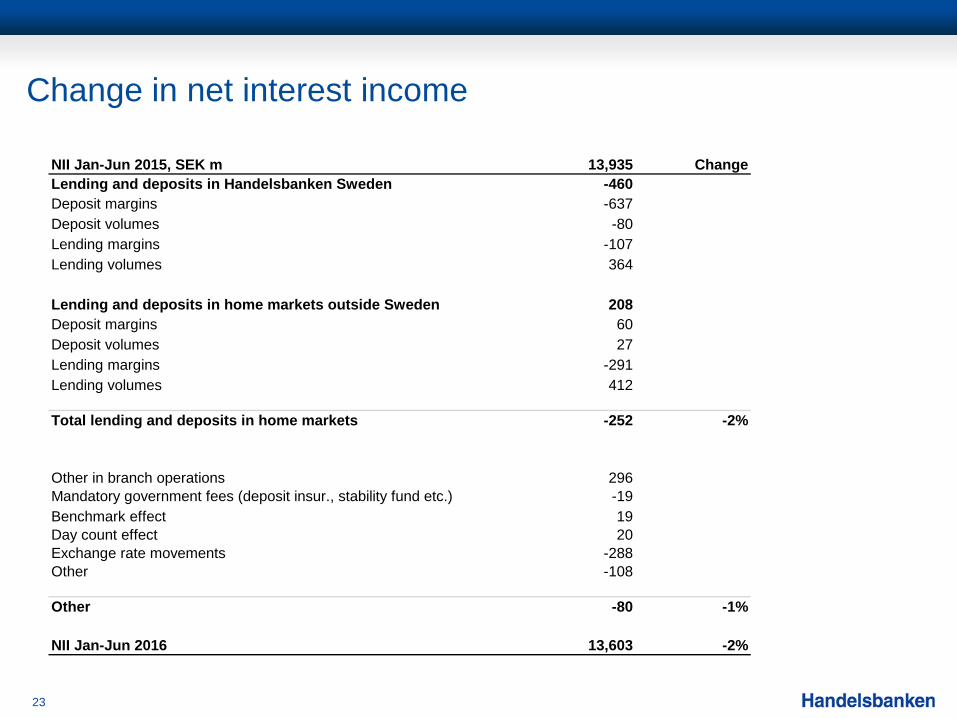
Change in net interest income
23
NII Jan-Jun 2015, SEK m 13,935 ChangeLending and deposits in Handelsbanken Sweden -460Deposit margins -637Deposit volumes -80Lending margins -107Lending volumes 364
Lending and deposits in home markets outside Sweden 208Deposit margins 60Deposit volumes 27Lending margins -291Lending volumes 412
Total lending and deposits in home markets -252 -2%
Other in branch operations 296Mandatory government fees (deposit insur., stability fund etc.) -19Benchmark effect 19Day count effect 20Exchange rate movements -288Other -108
Other -80 -1%
NII Jan-Jun 2016 13,603 -2%

Fees and commissions
24
SEK mJan-Jun
2016Jan-Jun
2015 ChangeBrokerage and other securities commissions 462 593 -22%Mutual funds 1,412 1,501 -6%Custody and other asset management fees 295 303 -3%Advisory services 202 141 43%Insurance 309 326 -5%Payments 1,513 1,622 -7%Loans and deposits 570 543 5%Guarantees 207 211 -2%Other 246 232 6%Commission income 5,216 5,472 -5%Securities -136 -134 1%Payments -593 -631 -6%Other -37 -38 -3%Commission expense -766 -803 -5%Net fee and commission income 4,450 4,669 -5%

Mandatory government fees
25
Q2 2016, SEK m Resolution fund Deposit guarantee TotalSweden -98 -63 -161UK -16 -5 -21Denmark -7 -4 -11Finland -10 -3 -13Norway -20 -6 -26Netherlands -2 0 -2Capital Markets -18 -1 -19Other -65 - -65Total -236 -82 -318
0
50
100
150
200
250
300
350
400
450
500
Kv 12009
Kv 32009
Kv 12010
Kv 32010
Kv 12011
Kv 32011
Kv 12012
Kv 32012
Kv 12013
Kv 32013
Kv 12014
Kv 32014
Kv 12015
Kv 32015
Kv 12016
Kv 32016
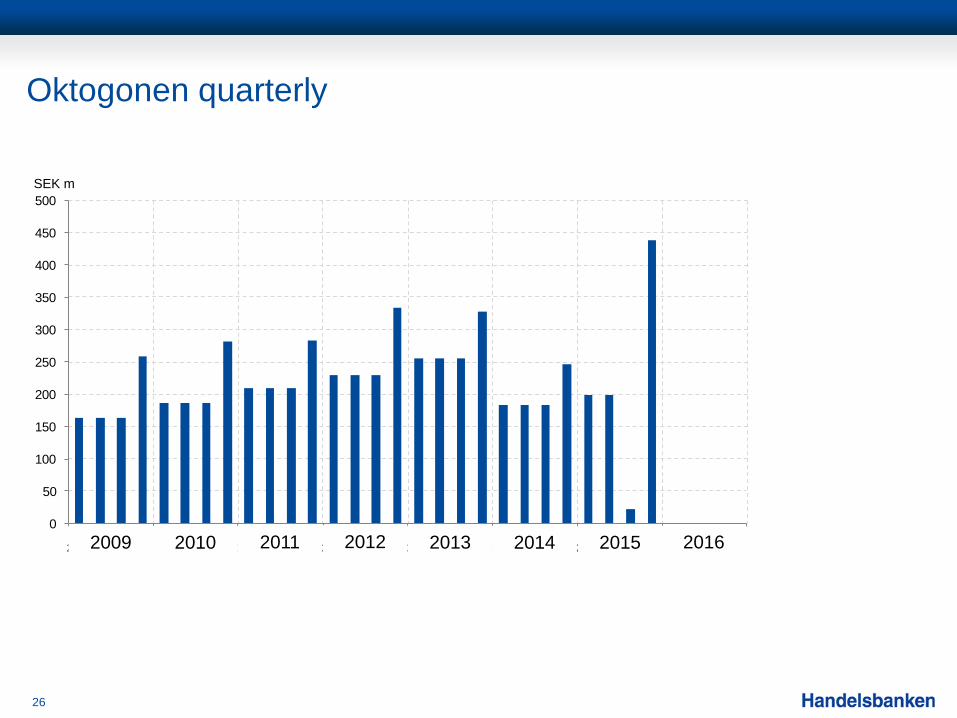
Oktogonen quarterly
26
SEK m
2009 2010 2011 2012 2013 2014 2015 2016
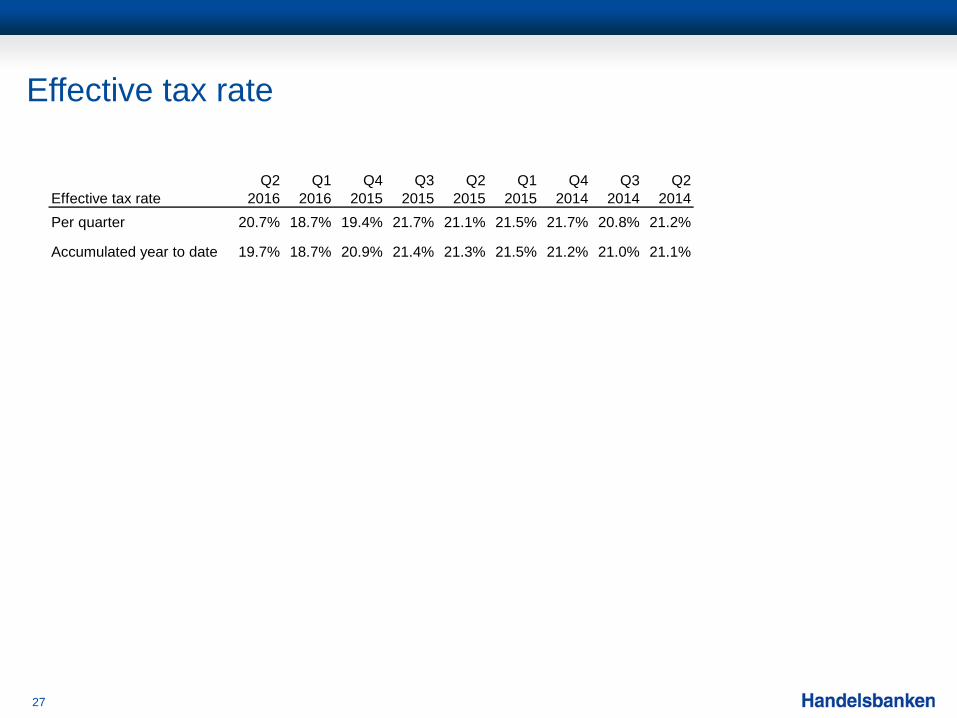
Effective tax rate
27
Effective tax rateQ2
2016Q1
2016Q4
2015Q3
2015Q2
2015Q1
2015Q4
2014Q3
2014Q2
2014Per quarter 20.7% 18.7% 19.4% 21.7% 21.1% 21.5% 21.7% 20.8% 21.2%
Accumulated year to date 19.7% 18.7% 20.9% 21.4% 21.3% 21.5% 21.2% 21.0% 21.1%
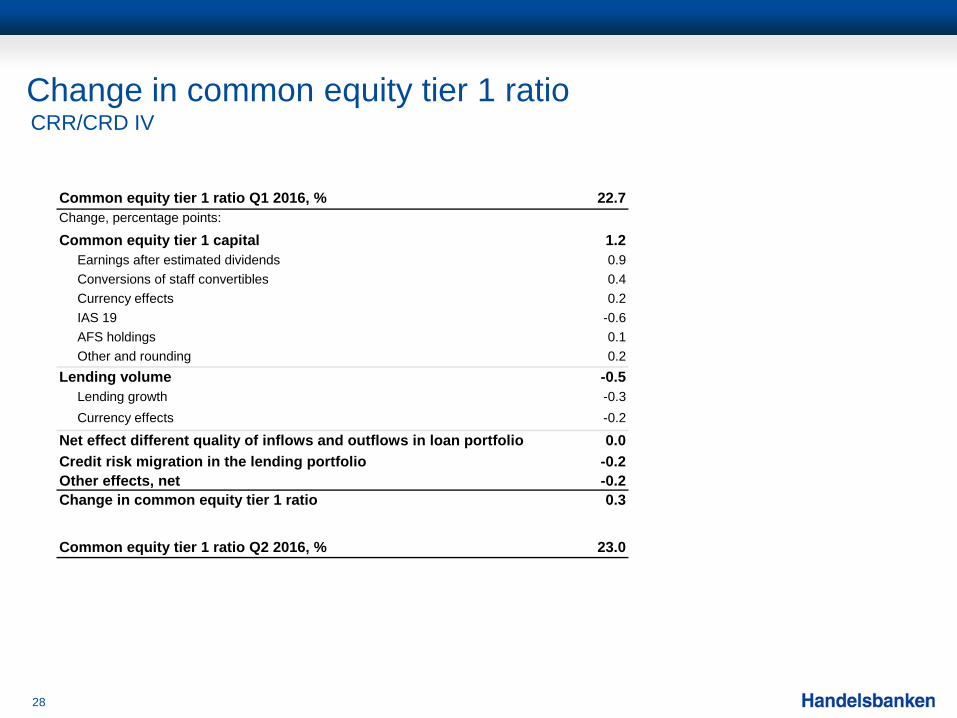
Change in common equity tier 1 ratio
28
CRR/CRD IV
Common equity tier 1 ratio Q1 2016, % 22.7Change, percentage points:
Common equity tier 1 capital 1.2 Earnings after estimated dividends 0.9 Conversions of staff convertibles 0.4 Currency effects 0.2 IAS 19 -0.6 AFS holdings 0.1 Other and rounding 0.2Lending volume -0.5 Lending growth -0.3 Currency effects -0.2
Net effect different quality of inflows and outflows in loan portfolio 0.0Credit risk migration in the lending portfolio -0.2Other effects, net -0.2Change in common equity tier 1 ratio 0.3
Common equity tier 1 ratio Q2 2016, % 23.0

Change in common equity tier 1 ratio
29
CRR/CRD IV
Common equity tier 1 ratio Q2 2015, % 21.3Change, percentage points:
Common equity tier 1 capital 1.3 Earnings after estimated dividends 2.3 Conversions of staff convertibles 0.4 Currency effects -0.3 IAS 19 -0.7 AFS holdings 0.1 Other and rounding -0.5Lending volume -0.6 Lending growth -0.7 Currency effects 0.1
Net effect different quality of inflows and outflows in loan portfolio 0.7Credit risk migration in the lending portfolio -0.3Other effects, net 0.6Change in common equity tier 1 ratio 1.7
Common equity tier 1 ratio Q2 2016, % 23.0
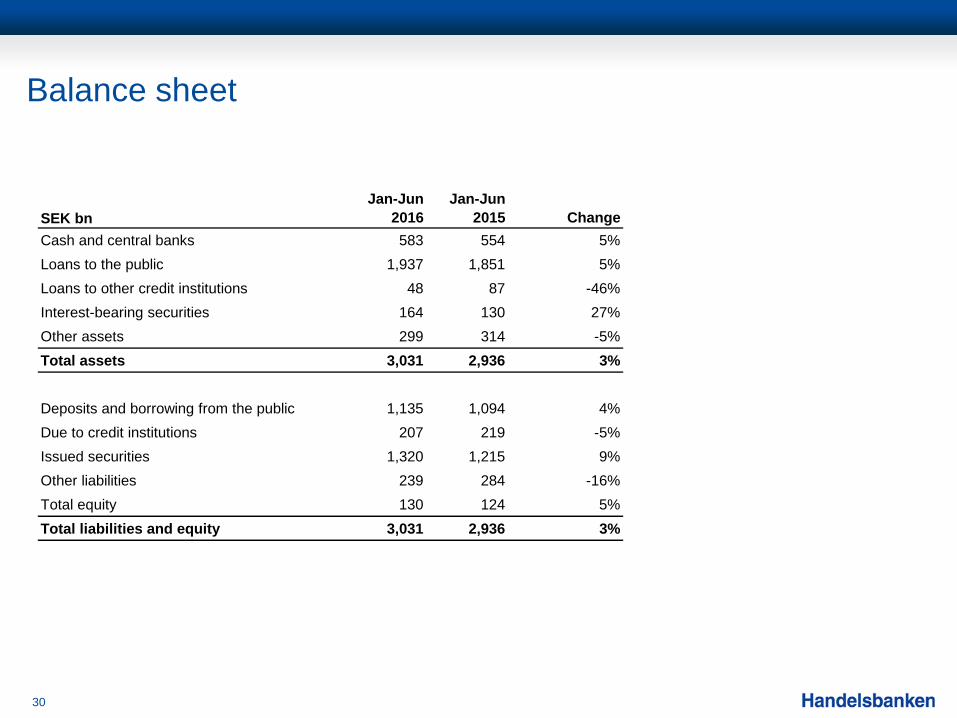
Balance sheet
30
SEK bnJan-Jun
2016Jan-Jun
2015 ChangeCash and central banks 583 554 5%Loans to the public 1,937 1,851 5%Loans to other credit institutions 48 87 -46%Interest-bearing securities 164 130 27%Other assets 299 314 -5%Total assets 3,031 2,936 3%
Deposits and borrowing from the public 1,135 1,094 4%Due to credit institutions 207 219 -5%Issued securities 1,320 1,215 9%Other liabilities 239 284 -16%Total equity 130 124 5%Total liabilities and equity 3,031 2,936 3%
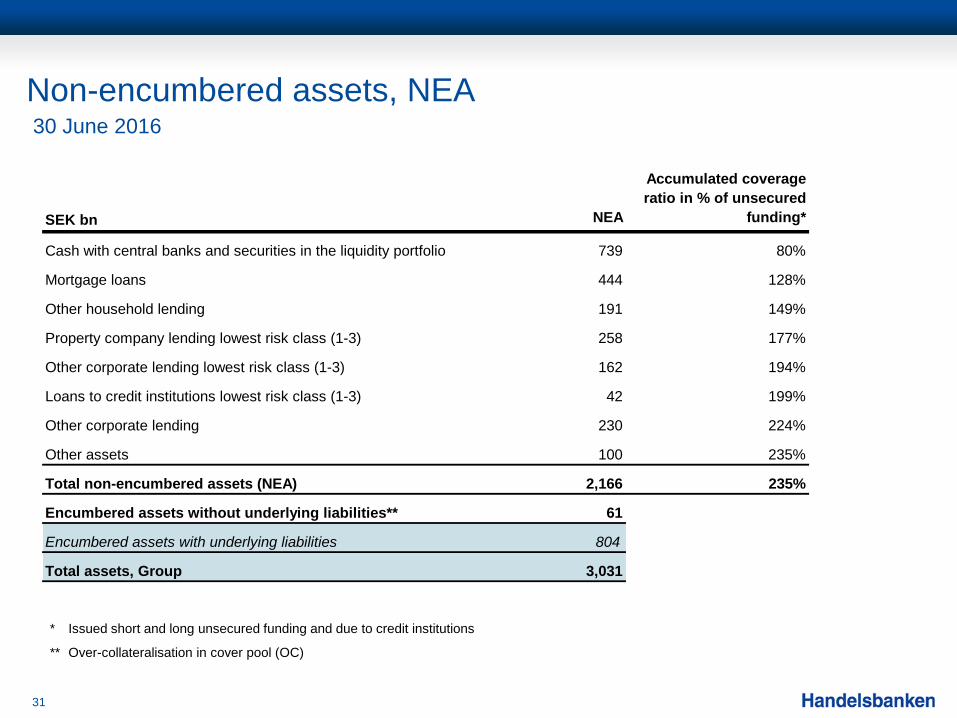
Non-encumbered assets, NEA
31
SEK bn NEA
Accumulated coverage ratio in % of unsecured
funding*
Cash with central banks and securities in the liquidity portfolio 739 80%
Mortgage loans 444 128%
Other household lending 191 149%
Property company lending lowest risk class (1-3) 258 177%
Other corporate lending lowest risk class (1-3) 162 194%
Loans to credit institutions lowest risk class (1-3) 42 199%
Other corporate lending 230 224%
Other assets 100 235%
Total non-encumbered assets (NEA) 2,166 235%
Encumbered assets without underlying liabilities** 61
Encumbered assets with underlying liabilities 804
Total assets, Group 3,031
30 June 2016
* Issued short and long unsecured funding and due to credit institutions
** Over-collateralisation in cover pool (OC)

Long-term bond funding, January – June
32
Issues in Q1 include:
EUR 1.0bn, 6-year covered bonds
Long term bond issuance, SEK bnJan-Jun
2016Jan-Jun
2015 ChangeSenior bonds 27 2 25
Covered bonds 93 62 31
Subordinated loans 0 10 -10
Total 120 74 46

Loans to the public*
33
SEK bn, end of periodQ2
2016Q1
2016Q4
2015Q3
2015Q2
2015Households 745 728 714 701 689Corporates 479 478 478 475 470
Handelsbanken Sweden 1,224 1,206 1,193 1,176 1,159Households 87 83 81 82 86Corporates 146 137 129 121 125
Handelsbanken Norway 233 220 210 203 211Households 63 63 64 64 62Corporates 125 126 130 131 130
Handelsbanken UK 188 189 194 195 192Households 35 35 35 36 35Corporates 83 80 80 80 79
Handelsbanken Finland 118 115 115 116 114Households 52 49 48 47 45Corporates 38 38 36 38 38
Handelsbanken Denmark 90 87 84 85 83Households 14 12 11 10 10Corporates 16 12 11 11 10
Handelsbanken Netherlands 30 24 22 21 20
Other 52 58 46 56 58
Households 1,003 977 960 946 933Corporates 932 922 903 905 904
Total lending to the public 1,935 1,899 1,863 1,851 1,837
* Excluding loans to the Swedish National Debt Office
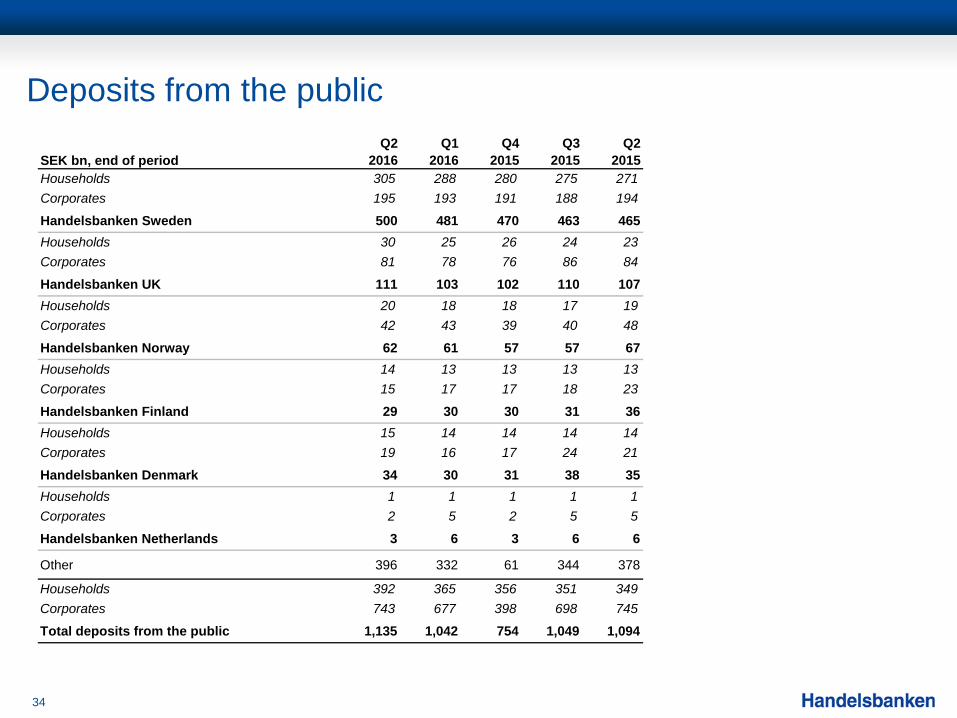
Deposits from the public
34
SEK bn, end of periodQ2
2016Q1
2016Q4
2015Q3
2015Q2
2015Households 305 288 280 275 271Corporates 195 193 191 188 194
Handelsbanken Sweden 500 481 470 463 465Households 30 25 26 24 23Corporates 81 78 76 86 84
Handelsbanken UK 111 103 102 110 107Households 20 18 18 17 19Corporates 42 43 39 40 48
Handelsbanken Norway 62 61 57 57 67Households 14 13 13 13 13Corporates 15 17 17 18 23
Handelsbanken Finland 29 30 30 31 36Households 15 14 14 14 14Corporates 19 16 17 24 21
Handelsbanken Denmark 34 30 31 38 35Households 1 1 1 1 1Corporates 2 5 2 5 5
Handelsbanken Netherlands 3 6 3 6 6
Other 396 332 61 344 378
Households 392 365 356 351 349Corporates 743 677 398 698 745
Total deposits from the public 1,135 1,042 754 1,049 1,094
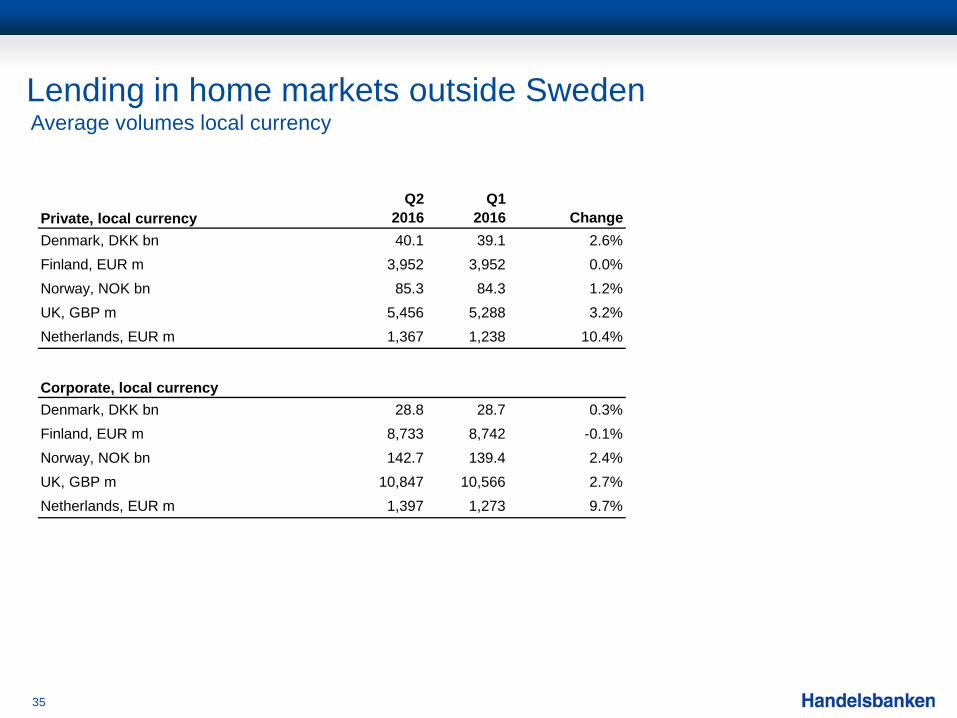
Lending in home markets outside Sweden
35
Private, local currencyQ2
2016Q1
2016 ChangeDenmark, DKK bn 40.1 39.1 2.6%Finland, EUR m 3,952 3,952 0.0%Norway, NOK bn 85.3 84.3 1.2%UK, GBP m 5,456 5,288 3.2%Netherlands, EUR m 1,367 1,238 10.4%
Corporate, local currencyDenmark, DKK bn 28.8 28.7 0.3%Finland, EUR m 8,733 8,742 -0.1%Norway, NOK bn 142.7 139.4 2.4%UK, GBP m 10,847 10,566 2.7%Netherlands, EUR m 1,397 1,273 9.7%
Average volumes local currency
Lending in home markets outside Sweden
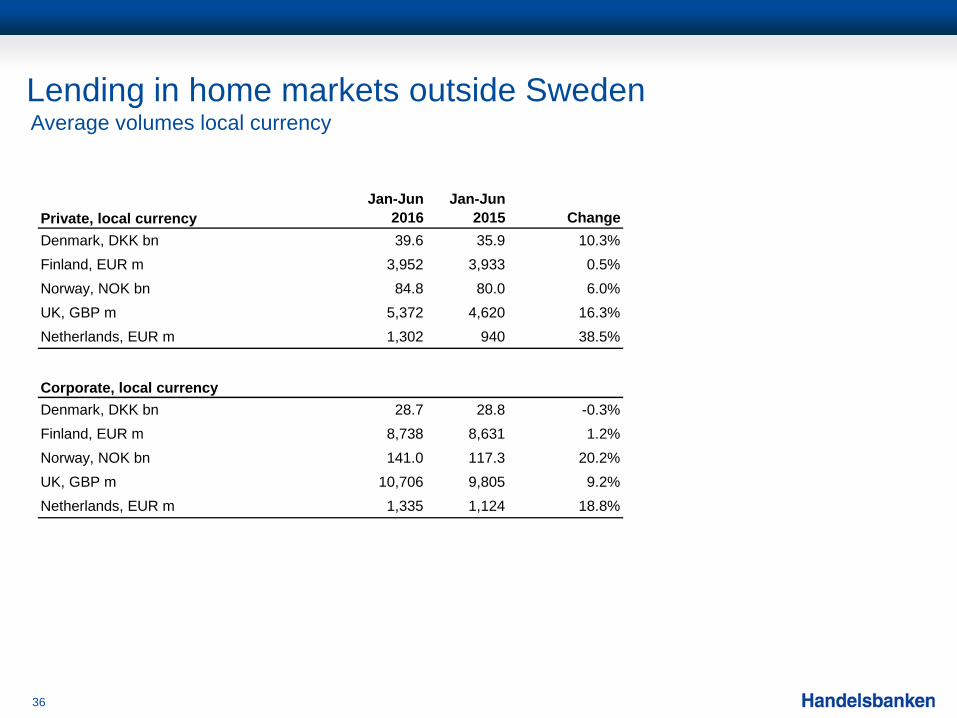
36
Private, local currencyJan-Jun
2016Jan-Jun
2015 ChangeDenmark, DKK bn 39.6 35.9 10.3%Finland, EUR m 3,952 3,933 0.5%Norway, NOK bn 84.8 80.0 6.0%UK, GBP m 5,372 4,620 16.3%Netherlands, EUR m 1,302 940 38.5%
Corporate, local currencyDenmark, DKK bn 28.7 28.8 -0.3%Finland, EUR m 8,738 8,631 1.2%Norway, NOK bn 141.0 117.3 20.2%UK, GBP m 10,706 9,805 9.2%Netherlands, EUR m 1,335 1,124 18.8%
Average volumes local currency

Deposits in home markets outside Sweden
37
Private, local currencyQ2
2016Q1
2016 ChangeDenmark, DKK bn 12.0 11.3 6.2%Finland, EUR m 1,432 1,381 3.7%Norway, NOK bn 19.1 18.6 2.7%UK, GBP m 2,425 2,060 17.7%Netherlands, EUR m 58 53 9.4%
Corporate, local currencyDenmark, DKK bn 13.5 17.1 -21.1%Finland, EUR m 1,766 2,052 -13.9%Norway, NOK bn 44.2 40.8 8.3%UK, GBP m 7,051 6,744 4.6%Netherlands, EUR m 440 408 7.8%
Average volumes local currency

Deposits in home markets outside Sweden
38
Private, local currencyJan-Jun
2016Jan-Jun
2015 ChangeDenmark, DKK bn 11.6 10.7 8.4%Finland, EUR m 1,406 1,359 3.5%Norway, NOK bn 18.9 16.9 11.8%UK, GBP m 2,242 1,604 39.8%Netherlands, EUR m 55 48 14.6%
Corporate, local currencyDenmark, DKK bn 15.3 16.2 -5.6%Finland, EUR m 1,909 2,407 -20.7%Norway, NOK bn 42.5 55.0 -22.7%UK, GBP m 6,898 6,367 8.3%Netherlands, EUR m 424 755 -43.8%
Average volumes local currency