Embed Size (px)
DESCRIPTION
cyanobacteria_biochemistryHandbook on Cyanobacteria Biochemistry, Biotechnology and Applications
Citation preview


Bacteriology Research Developments Series
HANDBOOK ON CYANOBACTERIA: BIOCHEMISTRY, BIOTECHNOLOGY
AND APPLICATIONS
No part of this digital document may be reproduced, stored in a retrieval system or transmitted in any form orby any means. The publisher has taken reasonable care in the preparation of this digital document, but makes noexpressed or implied warranty of any kind and assumes no responsibility for any errors or omissions. Noliability is assumed for incidental or consequential damages in connection with or arising out of informationcontained herein. This digital document is sold with the clear understanding that the publisher is not engaged inrendering legal, medical or any other professional services.

Bacteriology Research Developments Series
Handbook on Cyanobacteria: Biochemistry, Biotechnology and Applications Percy M. Gault and Harris J. Marler (Editors)
2009. ISBN: 978-1-60741-092-8
Bacteriology Research Developments Series
HANDBOOK ON CYANOBACTERIA: BIOCHEMISTRY, BIOTECHNOLOGY
AND APPLICATIONS
PERCY M. GAULT AND
HARRIS J. MARLER EDITORS
Nova Science Publishers, Inc. New York
Copyright © 2009 by Nova Science Publishers, Inc. All rights reserved. No part of this book may be reproduced, stored in a retrieval system or transmitted in any form or by any means: electronic, electrostatic, magnetic, tape, mechanical photocopying, recording or otherwise without the written permission of the Publisher. For permission to use material from this book please contact us: Telephone 631-231-7269; Fax 631-231-8175 Web Site: http://www.novapublishers.com
NOTICE TO THE READER The Publisher has taken reasonable care in the preparation of this book, but makes no expressed or implied warranty of any kind and assumes no responsibility for any errors or omissions. No liability is assumed for incidental or consequential damages in connection with or arising out of information contained in this book. The Publisher shall not be liable for any special, consequential, or exemplary damages resulting, in whole or in part, from the readers’ use of, or reliance upon, this material. Any parts of this book based on government reports are so indicated and copyright is claimed for those parts to the extent applicable to compilations of such works. Independent verification should be sought for any data, advice or recommendations contained in this book. In addition, no responsibility is assumed by the publisher for any injury and/or damage to persons or property arising from any methods, products, instructions, ideas or otherwise contained in this publication. This publication is designed to provide accurate and authoritative information with regard to the subject matter covered herein. It is sold with the clear understanding that the Publisher is not engaged in rendering legal or any other professional services. If legal or any other expert assistance is required, the services of a competent person should be sought. FROM A DECLARATION OF PARTICIPANTS JOINTLY ADOPTED BY A COMMITTEE OF THE AMERICAN BAR ASSOCIATION AND A COMMITTEE OF PUBLISHERS. LIBRARY OF CONGRESS CATALOGING-IN-PUBLICATION DATA Handbook on cyanobacteria : biochemistry, biotechnology, and applications / [edited by] Percy M. Gault and Harris J. Marler. p. ; cm. Includes bibliographical references and index. ISBN 978-1-61668-300-9 (E-Book) 1. Cyanobacteria. 2. Cyanobacteria--Biotechnology. I. Gault, Percy M. II. Marler, Harris J. [DNLM: 1. Cyanobacteria--metabolism. 2. Biotechnology--methods. QW 131 H236 2009] QR99.63.H36 2009 579.3'9--dc22 2009013519
Published by Nova Science Publishers, Inc. New York
CONTENTS
Preface vii Chapter 1 Electron and Energy Transfer in the Photosystem I of
Cyanobacteria: Insight from Compartmental Kinetic Modelling 1 Stefano Santabarbara and Luca Galuppini
Chapter 2 Overview of Spirulina: Biotechnological, Biochemical and Molecular Biological Aspects 51 Apiradee Hongsthong and Boosya Bunnag
Chapter 3 Phycobilisomes from Cyanobacteria 105 Li Sun, Shumei Wang, Mingri Zhao, Xuejun Fu, Xueqin Gong, Min Chen and Lu Wang
Chapter 4 Enigmatic Life and Evolution of Prochloron and Related Cyanobacteria Inhabiting Colonial Ascidians 161 Euichi Hirose, Brett A. Neilan, Eric W. Schmidt and Akio Murakami
Chapter 5 Microcystin Detection in Contaminated Fish from Italian Lakes Using Elisa Immunoassays and Lc-Ms/Ms Analysis 191 Bruno M., Melchiorre S. , Messineo V. , Volpi F. , Di Corcia A., Aragona I., Guglielmone G., Di Paolo C., Cenni M., Ferranti P. and Gallo P.
Chapter 6 Application of Genetic Tools to Cyanobacterial Biotechnology and Ecology 211 Olga A. Koksharova
Chapter 7 Pentapeptide Repeat Proteins and Cyanobacteria 233 Garry W. Buchko
Chapter 8 The Status and Potential of Cyanobacteria and Their Toxins as Agents of Bioterrorism 259 J. S. Metcalf and G. A. Codd
Chapter 9 Use of Lux-Marked Cyanobacterial Bioreporters for Assessment of Individual and Combined Toxicities of Metals in Aqueous Samples 283
Contents vi
Ismael Rodea-Palomares, Francisca Fernández-Piñas, Coral González-García and Francisco Leganés
Chapter 10 Crude Oil Biodegradation by Cyanobacteria from Microbial Mats: Fact or Fallacy? 305 Olga Sánchez and Jordi Mas
Chapter 11 Bioluminescence Reporter Systems for Monitoring Gene Expresion Profile in Cyanobacteria 329 Shinsuke Kutsuna and Setsuyuki Aoki
Chapter 12 Assessing the Health Risk of Flotation-Nanofiltration Sequence for Cyanobacteria and Cyanotoxin Removal in Drinking Water 349 Margarida Ribau Teixeira
Chapter 13 Carotenoids, Their Diversity and Carotenogenesis in Cyanobacteria 399 Shinichi Takaichi and Mari Mochimaru
Chapter 14 Hapalindole Family of Cyanobacterial Natural Products: Structure, Biosynthesis, and Function 429 M.C. Moffitt and B.P. Burns
Chapter 15 A Preliminary Survey of the Economical Viability of Large-Scale Photobiological Hydrogen Production Utilizing Mariculture-Raised Cyanobacteria 443 Hidehiro Sakurai, Hajime Masukawa and Kazuhito Inoue
Chapter 16 Advances in Marine Symbiotic Cyanobacteria 463 Zhiyong Li
Chapter 17 Antioxidant Enzyme Activities in the Cyanobacteria Planktothrix Agardhii, Planktothrix Perornata, Raphidiopsis Brookii, and the Green Alga Selenastrum Capricornutum 473 Kevin K. Schrader and Franck E. Dayan
Chapter 18 Corrinoid Compounds in Cyanobacteria 485 Yukinori Yabuta and Fumio Watanabe
Index 507
PREFACE Cyanobacteria, also known as blue-green algae, blue-green bacteria or cyanophyta, is a
phylum of bacteria that obtain their energy through photosynthesis. They are a significant component of the marine nitrogen cycle and an important primary producer in many areas of the ocean, but are also found in habitats other than the marine environment; in particular, cyanobacteria are known to occur in both freshwater and hypersaline inland lakes. They are found in almost every conceivable environment, from oceans to fresh water to bare rock to soil. Cyanobacteria are the only group of organisms that are able to reduce nitrogen and carbon in aerobic conditions, a fact that may be responsible for their evolutionary and ecological success. Certain cyanobacteria also produce cyanotoxins. This new book presents a broad variety of international research on this important organism.
Chapter 1 - Photosystem I (PS I) is large pigment-binding multi-subunit protein complex essential for the operation of oxygenic photosynthesis. PS I is composed of two functional moieties: a functional core which is well conserved throughout evolution and an external light harvesting antenna, which shows great variability between different organisms and generally depends on the spectral composition of light in specific ecological niches. The core of PS I binds all the cofactors active in electron transfer reaction as well as about 80 Chlorophyll a and 30 β-carotene molecules. However, PS I cores are organised as a supra-molecular trimer in cyanobacteria differently from the monomeric structure observed in higher plants. The most diffuse outer antenna structures are the phycobilisomes, found in red algae and cyanobacteria and the Light Harvesting Complex I (LHC I) family found in green algae and higher plants. Crystallographic models for PS I core trimer of Synechococcus elongatus and the PS I-LHC I super-complex from pea have been obtained with sufficient resolution to resolve all the cofactors involved in redox and light harvesting reaction as well as their location within the protein subunits framework. This has opened the possibility of refined functional analysis based on site-specific molecular genetics manipulations, leading to the discovery of unique properties in terms of electron transfer and energy transfer reaction in PS I. It has been recently demonstrated that the electron transfer cofactors bound to the two protein subunits constituting the reaction centre are active in electron transfer reactions, while only one of the possible electron transfer branch is active in Photosystem II and its bacterial homologous. Moreover, Photosystem I binds chlorophyll antenna pigments which absorb at wavelength longer than the photochemical active pigments, which are known as red forms. In cyanobacteria the red forms are bound to PS I core while in higher plants are located in the external LHC I antenna complexes. Even though the presence of the long-wavelength
Percy M. Gault and Harris J. Marler viii
chlorophyll forms expands the absorption cross section of PS I, the energy of these pigments lays well below that of the reaction centre pigments and might therefore influence the photochemical energy trapping efficiency. The detailed kinetic modelling, based on a discrete number of physically defined compartments, provides insight into the molecular properties of this reaction centre. This problem might be more severe for the case of cyanobacteria since the red forms, when present, are located closer in space to the photochemical reaction centre. In this chapter an attempt is presented to reconcile findings obtained in a host of ultra-fast spectroscopic studies relating to energy migration and electron transfer reactions by taking into account both types of phenomena in the kinetics simulation. The results of calculations performed for cyanobacterial and higher plants models highlights the fine tuning of the antenna properties in order to maintain an elevated (>95%) quantum yield of primary energy conversion.
Chapter 2 - The cyanobacterium Spirulina is well recognized as a potential food supplement for humans because of its high levels of protein (65-70% of dry weight), vitamins and minerals. In addition to its high protein level, Spirulina cells also contain significant amounts of phycocyanin, an antioxidant that is used as an ingredient in various products developed by cosmetic and pharmaceutical industries. Spirulina cells also produce sulfolipids that have been reported to exert inhibitory effects on the Herpes simplex type I virus. Moreover, Spirulina is able to synthesize polyunsaturated fatty acids such as glycerolipid γ-linolenic acid (GLA; C18:3Δ9,12,6), which comprise 30% of the total fatty acids or 1-1.5% of the dry weight under optimal growth conditions. GLA, the end product of the desaturation process in Spirulina, is a precursor for prostaglandin biosynthesis; prostaglandins are involved in a variety of processes related to human health and disease. Spirulina has advantages over other GLA-producing plants, such as evening primrose and borage, in terms of its short generation time and its compatibility with mass cultivation procedures. However, the GLA levels in Spirulina cells need to be increased to 3% of the dry weight in order to be cost-effective for industrial scale production. Therefore, extensive studies aimed at enhancing the GLA content of these cyanobacterial cells have been carried out during the past decade.
As part of these extensive studies, molecular biological approaches have been used to study the gene regulation of the desaturation process in Spirulina in order to find approaches that would lead to increased GLA production. The desaturation process in S. platensis occurs through the catalytic activity of three enzymes, the Δ9, Δ12 and Δ6 desaturases encoded by the desC, desA and desD genes, respectively. According to authors previous study, the cellular GLA level is increased by approximately 30% at low temperature (22oC) compared with its level in cells grown at the optimal growth temperature (35oC). Thus, the temperature stress response of Spirulina has been explored using various techniques, including proteomics. The importance of Spirulina has led to the sequencing of its genome, laying the foundation for various additional studies. However, despite the advances in heterologous expression systems, the primary challenge for molecular studies is the lack of a stable transformation system. Details on the aspects mentioned here will be discussed in the chapter highlighted Spirulina: Biotechnology, Biochemistry, Molecular Biology and Applications.
Chapter 3 - Cyanobacteria are prokaryotic oxygen-evolving photosynthetic organisms which had developed a sophisticated linear electron transport chain with two photochemical reaction systems, PSI and PSII, as early as a few billion years ago cyanobacteria. By endosymbiosis, oxygen-evolving photosynthetic eukaryotes are evolved and chloroplasts of
Preface ix
the photosynthetic eukaryotes are derived from the ancestral cyanobacteria engulfed by the eukaryotic cells. Cyanobacteria employ phycobiliproteins as major light-harvesting pigment complexes which are brilliantly colored and water-soluble chromophore-containing proteins. Phycobiliproteins assemble to form an ultra-molecular complex known as phycobilisome (PBS). Most of the PBSs from cyanobacteria show hemidiscoidal morphology in electron micrographs. The hemidiscoidal PBSs have two discrete substructural domains: the peripheral rods which are stacks of disk-shaped biliproteins, and the core which is seen in front view as either two or three circular objects which arrange side-by-side or stack to form a triangle. For typical hemidiscoidal PBSs, the rod domain is constructed by six or eight cylindrical rods that radiate outwards from the core domain. The rods are made up of disc-shaped phycobiliproteins, phycoerythrin (PE), phycoerythrocyanin (PEC) and phycocyanin (PC), and corresponding rod linker polypeptides. The core domain is more commonly composed of three cylindrical sub-assemblies. Each core cylinder is made up of four disc-shaped phycobiliprotein trimers, allophycocyanin (AP), allophycocyanin B (AP-B) and AP core-membrane linker complex (AP-LCM). By the core-membrane linkers, PBSs attach on the stromal side surface of thylakoids and are structurally coupled with PSII. PBSs harvest the sun light that chlorophylls poorly absorb and transfer the energy in high efficiency to PSII, PSI or other PBSs by AP-LCM and AP-B, known as the two terminal emitters of PBSs. This directional and high-efficient energy transfer absolutely depends on the intactness of PBS structure. For cyanobacteria, the structure and composition of PBSs are variable in the course of adaptation processes to varying conditions of light intensity and light quality. This feature makes cyanobacteria able to grow vigorously under the sun light environments where the photosynthetic organisms which exclusively employ chlorophyll-protein complexes to harvesting sun light are hard to live. Moreover, under stress conditions of nitrogen limitation and imbalanced photosynthesis, active phycobilisome degradation and phycobiliprotein proteolysis may improve cyanobacterium survival by reducing the absorption of excessive excitation energy and by providing cells with the amino acids required for the establishment of the ‘dormant’ state. In addition, the unique spectroscopic properties of phycobiliproteins have made them be promising fluorescent probes in practical application.
Chapter 4 - Prochloron is an oxygenic photosynthetic prokaryotes that possess not only chlorophyll a but also b and lacks any phycobilins. This cyanobacterium lives in obligate symbiosis with colonial ascidians inhabiting tropical/subtropical waters and free-living Prochloron cells have never been recorded so far. There are about 30 species of host ascidians that are all belong to four genera of the family Didemnidae. Asicidian-cyanobacteria symbiosis has attracted considerable attention as a source of biomedicals: many bioactive compounds were isolated from photosymbiotic ascidians and many of them are supposed to be originated from the photosymbionts. Since the stable in vitro culture of Prochloron has never been established, there are many unsolved question about the biology of Prochloron. Recent genetic, physiological, biochemical, and morphological studies are partly disclosing various aspects of its enigmatic life, e.g., photophysiology, metabolite synthesis, symbiosis, and evolution. Here, authors tried to draw a rough sketch of the life of Prochloron and some related cyanobacteria.
Chapter 5 - Cyanotoxin contamination in ichthyic fauna is a worldwide occurrence detected in small aquacultures and natural lakes, underlying a new class of risk factors for consumers. Microcystin contamination in fish tissues is a recent finding in Italian lakes,
Percy M. Gault and Harris J. Marler x
which monitoring requires fast and precise techniques, easy to perform and able to give results in real time.
Three different ELISA immunoassay kits, LC-MS/MS triple quadrupole, MALDI-ToF/MS and LC-Q-ToF-MS/MS techniques were employed to analyze 121 samples of fish and crustaceans (Mugil cephaus, Leuciscus cephalus, Carassius carassius, Cyprinus carpio, Dicentrarchus labrax, Atherina boyeri, Salmo trutta, Procambarus clarkii) collected in lakes Albano, Fiastrone, Ripabianca and, from June 2004 to August 2006 in Massaciuccoli Lake, an eutrophic waterbody seasonally affected by blooms of Microcystis aeruginosa, a widespread toxic species in Italy. Some of these samples were analysed also by ion trap LC/ESI-MS/MS, MALDI-ToF/MS and LC/ESI-Q-ToF/MS-MS, to compare the relative potency of different mass spectrometry detectors.
As a result, 87% of the analyzed extracts of tissues (muscle, viscera and ovary) were positive for the presence of microcystins, at concentration values ranging from minimum of 0.38 ng/g to maximum of 14620 ng/g b.w. In particular, the 95% of viscera samples (highest value 14620 ng/g), 71% of muscle samples (max value 36.42 ng/g) and 100% of ovary samples (max value 17.1 ng/g) were contaminated.
Mugil cephalus samples were all positive, showing the highest values, ranging from 393 ng/g to 14,62 μg/g.
Some different cooking prescriptions were tested to verify the degradation of microcystins in cooking.
Some discrepancies were observed in the results from different commercially available ELISA immunoassay kits; similarly, ELISA test results were from 3 to 8-fold higher than concentration calculated by LC-MS/MS analyses.
The rapid screening and accurate mass-based identification of cyanobacteria biotoxins can be easily afforded by MALDI-ToF/MS, spanning over wide molecular mass range, that shows the molecular ion signals of the compounds in the sample. Nevertheless, accurate structure characterization of all compounds can be attained only studying their own fragmentation patterns by LC-Q-ToF-MS/MS. As a matter of fact, this hybrid mass spectrometry detector resulted highly sensitive, selective and repeatable in measuring the characteristic ions from each cyanotoxin studied; this technique was successfully employed in confirming known toxins, as well as in elucidating the molecular structure of several new compounds never described previously. On the other hand, ion trap and triple quadrupole LC-MS/MS offer high repeatability and sensitivity for identifying targeted known compounds, such as some microcystins, but could fail in detecting the presence of structural modified derivatives, or less abundant molecules.
As a result, nowadays it is noteworthy that hybrid MS(MS) detectors giving full details about the molecular structure of many different biotoxins represent the most modern approach for “profiling” contamination levels and assessing the risk deriving to the consumers, both through freshwaters and foods.
Chapter 6 - Cyanobacteria, structurally Gram-negative prokaryotes and ancient relatives of chloroplasts, can assist analysis of photosynthesis and its regulation more easily than can studies with higher plants. Many genetic tools have been developed for unicellular and filamentous strains of cyanobacteria during the past three decades. These tools provide abundant opportunity for identifying novel genes; for investigating the structure, regulation and evolution of genes; for understanding the ecological roles of cyanobacteria; and for possible practical applications, such as molecular hydrogen photoproduction; production of
Preface xi
phycobiliproteins to form fluorescent antibody reagents; cyanophycin production; polyhydroxybutyrate biosynthesis; osmolytes production; nanoparticles formation; mosquito control; heavy metal removal; biodegradative ability of cyanobacteria; toxins formation by bloom-forming cyanobacteria; use of natural products of cyanobacteria for medicine and others aspects of cyanobacteria applications have been discussed in this chapter.
Chapter 7 - Cyanobacteria are unique in many ways and one unusual feature is the presence of a suite of proteins that contain at least one domain with a minimum of eight tandem repeated five-residues (Rfr) of the general consensus sequence A[N/D]LXX. The function of such pentapeptide repeat proteins (PRPs) are still unknown, however, their prevalence in cyanobacteria suggests that they may play some role in the unique biological activities of cyanobacteria. As part of an inter-disciplinary Membrane Biology Grand Challenge at the Environmental Molecular Sciences Laboratory (Pacific Northwest National Laboratory) and Washington University in St. Louis, the genome of Cyanothece 51142 was sequenced and its molecular biology studied with relation to circadian rhythms. The genome of Cyanothece encodes for 35 proteins that contain at least one PRP domain. These proteins range in size from 105 (Cce_3102) to 930 (Cce_2929) amino acids with the PRP domains ranging in predicted size from 12 (Cce_1545) to 62 (cce_3979) tandem pentapeptide repeats. Transcriptomic studies with 29 out of the 35 genes showed that at least three of the PRPs in Cyanothece 51142 (cce_0029, cce_3083, and cce_3272) oscillated with repeated periods of light and dark, further supporting a biological function for PRPs. Using X-ray diffraction crystallography, the structure for two pentapeptide repeat proteins from Cyanothece 51142 were determined, cce_1272 (aka Rfr32) and cce_4529 (aka Rfr23). Analysis of their molecular structures suggests that all PRP may share the same structural motif, a novel type of right-handed quadrilateral �-helix, or Rfr-fold, reminiscent of a square tower with four distinct faces. Each pentapeptide repeat occupies one face of the Rfr-fold with four consecutive pentapeptide repeats completing a coil that, in turn, stack upon each other to form “protein skyscrapers”. Details of the structural features of the Rfr-fold are reviewed here together with a discussion for the possible role of end-to-end aggregation in PRPs.
Chapter 8 - Cyanobacteria (blue-green algae) are ancient photosynthetic prokaryotes which inhabit a wide range of terrestrial and aquatic environments. Under certain aquatic conditions, they are able to proliferate to form extensive blooms, scums and mats, particularly in nutrient-rich waters which may be used for the preparation of drinking water and for recreation, fisheries and crop irrigation. Although not pathogens, many cyanobacteria can produce a wide range of toxic compounds (cyanotoxins) which act through a variety of molecular mechanisms. Cyanotoxins are predominantly characterised as hepatotoxins, neurotoxins and irritant toxins, and further bioactive cyanobacterial metabolites, with both harmful and beneficial properties, are emerging. Human and animal poisoning episodes have been documented and attributed to cyanotoxins, ranging from the deaths of haemodialysis patients in Brazil to a wide range of animal species, including cattle, sheep, dogs, fish and birds. Some purified cyanotoxins are classified as Scheduled Chemical Weapons as they are among the most toxic naturally-occurring compounds currently known and several countries have introduced Anti-Terrorism Legislation to monitor the use and supply of certain purified cyanobacterial toxins. A wide range of physico-chemical and biological methods is available to analyse the toxins and genes involved in their synthesis, which may be applicable to monitoring aspects of cyanobacteria and bioterrorism.
Percy M. Gault and Harris J. Marler xii
Chapter 9 - Available freshwater resources are polluted by industrial effluents, domestic and commercial sewage, as well as mine drainage, agricultural run-off and litter. Among water pollutants, heavy metals are priority toxicants that pose potential risks to human health and the environment. Bacterial bioreporters may complement physical and chemical analytical methods by detecting the bioavailable (potentially hazardous to biological systems) fraction of metals in environmental samples. Most bacterial bioreporters are based on heterotrophic organisms; cyanobacteria, although important primary producers in aquatic ecosystems, are clearly underrepresented. In this chapter, the potential use of self-luminescent cyanobacterial strains for ecotoxicity testing in aqueous samples has been evaluated; for this purpose, a self-luminescent strain of the freshwater cyanobacterium Anabaena sp. PCC 7120 which bears in the chromosome a Tn5 derivative with luxCDABE from the luminescent terrestrial bacterium Photorhabdus luminescens (formerly Xenorhabdus luminescens) and shows a high constitutive luminescence has been used. The ecotoxicity assay that has been developed is based on the inhibition of bioluminescence caused by biologically available toxic compounds; as a toxicity value, authors have used the effective concentration of each tested compound needed to reduce bioluminescence by 50% from that of the control (EC50). The bioassay allowed for acute as well as chronic toxicity testing. Cyanobacterial bioluminescence responded sensitively to a wide range of metals; furthermore, the sensitivity of the cyanobacterial bioreporter was competitive with that of published bacterial bioreporters. In contaminated environments, organisms are usually exposed to a mixture of pollutants rather than single pollutants. The toxicity of composite mixtures of metals using the cyanobacterial bioreporter was tested; to understand the toxicity of metal interactions, the combination index CI-isobologram equation, a widely used method for analysis of drug interactions that allows computerized quantitation of synergism, additive effect and antagonism has been used. Finally, this study indicates that cyanobacterial-based bioreporters may be useful tools for ecotoxicity testing in contaminated environments and that the CI-Isobologram equation can be applied to understand the toxicity of complex mixtures of contaminants in environmental samples.
Chapter 10 - Microbial mats consist of multi-layered microbial communities organized in space as a result of steep physicochemical gradients. They can be found in sheltered and shallow coastal areas and intertidal zones where they flourish whenever extreme temperatures, dryness or saltiness act to exclude plants and animals. Several metabolically active microorganisms, such as phototrophs (i.e., diatoms, cyanobacteria, purple and green sulfur bacteria) develop in microbial mats together with chemoautotrophic and heterotrophic bacteria.
These communities have been observed to grow in polluted sites where their ability to degrade petroleum components has been demonstrated. Furthermore, several investigations have attributed to cyanobacteria an important role in the biodegradation of organic pollutants. Nevertheless, it is still a matter of discussion whether cyanobacteria can develop using crude oil as the sole carbon source. In an attempt to evaluate their role in hydrocarbon degradation authors have developed an illuminated packed tubular reactor filled with perlite soaked with crude oil inoculated with samples from Ebro Delta microbial mats. A continuous stream of nutrient-containing water was circulated through the system. Crude oil was the only carbon source and the reactor did not contain inorganic carbon. Oxygen tension was kept low in order to minimize possible growth of cyanobacteria at the expense of CO2 produced from the degradation of oil by heterotrophic bacteria. Different microorganisms were able to develop
Preface xiii
attached to the surface of the filling material, and analysis of microbial diversity within the reactor using culture-independent molecular techniques revealed the existence of complex assemblages of bacteria diverse both taxonomically and functionally, but cyanobacteria were not among them. However, cyanobacteria did grow in parallel oil-containing reactors in the presence of carbonate.
Chapter 11 - In cyanobacteria, bioluminescence reporters have been applied to the measurement of physiological phenomenon, such as in the study of circadian clock and nitrite, ferric, and light responses. Cyanobacterial researchers have so far used several types of bioluminescence reporter systems—consisting of luminescence genes, genetically tractable host cells, and a monitoring device—because their studies require a method that offers gene expression data with high fidelity, high resolution for time, and enough dynamic range in data collection. In addition, no extraction of the products of the reporter gene from the culture is required to measure the luminescence, even in the living cell. In this chapter, applications using the bioluminescence genes luxAB (and luxCDE for substrate production) and insect genes are introduced. For measurement and imaging, general apparatuses, such as a luminometer and a luminoimager, have been used with several methods of substrate administration. Automated bioluminescence monitoring apparatuses were also newly developed. The initial machine was similar to that used to measure the native circadian rhythms in bioluminescence of the marine dinoflagellate Gonyaulax polyedra. Then, the machine with a cooled CCD camera which was automatically operated by a computer was used to screen mutant colonies representing abnormal bioluminescence profile or level from a mutagen-treated cyanobacterial cell with a luxAB reporter. Recently, different two promoter activities could be examined in the same cell culture and with the same timing by using railroad-worm luciferase genes. The bioluminescence rhythm monitoring technology of the living single-cell in micro chamber was developed. These might expand authors knowledge to understand other cyanobacterial fields and microorganisms. Here, authors provide a guide on the genes, the targeting loci in the genome, the apparatus and machines, and the studies utilizing the bioluminescence.
Chapter 12 - The human heath risk potential associated with the presence of cyanobacteria and cyanotoxins in water for human consumption has been evaluated. This risk is related to the potential production of taste and odour compounds and toxins by cyanobacteria, which may cause severe liver damage, neuromuscular blocking and are tumour promoters. Therefore, its presence in water, used for drinking water production and/or recreational activities, even at low concentrations, has particular interest to the water managers due to the acute toxicity and sublethal toxicity of these toxins, and may result in necessity of upgrading the water treatment sequences.
The need for risk management strategies to minimize these problems has been recognised in different countries. One of these strategies could pass through the implementation of a safe treatment sequence that guarantees a good drinking water quality, removing both cyanobacteria and cyanotoxins, despite prevention principle should be the first applied.
This work is a contribution for the development of one of these sequences, based on the removal of intact cyanobacteria and cyanotoxins from drinking water, minimising (or even eliminating) their potential heath risk. The sequence proposed is dissolved air flotation (DAF) and nanofiltration: DAF should profit the flotation ability of cyanobacteria and remove them without cell lysis, i.e. without releasing the cyanotoxins into the water; nanofiltration should
Percy M. Gault and Harris J. Marler xiv
remove the cyanotoxins present in water (by natural and/or induced release) down to a safe level for human supply.
Results indicated that DAF – nanofiltration sequence guaranteed a full removal of the cyanobacterial biomass (100% removal of chlorophyll a) and the associated microcystins. Microcystin concentrations in the treated water were always under the quantification limit, i.e. far below the World Health Organization (WHO) guideline value of 1 μg/L for microcystin-LR in drinking water. Therefore, this sequence is a safe barrier against M. aeruginosa and the associated microcystins variants in drinking water, even when high concentrations are present in raw water, and nanofiltration water recovery rates as high as 84% could be used. In addition, it ensures an excellent control of particles (turbidity), and disinfection by-products formation (very low values of DOC, UV254nm and SUVA were achieved), as well as other micropollutants (above ca. 200 g/mol, e.g. anatoxin-a) that might be present in the water.
Chapter 13 - Cyanobacteria grow by photosynthesis, and essentially contain chlorophyll and various carotenoids whose main functions are light-harvesting and photoprotection. In this chapter, authors have summarized carotenoids, characteristics of carotenogenesis enzymes and genes, and carotenogenesis pathways in some cyanobacteria, whose carotenoids and genome DNA sequences have both been determined. Cyanobacteria contain various carotenoids: β-carotene, its hydroxyl or keto derivatives, and carotenoid glycosides. Both ketocarotenoids, such as echinenone and 4-ketomyxol, and the carotenoid glycosides, such as myxol glycosides and oscillol diglycoside, are unique carotenoids in phototrophic organisms. Some cyanobacteria contain both unique carotenoids, while others do not contain such carotenoids. From these findings, certain carotenogenesis pathways can be proposed. The different compositions of carotenoids might be due to the presence or absence of certain gene(s), or to different enzyme characteristics. For instance, two distinct β-carotene hydroxylases, CrtR and CrtG, are bifunctional enzymes whose substrates are both β-carotene and deoxymyxol, and substrate specificities of CrtR vary across species. Two distinct β-carotene ketolases, CrtO and CrtW, are found only in the first group and properly used in two pathways, β-carotene and myxol, depending on the species. At present, the number of functionally confirmed genes is limited, and only a few species are examined. Therefore, further studies of carotenoids, characteristics of carotenogenesis enzymes and genes, and carotenogenesis pathways are needed.
Chapter 14 - Cyanobacteria are renowned for the biosynthesis of a range of natural products. In comparison to the bioactives produced by non-ribosomal peptide synthetase and polyketide synthase systems, the hapalindole family of hybrid isoprenoid-indole alkaloids has received considerably less attention. It has been proposed that these natural products, the indole alkaloids, are constructed by a pathway of monofunctional enzymes. This chapter will specifically discuss the hapalindole family of alkaloids isolated exclusively from the Group 5 cyanobacteria. Structural diversity within this family correlates with a wide range of bioactivities. However, despite the wide variety of structures related to the hapalindoles, their biosynthesis is proposed to occur via a common pathway. Structural diversification of the natural products is proposed to have occurred as a result of evolution of biosynthetic enzymes in Nature and thus will provide insights into how these and related enzymes may be engineered in the laboratory. In this chapter authors will focus on aspects of hapalindole
Preface xv
structural diversity, proposed biosynthetic pathways, known bioactivities, and the potential for bioengineering of this unique natural product class.
Chapter 15 - This paper briefly examines the future prospects for the economical viability of large-scale renewable energy production using maricultured cyanobacteria. In order to reduce CO2 emissions from burning fossil fuels in appreciable amounts, the replacement energy source will by necessity be substantial in scale. Solar energy is the most likely candidate because the amount of solar energy received on the Earth's surface is vast and exceeds the anthropogenic primary energy use by more than 6,000 times. Although solar energy is abundant, its economical utilization is not straightforward because the intensity received on the surface of the earth is relatively low. Current research and development efforts are focused on the production of biofuels as renewable, economical feasible energy sources from the land biomass. The authors propose, however, for reasons of scale and to minimize further environmental harm, that the utilization of the sea surface is a more viable alternative to land biomass exploitation. The sea surface area available for energy production far exceeds available cropland and use of the sea will not take valuable cropland out of food production. The authors current R & D strategy utilizes photosynthesis and the nitrogenase enzyme of cyanobacteria. The biological basis of relevant energy metabolism in cyanobacteria is briefly described. A model for future H2 production systems is presented, and a very rough trial calculation of the cost of photobiological H2 production is made in the hope that it may help the readers recognize the possibilities of large-scale H2 production and understand the need for the research and development.
Chapter 16 - Marine microbial symbionts represent a hotspot in the field of marine microbiology. Marine plants and animals, such as sponge, sea squirt, worm, and algae host symbiotic cyanobacteria with great diversity. Most of the symbiotic cyanobacteria are host-specific and can be transmitted directly from parent to offspring. Symbiotic cyanobacteria play an important role in nitrogen fixation, nutrition and energy transfer and are possible true producers of bioactive marine natural products. Though diverse cyanobacteria have been revealed by culture-independent methods, the isolation and culture of symbiotic cyanobacteria is a challenge. In this chapter, the advances in diversity, transmission, symbiotic relationship with the host, isolation and natural products of marine symbiotic cyanobacteria are reviewed.
Chapter 17 - Previous research has discovered that pesticides which generate reactive oxygen species (ROS), such as the bipyridilium herbicides diquat and paraquat, and certain natural compounds (e.g., quinones) are selectively toxic towards undesirable species of cyanobacteria (blue-green algae) (division Cyanophyta) compared to preferred green algae (division Chlorophyta) commonly found in channel catfish (Ictalurus punctatus) aquaculture ponds. In this study, the antioxidant enzyme activities of the green alga Selenastrum capricornutum and the cyanobacteria Planktothrix agardhii, Planktothrix perornata, and Raphidiopsis brookii, previously isolated from catfish aquaculture ponds in west Mississippi, were measured to help determine the cause for the selective toxicity of ROS-generating compounds. Enzyme assays were performed using cells from separate continuous culture systems to quantify and correlate the specific enzyme activities of superoxide dismutase, catalase, ascorbate peroxidase, and glutathione peroxidase relative to the protein content of the cells. The cyanobacteria used in this study have significantly lower specific activities of superoxide dismutase, catalase, and ascorbate peroxidase when compared to S. capricornutum. Glutathione peroxidase activity was not detected in these cyanobacteria or S.
Percy M. Gault and Harris J. Marler xvi
capricornutum. The deficiency of measured antioxidant enzyme activities in the test cyanobacteria is at least one reason for the selective toxicity of ROS-generating compounds towards these cyanobacteria compared to S. capricornutum.
Chapter 18 - Cyanobacteria produce numerous bioactive compounds including vitamin B12. Corrinoid compound found in various edible cyanobacteria (Spirulina sp., Nostoc sp., Aphanizomenon sp., and so on) were identified as pseudovitamin B12 (7-adeninyl cobamide), which is inactive for humans. Edible cyanobacteria are not suitable for use as a vitamin B12 source, especially in vegetarians.
Analysis of genomic information suggests that most cyanobacteria can synthesize the corrin ring, but not the 5,6-dimethylbenzimidazolyl nucleotide moiety in vitamin B12 molecule. Therefore, the bacterial cells would construct a corrinoid compound as pseudovitamin B12 by using a cellular metabolite, adenine nucleotide. Pseudovitamin B12 appears to function as coenzymes of cobalamin-dependent methionine synthase or ribonucleotide reductase (or both).
In: Handbook on Cyanobacteria ISBN: 978-1-60741-092-8 Editors: P. M. Gault and H. J. Marler © 2009 Nova Science Publishers, Inc.
Chapter 1
ELECTRON AND ENERGY TRANSFER IN THE PHOTOSYSTEM I OF CYANOBACTERIA: INSIGHT FROM COMPARTMENTAL KINETIC MODELLING*
Stefano Santabarbara†1,2 and Luca Galuppini1
1 The Centre for Fundamental Research in Photosynthesis, Via delle Ville 27, 21029 Vergiate (Va), Italy
2 University of Strathclyde, Department of Physics, 170 Rottenrow East, Glasgow G4 0NG, Scotland, United Kingdom
ABSTRACT
Photosystem I (PS I) is large pigment-binding multi-subunit protein complex essential for the operation of oxygenic photosynthesis. PS I is composed of two functional moieties: a functional core which is well conserved throughout evolution and an external light harvesting antenna, which shows great variability between different organisms and generally depends on the spectral composition of light in specific ecological niches. The core of PS I binds all the cofactors active in electron transfer reaction as well as about 80 Chlorophyll a and 30 β-carotene molecules. However, PS I cores are organised as a supra-molecular trimer in cyanobacteria differently from the monomeric structure observed in higher plants. The most diffuse outer antenna structures are the phycobilisomes, found in red algae and cyanobacteria and the Light Harvesting Complex I (LHC I) family found in green algae and higher plants. Crystallographic models for PS I core trimer of Synechococcus elongatus and the PS I-LHC I super-complex from pea have been obtained with sufficient resolution to resolve all the cofactors involved in redox and light harvesting reaction as well as their location within the protein subunits framework. This has opened the possibility of refined functional analysis based on site-specific molecular genetics manipulations, leading to the discovery of unique properties in terms of electron transfer and energy transfer reaction in PS I. It has been recently demonstrated that the electron transfer cofactors bound to the two
* This chapter is dedicated to the memory of Michael C.W. Evans, an inspirational mentor and collaborator. † Department of Physics, University of Strathclyde, John Anderson Building; 107 Rottenrow, Glasgow G4 0NG,
Scotland, U.K. Email:[email protected].
Stefano Santabarbara and Luca Galuppini 2
protein subunits constituting the reaction centre are active in electron transfer reactions, while only one of the possible electron transfer branch is active in Photosystem II and its bacterial homologous. Moreover, Photosystem I binds chlorophyll antenna pigments which absorb at wavelength longer than the photochemical active pigments, which are known as red forms. In cyanobacteria the red forms are bound to PS I core while in higher plants are located in the external LHC I antenna complexes. Even though the presence of the long-wavelength chlorophyll forms expands the absorption cross section of PS I, the energy of these pigments lays well below that of the reaction centre pigments and might therefore influence the photochemical energy trapping efficiency. The detailed kinetic modelling, based on a discrete number of physically defined compartments, provides insight into the molecular properties of this reaction centre. This problem might be more severe for the case of cyanobacteria since the red forms, when present, are located closer in space to the photochemical reaction centre. In this chapter an attempt is presented to reconcile findings obtained in a host of ultra-fast spectroscopic studies relating to energy migration and electron transfer reactions by taking into account both types of phenomena in the kinetics simulation. The results of calculations performed for cyanobacterial and higher plants models highlights the fine tuning of the antenna properties in order to maintain an elevated (>95%) quantum yield of primary energy conversion.
1. INTRODUCTION Photosystem I (PS I) is a transmembrane macromolecular complex which is ubiquitous
and essential for oxygen evolution in photosynthetic organisms, even though it does not catalyse the water splitting reaction directly. In eukaryotic organisms, such as higher plants and green algae, PS I is localised in the thylakoid membrane of the chloroplast, together with the other complexes active in photosynthetic electron transfer reactions. In prokaryotes, such as cyanobacteria, PS I and the other photosynthetic complexes are localised in specialised regions of the plasma membrane which are also, for analogy with eukaryotes, called thylakoids, but lack the characteristic morphological structure of the latter.
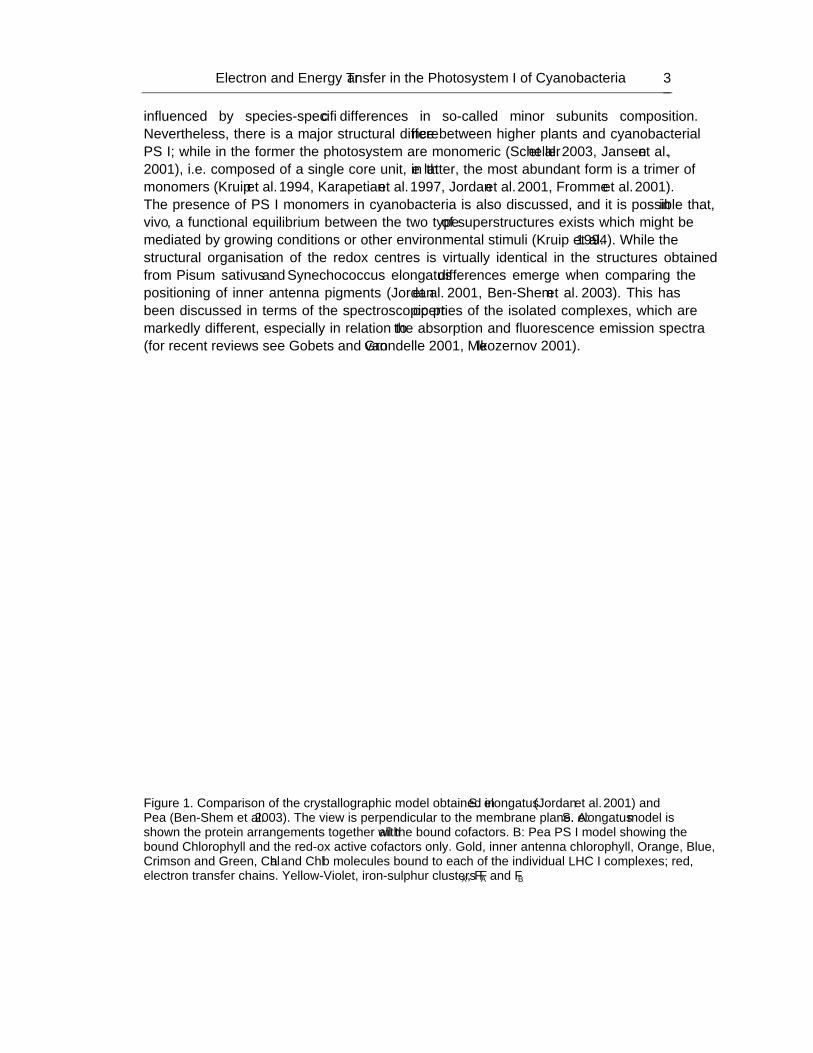
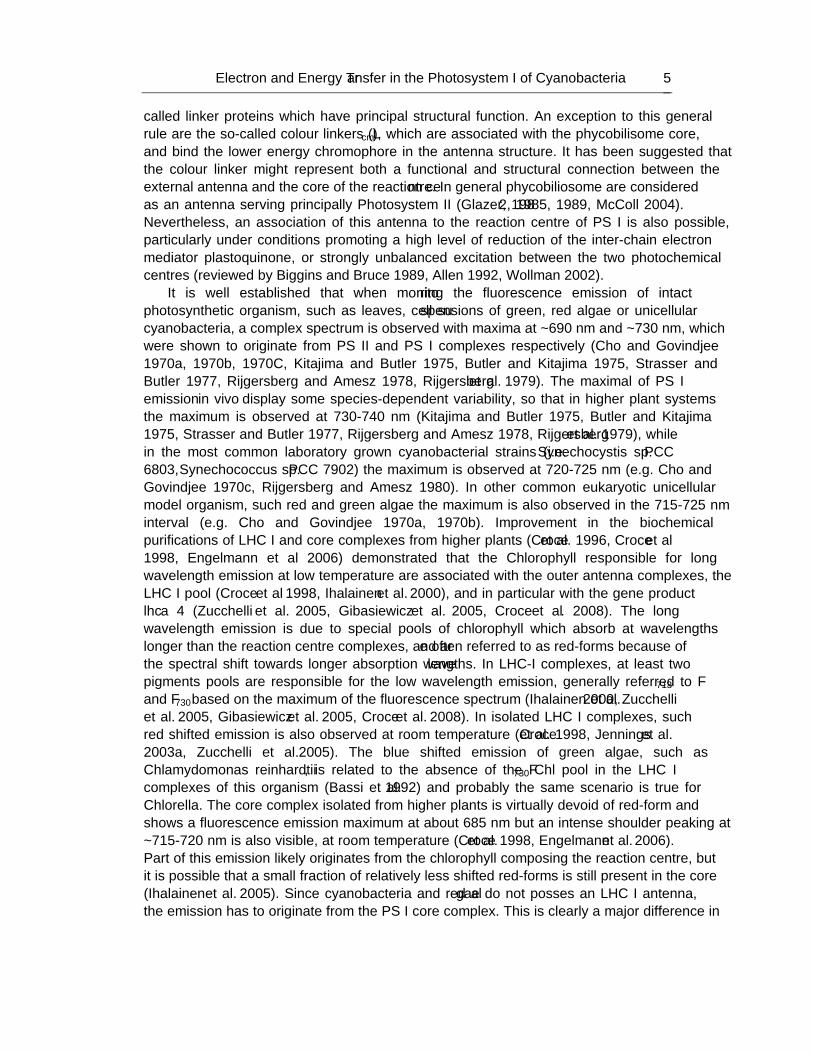
Functionally and structurally PS I can be considered as being composed of two moieties, the core and the external antenna. The core is composed of 12 to 13 different polypeptides, the specific number varying from species to species (Scheller et al. 2003, Jansen et al., 2001). The subunits which have higher molecular weights, and are the gene products of psaA and psaB, form a heterodimer which binds a host of other cofactors including approximately 100 Chlorophyll (Chl) a, 30 ß-carotene molecules, two phylloquinone molecules, a [4Fe-4S] iron-sulphur clusters (Jordan et al. 2001, Ben Shem et al. 2003). Two other [4Fe-4S] clusters are bound to the PsaC subunit which is evolutionarily related to the class of bacterial Ferredoxin (Antonkine et al. 2003). The majority of pigments bound to the core have light harvesting function, and are referred to as core antenna or inner antenna. A cluster of 6 Chl a molecules, one of which was suggested to be the 13’-epimer (Chl a’), functions as the photochemical catalytic centre, and comprises the primary electron donor and electron acceptor(s). Crystallographic model of PS I cores based on X-ray diffraction data have been presented both for cyanobacterial (Jordan et al. 2001) and a higher plant system (Ben-Shem et al. 2003). The comparison of the two crystallographic models (comparisons are shown in figures 1 and 2) does not highlight differences in the organisation and specific binding site of the putative electron transfer cofactors. Thus the structural organisation of the redox active species is not
Electron and Energy Transfer in the Photosystem I of Cyanobacteria 3
influenced by species-specific differences in so-called minor subunits composition. Nevertheless, there is a major structural difference between higher plants and cyanobacterial PS I; while in the former the photosystem are monomeric (Scheller et al. 2003, Jansen et al., 2001), i.e. composed of a single core unit, in the latter, the most abundant form is a trimer of monomers (Kruip et al. 1994, Karapetian et al. 1997, Jordan et al. 2001, Fromme et al. 2001). The presence of PS I monomers in cyanobacteria is also discussed, and it is possible that, in vivo, a functional equilibrium between the two type of superstructures exists which might be mediated by growing conditions or other environmental stimuli (Kruip et al. 1994). While the structural organisation of the redox centres is virtually identical in the structures obtained from Pisum sativus and Synechococcus elongatus differences emerge when comparing the positioning of inner antenna pigments (Jordan et al. 2001, Ben-Shem et al. 2003). This has been discussed in terms of the spectroscopic properties of the isolated complexes, which are markedly different, especially in relation to the absorption and fluorescence emission spectra (for recent reviews see Gobets and van Grondelle 2001, Melkozernov 2001).
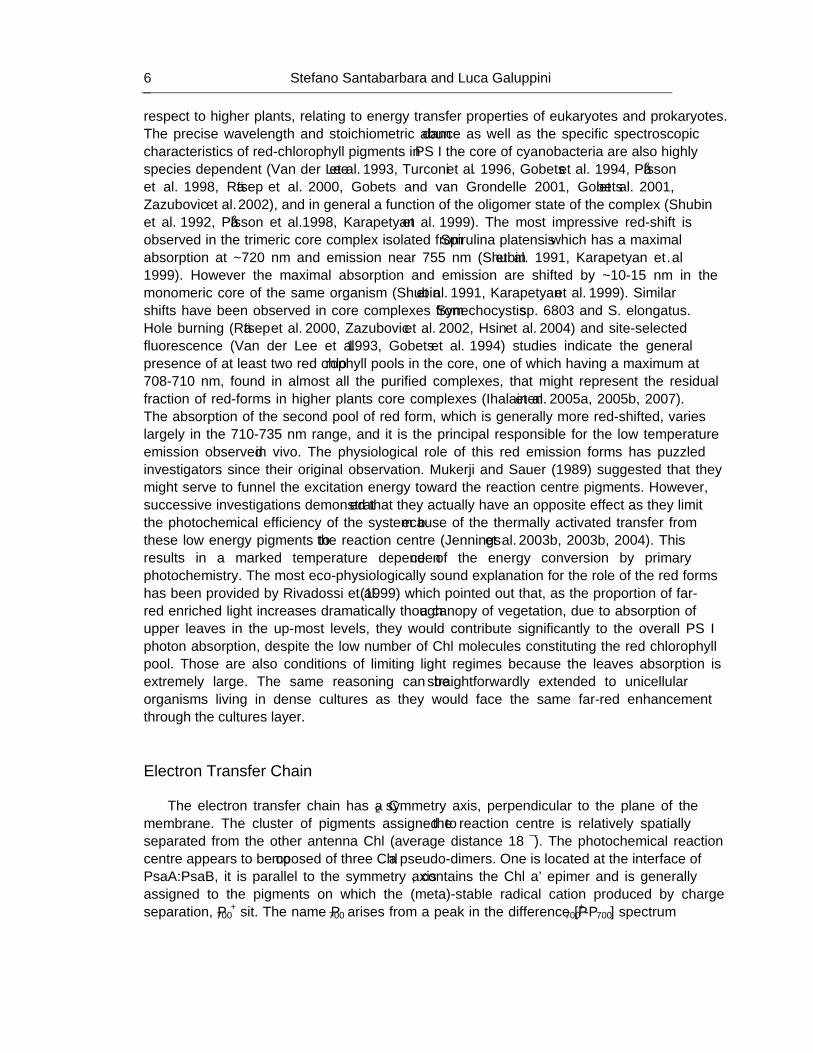
Figure 1. Comparison of the crystallographic model obtained in S. elongatus (Jordan et al. 2001) and Pea (Ben-Shem et al. 2003). The view is perpendicular to the membrane plane. A: S. elongatus model is shown the protein arrangements together with all the bound cofactors. B: Pea PS I model showing the bound Chlorophyll and the red-ox active cofactors only. Gold, inner antenna chlorophyll, Orange, Blue, Crimson and Green, Chl a and Chl b molecules bound to each of the individual LHC I complexes; red, electron transfer chains. Yellow-Violet, iron-sulphur clusters FX, FA and FB
Stefano Santabarbara and Luca Galuppini 4
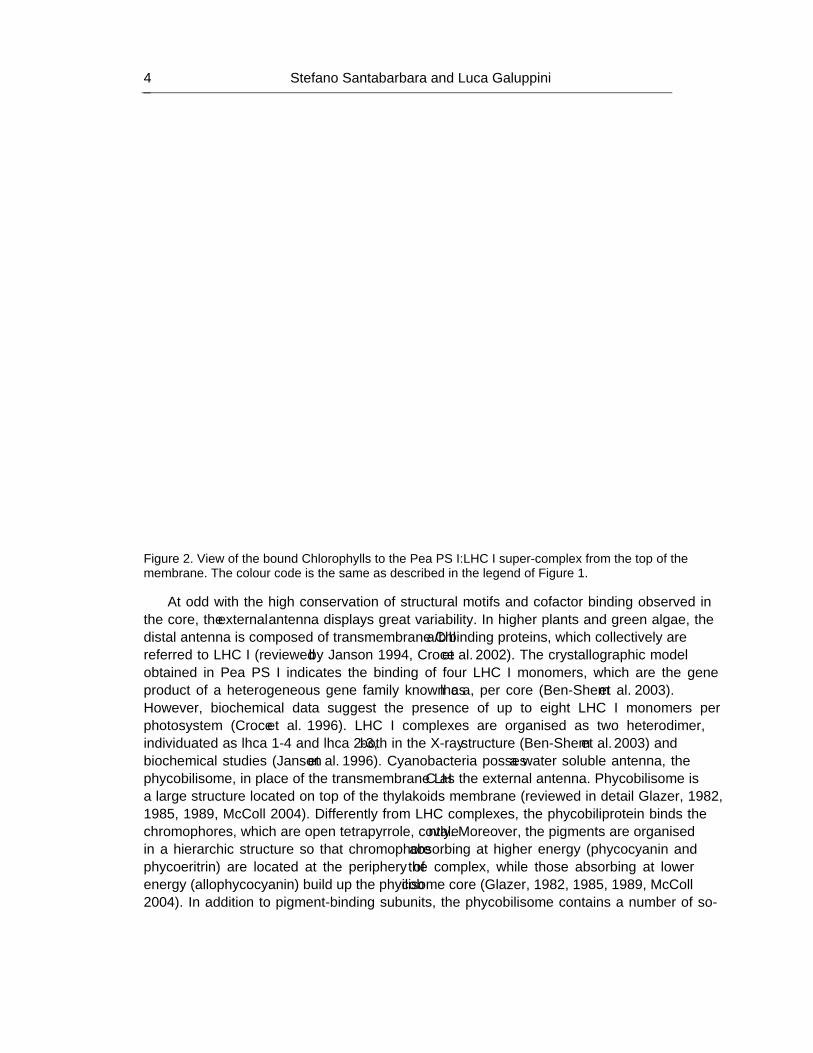
Figure 2. View of the bound Chlorophylls to the Pea PS I:LHC I super-complex from the top of the membrane. The colour code is the same as described in the legend of Figure 1.
At odd with the high conservation of structural motifs and cofactor binding observed in the core, the external antenna displays great variability. In higher plants and green algae, the distal antenna is composed of transmembrane Chl a/b binding proteins, which collectively are referred to LHC I (reviewed by Janson 1994, Croce et al. 2002). The crystallographic model obtained in Pea PS I indicates the binding of four LHC I monomers, which are the gene product of a heterogeneous gene family known as lhc a, per core (Ben-Shem et al. 2003). However, biochemical data suggest the presence of up to eight LHC I monomers per photosystem (Croce et al. 1996). LHC I complexes are organised as two heterodimer, individuated as lhca 1-4 and lhca 2-3, both in the X-ray structure (Ben-Shem et al. 2003) and biochemical studies (Janson et al. 1996). Cyanobacteria posses a water soluble antenna, the phycobilisome, in place of the transmembrane LHC as the external antenna. Phycobilisome is a large structure located on top of the thylakoids membrane (reviewed in detail Glazer, 1982, 1985, 1989, McColl 2004). Differently from LHC complexes, the phycobiliprotein binds the chromophores, which are open tetrapyrrole, covalently. Moreover, the pigments are organised in a hierarchic structure so that chromophore absorbing at higher energy (phycocyanin and phycoeritrin) are located at the periphery of the complex, while those absorbing at lower energy (allophycocyanin) build up the phycobilisome core (Glazer, 1982, 1985, 1989, McColl 2004). In addition to pigment-binding subunits, the phycobilisome contains a number of so-
Electron and Energy Transfer in the Photosystem I of Cyanobacteria 5
called linker proteins which have principal structural function. An exception to this general rule are the so-called colour linkers (Lcm), which are associated with the phycobilisome core, and bind the lower energy chromophore in the antenna structure. It has been suggested that the colour linker might represent both a functional and structural connection between the external antenna and the core of the reaction centre. In general phycobiliosome are considered as an antenna serving principally Photosystem II (Glazer, 1982, 1985, 1989, McColl 2004). Nevertheless, an association of this antenna to the reaction centre of PS I is also possible, particularly under conditions promoting a high level of reduction of the inter-chain electron mediator plastoquinone, or strongly unbalanced excitation between the two photochemical centres (reviewed by Biggins and Bruce 1989, Allen 1992, Wollman 2002).
It is well established that when monitoring the fluorescence emission of intact photosynthetic organism, such as leaves, cell suspensions of green, red algae or unicellular cyanobacteria, a complex spectrum is observed with maxima at ~690 nm and ~730 nm, which were shown to originate from PS II and PS I complexes respectively (Cho and Govindjee 1970a, 1970b, 1970C, Kitajima and Butler 1975, Butler and Kitajima 1975, Strasser and Butler 1977, Rijgersberg and Amesz 1978, Rijgersberg et al. 1979). The maximal of PS I emission in vivo display some species-dependent variability, so that in higher plant systems the maximum is observed at 730-740 nm (Kitajima and Butler 1975, Butler and Kitajima 1975, Strasser and Butler 1977, Rijgersberg and Amesz 1978, Rijgersberg et al. 1979), while in the most common laboratory grown cyanobacterial strains (i.e. Synechocystis sp. PCC 6803, Synechococcus sp. PCC 7902) the maximum is observed at 720-725 nm (e.g. Cho and Govindjee 1970c, Rijgersberg and Amesz 1980). In other common eukaryotic unicellular model organism, such red and green algae the maximum is also observed in the 715-725 nm interval (e.g. Cho and Govindjee 1970a, 1970b). Improvement in the biochemical purifications of LHC I and core complexes from higher plants (Croce et al. 1996, Croce et al 1998, Engelmann et al 2006) demonstrated that the Chlorophyll responsible for long wavelength emission at low temperature are associated with the outer antenna complexes, the LHC I pool (Croce et al 1998, Ihalainen et al. 2000), and in particular with the gene product lhca 4 (Zucchelli et al. 2005, Gibasiewicz et al. 2005, Croce et al. 2008). The long wavelength emission is due to special pools of chlorophyll which absorb at wavelengths longer than the reaction centre complexes, and are often referred to as “red-forms” because of the spectral shift towards longer absorption wavelengths. In LHC-I complexes, at least two pigments pools are responsible for the low wavelength emission, generally referred to F713 and F730 based on the maximum of the fluorescence spectrum (Ihalainen et al. 2000, Zucchelli et al. 2005, Gibasiewicz et al. 2005, Croce et al. 2008). In isolated LHC I complexes, such red shifted emission is also observed at room temperature (Croce et al. 1998, Jennings et al. 2003a, Zucchelli et al. 2005). The blue shifted emission of green algae, such as Chlamydomonas reinhardtii, is related to the absence of the F730 Chl pool in the LHC I complexes of this organism (Bassi et al. 1992) and probably the same scenario is true for Chlorella. The core complex isolated from higher plants is virtually devoid of “red-form” and shows a fluorescence emission maximum at about 685 nm but an intense shoulder peaking at ~715-720 nm is also visible, at room temperature (Croce et al. 1998, Engelmann et al. 2006). Part of this emission likely originates from the chlorophyll composing the reaction centre, but it is possible that a small fraction of relatively less shifted red-forms is still present in the core (Ihalainen et al. 2005). Since cyanobacteria and red algae do not posses an LHC I antenna, the emission has to originate from the PS I core complex. This is clearly a major difference in
Stefano Santabarbara and Luca Galuppini 6
respect to higher plants, relating to energy transfer properties of eukaryotes and prokaryotes. The precise wavelength and stoichiometric abundance as well as the specific spectroscopic characteristics of “red-chlorophyll pigments” in PS I the core of cyanobacteria are also highly species dependent (Van der Lee et al. 1993, Turconi et al. 1996, Gobets et al. 1994, Pålsson et al. 1998, Rätsep et al. 2000, Gobets and van Grondelle 2001, Gobets et al. 2001, Zazubovic et al. 2002), and in general a function of the oligomer state of the complex (Shubin et al. 1992, Pålsson et al.1998, Karapetyan et al. 1999). The most impressive red-shift is observed in the trimeric core complex isolated from Spirulina platensis which has a maximal absorption at ~720 nm and emission near 755 nm (Shubin et al. 1991, Karapetyan et al. 1999). However the maximal absorption and emission are shifted by ~10-15 nm in the monomeric core of the same organism (Shubin et al. 1991, Karapetyan et al. 1999). Similar shifts have been observed in core complexes from Synechocystis sp. 6803 and S. elongatus. Hole burning (Rätsep et al. 2000, Zazubovic et al. 2002, Hsin et al. 2004) and site-selected fluorescence (Van der Lee et al. 1993, Gobets et al. 1994) studies indicate the general presence of at least two red chlorophyll pools in the core, one of which having a maximum at 708-710 nm, found in almost all the purified complexes, that might represent the residual fraction of red-forms in higher plants core complexes (Ihalainen et al. 2005a, 2005b, 2007). The absorption of the second pool of “red form”, which is generally more red-shifted, varies largely in the 710-735 nm range, and it is the principal responsible for the low temperature emission observed in vivo. The physiological role of this red emission forms has puzzled investigators since their original observation. Mukerji and Sauer (1989) suggested that they might serve to “funnel” the excitation energy toward the reaction centre pigments. However, successive investigations demonstrated that they actually have an opposite effect as they limit the photochemical efficiency of the system because of the thermally activated transfer from these low energy pigments to the reaction centre (Jennings et al. 2003b, 2003b, 2004). This results in a marked temperature dependence of the energy conversion by primary photochemistry. The most eco-physiologically sound explanation for the role of the red forms has been provided by Rivadossi et al. (1999) which pointed out that, as the proportion of far-red enriched light increases dramatically though a canopy of vegetation, due to absorption of upper leaves in the up-most levels, they would contribute significantly to the overall PS I photon absorption, despite the low number of Chl molecules constituting the red chlorophyll pool. Those are also conditions of limiting light regimes because the leaves absorption is extremely large. The same reasoning can be straightforwardly extended to unicellular organisms living in dense cultures as they would face the same “far-red” enhancement through the cultures layer.
Electron Transfer Chain The electron transfer chain has a C2 symmetry axis, perpendicular to the plane of the
membrane. The cluster of pigments assigned to the reaction centre is relatively spatially separated from the other antenna Chl (average distance 18 Å). The photochemical reaction centre appears to be composed of three Chl a pseudo-dimers. One is located at the interface of PsaA:PsaB, it is parallel to the symmetry axis, contains the Chl a' epimer and is generally assigned to the pigments on which the (meta)-stable radical cation produced by charge separation, P700
+ sit. The name P700 arises from a peak in the difference [P700+-P700] spectrum
Electron and Energy Transfer in the Photosystem I of Cyanobacteria 7
(Kok 1956, Doring et al. 1968) . In the structural studies the Chl a and Chl a’ composing P700 are called eC1A and eC1B (Jordan et al. 2001). The other two dimers are composed of the eC2A/eC3A and eC2B/eC3B. Chl(s) eC2 are often referred to as “accessory” chlorophyll, because they were resolved in the structure, but not functionally by spectroscopic investigation, while eC3 is often referred to as A0 which represents the first electron acceptor observed by spectroscopic methods. The kinetics of A0 reduction, which are often discussed in terms of primary charge separation, take place in less then ten picoseconds (Shuvalov et al. 1979, Nuijs et al. 1987, Wasilievski et al. 1987, Mathis et al. 1988, Brettel and Vos 1999, Hecks et al. 1994, Hastings et al. 1994, Kumazaki et al. 1994, Savikhin et al. 2000, Turconi et al. 1996, Gobets and van Grondelle 2001), with limits up to ~1 ps discussed in the literature (Beddard 1998). The eC3 (A0) chlorophylls are adjacent to a phylloquinone molecule (A1) which acts as a successive electron transfer intermediate (e.g. Rustandi et al. 1990, Snyder et al. 1991, Brettel and Golbeck 1996, Setif and Brettel 1993, Rigby et al. 1996). The binding site of A1 is very similar, either in the PsaA or the PsaB subunit (Jordan et al. 2001). The naphtone ring of the molecule is stacked to the side chain of a tryptophan residue (PsaA-W697, PsaB-W677, S. elongatus numbering). Only one of the keto-carbonyl oxygen appears to be hydrogen bonded by the peptide bond involving PsaA-Leu722 (PsaB-718). The successive electron acceptor is the [4Fe-4S] cluster, FX (e.g. Evans and Cammack 1975, Evans et al. 1978, Golbeck et al. 1978, McDermott et al. 1989), which is, as P700, bound at the interface of the PsaA:PsaB protein hetero-dimer. The terminal iron-sulphur clusters FA and FB, which operates in series, are not bound by PsaA:PsaB but by the PsaC subunit.
The phylloquinones (A1) are reduced very rapidly to the phyllosemiquinone radical form in about 20-40 ps (e.g. Brettel and Vos 1999, Hecks et al. 1994, Brettel 1997, Santabarbara et al. 2005a). Oxidation of the ionic radical displays polyphasic kinetics with characteristic lifetimes of about ~20 ns and ~200 ns. Brettel and coworkers (Brettel 1997, Schlodder et al. 1998) initially suggested that the observed biphasic kinetic was the result of a small driving force for the electron transfer reaction between A1 and FX. The fast phase, in this hypothesis, essentially reflects the rate of FX oxidation and the slow phase is principally determined by the actual radical semiquinone A1
- quinone oxidation. Evidences for this model were derived from temperature dependence studies of A1
- oxidation kinetics, where a large activation barrier in the order of 100-200 meV was observed (Schlodder et al. 1998). However, in a more recent reinvestigation in which the fast ~20-ns phase was resolved, it was shown to have a much lower activation barrier of 15 meV (Agalarov and Brettel 2003). Thus, it has been suggested that the fast rate is associated with the oxidation of the A1B
- (the phylloquinone bound by the PsaB subunits) while the slow phase, as generally accepted, is associated to the reoxidation of A1A
- (the phylloquinone bound by the PsaA subunits). This hypothesis, which is referred to as “bidirectional” electron transfer model, was initially proposed by Joliot and Joliot (1999) and successively substantiated by a host of spectroscopic studies in site directed mutants of either the phylloquinone (e.g. Guergova-Kuras et al. 2001, Fairclough et al. 2003, Byrdin et al. 2006, Ali et al. 2006) or the eC3 Chls (Santabarbara et al. 2005b, Byrdin et al. 2006). The scientific community working on higher plants systems has rapidly reached a consensus on the validity of the bidirectional model. However some discrepancies existed with respect to researches working on often identical site-directed mutations but in the cyanobacterial reaction centre (e.g. Xu et al 2003a, 2003b, Cohen et al. 2004). Nevertheless, recent works by Bautista et al. (2005), Santabarbara et al. (2006) and Poluektov et al. (2005) clearly demonstrated the possibility of populating radical pairs, in which the electron
Stefano Santabarbara and Luca Galuppini 8
acceptors is either A1A or A1B. Thus bidirectionality appears to hold true and to be a general property of PS I reaction centres. This is a very unique property, as both Photosystem II and the reaction centre of purple bacteria perform a very symmetric electron transfer, where only one of the symmetrically arranged potential redox centre is functionally active in primary photochemistry. The necessity of performing asymmetric electron transfer is functionally linked to the two electron reduction of the terminal electron acceptors of type II (PS II and Purple Bacterial RC), QB. The QB quinone is reduced to quinol in two successive reactions, each of which involves the single reduction of QA to semi-quinone state. Thus, there is a need to control the flux of electron from one quinone (QA) to the other (QB) to avoid possible photochemical and chemical shortcut leading to dissipation of the charge separated state. As all the electron transfer reactions in PS I involve a single-electron exchange, an asymmetric (or monodirectional) electron transfer does not bring about any functional advantage.
Even though the level of knowledge of energy and electron transfer in photosynthetic reaction centre, and in particular that of Photosystem I, is relatively advanced so that the main characteristic of energy and electron transfer processes are understood in their general terms, a number of unsolved issues relating the molecular details of these processes still exist. These are often the results of improved and novel spectroscopic investigation possessing superior temporal, spectral and analytical resolution. We will try to discuss some of the contended matter by using kinetic models of increasing complexity, which takes into account electron transfer and energy transfer reactions. This will also serve to highlight specific differences amongst prokaryotic and eukaryotic PS I reaction centres. In the following we will address the points which represent, in our view, the principal matter of contention. Those are the effect of the dimension of external antenna on the primary photochemical events and the role of long wavelengths absorption Chlorophyll form and the chemical nature of electron transfer cofactors involved in primary charge separation and their kinetics of reduction and oxidation.
The effect of the dimension on the (whole) light harvesting antenna have been a matter of intense debate amongst the photosynthetic community for over three decades. The trapping kinetics can be, in the simplest framework, be categorised into two different scenarios, the trap limited and the diffusion limited case. The trap limited model implies that singlet excited state equilibration amongst the antenna pigments is extremely rapid, while the photochemical reactions are comparatively slower. This yield full thermal equilibration in the antenna, which can be considered as comprising the photochemical pigments, particularly if photochemistry is initially reversible, so that singlet excited state de-excitation occurs essentially via photochemical quenching. The diffusion limited model describes an opposite scenario, in which photochemistry is very rapid, but the transfer of excitation in the antenna is not. Thus it is the time the exciton spends in the antenna, before reaching the photochemical trap that limits the photochemistry. Clearly, both views are extreme and simplified limit cases. This has been widely recognised, so that, even in relatively limited kinetics models the contribution of both, exciton migration and photochemical trapping, is considered (e.g. Melkozernov 2001, Gobets and van Grondelle 2001, Muller et al. 2003). A system is then considered as diffusion or trap limited if one of these parameters is largely dominating, i.e. if the constrains imposed by the exciton diffusion in the antenna or by the photochemical rate are significantly larger than the other, or vice versa. An interesting case at the interface between a purely trap and a purely diffusion limited model is a so-called transfer-to-trap limited model. This case can be exemplified by a rapid initial excited state equilibration in the antenna, followed by a slow energy transfer from the thermalised antenna bed to the
Electron and Energy Transfer in the Photosystem I of Cyanobacteria 9
photochemical trap.. In a series of investigations of cyanobacterial PS I core complexes from a variety of species, Gobets and coworkers (Gobets and van Grondelle 2001, Gobets et al. 2001a, 2001b, Gobets et al. 2003a, 2003b) concluded that the presence of long-wavelength Chl forms (“red forms”) imposed such a kinetic limitation. Therefore, the trapping kinetics was consistent with a transfer-to-trap limited model. Similar conclusions were also reached by Melkozernov and coworkers. (Melkozernov et al. 2000a, 2004, Melkozernov 2001) who investigated the problem independently. Subsequently Ihalainen et al. (2005a, 2005b) who studied PS I-LHC I complexes from different higher plants systems and Engelmann et al. (2006) who investigated both the PS I-LHC I super-complex and a core, both purified from Zea mays extended the transfer-to-trap limited model to eukaryotic PSI reaction centre. These results agreed with a previous investigation using time-resolved fluorescence spectroscopy in PS I:LHC I super-complex (Croce et al. 2000) which showed a continuous spectral evolution during the excited state lifetime, which is not expected for a trap-limited model where singlet state equilibration is expected to be more rapid than the kinetics of photochemical trapping. Engelmann et al. (2006) and Gobets et al. (2001a, 2001b, 2003a, 2003b) also discussed the effect of a “pure” increase in antenna dimension on the trapping kinetics, concluding that, albeit an enlarged antenna would slow the excited state (this kinetic limitation were greater for Engelmann and cowokers (2006) compared to Gobets and coworkers (Gobets and van Grondelle 2001)), the principal kinetic bottleneck resides in the presence of red chlorophyll forms. On the other hand, Holzwarth and coworkers (Muller et al. 2003, Holzwarth et al. 2003, Holzwarth et al. 2005, Slavov et al. 2008) who principally investigated PS I complexes isolated from the green alga Chlamydomonas reinhardtii (Muller et al. 2003, Holzwarth et al. 2003, Holzwarth et al. 2005), but successively confirmed their observation in core and PS I-LHC I particle from Arabidopsis thaliana (Slavov et al. 2008), concluded that the trapping kinetic were trap-limited instead. The difference in the interpretation of the otherwise similar experimental results stemmed from the need to include a reversible primary radical pair, to describe the kinetics in the 500 fs to 10 ps time range. Such a process was not considered in the publication of Van Grondelle and coworkers (Gobets and van Grondelle 2001, Gobets et al. 2001a, 2001b, Gobets et al. 2003a, 2003b, Ihalainen et al. 2005a, 2005b, 2007) and Jennings and coworkers (Engelmann et al. 2006). In a more recent publication by Slavov et al. (2008) the role of kinetic limitation by the dimension of the antenna and the presence of red form were also addressed. However, it was concluded that albeit the red forms induced a kinetic constrain on trapping, it is the actual photochemistry which dominates the decay lifetime, so that the overall the process should still be considered trap-limited. It is obvious that, at present, there is no general agreement amongst different laboratories. This possibly originates from the choice of specific kinetic models that emphasise either the electron transfer or the energy transfer process, although that is not always the case. Moreover, the different groups have, until now, only considered mono-directional primary reactions schemes. Thus, we will discuss the experimental findings by the aid of a kinetic model considering both the energy transfer and the electron transfer kinetic as well as bi-directionality.
Stefano Santabarbara and Luca Galuppini 10
2. COMPARTMENTAL MODELLING
2.1. General Aspects Compartmental modelling is a modelling approach which considers a few discrete states
(the compartments) of a more complex system. The rational behind this approximation is that the chosen compartments represent the most relevant states in the systems, or the only ones that can be observed experimentally. A straightforward extension of this approach is that many microscopic states can be condensed in a single functional compartment, and only the evolutions of the functional compartments are considered. This approximation holds true, as long as any kinetic processes occurring within the microscopic state building up the functional compartment are faster than the reaction occurring amongst different compartments. Thus, it is the reactions taking place between internally pre-equilibrated states of the system which are explicitly considered in the model. In general, this is a sensible approximation, and in most cases is substantiated by experimental evidences. For instance, in the case of photosynthetic complexes which are described in this chapter, the transfer of excitation energy amongst the chromophore composing either the inner or the outer antenna, occurs in a sub-picosecond time scale (reviewed by Melkozernov 2001, Gobets and van Grondelle 2001), while fluorescence emission, in absence of excited state quenching by photochemical reactions, is observed in the nanoseconds (ns) time scale. This large difference in between exciton hopping and radiative relaxation allows considering only a few emitters, which act as local excitation sinks, typically for thermodynamic reasons, rather than the complex network of the antenna which involves over 100 fluorescing chromophores. More complex and elegant calculations, largely based on structural data and which consider each and every chromophore in photosynthetic super-complexes have also been performed (Byrdin et al. 2002, Damjanovic et al. 2002, Gobets et al. 2003b, Sener et al. 2004, 2005). However, relevant parameters in the modelling such as the energy of the sites, the direction and the intensity of the transition dipole moment, the homogenous and inhomogeneous distributions which determine the band-shape, the electron-phonon coupling modes, the energy of each pigment site, and so on are not directly accessible from the crystallographic model, therefore, they have to be arbitrarily set. These assumptions are often the source of large uncertainties despite the elegance of the calculation approach. In this respect the advantages of compartmental modelling are obvious; as it allows consideration of a limited number of states, the number of parameters to adjust to obtain a description of the experimental observable is relatively contained, compared to extensive which considers every microscopic state in a complex system. Moreover, as the simulations are constrained to a minimal set of physical quantities, it is generally simpler to abstract straightforwardly meaningful information from them. It is at the same time obvious that compartmental modelling can be applied successfully to systems for which the crystallographic structure has not been yet resolved, but for which the functional states are known, for example, from spectroscopic or biochemical analysis. In this chapter we present an extension of a previous modelling of the electron transfer reaction in Photosystem I (Santabarbara et al. 2005a) of eukaryotes and prokaryotes, which also take directly into account excited state equilibration in the antenna bed. The following paragraph describes the detail of the mathematical model employed to perform the calculations. Although this refers to the specific system under investigation, it
Electron and Energy Transfer in the Photosystem I of Cyanobacteria 11
can be easily extended to any multi-step electron transfer process, either of biological or chemical nature.
2.2. Mathematical Description In order to model the catalytic activity of Photosystem I its is necessary to consider an
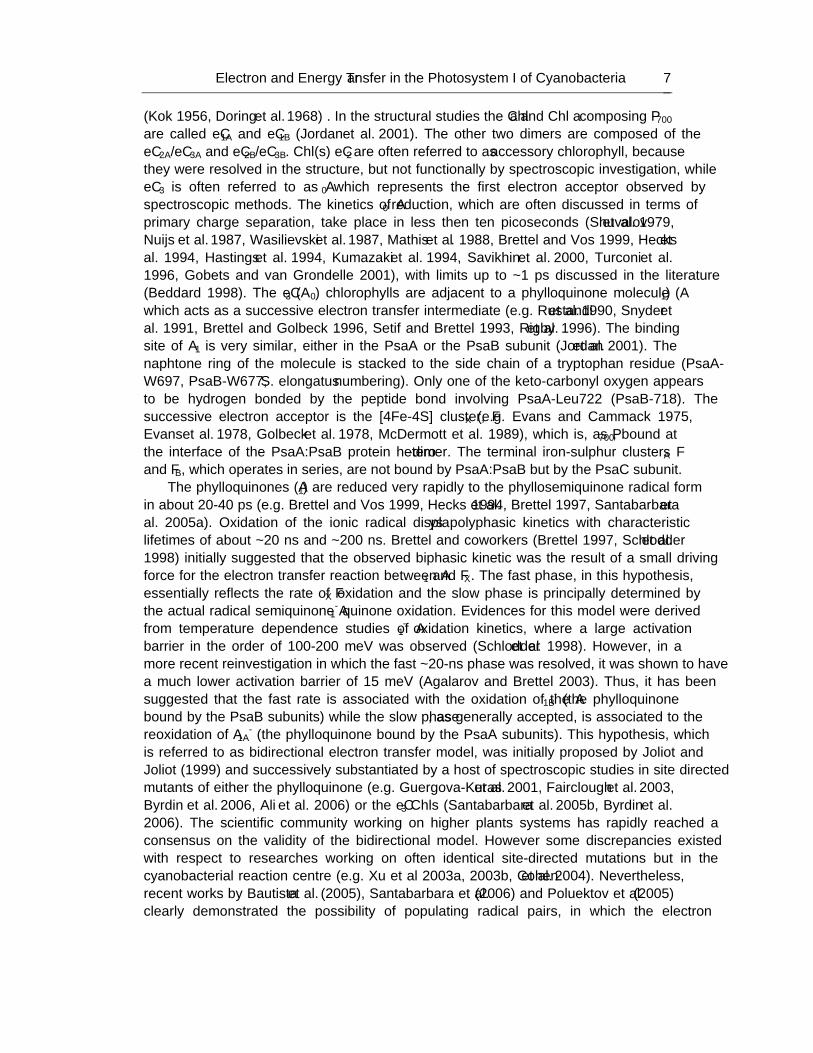
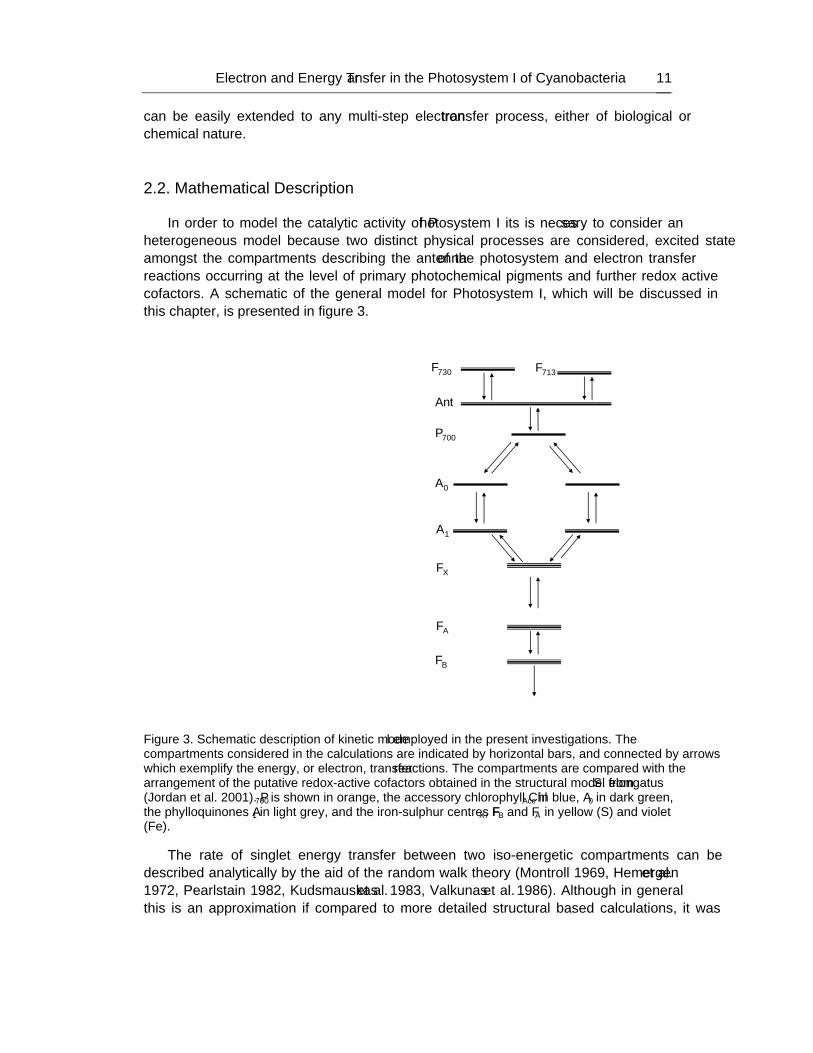
heterogeneous model because two distinct physical processes are considered, excited state amongst the compartments describing the antenna of the photosystem and electron transfer reactions occurring at the level of primary photochemical pigments and further redox active cofactors. A schematic of the general model for Photosystem I, which will be discussed in this chapter, is presented in figure 3.
FB
FA
FX
A1
A0
P700
Ant
F730 F713
Figure 3. Schematic description of kinetic model employed in the present investigations. The compartments considered in the calculations are indicated by horizontal bars, and connected by arrows which exemplify the energy, or electron, transfer reactions. The compartments are compared with the arrangement of the putative redox-active cofactors obtained in the structural model from S. elongatus (Jordan et al. 2001). P700 is shown in orange, the accessory chlorophyll ChlAcc in blue, A0 in dark green, the phylloquinones A1 in light grey, and the iron-sulphur centres FX, FB and FA in yellow (S) and violet (Fe).
The rate of singlet energy transfer between two iso-energetic compartments can be described analytically by the aid of the random walk theory (Montroll 1969, Hemergen et al. 1972, Pearlstain 1982, Kudsmauskas et al. 1983, Valkunas et al. 1986). Although in general this is an approximation if compared to more detailed structural based calculations, it was
Stefano Santabarbara and Luca Galuppini 12
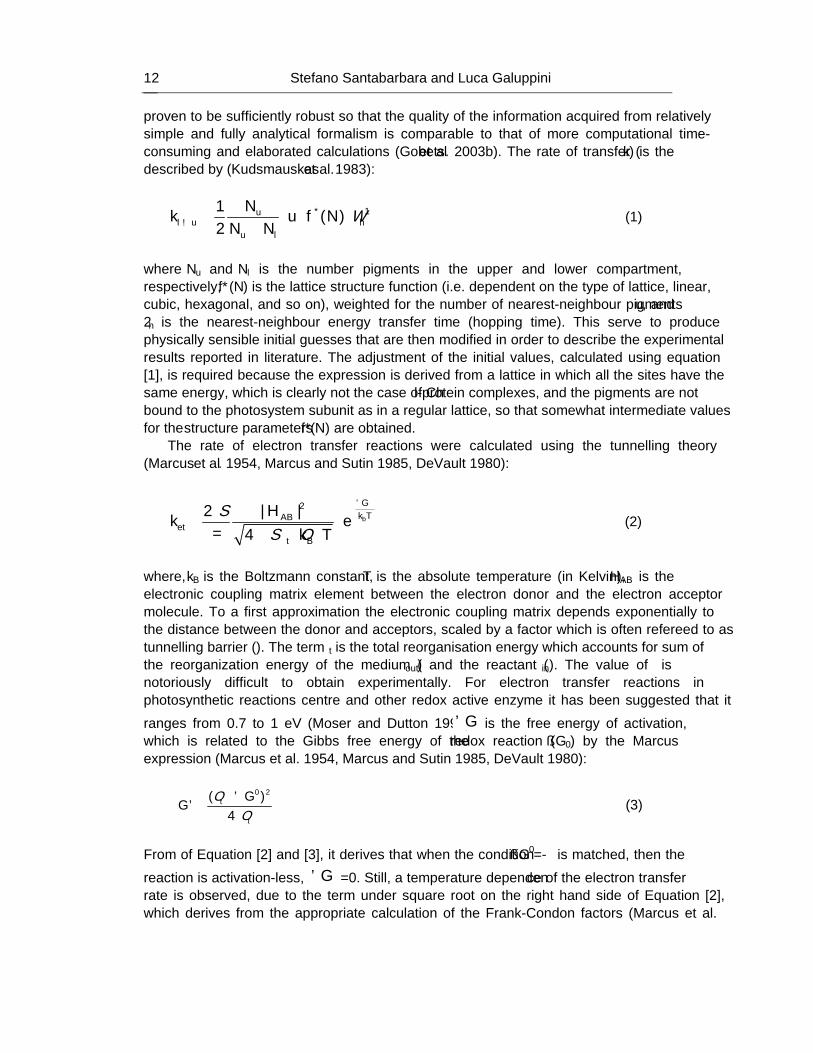
proven to be sufficiently robust so that the quality of the information acquired from relatively simple and fully analytical formalism is comparable to that of more computational time-consuming and elaborated calculations (Gobets et al. 2003b). The rate of transfer (k) is the described by (Kudsmauskas et al. 1983):
* 11 ( )
2u
l u hu l
Nk u f NN N
τ −−> = ⋅ ⋅ ⋅
+ (1)
where Nu and Nl is the number pigments in the “upper” and “lower “compartment, respectively, f*(N) is the lattice structure function (i.e. dependent on the type of lattice, linear, cubic, hexagonal, and so on), weighted for the number of nearest-neighbour pigments u, and τh is the nearest-neighbour energy transfer time (hopping time). This serve to produce physically sensible initial guesses that are then modified in order to describe the experimental results reported in literature. The adjustment of the initial values, calculated using equation [1], is required because the expression is derived from a lattice in which all the sites have the same energy, which is clearly not the case of Chl-protein complexes, and the pigments are not bound to the photosystem subunit as in a regular lattice, so that somewhat intermediate values for the structure parameters f*(N) are obtained.
The rate of electron transfer reactions were calculated using the tunnelling theory (Marcus et al. 1954, Marcus and Sutin 1985, DeVault 1980):
†
2| |24
b
Gk TAB
ett B
Hk ek T
ππ λ
Δ−⋅
= ⋅⋅ ⋅ ⋅ ⋅
(2)
where, kB is the Boltzmann constant, T is the absolute temperature (in Kelvin), HAB is the electronic coupling matrix element between the electron donor and the electron acceptor molecule. To a first approximation the electronic coupling matrix depends exponentially to the distance between the donor and acceptors, scaled by a factor which is often refereed to as tunnelling barrier (β). The term λt is the total reorganisation energy which accounts for sum of the reorganization energy of the medium (λout) and the reactant (λin). The value of λ is notoriously difficult to obtain experimentally. For electron transfer reactions in photosynthetic reactions centre and other redox active enzyme it has been suggested that it
ranges from 0.7 to 1 eV (Moser and Dutton 1992). †GΔ is the free energy of activation, which is related to the Gibbs free energy of the redox reaction (ΔG0) by the Marcus expression (Marcus et al. 1954, Marcus and Sutin 1985, DeVault 1980):
0 2
† ( )4
t
t
GG
λλ
+ ΔΔ =
⋅ (3)
From of Equation [2] and [3], it derives that when the condition ΔG0=-λ is matched, then the
reaction is activation-less, as †GΔ =0. Still, a temperature dependence of the electron transfer rate is observed, due to the term under square root on the right hand side of Equation [2], which derives from the appropriate calculation of the Frank-Condon factors (Marcus et al.
Electron and Energy Transfer in the Photosystem I of Cyanobacteria 13
1954, Marcus and Sutin 1985, DeVault 1980). In order to take into account coupling of the electron transfer reaction with a main low-frequency vibration of the protein matrix (phonon), Hopfield (1974, see also DeVault 1980) derived a formulation in which the kbT term is substituted by:
( ) coth2 2 b
Tk T
ω ωσ = ⋅ (4)
where is the Dirac constant and ω is the mean phonon frequency, expressed in angular frequency units. It is interesting to notice that at high temperatures ( )Tσ is numerically very close to kbT (i.e. when kbT>> ω ), while at low temperature ( )Tσ tends to an almost constant value ( 1
2 ω ). More sophisticated expressions, which include contributions from several phonon models, have been described by Jortner (1976). However, such refinement goes beyond the scope of the present calculation; therefore we limit ourselves to the use of the Hopfield approximation.
The population dynamics in each compartment of the kinetic model are calculated by a system of linear differential equations, which can be written in a compact matrix form as:
ddt
Κ= −A A (5)
where A is the composition vector (of each state/compartment) and K is the rate coefficient matrix, and have forms:
( )( )( )
( )........
( )
A tB tC t
t
Z t
=
⎛ ⎞⎜ ⎟⎜ ⎟⎜ ⎟⎜ ⎟⎜ ⎟⎜ ⎟⎜ ⎟⎜ ⎟⎝ ⎠
Α and
1, ,1 1,1 ,12
1, 2, 1,2
1, 1 2, 1 3,
1, 2, 3, ,
...
... ...
... ...
... ... ... ... ...
...
n
j j j nj
j j j
j j j
n n n n j
k k k k
k k k
k k k
k k k k
Κ =
+=
+
+ +
⎛ ⎞−⎜ ⎟
⎜ ⎟⎜ ⎟
−⎜ ⎟⎜ ⎟⎜ ⎟
−⎜ ⎟⎜ ⎟⎜ ⎟⎜ ⎟⎜ ⎟−⎜ ⎟⎝ ⎠
∑
∑
∑
∑
(6)
where A(t), B(t)…Z(t), are the population evolution of each compartment (A, B…Z) and K is a square matrix, which elements are the kinetic constants connecting the compartments. The element on the diagonal represents the sum of the depopulation rate of each compartment, hence the minus sign, while the off-diagonal terms describe the rate of population of each compartment from the other. The experimentally observed decay lifetimes are the eigenvalues of the matrix K , and generally depend on all the individual rate
Stefano Santabarbara and Luca Galuppini 14
constants. Thus in principle it is incorrect to assign an observed decay lifetime to a specific reaction, which is a rather common approach. This simple approximation is, rigorously, valid only when the off-diagonal terms are zero, which is the case for linear reaction scheme, in which the back-reaction constants are so small to be negligible (i.e. a very large equilibrium constant).
The solutions of the system of differential equation are described as:
1( ) tt Pe PΛ −=A (7) where P is an orthogonal and invertible matrix which satisfies the condition: 1PKP− = Λ , Λ is the matrix of the negative eigenvalues, defined by det( ) 0K I− Λ = , where I is the identity matrix. In order to obtain a unique solution, it is necessary to solve the system for a specific boundary condition, which describes the initial state of the system (i.e. excitation wavelength, redox state of the cofactors, etc). The general solutions for the system of differential equations have the form:
1
( ) jn
tj
j
t e τ
=
= ∑Α V (8)
where Vj is the j-th eigenvector (for a specific set of initial conditions ~
iA ) and τj is the inverse of the j-th eigenvalue, which is, obviously, independent from the initial conditions. In experimental terms, this means that the measured lifetimes are not expected to change, under different experimental conditions (unless a specific reaction is suppressed or the rate constants modified by sample manipulation), while the amplitudes are. Positive values in the eigenvectors represent depopulation processes while negative values describe population reactions. With this in mind we have calculated a series of parameters from the solutions of the system of differential equations, avτ , the weighted average decay lifetime , r
avτ , the
average rise time, and davτ the reduced averaged decay time. The expression has the form
1
1
n
j jj
av n
jj
V
V
ττ =
=
⋅=
∑
∑ (9)
This expression (Equation [9]) is valid only for the compartment which are initially
populated. The τav terms have been shown to describe the “average trapping time” in photosynthetic RC (Croce et al. 2000, Jennings et al. 2003c, Engelmann et al. 2005), and can be determined with accuracy by the analysis of time-resolved fluorescence spectra. However, or all the compartments describing pure electron transfer reactions this parameter is
inadequate as 1
0n
jj
V=
=∑ and the value tend to infinity. In experimental measure, this is not a
Electron and Energy Transfer in the Photosystem I of Cyanobacteria 15
problem because absolute excitation selectivity is impossible, yielding a small, but non-zero, population in all the physical compartments involved in energy transfer and primary photochemical reactions. For the purpose of the calculations presented in this study, we introduce the terms r
avτ , the average rise time, and davτ reduced decay lifetime, which have
the same form of Equation 9, but for ravτ the summation is performed over all negative
amplitude, while for davτ it is performed over positive.
A parameter of general validity is the mean decay lifetime, which is described by the first moment of the population evolution:
0
0
( )
( )i
t f t dt
f t dtτ
∞
∞
⋅=
∫
∫ (10)
where f(t) is the population evolution of a compartment i. This parameter can be shown to represent the average time of depopulation of compartment i since the initiation of the process, which can take place in any other level in the kinetic model.
3. MODELLING OF THE PRIMARY PHOTOCHEMICAL REACTION IN PHOTOSYSTEM I REACTION CENTRE
3.1. Isoenergetic Antenna Systems
In the following we will present models of increasing complexity in terms of antenna
organisation and electron transfer reactions. We set out our analysis by considering all the possible electron transfer reactions within PS I reaction centre but a simplified antenna description, which is accounted by a single antenna compartment.
A scheme which describes pictorially the compartment included in the calculation is presented in figure 4. The antenna is described by a single compartment composed of 80 Chl a molecules emitting fluorescence at 680 nm. This wavelength was chosen as it is close to the maximal emission of the PS I core complex isolated from higher plants (Croce et al. 1996, 1998) and that of LHC I complexes which do not bind long-wavelength emitting Chls (Croce et al. 1998, 2007), at room temperature. The antenna is kinetically coupled to a group of six chlorophyll a (Chl a) molecules, which build up the photochemical reaction centre. The singlet excited state of this Chl a cluster (which will be referred to as RC*) is considered as a single functional compartment. That implies that singlet energy equilibration within the RC* compartment is more rapid than photochemical reactions. At this stage, we consider a simple one-step charge separation reaction, stemming from the Chl a dimer located perpendicular to the membrane plane, which physically is part of RC*, and is commonly referred to as P700 (the primary electron donor). The electron acceptor, is a second functional dimer of Chl a, which is also physically part of RC*, and will be referred to as A0. The cofactors bound to the PsaA and PsaB reaction centre subunits are both considered photochemically active, in view of the
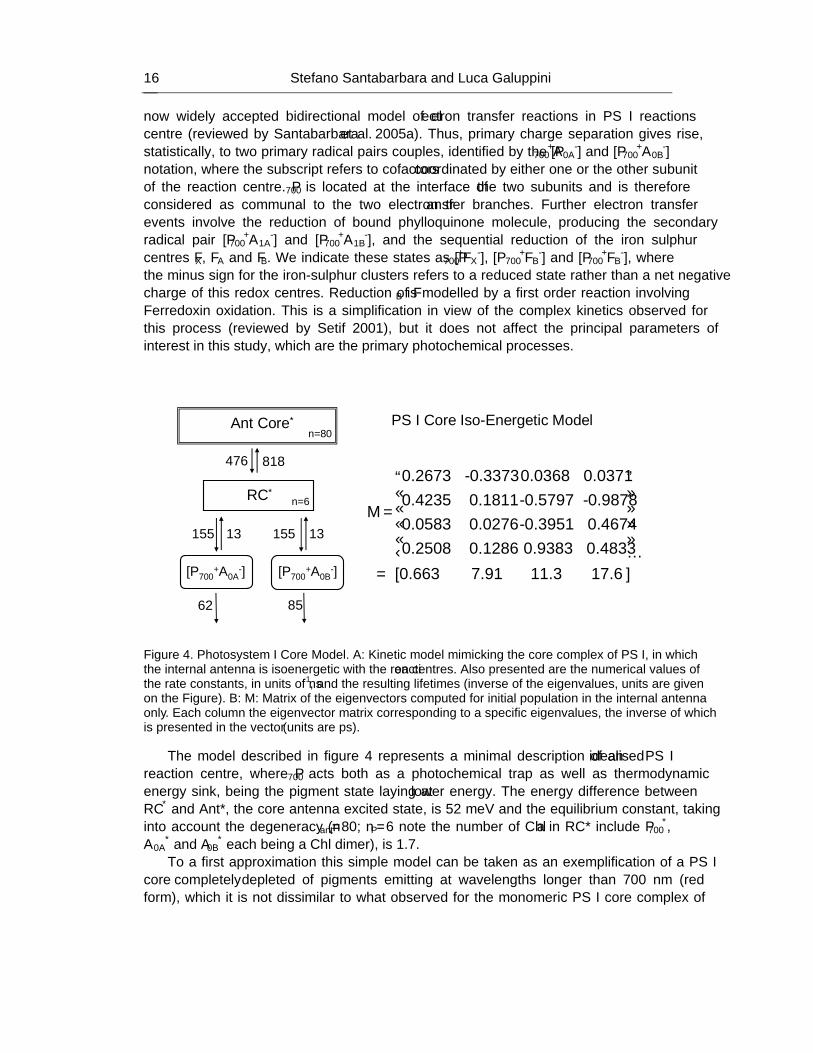
Stefano Santabarbara and Luca Galuppini 16
now widely accepted bidirectional model of electron transfer reactions in PS I reactions centre (reviewed by Santabarbara et al. 2005a). Thus, primary charge separation gives rise, statistically, to two primary radical pairs couples, identified by the [P700
+A0A-] and [P700
+A0B-]
notation, where the subscript refers to cofactors coordinated by either one or the other subunit of the reaction centre. P700 is located at the interface of the two subunits and is therefore considered as communal to the two electron transfer branches. Further electron transfer events involve the reduction of bound phylloquinone molecule, producing the secondary radical pair [P700
+A1A-] and [P700
+A1B-], and the sequential reduction of the iron sulphur
centres FX, FA and FB. We indicate these states as [P700+FX
-], [P700+FB
-] and [P700+FB
-], where the minus sign for the iron-sulphur clusters refers to a reduced state rather than a net negative charge of this redox centres. Reduction of FB is modelled by a first order reaction involving Ferredoxin oxidation. This is a simplification in view of the complex kinetics observed for this process (reviewed by Setif 2001), but it does not affect the principal parameters of interest in this study, which are the primary photochemical processes.
Ant Core*
RC*
476 818
155 13 155 13
n=80
n=6
“PS I Core Iso-Energetic” Model
0.2673 -0.3373 0.0368 0.03710.4235 0.1811 -0.5797 -0.9878
=0.0583 0.0276 -0.3951 0.46740.2508 0.1286 0.9383 0.4833
= [0.663 7.91 11.3 17.6
⎡ ⎤⎢ ⎥⎢ ⎥⎢ ⎥⎢ ⎥⎣ ⎦
M
λ ][P700+A0A
-]
62 85
[P700+A0B
-]
Figure 4. Photosystem I Core Model. A: Kinetic model mimicking the core complex of PS I, in which the internal antenna is isoenergetic with the reaction centres. Also presented are the numerical values of the rate constants, in units of ns-1, and the resulting lifetimes (inverse of the eigenvalues, units are given on the Figure). B: M: Matrix of the eigenvectors computed for initial population in the internal antenna only. Each column the eigenvector matrix corresponding to a specific eigenvalues, the inverse of which is presented in the vector λ (units are ps).
The model described in figure 4 represents a minimal description of an idealised PS I reaction centre, where P700 acts both as a photochemical trap as well as thermodynamic energy sink, being the pigment state laying at lower energy. The energy difference between RC* and Ant*, the core antenna excited state, is 52 meV and the equilibrium constant, taking into account the degeneracy (nant=80; nP=6 note the number of Chl a in RC* include P700
*, A0A
* and A0B* each being a Chl dimer), is 1.7.
To a first approximation this simple model can be taken as an exemplification of a PS I core completely depleted of pigments emitting at wavelengths longer than 700 nm (“red form”), which it is not dissimilar to what observed for the monomeric PS I core complex of
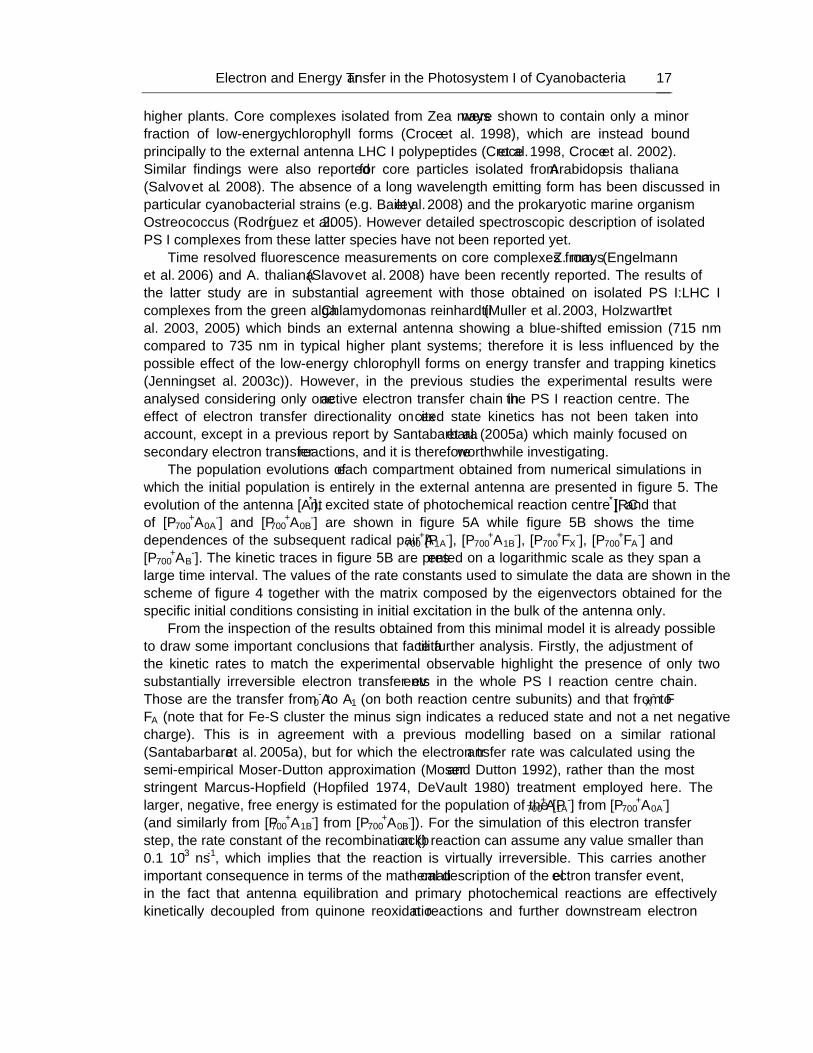
Electron and Energy Transfer in the Photosystem I of Cyanobacteria 17
higher plants. Core complexes isolated from Zea mays were shown to contain only a minor fraction of low-energy chlorophyll forms (Croce et al. 1998), which are instead bound principally to the external antenna LHC I polypeptides (Croce et al. 1998, Croce et al. 2002). Similar findings were also reported for core particles isolated from Arabidopsis thaliana (Salvov et al. 2008). The absence of a long wavelength emitting form has been discussed in particular cyanobacterial strains (e.g. Bailey et al. 2008) and the prokaryotic marine organism Ostreococcus (Rodríguez et al. 2005). However detailed spectroscopic description of isolated PS I complexes from these latter species have not been reported yet.
Time resolved fluorescence measurements on core complexes from Z. mays (Engelmann et al. 2006) and A. thaliana (Slavov et al. 2008) have been recently reported. The results of the latter study are in substantial agreement with those obtained on isolated PS I:LHC I complexes from the green alga Chlamydomonas reinhardtii (Muller et al. 2003, Holzwarth et al. 2003, 2005) which binds an external antenna showing a blue-shifted emission (715 nm compared to 735 nm in typical higher plant systems; therefore it is less influenced by the possible effect of the low-energy chlorophyll forms on energy transfer and trapping kinetics (Jennings et al. 2003c)). However, in the previous studies the experimental results were analysed considering only one active electron transfer chain in the PS I reaction centre. The effect of electron transfer directionality on excited state kinetics has not been taken into account, except in a previous report by Santabarbara et al. (2005a) which mainly focused on secondary electron transfer reactions, and it is therefore worthwhile investigating.
The population evolutions of each compartment obtained from numerical simulations in which the initial population is entirely in the external antenna are presented in figure 5. The evolution of the antenna [Ant*], excited state of photochemical reaction centre [RC*], and that of [P700
+A0A-] and [P700
+A0B-] are shown in figure 5A while figure 5B shows the time
dependences of the subsequent radical pair [P700+A1A
-], [P700+A1B
-], [P700+FX
-], [P700+FA
-] and [P700
+AB-]. The kinetic traces in figure 5B are presented on a logarithmic scale as they span a
large time interval. The values of the rate constants used to simulate the data are shown in the scheme of figure 4 together with the matrix composed by the eigenvectors obtained for the specific initial conditions consisting in initial excitation in the bulk of the antenna only.
From the inspection of the results obtained from this minimal model it is already possible to draw some important conclusions that facilitate further analysis. Firstly, the adjustment of the kinetic rates to match the experimental observable highlight the presence of only two substantially irreversible electron transfer events in the whole PS I reaction centre chain. Those are the transfer from A0
- to A1 (on both reaction centre subunits) and that from FX- to
FA (note that for Fe-S cluster the minus sign indicates a reduced state and not a net negative charge). This is in agreement with a previous modelling based on a similar rational (Santabarbara et al. 2005a), but for which the electron transfer rate was calculated using the semi-empirical Moser-Dutton approximation (Moser and Dutton 1992), rather than the most stringent Marcus-Hopfield (Hopfiled 1974, DeVault 1980) treatment employed here. The larger, negative, free energy is estimated for the population of the [P700
+A1A-] from [P700
+A0A-]
(and similarly from [P700+A1B
-] from [P700+A0B
-]). For the simulation of this electron transfer step, the rate constant of the recombination (back) reaction can assume any value smaller than 0.1 10-3 ns-1, which implies that the reaction is virtually irreversible. This carries another important consequence in terms of the mathematical description of the electron transfer event, in the fact that antenna equilibration and primary photochemical reactions are effectively kinetically decoupled from quinone reoxidation reactions and further downstream electron
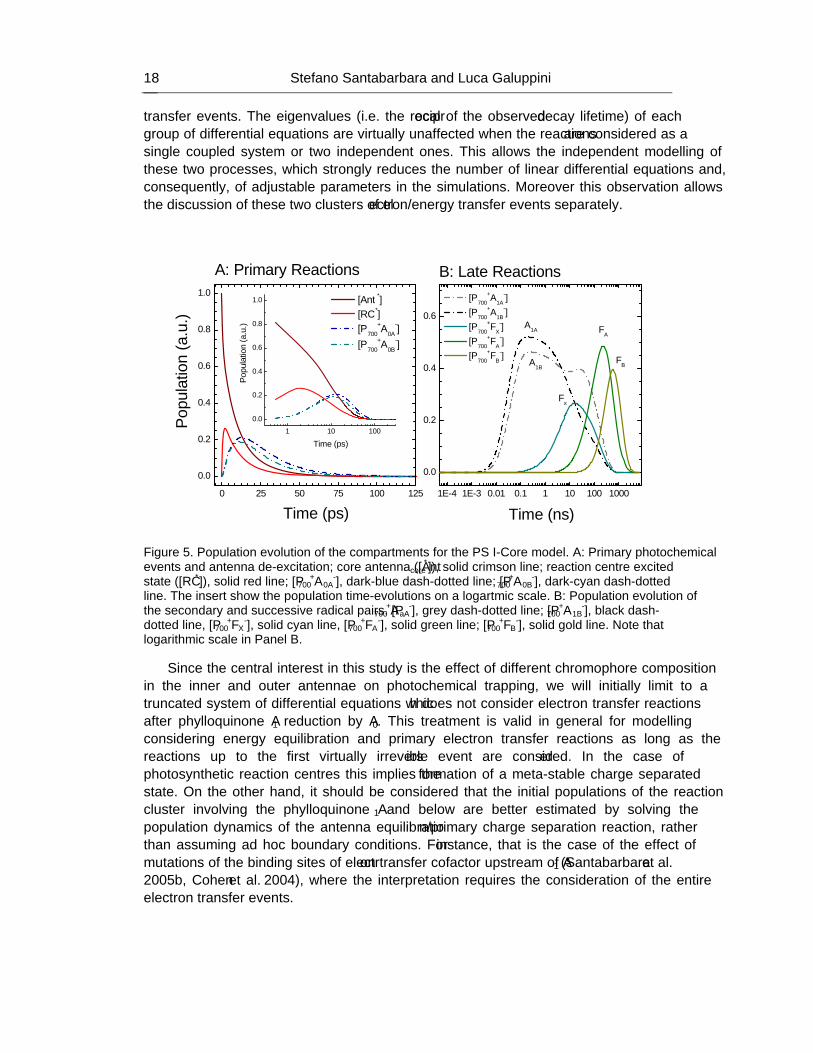
Stefano Santabarbara and Luca Galuppini 18
transfer events. The eigenvalues (i.e. the reciprocal of the observed decay lifetime) of each group of differential equations are virtually unaffected when the reactions are considered as a single coupled system or two independent ones. This allows the independent modelling of these two processes, which strongly reduces the number of linear differential equations and, consequently, of adjustable parameters in the simulations. Moreover this observation allows the discussion of these two clusters of electron/energy transfer events separately.
1E-4 1E-3 0.01 0.1 1 10 100 1000
0.0
0.2
0.4
0.6
B: Late ReactionsA: Primary Reactions [P700
+A1A-]
[P700+A1B
-] [P700
+FX-]
[P700+FA
-] [P700
+FB-]
A1A
A1B
FA
FB
Fx
Time (ns)0 25 50 75 100 125
0.0
0.2
0.4
0.6
0.8
1.0
[Ant*] [RC*] [P700
+A0A-]
[P700+A0B
-]
Time (ps)
Popu
latio
n (a
.u.)
1 10 1000.0
0.2
0.4
0.6
0.8
1.0
Time (ps)
Popu
latio
n (a
.u.)
Figure 5. Population evolution of the compartments for the PS I-Core model. A: Primary photochemical events and antenna de-excitation; core antenna ([Antcore
*]), solid crimson line; reaction centre excited state ([RC*]), solid red line; [P700
+A0A-], dark-blue dash-dotted line; [P700
+A0B-], dark-cyan dash-dotted
line. The insert show the population time-evolutions on a logartmic scale. B: Population evolution of the secondary and successive radical pairs. [P700
+AaA-], grey dash-dotted line; [P700
+A1B-], black dash-
dotted line, [P700+FX
-], solid cyan line, [P700+FA
-], solid green line; [P700+FB
-], solid gold line. Note that logarithmic scale in Panel B.
Since the central interest in this study is the effect of different chromophore composition in the inner and outer antennae on photochemical trapping, we will initially limit to a truncated system of differential equations which does not consider electron transfer reactions after phylloquinone A1 reduction by A0. This treatment is valid in general for modelling considering energy equilibration and primary electron transfer reactions as long as the reactions up to the first virtually irreversible event are considered. In the case of photosynthetic reaction centres this implies the formation of a meta-stable charge separated state. On the other hand, it should be considered that the initial populations of the reaction cluster involving the phylloquinone A1 and below are better estimated by solving the population dynamics of the antenna equilibration/primary charge separation reaction, rather than assuming “ad hoc” boundary conditions. For instance, that is the case of the effect of mutations of the binding sites of electron transfer cofactor upstream of A1 (Santabarbara et al. 2005b, Cohen et al. 2004), where the interpretation requires the consideration of the entire electron transfer events.
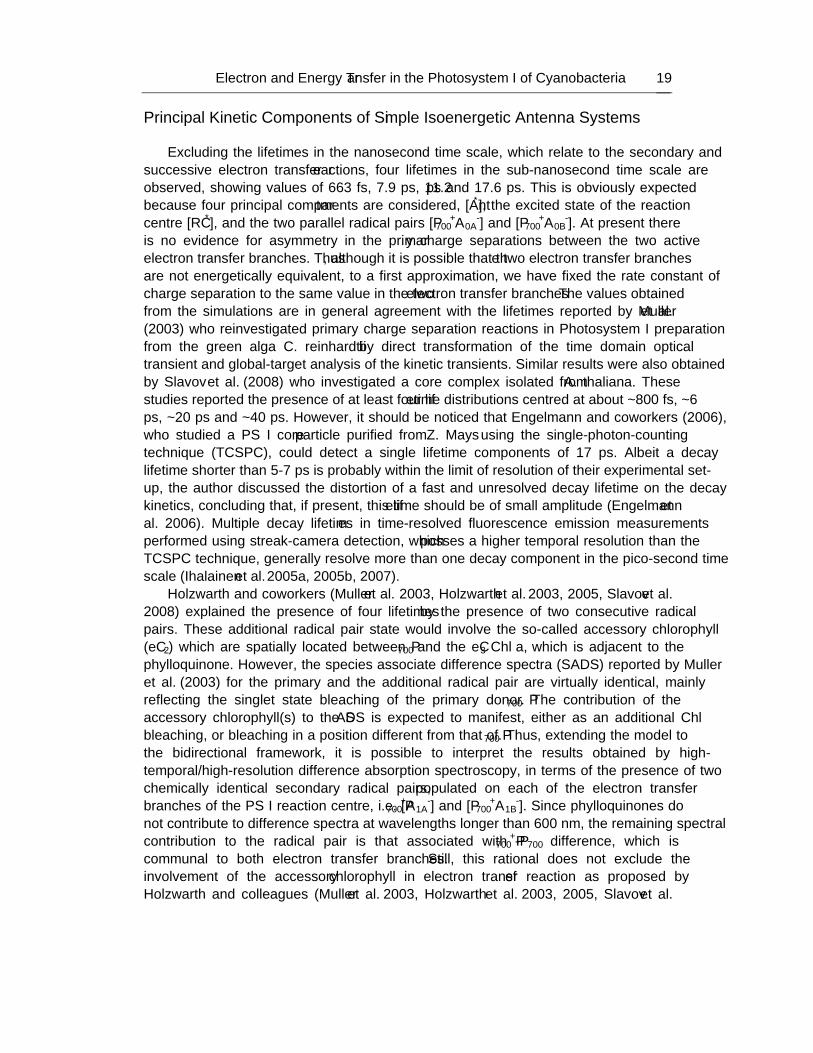
Electron and Energy Transfer in the Photosystem I of Cyanobacteria 19
Principal Kinetic Components of Simple Isoenergetic Antenna Systems Excluding the lifetimes in the nanosecond time scale, which relate to the secondary and
successive electron transfer reactions, four lifetimes in the sub-nanosecond time scale are observed, showing values of 663 fs, 7.9 ps, 11.2 ps and 17.6 ps. This is obviously expected because four principal compartments are considered, [Ant*], the excited state of the reaction centre [RC*], and the two “parallel” radical pairs [P700
+A0A-] and [P700
+A0B-]. At present there
is no evidence for asymmetry in the primary charge separations between the two active electron transfer branches. Thus, although it is possible that the two electron transfer branches are not energetically equivalent, to a first approximation, we have fixed the rate constant of charge separation to the same value in the two electron transfer branches. The values obtained from the simulations are in general agreement with the lifetimes reported by Muller et al. (2003) who reinvestigated primary charge separation reactions in Photosystem I preparation from the green alga C. reinhardtii by direct transformation of the time domain optical transient and global-target analysis of the kinetic transients. Similar results were also obtained by Slavov et al. (2008) who investigated a core complex isolated from A. thaliana. These studies reported the presence of at least four lifetime distributions centred at about ~800 fs, ~6 ps, ~20 ps and ~40 ps. However, it should be noticed that Engelmann and coworkers (2006), who studied a PS I core particle purified from Z. Mays using the single-photon-counting technique (TCSPC), could detect a single lifetime components of 17 ps. Albeit a decay lifetime shorter than 5-7 ps is probably within the limit of resolution of their experimental set-up, the author discussed the distortion of a fast and unresolved decay lifetime on the decay kinetics, concluding that, if present, this lifetime should be of small amplitude (Engelmann et al. 2006). Multiple decay lifetimes in time-resolved fluorescence emission measurements performed using streak-camera detection, which posses a higher temporal resolution than the TCSPC technique, generally resolve more than one decay component in the pico-second time scale (Ihalainen et al. 2005a, 2005b, 2007).
Holzwarth and coworkers (Muller et al. 2003, Holzwarth et al. 2003, 2005, Slavov et al. 2008) explained the presence of four lifetimes by the presence of two consecutive radical pairs. These additional radical pair state would involve the so-called accessory chlorophyll (eC2) which are spatially located between P700 and the eC3 Chl a, which is adjacent to the phylloquinone. However, the species associate difference spectra (SADS) reported by Muller et al. (2003) for the primary and the additional radical pair are virtually identical, mainly reflecting the singlet state bleaching of the primary donor P700. The contribution of the accessory chlorophyll(s) to the SADS is expected to manifest, either as an additional Chl bleaching, or bleaching in a position different from that of P700. Thus, extending the model to the bidirectional framework, it is possible to interpret the results obtained by high-temporal/high-resolution difference absorption spectroscopy, in terms of the presence of two chemically identical secondary radical pairs, populated on each of the electron transfer branches of the PS I reaction centre, i.e. [P700
+A1A-] and [P700
+A1B-]. Since phylloquinones do
not contribute to difference spectra at wavelengths longer than 600 nm, the remaining spectral contribution to the radical pair is that associated with P700
+-P700 difference, which is communal to both electron transfer branches. Still, this rational does not exclude the involvement of the accessory chlorophyll in electron transfer reaction as proposed by Holzwarth and colleagues (Muller et al. 2003, Holzwarth et al. 2003, 2005, Slavov et al.
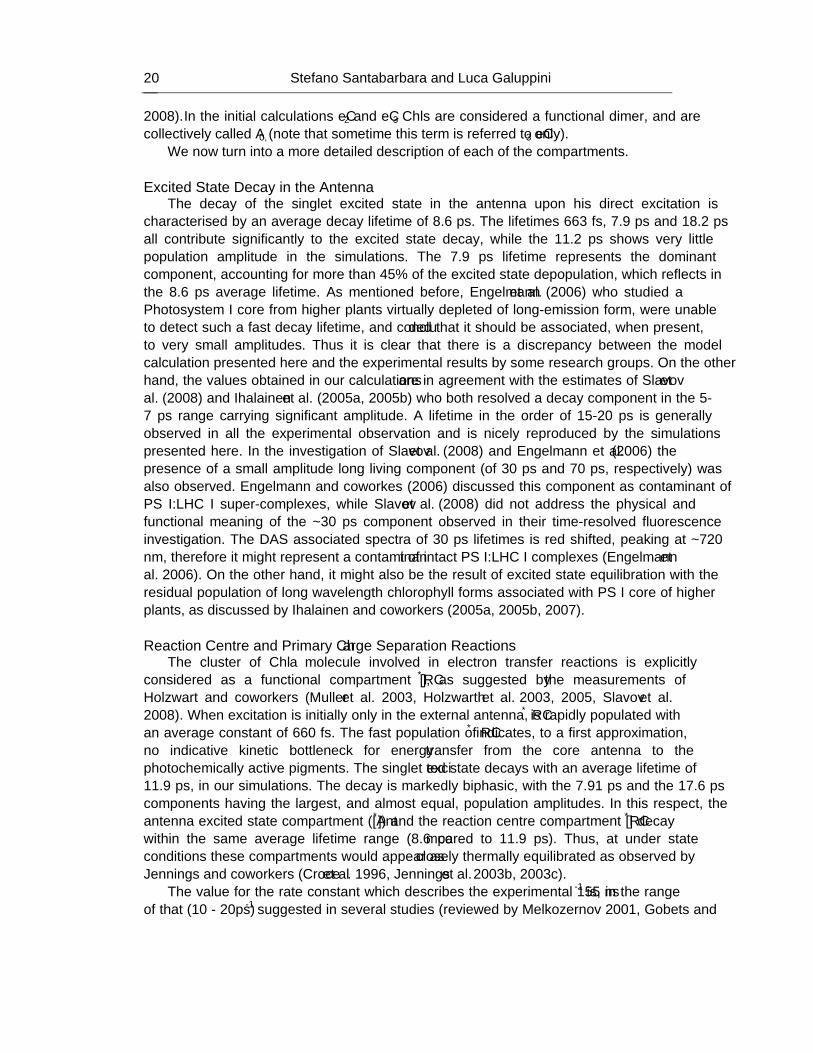
Stefano Santabarbara and Luca Galuppini 20
2008). In the initial calculations eC2 and eC3 Chls are considered a functional dimer, and are collectively called A0, (note that sometime this term is referred to eC3 only).
We now turn into a more detailed description of each of the compartments.
Excited State Decay in the Antenna The decay of the singlet excited state in the antenna upon his direct excitation is
characterised by an average decay lifetime of 8.6 ps. The lifetimes 663 fs, 7.9 ps and 18.2 ps all contribute significantly to the excited state decay, while the 11.2 ps shows very little population amplitude in the simulations. The 7.9 ps lifetime represents the dominant component, accounting for more than 45% of the excited state depopulation, which reflects in the 8.6 ps average lifetime. As mentioned before, Engelmann et al. (2006) who studied a Photosystem I core from higher plants virtually depleted of long-emission form, were unable to detect such a fast decay lifetime, and concluded that it should be associated, when present, to very small amplitudes. Thus it is clear that there is a discrepancy between the model calculation presented here and the experimental results by some research groups. On the other hand, the values obtained in our calculations are in agreement with the estimates of Slavov et al. (2008) and Ihalainen et al. (2005a, 2005b) who both resolved a decay component in the 5-7 ps range carrying significant amplitude. A lifetime in the order of 15-20 ps is generally observed in all the experimental observation and is nicely reproduced by the simulations presented here. In the investigation of Slavov et al. (2008) and Engelmann et al. (2006) the presence of a small amplitude long living component (of 30 ps and 70 ps, respectively) was also observed. Engelmann and coworkes (2006) discussed this component as contaminant of PS I:LHC I super-complexes, while Slavov et al. (2008) did not address the physical and functional meaning of the ~30 ps component observed in their time-resolved fluorescence investigation. The DAS associated spectra of 30 ps lifetimes is red shifted, peaking at ~720 nm, therefore it might represent a contaminant of intact PS I:LHC I complexes (Engelmann et al. 2006). On the other hand, it might also be the result of excited state equilibration with the residual population of long wavelength chlorophyll forms associated with PS I core of higher plants, as discussed by Ihalainen and coworkers (2005a, 2005b, 2007).
Reaction Centre and Primary Charge Separation Reactions
The cluster of Chl a molecule involved in electron transfer reactions is explicitly considered as a functional compartment [RC*], as suggested by the measurements of Holzwart and coworkers (Muller et al. 2003, Holzwarth et al. 2003, 2005, Slavov et al. 2008). When excitation is initially only in the external antenna, RC* is rapidly populated with an average constant of 660 fs. The fast population of RC* indicates, to a first approximation, no indicative kinetic bottleneck for energy transfer from the core antenna to the photochemically active pigments. The singlet excited state decays with an average lifetime of 11.9 ps, in our simulations. The decay is markedly biphasic, with the 7.91 ps and the 17.6 ps components having the largest, and almost equal, population amplitudes. In this respect, the antenna excited state compartment ([Ant*]) and the reaction centre compartment [RC*] decay within the same average lifetime range (8.6 compared to 11.9 ps). Thus, at under state conditions these compartments would appear as closely thermally equilibrated as observed by Jennings and coworkers (Croce et al. 1996, Jennings et al. 2003b, 2003c).
The value for the rate constant which describes the experimental 155 ns-1 is, in the range of that (10 - 20ps)-1 suggested in several studies (reviewed by Melkozernov 2001, Gobets and
Electron and Energy Transfer in the Photosystem I of Cyanobacteria 21
van Grondelle 2001), but significantly smaller than the rate of 400 ns-1 proposed by the Muller et al (2003) and Slavov et al. (2008) which included reversible charge separation. However, in all previous studies, the excited state and trapping kinetics were estimated using a mono-directional model. In the previous calculation, as well in those previously published by Santabarbara et al. (2005a) a bi-directional electron transfer model is considered. Thus, the overall depopulation of RC* has to take into account the processes occurring on both putative electron transfer branches. As the rate for the population of the [P700
+A0A-] and [P700
+A0B-]
radical pair are assumed to be identical, the actual total depopulation of rate of [RC*] is 360 ns-1, a value not dissimilar from the ~400 ns-1 indicated by Holzwarth’s laboratory.
Primary Radical Pair
The numerical simulation predicts an average rise time of 9.2 ps and 7.9 ps for the [P700
+A0A-] and the [P700
+A0B-] radical pairs respectively. We wish to underline the fact that,
based on the present knowledge, we are unable to actually distinguish [P700+A0A
-] and [P700
+A0B-]. We have assigned to the latter radical pair the faster decay dynamics, which
allows us to identify in a simple manner each of the two “parallel” charge separated states. However, this assignment is arbitrary, and further experimental investigations, possibly involving site-directed mutants of specific binding sites of the PsaA and the PsaB subunits, are needed to actually discriminate the kinetic properties of these radical pairs. The simulated rise kinetics of 7.9 and 9.2 ps fall in lifetime distributions observed in the ultra-fast optical absorption measurements (Muller et al. 2003, Holzwarth et al. 2003, 2005) and they are therefore in general agreement with experimental observations. Similar rises time for the [P700
+A0A-] and the [P700
+A0B-] radical pairs are expected because the charge separation rates
are presumed to be identical on both the electron transfer branches. The slight difference arises from different weighting factors (eigenvectors) in the presence of the same lifetimes (eigenvalues), which resulted from a slightly larger depopulation of [P700
+A0B-] (85 ns-1) with
respect to [P700+A0A
-] (65 ns-1). The rise of [P700+A0B
-] is monotonous and described by the 7.9 ps lifetime, while the one of [P700
+A0A-] is biphasic and described by the 7.9 ps and 11.2 ps
components, with fractional amplitudes of 0.6:0.4 respectively. Non-monotonous kinetics of primary radical pair population, are also expected in the frame of reversible charge separation. However, the lifetimes are generally very close in space, and might be difficult to distinguish in experimental measurements. [P700
+A0A-] and the [P700
+A0B-] decay with average
lifetimes of 17.0 ps and 14.0 ps respectively. In both cases, the 17.6 ps component is dominant in determining the rate of depopulation. The decay of the primary radical pair, leading to the population of a virtually irreversible charge separated state, parallel that of the antenna excited state population, i.e. 17.6 ps. Similar figures are found computing the first moment of the population evolution which is 13.0 ps for the [Ant*] compartment and 14.4 ps for [RC*] compartment. Therefore it appears that the trapping time determined by time-resolved fluorescence experiments do not reflect primary charge separation events, in case the reaction are reversible and a rapid equilibrium between [RC*] and [Ant*] is taking place, but rather the average time of population of a meta-stable radical pair, which is the case described here is the formation of [P700
+A1A/B-]. This also points toward a significant limitation of
trapping kinetics on the excited state lifetime, i.e. a trap-limited model. On the other hand, it is significant to note that, compared to our previous calculations (Santabarbara et al. 2005a) in which a simpler model assuming a strongly energy funnelled antenna was considered, we need to increase the value of the charge separation rate by approximately 50% (i.e. 155 ns-1
Stefano Santabarbara and Luca Galuppini 22
compared to 100 ns-1). This also points toward some kinetic limitation imposed by [RC*]/[Ant*] equilibration, i.e. transfer-to-trap limited model. It is therefore the interplay of energy transfer and photochemical reaction to determine the overall excited state equilibration. Ignoring either one or the other process in modelling the reaction centre dynamics, might lead to substantial biased estimation of kinetics rates and excited state/electron transfer intermediate population.
3.2. Effect of Dimension of an Isoenergetic Antenna System An interesting problem for the kinetic and efficiency of energy trapping are the eventual
limitation imposed by the size, i.e. the number of chromophore, in the antenna. Theoretical studies indicate that the trapping time of an iso-energetic lattice should scale linearly with the number of pigments. This can be understood in a simple intuitive manner considering that excitation losses increase proportionally to the number of steps in a random walk (Pealstain 1982, Kudsmauskas et al. 1983, Gobets et al. 2003b). However, this suggestion holds true principally when the energy transfer to the photochemical active centre represents the main kinetic limitation to the overall excited state dynamic, which is often referred to as a purely diffusion-limited model. It is clear, that this is not the case for photosynthetic complexes, where the principal bottlenecks are discussed either in terms of the photochemical reactions only (trap-limited (Muller et al. 2003, Holzwarth et al. 2003, 2005, Slavov et al. 2008)), or by energy transfer from a specific spectral pool to the photochemical reaction centre (transfer-to-trap limited (Melkzernov et al. 2000a, 2000b, Gobets and van Grondelle 2001, Gobets et al. 2001b, 2003a, 2003b, Engelmann et al. 2006)). On the other hand, as discussed by Engelmann et al. (2005) for the case of higher plants Photosystem II:LHC II complex, that either in a diffusion limited or transfer-to-trap limited model, the excited state resides mostly in the antenna during its average lifetime. This is also the case of a trap-limited model, if rapid equilibration with the antenna takes place, as it is case both in PS I and PS II reaction centres.
In order to address this issue we have considered a system which is schematically shown in figure 6 and in which an additional antenna compartment is directly coupled to the “core” antenna, but not to the reaction centre. Structurally, this mimics the effect of coupling an external antenna moiety, such as the LHC I complexes, to the inner antenna-reaction centre complex, as observed in higher plants and green algal PS I (e.g. see figures 1 and 2). We consider this compartment as iso-energetic to the core, or, in other words, we initially neglect the presence of chlorophyll forms which absorb at wavelengths longer than the trap. Thus, in this calculation P700 still represents both a photochemical and an excitonic trap. This system is effectively purely artificial, as, to our knowledge, there is no report of an equivalent energetically related to this scheme, with the possible exclusion of the PS I:LHC I complex of Ostreococcus. Nevertheless, this allows addressing, at least under the calculations point of view, to the effect of the number of molecule in the antenna only. As a reference, we started with an isoenergetic antenna compartment composed of 80 Chl a, thereafter referred as the “bulk”. This number is also similar to that suggested by crystallographic models (Jordan et al. 2001, Ben-Shem et al. 2003) in which four LHC I monomers, each binding approximately 15 Chl a, were resolved. However, this initial assumption is sub-stoichiometric with the number of Chl a obtained in biochemical studies which is about 200 for the PS I:LHC I super-
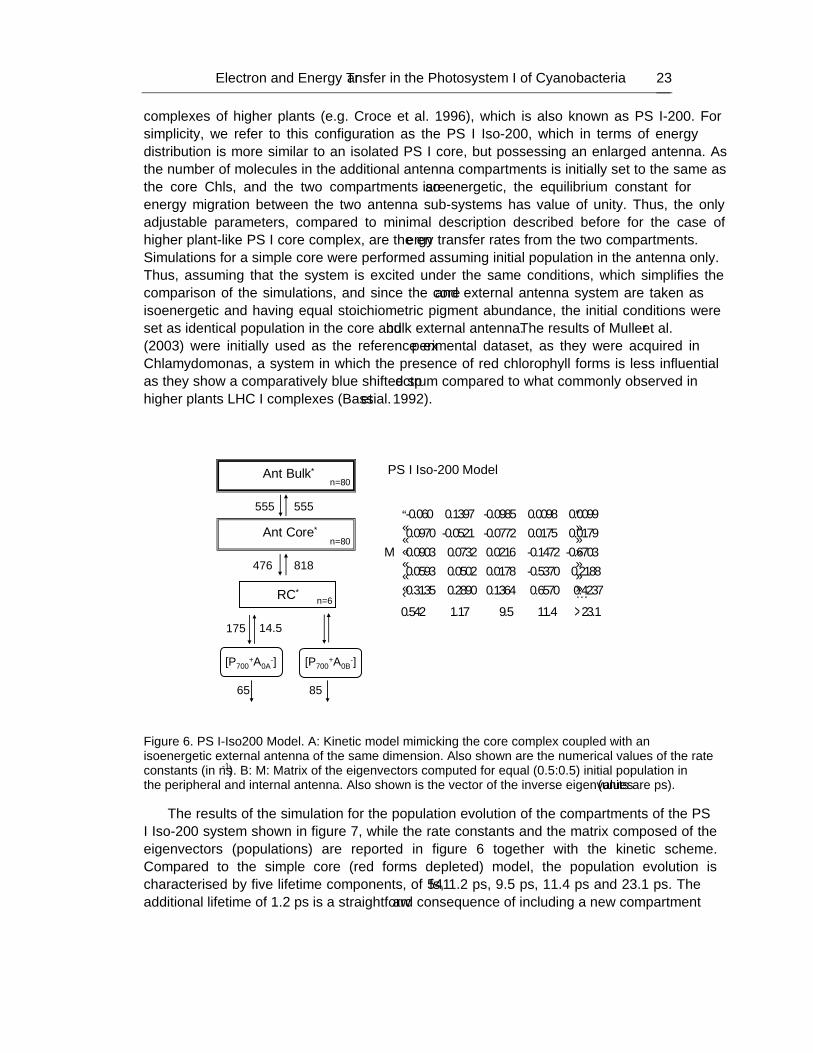
Electron and Energy Transfer in the Photosystem I of Cyanobacteria 23
complexes of higher plants (e.g. Croce et al. 1996), which is also known as PS I-200. For simplicity, we refer to this configuration as the “PS I Iso-200”, which in terms of energy distribution is more similar to an isolated PS I core, but possessing an enlarged antenna. As the number of molecules in the additional antenna compartments is initially set to the same as the core Chls, and the two compartments are iso-energetic, the equilibrium constant for energy migration between the two antenna sub-systems has value of unity. Thus, the only adjustable parameters, compared to minimal description described before for the case of higher plant-like PS I core complex, are the energy transfer rates from the two compartments. Simulations for a simple core were performed assuming initial population in the antenna only. Thus, assuming that the system is excited under the same conditions, which simplifies the comparison of the simulations, and since the core and external antenna system are taken as isoenergetic and having equal stoichiometric pigment abundance, the initial conditions were set as identical population in the core and “bulk” external antenna. The results of Muller et al. (2003) were initially used as the reference experimental dataset, as they were acquired in Chlamydomonas, a system in which the presence of red chlorophyll forms is less influential as they show a comparatively blue shifted spectrum compared to what commonly observed in higher plants LHC I complexes (Bassi et al. 1992).
Ant Core*
RC*
476 818
175 14.5
n=80
n=6
Ant Bulk*
555 555
n=80“PS I Iso-200” Model
-0.060 0.1397 -0.0985 0.0098 0.00990.0970 -0.0521 -0.0772 0.0175 0.01790.0903 0.0732 0.0216 -0.1472 -0.67030.0593 0.0502 0.0178 -0.5370 0.2188
=M
[ ]0.3135 0.2890 0.1364 0.6570 0.4237
0.542 1.17 9.5 11.4 23.1
⎡ ⎤⎢ ⎥⎢ ⎥⎢ ⎥⎢ ⎥⎢ ⎥⎢ ⎥⎣ ⎦
=λ
[P700+A0A
-]
65 85
[P700+A0B
-]
Figure 6. PS I-Iso200 Model. A: Kinetic model mimicking the core complex coupled with an isoenergetic external antenna of the same dimension. Also shown are the numerical values of the rate constants (in ns-1). B: M: Matrix of the eigenvectors computed for equal (0.5:0.5) initial population in the peripheral and internal antenna. Also shown is the vector of the inverse eigenvalues λ (units are ps).
The results of the simulation for the population evolution of the compartments of the “PS I Iso-200” system shown in figure 7, while the rate constants and the matrix composed of the eigenvectors (populations) are reported in figure 6 together with the kinetic scheme. Compared to the simple core (red forms depleted) model, the population evolution is characterised by five lifetime components, of 541 fs, 1.2 ps, 9.5 ps, 11.4 ps and 23.1 ps. The additional lifetime of 1.2 ps is a straightforward consequence of including a new compartment
Stefano Santabarbara and Luca Galuppini 24
in the modelling. It is obvious that all the other lifetimes are not largely modified, even though both the 9.5 ps and 23.1 ps have increased values with respect to 7.9 and 17.6 ps, simulated in the core. Inspection of the rate constants shown in scheme of figure 6 shows that the principal difference resides in the rate constants of primary charge separation (kfc), which assumes a value of 175 ns-1 compared to 155 ns-1 when only an iso-energetic core antenna is considered. The need to increase the time constant for charge separation in order to maintain similar population (core=0.66 ps, iso200=0.81 ps) and depopulation (core=11.9 ps, iso200=20.2 ps) rates in the [RC*] component in the simulate core and a system with isonergetic antenna, derives from the direct competition of the external antenna, [AntBulk
*], and the [RC*] for the excited state in [Antcore
*], which to a first approximation equilibrates, with an average lifetime of ~1 ps. The value of 175 ns-1 for kfc was obtained with an excited state transfer constant between the core antenna, [Ant*], and the external bulk antenna [AntBulk
*] of 555 ns-1, which is equivalent to a τcore->bulk of 1.8 ps. Further increase of the value of energy exchange between the two antenna compartments did not lead to a decrease of the value of primary charge separation, unless physically unrealistic values in the order of 1600 ns-1 and higher were considered. Qualitatively, the necessity to increase the value of kfc upon increasing the size of the antenna, agrees with what observed in simulation for a funnelled core system (Santabarbara et al. 2005) compared to the absence of funnel (figure 4 and 5). However, it should be noticed that Slavov et al. (2008) who compared a core and a PS I:LHC I super-complex from A. thaliana described their experimental data by means of global-target and compartmental modelling using the same value for the primary charge separation of 400 ns-1. The authors consider for both the PS I core and the PSI:LHC I complexes a single “bulk” excited state antenna compartment, rather than the two separated compartment described here. This was also determined by the number of parameters effectively accessible from the data analysis and is in principle justified by ultra-fast equilibration between the core antenna and the bulk of the external antenna. However, Slavov et al. (2008) needed to modify the rate of excited state transfer from the antenna to the reaction centre. On the other hand, since in the simulations presented here the core and external antenna are considered separately, the transfer rate from the core to [RC*] is kept virtually to the same value (which is close to that estimated by Slavov and coworkers (2008)), while it is the coupling between the two antenna moieties which is varied. As mentioned above, up to physically reasonable rates for excited state transfer from (and to) the core antenna to (and from) the external antenna, we were required to increase of primary charge separation to preserve the population dynamics of [RC*]. This clearly shows that the coupling of an external antenna moiety, and in general increasing the total antenna size, imposes some kinetic constrain to primary charge separation as well as excited state depopulation. This can be almost straightforwardly quantified by comparing the kinetics of de-activation of the two antenna compartments. The calculations reported in figures 6 and 7 show that, under the initial population condition used in our simulation, the core and the bulk eternal antenna decay virtually simultaneously. The average decay lifetime of [Antcore
*] is 14.5 ps and that of [AntBulk*] is 15.9 ps. These lifetimes would
be indistinguishable in experimental data, and contribute to some form of lifetime distribution. It is interestingly to note that, even considering the readjustment of the primary charge separation constants which were increased from 155 ns-1 to 175 ns-1, the antenna τav increases from 8.6 ps in PS I core to ~15 ps PSI-iso200, a factor which is nearly identical to the increase in antenna size (ncor=80, niso200=160).
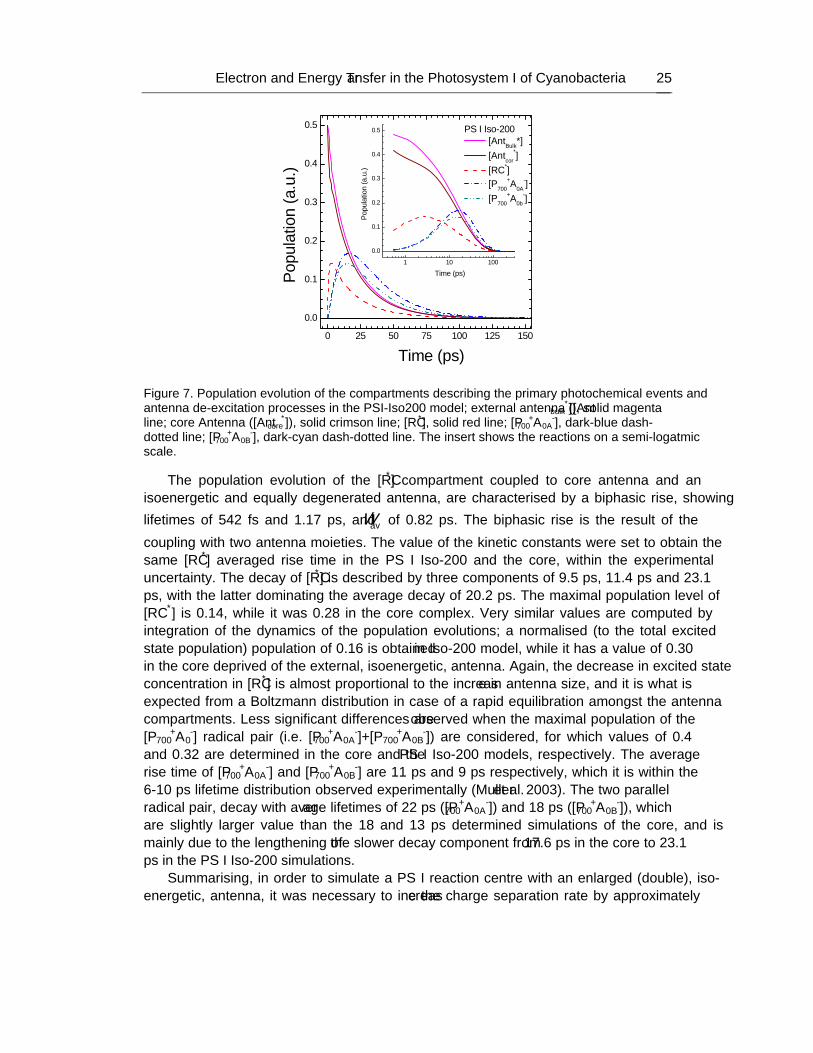
Electron and Energy Transfer in the Photosystem I of Cyanobacteria 25
0 25 50 75 100 125 150
0.0
0.1
0.2
0.3
0.4
0.5
Pop
ulat
ion
(a.u
.)
Time (ps)
PS I Iso-200 [AntBulk*] [Antcor
*] [RC*] [P700
+A0A-]
[P700+A0b
-]
1 10 100
0.0
0.1
0.2
0.3
0.4
0.5
Pop
ulat
ion
(a.u
.)
Time (ps)
Figure 7. Population evolution of the compartments describing the primary photochemical events and antenna de-excitation processes in the PSI-Iso200 model; external antenna ([Antbulk
*]), solid magenta line; core Antenna ([Antcore
*]), solid crimson line; [RC*], solid red line; [P700+A0A
-], dark-blue dash-dotted line; [P700
+A0B-], dark-cyan dash-dotted line. The insert shows the reactions on a semi-logatmic
scale.
The population evolution of the [RC*] compartment coupled to core antenna and an isoenergetic and equally degenerated antenna, are characterised by a biphasic rise, showing lifetimes of 542 fs and 1.17 ps, and r
avτ of 0.82 ps. The biphasic rise is the result of the coupling with two antenna moieties. The value of the kinetic constants were set to obtain the same [RC*] averaged rise time in the PS I Iso-200 and the core, within the experimental uncertainty. The decay of [RC*] is described by three components of 9.5 ps, 11.4 ps and 23.1 ps, with the latter dominating the average decay of 20.2 ps. The maximal population level of [RC*] is 0.14, while it was 0.28 in the core complex. Very similar values are computed by integration of the dynamics of the population evolutions; a normalised (to the total excited state population) population of 0.16 is obtained in Iso-200 model, while it has a value of 0.30 in the core deprived of the external, isoenergetic, antenna. Again, the decrease in excited state concentration in [RC*] is almost proportional to the increase in antenna size, and it is what is expected from a Boltzmann distribution in case of a rapid equilibration amongst the antenna compartments. Less significant differences are observed when the maximal population of the [P700
+A0-] radical pair (i.e. [P700
+A0A-]+[P700
+A0B-]) are considered, for which values of 0.4
and 0.32 are determined in the core and the PS I Iso-200 models, respectively. The average rise time of [P700
+A0A-] and [P700
+A0B-] are 11 ps and 9 ps respectively, which it is within the
6-10 ps lifetime distribution observed experimentally (Muller et al. 2003). The two “parallel” radical pair, decay with average lifetimes of 22 ps ([P700
+A0A-]) and 18 ps ([P700
+A0B-]), which
are slightly larger value than the 18 and 13 ps determined simulations of the core, and is mainly due to the lengthening of the slower decay component from 17.6 ps in the core to 23.1 ps in the PS I Iso-200 simulations.
Summarising, in order to simulate a PS I reaction centre with an enlarged (double), iso-energetic, antenna, it was necessary to increase the charge separation rate by approximately
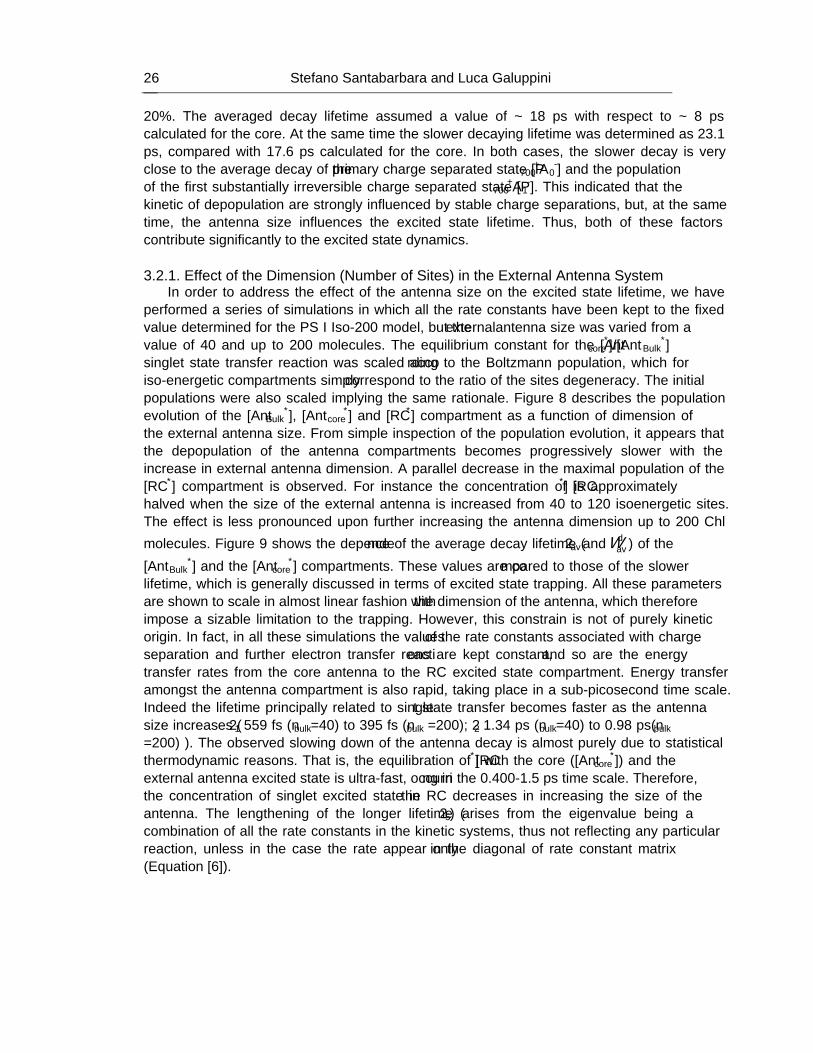
Stefano Santabarbara and Luca Galuppini 26
20%. The averaged decay lifetime assumed a value of ~ 18 ps with respect to ~ 8 ps calculated for the core. At the same time the slower decaying lifetime was determined as 23.1 ps, compared with 17.6 ps calculated for the core. In both cases, the slower decay is very close to the average decay of the primary charge separated state [P700
+A0-] and the population
of the first substantially irreversible charge separated state [P700+A1
-]. This indicated that the kinetic of depopulation are strongly influenced by stable charge separations, but, at the same time, the antenna size influences the excited state lifetime. Thus, both of these factors contribute significantly to the excited state dynamics.
3.2.1. Effect of the Dimension (Number of Sites) in the External Antenna System
In order to address the effect of the antenna size on the excited state lifetime, we have performed a series of simulations in which all the rate constants have been kept to the fixed value determined for the PS I Iso-200 model, but the external antenna size was varied from a value of 40 and up to 200 molecules. The equilibrium constant for the [Antcore
*]/[AntBulk*]
singlet state transfer reaction was scaled according to the Boltzmann population, which for iso-energetic compartments simply correspond to the ratio of the sites degeneracy. The initial populations were also scaled implying the same rationale. Figure 8 describes the population evolution of the [AntBulk
*], [Antcore*] and [RC*] compartment as a function of dimension of
the external antenna size. From simple inspection of the population evolution, it appears that the depopulation of the antenna compartments becomes progressively slower with the increase in external antenna dimension. A parallel decrease in the maximal population of the [RC*] compartment is observed. For instance the concentration of [RC*] is approximately halved when the size of the external antenna is increased from 40 to 120 isoenergetic sites. The effect is less pronounced upon further increasing the antenna dimension up to 200 Chl molecules. Figure 9 shows the dependence of the average decay lifetime (τav and d
avτ ) of the [AntBulk
*] and the [Antcore*] compartments. These values are compared to those of the slower
lifetime, which is generally discussed in terms of excited state trapping. All these parameters are shown to scale in almost linear fashion with the dimension of the antenna, which therefore impose a sizable limitation to the trapping. However, this constrain is not of purely kinetic origin. In fact, in all these simulations the values of the rate constants associated with charge separation and further electron transfer reactions are kept constant, and so are the energy transfer rates from the core antenna to the RC excited state compartment. Energy transfer amongst the antenna compartment is also rapid, taking place in a sub-picosecond time scale. Indeed the lifetime principally related to singlet state transfer becomes faster as the antenna size increases (τ1 559 fs (nbulk=40) to 395 fs (nbulk =200); τ2 1.34 ps (nbulk=40) to 0.98 ps(nbulk =200) ). The observed slowing down of the antenna decay is almost purely due to statistical thermodynamic reasons. That is, the equilibration of [RC*] with the core ([Antcore
*]) and the external antenna excited state is ultra-fast, occurring in the 0.400-1.5 ps time scale. Therefore, the concentration of singlet excited state in the RC decreases in increasing the size of the antenna. The lengthening of the longer lifetime (τ5) arises from the eigenvalue being a combination of all the rate constants in the kinetic systems, thus not reflecting any particular reaction, unless in the case the rate appear only in the diagonal of rate constant matrix Κ (Equation [6]).
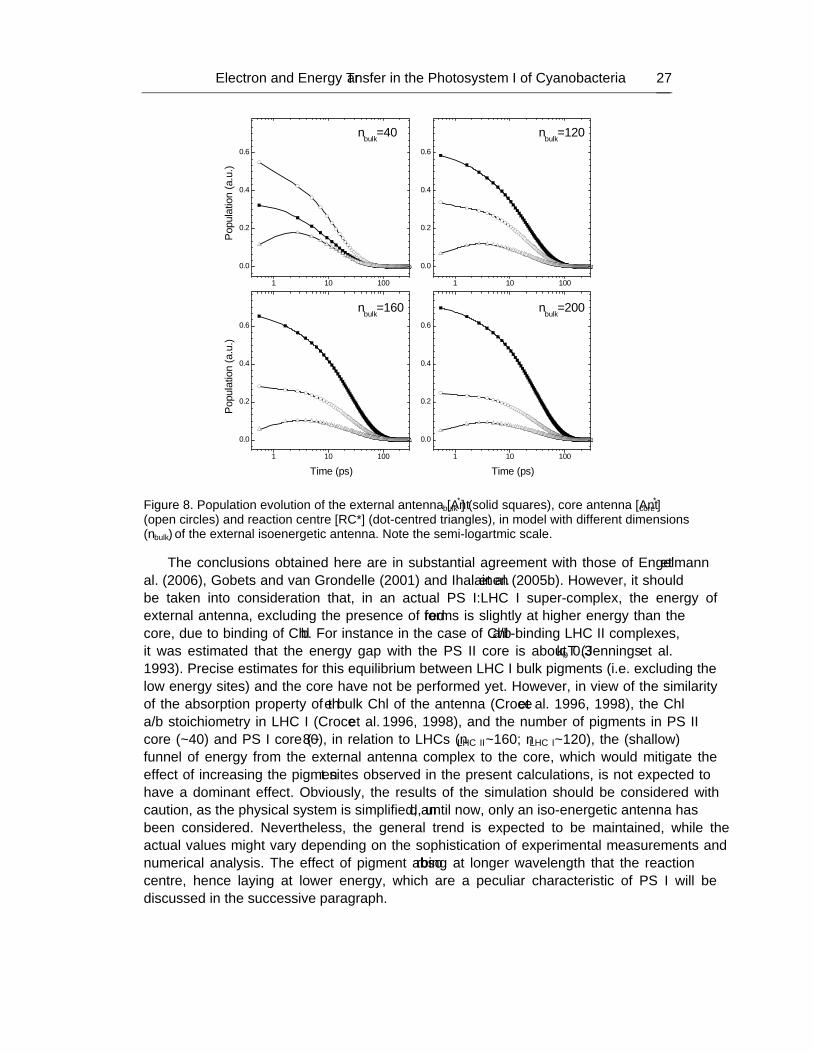
Electron and Energy Transfer in the Photosystem I of Cyanobacteria 27
1 10 100
0.0
0.2
0.4
0.6
nbulk
=200nbulk
=160
nbulk
=120nbulk
=40
Popu
latio
n (a
.u.)
1 10 100
0.0
0.2
0.4
0.6
1 10 100
0.0
0.2
0.4
0.6
Time (ps)
Popu
latio
n (a
.u.)
1 10 100
0.0
0.2
0.4
0.6
Time (ps)
Figure 8. Population evolution of the external antenna [Antbulk*] (solid squares), core antenna [Antcore
*] (open circles) and reaction centre [RC*] (dot-centred triangles), in model with different dimensions (nbulk) of the external isoenergetic antenna. Note the semi-logartmic scale.
The conclusions obtained here are in substantial agreement with those of Engelmann et al. (2006), Gobets and van Grondelle (2001) and Ihalainen et al. (2005b). However, it should be taken into consideration that, in an actual PS I:LHC I super-complex, the energy of external antenna, excluding the presence of “red forms” is slightly at higher energy than the core, due to binding of Chl b. For instance in the case of Chl a/b-binding LHC II complexes, it was estimated that the energy gap with the PS II core is about 0.3 kbT (Jennings et al. 1993). Precise estimates for this equilibrium between LHC I bulk pigments (i.e. excluding the low energy sites) and the core have not be performed yet. However, in view of the similarity of the absorption property of the bulk Chl of the antenna (Croce et al. 1996, 1998), the Chl a/b stoichiometry in LHC I (Croce et al. 1996, 1998), and the number of pigments in PS II core (~40) and PS I core (~80), in relation to LHCs (nLHC II~160; nLHC I~120), the (shallow) funnel of energy from the external antenna complex to the core, which would mitigate the effect of increasing the pigment sites observed in the present calculations, is not expected to have a dominant effect. Obviously, the results of the simulation should be considered with caution, as the physical system is simplified, and, until now, only an iso-energetic antenna has been considered. Nevertheless, the general trend is expected to be maintained, while the actual values might vary depending on the sophistication of experimental measurements and numerical analysis. The effect of pigment absorbing at longer wavelength that the reaction centre, hence laying at lower energy, which are a peculiar characteristic of PS I will be discussed in the successive paragraph.
Stefano Santabarbara and Luca Galuppini 28
40 80 120 160 200 2400
4
8
12
16
20
24
28
32
36
40
τav AntBk*
τav Antcore*
τ5
τ av, τ
5 (ps)
nbulk
Figure 9. Dependence of the averaged decay lifetime (τav) of the external antenna ([AntBk*], Squares)
and the core antenna ([Antcore*], Cicles), and the longest lifetime component in the kinetic of the PS I-ISO-antenna models (τ5, Triangles), on the number of sites (nbulk) in the external antenna compartment. Solid lines are linear fits which serve as a guide for the eye.
3.3. Exciton Traps in the Peripheral Antenna System
Exciton Traps (Long Wavelength Chl a Absorption Form) in the External Antenna
As mentioned in the introduction the antenna of PS I contains Chl a spectral forms which absorb at wavelengths longer than the reaction centre (>700 nm), and which are generally known as “red Chlorophylls” or “red forms”. The fluorescence emission of these long wavelength chlorophyll forms is even more obviously red-shifted, due to very large values of the Stokes’ shift (Jennings et al. 2003a, Zucchelli et al. 2005, Croce et al. 2007). In LHC I, the principal emission forms are observed at 713 nm and 730 nm, and are shown to be associated with the lhca 1 and the lhca 4 complexes. Thus in order to describe the kinetics of energy and electron transfer in a quasi-realistic model, it is required to take into account a minimum of two low wavelength chlorophyll pools, which will be refereed to as F713 and F730. We notice that the precise wavelength of emission varies amongst difference species. However this would not affect the qualitative outcome of the calculations. The energy transfer between these two red chlorophyll forms is weak, as proven by their independent emission even at very low temperatures (4-10 K) in isolate complexes (Ihalainen et al. 2000). Thus, as shown in figure 10 it is sufficient to include the coupling of F713 and F730 with the bulk of the external antenna, which is, for consistency with the previous kinetic models discussed in the this study, considered as a separate compartment. We notice that this is a point of distinction with respect to other kinetic analysis present in the literature where the bulk and the core antenna are considered as a single unit. As, spectrally, the inner and the bulk of the outer antenna are very similar and energy transfer between the two “physical” compartments is fast, in principle our approach and that of previous investigation are equivalent. All the other
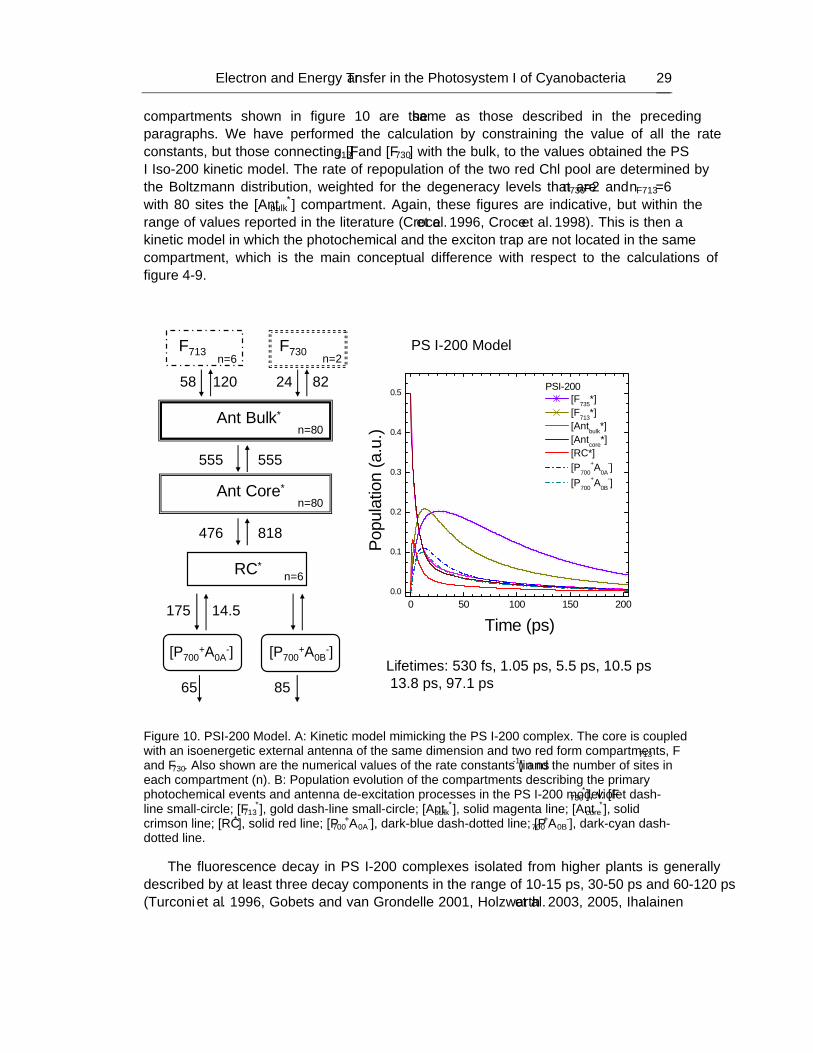
Electron and Energy Transfer in the Photosystem I of Cyanobacteria 29
compartments shown in figure 10 are the same as those described in the preceding paragraphs. We have performed the calculation by constraining the value of all the rate constants, but those connecting [F713] and [F730] with the bulk, to the values obtained the “PS I Iso-200” kinetic model. The rate of repopulation of the two red Chl pool are determined by the Boltzmann distribution, weighted for the degeneracy levels that are n730=2 and nF713=6 with 80 sites the [Antbulk
*] compartment. Again, these figures are indicative, but within the range of values reported in the literature (Croce et al. 1996, Croce et al. 1998). This is then a kinetic model in which the “photochemical” and the “exciton” trap are not located in the same compartment, which is the main conceptual difference with respect to the calculations of figure 4-9.
Lifetimes: 530 fs, 1.05 ps, 5.5 ps, 10.5 ps13.8 ps, 97.1 ps
Ant Core*
RC*
476 818
175 14.5
n=80
n=6
Ant Bulk*
555 555
n=80
F713
58 24
F730
120 82n=2n=6
“PS I-200” Model
[P700+A0A
-]
65 85
[P700+A0B
-]
0 50 100 150 2000.0
0.1
0.2
0.3
0.4
0.5 PSI-200 [F735*] [F713*] [Antbulk*] [Antcore*] [RC*] [P700
+A0A-]
[P700+A0B
-]
Popu
latio
n (a
.u.)
Time (ps)
Figure 10. PSI-200 Model. A: Kinetic model mimicking the PS I-200 complex. The core is coupled with an isoenergetic external antenna of the same dimension and two “red form” compartments, F713 and F730. Also shown are the numerical values of the rate constants (in ns-1) and the number of sites in each compartment (n). B: Population evolution of the compartments describing the primary photochemical events and antenna de-excitation processes in the PS I-200 model: [F730
*], violet dash-line small-circle; [F713
*], gold dash-line small-circle; [Antbulk*], solid magenta line; [Antcore
*], solid crimson line; [RC*], solid red line; [P700
+A0A-], dark-blue dash-dotted line; [P700
+A0B-], dark-cyan dash-
dotted line.
The fluorescence decay in PS I-200 complexes isolated from higher plants is generally described by at least three decay components in the range of 10-15 ps, 30-50 ps and 60-120 ps (Turconi et al. 1996, Gobets and van Grondelle 2001, Holzwarth et al. 2003, 2005, Ihalainen
Stefano Santabarbara and Luca Galuppini 30
et al. 2005a, 2005b, Melkozernov et al. 2000a, 2004). Faster components in the range of 1-5 ps have been also reported, especially when using high-temporal resolution streak-camera detection (Ihalainen et al. 2005a, 2005b, 2007), even though they have also been observed with the traditional single photon timing technique (Slavov et al. 2008). This fast component is also observed in the core and his nature has been already discussed. Therefore, we concentrate on the most long lived, ~35 ps and ~80 ps, lifetimes. The Decay Associated Spectra (DAS) of the two long lived lifetimes are all positive throughout the emission spectra. This is in principle unexpected as only the DAS associated with the longer lifetime should display all positive amplitude. Moreover, the DAS of the ~30 ps and ~80 ps component are markedly red-shifted compared to that of fast decay component, peaking in the 720-740 nm range (Croce et al. 2000, Ihalainen et al. 2005a, 2005b, Engelmann et al. 2006). It has been shown that the long emission tail of these two DAS can be satisfactorily described by the emission band-shape of the F713 and F735 forms, obtained by their direct excitation in isolated LHC I complexes (Zucchelli et al. 2005, Jennings et al. 2003), at room temperature (Engelmann et al. 2006). The presence of red-shifted DAS associated with long living lifetime components determines a continuous spectral evolution throughout the excited state decay (Croce et al. 2000), which is monitored by a progressive red-shift of the time-resolved emission spectra. This is in contrast with the postulate of a purely trap limited model, which assumes ultra-fast excited state equilibration, for which the spectra evolution should be completed before trapping occurs. However, this observation does not exclude kinetic bottlenecks imposed by photochemistry, but highlights the importance of exciton dynamics in the antenna.
In our simulations, which are also shown in figure 10, we aimed at reproducing the presence of two lifetimes in the order of ~30 ps and ~80 ps, which should be clearly observed, i.e. the value of the eigenvectors should be fractionally large, on the population dynamics of the F713 and F730 compartments. We obtain lifetimes (also reported in figure 10) of 25 ps and 96 ps, which are kinetically satisfactorily. We also compute three lifetimes in the 5-15 ps timescale (figure 10). A lifetime of ~10 ps is observed by fluorescence measurements by all laboratories who have investigated the excited state dynamics of intact PS I (cite i.e. Turconi et al. 1996, Holzwarth et al. 2003, 2005, Ihalainen et al. 2005a, 2005b, Melkozernov et al. 2000a, 2004). A shot lifetime component of ~3-5 ps was also detected in several investigations (Holzwarth et al. 2003, Ihalainen et al. 2005a, 2005b, Slavov et al. 2008,). Thus, qualitatively, the excited state dynamics of the PS I-LHC I super-complex are simulated satisfactorily.
The average decay lifetimes of the [F713] and [F730] are in the ~60 ps and ~ 96 ps respectively, so that most of the excited state population resides in these antenna compartments despite their low stoichiometric abundance (less than 10% of the total Chla+b). The average lifetimes of the bulk external and the core antenna are 17.0 ps and 15.9 ps, respectively. Hence, they are not largely modified in respect to the value obtained in the simulation of an iso-energetic system deprived of red-forms, i.e. 15.9 ps and 14.5 ps. However, τav of the core antenna coupled to an external antenna is almost two-times larger than for the core antenna alone (τav =8.7 ps). The kinetics of [RC*] de-excitation calculated by coupling of two red emission pool to the external antenna gives a value of d
avτ =15.5 ps, in PS I-200 model compared to ~ 25 ps in PS I Iso-200. The effect on the population decay is larger when the first moment is considered, as it is 67.7 ps in the PS I-200 model, while it was 22.5
Electron and Energy Transfer in the Photosystem I of Cyanobacteria 31
ps in the PSI-Iso200 and 13.6 ps in the core. The maximal population of [RC*] is 0.10 in the PSI-200 model, which includes the red form, and it was 0.14 in the Iso-200 kinetic model. A larger decrease in the population of [RC*] is computed by integration; the normalised integrated population has a value of 0.05 in the PSI-200 model, while it was 0.16 in the PSI-Iso 200 an 0.3 in the core, in the absence of external antenna. The depopulation of the primary radical couples [P700
+A0A-] and [P700
+A0B-] is also lengthened to values of 29 ps and 23 ps
respectively, compared to 22 ps and 18 ps calculated in the PS I Iso-200 model (i.e. almost a factor of 1.3 difference), using the same constants for electron transfer reactions. Comparing the first moments of the population evolutions, the mean value is found at ~65 ps, which is almost 3 times larger than in the core and the PS I-Iso 200 models. This is because the ~100 ps lifetime, which is brought about by the coupling of [F713] and [F730] is the most significant component in the depopulation of these radical pairs. Thus, it is straightforward to deduce that the red forms have a role in determine the kinetic of formation of a meta-stable charge separated state: coupling a small pigment population to the antenna (10%) has kinetically almost the same effect as that of doubling the antenna size. The precise increase in decay lifetime (that in our simulation is slightly on the long tail of the values reported in the literature) and the population levels would depend on the particular choice of rate constants. Therefore, care should be taken not to over-emphasise the quantitative outcome of the simulations. Nevertheless, predicted trend should hold true, provided that the rate constants are physically sound. For instance, notice that the description of figure 10 is not fully consistent with the experimental results. The values in the eigenvectors associated with the 28 ps component are not all positive, so that the DAS associated with it would also have negative amplitude. Significantly, the negative eigenvectors is associated with F713, so that the DAS of this simulated component should display negative sign at these wavelengths, while the value is large and positive in the measurements (Croce et al. 2000, Ihalainen et al. 2005a, 2005b, Engelmann et al 2006, Slavov et al 2008). It is worth noticing that using a similar kinetic model, but considering a unique compartment for the core and the bulk of the external antenna, Slavov et al. (2008) also found a negative value of the amplitude of the ~30 ps component for the compartment that, in their model, is equivalent to our F713 but a fully emissive DAS in the measurements.
In order to address exactly this problem of two fully emissive DAS Jennings and co-workers (Engelmann et al. 2006) advanced the suggestion that two spectrally similar but kinetically heterogeneous populations of F730 are bound to the external antenna. The apparent rate of transfer from one of the two F730 populations is about four fold slower than for the other (Engelmann et al. 2006). This might indicate a slightly different “environment” (i.e. pseudo-lattice structure and/or number of neighbour pigments), as the overlap between this Chl(s) and that “average” bulk chlorophyll should be virtually the same. We have explored the suggestion of Engelmann et al. (2006), introducing a third compartment ([F730B]), which describes the heterogeneity of red-most Chl form (figure 11). The results of the calculations performed both for a “non-selective excitation” (linear scaling of initial populations) or “selective excitations” in the [F730] and [F730B] forms are shown in figure 12. The two long living components in the picosecond time range are simulated easily by this extended antenna model, using the constants reported in figure 11. The precise values of the longer living decay components are 28.0 and 87.5 ps. However, even including the presence of a second F730 compartment (i.e. [F730b]), our calculations fail to reproduce two fully emissive DAS, as a negative value of 28 ps component is computed for the slow transferring [F730B]
Stefano Santabarbara and Luca Galuppini 32
compartments. We notice that the values for the equilibrium constants of [F730] and [F713] energy transfer to the bulk antenna ([Antbulk*]) are virtually the same as those previously (Engelmann et al. 2006) after the appropriate correction for the sites degeneracy. These authors (Engelmann et al. 2006) found that, for energy transfer reaction from each of the red-forms to the bulk, the equilibrium constant is >1 (i.e. ~1.1). This is mirrored in our calculations where the value of the equilibrium constant are in the 1.7-2.1 range, due considering the coupling to a bulk of antenna which has about half the sites of the sum of the core and the external antenna pigments. The equilibrium parameters relating the F713 compartment (or its equivalent in the model) used in the present simulations are also in agreement with those of Slavov et al. (2008). On the other hand, the equilibrium constant for energy transfer from the red-most forms differ by a factor of ~2. Beside the precise numerical values, this has the effect that the transfer from the red-most antenna pigments to the bulk is faster than the transfer to the red-form, while they are slower in the calculation of Engelmann et al. (2006) (as Keq~1, they have almost the same value) and those presented here (almost 2 fold). These differences can be easily explained by the assumption of slight differences in energy of the pigment sites (ΔE) and/or pigment stoichiometry. Particularly, the energy gap appears on the exponential of the Boltzmann distribution determining the equilibrium constant, so that small variations in ΔE can cause a few fold increase (or decrease) in Keq. Thus, even starting from substantially identical initial assumptions, some (apparently) significant discrepancies might arise from specific numerical value used in the calculations. Obviously, the direct comparison and possible direct link (i.e. fitting) to the experimental data is, whenever possible, the preferable strategy. For the calculations discussed here, we limit to observe that, after simple weighting for the site degeneracy, even assuming the same energy gap of Slavov and coworkers (Slavov et al. 2008) the value of Keq would be larger than 1.
The actual energy transfer rate constants, in the random walk framework (see Equation 1), also scales with the number of pigments in the transfer compartments. Thus, when splitting the antenna compartment into two, [AntCore
*] and [AntBulk*], the relative
stoichiometric increase in size for the red-forms is sizable so that the macroscopic rate of energy transfer to the Bulk from [F730], [F730B] and [F713], increases by a factor of ~2, while the transfer from the red forms to the a separate Bulk compartment or the a single “core-bulk” antenna remains virtually the same (which agrees with the purely thermodynamic scaling). The invariance of the rate transfer of the reaction F[λ]→F[bulk] holds true for any conditions in which
[ ] [ ]bulkF Fn nλ
>> , where nF is the number of sites in the compartments. This allows
comparing the values for the rate constants used in different studies on PS I as the large number of antenna pigments with respect to long wavelength emission forms is always matched. For [F730] and [F730B] we used the value of 60 ns-1 and 28 ns-1. Jennings and co-workers (Engelmann et al. 2006), indicated rates of 45 ns-1 and 14 ns-1, while the one given by Holzwarth and coworkers (Muller et al. 2003, Slavov et al. 2008) for the red-most form in their model was 36 ns-1. In the model in which we included a single [F730] compartment we used a value of 24 ns-1. Clearly, the rates used in this study are similar, but not identical, to those used by others. In particular the value for the “slow transferring” rate from F730 is essentially twice as large as the one given by Engelmann et al. (2006). Nevertheless, even using exactly the same values as those reported by this authors we failed to obtain two eigenvectors with all positive entries associated with the two longer lifetimes. Surely, this does not disprove the suggestion of Jennings and coworkers (Engelmann et al. 2006), but
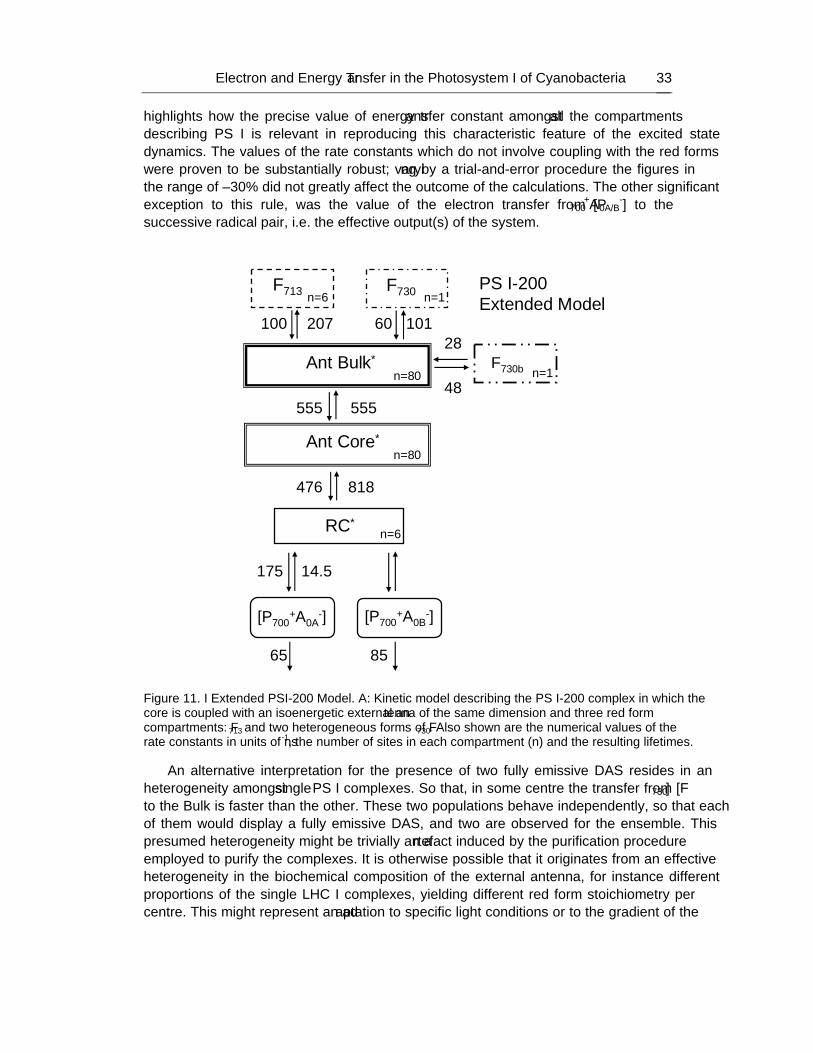
Electron and Energy Transfer in the Photosystem I of Cyanobacteria 33
highlights how the precise value of energy transfer constant amongst all the compartments describing PS I is relevant in reproducing this characteristic feature of the excited state dynamics. The values of the rate constants which do not involve coupling with the red forms were proven to be substantially robust; varying by a trial-and-error procedure the figures in the range of ±30% did not greatly affect the outcome of the calculations. The other significant exception to this rule, was the value of the electron transfer from [P700
+A0A/B-] to the
successive radical pair, i.e. the effective “output(s)” of the system.
Ant Core*
RC*
[P700+A0A
-]
476 818
175 14.5
65 85
[P700+A0B
-]
n=80
n=6
Ant Bulk*
555 555
n=80
F713
100 60
F730
207 101
48
28F730b
n=6 n=1
n=1
“PS I-200”Extended Model
Figure 11. I Extended PSI-200 Model. A: Kinetic model describing the PS I-200 complex in which the core is coupled with an isoenergetic external antenna of the same dimension and three “red form” compartments: F713 and two heterogeneous forms of F730. Also shown are the numerical values of the rate constants in units of ns-1, the number of sites in each compartment (n) and the resulting lifetimes.
An alternative interpretation for the presence of two fully emissive DAS resides in an heterogeneity amongst single PS I complexes. So that, in some centre the transfer from [F730] to the Bulk is faster than the other. These two populations behave independently, so that each of them would display a fully emissive DAS, and two are observed for the ensemble. This presumed heterogeneity might be trivially an “artefact” induced by the purification procedure employed to purify the complexes. It is otherwise possible that it originates from an effective heterogeneity in the biochemical composition of the external antenna, for instance different proportions of the single LHC I complexes, yielding different “red form” stoichiometry per centre. This might represent an adaptation to specific light conditions or to the gradient of the
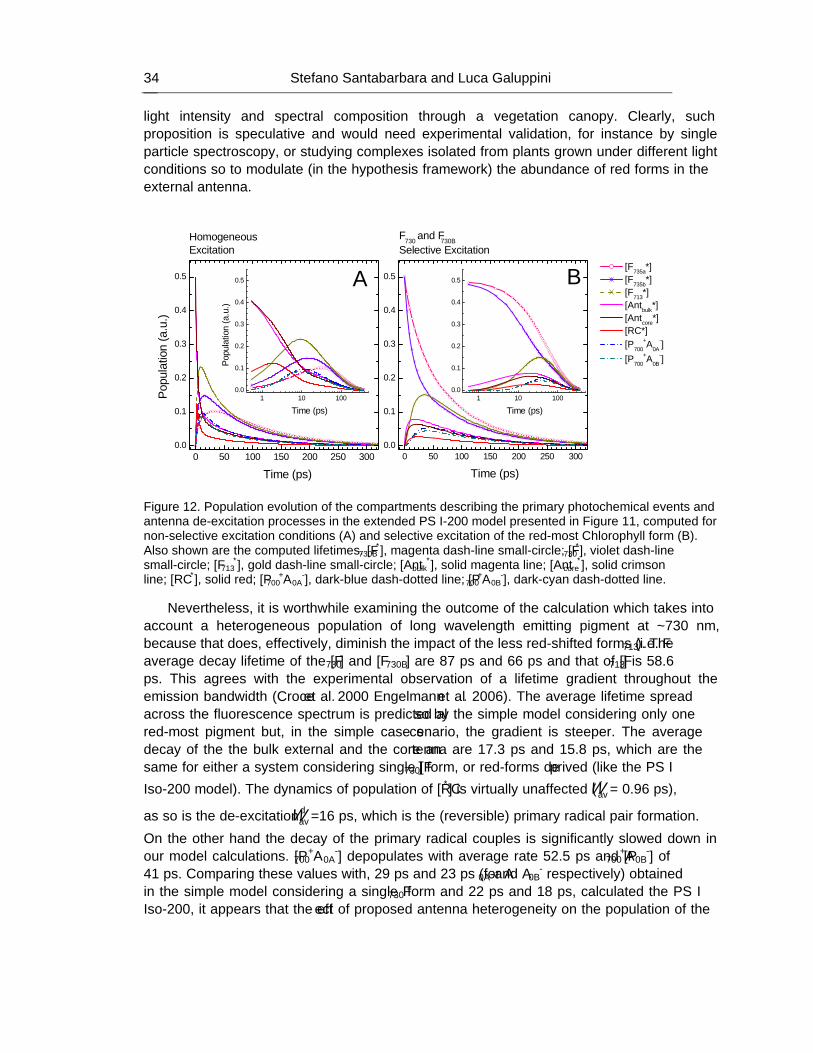
Stefano Santabarbara and Luca Galuppini 34
light intensity and spectral composition through a vegetation canopy. Clearly, such proposition is speculative and would need experimental validation, for instance by single particle spectroscopy, or studying complexes isolated from plants grown under different light conditions so to modulate (in the hypothesis framework) the abundance of “red forms” in the external antenna.
0 50 100 150 200 250 3000.0
0.1
0.2
0.3
0.4
0.5
F730 and F730BSelective Excitation
HomogeneousExcitation
BA
Pop
ulat
ion
(a.u
.)
Time (ps)
[F735a*] [F735b*] [F713*] [Antbulk*] [Antcore*] [RC*] [P700
+A0A-]
[P700+A0B
-]
0 50 100 150 200 250 3000.0
0.1
0.2
0.3
0.4
0.5
Time (ps)
1 10 1000.0
0.1
0.2
0.3
0.4
0.5
Pop
ulat
ion
(a.u
.)
Time (ps)1 10 100
0.0
0.1
0.2
0.3
0.4
0.5
Time (ps)
Figure 12. Population evolution of the compartments describing the primary photochemical events and antenna de-excitation processes in the extended PS I-200 model presented in Figure 11, computed for non-selective excitation conditions (A) and selective excitation of the red-most Chlorophyll form (B). Also shown are the computed lifetimes. [F730B
*], magenta dash-line small-circle; [F730*], violet dash-line
small-circle; [F713*], gold dash-line small-circle; [Antbulk
*], solid magenta line; [Antcore*], solid crimson
line; [RC*], solid red; [P700+A0A
-], dark-blue dash-dotted line; [P700+A0B
-], dark-cyan dash-dotted line.
Nevertheless, it is worthwhile examining the outcome of the calculation which takes into account a heterogeneous population of long wavelength emitting pigment at ~730 nm, because that does, effectively, diminish the impact of the less red-shifted forms (i.e. F713). The average decay lifetime of the [F730] and [F730B] are 87 ps and 66 ps and that of [F713] is 58.6 ps. This agrees with the experimental observation of a lifetime gradient throughout the emission bandwidth (Croce et al. 2000 Engelmann et al. 2006). The average lifetime spread across the fluorescence spectrum is predicted also by the simple model considering only one “red-most” pigment but, in the simple case scenario, the gradient is steeper. The average decay of the the bulk external and the core antenna are 17.3 ps and 15.8 ps, which are the same for either a system considering single [F730] form, or red-forms deprived (like the “PS I Iso-200” model). The dynamics of population of [RC*] is virtually unaffected ( r
avτ = 0.96 ps),
as so is the de-excitation, davτ =16 ps, which is the (reversible) primary radical pair formation.
On the other hand the decay of the primary radical couples is significantly slowed down in our model calculations. [P700
+A0A-] depopulates with average rate 52.5 ps and [P700
+A0B-] of
41 ps. Comparing these values with, 29 ps and 23 ps (for A0A-and A0B- respectively) obtained
in the simple model considering a single F730 form and 22 ps and 18 ps, calculated the PS I Iso-200, it appears that the effect of proposed antenna heterogeneity on the population of the
Electron and Energy Transfer in the Photosystem I of Cyanobacteria 35
(virtually) irreversible radical pair [P700+A1
-] are large. To further explore this aspect we have also repeated the calculation using initial conditions equivalent to initial populations in the two red-most pigments only (figure 12 B). Thermodynamically, these represent a “worst case scenario” as the excited stare equilibration, and the energy transfer from the trap, is largely uphill. In our calculation these conditions produce an “inversion” of the lifetime gradient, so that the d
avτ are 66.4, 45.7, 72.2, 87.5, 78.7 and 62.6 for [F730b], [F730], [F713], [AntBulk*],
[Acore] and [RC*] respectively. The most sticking effect is observed on the dynamics of [RC*] population which are lengthened by a ten-fold factor, i.e. ~10 ps compared to 1 ps for non-selective excitation. This “delay” can be interpreted as the time that it takes from the excitation to reach the RC from initially it is F730. The decay is also lengthened by a factor 5, so is the maximal [RC*] maximal population. The rate of population of the primary radical pair is in consequence lengthened to ~15 ps for both [P700
-A0A/B-] radical pairs. Due to the
retardation in reaching the maximal population brought about by excitation in the red Chl forms, the time of transfer from this radical pair to [P700
+A1AB-] it is preferable to compare the
fist moments of the population evolution (i.e. this is equivalent to τm value), which are ~110 ps. For “homogeneous” excitation the values are ~95 ps, which is about 10-15% more rapid than upon selective excitation. This simple approach shows how the red forms not only play in role in determining the observed lifetimes, lengthening the formation of a “stable” (that is in the tens of nanoseconds time scale) charge separated state, but also induce an heterogeneity of the average time of electron transfer depending on the energy of the absorbed photons (each photosystem absorbs a photon of a certain energy at the time, thus only the “average” value is observed from the population). This is interesting under the photochemical point of view, but it is unlikely to play any significant physiological constrain, as the rate of the reaction which are affected the red forms are still “fast” with respect to those of successive electron transfer steps (see figure 4B) that occur in tens of nanosecond or longer, and with respect to any diffusion process in the photosynthetic membranes which are typically in the order of hundreds of microseconds.
Unless the quantum efficiency is not excessively affected (it will be discussed successively in conjunction with the cyanobacterial reaction centre), the “purely kinetic” limitation of the energy and electron transfer induced by the presence of the red-form would be more than balanced at steady state condition, by the ability to absorb photons at the low energy limit of the visible spectrum and the near infrared, especially under condition when the majority of the Photosynthetic Active Radiation is limited in other spectral region. This is the case, of shading by a layer of vegetation, a condition that commonly occurs in Nature. For instance in a tree, most leaves would experience light filtered, to some extent, by the more external vegetation shields. Thus, through the canopy, there would be a large spectral gradient with progressive qualitative increase in “far-red” light. This is precisely the reasoning of Rivadossi et al. (1999) which shows how, under such conditions, the red-forms represent a significantly large fraction of the effective optical cross-section of the photosystem.
It was recently suggested that the red-forms might play a role in the photo-protection of PS I, i.e. somehow preventing the system to form photochemical processes in the antenna which might lead to the production of reactive oxygen species (cite Slavov et al. 2008). We think that this suggestion is, to say the least, unlikely. Firstly, the red form increases the excited state lifetime, and as result, the fluorescence quantum yield of all the Chl in the antenna. As photochemical reactions are proportional to the excited state level, then the
Stefano Santabarbara and Luca Galuppini 36
increase in fluorescence yield would bring about an increase in “potential harmful” side reactions. The same holds true for the population of the triplet state, as the intersystem crossing rate from the singlet state is an intrinsic property of the chromophore. Thus, decreasing the photochemical quenching and increasing the singlet excited state level would increase the yield of triplet formation as well. Actually, the red forms are well coupled to carotenes (Santabarbara and Carbonera 2005, Carbonera et al. 2005), which efficiently quench the excited triplet state to prevent photo-inhibitory reactions. This process was initially observed in intact thylakoids at temperatures approaching 1.5 K (Santabarbara and Carbonera 2005), while it is undetectable at room temperature (Jaforfi et al. 2000). This is because at low temperature, the steady state population of F730 increases dramatically because of the Boltzmann factors and most of the excited state resides in this pigments, and it is decoupled from photochemistry (i.e. not quenched). However, the observation of efficient F730 triplet quenching in substantially intact system as the thylakoids (Santabarbara and Carbonera 2005), imply that the antenna has in place strategy to avoid possible reaction leading to photo-inhibition, and are specifically associated to the presence of the red-forms in the antenna.
3.4. Exciton Traps in the Core Antenna Differently from the case of higher plants, in cyanobacteria, which lack membranous
antenna systems, the long-wavelength chlorophyll forms are associated with the core complex. Analysis by high-resolution optical spectroscopy show the presence of at least two red forms in PS I core, one absorbing at 708 nm is almost ubiquitous and found in preparation from several strain, as well as monomeric and trimeric form of the complex (Kruip et al. 1994, Karapetyan et al. 1999). The maximum of emission of the 708-nm absorption Chlorophyll is approximately 5-6 nm red-shifted, i.e. at ~710-715 nm (Goberts et al. 1994). The second red absorption-emission Chlorophyll pool shows great variability depending on the species investigated, for instance the emission maximum is at 725 nm, in PS I from Synechocystis sp. PCC 6803, at 730 nm in trimers of Synchococcus elongatus, and even further shifted toward lower energy (~750 nm) is PS I trimers of Spirulina platensis (reviewed by Gobets and van Grondelle 2001). The number of pigments associated with the red emitting pool seems also to be variable, in between 2-4 for the ~710 nm emissions and 4-8 for the red-most form (Gobets et al., 1994, Palsson et al. 1998, Ratsep et al. 2000, Zazubovic et al. 2002). To investigate the effect of the coupling of a red-emission pool to core complex it would be, in principle, sufficient to consider the red-most emitting form, especially because the 708-nm pool is almost iso-energetic with RC. However, Gobets and coworkers (Gobets et al. 2001, 2003, 2003b) performed an extensive and detailed experimental characterisation of the fluorescence kinetics in the PS I particle purified from cyanobacterial strains and needed to include at least two red chlorophyll pools in the analysis of the results, employing kinetic models of an increasing degree of complexity, including compartmental (Gobets et al. 2001, Gobets and van Grondelle 2001, Gobets et al. 2003a, 2003 b) and structural based (Gobets and van Grondelle 2001, Gobets et al. 2003b) calculations. It is also worth noticing that Ihalainen et al. (Ihalainen et al. 2005a, 2005b) suggested that the 708-nm absorption form might be present in the core of higher plants, as well as in cyanobacteria. Thus, in order to allow a direct comparison of the calculation
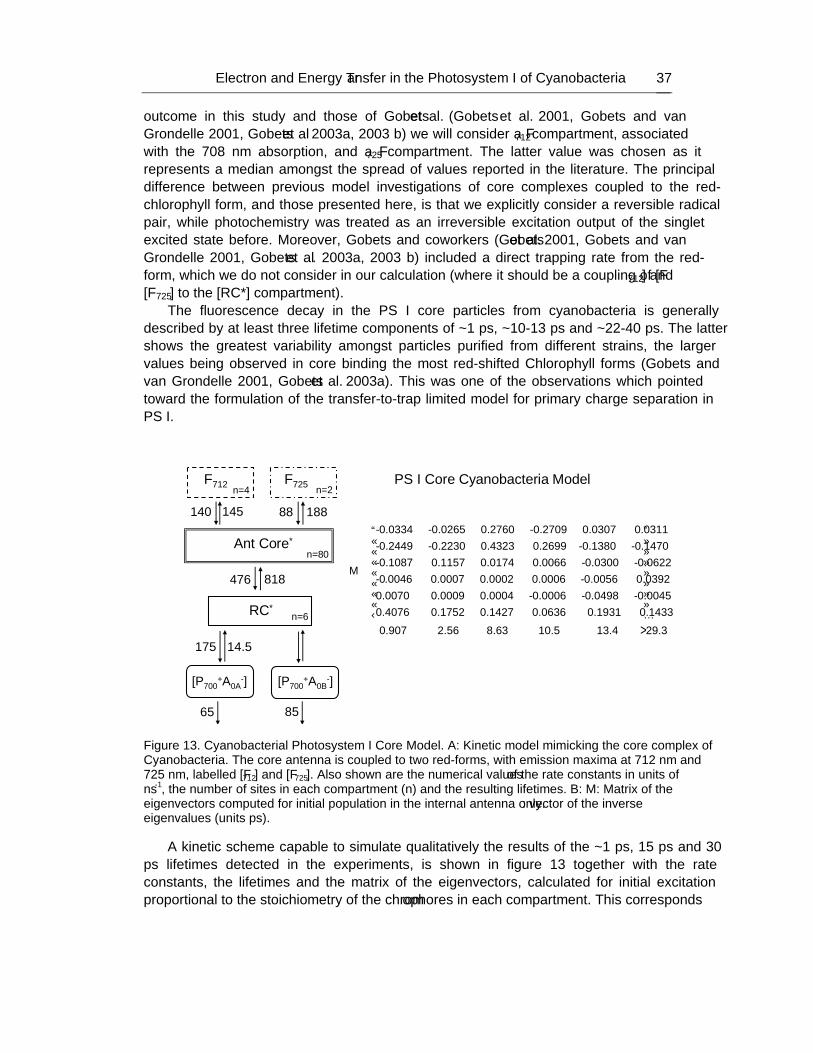
Electron and Energy Transfer in the Photosystem I of Cyanobacteria 37
outcome in this study and those of Gobets et al. (Gobets et al. 2001, Gobets and van Grondelle 2001, Gobets et al 2003a, 2003 b) we will consider a F712 compartment, associated with the 708 nm absorption, and a F725 compartment. The latter value was chosen as it represents a “median” amongst the spread of values reported in the literature. The principal difference between previous model investigations of core complexes coupled to the red-chlorophyll form, and those presented here, is that we explicitly consider a reversible radical pair, while photochemistry was treated as an irreversible excitation “output” of the singlet excited state before. Moreover, Gobets and coworkers (Gobets et al. 2001, Gobets and van Grondelle 2001, Gobets et al. 2003a, 2003 b) included a direct trapping rate from the red-form, which we do not consider in our calculation (where it should be a coupling of [F712] and [F725] to the [RC*] compartment).
The fluorescence decay in the PS I core particles from cyanobacteria is generally described by at least three lifetime components of ~1 ps, ~10-13 ps and ~22-40 ps. The latter shows the greatest variability amongst particles purified from different strains, the larger values being observed in core binding the most red-shifted Chlorophyll forms (Gobets and van Grondelle 2001, Gobets et al. 2003a). This was one of the observations which pointed toward the formulation of the transfer-to-trap limited model for primary charge separation in PS I.
Ant Core*
RC*
476 818
175 14.5
n=80
n=6
F712
140 88
F725
145 188
n=4 n=2“PS I Core Cyanobacteria” Model
-0.0334 -0.0265 0.2760 -0.2709 0.0307 0.0311-0.2449 -0.2230 0.4323 0.2699 -0.1380 -0.1470-0.1087 0.1157 0.0174 0.0066 -0.0300 -0.0622-0
=M.0046 0.0007 0.0002 0.0006 -0.0056 0.0392
0.0070 0.0009 0.0004 -0.0006 -0.0498 -0.00450.4076 0.1752 0.1427 0.0636 0.1931 0.1433
⎡⎢
⎣[ ] 0.907 2.56 8.63 10.5 13.4 29.3
⎤⎥
⎢ ⎥⎢ ⎥⎢ ⎥⎢ ⎥⎢ ⎥⎢ ⎥
⎦=λ
[P700+A0A
-]
65 85
[P700+A0B
-]
Figure 13. Cyanobacterial Photosystem I Core Model. A: Kinetic model mimicking the core complex of Cyanobacteria. The core antenna is coupled to two red-forms, with emission maxima at 712 nm and 725 nm, labelled [F712] and [F725]. Also shown are the numerical values of the rate constants in units of ns-1, the number of sites in each compartment (n) and the resulting lifetimes. B: M: Matrix of the eigenvectors computed for initial population in the internal antenna only. λ: vector of the inverse eigenvalues (units ps).
A kinetic scheme capable to simulate qualitatively the results of the ~1 ps, 15 ps and 30 ps lifetimes detected in the experiments, is shown in figure 13 together with the rate constants, the lifetimes and the matrix of the eigenvectors, calculated for initial excitation proportional to the stoichiometry of the chromophores in each compartment. This corresponds
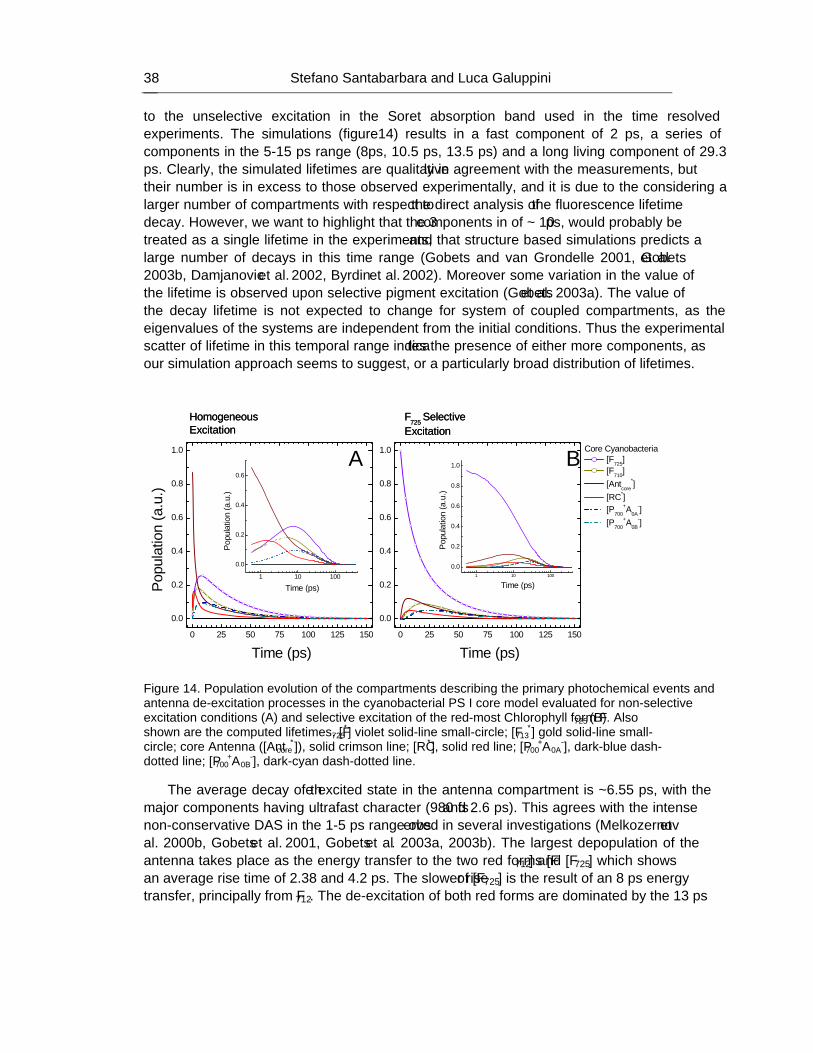
Stefano Santabarbara and Luca Galuppini 38
to the unselective excitation in the Soret absorption band used in the time resolved experiments. The simulations (figure14) results in a fast component of 2 ps, a series of components in the 5-15 ps range (8ps, 10.5 ps, 13.5 ps) and a long living component of 29.3 ps. Clearly, the simulated lifetimes are qualitatively in agreement with the measurements, but their number is in excess to those observed experimentally, and it is due to the considering a larger number of compartments with respect to the direct analysis of the fluorescence lifetime decay. However, we want to highlight that the 3 components in of ~ 10 ps, would probably be treated as a single lifetime in the experiments, and that structure based simulations predicts a large number of decays in this time range (Gobets and van Grondelle 2001, Gobets et al. 2003b, Damjanovic et al. 2002, Byrdin et al. 2002). Moreover some variation in the value of the lifetime is observed upon selective pigment excitation (Gobets et al. 2003a). The value of the decay lifetime is not expected to change for system of coupled compartments, as the eigenvalues of the systems are independent from the initial conditions. Thus the experimental scatter of lifetime in this temporal range indicates the presence of either more components, as our simulation approach seems to suggest, or a particularly broad distribution of lifetimes.
0 25 50 75 100 125 150
0.0
0.2
0.4
0.6
0.8
1.0 BA
F725 SelectiveExcitation
HomogeneousExcitation
Core Cyanobacteria [F725] [F710] [Antcore
*] [RC*] [P700
+A0A-]
[P700+A0B
-]
Time (ps)
Popu
latio
n (a
.u.)
0 25 50 75 100 125 150
0.0
0.2
0.4
0.6
0.8
1.0
Time (ps)
1 10 100
0.0
0.2
0.4
0.6
F725 SelectiveExcitation
HomogeneousExcitation
Time (ps)
Popu
latio
n (a
.u.)
1 10 100
0.0
0.2
0.4
0.6
0.8
1.0
Pop
ulat
ion
(a.u
.)
Time (ps)
Figure 14. Population evolution of the compartments describing the primary photochemical events and antenna de-excitation processes in the cyanobacterial PS I core model evaluated for non-selective excitation conditions (A) and selective excitation of the red-most Chlorophyll form F725 (B). Also shown are the computed lifetimes. [F725
*] violet solid-line small-circle; [F713*] gold solid-line small-
circle; core Antenna ([Antcore*]), solid crimson line; [RC*], solid red line; [P700
+A0A-], dark-blue dash-
dotted line; [P700+A0B
-], dark-cyan dash-dotted line.
The average decay of the excited state in the antenna compartment is ~6.55 ps, with the major components having ultrafast character (980 fs and 2.6 ps). This agrees with the intense non-conservative DAS in the 1-5 ps range observed in several investigations (Melkozernov et al. 2000b, Gobets et al. 2001, Gobets et al. 2003a, 2003b). The largest depopulation of the antenna takes place as the energy transfer to the two red forms [F712] and [F725] which shows an average rise time of 2.38 and 4.2 ps. The slower rise of [F725] is the result of an 8 ps energy transfer, principally from F712. The de-excitation of both red forms are dominated by the 13 ps
Electron and Energy Transfer in the Photosystem I of Cyanobacteria 39
and the 28 ps lifetimes, and yield average decay time of 29 ps and 21 ps for F725 and F712 respectively. The reaction centre is populated in ~1 ps and depopulated in ~8 ps. These figures are similar to those obtained for the kinetic model of a core completely depleted of red-forms, and substantially reproduce the results of Muller et al. (cite). The two “parallel” radical pairs [P700
+A0A-] and [P700
+A0B-] are populated in 6 ps and 4.5 ps respectively in the
calculations, and decay to the population of the respective [P700+A1A/B
-] couples in 25.4 ps and 21.7 ps respectively. We notice that, as in the case of the PS I-200 kinetic model and the models in which the red forms were not considered, the average decay of the antenna components is virtually the same as that of the [P700
+A0-] or, in other words, the formation of
a meta-stable radical pair. The population of [P700+A1
-] is characterised by a rate constant in the 65-85 ns-1 range in our calculations, and similar values were reported by Muller et al. (2003), Holzwarth et al. (2005) and Slavov et al. (2008). This is only slightly faster than the “irreversible trapping” constant used by van Grondelle, Gobets and coworkers in a series of publications (Gobets et al. 2001, Gobets and van Grondelle 2001, Gobets et al. 2003a, 2003 b, see also Melkozernov 2001, Savikhin et al. 2000 ), i.e. (18 ps)-1, which is 55 ns-1 in the same notation used here.
The comparison with the simulation performed using initial conditions which mimics the excitation of the F725 compartment only (figure 14B), shows the same tendency described for the PS I-LHC I super-complex model when the red-most form only is excited. That is, the gradient of average lifetimes through the emission wavelength is somehow “inverted”, i.e. the average decay of F725 is 19 ps (29 ps upon unselective excitation), that of F712 is 23 ps (unselective, 21 ps), that of the core antenna is 28.8 ps (unselective 6 ps). This is due to the relative increase in the amplitude of the 29.9 ps lifetime component in all the antenna compartments, when F725 is directly excited. The more rapid decay of F725 is explained because all the amplitude factor are positive (i.e. there is no transfer component to this compartment), so that the lifetimes in the ~10 ps range contribute significantly to its depopulation, while they mainly appeared as population functions for an homogenous (figure 14B), or bulk-selective (not shown) initial conditions. The [RC*] compartment is populated with an average time of ~4 ps and the two primary radical pairs [P700
+A0A/B-] in ~13 ps. The
decay of the secondary radical pair, as estimated by the first moment of the population evolution is in the order of 60-62 ps, upon selective excitation of F725 while it was 49-56 ps for equally distributed excitation between the compartments (including [RC*]). In the core depleted of red-form we computed values of 23 ps and 26 ps for the depopulation of [P700
+A0B-] and [P700
+A0A-] respectively (figure 4). Thus, even including a reversible radical
pair in the calculation, the excited state migration has a substantial impact on kinetics of trapping. The simple coupling of a small number of pigments (n=2) responsible for the F725 emission per se yield almost a doubling of the average time it takes to the absorbed photon to be converted into a long lived charge separated state. This effect is enhanced when the red forms are excited directly, exactly as observed in the calculation for the PS I-LHCI super-complex. In average, and within the limitations implicit in the formulation of the kinetic model described here, upon selective excitation of the red-most pigment, the reaction centre is populated on the same time-scale of ~15 ps in cyanobacterial-like PS I and ~10 ps in higher-plants-like system, when the red forms are located in the core antenna and the external, respectively. The ~50 % increase should not be excessively over-emphasised because experimental data on the cyanobacterial systems have not been directly tested with similar kinetic models. However, the ability to reproduce with ease the published lifetime, and
Stefano Santabarbara and Luca Galuppini 40
overall dynamics, indicates that the calculations provide realistic, albeit not numerically precise, estimations. Then, considering that the overall antenna size is found ~2 smaller in cyanobacteria, the apparent increase F725→RC* transfer might represent an important indicator on the factors leading to light harvesting optimisation. For instance, we notice that to reproduce the decay lifetimes (essentially for not selective excitation), we used a rate constant of energy transfer from [F725] to the core of 88 ns-1, which is somewhat faster, but comparable to the value of 55-65 ns-1 found by Gobets et al. (Gobets et al. 2001, Gobets et al. 2003a). The equilibrium constant is also the same, i.e. ~2, thus the simulations are directly comparable. We notice that, even with respect to the value reported by other research groups, the energy transfer from the red-most form to the substantially iso-energetic antenna molecules is about 2-4 faster in cyanobacteria. Assuming that the single-site energy transfer time (τh) is the same for F725→AntCore and F730→Antbulk, and that, at least in our case, the pure probabilistic factor is also the same (and however is not expected to change significantly in response to the number of molecules in the compartment larger in size, i.e. the [Antcore
*] and [Antbulk
*]), this highlights difference in the “local” (pseudo) lattice-structure, or in the number of the nearest-neighbour molecules.
5. CONCLUSIONS Using a compartmental kinetic model which treats a limited and discrete number of
functional components we have explored the factors which affect the rate and yield of reactions of the Photosystem I reaction centre. The dynamics of the singlet excited state and that of charge separation reaction were modelled in a system which mimics either a prokaryotic PS I reaction centre, as that of cyanobacteria, and that of eukaryotic organisms possessing a Chl-a/b transmembrane antenna, such as green algae and higher plants. We showed that it is possible to reconcile the experimental observation reported in the literature assuming the same primary reaction mechanism, and the same kinetic constant for the process. This is in agreement with recent measures which indicate that the primary trapping is reversible (Muller et al. 2003, Holzwarth et al. 2005, Slavov et al. 2008), as previously demonstrated for Photosystem II (e.g. Schatz et al. 1987, Holzwarth et al. 2006, Miloslavina et al. 2006). The free energy for primary charge separation is in the order of -50-80 meV. We used an intermediate value of -64 meV which is, to a first approximation, adequate to describe the excited state dynamics independently from the specific characteristics of the antenna pigments.
We also showed that, the longer decay lifetime observed in fluorescence measurements, and which is often described as a “trapping” component, is related to the population of the secondary radical pair. As this reaction is coupled with a large free energy (>-180 meV), it is virtually irreversible, so that the secondary radical pair lifetime is in the tens of nanosecond range which is at least one order of magnitude larger than the intrinsic fluorescence de-excitation of Chl-pigment complexes (~1.5-2.5 ns). Thus, the use of the term trapping is semantically correct, but rather than referring to primary photochemical reactions, it relates to the a substantially irreversible charge separated state. Thus, primary charge separation does impose kinetic constrains on the excited state dynamics, as reversible reactions leads to repopulation of the RC excited state. For a system deprived of red forms the concentration of
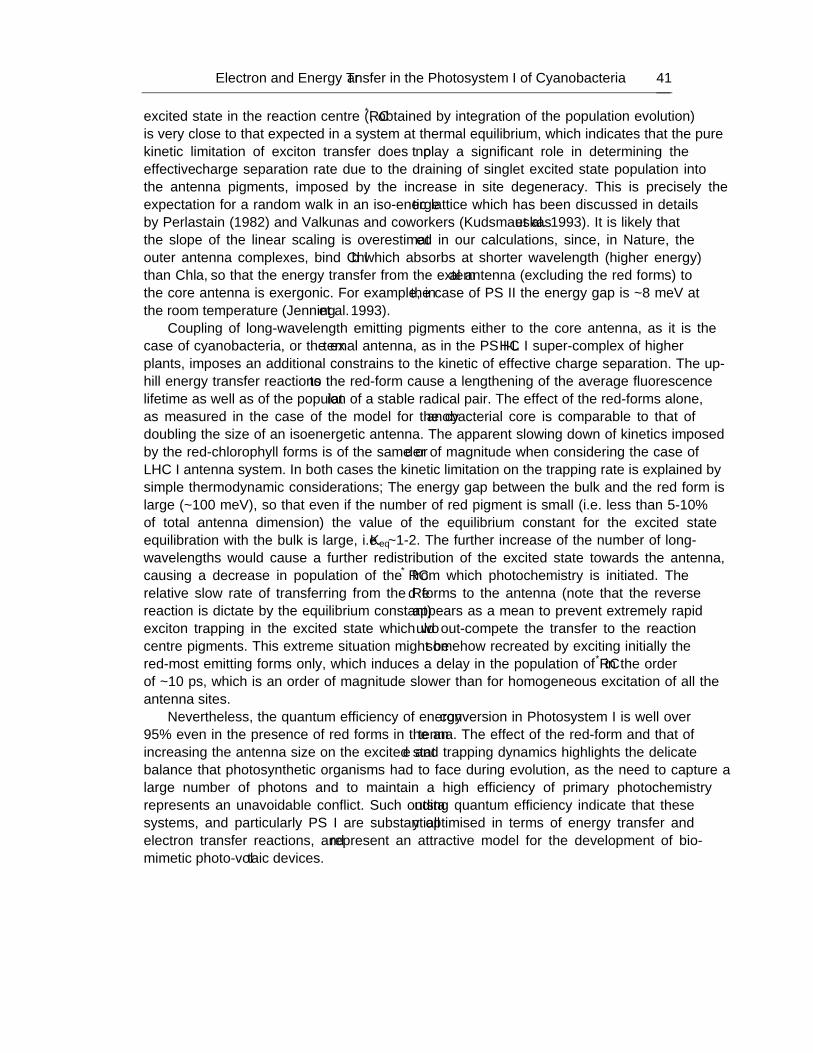
Electron and Energy Transfer in the Photosystem I of Cyanobacteria 41
excited state in the reaction centre (RC*, obtained by integration of the population evolution) is very close to that expected in a system at thermal equilibrium, which indicates that the pure kinetic limitation of exciton transfer does not play a significant role in determining the effective charge separation rate due to the “draining” of singlet excited state population into the antenna pigments, imposed by the increase in site degeneracy. This is precisely the expectation for a random walk in an iso-energetic lattice which has been discussed in details by Perlastain (1982) and Valkunas and coworkers (Kudsmauskas et al. 1993). It is likely that the “slope” of the linear scaling is overestimated in our calculations, since, in Nature, the outer antenna complexes, bind Chl b which absorbs at shorter wavelength (higher energy) than Chl a, so that the energy transfer from the external antenna (excluding the red forms) to the core antenna is exergonic. For example, in the case of PS II the energy gap is ~8 meV at the room temperature (Jenning et al. 1993).
Coupling of long-wavelength emitting pigments either to the core antenna, as it is the case of cyanobacteria, or the external antenna, as in the PS I-LHC I super-complex of higher plants, imposes an additional constrains to the kinetic of effective charge separation. The up-hill energy transfer reactions to the red-form cause a lengthening of the average fluorescence lifetime as well as of the population of a stable radical pair. The effect of the red-forms alone, as measured in the case of the model for the cyanobacterial core is comparable to that of doubling the size of an isoenergetic antenna. The apparent slowing down of kinetics imposed by the red-chlorophyll forms is of the same order of magnitude when considering the case of LHC I antenna system. In both cases the kinetic limitation on the trapping rate is explained by simple thermodynamic considerations; The energy gap between the bulk and the red form is large (~100 meV), so that even if the number of “red” pigment is small (i.e. less than 5-10% of total antenna dimension) the value of the equilibrium constant for the excited state equilibration with the bulk is large, i.e. Keq~1-2. The further increase of the number of long-wavelengths would cause a further redistribution of the excited state towards the antenna, causing a decrease in population of the RC* from which photochemistry is initiated. The relative slow rate of transferring from the Red forms to the antenna (note that the reverse reaction is dictate by the equilibrium constant) appears as a mean to prevent extremely rapid exciton trapping in the excited state which would out-compete the transfer to the reaction centre pigments. This extreme situation might be somehow recreated by exciting initially the red-most emitting forms only, which induces a “delay” in the population of RC* in the order of ~10 ps, which is an order of magnitude slower than for homogeneous excitation of all the antenna sites.
Nevertheless, the quantum efficiency of energy conversion in Photosystem I is well over 95% even in the presence of red forms in the antenna. The effect of the red-form and that of increasing the antenna size on the excited state and trapping dynamics highlights the delicate balance that photosynthetic organisms had to face during evolution, as the need to capture a large number of photons and to maintain a high efficiency of primary photochemistry represents an unavoidable conflict. Such outstanding quantum efficiency indicate that these systems, and particularly PS I are substantially optimised in terms of energy transfer and electron transfer reactions, and represent an attractive model for the development of bio-mimetic photo-voltaic devices.
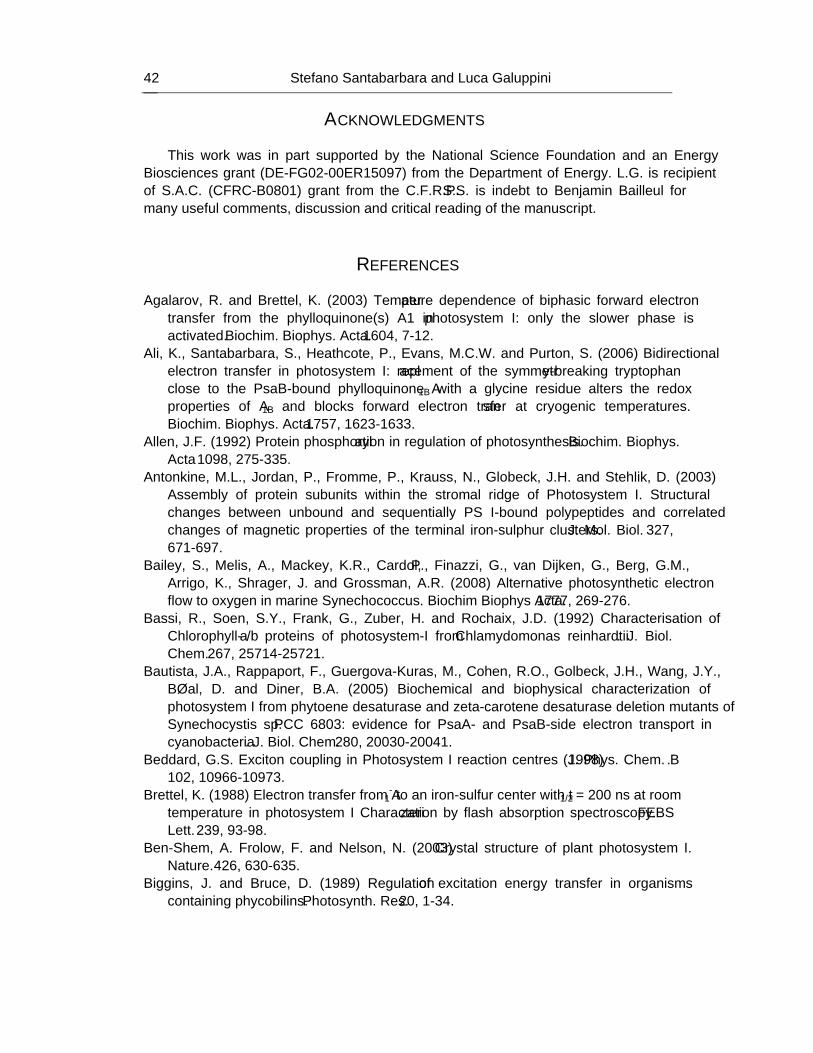
Stefano Santabarbara and Luca Galuppini 42
ACKNOWLEDGMENTS This work was in part supported by the National Science Foundation and an Energy
Biosciences grant (DE-FG02-00ER15097) from the Department of Energy. L.G. is recipient of S.A.C. (CFRC-B0801) grant from the C.F.R.P. S.S. is indebt to Benjamin Bailleul for many useful comments, discussion and critical reading of the manuscript.
REFERENCES
Agalarov, R. and Brettel, K. (2003) Temperature dependence of biphasic forward electron transfer from the phylloquinone(s) A1 in photosystem I: only the slower phase is activated. Biochim. Biophys. Acta. 1604, 7-12.
Ali, K., Santabarbara, S., Heathcote, P., Evans, M.C.W. and Purton, S. (2006) Bidirectional electron transfer in photosystem I: replacement of the symmetry-breaking tryptophan close to the PsaB-bound phylloquinone A1B with a glycine residue alters the redox properties of A1B and blocks forward electron transfer at cryogenic temperatures. Biochim. Biophys. Acta. 1757, 1623-1633.
Allen, J.F. (1992) Protein phosphorylation in regulation of photosynthesis. Biochim. Biophys. Acta 1098, 275-335.
Antonkine, M.L., Jordan, P., Fromme, P., Krauss, N., Globeck, J.H. and Stehlik, D. (2003) Assembly of protein subunits within the stromal ridge of Photosystem I. Structural changes between unbound and sequentially PS I-bound polypeptides and correlated changes of magnetic properties of the terminal iron-sulphur clusters. J. Mol. Biol. 327, 671-697.
Bailey, S., Melis, A., Mackey, K.R., Cardol, P., Finazzi, G., van Dijken, G., Berg, G.M., Arrigo, K., Shrager, J. and Grossman, A.R. (2008) Alternative photosynthetic electron flow to oxygen in marine Synechococcus. Biochim Biophys Acta. 1777, 269-276.
Bassi, R., Soen, S.Y., Frank, G., Zuber, H. and Rochaix, J.D. (1992) Characterisation of Chlorophyll-a/b proteins of photosystem-I from Chlamydomonas reinhardtii. J. Biol. Chem. 267, 25714-25721.
Bautista, J.A., Rappaport, F., Guergova-Kuras, M., Cohen, R.O., Golbeck, J.H., Wang, J.Y., Béal, D. and Diner, B.A. (2005) Biochemical and biophysical characterization of photosystem I from phytoene desaturase and zeta-carotene desaturase deletion mutants of Synechocystis sp. PCC 6803: evidence for PsaA- and PsaB-side electron transport in cyanobacteria. J. Biol. Chem. 280, 20030-20041.
Beddard, G.S. Exciton coupling in Photosystem I reaction centres (1998) J. Phys. Chem. B. 102, 10966-10973.
Brettel, K. (1988) Electron transfer from A1- to an iron-sulfur center with t1/2 = 200 ns at room
temperature in photosystem I Characterization by flash absorption spectroscopy. FEBS Lett. 239, 93-98.
Ben-Shem, A. Frolow, F. and Nelson, N. (2003) Crystal structure of plant photosystem I. Nature. 426, 630-635.
Biggins, J. and Bruce, D. (1989) Regulation of excitation energy transfer in organisms containing phycobilins. Photosynth. Res. 20, 1-34.
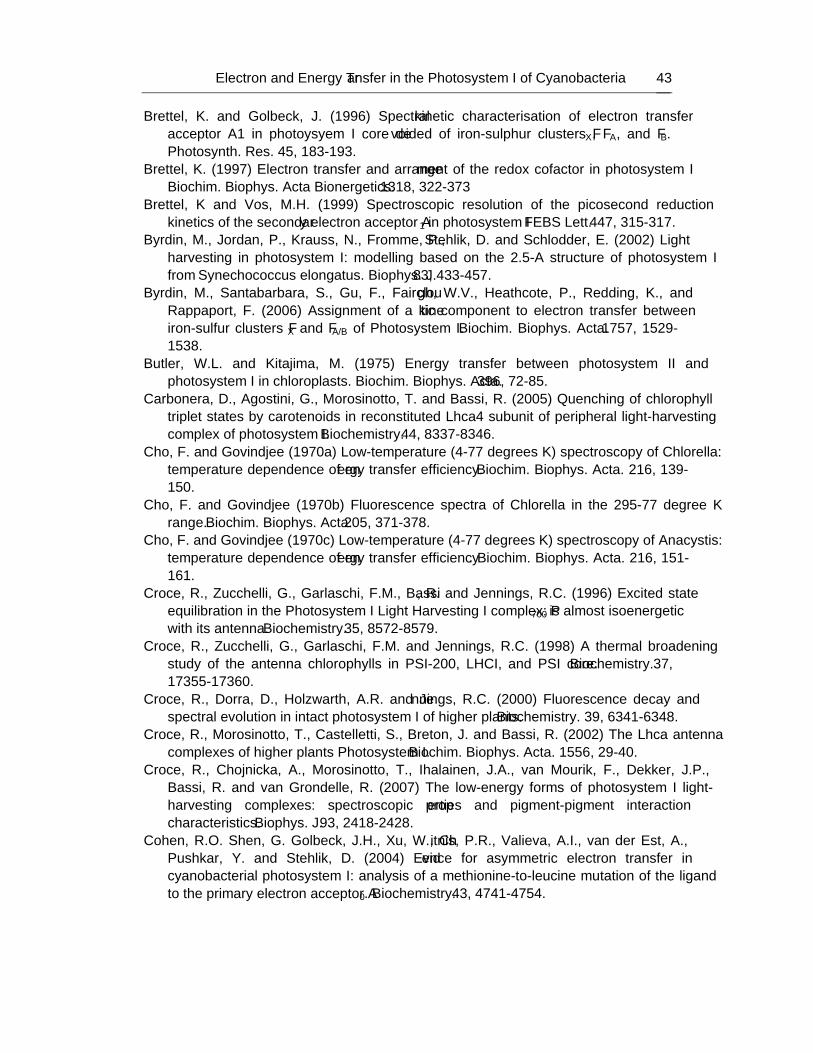
Electron and Energy Transfer in the Photosystem I of Cyanobacteria 43
Brettel, K. and Golbeck, J. (1996) Spectral kinetic characterisation of electron transfer acceptor A1 in photoysyem I core devoided of iron-sulphur clusters FX, FA, and FB. Photosynth. Res. 45, 183-193.
Brettel, K. (1997) Electron transfer and arrangement of the redox cofactor in photosystem I Biochim. Biophys. Acta Bionergetics. 1318, 322-373
Brettel, K and Vos, M.H. (1999) Spectroscopic resolution of the picosecond reduction kinetics of the secondary electron acceptor A1 in photosystem I FEBS Lett. 447, 315-317.
Byrdin, M., Jordan, P., Krauss, N., Fromme, P., Stehlik, D. and Schlodder, E. (2002) Light harvesting in photosystem I: modelling based on the 2.5-A structure of photosystem I from Synechococcus elongatus. Biophys. J. 83, 433-457.
Byrdin, M., Santabarbara, S., Gu, F., Fairclough, W.V., Heathcote, P., Redding, K., and Rappaport, F. (2006) Assignment of a kinetic component to electron transfer between iron-sulfur clusters FX and FA/B of Photosystem I. Biochim. Biophys. Acta. 1757, 1529-1538.
Butler, W.L. and Kitajima, M. (1975) Energy transfer between photosystem II and photosystem I in chloroplasts. Biochim. Biophys. Acta. 396, 72-85.
Carbonera, D., Agostini, G., Morosinotto, T. and Bassi, R. (2005) Quenching of chlorophyll triplet states by carotenoids in reconstituted Lhca4 subunit of peripheral light-harvesting complex of photosystem I. Biochemistry. 44, 8337-8346.
Cho, F. and Govindjee (1970a) Low-temperature (4-77 degrees K) spectroscopy of Chlorella: temperature dependence of energy transfer efficiency. Biochim. Biophys. Acta. 216, 139-150.
Cho, F. and Govindjee (1970b) Fluorescence spectra of Chlorella in the 295-77 degree K range. Biochim. Biophys. Acta. 205, 371-378.
Cho, F. and Govindjee (1970c) Low-temperature (4-77 degrees K) spectroscopy of Anacystis: temperature dependence of energy transfer efficiency. Biochim. Biophys. Acta. 216, 151-161.
Croce, R., Zucchelli, G., Garlaschi, F.M., Bassi, R. and Jennings, R.C. (1996) Excited state equilibration in the Photosystem I Light Harvesting I complex: P700 is almost isoenergetic with its antenna. Biochemistry. 35, 8572-8579.
Croce, R., Zucchelli, G., Garlaschi, F.M. and Jennings, R.C. (1998) A thermal broadening study of the antenna chlorophylls in PSI-200, LHCI, and PSI core. Biochemistry. 37, 17355-17360.
Croce, R., Dorra, D., Holzwarth, A.R. and Jennings, R.C. (2000) Fluorescence decay and spectral evolution in intact photosystem I of higher plants. Biochemistry. 39, 6341-6348.
Croce, R., Morosinotto, T., Castelletti, S., Breton, J. and Bassi, R. (2002) The Lhca antenna complexes of higher plants Photosystem I. Biochim. Biophys. Acta. 1556, 29-40.
Croce, R., Chojnicka, A., Morosinotto, T., Ihalainen, J.A., van Mourik, F., Dekker, J.P., Bassi, R. and van Grondelle, R. (2007) The low-energy forms of photosystem I light-harvesting complexes: spectroscopic properties and pigment-pigment interaction characteristics. Biophys. J. 93, 2418-2428.
Cohen, R.O. Shen, G. Golbeck, J.H., Xu, W., Chitnis, P.R., Valieva, A.I., van der Est, A., Pushkar, Y. and Stehlik, D. (2004) Evidence for asymmetric electron transfer in cyanobacterial photosystem I: analysis of a methionine-to-leucine mutation of the ligand to the primary electron acceptor A0. Biochemistry. 43, 4741-4754.
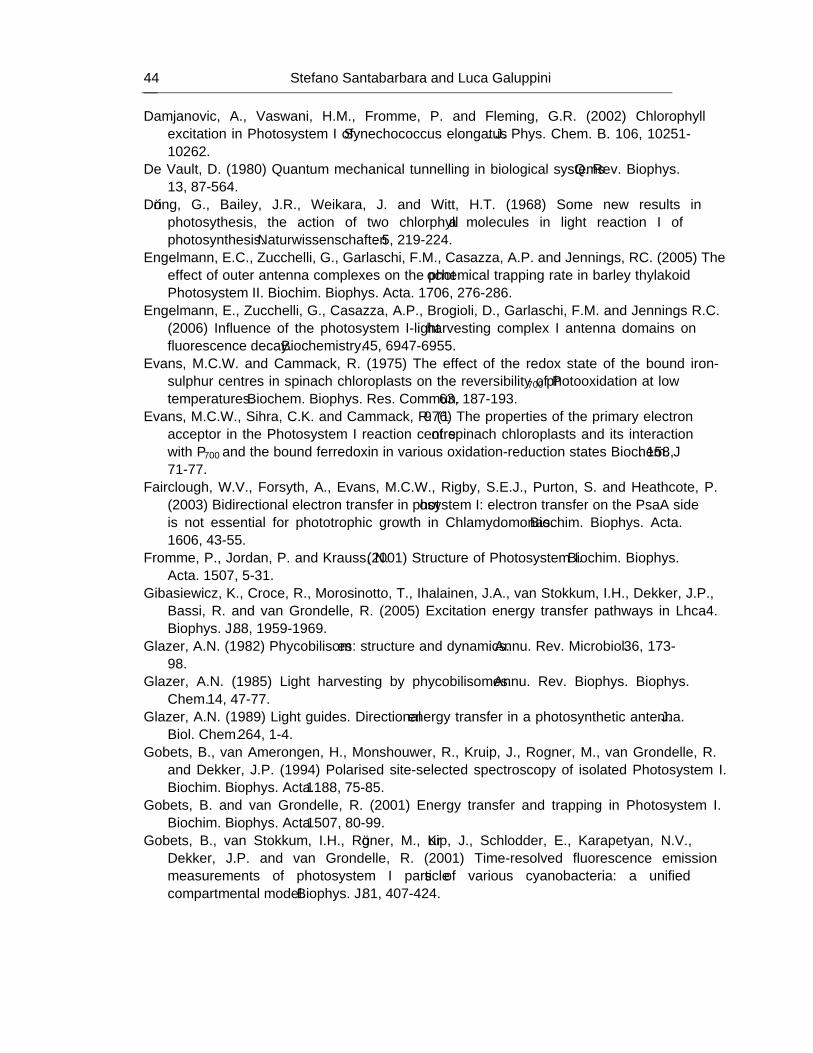
Stefano Santabarbara and Luca Galuppini 44
Damjanovic, A., Vaswani, H.M., Fromme, P. and Fleming, G.R. (2002) Chlorophyll excitation in Photosystem I of Synechococcus elongatus. J. Phys. Chem. B. 106, 10251-10262.
De Vault, D. (1980) Quantum mechanical tunnelling in biological systems Q. Rev. Biophys. 13, 87-564.
Döring, G., Bailey, J.R., Weikara, J. and Witt, H.T. (1968) Some new results in photosythesis, the action of two chlorphyll a molecules in light reaction I of photosynthesis. Naturwissenschaften. 5, 219-224.
Engelmann, E.C., Zucchelli, G., Garlaschi, F.M., Casazza, A.P. and Jennings, RC. (2005) The effect of outer antenna complexes on the photochemical trapping rate in barley thylakoid Photosystem II. Biochim. Biophys. Acta. 1706, 276-286.
Engelmann, E., Zucchelli, G., Casazza, A.P., Brogioli, D., Garlaschi, F.M. and Jennings R.C. (2006) Influence of the photosystem I-light harvesting complex I antenna domains on fluorescence decay. Biochemistry. 45, 6947-6955.
Evans, M.C.W. and Cammack, R. (1975) The effect of the redox state of the bound iron-sulphur centres in spinach chloroplasts on the reversibility of P700 photooxidation at low temperatures. Biochem. Biophys. Res. Commun. 63, 187-193.
Evans, M.C.W., Sihra, C.K. and Cammack, R. (1976) The properties of the primary electron acceptor in the Photosystem I reaction centre of spinach chloroplasts and its interaction with P700 and the bound ferredoxin in various oxidation-reduction states Biochem. J. 158, 71-77.
Fairclough, W.V., Forsyth, A., Evans, M.C.W., Rigby, S.E.J., Purton, S. and Heathcote, P. (2003) Bidirectional electron transfer in photosystem I: electron transfer on the PsaA side is not essential for phototrophic growth in Chlamydomonas. Biochim. Biophys. Acta. 1606, 43-55.
Fromme, P., Jordan, P. and Krauss, N. (2001) Structure of Photosystem I. Biochim. Biophys. Acta. 1507, 5-31.
Gibasiewicz, K., Croce, R., Morosinotto, T., Ihalainen, J.A., van Stokkum, I.H., Dekker, J.P., Bassi, R. and van Grondelle, R. (2005) Excitation energy transfer pathways in Lhca4. Biophys. J. 88, 1959-1969.
Glazer, A.N. (1982) Phycobilisomes: structure and dynamics. Annu. Rev. Microbiol. 36, 173-98.
Glazer, A.N. (1985) Light harvesting by phycobilisomes. Annu. Rev. Biophys. Biophys. Chem. 14, 47-77.
Glazer, A.N. (1989) Light guides. Directional energy transfer in a photosynthetic antenna. J. Biol. Chem. 264, 1-4.
Gobets, B., van Amerongen, H., Monshouwer, R., Kruip, J., Rogner, M., van Grondelle, R. and Dekker, J.P. (1994) Polarised site-selected spectroscopy of isolated Photosystem I. Biochim. Biophys. Acta. 1188, 75-85.
Gobets, B. and van Grondelle, R. (2001) Energy transfer and trapping in Photosystem I. Biochim. Biophys. Acta. 1507, 80-99.
Gobets, B., van Stokkum, I.H., Rögner, M., Kruip, J., Schlodder, E., Karapetyan, N.V., Dekker, J.P. and van Grondelle, R. (2001) Time-resolved fluorescence emission measurements of photosystem I particles of various cyanobacteria: a unified compartmental model. Biophys. J. 81, 407-424.
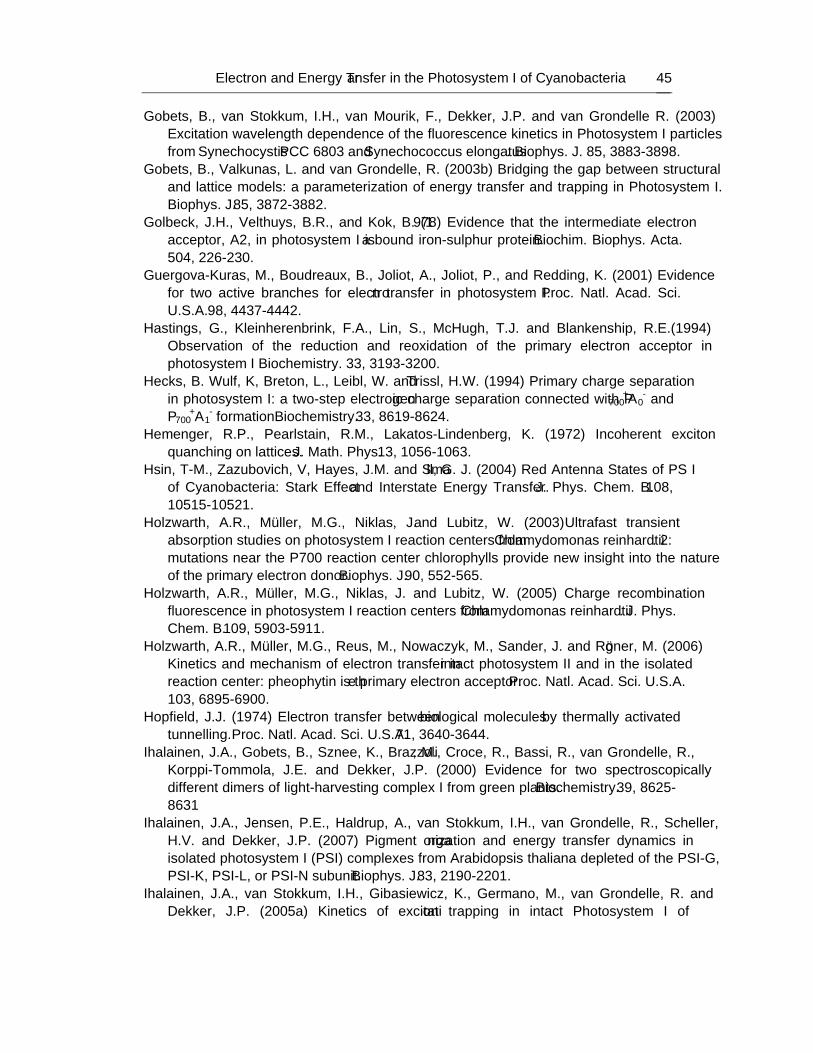
Electron and Energy Transfer in the Photosystem I of Cyanobacteria 45
Gobets, B., van Stokkum, I.H., van Mourik, F., Dekker, J.P. and van Grondelle R. (2003) Excitation wavelength dependence of the fluorescence kinetics in Photosystem I particles from Synechocystis PCC 6803 and Synechococcus elongatus. Biophys. J. 85, 3883-3898.
Gobets, B., Valkunas, L. and van Grondelle, R. (2003b) Bridging the gap between structural and lattice models: a parameterization of energy transfer and trapping in Photosystem I. Biophys. J. 85, 3872-3882.
Golbeck, J.H., Velthuys, B.R., and Kok, B. (1978) Evidence that the intermediate electron acceptor, A2, in photosystem I is a bound iron-sulphur protein. Biochim. Biophys. Acta. 504, 226-230.
Guergova-Kuras, M., Boudreaux, B., Joliot, A., Joliot, P., and Redding, K. (2001) Evidence for two active branches for electron transfer in photosystem I. Proc. Natl. Acad. Sci. U.S.A. 98, 4437-4442.
Hastings, G., Kleinherenbrink, F.A., Lin, S., McHugh, T.J. and Blankenship, R.E.(1994) Observation of the reduction and reoxidation of the primary electron acceptor in photosystem I Biochemistry. 33, 3193-3200.
Hecks, B. Wulf, K, Breton, L., Leibl, W. and Trissl, H.W. (1994) Primary charge separation in photosystem I: a two-step electrogenic charge separation connected with P700
+A0- and
P700+A1
- formation Biochemistry. 33, 8619-8624. Hemenger, R.P., Pearlstain, R.M., Lakatos-Lindenberg, K. (1972) Incoherent exciton
quanching on lattices. J. Math. Phys. 13, 1056-1063. Hsin, T-M., Zazubovich, V, Hayes, J.M. and Small, G. J. (2004) Red Antenna States of PS I
of Cyanobacteria: Stark Effect and Interstate Energy Transfer. J. Phys. Chem. B. 108, 10515-10521.
Holzwarth, A.R., Müller, M.G., Niklas, J. and Lubitz, W. (2003) Ultrafast transient absorption studies on photosystem I reaction centers from Chlamydomonas reinhardtii. 2: mutations near the P700 reaction center chlorophylls provide new insight into the nature of the primary electron donor. Biophys. J. 90, 552-565.
Holzwarth, A.R., Müller, M.G., Niklas, J. and Lubitz, W. (2005) Charge recombination fluorescence in photosystem I reaction centers from Chlamydomonas reinhardtii. J. Phys. Chem. B. 109, 5903-5911.
Holzwarth, A.R., Müller, M.G., Reus, M., Nowaczyk, M., Sander, J. and Rögner, M. (2006) Kinetics and mechanism of electron transfer in intact photosystem II and in the isolated reaction center: pheophytin is the primary electron acceptor. Proc. Natl. Acad. Sci. U.S.A. 103, 6895-6900.
Hopfield, J.J. (1974) Electron transfer between biological molecules by thermally activated tunnelling. Proc. Natl. Acad. Sci. U.S.A. 71, 3640-3644.
Ihalainen, J.A., Gobets, B., Sznee, K., Brazzoli, M., Croce, R., Bassi, R., van Grondelle, R., Korppi-Tommola, J.E. and Dekker, J.P. (2000) Evidence for two spectroscopically different dimers of light-harvesting complex I from green plants. Biochemistry. 39, 8625-8631
Ihalainen, J.A., Jensen, P.E., Haldrup, A., van Stokkum, I.H., van Grondelle, R., Scheller, H.V. and Dekker, J.P. (2007) Pigment organization and energy transfer dynamics in isolated photosystem I (PSI) complexes from Arabidopsis thaliana depleted of the PSI-G, PSI-K, PSI-L, or PSI-N subunit. Biophys. J. 83, 2190-2201.
Ihalainen, J.A., van Stokkum, I.H., Gibasiewicz, K., Germano, M., van Grondelle, R. and Dekker, J.P. (2005a) Kinetics of excitation trapping in intact Photosystem I of
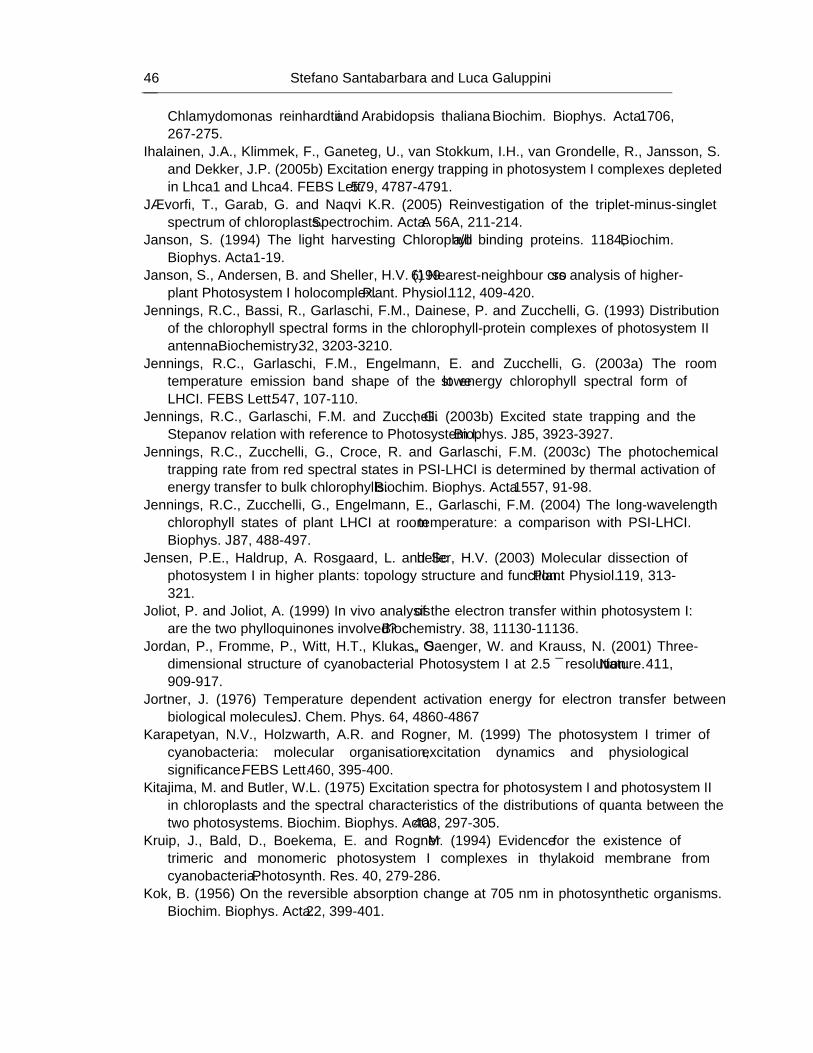
Stefano Santabarbara and Luca Galuppini 46
Chlamydomonas reinhardtii and Arabidopsis thaliana. Biochim. Biophys. Acta. 1706, 267-275.
Ihalainen, J.A., Klimmek, F., Ganeteg, U., van Stokkum, I.H., van Grondelle, R., Jansson, S. and Dekker, J.P. (2005b) Excitation energy trapping in photosystem I complexes depleted in Lhca1 and Lhca4. FEBS Lett. 579, 4787-4791.
Jávorfi, T., Garab, G. and Naqvi K.R. (2005) Reinvestigation of the triplet-minus-singlet spectrum of chloroplasts. Spectrochim. Acta. A 56A, 211-214.
Janson, S. (1994) The light harvesting Chlorophyll a/b binding proteins. 1184, Biochim. Biophys. Acta. 1-19.
Janson, S., Andersen, B. and Sheller, H.V. (1996) Nearest-neighbour cross analysis of higher-plant Photosystem I holocomplex. Plant. Physiol. 112, 409-420.
Jennings, R.C., Bassi, R., Garlaschi, F.M., Dainese, P. and Zucchelli, G. (1993) Distribution of the chlorophyll spectral forms in the chlorophyll-protein complexes of photosystem II antenna. Biochemistry. 32, 3203-3210.
Jennings, R.C., Garlaschi, F.M., Engelmann, E. and Zucchelli, G. (2003a) The room temperature emission band shape of the lowest energy chlorophyll spectral form of LHCI. FEBS Lett. 547, 107-110.
Jennings, R.C., Garlaschi, F.M. and Zucchelli, G. (2003b) Excited state trapping and the Stepanov relation with reference to Photosystem I. Biophys. J. 85, 3923-3927.
Jennings, R.C., Zucchelli, G., Croce, R. and Garlaschi, F.M. (2003c) The photochemical trapping rate from red spectral states in PSI-LHCI is determined by thermal activation of energy transfer to bulk chlorophylls. Biochim. Biophys. Acta. 1557, 91-98.
Jennings, R.C., Zucchelli, G., Engelmann, E., Garlaschi, F.M. (2004) The long-wavelength chlorophyll states of plant LHCI at room temperature: a comparison with PSI-LHCI. Biophys. J. 87, 488-497.
Jensen, P.E., Haldrup, A. Rosgaard, L. and Scheller, H.V. (2003) Molecular dissection of photosystem I in higher plants: topology structure and function. Plant Physiol. 119, 313-321.
Joliot, P. and Joliot, A. (1999) In vivo analysis of the electron transfer within photosystem I: are the two phylloquinones involved? Biochemistry. 38, 11130-11136.
Jordan, P., Fromme, P., Witt, H.T., Klukas, O., Saenger, W. and Krauss, N. (2001) Three-dimensional structure of cyanobacterial Photosystem I at 2.5 Å resolution. Nature. 411, 909-917.
Jortner, J. (1976) Temperature dependent activation energy for electron transfer between biological molecules. J. Chem. Phys. 64, 4860-4867
Karapetyan, N.V., Holzwarth, A.R. and Rogner, M. (1999) The photosystem I trimer of cyanobacteria: molecular organisation, excitation dynamics and physiological significance. FEBS Lett. 460, 395-400.
Kitajima, M. and Butler, W.L. (1975) Excitation spectra for photosystem I and photosystem II in chloroplasts and the spectral characteristics of the distributions of quanta between the two photosystems. Biochim. Biophys. Acta. 408, 297-305.
Kruip, J., Bald, D., Boekema, E. and Rogner, M. (1994) Evidence for the existence of trimeric and monomeric photosystem I complexes in thylakoid membrane from cyanobacteria. Photosynth. Res. 40, 279-286.
Kok, B. (1956) On the reversible absorption change at 705 nm in photosynthetic organisms. Biochim. Biophys. Acta. 22, 399-401.
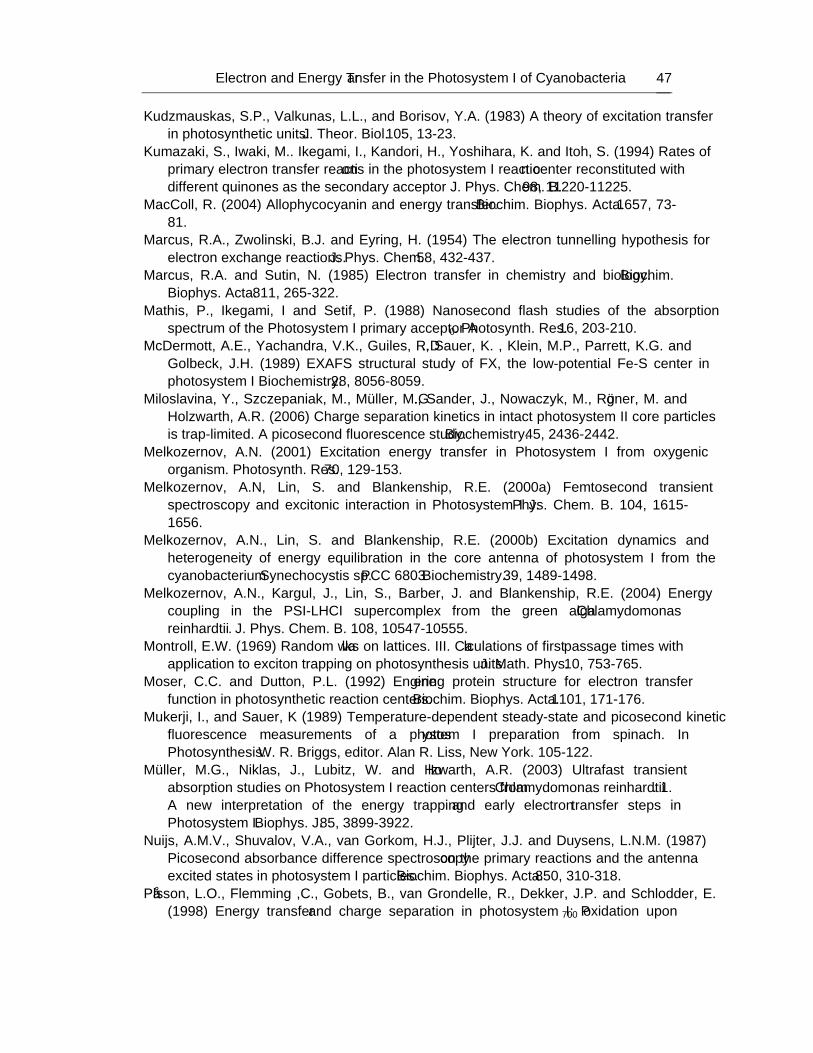
Electron and Energy Transfer in the Photosystem I of Cyanobacteria 47
Kudzmauskas, S.P., Valkunas, L.L., and Borisov, Y.A. (1983) A theory of excitation transfer in photosynthetic units. J. Theor. Biol. 105, 13-23.
Kumazaki, S., Iwaki, M.. Ikegami, I., Kandori, H., Yoshihara, K. and Itoh, S. (1994) Rates of primary electron transfer reactions in the photosystem I reaction center reconstituted with different quinones as the secondary acceptor J. Phys. Chem. B. 98, 11220-11225.
MacColl, R. (2004) Allophycocyanin and energy transfer. Biochim. Biophys. Acta. 1657, 73-81.
Marcus, R.A., Zwolinski, B.J. and Eyring, H. (1954) The electron tunnelling hypothesis for electron exchange reactions. J. Phys. Chem. 58, 432-437.
Marcus, R.A. and Sutin, N. (1985) Electron transfer in chemistry and biology. Biochim. Biophys. Acta. 811, 265-322.
Mathis, P., Ikegami, I and Setif, P. (1988) Nanosecond flash studies of the absorption spectrum of the Photosystem I primary acceptor A0. Photosynth. Res. 16, 203-210.
McDermott, A.E., Yachandra, V.K., Guiles, R.D., Sauer, K. , Klein, M.P., Parrett, K.G. and Golbeck, J.H. (1989) EXAFS structural study of FX, the low-potential Fe-S center in photosystem I Biochemistry. 28, 8056-8059.
Miloslavina, Y., Szczepaniak, M., Müller, M.G., Sander, J., Nowaczyk, M., Rögner, M. and Holzwarth, A.R. (2006) Charge separation kinetics in intact photosystem II core particles is trap-limited. A picosecond fluorescence study. Biochemistry. 45, 2436-2442.
Melkozernov, A.N. (2001) Excitation energy transfer in Photosystem I from oxygenic organism. Photosynth. Res. 70, 129-153.
Melkozernov, A.N, Lin, S. and Blankenship, R.E. (2000a) Femtosecond transient spectroscopy and excitonic interaction in Photosystem I J. Phys. Chem. B. 104, 1615-1656.
Melkozernov, A.N., Lin, S. and Blankenship, R.E. (2000b) Excitation dynamics and heterogeneity of energy equilibration in the core antenna of photosystem I from the cyanobacterium Synechocystis sp. PCC 6803 Biochemistry. 39, 1489-1498.
Melkozernov, A.N., Kargul, J., Lin, S., Barber, J. and Blankenship, R.E. (2004) Energy coupling in the PSI-LHCI supercomplex from the green alga Chlamydomonas reinhardtii. J. Phys. Chem. B. 108, 10547-10555.
Montroll, E.W. (1969) Random walks on lattices. III. Calculations of first passage times with application to exciton trapping on photosynthesis units. J. Math. Phys. 10, 753-765.
Moser, C.C. and Dutton, P.L. (1992) Engineering protein structure for electron transfer function in photosynthetic reaction centers. Biochim. Biophys. Acta. 1101, 171-176.
Mukerji, I., and Sauer, K (1989) Temperature-dependent steady-state and picosecond kinetic fluorescence measurements of a photosystem I preparation from spinach. In Photosynthesis. W. R. Briggs, editor. Alan R. Liss, New York. 105-122.
Müller, M.G., Niklas, J., Lubitz, W. and Holzwarth, A.R. (2003) Ultrafast transient absorption studies on Photosystem I reaction centers from Chlamydomonas reinhardtii. 1. A new interpretation of the energy trapping and early electron transfer steps in Photosystem I. Biophys. J. 85, 3899-3922.
Nuijs, A.M.V., Shuvalov, V.A., van Gorkom, H.J., Plijter, J.J. and Duysens, L.N.M. (1987) Picosecond absorbance difference spectroscopy on the primary reactions and the antenna excited states in photosystem I particles. Biochim. Biophys. Acta. 850, 310-318.
Pålsson, L.O., Flemming ,C., Gobets, B., van Grondelle, R., Dekker, J.P. and Schlodder, E. (1998) Energy transfer and charge separation in photosystem I: P700 oxidation upon
Stefano Santabarbara and Luca Galuppini 48
selective excitation of the long-wavelength antenna chlorophylls of Synechococcus elongatus. Biophys. J. 74, 2611-2622.
Pealstein, R.M. (1982) Excitation Migration and trapping in photosynthesis. Photochem. Photobiol. 35, 139-147.
Poluektov, O.G., Paschenko, S.V., Utschig, L.M., Lakshmi, K.V. and Thurnauer, M.C. (2005) Bidirectional electron transfer in photosystem I: direct evidence from high-frequency time-resolved EPR spectroscopy. J. Am. Chem. Soc. 127, 11910-11911.
Rätsep, M., Johnson, T.W., Chitnis, P.R. and Small, G.J. (2000) The red-absorbing chlorophyll a antenna states of Photosystem I: a hole-burning study of Synechocystis PCC 6803 and its mutants. J. Phys. Chem. B. 104, 836-847.
Rigby, S.E.J., Evans, M.C.W. and Heathcote, P. (1996) ENDOR and special triple resonance spectroscopy of A1.- of photosystem 1 Biochemistry. 35, 6651-6656.
Rijgersberg, C.P., Amesz, J., Thielen, A.P. and Swager, J.A. (1979) Fluorescence emission spectra of chloroplasts and subchloroplast preparations at low temperature. Biochim. Biophys. Acta. 545, 473-482.
Rijgersberg, C.P. and Amesz, J. (1978) Changes in light absorbance and chlorophyll fluorescence in spinach chloroplasts between 5 and 80 K. Biochim. Biophys. Acta. 502, 152-60.
Rijgersberg, C.P. and Amesz, J. (1980) Fluorescence and energy transfer in phycobiliprotein-containing algae at low temperature. Biochim. Biophys. Acta. 593, 261-271.
Rivadossi, A. Zucchelli, D., Garlaschi, F.M. and Jennings, R.C. (1999) The importance of PS I chlorophyll red forms in light-harvesting by leaves. Photosynth. Res. 60, 209-215.
Rodríguez, F., Derelle, E., Guillou, L., Le Gall, F., Vaulot, D. and Moreau, H. (2005) Ecotype diversity in the marine picoeukaryote Ostreococcus (Chlorophyta, Prasinophyceae). Environ. Microbiol. 7, 853-859.
Rustandi, R.R., Snyder, S.W., Feezel, L.L., Michalski, T.J., Norris, J.R. Thurnauer, M.C. and Biggins, J. (1990) Contribution of vitamin K1 to the electron spin polarization in spinach photosystem I. Biochemistry. 29, 8030-8032.
Santabarbara, S., Kuprov, I., Hore, P.J., Casal, A., Heathcote, P. and Evans, M.C.W. (2006) Analysis of the spin-polarized electron spin echo of the [P700
+A1-] radical pair of
photosystem I indicates that both reaction center subunits are competent in electron transfer in cyanobacteria, green algae, and higher plants. Biochemistry. 45, 7389-7403
Santabarbara, S., Heathcote, P. and Evans, M.C.W. (2005a) Modelling of the electron transfer reactions in Photosystem I by electron tunnelling theory: the phylloquinones bound to the PsaA and the PsaB reaction centre subunits of PS I are almost isoenergetic to the iron-sulfur cluster FX. Biochim. Biophys. Acta. 1708, 283-310.
Santabarbara, S., Kuprov, I., Fairclough, W.V., Purton, S., Hore, P.J., Heathcote, P. and Evans, M.C.W. (2005b) Bidirectional electron transfer in photosystem I: determination of two distances between P700
+ and A1- in spin-correlated radical pairs. Biochemistry. 44,
2119-2128. Santabarbara, S. and Carbonera, D. (2005c) Carotenoid triplet states associated with the long-
wavelength-emitting chlorophyll forms of photosystem I in isolated thylakoid membranes. J. Phys. Chem. B. 109, 986-991.
Savikhin, S. Xu, W., Chitnis, P.R. and Struve, P.R. (2000) Ultrafast primary processes in PS I from Synechocystis sp. PCC 6803: roles of P700 and A0. Biophys. J. 79, 1573-1586.
Electron and Energy Transfer in the Photosystem I of Cyanobacteria 49
Savikhin, S., Xu, W., Martinsson, P., Chitnis, P.R. and Struve, W.S. (2001) Kinetics of charge separation and A0->A1 electron transfer in photosystem I reaction centers Biochemistry. 40, 9282-90.
Scheller, H.V., Jensen, P.E., Haldrup, A., Lunde C., and Knoetzel, J. (2001) Role of subunits in eukaryotic PS I. Biochim. Biophys. Acta. 1507, 41-60.
Schatz, G.H., Brock, H. and Holzwarth, A.R. (1987) Picosecond kinetics of fluorescence and absorbance changes in photosystem II particles excited at low photon density. Proc. Natl. Acad. Sci. U.S.A. 84, 8414-8418.
Schlodder, E., Falkenberg, K., Gergeleit, M. and Brettel, K. (1998) Temperature dependence of forward and reverse electron transfer from A1
-, the reduced secondary electron acceptor in photosystem I Biochemistry. 37, 9466-9476.
Sener, M.K., Jolley, C., Ben-Shem, A., Fromme, P., Nelson, N., Croce, R. and Schulten, K. (2005) Comparison of the light-harvesting networks of plant and cyanobacterial photosystem I. Biophys. J. 89, 1630-1642.
Sener, M.K., Park, S., Lu, D., Damjanovic, A., Ritz, T., Fromme, P. and Schulten, K. (2004) Excitation migration in trimeric cyanobacterial photosystem I. J. Chem. Phys. 120, 11183-11195.
Setif, P. and Brettel, K. (1993) Forward electron transfer from phylloquinone A1 to iron-sulfur centers in spinach photosystem I Biochemistry. 32 (1993) 7846-7854.
Setif, P. (2001) Ferredoxin and flavodoxin reduction by photosystem I Biochim. Biophys. Acta. 1507, 161-179.
Shubin, V.V., Bezmertnaya, I.N. and Karapetyan, N.V. (1992) Isolation from Spirulina membranes of two Photosystem I-type complexes, one of which contains chlorophyll responsible for the 77 K fluorescence at 760 nm. FEBS Lett. 309, 340-342.
Shuvalov, V.A., KE. B., and Dolan, E. (1979) Kinetic and spectral properties of the intermediary electron acceptor A1 in photosystem I. Subnanosecond spectroscopy. FEBS Lett. 100, 5-8.
Slavov, C., Ballottari, M., Morosinotto, T., Bassi, R. and Holzwarth, A.R. (2008) Trap-limited charge separation kinetics in higher plant photosystem I complexes. Biophys. J. 94, 3601-3612.
Snyder, S.W., Rustandi, R.R. Biggins, J., Norris, J.R. and Thurnauer, M.C. (1991) Direct assignment of vitamin K1 as the secondary acceptor A1 in photosystem I. Proc. Natl. Acad. Sci. U.S.A. 88, 9895-9896.
Strasser, R.J. and Butler W.L. (1977) Fluorescence emission spectra of photosystem I, photosystem II and the light-harvesting chlorophyll a/b complex of higher plants. Biochim. Biophys. Acta. 462, 307-313.
Turconi, S., Kruip, G., Schweitzer, G., Rogner, M., and Holzwarth, A.R. (1996) A comparative fluorescence kinetic study of photosystem I monomer and trimers from Synechocystis PCC 6803. Photosyneth. Res. 49, 263-268.
Valkunas, L.,L, Kudsmauskas, S.P., and Liuolia, V.Y. (1986) Non-coherent migration of excitation in impure molecular structures. Lit. Fiz. Sbornik. 26, 3-15.
van der Lee, J., Bald, D., Kwa, S.L.S., van Grondelle, R., Rogner, M. and Dekker, J.P. (1993) Steady-state polarised-light spectroscopy of isolated photosystem I complexes. Photosynth. Res. 35, 311-321.
Stefano Santabarbara and Luca Galuppini 50
Wasiliewski, M.R., Fenton, J.M. and Govinjee (1987) The rate of formation of the P700+ A0
- in photosytsem I particles from spinach as measured by picosecond transient absorption spectroscopy. Photosynth. Res. 12, 181-190.
Wollman, F.A. (2001) State transitions reveal the dynamics and flexibility of the photosynthetic apparatus. EMBO J. 20, 3623-3630.
Xu, W., Chitnis, P., Valieva, A.I., van der Est, A., Pushkar, Y.N., Krzystyniak, M., Teutloff, C., Zech, S.G., Bittl, R., Stehlik, D., Zybailov, Y.N., Shen, G. and Golbeck, J.H. (2003) Electron transfer in cyanobacterial photosystem I: I. Physiological and spectroscopic characterization of site-directed mutants in a putative electron transfer pathway from A0 through A1 to FX. J. Biol. Chem. 278, 27864-27875.
Xu, W., Chitnis, P.R., Valieva, A.I., van der Est, A, Brettel, K., Guergova-Kuras, M., Pushkar, Y.N., Zech, S.G., Stehlik, D., Shen, G., Zybailov, B. and Golbeck, J.H. (2003) Electron transfer in cyanobacterial photosystem I: II. Determination of forward electron transfer rates of site-directed mutants in a putative electron transfer pathway from A0 through A1 to FX. J. Biol. Chem. 278, 27876-27887.
Zazubovich, V., Matsuzaki, S., Johnson, T.W., Hayes, M., Chitnis, P.R. and Small, G.J. (2002) Red antenna state of Photosystem I from cyanobacterium Synechococcus elongatus: a spectra hole burning study. Chem. Phys. 275, 47-59.
Zucchelli, G, Garlaschi, F.M., Bassi, R. and Jennings, R.C. (2005) The low energy emitting states of the Lhca4 subunit of higher plant photosystem I. FEBS Lett. 579, 2071-2076.
In: Handbook on Cyanobacteria ISBN: 978-1-60741-092-8 Editors: P. M. Gault and H. J. Marler © 2009 Nova Science Publishers, Inc.
Chapter 2
OVERVIEW OF SPIRULINA: BIOTECHNOLOGICAL, BIOCHEMICAL AND MOLECULAR
BIOLOGICAL ASPECTS
Apiradee Hongsthong1* and Boosya Bunnag2 1 BEC Unit, National Center for Genetic Engineering and Biotechnology,
2 Pilot Plant Development and Training Institute; King Mongkut’s University of Technology Thonburi, 83 Moo 8, Thakham,
Bangkhuntien, Bangkok 10150, Thailand
ABSTRACT
The cyanobacterium Spirulina is well recognized as a potential food supplement for humans because of its high levels of protein (65-70% of dry weight), vitamins and minerals. In addition to its high protein level, Spirulina cells also contain significant amounts of phycocyanin, an antioxidant that is used as an ingredient in various products developed by cosmetic and pharmaceutical industries. Spirulina cells also produce sulfolipids that have been reported to exert inhibitory effects on the Herpes simplex type I virus. Moreover, Spirulina is able to synthesize polyunsaturated fatty acids such as glycerolipid γ-linolenic acid (GLA; C18:3Δ9,12,6), which comprise 30% of the total fatty acids or 1-1.5% of the dry weight under optimal growth conditions. GLA, the end product of the desaturation process in Spirulina, is a precursor for prostaglandin biosynthesis; prostaglandins are involved in a variety of processes related to human health and disease. Spirulina has advantages over other GLA-producing plants, such as evening primrose and borage, in terms of its short generation time and its compatibility with mass cultivation procedures. However, the GLA levels in Spirulina cells need to be increased to 3% of the dry weight in order to be cost-effective for industrial scale production. Therefore, extensive studies aimed at enhancing the GLA content of these cyanobacterial cells have been carried out during the past decade.
As part of these extensive studies, molecular biological approaches have been used to study the gene regulation of the desaturation process in Spirulina in order to find
* Corresponding Author: Mailing Address: BEC Unit, KMUTT, 83 Moo8, Thakham, Bangkhuntien, Bangkok
10150, Thailand. Tel: 662-470-7509 Fax: 662-452-3455; Email: [email protected]
Apiradee Hongsthong and Boosya Bunnag 52
approaches that would lead to increased GLA production. The desaturation process in S. platensis occurs through the catalytic activity of three enzymes, the Δ9, Δ12 and Δ6 desaturases encoded by the desC, desA and desD genes, respectively. According to our previous study, the cellular GLA level is increased by approximately 30% at low temperature (22oC) compared with its level in cells grown at the optimal growth temperature (35oC). Thus, the temperature stress response of Spirulina has been explored using various techniques, including proteomics. The importance of Spirulina has led to the sequencing of its genome, laying the foundation for various additional studies. However, despite the advances in heterologous expression systems, the primary challenge for molecular studies is the lack of a stable transformation system. Details on the aspects mentioned here will be discussed in the chapter highlighted Spirulina: Biotechnology, Biochemistry, Molecular Biology and Applications.
BIOTECHNOLOGICAL ASPECTS OF SPIRULINA The development in the field of algal biotechnology started in the early 1960s in Japan
with the culture of Chlorella [142]. During the same period, the discovery of Spirulina in the mid-1960s by Jean Leonard, a member of a French-Belgian expedition to Africa, contributed to the start of extensive studies which led to the present knowledge in the physiology, biochemistry and mass cultivation techniques for Spirulina.
Spirulina has been used by the indigenous people in Africa and Mexico for centuries [20]. Spirulina is the only cyanobacterium, or blue-green algae, that is commercially cultivated for feed and food supplement. Besides the high content of protein, Spirulina also contains valuable chemicals such as γ-linolenic acid (GLA), phycocyanin, β-carotene and polysaccharides which were reported to have health benefit to humans.
This part of the chapter will summarize the uses and benefits of Spirulina and mass cultivation techniques.
1. Uses and Benefits of Spirulina Spirulina has been recognized as a potential food supplement for humans because of its
high content of protein (65-70%), vitamins and minerals. Spirulina cells and extracts have been reported to act as anti-inflammatory, antioxidant and anti-cancer agents and have therapeutic actions against diseases such as hypercholesterolemia, These properties are probably due to the benefits of the unique compositions from Spirulina such as γ-linolenic acid (GLA), phycocyanin and polysaccharides. Belay et al. (1993) reviewed the studies on potential health benefits, stating the limited published information at that time. In 2002, a more comprehensive review by Belay (2002) was published. Studies of the benefits to human health are summarized below.
1.1. Hypercholesterolemic
Devi and Ventakaraman (1983) were among the first to report their study on the reduction of serum cholesterol by Spirulina in rats [28]. Since then, many researchers have confirmed these findings in animals and humans. As summarized by Belay et al. (1993), most of the studies on the health-promoting effects were performed in mice or rats with few studies
Overview of Spirulina: Biotechnological, Biochemical… 53
in humans [10]. Torres-Duran et al. (1999) studied the preventive effects of Spirulina maxima on fatty liver development which was induced by carbon tetrachloride in rats [140]. They found that there was no difference in the concentration of liver lipids when rats were fed a diet supplemented with oil extract from Spirulina or defatted Spirulina when compared with the control group. A slight increase in the total cholesterol was observed in the group fed a diet containing oil extract. After the CCl4 treatment, total liver lipid and triacylglycerol concentrations were significantly lowered in both groups of rats fed a diet containing an oil fraction and defatted Spirulina.
In an earlier study on humans, Nakaya et al. (1988) showed that taking 4.2 g/day Spirulina continuously for eight weeks significantly reduced low density lipoprotein cholesterol (LDL) (P<0.05) in fifteen male volunteers [91]. However, no significant difference in the level of high density lipoprotein cholesterol (HDL) was observed. In contrast, the results from the study of Ramamoorthy and Premakumavi (1996) showed that supplementation with 4 g/day of Spirulina in ischemic heart disease patients significantly decreased the levels of blood cholesterol, triglycerides, LDL and VLDL cholesterol and increased HDL cholesterol levels [107].
A study of the role of Spirulina in the control of glycemia and lipidemia in type 2 diabetes mellitus showed that supplementation with 2 g/day for two months in twenty-five subjects with type 2 diabetes mellitus resulted in an appreciable lowering of fasting blood glucose and postprandial blood glucose levels. Triglyceride levels were drastically decreased as were total cholesterol and LDL levels, but the HDL level was increased [102].
1.2. Antioxidant
Generation of reactive oxygen species (ROS) in living tissues is a natural process. However, the imposition of stresses can aggravate the production of ROS [1], which, in turn, may lead to oxidative deterioration of cellular constituents and ultimately to cell death. Reactive oxygen species (ROS) are constantly being produced in cells through normal metabolic processes. Oxidative stress occurs when the balance of oxidants within the cell exceeds the levels of antioxidants present. An increased level of ROS can lead to the damage of macromolecules within the cell. The damage to lipids, proteins and DNA can raise the possibilities of diseases such as cancer. Many studies demonstrate that oxidative stress and ROS play an important role in the etiology and/or progression of a number of human diseases [16, 141]. Antioxidants are thus needed to prevent the formation and oppose the actions of reactive oxygen and nitrogen species, which are generated in vivo and cause damage to DNA, lipids, proteins and other biomolecules [16, 81, 104, 141, 143].
Spirulina contains a large amount of carotenoid pigments, especially β-carotene, which provide some of the antioxidant effect. Spirulina also contains a high amount of phycocyanin (PC), which is the major light harvesting protein. Phycocyanin is produced on a commercial scale by many manufacturers. Currently, phycocyanin is used as a natural dye in foods and cosmetics. However, there have been numerous published reports about the properties of phycocyanin such as its antioxidant, anti-inflammatory, anti-cancer and immunomodulator properties and its inhibition of viruses.
Recent studies of the ability of the linear tetrapyrrol prosthetic group, commonly called ‘bilins’, of phycocyanin to scavenge reactive oxygen species (ROS) have been reported. An in vitro study on the antioxidant properties of phycocyanin revealed that phycocyanin inhibited 2, 2�-azobis (2 midinoprapane) dihydroxychloride (AAPH)-induced human
Apiradee Hongsthong and Boosya Bunnag 54
erythrocyte hemolysis in the same way as trolox and ascorbic acid, two well known antioxidants. Based on IC50 values, phycocyanin was found to be 16 times more effective as an antioxidant than trolox and about 20 times more effective than ascorbic acid [112].
The hydroxyl radical scavenging capacity of phycocyanin has also been assayed by the inhibition of damage to 2-deoxyribose. The IC50 values reported for phycocyanin using this method were 19 µM and 28 µM. The phycobiliprotein interacts with hydroxyl radicals with a reaction rate constant in the range of 1.9 to 3.5 ×10¹¹ M-1sec-1, whereas the rate constant obtained using the same method for some non-steroidal anti-inflammatory drugs (NSAIDs), such as indomethacin and ibuprofen, was 1.8 ×10¹⁰ M-1sec-1 [113]. It has been shown that phycocyanin significantly inhibits the increase in lipid peroxides of rat liver microsomes after treatment with Fe2+-ascorbic acid or the free radical initiator AAPH [113]. Bhat and Madyastha (2000) also demonstrated that phycocyanin extracted from S. platensis is a potent peroxyl radical scavenger in vivo and in vitro [12]. C-phycocyanin effectively inhibited CCl4-induced lipid peroxidation in rat livers in vivo.
Soni et al. (2008) determined the antioxidant capacity of purified phycocyanin extracted from Phormidium fragile, which was checked in vitro by the Ferric Reducing Ability of Plasma (FRAP) assay [127]. To assess the antioxidant capacity, they used various well established non-enzymatic antioxidants such as ferrous sulfate, ascorbic acid, galic acid, uric acid and a-tocopherol. They found that the antioxidant activity of phycocyanin was either equal to or higher than that of all of these antioxidants. The fold antioxidant capacity of phycocyanin to ferrous sulfate, ascorbic acid, galic acid, uric acid and a-tocopherol was 4.25, 1.78, 0.94, 3.98 and 2.65, respectively, suggesting the potential for use of phycocyanin as an antioxidant in various preparations.
1.3. Anti-Cancer and Immune System Effects
Phycocyanin has been reported to have anti-cancer and immune boosting effects. Spirulina was extracted and given orally to laboratory mice that had been injected with liver tumor cells. The survival rate was increased significantly above those of the controls. The lymphocyte activity of the treatment group was also found to be significantly higher than that of the control group (Japanese Patent #58-65216) [26].
Schwartz and Shklar (1987) showed that β-carotene and Spirulina-Dunaliella extracts could inhibit carcinogenesis in hamster buccal pouches [118]. A later study by Schwartz et al. (1988) demonstrated that the efficiency of Spirulina and Dunaliella extracts was higher than the result in the previous report with hamster buccal pouches when administered orally [119]. Subhashini et al. (2004) studied the effect of purified C-phycocyanin (C-PC) on the growth and multiplication of the human chronic myeloid leukemia cell line (K562) [129]. Their results indicated a significant decrease (49%) in the proliferation of K562 cells treated with 50 μM C-PC up to 48 h. Apoptosis features were also detected under an electron microscope.
1.4. Anti-Inflammatory Effects
C-PC found in cyanobacteria is often used as a dietary nutritional supplement. C-PC has been found to have anti-inflammatory activity and has beneficial effects against various diseases. However, the mechanisms of the anti-inflammation are not clearly studied. There have been many studies carried out to determine anti-inflammation activity and its mechanisms.
Overview of Spirulina: Biotechnological, Biochemical… 55
Macrophages play an important role in inflammation and immune response regulation. When activated, macrophages release growth factors, cytokines and lipid mediators, such as prostaglandins and leukotrienes, which promote inflammation by directing cellular migration to the site of inflammation through the production and release of pro-inflammatory cytokines [62].
To provide evidence that phycocyanin could potentially be used as a dietary supplement in inflammatory bowel disease (IBD), which is a complex disorder of the gastrointestinal tract, Gonzales et al. (1999) studied the anti-inflammatory effects of phycocyanin in acetic acid-induced colitis in rats [36]. Phycocyanin (150, 200, 300 mg/kg post-orally (p.o.)) was administered 30 min before the induction of colitis with an enema of 1 ml of 4% acetic acid per rat. 5-ASA (5-aminosalicylic acid at a dose of 200 mg/kg) was used as a reference drug for these experiments. In the groups of rats pre-treated with phycocyanin, there was only slight submucosal edema, minimal subepithelial hemorrhage and mild inflammatory cell infiltration. This was the first report of the anti-colitic effect of phycocyanin.
Reddy et al. (2000) showed that C-phycocyanin (C-PC) selectively inhibits cycloxygenase-2 (COX-2), which is an inducible isoform of cyclooxygenase implicated in the mediation of inflammation and arthritis [108]. The catalytic activity of cyclooxygenase, also called prostaglandin synthase, when applied to arachidonic acid, results in the formation of prostaglandin H2 (PGH2). PGH2 is an unstable endoperoxide intermediate, which, in turn, serves as a substrate for cell-specific isomerases and synthases to produce prostaglandins (PGE2, PGD2, PGF2α), prostacyclin (PGI2) and thromboxane A2 (TXA2). Prostaglandins are important lipid mediators in several pathological processes, such as inflammation, thrombosis and cancer, in addition to normal physiological processes.
In addition, nitric oxide (NO), which is synthesized by the enzyme nitric oxide synthase (NOS), also plays an important regulatory/modulatory role in many physiological and pathological conditions [88]. However, the high amount of NO produced by inducible NOS (iNOS) stimulated by pro-inflammatory cytokines, free radicals and lipopolysaccharide (LPS) may be a critical mediator in the pathogenesis of inflammatory diseases [134, 144]. As mentioned earlier, it is well understood that activated macrophages play an important role in the regulation of inflammation and the immune response through the production of various inflammatory mediators, including pro-inflammatory cytokines. Macrophages also produce NO and reactive oxygen species (ROS), which are then released into the general circulation to exert systemic effects [34]. Agents that inhibit the overproduction of NO derived from iNOS in macrophages may thus have anti-inflammatory activities.
Cherng et al. (2007) concluded that the inhibitor activity of C-PC on LPS-induced NO release and iNOS expression is probably associated with suppressing TNF-α formation and nuclear NF-κB activation, which provides an additional explanation for the anti-inflammation activity [19].
Moreover, phycocyanin can inhibit the induced allergic inflammatory response and histamine release from isolated rat mast cells [109]. In in vivo experiments, phycocyanin (100, 200 and 300 mg/kg p.o.) was administered 1 h before the assessment with 1 µg of ovalbumin (OA) in the ear of mice previously sensitized with OA. One hour later, myeloperoxidase (MPO) activity, an indicator for inflammation, and ear edema were assessed. Phycocyanin was found to significantly reduce both parameters. In separate experiments, phycocyanin (100 and 200 mg/kg p.o.) also reduced the blue spot area induced
Apiradee Hongsthong and Boosya Bunnag 56
by intradermal injections of histamine. The inhibitory effect of phycocyanin was dose-dependent.
In accord with the previous results, phycocyanin also significantly reduced the histamine release induced by the histamine releaser compound 48/80 from isolated peritoneal rat mast cells.
1.5. Antiviral Effects
Hayachi et al. (1993) reported that the water extract of S. platensis could inhibit the in vitro replication of Herpes simplex virus type I (HSV-1) in HeLa cells within the concentration range of 0.08-50 mg/ml. The mechanism of the effect was the interference with the adsorption and penetration of the virus into the host cell [42].
A novel sulfated-polysaccharide, calcium spirulan (Ca-SP) was later isolated and tested for the inhibition of the in vitro replication of several enveloped viruses [41, 43]. This study also found that the anti-HIV-1 activity of Ca-SP is comparable to that of dextran sulfate (DS; a known potent anti-HIV-1 agent), while its anti-HSV-1 activity was 4-5 fold higher than that of dextran sulfate [43]. Ayehunie et al. also reported that an aqueous extract of Spirulina (Arthrospira) platensis inhibited HIV-1 replication in human T-cell lines, peripheral blood mononuclear cells (PBMC) and Langerhans cells [4]. It was also found that the extract directly inactivated HIV-1 infectivity when pre-incubated with virus before addition to human T-cell lines.
Shih-Ru et al. (2003) studied the inhibition of enterovirus 71 by allophycocyanin isolated from S. platensis [124]. Their results showed that allophycocyanin neutralized the enterovirus 71-induced cytopathic effect in both human rhabdomyosarcoma cells and African green monkey kidney cells. The 50% inhibitory concentration of allophycocyanin for neutralizing the enterovirus 71-induced cytopathic effect was approximately 0.045 ± 0.012 µM in green monkey kidney cells. A plaque reduction assay showed that the concentrations of allophycocyanin required for a 50% reduction of plaque formation were about 0.056 ± 0.007 µM for rhabdomyosarcoma cells and 0.101 ± 0.032 µM for African green monkey kidney cells. Allophycocyanin was also found to be able to delay viral RNA synthesis in the infected cells and to abate the apoptosis process in enterovirus 71-infected rhabdomyosarcoma cells with evidence of DNA fragmentation, decreasing membrane damage and declining the cell sub-B1 phase.
2. Uses as a Feed Supplement Besides being used as a food supplement, in 1996 about 30% of the worldwide Spirulina
mass production was used as a feed supplement for animals [11]. The benefits conferred to animals include enhancing the color in ornamental fish and promoting yolk color [116, 117]. Spirulina formulated feed was found to increase growth rates in many species of fish.
Overview of Spirulina: Biotechnological, Biochemical… 57
3. Mass Cultivation Few microalgae have been cultivated for commercial purposes. Chlorella and Spirulina
are mainly grown for health foods, Haematococcus for astaxanthin, Dunaliella salina for β-carotene and other microalgae and diatoms for aquaculture. Recently, interest in growing microalgae for biofuel has increased among researchers and private sectors as an alternative source of energy. As a result, many researchers have been trying to develop photobioreactors in order to be able to produce highest activity of the grown algae.
Although cultivation techniques of microalgae being operated nowadays are not complicated, many constraints still obstruct the commercialization of the products. Some microalgae can be grown outdoors in open ponds because they can be grown in media that favor their growth, but not the growth of other organisms; for instance, Spirulina requires high alkalinity and Dunalialla requires high salinity. Other microalgae have to be cultivated in closed systems, which are very expensive.
Three major steps are required for the cultivation of any microalgae. The first step is the design of the pond or the reactors, the second is the separation of the algae from the medium and the final step is the dehydration process.
The reactors can be open ponds in the case of Spirulina since contamination can be prevented by controlling the pH of the pond. Generally, open ponds are oblong with varied sizes. For example, Siam Algae, Ltd. in Thailand (which closed down in 2007) had a 2,000 m2 pond for commercial scale production and Earthrise Farm in California, USA has a 5,000 m2 pond [9]. These ponds are designed to provide good mixing to facilitate exposure of the cells to sunlight as well as to purge the O2 that evolves during photosynthesis from the system. Accumulation of O2 in the medium can be detrimental to the cell photosynthetic apparatus [82, 126]. Circulation is made possible by means of paddle wheels. The velocity of the medium should be 15-30 cm/sec. It has been reported that a velocity of more than 30 cm/sec will not enhance productivity and may cause cells to break [9].
To prevent deposition of dead cells in the ponds, baffles are installed along the corners of the ponds to increase the flow. Deposition of dead cells results in an increase in organic matter, which can cause contamination by bacteria and protozoa.
Closed photobioreactors have been studied to increase productivity. There are varieties of photobioreactor designs, but from a commercial point of view, photobioreactors must have the following characteristics: high area productivity (g m-2 per day), high volumetric productivity (g l-1 per day), large volume (l per photobioreactor), economical construction and maintenance, easy control of culture parameters (temperature, pH, O2 and turbulence) and reliability [98].
The main aim for ponds and reactor design is to give the highest output rate of biomass per area. To have the best design, the study of algae physiology needs to be thoroughly understood. Unfortunately, not much research has been done on the commercial scale. Photobioreactors are used for cultivation of algal species which do not have growth selective advantages. Most of the commercial scale production of Spirulina still employs open ponds which are more cost-effective.
Currently, much research is underway to find effective systems to grow algae for biofuel. Spirulina may not be a candidate for oil feedstocks, but the development of new types of photobioreactors may have benefits as more efficient methods for growing this microalgae.
Apiradee Hongsthong and Boosya Bunnag 58
BIOCHEMICAL AND MOLECULAR BIOLOGICAL ASPECTS OF SPIRULINA
1. Stress Response
1.1. Temperature Stress
Extreme variation in the surrounding temperature is one of the most common stresses for many living organisms. Therefore, adaptive mechanisms to protect against the potentially harmful effects of temperature variations are found in all living organisms. These survival pathways are regulated at molecular levels, including the transcriptional, post-transcriptional and translational levels [44, 93, 94]. In cyanobacteria, gene regulation mediated by heat shock has been less extensively studied than the response of the organism to cold shock; however, the heat shock responses in some cyanobacteria such as Synechocystis, Synechococcus and Nostoc have been investigated [31, 33, 66]. In the case of Spirulina, the regulation of the desaturation process and the effects of low and high temperatures on the cells at the molecular level have been studied in the C1 strain [27, 47].
A. Low Temperature Stress
Temperature reduction is an important environmental factor that leads to stabilization of DNA and RNA secondary structures, impaired protein biosynthesis and particularly, to a reduction in membrane fluidity [100, 151]. Exposure to ambient temperatures lower than the optimal growth temperatures of cyanobacterial cells, including Spirulina and other poikilothermous organisms, causes an increase in the degree of fatty acid desaturation in the lipid membrane. It has been well established, in terms of lipid membrane composition, that unsaturated fatty acid levels in the membrane have to increase to cause a phase transition of the plasma membrane in order to cope with a reduction in membrane fluidity [151]. This phenomenon is recognized as homeoviscous adaptation, which is defined as maintenance of the optimal function of biological membranes in response to temperature stress via the adjustment of membrane fluidity. Therefore, extensive studies on this phenomenon, including the regulation of the genes involved in fatty acid desaturation, were carried out in various organisms, including Spirulina.
Desaturase Gene Regulation under Low Temperature Stress
Cyanobacterial desaturases are categorized in the family of acyl-lipid desaturases, which are membrane bound proteins [90, 139]. Three desaturase enzymes, Δ9, Δ12 and Δ6 desaturase, are involved in the fatty acid desaturation process of S. platensis; these enzymes are encoded by the desC, desA and desD genes, respectively. The three double bonds are introduced at the Δ9, Δ12 and Δ6 positions of stearic acid (18:0), oleic acid (18:1) and linoleic acid (18:2), respectively, by the three respective enzymes. As mentioned earlier, the levels of the end-product of the desaturation reaction, γ-linolenic acid (GLA), increase by approximately 30% under low temperature stress (table 2). Therefore, questions have been raised as to at what level the desaturase genes are regulated in response to temperature reduction.
The regulation of Spirulina-desaturase genes in response to temperature change have been studied at the transcriptional and post-transcriptional levels [27]. After an abrupt temperature reduction from 35oC, which is the optimal growth temperature, to 22oC, the
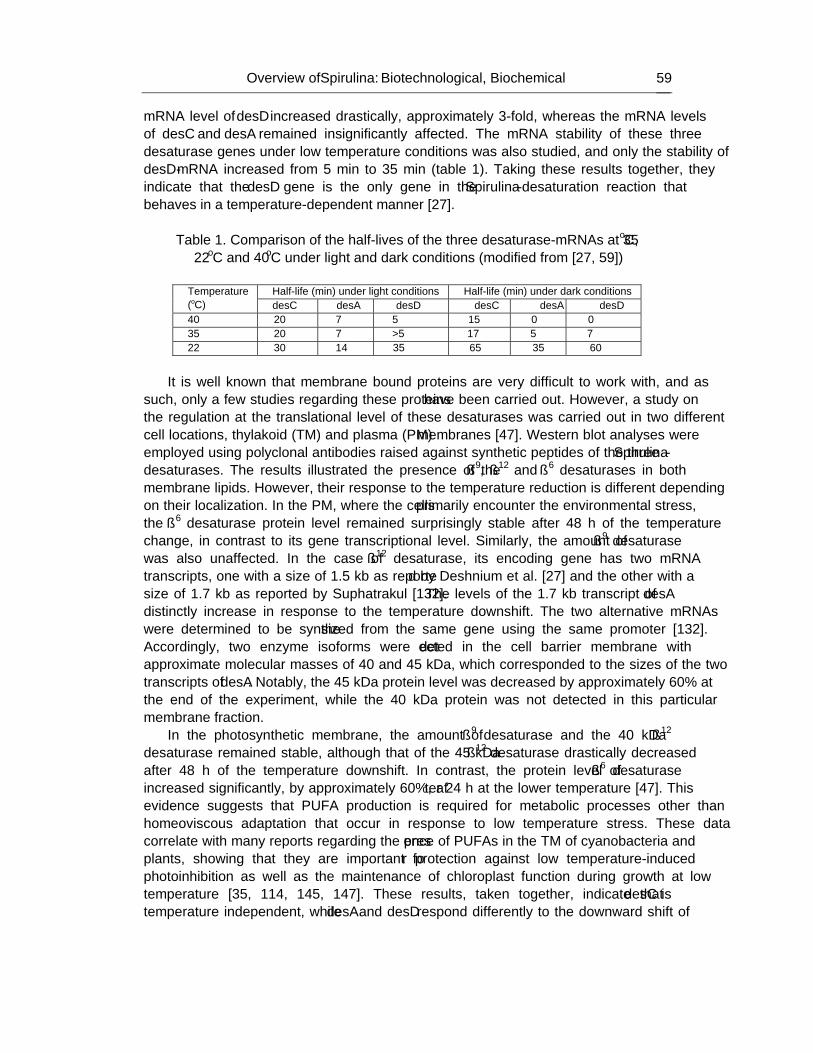
Overview of Spirulina: Biotechnological, Biochemical… 59
mRNA level of desD increased drastically, approximately 3-fold, whereas the mRNA levels of desC and desA remained insignificantly affected. The mRNA stability of these three desaturase genes under low temperature conditions was also studied, and only the stability of desD-mRNA increased from 5 min to 35 min (table 1). Taking these results together, they indicate that the desD gene is the only gene in the Spirulina-desaturation reaction that behaves in a temperature-dependent manner [27].
Table 1. Comparison of the half-lives of the three desaturase-mRNAs at 35oC,
22oC and 40oC under light and dark conditions (modified from [27, 59])
Half-life (min) under light conditions Half-life (min) under dark conditions Temperature (oC) desC desA desD desC desA desD 40 20 7 5 15 0 0 35 20 7 >5 17 5 7 22 30 14 35 65 35 60
It is well known that membrane bound proteins are very difficult to work with, and as
such, only a few studies regarding these proteins have been carried out. However, a study on the regulation at the translational level of these desaturases was carried out in two different cell locations, thylakoid (TM) and plasma (PM) membranes [47]. Western blot analyses were employed using polyclonal antibodies raised against synthetic peptides of the three Spirulina-desaturases. The results illustrated the presence of the Δ9, Δ12 and Δ6 desaturases in both membrane lipids. However, their response to the temperature reduction is different depending on their localization. In the PM, where the cells primarily encounter the environmental stress, the Δ6 desaturase protein level remained surprisingly stable after 48 h of the temperature change, in contrast to its gene transcriptional level. Similarly, the amount of Δ9 desaturase was also unaffected. In the case of Δ12 desaturase, its encoding gene has two mRNA transcripts, one with a size of 1.5 kb as reported by Deshnium et al. [27] and the other with a size of 1.7 kb as reported by Suphatrakul [132]. The levels of the 1.7 kb transcript of desA distinctly increase in response to the temperature downshift. The two alternative mRNAs were determined to be synthesized from the same gene using the same promoter [132]. Accordingly, two enzyme isoforms were detected in the cell barrier membrane with approximate molecular masses of 40 and 45 kDa, which corresponded to the sizes of the two transcripts of desA. Notably, the 45 kDa protein level was decreased by approximately 60% at the end of the experiment, while the 40 kDa protein was not detected in this particular membrane fraction.
In the photosynthetic membrane, the amount of Δ9 desaturase and the 40 kDa Δ12 desaturase remained stable, although that of the 45 kDa Δ12 desaturase drastically decreased after 48 h of the temperature downshift. In contrast, the protein level of Δ6 desaturase increased significantly, by approximately 60%, after 24 h at the lower temperature [47]. This evidence suggests that PUFA production is required for metabolic processes other than homeoviscous adaptation that occur in response to low temperature stress. These data correlate with many reports regarding the presence of PUFAs in the TM of cyanobacteria and plants, showing that they are important for protection against low temperature-induced photoinhibition as well as the maintenance of chloroplast function during growth at low temperature [35, 114, 145, 147]. These results, taken together, indicate that desC is temperature independent, while desA and desD respond differently to the downward shift of
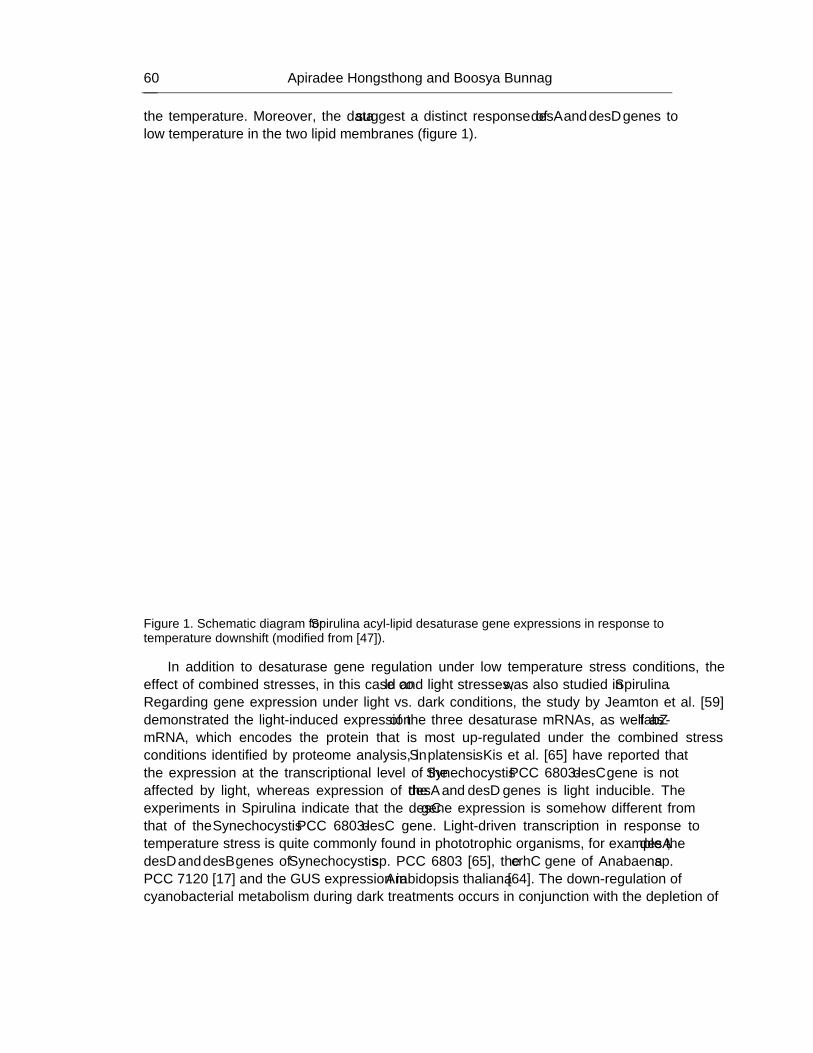
Apiradee Hongsthong and Boosya Bunnag 60
the temperature. Moreover, the data suggest a distinct response of desA and desD genes to low temperature in the two lipid membranes (figure 1).
Figure 1. Schematic diagram for Spirulina acyl-lipid desaturase gene expressions in response to temperature downshift (modified from [47]).
In addition to desaturase gene regulation under low temperature stress conditions, the effect of combined stresses, in this case cold and light stresses, was also studied in Spirulina. Regarding gene expression under light vs. dark conditions, the study by Jeamton et al. [59] demonstrated the light-induced expression of the three desaturase mRNAs, as well as fabZ-mRNA, which encodes the protein that is most up-regulated under the combined stress conditions identified by proteome analysis, in S. platensis. Kis et al. [65] have reported that the expression at the transcriptional level of the Synechocystis PCC 6803-desC gene is not affected by light, whereas expression of the desA and desD genes is light inducible. The experiments in Spirulina indicate that the desC gene expression is somehow different from that of the Synechocystis PCC 6803-desC gene. Light-driven transcription in response to temperature stress is quite commonly found in phototrophic organisms, for example the desA, desD and desB genes of Synechocystis sp. PCC 6803 [65], the crhC gene of Anabaena sp. PCC 7120 [17] and the GUS expression in Arabidopsis thaliana [64]. The down-regulation of cyanobacterial metabolism during dark treatments occurs in conjunction with the depletion of
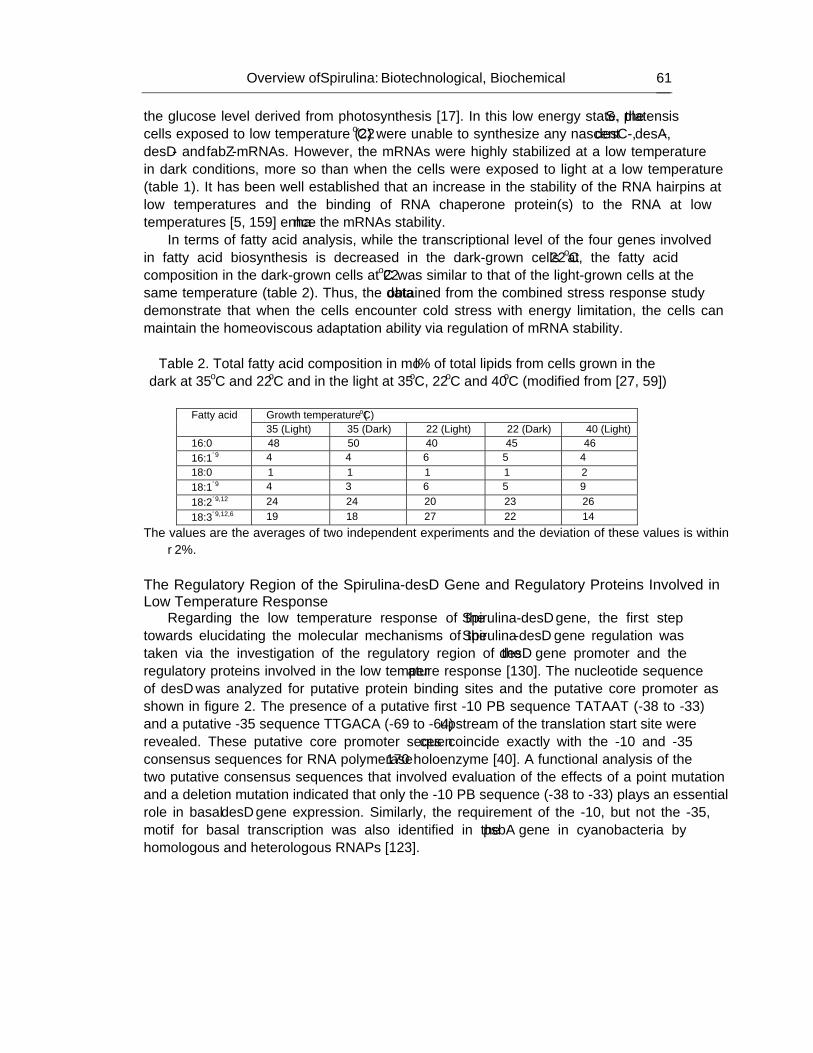
Overview of Spirulina: Biotechnological, Biochemical… 61
the glucose level derived from photosynthesis [17]. In this low energy state, the S. platensis cells exposed to low temperature (22oC) were unable to synthesize any nascent desC-, desA-, desD- and fabZ-mRNAs. However, the mRNAs were highly stabilized at a low temperature in dark conditions, more so than when the cells were exposed to light at a low temperature (table 1). It has been well established that an increase in the stability of the RNA hairpins at low temperatures and the binding of RNA chaperone protein(s) to the RNA at low temperatures [5, 159] enhance the mRNAs’ stability.
In terms of fatty acid analysis, while the transcriptional level of the four genes involved in fatty acid biosynthesis is decreased in the dark-grown cells at 22oC, the fatty acid composition in the dark-grown cells at 22oC was similar to that of the light-grown cells at the same temperature (table 2). Thus, the data obtained from the combined stress response study demonstrate that when the cells encounter cold stress with energy limitation, the cells can maintain the homeoviscous adaptation ability via regulation of mRNA stability.
Table 2. Total fatty acid composition in mol% of total lipids from cells grown in the
dark at 35oC and 22oC and in the light at 35oC, 22oC and 40oC (modified from [27, 59])
Growth temperature (oC) Fatty acid 35 (Light) 35 (Dark) 22 (Light) 22 (Dark) 40 (Light)
16:0 48 50 40 45 46 16:1Δ9 4 4 6 5 4 18:0 1 1 1 1 2 18:1Δ9 4 3 6 5 9 18:2Δ9,12 24 24 20 23 26 18:3Δ9,12,6 19 18 27 22 14
The values are the averages of two independent experiments and the deviation of these values is within ±2%.
The Regulatory Region of the Spirulina-desD Gene and Regulatory Proteins Involved in Low Temperature Response
Regarding the low temperature response of the Spirulina-desD gene, the first step towards elucidating the molecular mechanisms of the Spirulina-desD gene regulation was taken via the investigation of the regulatory region of the desD gene promoter and the regulatory proteins involved in the low temperature response [130]. The nucleotide sequence of desD was analyzed for putative protein binding sites and the putative core promoter as shown in figure 2. The presence of a putative first -10 PB sequence ‘TATAAT’ (-38 to -33) and a putative -35 sequence ‘TTGACA’ (-69 to -64) upstream of the translation start site were revealed. These putative core promoter sequences coincide exactly with the -10 and -35 consensus sequences for RNA polymerase σ70 holoenzyme [40]. A functional analysis of the two putative consensus sequences that involved evaluation of the effects of a point mutation and a deletion mutation indicated that only the -10 PB sequence (-38 to -33) plays an essential role in basal desD gene expression. Similarly, the requirement of the -10, but not the -35, motif for basal transcription was also identified in the psbA gene in cyanobacteria by homologous and heterologous RNAPs [123].
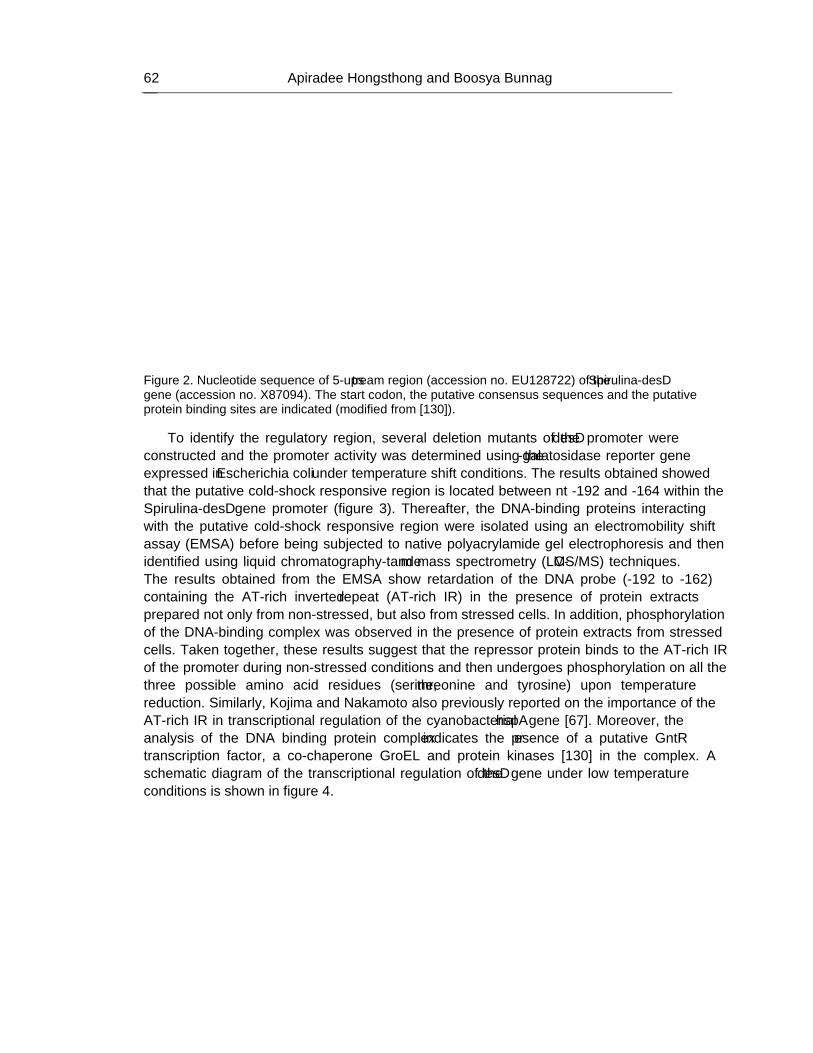
Apiradee Hongsthong and Boosya Bunnag 62
Figure 2. Nucleotide sequence of 5�-upstream region (accession no. EU128722) of the Spirulina-desD gene (accession no. X87094). The start codon, the putative consensus sequences and the putative protein binding sites are indicated (modified from [130]).
To identify the regulatory region, several deletion mutants of the desD promoter were constructed and the promoter activity was determined using the β-galatosidase reporter gene expressed in Escherichia coli under temperature shift conditions. The results obtained showed that the putative cold-shock responsive region is located between nt -192 and -164 within the Spirulina-desD gene promoter (figure 3). Thereafter, the DNA-binding proteins interacting with the putative cold-shock responsive region were isolated using an electromobility shift assay (EMSA) before being subjected to native polyacrylamide gel electrophoresis and then identified using liquid chromatography-tandem mass spectrometry (LC-MS/MS) techniques. The results obtained from the EMSA show retardation of the DNA probe (-192 to -162) containing the AT-rich inverted repeat (AT-rich IR) in the presence of protein extracts prepared not only from non-stressed, but also from stressed cells. In addition, phosphorylation of the DNA-binding complex was observed in the presence of protein extracts from stressed cells. Taken together, these results suggest that the repressor protein binds to the AT-rich IR of the promoter during non-stressed conditions and then undergoes phosphorylation on all the three possible amino acid residues (serine, threonine and tyrosine) upon temperature reduction. Similarly, Kojima and Nakamoto also previously reported on the importance of the AT-rich IR in transcriptional regulation of the cyanobacterial hspA gene [67]. Moreover, the analysis of the DNA binding protein complex indicates the presence of a putative GntR transcription factor, a co-chaperone GroEL and protein kinases [130] in the complex. A schematic diagram of the transcriptional regulation of the desD gene under low temperature conditions is shown in figure 4.
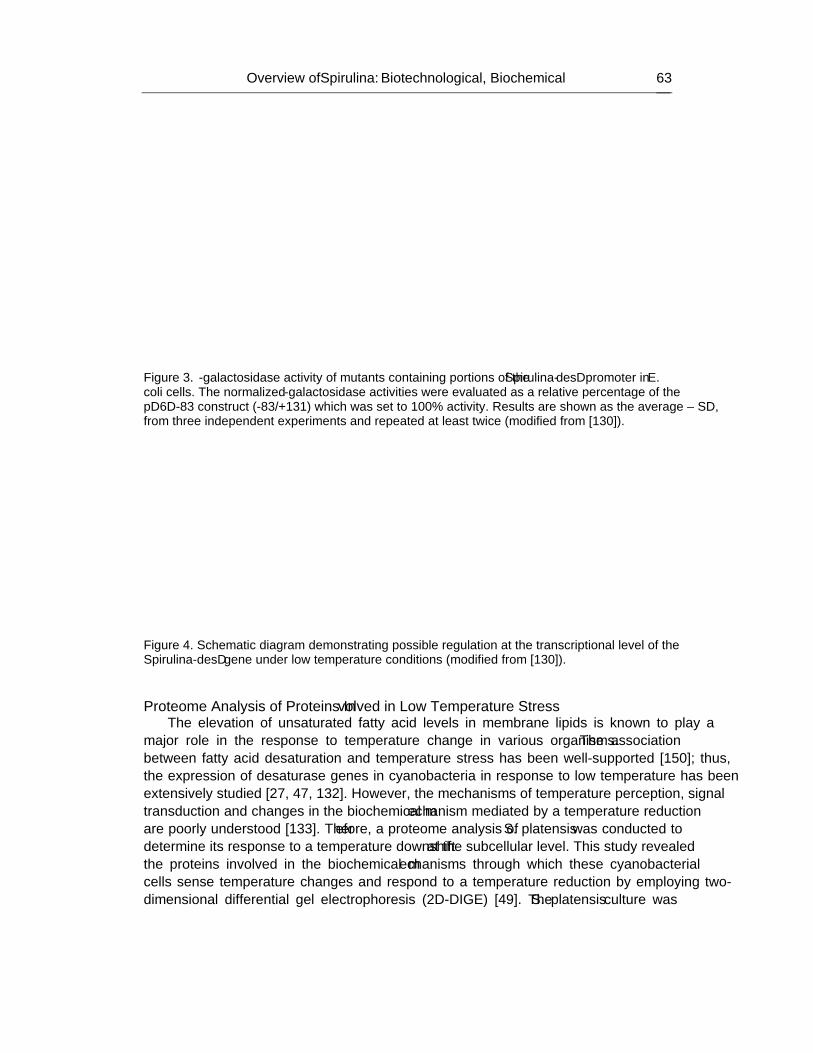
Overview of Spirulina: Biotechnological, Biochemical… 63
Figure 3. β-galactosidase activity of mutants containing portions of the Spirulina-desD promoter in E. coli cells. The normalized β-galactosidase activities were evaluated as a relative percentage of the pD6D-83 construct (-83/+131) which was set to 100% activity. Results are shown as the average ± SD, from three independent experiments and repeated at least twice (modified from [130]).
Figure 4. Schematic diagram demonstrating possible regulation at the transcriptional level of the Spirulina-desD gene under low temperature conditions (modified from [130]).
Proteome Analysis of Proteins Involved in Low Temperature Stress
The elevation of unsaturated fatty acid levels in membrane lipids is known to play a major role in the response to temperature change in various organisms. The association between fatty acid desaturation and temperature stress has been well-supported [150]; thus, the expression of desaturase genes in cyanobacteria in response to low temperature has been extensively studied [27, 47, 132]. However, the mechanisms of temperature perception, signal transduction and changes in the biochemical mechanism mediated by a temperature reduction are poorly understood [133]. Therefore, a proteome analysis of S. platensis was conducted to determine its response to a temperature downshift at the subcellular level. This study revealed the proteins involved in the biochemical mechanisms through which these cyanobacterial cells sense temperature changes and respond to a temperature reduction by employing two-dimensional differential gel electrophoresis (2D-DIGE) [49]. The S. platensis culture was
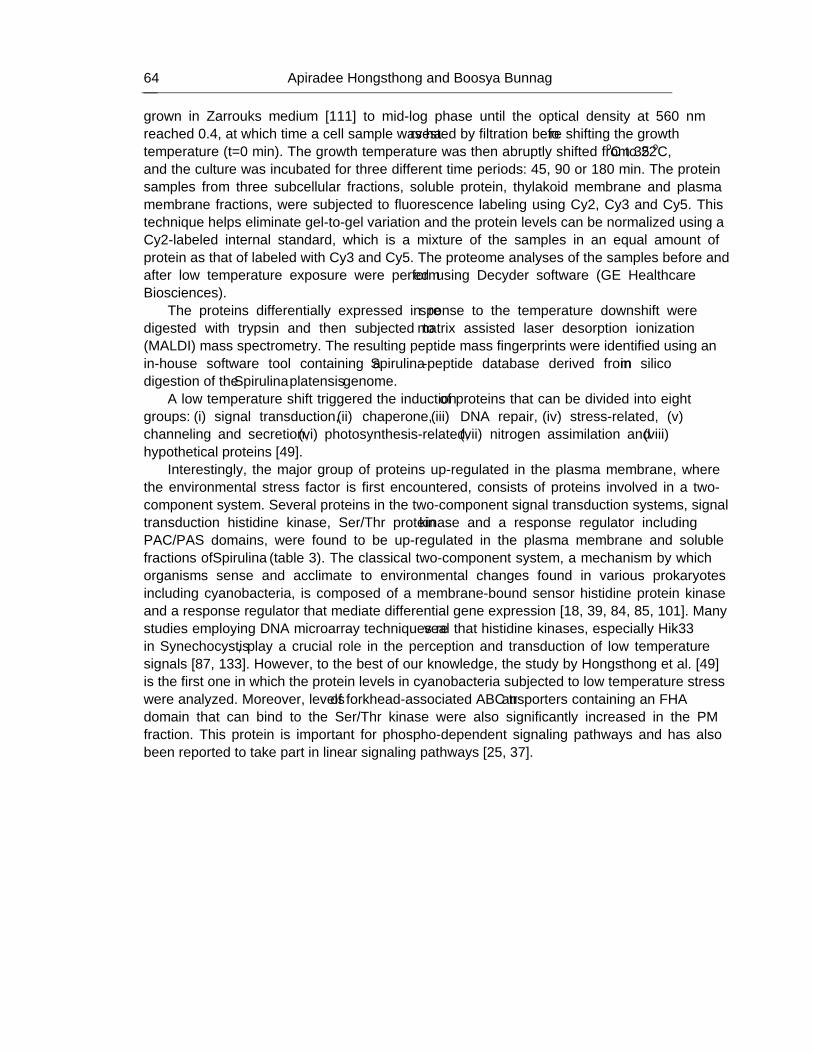
Apiradee Hongsthong and Boosya Bunnag 64
grown in Zarrouk’s medium [111] to mid-log phase until the optical density at 560 nm reached 0.4, at which time a cell sample was harvested by filtration before shifting the growth temperature (t=0 min). The growth temperature was then abruptly shifted from 35oC to 22oC, and the culture was incubated for three different time periods: 45, 90 or 180 min. The protein samples from three subcellular fractions, soluble protein, thylakoid membrane and plasma membrane fractions, were subjected to fluorescence labeling using Cy2, Cy3 and Cy5. This technique helps eliminate gel-to-gel variation and the protein levels can be normalized using a Cy2-labeled internal standard, which is a mixture of the samples in an equal amount of protein as that of labeled with Cy3 and Cy5. The proteome analyses of the samples before and after low temperature exposure were performed using Decyder software (GE Healthcare Biosciences).
The proteins differentially expressed in response to the temperature downshift were digested with trypsin and then subjected to matrix assisted laser desorption ionization (MALDI) mass spectrometry. The resulting peptide mass fingerprints were identified using an in-house software tool containing a Spirulina-peptide database derived from in silico digestion of the Spirulina platensis genome.
A low temperature shift triggered the induction of proteins that can be divided into eight groups: (i) signal transduction, (ii) chaperone, (iii) DNA repair, (iv) stress-related, (v) channeling and secretion, (vi) photosynthesis-related, (vii) nitrogen assimilation and (viii) hypothetical proteins [49].
Interestingly, the major group of proteins up-regulated in the plasma membrane, where the environmental stress factor is first encountered, consists of proteins involved in a two-component system. Several proteins in the two-component signal transduction systems, signal transduction histidine kinase, Ser/Thr protein kinase and a response regulator including PAC/PAS domains, were found to be up-regulated in the plasma membrane and soluble fractions of Spirulina (table 3). The classical two-component system, a mechanism by which organisms sense and acclimate to environmental changes found in various prokaryotes including cyanobacteria, is composed of a membrane-bound sensor histidine protein kinase and a response regulator that mediate differential gene expression [18, 39, 84, 85, 101]. Many studies employing DNA microarray techniques reveal that histidine kinases, especially Hik33 in Synechocystis, play a crucial role in the perception and transduction of low temperature signals [87, 133]. However, to the best of our knowledge, the study by Hongsthong et al. [49] is the first one in which the protein levels in cyanobacteria subjected to low temperature stress were analyzed. Moreover, levels of forkhead-associated ABC transporters containing an FHA domain that can bind to the Ser/Thr kinase were also significantly increased in the PM fraction. This protein is important for phospho-dependent signaling pathways and has also been reported to take part in linear signaling pathways [25, 37].
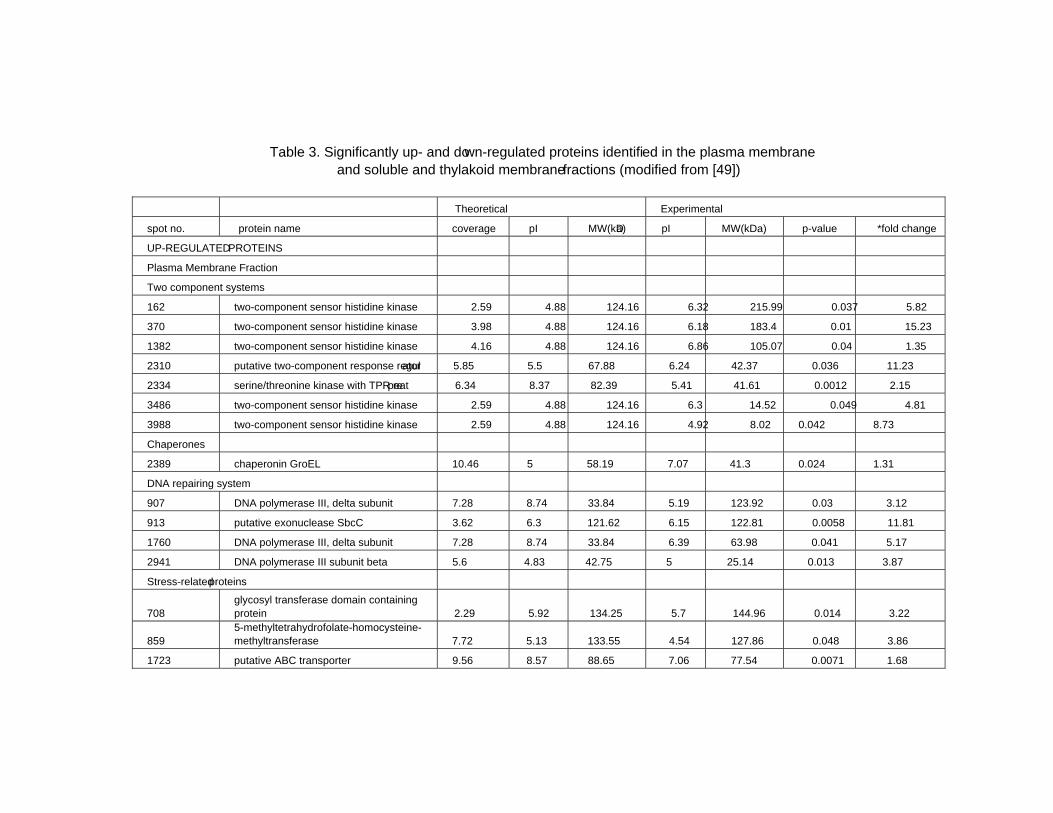
Table 3. Significantly up- and down-regulated proteins identified in the plasma membrane and soluble and thylakoid membrane fractions (modified from [49])
Theoretical Experimental
spot no. protein name coverage pI MW(kDa) pI MW(kDa) p-value *fold change
UP-REGULATED PROTEINS
Plasma Membrane Fraction
Two component systems
162 two-component sensor histidine kinase 2.59 4.88 124.16 6.32 215.99 0.037 5.82
370 two-component sensor histidine kinase 3.98 4.88 124.16 6.18 183.4 0.01 15.23
1382 two-component sensor histidine kinase 4.16 4.88 124.16 6.86 105.07 0.04 1.35
2310 putative two-component response regulator 5.85 5.5 67.88 6.24 42.37 0.036 11.23
2334 serine/threonine kinase with TPR repeat 6.34 8.37 82.39 5.41 41.61 0.0012 2.15
3486 two-component sensor histidine kinase 2.59 4.88 124.16 6.3 14.52 0.049 4.81
3988 two-component sensor histidine kinase 2.59 4.88 124.16 4.92 8.02 0.042 8.73
Chaperones
2389 chaperonin GroEL 10.46 5 58.19 7.07 41.3 0.024 1.31
DNA repairing system
907 DNA polymerase III, delta subunit 7.28 8.74 33.84 5.19 123.92 0.03 3.12
913 putative exonuclease SbcC 3.62 6.3 121.62 6.15 122.81 0.0058 11.81
1760 DNA polymerase III, delta subunit 7.28 8.74 33.84 6.39 63.98 0.041 5.17
2941 DNA polymerase III subunit beta 5.6 4.83 42.75 5 25.14 0.013 3.87
Stress-related proteins
708 glycosyl transferase domain containing protein 2.29 5.92 134.25 5.7 144.96 0.014 3.22
859 5-methyltetrahydrofolate-homocysteine- methyltransferase 7.72 5.13 133.55 4.54 127.86 0.048 3.86
1723 putative ABC transporter 9.56 8.57 88.65 7.06 77.54 0.0071 1.68
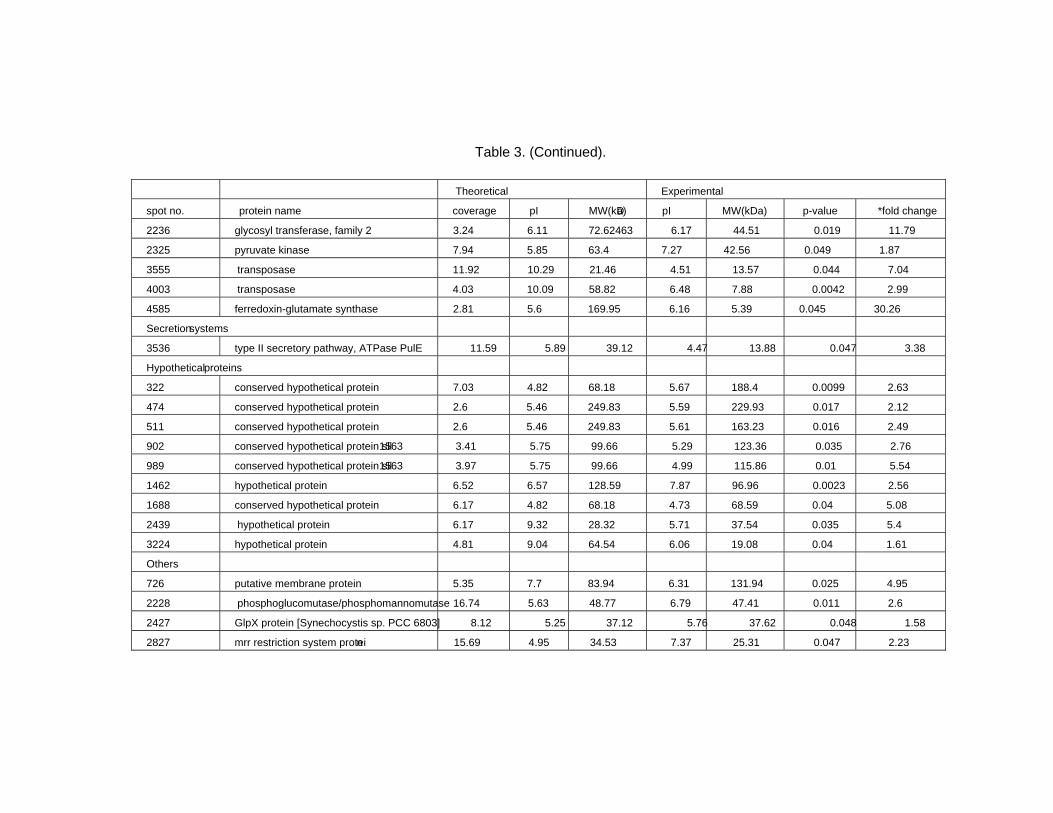
Table 3. (Continued).
Theoretical Experimental
spot no. protein name coverage pI MW(kDa) pI MW(kDa) p-value *fold change
2236 glycosyl transferase, family 2 3.24 6.11 72.62463 6.17 44.51 0.019 11.79
2325 pyruvate kinase 7.94 5.85 63.4 7.27 42.56 0.049 1.87
3555 transposase 11.92 10.29 21.46 4.51 13.57 0.044 7.04
4003 transposase 4.03 10.09 58.82 6.48 7.88 0.0042 2.99
4585 ferredoxin-glutamate synthase 2.81 5.6 169.95 6.16 5.39 0.045 30.26
Secretion systems
3536 type II secretory pathway, ATPase PulE 11.59 5.89 39.12 4.47 13.88 0.047 3.38
Hypothetical proteins
322 conserved hypothetical protein 7.03 4.82 68.18 5.67 188.4 0.0099 2.63
474 conserved hypothetical protein 2.6 5.46 249.83 5.59 229.93 0.017 2.12
511 conserved hypothetical protein 2.6 5.46 249.83 5.61 163.23 0.016 2.49
902 conserved hypothetical protein sll1563 3.41 5.75 99.66 5.29 123.36 0.035 2.76
989 conserved hypothetical protein sll1563 3.97 5.75 99.66 4.99 115.86 0.01 5.54
1462 hypothetical protein 6.52 6.57 128.59 7.87 96.96 0.0023 2.56
1688 conserved hypothetical protein 6.17 4.82 68.18 4.73 68.59 0.04 5.08
2439 hypothetical protein 6.17 9.32 28.32 5.71 37.54 0.035 5.4
3224 hypothetical protein 4.81 9.04 64.54 6.06 19.08 0.04 1.61
Others
726 putative membrane protein 5.35 7.7 83.94 6.31 131.94 0.025 4.95
2228 phosphoglucomutase/phosphomannomutase 16.74 5.63 48.77 6.79 47.41 0.011 2.6
2427 GlpX protein [Synechocystis sp. PCC 6803] 8.12 5.25 37.12 5.76 37.62 0.048 1.58
2827 mrr restriction system protein 15.69 4.95 34.53 7.37 25.31 0.047 2.23
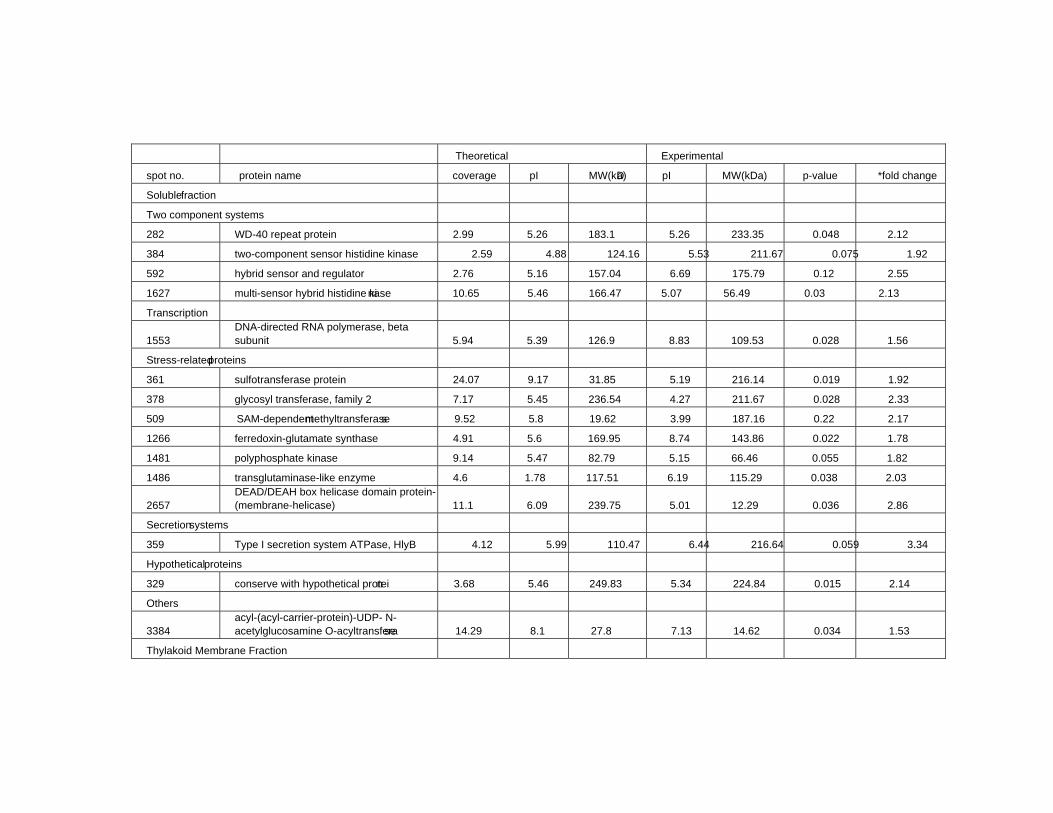
Theoretical Experimental
spot no. protein name coverage pI MW(kDa) pI MW(kDa) p-value *fold change
Soluble fraction
Two component systems
282 WD-40 repeat protein 2.99 5.26 183.1 5.26 233.35 0.048 2.12
384 two-component sensor histidine kinase 2.59 4.88 124.16 5.53 211.67 0.075 1.92
592 hybrid sensor and regulator 2.76 5.16 157.04 6.69 175.79 0.12 2.55
1627 multi-sensor hybrid histidine kinase 10.65 5.46 166.47 5.07 56.49 0.03 2.13
Transcription
1553 DNA-directed RNA polymerase, beta subunit 5.94 5.39 126.9 8.83 109.53 0.028 1.56
Stress-related proteins
361 sulfotransferase protein 24.07 9.17 31.85 5.19 216.14 0.019 1.92
378 glycosyl transferase, family 2 7.17 5.45 236.54 4.27 211.67 0.028 2.33
509 SAM-dependent methyltransferases 9.52 5.8 19.62 3.99 187.16 0.22 2.17
1266 ferredoxin-glutamate synthase 4.91 5.6 169.95 8.74 143.86 0.022 1.78
1481 polyphosphate kinase 9.14 5.47 82.79 5.15 66.46 0.055 1.82
1486 transglutaminase-like enzyme 4.6 1.78 117.51 6.19 115.29 0.038 2.03
2657 DEAD/DEAH box helicase domain protein- (membrane-helicase) 11.1 6.09 239.75 5.01 12.29 0.036 2.86
Secretion systems
359 Type I secretion system ATPase, HlyB 4.12 5.99 110.47 6.44 216.64 0.059 3.34
Hypothetical proteins
329 conserve with hypothetical protein 3.68 5.46 249.83 5.34 224.84 0.015 2.14
Others
3384 acyl-(acyl-carrier-protein)-UDP- N-acetylglucosamine O-acyltransferase 14.29 8.1 27.8 7.13 14.62 0.034 1.53
Thylakoid Membrane Fraction
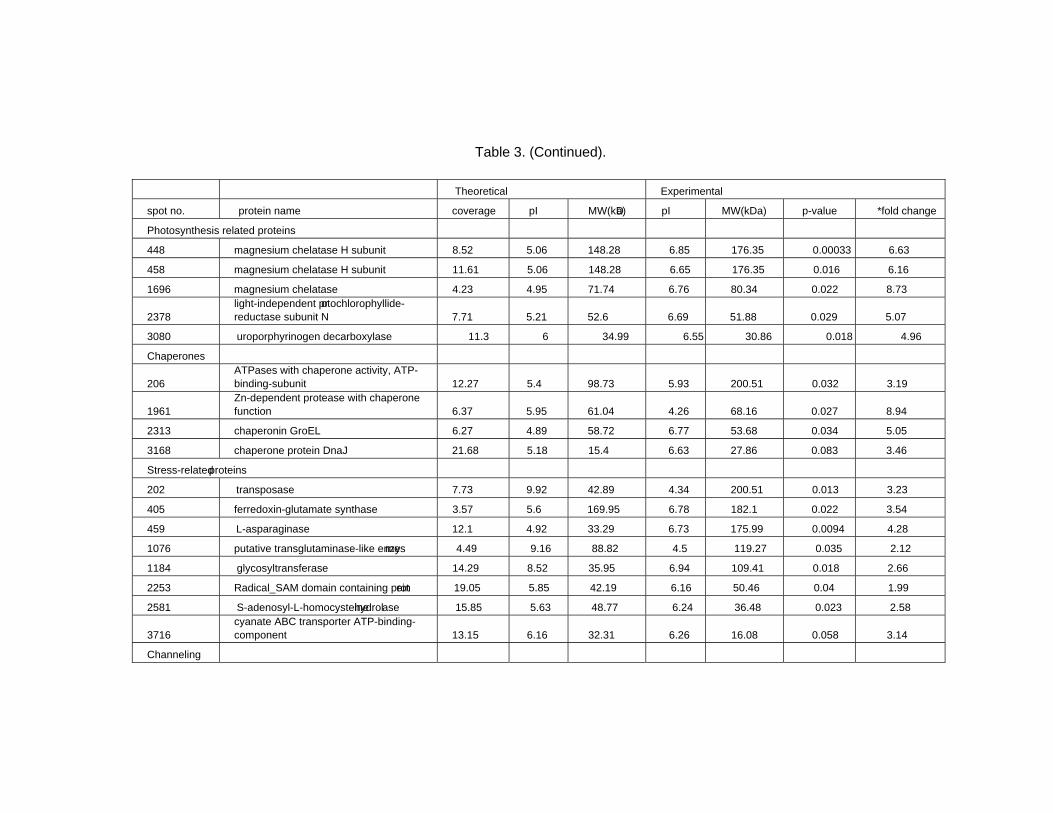
Table 3. (Continued).
Theoretical Experimental
spot no. protein name coverage pI MW(kDa) pI MW(kDa) p-value *fold change
Photosynthesis related proteins
448 magnesium chelatase H subunit 8.52 5.06 148.28 6.85 176.35 0.00033 6.63
458 magnesium chelatase H subunit 11.61 5.06 148.28 6.65 176.35 0.016 6.16
1696 magnesium chelatase 4.23 4.95 71.74 6.76 80.34 0.022 8.73
2378 light-independent protochlorophyllide- reductase subunit N 7.71 5.21 52.6 6.69 51.88 0.029 5.07
3080 uroporphyrinogen decarboxylase 11.3 6 34.99 6.55 30.86 0.018 4.96
Chaperones
206 ATPases with chaperone activity, ATP-binding-subunit 12.27 5.4 98.73 5.93 200.51 0.032 3.19
1961 Zn-dependent protease with chaperone function 6.37 5.95 61.04 4.26 68.16 0.027 8.94
2313 chaperonin GroEL 6.27 4.89 58.72 6.77 53.68 0.034 5.05
3168 chaperone protein DnaJ 21.68 5.18 15.4 6.63 27.86 0.083 3.46
Stress-related proteins
202 transposase 7.73 9.92 42.89 4.34 200.51 0.013 3.23
405 ferredoxin-glutamate synthase 3.57 5.6 169.95 6.78 182.1 0.022 3.54
459 L-asparaginase 12.1 4.92 33.29 6.73 175.99 0.0094 4.28
1076 putative transglutaminase-like enzymes 4.49 9.16 88.82 4.5 119.27 0.035 2.12
1184 glycosyltransferase 14.29 8.52 35.95 6.94 109.41 0.018 2.66
2253 Radical_SAM domain containing protein 19.05 5.85 42.19 6.16 50.46 0.04 1.99
2581 S-adenosyl-L-homocysteine hydrolase 15.85 5.63 48.77 6.24 36.48 0.023 2.58
3716 cyanate ABC transporter ATP-binding- component 13.15 6.16 32.31 6.26 16.08 0.058 3.14
Channeling
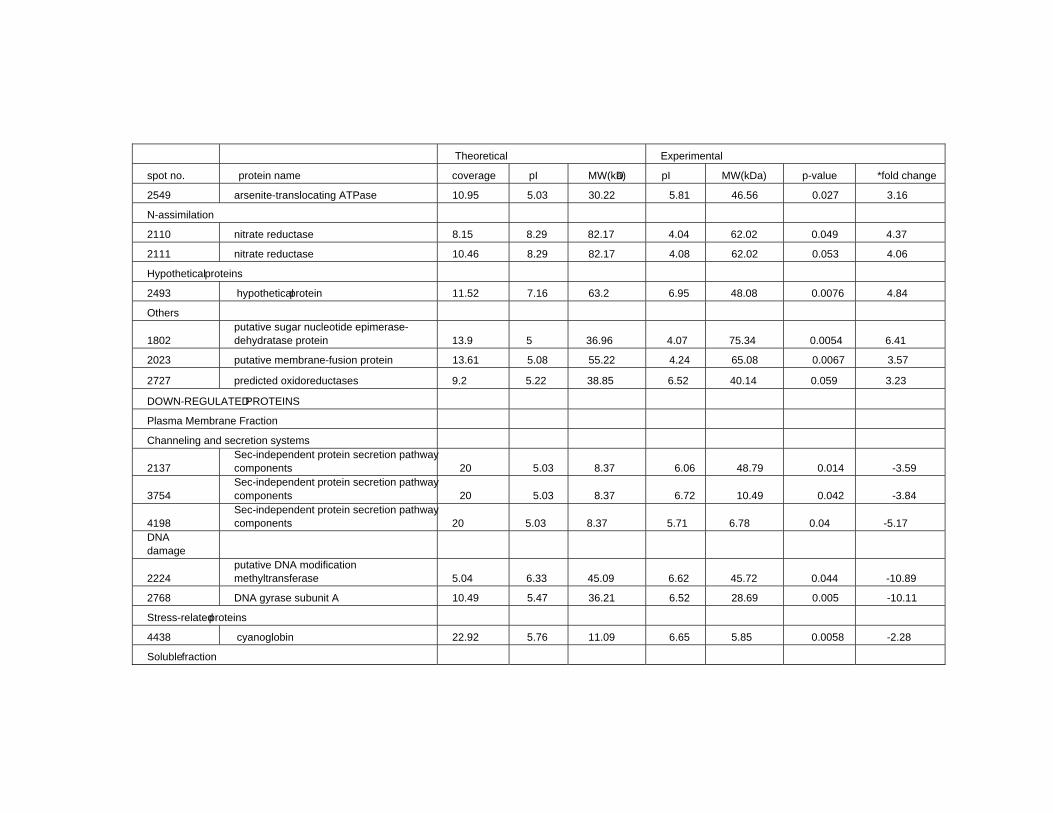
Theoretical Experimental
spot no. protein name coverage pI MW(kDa) pI MW(kDa) p-value *fold change
2549 arsenite-translocating ATPase 10.95 5.03 30.22 5.81 46.56 0.027 3.16
N-assimilation
2110 nitrate reductase 8.15 8.29 82.17 4.04 62.02 0.049 4.37
2111 nitrate reductase 10.46 8.29 82.17 4.08 62.02 0.053 4.06
Hypothetical proteins
2493 hypothetical protein 11.52 7.16 63.2 6.95 48.08 0.0076 4.84
Others
1802 putative sugar nucleotide epimerase- dehydratase protein 13.9 5 36.96 4.07 75.34 0.0054 6.41
2023 putative membrane-fusion protein 13.61 5.08 55.22 4.24 65.08 0.0067 3.57
2727 predicted oxidoreductases 9.2 5.22 38.85 6.52 40.14 0.059 3.23
DOWN-REGULATED PROTEINS
Plasma Membrane Fraction
Channeling and secretion systems
2137 Sec-independent protein secretion pathway components 20 5.03 8.37 6.06 48.79 0.014 -3.59
3754 Sec-independent protein secretion pathway components 20 5.03 8.37 6.72 10.49 0.042 -3.84
4198 Sec-independent protein secretion pathway components 20 5.03 8.37 5.71 6.78 0.04 -5.17
DNA damage
2224 putative DNA modification methyltransferase 5.04 6.33 45.09 6.62 45.72 0.044 -10.89
2768 DNA gyrase subunit A 10.49 5.47 36.21 6.52 28.69 0.005 -10.11
Stress-related proteins
4438 cyanoglobin 22.92 5.76 11.09 6.65 5.85 0.0058 -2.28
Soluble fraction
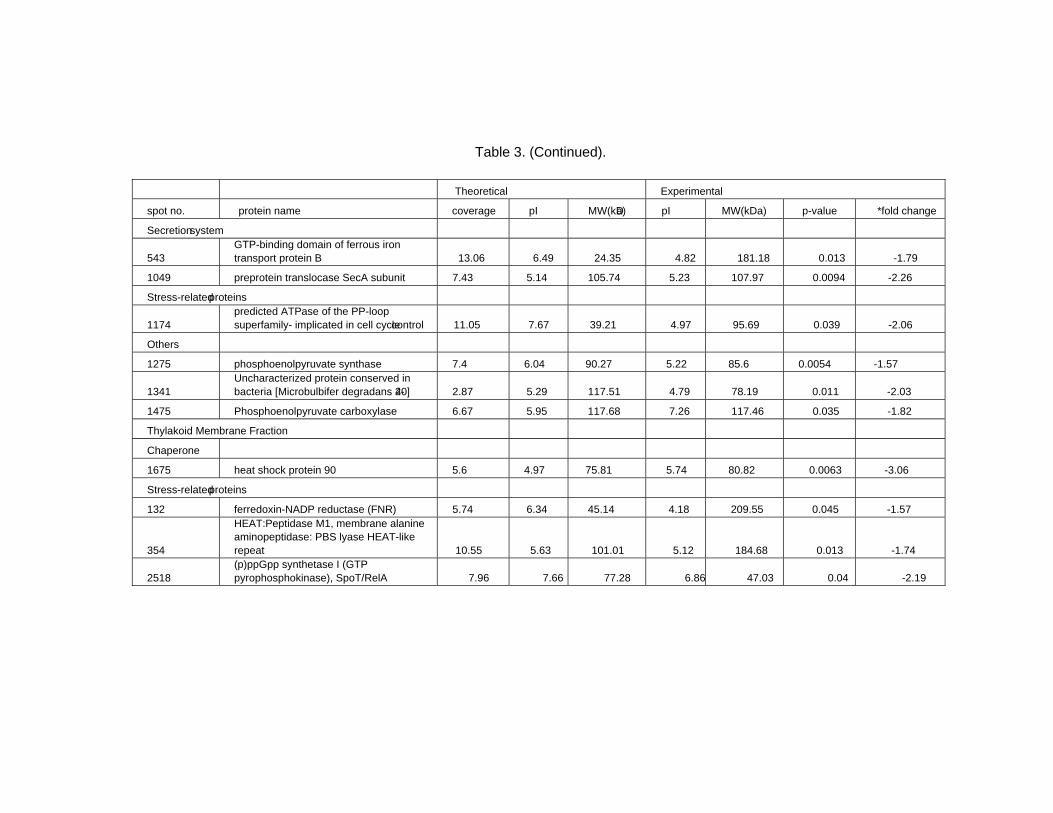
Table 3. (Continued).
Theoretical Experimental
spot no. protein name coverage pI MW(kDa) pI MW(kDa) p-value *fold change
Secretion system
543 GTP-binding domain of ferrous iron transport protein B 13.06 6.49 24.35 4.82 181.18 0.013 -1.79
1049 preprotein translocase SecA subunit 7.43 5.14 105.74 5.23 107.97 0.0094 -2.26
Stress-related proteins
1174 predicted ATPase of the PP-loop superfamily- implicated in cell cycle control 11.05 7.67 39.21 4.97 95.69 0.039 -2.06
Others
1275 phosphoenolpyruvate synthase 7.4 6.04 90.27 5.22 85.6 0.0054 -1.57
1341 Uncharacterized protein conserved in bacteria [Microbulbifer degradans 2-40] 2.87 5.29 117.51 4.79 78.19 0.011 -2.03
1475 Phosphoenolpyruvate carboxylase 6.67 5.95 117.68 7.26 117.46 0.035 -1.82
Thylakoid Membrane Fraction
Chaperone
1675 heat shock protein 90 5.6 4.97 75.81 5.74 80.82 0.0063 -3.06
Stress-related proteins
132 ferredoxin-NADP reductase (FNR) 5.74 6.34 45.14 4.18 209.55 0.045 -1.57
354
HEAT:Peptidase M1, membrane alanine aminopeptidase: PBS lyase HEAT-like repeat 10.55 5.63 101.01 5.12 184.68 0.013 -1.74
2518 (p)ppGpp synthetase I (GTP pyrophosphokinase), SpoT/RelA 7.96 7.66 77.28 6.86 47.03 0.04 -2.19
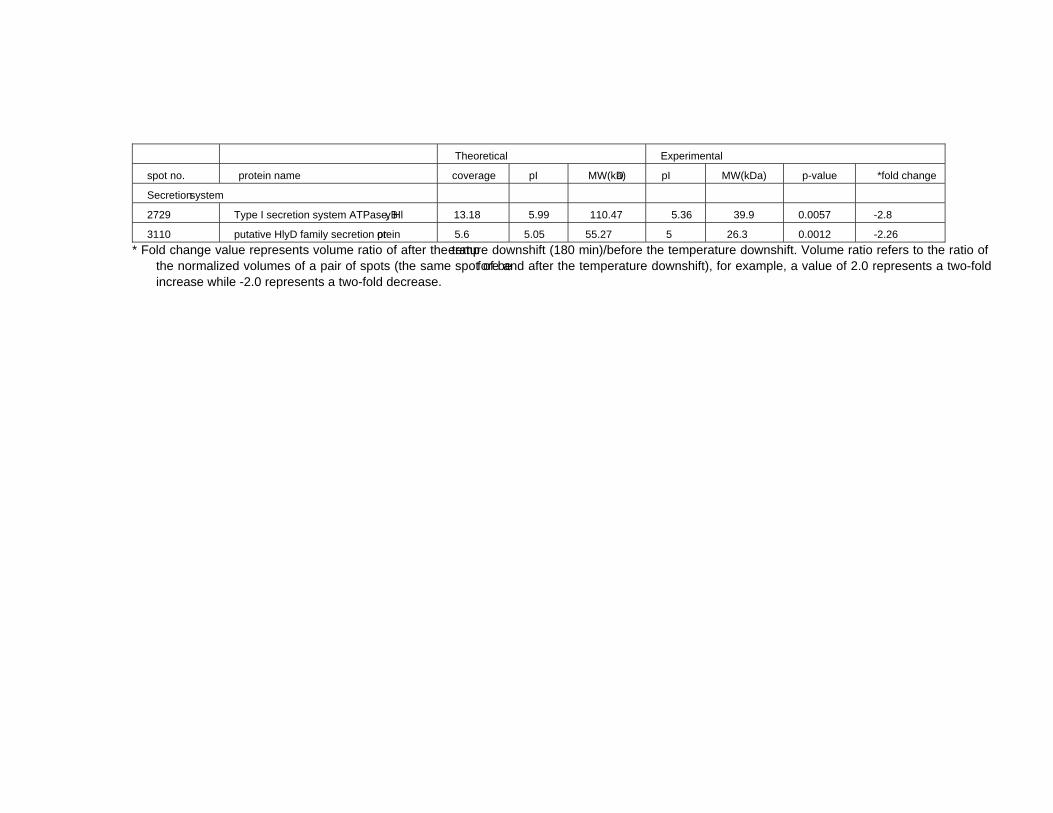
Theoretical Experimental
spot no. protein name coverage pI MW(kDa) pI MW(kDa) p-value *fold change
Secretion system
2729 Type I secretion system ATPase, HlyB 13.18 5.99 110.47 5.36 39.9 0.0057 -2.8
3110 putative HlyD family secretion protein 5.6 5.05 55.27 5 26.3 0.0012 -2.26 * Fold change value represents volume ratio of after the temperature downshift (180 min)/before the temperature downshift. Volume ratio refers to the ratio of
the normalized volumes of a pair of spots (the same spot of before and after the temperature downshift), for example, a value of 2.0 represents a two-fold increase while -2.0 represents a two-fold decrease.
Apiradee Hongsthong and Boosya Bunnag 72
Taken together, the results suggest that the cold signal is perceived through the two-component regulatory systems found in the plasma membrane and soluble fractions, when S. platensis cells are exposed to low temperature. While other sensory input domains (e.g., CACHE, Ca2+ channels and chemotaxis receptor; GAF, cGMP phosphodiesterase adenylate cyclase FhlA; MCP, methyl-accepting chemotaxis protein; USP, universal stress protein and phytochrome) are present in the Spirulina genome sequence, only the PAC/PAS sensory input domains of the two-component systems were detected in response to reduced temperature, suggesting an association of this type of sensory input domain of the signal transduction system with the low temperature stress response. Following this association, an alteration occurs in the expression of many genes. The evidence obtained in this study indicates that the cellular response of Spirulina to low temperature involves various processes. The processes related to RNA and DNA structures, as well as de novo protein synthesis, involve destabilization of cold-stabilized RNA secondary structures to facilitate gene expression under low temperatures, DNA damage, DNA repair and chaperone function in de novo protein folding of newly synthesized polypeptides.
In addition, two chlorophyll biosynthetic proteins, POR and ChlI, detected in the thylakoid membrane exhibit unique expression patterns. The levels of these proteins immediately decreased during the first 45 min of exposure to low temperature, which is consistent with the report by Tewari and Tripathy [136]. On the contrary, their expression levels increased dramatically after 45 min, indicating the relevance of the photosynthetic proteins in Spirulina in the organism’s response to low temperature stress in the presence of light.
In addition, it is noteworthy that this is the first report in which genome-based protein identification in S. platensis by peptide mass fingerprinting was performed using the database derived from the unpublished Spirulina genome sequence. This study is an attempt to understand the changes of various cellular mechanisms mediated by temperature reduction, which is a suitable condition for polyunsaturated fatty acid (PUFA) biosynthesis. However, data verification at the transcriptional level of some differentially expressed genes is currently underway.
B. High Temperature Stress
In cyanobacteria, gene regulation mediated by high temperature stress has been studied less extensively than the response of the organism to low temperature stress. However, in some cyanobacteria such as Synechocystis, Synechococcus and Nostoc, the heat shock responses have been investigated [31, 33, 66]. These studies demonstrated that an alternative sigma factor (SigH) and heat-shock protein (HSP) were significantly induced immediately following exposure to heat stress [54, 67]. In the case of Spirulina, the studies regarding the molecular level response mediated by high temperature stress were carried out, and the details are discussed as follows.
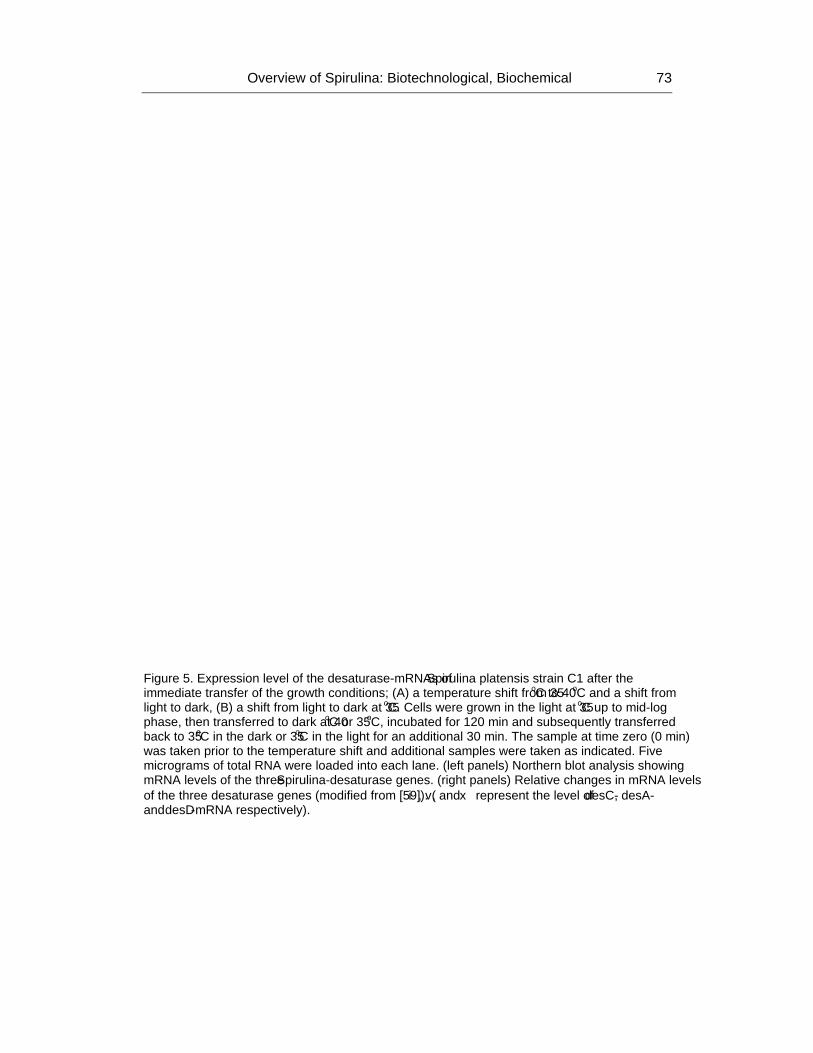
Overview of Spirulina: Biotechnological, Biochemical… 73
Figure 5. Expression level of the desaturase-mRNAs of Spirulina platensis strain C1 after the immediate transfer of the growth conditions; (A) a temperature shift from 35oC to 40oC and a shift from light to dark, (B) a shift from light to dark at 35oC. Cells were grown in the light at 35oC up to mid-log phase, then transferred to dark at 40oC or 35oC, incubated for 120 min and subsequently transferred back to 35oC in the dark or 35oC in the light for an additional 30 min. The sample at time zero (0 min) was taken prior to the temperature shift and additional samples were taken as indicated. Five micrograms of total RNA were loaded into each lane. (left panels) Northern blot analysis showing mRNA levels of the three Spirulina-desaturase genes. (right panels) Relative changes in mRNA levels of the three desaturase genes (modified from [59]). (♦, ■, and ▲ represent the level of desC-, desA- and desD-mRNA respectively).
Apiradee Hongsthong and Boosya Bunnag 74
Desaturase Gene Regulation under High Temperature Stress In contrast to the study on the regulation of Spirulina-desaturase genes in response to low
temperature change, the effects of high temperatures on the transcription of desaturase genes in Spirulina have been studied [27] by employing northern blot analysis of the RNA samples prepared from the cells harvested before (0 min) and after the temperature upshift for 10-120 min. In the presence of light, a temperature change from 35oC to 40oC did not significantly affect either the mRNA levels of the desC, desA and desD genes or the stability of the desD-mRNA [27]. In contrast, when the culture was shifted to 40oC in the dark, the mRNAs of all three desaturase genes disappeared after incubation for 120 min (figure 5). It is worth noting that the desC-mRNA gradually decreased after 20 min of exposure, before virtually disappearing at 120 min after incubation, while the desA- and desD-mRNAs drastically decreased after 10 min of the shift and disappeared after 20 min.
To study the expression levels of these desaturase-mRNAs after exposure to high temperatures in dark conditions, the culture was transferred back to the original temperature, 35oC, and kept again in the dark. When the culture was shifted back from 40oC to 35oC, the desC- and desD-mRNA levels increased about twofold, while the desA-mRNA level remained absent after the transfer back from 40oC to 35oC in dark conditions (figure 5).
Figures 5a and b show that the probes used in the northern blot analysis are specific for the detection of desC, desA and desD genes and that the detected bands correspond to 1.5, 1.5 and 1.4 kb transcripts. However, we note that for desA-mRNA, two hybridization bands of 1.7 and 1.5 kb were found [132]. The primary desA-mRNA product, the 1.5 kb variant, might be a result of post-transcriptional cleavage.
To study the effect of light on the recovery of the desaturase-mRNAs, the mRNA levels for these three desaturase genes in the culture, which was originally grown at 35oC in the light and subsequently transferred to the dark for 120 min before being shifted back to the light, were determined (figure 5b). The results showed that light can induce the recovery of all the desaturase-mRNAs. The desC-, desA- and desD-mRNA expression levels showed a recovery rate of about 25%, 68% and 29% of the original mRNA levels prior to the treatment, indicating light-inducible recovery of the three desaturase expressions.
To elucidate the effects of temperature change and darkness on the stability of the three desaturase-mRNAs, a study to determine the half-life of the desaturase-mRNAs was conducted. The rates of degradation of the desaturase-mRNAs are shown in figure 5, while the half-lives of the desaturase-mRNAs are shown in table 1. The results clearly illustrate that at 40oC in the dark, the half-life of the desC-mRNA showed a marginal decrease, while the desA- and desD-transcripts were not found at this high temperature.
Of note, there are no reported data concerning the translational and post-translational regulation of this particular gene in response to high temperature stress. However, the level of the polyunsaturated fatty acid, γ-linolenic acid (GLA), decreased approximately 30% upon high temperature exposure compared to the level found in cells grown at an optimal temperature (35oC) (table 2) [27]. This information highlights the regulation of Spirulina-Δ6 desaturase. Therefore, the next section will focus on the identification of the putative heat shock-responsive element and corresponding regulatory protein(s) that modulate desD gene expression in response to heat stress.
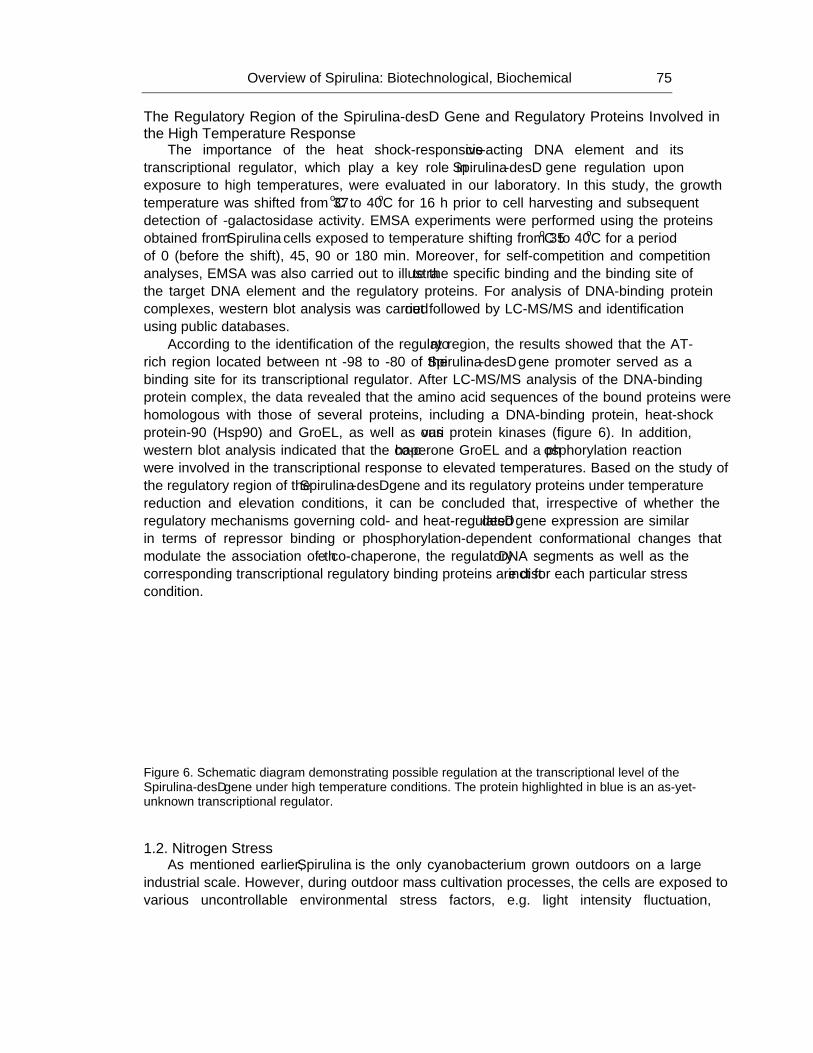
Overview of Spirulina: Biotechnological, Biochemical… 75
The Regulatory Region of the Spirulina-desD Gene and Regulatory Proteins Involved in the High Temperature Response
The importance of the heat shock-responsive cis-acting DNA element and its transcriptional regulator, which play a key role in Spirulina-desD gene regulation upon exposure to high temperatures, were evaluated in our laboratory. In this study, the growth temperature was shifted from 37oC to 40oC for 16 h prior to cell harvesting and subsequent detection of β-galactosidase activity. EMSA experiments were performed using the proteins obtained from Spirulina cells exposed to temperature shifting from 35oC to 40oC for a period of 0 (before the shift), 45, 90 or 180 min. Moreover, for self-competition and competition analyses, EMSA was also carried out to illustrate the specific binding and the binding site of the target DNA element and the regulatory proteins. For analysis of DNA-binding protein complexes, western blot analysis was carried out followed by LC-MS/MS and identification using public databases.
According to the identification of the regulatory region, the results showed that the AT-rich region located between nt -98 to -80 of the Spirulina-desD gene promoter served as a binding site for its transcriptional regulator. After LC-MS/MS analysis of the DNA-binding protein complex, the data revealed that the amino acid sequences of the bound proteins were homologous with those of several proteins, including a DNA-binding protein, heat-shock protein-90 (Hsp90) and GroEL, as well as various protein kinases (figure 6). In addition, western blot analysis indicated that the co-chaperone GroEL and a phosphorylation reaction were involved in the transcriptional response to elevated temperatures. Based on the study of the regulatory region of the Spirulina-desD gene and its regulatory proteins under temperature reduction and elevation conditions, it can be concluded that, irrespective of whether the regulatory mechanisms governing cold- and heat-regulated desD gene expression are similar in terms of repressor binding or phosphorylation-dependent conformational changes that modulate the association of the co-chaperone, the regulatory DNA segments as well as the corresponding transcriptional regulatory binding proteins are distinct for each particular stress condition.
Figure 6. Schematic diagram demonstrating possible regulation at the transcriptional level of the Spirulina-desD gene under high temperature conditions. The protein highlighted in blue is an as-yet-unknown transcriptional regulator.
1.2. Nitrogen Stress
As mentioned earlier, Spirulina is the only cyanobacterium grown outdoors on a large industrial scale. However, during outdoor mass cultivation processes, the cells are exposed to various uncontrollable environmental stress factors, e.g. light intensity fluctuation,
Apiradee Hongsthong and Boosya Bunnag 76
temperature stress and nitrogen deprivation. Hence, the problem of nitrogen deprivation is also important to the outdoor mass cultivation of Spirulina. A study in our “Algal biotechnology lab” at the King Mongkut’s University of Technology-thonburi of effects of nitrogen stress on the biochemical compositions in the cells, especially phycobilisomes [106], was carried out for a 120 h time period. The results show that under nitrogen deprivation conditions, the levels of phycocyanin (PC), allophycocyanin (AP) and chlorophyll a decreased drastically, whereas the cell growth in terms of dry weight was barely affected. Accordingly, the transcript levels of the genes encoding PC, AP and a linker protein, LCM
97, were significantly reduced. It is expected that the cells degrade their phycobilisome, which is the most abundant protein (up to 50% of soluble cellular protein) in cyanobacteria [121], to serve as a nitrogen source in response to nitrogen starvation [106]. Many research groups have reported the degradation of this light-harvesting antenna upon nutrient deprivation including nitrogen deprivation [8, 22, 125] in Synechococcus and Synechocystis. Thus, this degradation process is a general acclimation response that is observed under various stress conditions. Moreover, the phycobilisome degradation mechanism in cyanobacteria has been explored at the molecular level, and it was revealed that two components of the nbl pathway, NblA and NblB, are specifically involved in the degradation process (figure 7) [23, 29]. NblA has been widely demonstrated to be highly inducible upon nutrient starvation [6, 7, 23, 76, 78, 79, 110]. The study by Lahmi et al. indicated that during nitrogen starvation, lower levels of nblA and nblC transcripts, about 40-60% of the wild type, were detected in alanine dehydrogenase mutants [71], in which phycobilisome degradation was impaired only under nitrogen deprivation. The inactivation of alanine dehydrogenase activity leads to the inability to induce a number of genes, including general nutrient stress-related genes. Taken together, all this information suggests that mechanisms related to nitrogen stress responses in cyanobacteria are associated with the modulation of a general acclimation process [71].
Figure 7. Schematic diagram representing general acclimation responses to nutrient stress, including nitrogen stress, in a cyanobacterium, Synechococcus elongatus (modified from [121]). -S, -N, -P and HL represent deprivation of sulfur, nitrogen and phosphorus and high light conditions, respectively.
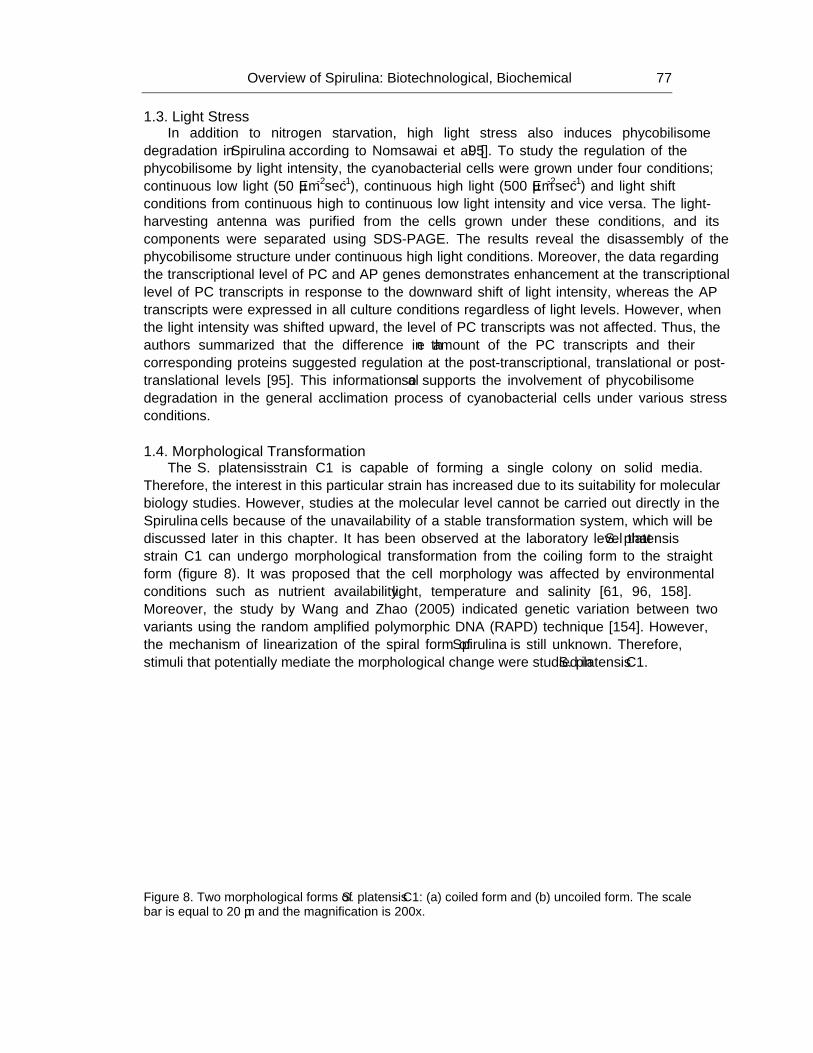
Overview of Spirulina: Biotechnological, Biochemical… 77
1.3. Light Stress In addition to nitrogen starvation, high light stress also induces phycobilisome
degradation in Spirulina according to Nomsawai et al. [95]. To study the regulation of the phycobilisome by light intensity, the cyanobacterial cells were grown under four conditions; continuous low light (50 µEm-2sec-1), continuous high light (500 µEm-2sec-1) and light shift conditions from continuous high to continuous low light intensity and vice versa. The light-harvesting antenna was purified from the cells grown under these conditions, and its components were separated using SDS-PAGE. The results reveal the disassembly of the phycobilisome structure under continuous high light conditions. Moreover, the data regarding the transcriptional level of PC and AP genes demonstrates enhancement at the transcriptional level of PC transcripts in response to the downward shift of light intensity, whereas the AP transcripts were expressed in all culture conditions regardless of light levels. However, when the light intensity was shifted upward, the level of PC transcripts was not affected. Thus, the authors summarized that the difference in the amount of the PC transcripts and their corresponding proteins suggested regulation at the post-transcriptional, translational or post-translational levels [95]. This information also supports the involvement of phycobilisome degradation in the general acclimation process of cyanobacterial cells under various stress conditions.
1.4. Morphological Transformation
The S. platensis strain C1 is capable of forming a single colony on solid media. Therefore, the interest in this particular strain has increased due to its suitability for molecular biology studies. However, studies at the molecular level cannot be carried out directly in the Spirulina cells because of the unavailability of a stable transformation system, which will be discussed later in this chapter. It has been observed at the laboratory level that S. platensis strain C1 can undergo morphological transformation from the coiling form to the straight form (figure 8). It was proposed that the cell morphology was affected by environmental conditions such as nutrient availability, light, temperature and salinity [61, 96, 158]. Moreover, the study by Wang and Zhao (2005) indicated genetic variation between two variants using the random amplified polymorphic DNA (RAPD) technique [154]. However, the mechanism of linearization of the spiral form of Spirulina is still unknown. Therefore, stimuli that potentially mediate the morphological change were studied in S. platensis C1.
Figure 8. Two morphological forms of S. platensis C1: (a) coiled form and (b) uncoiled form. The scale bar is equal to 20 µm and the magnification is 200x.
Apiradee Hongsthong and Boosya Bunnag 78
Alterations in growth medium concentration, light and temperature were introduced to the S. platensis C1 cells, in order to induce the morphological change from the coiling form to the uncoiling form. However, none of these stresses caused the transformation into the straight shape, while irregularly curved cells were detected [137]. According to this study, the linear variants of the S. platensis C1 occurred simultaneously with the spiral-form culture grown under laboratory conditions. In addition, there are many reports on the morphological change of this cyanobacterium. Abnormal morphologies such as irregularly curved and linear or straight shapes were found [74], and it is now accepted that the linear shape is one of the Spirulina morphologies [154]. The linear variant is rarely reverted, has a low metabolic rate and is highly acclimated to stress [60, 152]. While many studies have been carried out in order to understand the mechanism of linearization of the spiral form of Spirulina as mentioned above, the morphological transformation mechanism is still unknown. To address this, Hongsthong et al performed a study employing two-dimensional differential gel electrophoresis (2D-DIGE) [50]. The two forms of S. platensis C1 were separated and grown as axenic cultures, and the proteins that were differentially expressed in the soluble and insoluble protein fractions of the spiral and linear forms were identified.
The nineteen identified proteins from the two protein fractions that might be involved in the morphological transformation of Spirulina can be categorized into seven groups according to their function: (i) two proteins are involved in energy metabolism, (ii) three proteins are involved in translation, (iii) two proteins are involved in energy production and conversion, (iv) three proteins are transcription regulators, (v) one protein has acetyltransferase activity, (vi) two proteins are involved in pyrimidine metabolism, (vii) two proteins are involved in cell wall/cell envelope biogenesis and (viii) four proteins carry out other functions, including one receptor protein (table 4) [50].
In terms of stress related proteins, Ferric uptake regulators (Fur), arginine repressors, carbon dioxide concentrating mechanism proteins and ABC transporters were found to be up-regulated in the linear form. Fur is a repressor that regulates several iron responsive genes, including the genes involved in oxidative stress, iron homeostasis and central metabolism [45, 83]. The arginine repressor is a negative regulator that represses the expression of factors involved in the arginine biosynthetic pathway. The repressor also induces the arginine deaminase operon either under oxygen depletion or in the presence of arginine [77, 80, 131]. Moreover, it is worth noting that L-arginine can be utilized as both a carbon and nitrogen source under oxygen depletion and nutrient-limiting conditions [80, 155]. Therefore, the elevation in the levels of these proteins suggests that the linear form of Spirulina might be a cellular response to environmental stress, which supports a hypothesis proposed by many researchers [60, 61, 74, 152-154].
Regarding the induction of carbon dioxide concentrating mechanism proteins and ABC transporters, a low level of carbon dioxide in terms of total Ci, [CO2]/[O2] ratio and absolute CO2(aq) causes the induction of a CO2 concentrating mechanism or CCM [55, 63]. The CCM genes are light-responsive genes, whose expression has been suggested to be controlled by the intracellular redox level, although triggers for the CCM response are still unknown [55]. The parallel up-regulation of the CCM and ABC transporter proteins made sense since the transporter, including that in Synechocystis, plays a role in the uptake of bicarbonate and Ci against the concentration gradient, which is fueled by energy from photosystem I (PSI), in the acclimation of cells to low CO2 concentrations [53, 55, 97].
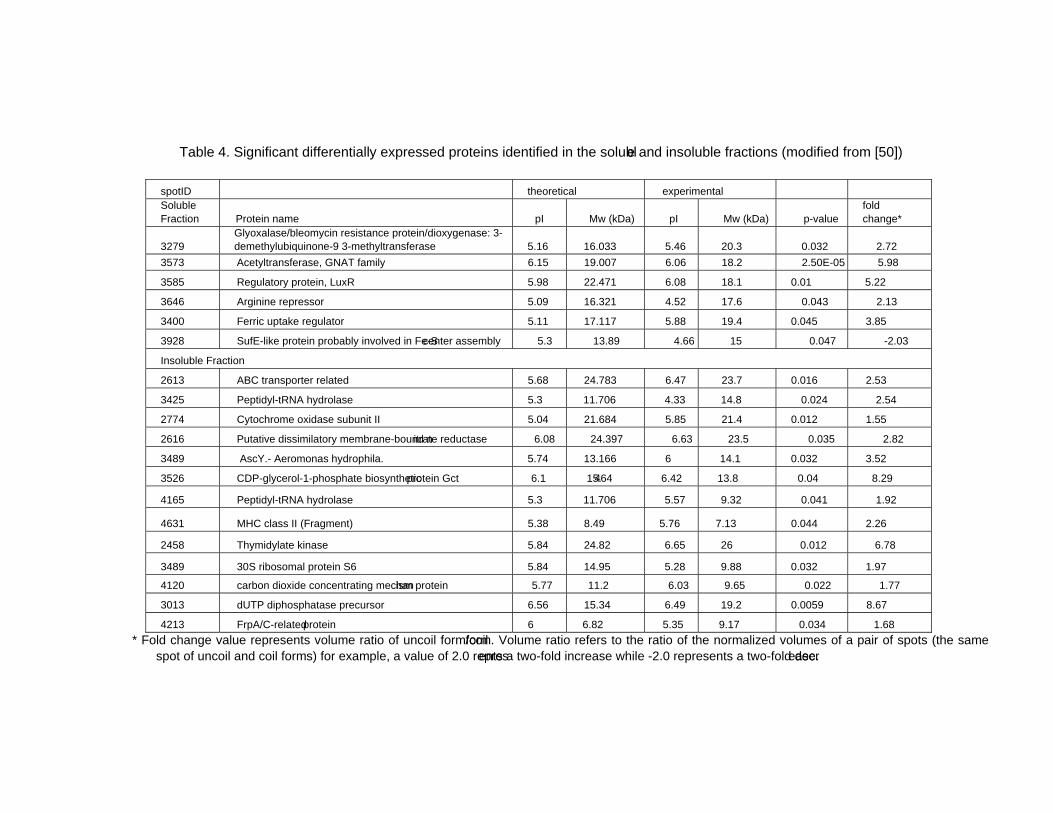
Table 4. Significant differentially expressed proteins identified in the soluble and insoluble fractions (modified from [50]) spotID theoretical experimental Soluble Fraction Protein name pI Mw (kDa) pI Mw (kDa) p-value
fold change*
3279 Glyoxalase/bleomycin resistance protein/dioxygenase: 3- demethylubiquinone-9 3-methyltransferase 5.16 16.033 5.46 20.3 0.032 2.72
3573 Acetyltransferase, GNAT family 6.15 19.007 6.06 18.2 2.50E-05 5.98
3585 Regulatory protein, LuxR 5.98 22.471 6.08 18.1 0.01 5.22
3646 Arginine repressor 5.09 16.321 4.52 17.6 0.043 2.13
3400 Ferric uptake regulator 5.11 17.117 5.88 19.4 0.045 3.85
3928 SufE-like protein probably involved in Fe-S center assembly 5.3 13.89 4.66 15 0.047 -2.03
Insoluble Fraction
2613 ABC transporter related 5.68 24.783 6.47 23.7 0.016 2.53
3425 Peptidyl-tRNA hydrolase 5.3 11.706 4.33 14.8 0.024 2.54
2774 Cytochrome oxidase subunit II 5.04 21.684 5.85 21.4 0.012 1.55
2616 Putative dissimilatory membrane-bound nitrate reductase 6.08 24.397 6.63 23.5 0.035 2.82
3489 AscY.- Aeromonas hydrophila. 5.74 13.166 6 14.1 0.032 3.52
3526 CDP-glycerol-1-phosphate biosynthetic protein Gct 6.1 15.464 6.42 13.8 0.04 8.29
4165 Peptidyl-tRNA hydrolase 5.3 11.706 5.57 9.32 0.041 1.92
4631 MHC class II (Fragment) 5.38 8.49 5.76 7.13 0.044 2.26
2458 Thymidylate kinase 5.84 24.82 6.65 26 0.012 6.78
3489 30S ribosomal protein S6 5.84 14.95 5.28 9.88 0.032 1.97
4120 carbon dioxide concentrating mechanism protein 5.77 11.2 6.03 9.65 0.022 1.77
3013 dUTP diphosphatase precursor 6.56 15.34 6.49 19.2 0.0059 8.67
4213 FrpA/C-related protein 6 6.82 5.35 9.17 0.034 1.68 * Fold change value represents volume ratio of uncoil form/coil form. Volume ratio refers to the ratio of the normalized volumes of a pair of spots (the same
spot of uncoil and coil forms) for example, a value of 2.0 represents a two-fold increase while -2.0 represents a two-fold decrease.
Apiradee Hongsthong and Boosya Bunnag 80
The linear form of Spirulina, in which the Fur protein was up-regulated, shows a reduction of SufE. The SufE protein has been detected in many organisms including a cyanobacterium, Synechocystis sp. PCC6803, and it accepts an S atom during the conversion of L-cysteine to L-alanine catalyzed by SufS and transfers it to iron to form an Fe-S cluster, which is important for some enzymatic activities [99, 138]. Moreover, it is noteworthy that the Suf operon is involved in iron-sulfur (Fe-S) cluster biosynthesis under (i) iron deprivation through loss of repression by Fur and (ii) stress conditions through the hydrogen peroxide sensor in which it forms a two-component cysteine desulfurase with SufS [99].
In terms of proteins involved in cell shape determination, the levels of CDP-glycerol-1-phosphate biosynthetic protein (Gct), and FrpA/C-related protein are elevated in the linear form. The Gct protein, which has cytidylyltransferase activity, catalyzes the reaction to produce a precursor in wall synthesis, CDP-glycerol [2, 103], whereas the FrpA/C-related protein is a putative peptidoglycan bound protein. It was reported that outer membrane proteins, as well as peptidoglycan, play a critical role in cell shape determination [46].
Accordingly, two conclusions can be drawn concerning the mechanism of morphological change. First, the differentially expressed protein results indicated for the first time that the morphological change of Spirulina is most likely induced by various environmental stresses. These environmental factors, including oxygen level, carbon dioxide level, and light and nutrient availability, might play critical roles in the induction of the cell shape alteration. This is in accordance with the observation by the same research group that the straight form appears in the coil form culture after growth of the culture under laboratory conditions, especially under static conditions for at least one month. Second, an alteration in the cell shape determination mechanism might lead to the transformation of the cell shape from spiral to linear forms. Thus, this study is the first to produce data at the protein level that may explain this morphological transformation in Spirulina.
2. Heterologous Expression Systems The primary challenge for molecular studies in Spirulina is the lack of a stable
transformation system. Heterologous expression systems are employed for this purpose. Two heterologous expression systems, Saccharomyces cerevisiae and Escherichia coli DH5α, have been used for studies at the molecular level of S. platensis. The details regarding the studies at the molecular level of Spirulina and the corresponding expression systems will be discussed in the following two sections.
2.1. Heterologous Hosts for Studies at the Molecular Level
Spirulina-desaturases are categorized as being a part of the family of acyl-lipid desaturases or plant-type desaturases [89], which are membrane-bound enzymes [90, 139]. The Spirulina desaturation reaction occurs mainly at the sn-1 position of the glycerolipid [89]. The difficulties in obtaining large quantities of purified membrane-bound proteins lead to this particular group of proteins being less well understood [122].
Several studies employing molecular biological approaches have been carried out, including studies involving Spirulina-desaturase genes and the two heterologous expression systems mentioned above. The first attempt has been made on the expression of the Spirulina-desD gene in S. cerevisiae in order to functionally characterize this gene. The Spirulina-desD
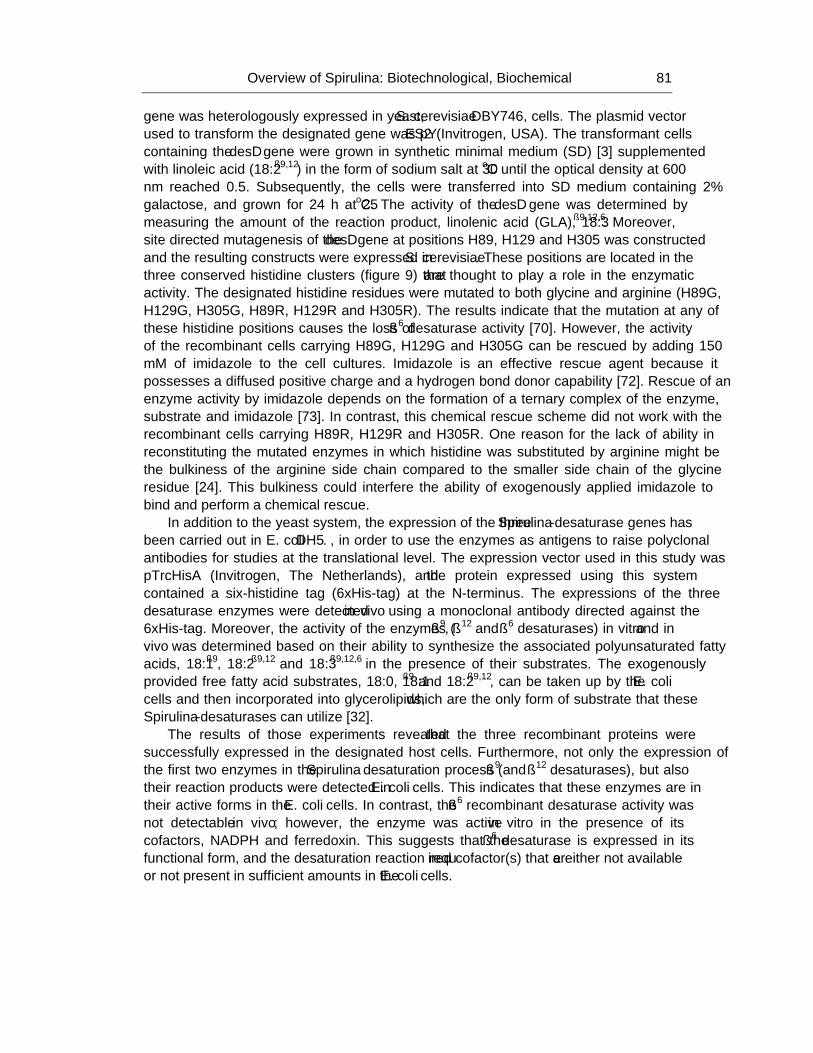
Overview of Spirulina: Biotechnological, Biochemical… 81
gene was heterologously expressed in yeast, S. cerevisiae DBY746, cells. The plasmid vector used to transform the designated gene was pYES2 (Invitrogen, USA). The transformant cells containing the desD gene were grown in synthetic minimal medium (SD) [3] supplemented with linoleic acid (18:2Δ9,12) in the form of sodium salt at 30oC until the optical density at 600 nm reached 0.5. Subsequently, the cells were transferred into SD medium containing 2% galactose, and grown for 24 h at 25oC. The activity of the desD gene was determined by measuring the amount of the reaction product, linolenic acid (GLA), 18:3Δ9,12,6. Moreover, site directed mutagenesis of the desD gene at positions H89, H129 and H305 was constructed and the resulting constructs were expressed in S. cerevisiae. These positions are located in the three conserved histidine clusters (figure 9) that are thought to play a role in the enzymatic activity. The designated histidine residues were mutated to both glycine and arginine (H89G, H129G, H305G, H89R, H129R and H305R). The results indicate that the mutation at any of these histidine positions causes the loss of Δ6 desaturase activity [70]. However, the activity of the recombinant cells carrying H89G, H129G and H305G can be rescued by adding 150 mM of imidazole to the cell cultures. Imidazole is an effective rescue agent because it possesses a diffused positive charge and a hydrogen bond donor capability [72]. Rescue of an enzyme activity by imidazole depends on the formation of a ternary complex of the enzyme, substrate and imidazole [73]. In contrast, this chemical rescue scheme did not work with the recombinant cells carrying H89R, H129R and H305R. One reason for the lack of ability in reconstituting the mutated enzymes in which histidine was substituted by arginine might be the bulkiness of the arginine side chain compared to the smaller side chain of the glycine residue [24]. This bulkiness could interfere the ability of exogenously applied imidazole to bind and perform a chemical rescue.
In addition to the yeast system, the expression of the three Spirulina-desaturase genes has been carried out in E. coli DH5α, in order to use the enzymes as antigens to raise polyclonal antibodies for studies at the translational level. The expression vector used in this study was pTrcHisA (Invitrogen, The Netherlands), and the protein expressed using this system contained a six-histidine tag (6xHis-tag) at the N-terminus. The expressions of the three desaturase enzymes were detected in vivo using a monoclonal antibody directed against the 6xHis-tag. Moreover, the activity of the enzymes (Δ9, Δ12 and Δ6 desaturases) in vitro and in vivo was determined based on their ability to synthesize the associated polyunsaturated fatty acids, 18:1Δ9, 18:2Δ9,12 and 18:3Δ9,12,6 in the presence of their substrates. The exogenously provided free fatty acid substrates, 18:0, 18:1Δ9 and 18:2Δ9,12, can be taken up by the E. coli cells and then incorporated into glycerolipids, which are the only form of substrate that these Spirulina-desaturases can utilize [32].
The results of those experiments revealed that the three recombinant proteins were successfully expressed in the designated host cells. Furthermore, not only the expression of the first two enzymes in the Spirulina desaturation process (Δ9 and Δ12 desaturases), but also their reaction products were detected in E. coli cells. This indicates that these enzymes are in their active forms in the E. coli cells. In contrast, the Δ6 recombinant desaturase activity was not detectable in vivo; however, the enzyme was active in vitro in the presence of its cofactors, NADPH and ferredoxin. This suggests that the Δ6 desaturase is expressed in its functional form, and the desaturation reaction required cofactor(s) that are either not available or not present in sufficient amounts in the E. coli cells.

Apiradee Hongsthong and Boosya Bunnag 82
Figure 9. Continued on next page.
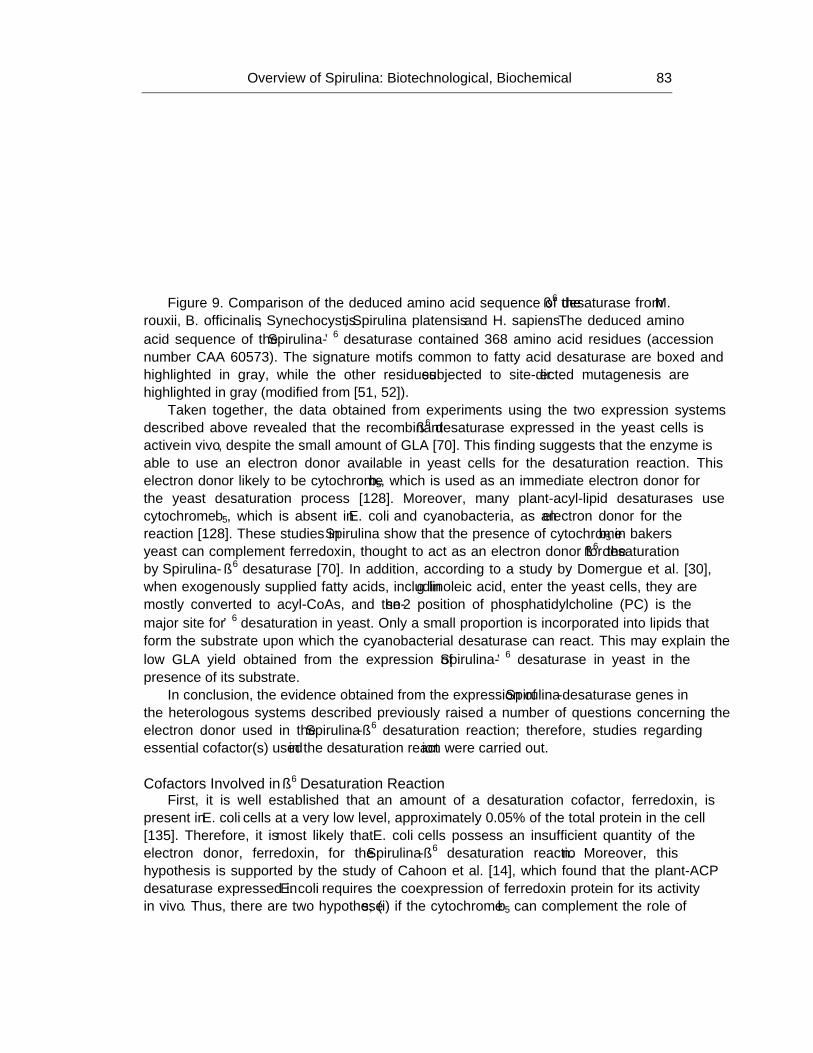
Overview of Spirulina: Biotechnological, Biochemical… 83
Figure 9. Comparison of the deduced amino acid sequence of the Δ6 desaturase from M. rouxii, B. officinalis, Synechocystis, Spirulina platensis and H. sapiens. The deduced amino acid sequence of the Spirulina-Δ6 desaturase contained 368 amino acid residues (accession number CAA 60573). The signature motifs common to fatty acid desaturase are boxed and highlighted in gray, while the other residues subjected to site-directed mutagenesis are highlighted in gray (modified from [51, 52]).
Taken together, the data obtained from experiments using the two expression systems described above revealed that the recombinant Δ6 desaturase expressed in the yeast cells is active in vivo, despite the small amount of GLA [70]. This finding suggests that the enzyme is able to use an electron donor available in yeast cells for the desaturation reaction. This electron donor likely to be cytochrome b5, which is used as an immediate electron donor for the yeast desaturation process [128]. Moreover, many plant-acyl-lipid desaturases use cytochrome b5, which is absent in E. coli and cyanobacteria, as an electron donor for the reaction [128]. These studies in Spirulina show that the presence of cytochrome b5 in baker’s yeast can complement ferredoxin, thought to act as an electron donor for the Δ6 desaturation by Spirulina- Δ6 desaturase [70]. In addition, according to a study by Domergue et al. [30], when exogenously supplied fatty acids, including linoleic acid, enter the yeast cells, they are mostly converted to acyl-CoAs, and the sn-2 position of phosphatidylcholine (PC) is the major site for Δ6 desaturation in yeast. Only a small proportion is incorporated into lipids that form the substrate upon which the cyanobacterial desaturase can react. This may explain the low GLA yield obtained from the expression of Spirulina-Δ6 desaturase in yeast in the presence of its substrate.
In conclusion, the evidence obtained from the expression of Spirulina-desaturase genes in the heterologous systems described previously raised a number of questions concerning the electron donor used in the Spirulina-Δ6 desaturation reaction; therefore, studies regarding essential cofactor(s) used in the desaturation reaction were carried out.
Cofactors Involved in Δ6 Desaturation Reaction
First, it is well established that an amount of a desaturation cofactor, ferredoxin, is present in E. coli cells at a very low level, approximately 0.05% of the total protein in the cell [135]. Therefore, it is most likely that E. coli cells possess an insufficient quantity of the electron donor, ferredoxin, for the Spirulina-Δ6 desaturation reaction. Moreover, this hypothesis is supported by the study of Cahoon et al. [14], which found that the plant-ACP desaturase expressed in E. coli requires the coexpression of ferredoxin protein for its activity in vivo. Thus, there are two hypotheses; (i) if the cytochrome b5 can complement the role of
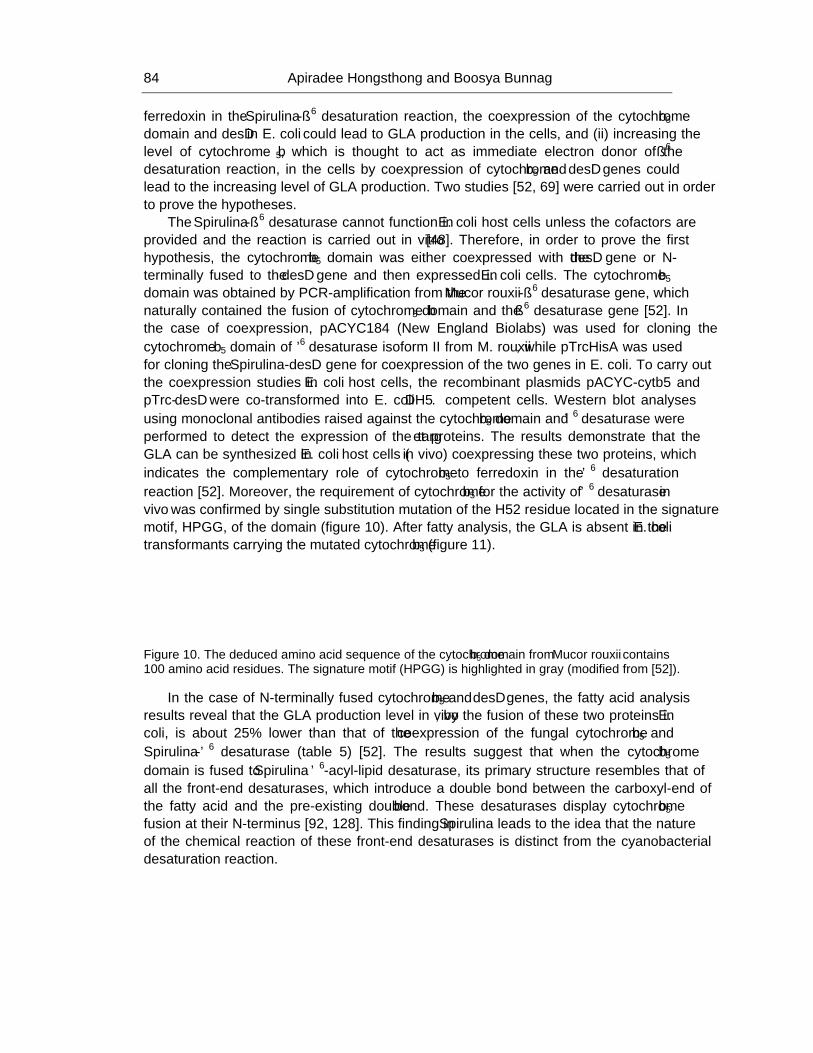
Apiradee Hongsthong and Boosya Bunnag 84
ferredoxin in the Spirulina-Δ6 desaturation reaction, the coexpression of the cytochrome b5 domain and desD in E. coli could lead to GLA production in the cells, and (ii) increasing the level of cytochrome b5, which is thought to act as immediate electron donor of the Δ6 desaturation reaction, in the cells by coexpression of cytochrome b5 and desD genes could lead to the increasing level of GLA production. Two studies [52, 69] were carried out in order to prove the hypotheses.
The Spirulina-Δ6 desaturase cannot function in E. coli host cells unless the cofactors are provided and the reaction is carried out in vitro [48]. Therefore, in order to prove the first hypothesis, the cytochrome b5 domain was either coexpressed with the desD gene or N-terminally fused to the desD gene and then expressed in E. coli cells. The cytochrome b5 domain was obtained by PCR-amplification from the Mucor rouxii-Δ6 desaturase gene, which naturally contained the fusion of cytochrome b5 domain and the Δ6 desaturase gene [52]. In the case of coexpression, pACYC184 (New England Biolabs) was used for cloning the cytochrome b5 domain of Δ6 desaturase isoform II from M. rouxii, while pTrcHisA was used for cloning the Spirulina-desD gene for coexpression of the two genes in E. coli. To carry out the coexpression studies in E. coli host cells, the recombinant plasmids pACYC-cytb5 and pTrc-desD were co-transformed into E. coli DH5α competent cells. Western blot analyses using monoclonal antibodies raised against the cytochrome b5 domain and Δ6 desaturase were performed to detect the expression of the target proteins. The results demonstrate that the GLA can be synthesized in E. coli host cells (in vivo) coexpressing these two proteins, which indicates the complementary role of cytochrome b5 to ferredoxin in the Δ6 desaturation reaction [52]. Moreover, the requirement of cytochrome b5 for the activity of Δ6 desaturase in vivo was confirmed by single substitution mutation of the H52 residue located in the signature motif, HPGG, of the domain (figure 10). After fatty analysis, the GLA is absent in the E. coli transformants carrying the mutated cytochrome b5 (figure 11).
Figure 10. The deduced amino acid sequence of the cytochrome b5 domain from Mucor rouxii contains 100 amino acid residues. The signature motif (HPGG) is highlighted in gray (modified from [52]).
In the case of N-terminally fused cytochrome b5 and desD genes, the fatty acid analysis results reveal that the GLA production level in vivo, by the fusion of these two proteins in E. coli, is about 25% lower than that of the coexpression of the fungal cytochrome b5 and Spirulina-Δ6 desaturase (table 5) [52]. The results suggest that when the cytochrome b5 domain is fused to Spirulina Δ6-acyl-lipid desaturase, its primary structure resembles that of all the “front-end” desaturases, which introduce a double bond between the carboxyl-end of the fatty acid and the pre-existing double bond. These desaturases display cytochrome b5 fusion at their N-terminus [92, 128]. This finding in Spirulina leads to the idea that the nature of the chemical reaction of these “front-end” desaturases is distinct from the cyanobacterial desaturation reaction.
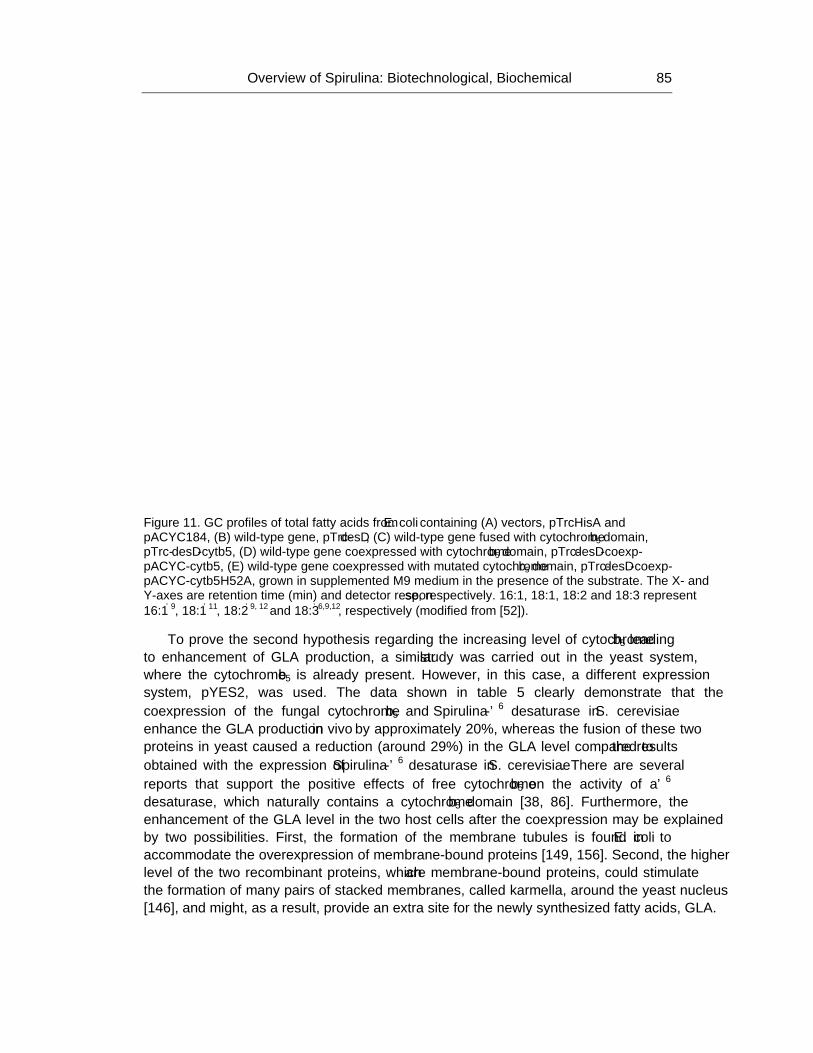
Overview of Spirulina: Biotechnological, Biochemical… 85
Figure 11. GC profiles of total fatty acids from E. coli containing (A) vectors, pTrcHisA and pACYC184, (B) wild-type gene, pTrc-desD, (C) wild-type gene fused with cytochrome b5 domain, pTrc-desD-cytb5, (D) wild-type gene coexpressed with cytochrome b5 domain, pTrc-desD-coexp-pACYC-cytb5, (E) wild-type gene coexpressed with mutated cytochrome b5 domain, pTrc-desD-coexp-pACYC-cytb5H52A, grown in supplemented M9 medium in the presence of the substrate. The X- and Y-axes are retention time (min) and detector response, respectively. 16:1, 18:1, 18:2 and 18:3 represent 16:1Δ9, 18:1Δ11, 18:2Δ9, 12 and 18:3Δ6,9,12, respectively (modified from [52]).
To prove the second hypothesis regarding the increasing level of cytochrome b5 leading to enhancement of GLA production, a similar study was carried out in the yeast system, where the cytochrome b5 is already present. However, in this case, a different expression system, pYES2, was used. The data shown in table 5 clearly demonstrate that the coexpression of the fungal cytochrome b5 and Spirulina-Δ6 desaturase in S. cerevisiae enhance the GLA production in vivo by approximately 20%, whereas the fusion of these two proteins in yeast caused a reduction (around 29%) in the GLA level compared to the results obtained with the expression of Spirulina-Δ6 desaturase in S. cerevisiae. There are several reports that support the positive effects of free cytochrome b5 on the activity of a Δ6 desaturase, which naturally contains a cytochrome b5 domain [38, 86]. Furthermore, the enhancement of the GLA level in the two host cells after the coexpression may be explained by two possibilities. First, the formation of the membrane tubules is found in E. coli to accommodate the overexpression of membrane-bound proteins [149, 156]. Second, the higher level of the two recombinant proteins, which are membrane-bound proteins, could stimulate the formation of many pairs of stacked membranes, called karmella, around the yeast nucleus [146], and might, as a result, provide an extra site for the newly synthesized fatty acids, GLA.
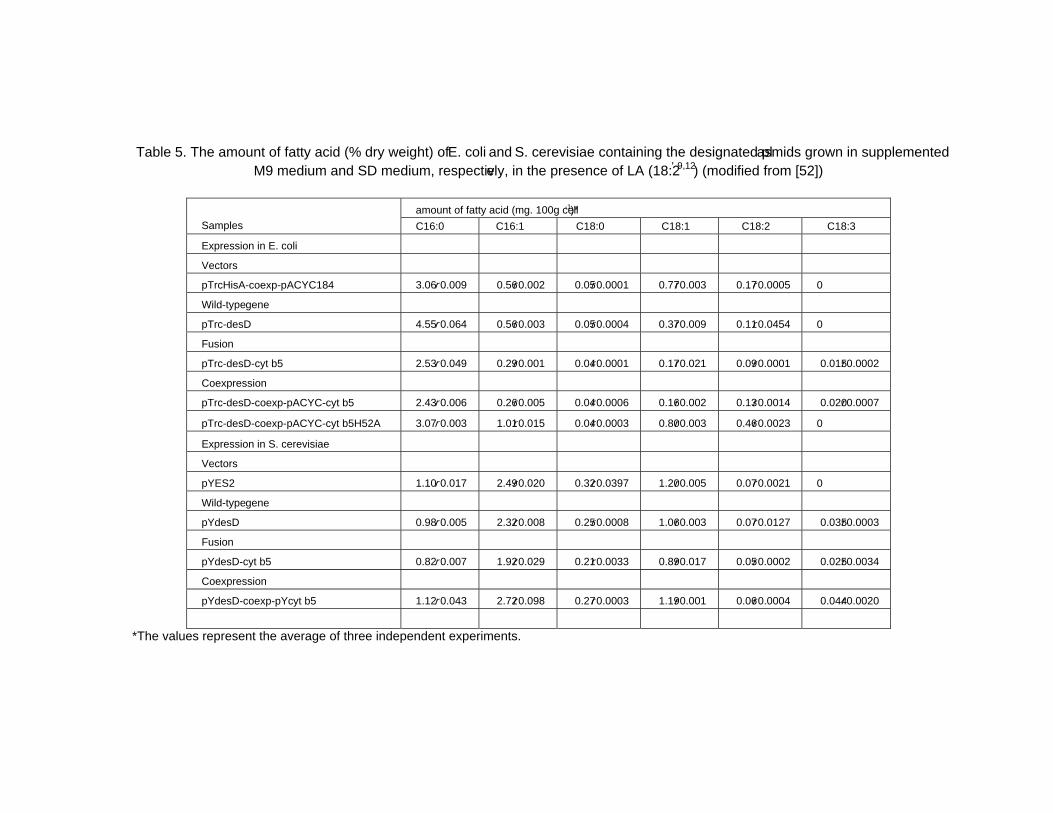
Table 5. The amount of fatty acid (% dry weight) of E. coli and S. cerevisiae containing the designated plasmids grown in supplemented M9 medium and SD medium, respectively, in the presence of LA (18:2Δ9,12) (modified from [52])
amount of fatty acid (mg. 100g cell-1)*
Samples C16:0 C16:1 C18:0 C18:1 C18:2 C18:3
Expression in E. coli
Vectors
pTrcHisA-coexp-pACYC184 3.06±0.009 0.56±0.002 0.05±0.0001 0.77±0.003 0.17±0.0005 0
Wild-type gene
pTrc-desD 4.55±0.064 0.56±0.003 0.05±0.0004 0.37±0.009 0.11±0.0454 0
Fusion
pTrc-desD-cyt b5 2.53±0.049 0.29±0.001 0.04±0.0001 0.17±0.021 0.09±0.0001 0.015±0.0002
Coexpression
pTrc-desD-coexp-pACYC-cyt b5 2.43±0.006 0.26±0.005 0.04±0.0006 0.16±0.002 0.13±0.0014 0.020±0.0007
pTrc-desD-coexp-pACYC-cyt b5H52A 3.07±0.003 1.01±0.015 0.04±0.0003 0.80±0.003 0.46±0.0023 0
Expression in S. cerevisiae
Vectors
pYES2 1.10±0.017 2.49±0.020 0.32±0.0397 1.20±0.005 0.07±0.0021 0
Wild-type gene
pYdesD 0.98±0.005 2.32±0.008 0.25±0.0008 1.06±0.003 0.07±0.0127 0.035±0.0003
Fusion
pYdesD-cyt b5 0.82±0.007 1.92±0.029 0.21±0.0033 0.89±0.017 0.05±0.0002 0.025±0.0034
Coexpression
pYdesD-coexp-pYcyt b5 1.12±0.043 2.72±0.098 0.27±0.0003 1.19±0.001 0.06±0.0004 0.044±0.0020
*The values represent the average of three independent experiments.
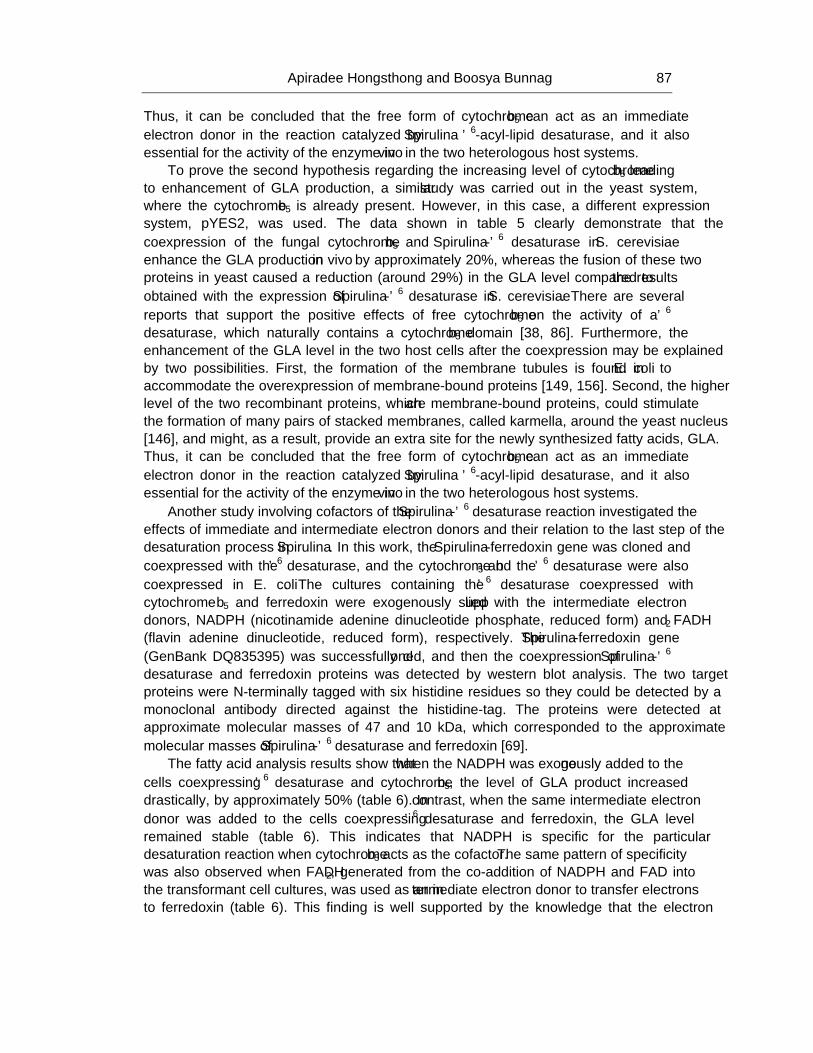
Apiradee Hongsthong and Boosya Bunnag 87
Thus, it can be concluded that the free form of cytochrome b5 can act as an immediate electron donor in the reaction catalyzed by Spirulina Δ6-acyl-lipid desaturase, and it also essential for the activity of the enzyme in vivo in the two heterologous host systems.
To prove the second hypothesis regarding the increasing level of cytochrome b5 leading to enhancement of GLA production, a similar study was carried out in the yeast system, where the cytochrome b5 is already present. However, in this case, a different expression system, pYES2, was used. The data shown in table 5 clearly demonstrate that the coexpression of the fungal cytochrome b5 and Spirulina-Δ6 desaturase in S. cerevisiae enhance the GLA production in vivo by approximately 20%, whereas the fusion of these two proteins in yeast caused a reduction (around 29%) in the GLA level compared to the results obtained with the expression of Spirulina-Δ6 desaturase in S. cerevisiae. There are several reports that support the positive effects of free cytochrome b5 on the activity of a Δ6 desaturase, which naturally contains a cytochrome b5 domain [38, 86]. Furthermore, the enhancement of the GLA level in the two host cells after the coexpression may be explained by two possibilities. First, the formation of the membrane tubules is found in E. coli to accommodate the overexpression of membrane-bound proteins [149, 156]. Second, the higher level of the two recombinant proteins, which are membrane-bound proteins, could stimulate the formation of many pairs of stacked membranes, called karmella, around the yeast nucleus [146], and might, as a result, provide an extra site for the newly synthesized fatty acids, GLA. Thus, it can be concluded that the free form of cytochrome b5 can act as an immediate electron donor in the reaction catalyzed by Spirulina Δ6-acyl-lipid desaturase, and it also essential for the activity of the enzyme in vivo in the two heterologous host systems.
Another study involving cofactors of the Spirulina-Δ6 desaturase reaction investigated the effects of immediate and intermediate electron donors and their relation to the last step of the desaturation process in Spirulina. In this work, the Spirulina-ferredoxin gene was cloned and coexpressed with the Δ6 desaturase, and the cytochrome b5 and the Δ6 desaturase were also coexpressed in E. coli. The cultures containing the Δ6 desaturase coexpressed with cytochrome b5 and ferredoxin were exogenously supplied with the intermediate electron donors, NADPH (nicotinamide adenine dinucleotide phosphate, reduced form) and FADH2 (flavin adenine dinucleotide, reduced form), respectively. The Spirulina-ferredoxin gene (GenBank DQ835395) was successfully cloned, and then the coexpression of Spirulina-Δ6 desaturase and ferredoxin proteins was detected by western blot analysis. The two target proteins were N-terminally tagged with six histidine residues so they could be detected by a monoclonal antibody directed against the histidine-tag. The proteins were detected at approximate molecular masses of 47 and 10 kDa, which corresponded to the approximate molecular masses of Spirulina-Δ6 desaturase and ferredoxin [69].
The fatty acid analysis results show that when the NADPH was exogenously added to the cells coexpressing Δ6 desaturase and cytochrome b5, the level of GLA product increased drastically, by approximately 50% (table 6). In contrast, when the same intermediate electron donor was added to the cells coexpressing Δ6 desaturase and ferredoxin, the GLA level remained stable (table 6). This indicates that NADPH is specific for the particular desaturation reaction when cytochrome b5 acts as the cofactor. The same pattern of specificity was also observed when FADH2, generated from the co-addition of NADPH and FAD into the transformant cell cultures, was used as an intermediate electron donor to transfer electrons to ferredoxin (table 6). This finding is well supported by the knowledge that the electron
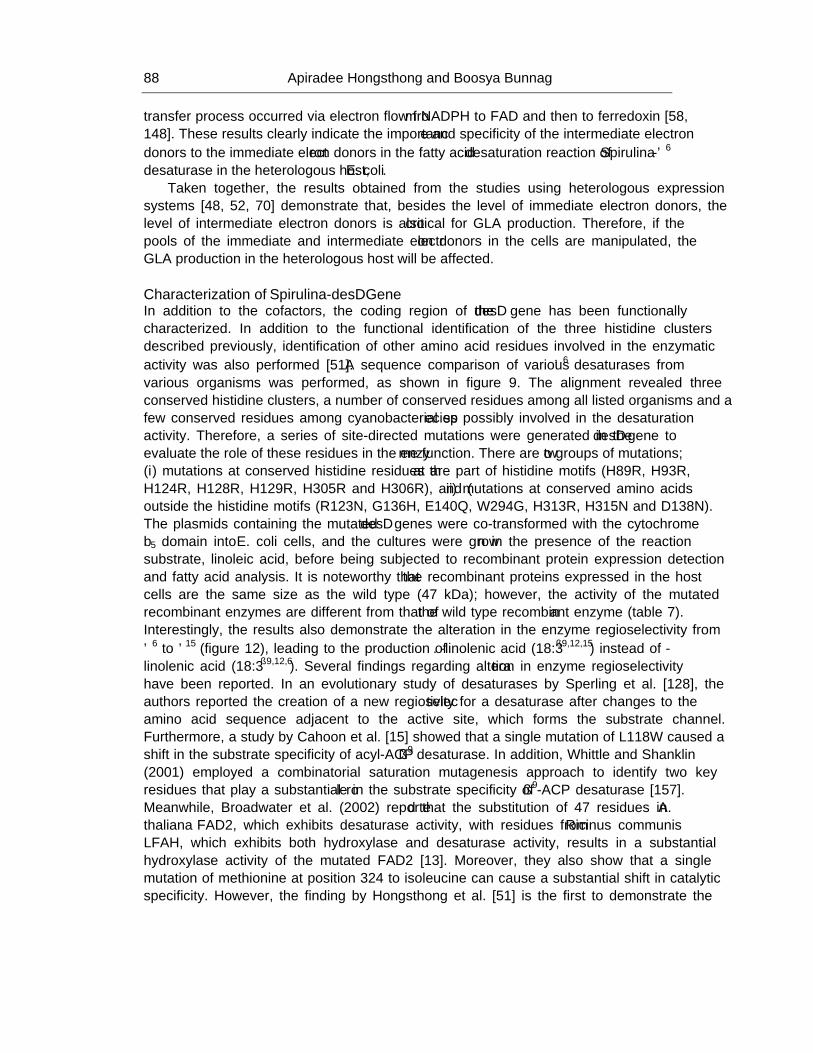
Apiradee Hongsthong and Boosya Bunnag 88
transfer process occurred via electron flow from NADPH to FAD and then to ferredoxin [58, 148]. These results clearly indicate the importance and specificity of the intermediate electron donors to the immediate electron donors in the fatty acid desaturation reaction of Spirulina-Δ6 desaturase in the heterologous host, E. coli.
Taken together, the results obtained from the studies using heterologous expression systems [48, 52, 70] demonstrate that, besides the level of immediate electron donors, the level of intermediate electron donors is also critical for GLA production. Therefore, if the pools of the immediate and intermediate electron donors in the cells are manipulated, the GLA production in the heterologous host will be affected.
Characterization of Spirulina-desD Gene In addition to the cofactors, the coding region of the desD gene has been functionally characterized. In addition to the functional identification of the three histidine clusters described previously, identification of other amino acid residues involved in the enzymatic activity was also performed [51]. A sequence comparison of various Δ6 desaturases from various organisms was performed, as shown in figure 9. The alignment revealed three conserved histidine clusters, a number of conserved residues among all listed organisms and a few conserved residues among cyanobacterial species possibly involved in the desaturation activity. Therefore, a series of site-directed mutations were generated in the desD gene to evaluate the role of these residues in the enzyme function. There are two groups of mutations; (i) mutations at conserved histidine residues that are part of histidine motifs (H89R, H93R, H124R, H128R, H129R, H305R and H306R), and (ii) mutations at conserved amino acids outside the histidine motifs (R123N, G136H, E140Q, W294G, H313R, H315N and D138N). The plasmids containing the mutated desD genes were co-transformed with the cytochrome b5 domain into E. coli cells, and the cultures were grown in the presence of the reaction substrate, linoleic acid, before being subjected to recombinant protein expression detection and fatty acid analysis. It is noteworthy that the recombinant proteins expressed in the host cells are the same size as the wild type (47 kDa); however, the activity of the mutated recombinant enzymes are different from that of the wild type recombinant enzyme (table 7). Interestingly, the results also demonstrate the alteration in the enzyme regioselectivity from Δ6 to Δ15 (figure 12), leading to the production of α-linolenic acid (18:3Δ9,12,15) instead of γ-linolenic acid (18:3 Δ9,12,6). Several findings regarding alteration in enzyme regioselectivity have been reported. In an evolutionary study of desaturases by Sperling et al. [128], the authors reported the creation of a new regioselectivity for a desaturase after changes to the amino acid sequence adjacent to the active site, which forms the substrate channel. Furthermore, a study by Cahoon et al. [15] showed that a single mutation of L118W caused a shift in the substrate specificity of acyl-ACP Δ9 desaturase. In addition, Whittle and Shanklin (2001) employed a combinatorial saturation mutagenesis approach to identify two key residues that play a substantial role in the substrate specificity of Δ9-ACP desaturase [157]. Meanwhile, Broadwater et al. (2002) reported that the substitution of 4–7 residues in A. thaliana FAD2, which exhibits desaturase activity, with residues from Ricinus communis LFAH, which exhibits both hydroxylase and desaturase activity, results in a substantial hydroxylase activity of the mutated FAD2 [13]. Moreover, they also show that a single mutation of methionine at position 324 to isoleucine can cause a substantial shift in catalytic specificity. However, the finding by Hongsthong et al. [51] is the first to demonstrate the
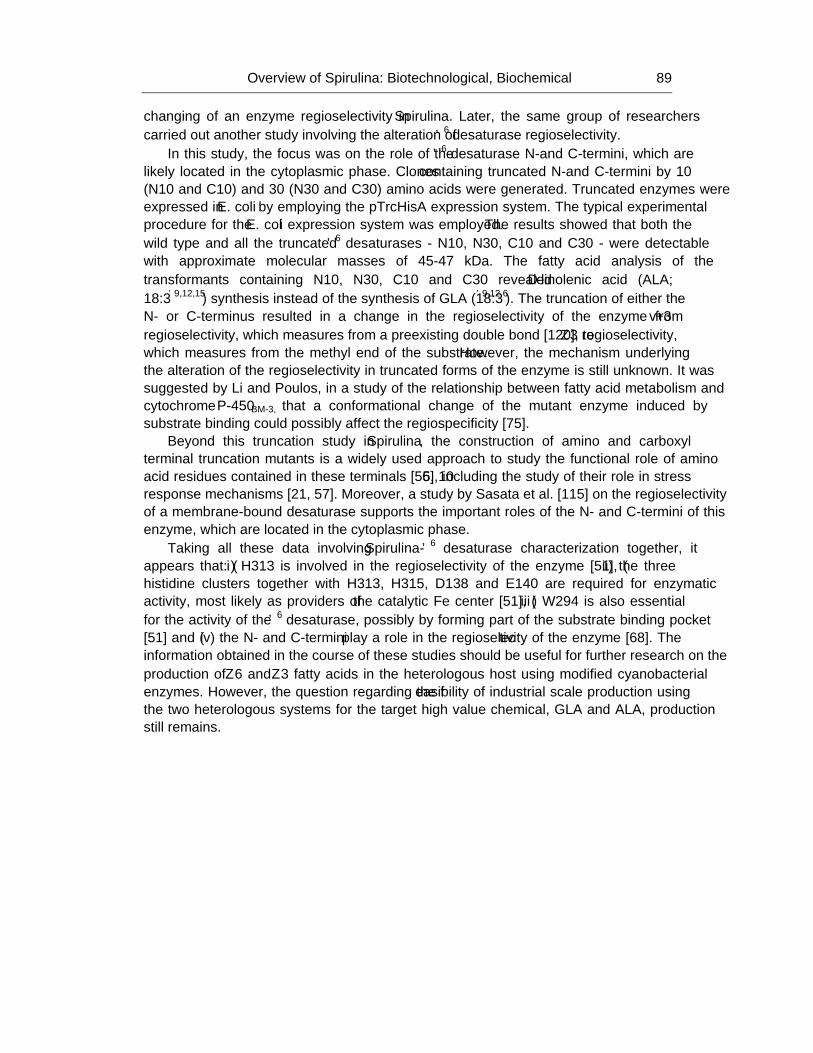
Overview of Spirulina: Biotechnological, Biochemical… 89
changing of an enzyme regioselectivity in Spirulina. Later, the same group of researchers carried out another study involving the alteration of Δ6 desaturase regioselectivity.
In this study, the focus was on the role of the Δ6 desaturase N-and C-termini, which are likely located in the cytoplasmic phase. Clones containing truncated N-and C-termini by 10 (N10 and C10) and 30 (N30 and C30) amino acids were generated. Truncated enzymes were expressed in E. coli by employing the pTrcHisA expression system. The typical experimental procedure for the E. coli expression system was employed. The results showed that both the wild type and all the truncated Δ6 desaturases - N10, N30, C10 and C30 - were detectable with approximate molecular masses of 45-47 kDa. The fatty acid analysis of the transformants containing N10, N30, C10 and C30 revealed α-linolenic acid (ALA; 18:3Δ9,12,15) synthesis instead of the synthesis of GLA (18:3Δ9,12,6). The truncation of either the N- or C-terminus resulted in a change in the regioselectivity of the enzyme from v+3 regioselectivity, which measures from a preexisting double bond [120], to ω3 regioselectivity, which measures from the methyl end of the substrate. However, the mechanism underlying the alteration of the regioselectivity in truncated forms of the enzyme is still unknown. It was suggested by Li and Poulos, in a study of the relationship between fatty acid metabolism and cytochrome P-450BM-3, that a conformational change of the mutant enzyme induced by substrate binding could possibly affect the regiospecificity [75].
Beyond this truncation study in Spirulina, the construction of amino and carboxyl terminal truncation mutants is a widely used approach to study the functional role of amino acid residues contained in these terminals [56, 105], including the study of their role in stress response mechanisms [21, 57]. Moreover, a study by Sasata et al. [115] on the regioselectivity of a membrane-bound desaturase supports the important roles of the N- and C-termini of this enzyme, which are located in the cytoplasmic phase.
Taking all these data involving Spirulina-Δ6 desaturase characterization together, it appears that: (i) H313 is involved in the regioselectivity of the enzyme [51], (ii) the three histidine clusters together with H313, H315, D138 and E140 are required for enzymatic activity, most likely as providers of the catalytic Fe center [51], (iii) W294 is also essential for the activity of the Δ6 desaturase, possibly by forming part of the substrate binding pocket [51] and (iv) the N- and C-termini play a role in the regioselectivity of the enzyme [68]. The information obtained in the course of these studies should be useful for further research on the production of ω6 and ω3 fatty acids in the heterologous host using modified cyanobacterial enzymes. However, the question regarding the feasibility of industrial scale production using the two heterologous systems for the target high value chemical, GLA and ALA, production still remains.
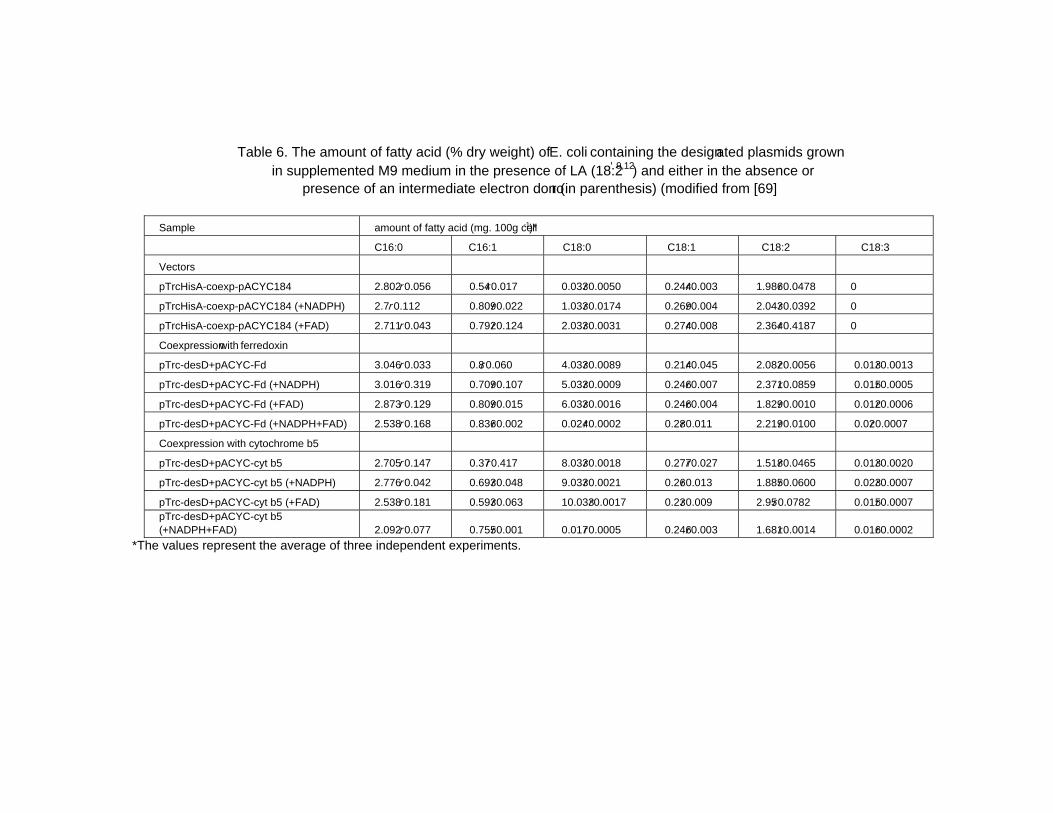
Table 6. The amount of fatty acid (% dry weight) of E. coli containing the designated plasmids grown in supplemented M9 medium in the presence of LA (18:2Δ9,12) and either in the absence or
presence of an intermediate electron donor (in parenthesis) (modified from [69] Sample amount of fatty acid (mg. 100g cell-1)*
C16:0 C16:1 C18:0 C18:1 C18:2 C18:3
Vectors
pTrcHisA-coexp-pACYC184 2.802±0.056 0.54±0.017 0.033±0.0050 0.244±0.003 1.986±0.0478 0
pTrcHisA-coexp-pACYC184 (+NADPH) 2.7±0.112 0.809±0.022 1.033±0.0174 0.269±0.004 2.043±0.0392 0
pTrcHisA-coexp-pACYC184 (+FAD) 2.711±0.043 0.792±0.124 2.033±0.0031 0.274±0.008 2.364±0.4187 0
Coexpression with ferredoxin
pTrc-desD+pACYC-Fd 3.046±0.033 0.8±0.060 4.033±0.0089 0.214±0.045 2.082±0.0056 0.013±0.0013
pTrc-desD+pACYC-Fd (+NADPH) 3.016±0.319 0.709±0.107 5.033±0.0009 0.246±0.007 2.371±0.0859 0.015±0.0005
pTrc-desD+pACYC-Fd (+FAD) 2.873±0.129 0.809±0.015 6.033±0.0016 0.246±0.004 1.829±0.0010 0.012±0.0006
pTrc-desD+pACYC-Fd (+NADPH+FAD) 2.538±0.168 0.836±0.002 0.024±0.0002 0.28±0.011 2.219±0.0100 0.02±0.0007
Coexpression with cytochrome b5
pTrc-desD+pACYC-cyt b5 2.705±0.147 0.37±0.417 8.033±0.0018 0.277±0.027 1.518±0.0465 0.013±0.0020
pTrc-desD+pACYC-cyt b5 (+NADPH) 2.776±0.042 0.693±0.048 9.033±0.0021 0.26±0.013 1.885±0.0600 0.023±0.0007
pTrc-desD+pACYC-cyt b5 (+FAD) 2.538±0.181 0.593±0.063 10.033±0.0017 0.23±0.009 2.95±0.0782 0.015±0.0007 pTrc-desD+pACYC-cyt b5 (+NADPH+FAD) 2.092±0.077 0.755±0.001 0.017±0.0005 0.246±0.003 1.681±0.0014 0.016±0.0002
*The values represent the average of three independent experiments.
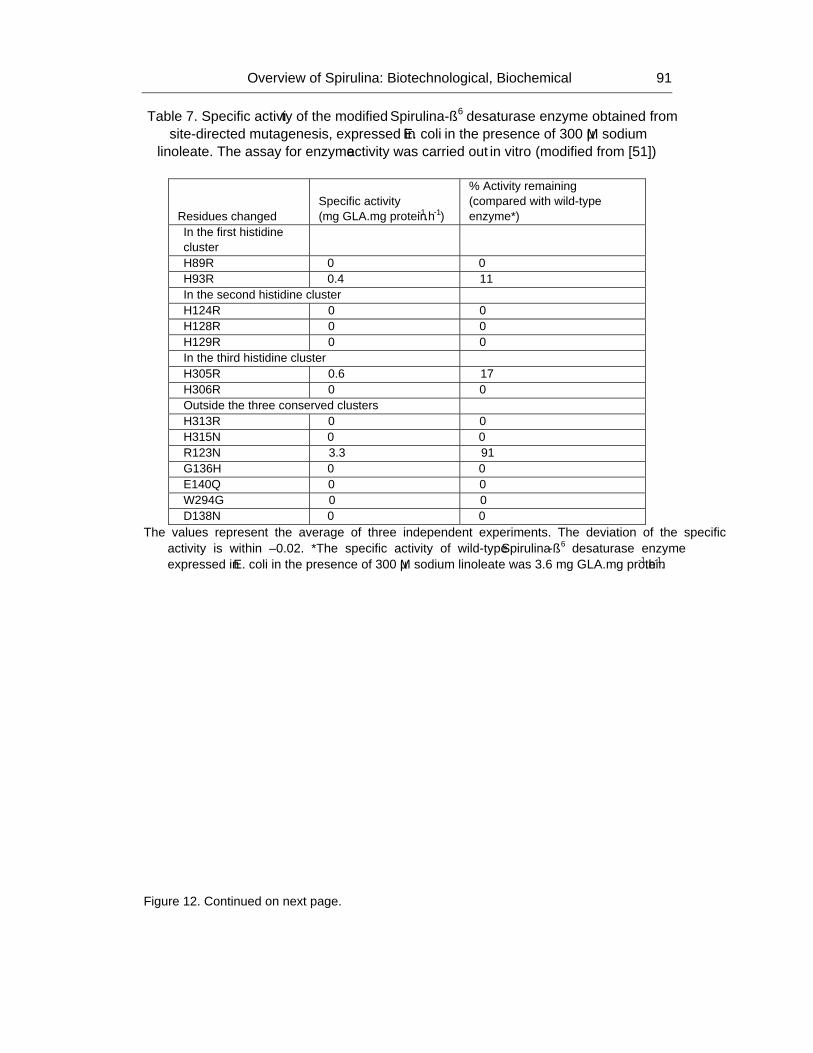
Overview of Spirulina: Biotechnological, Biochemical… 91
Table 7. Specific activity of the modified Spirulina-Δ6 desaturase enzyme obtained from site-directed mutagenesis, expressed in E. coli in the presence of 300 µM sodium
linoleate. The assay for enzyme activity was carried out in vitro (modified from [51])
Residues changed Specific activity (mg GLA.mg protein-1.h-1)
% Activity remaining (compared with wild-type enzyme*)
In the first histidine cluster H89R 0 0 H93R 0.4 11 In the second histidine cluster H124R 0 0 H128R 0 0 H129R 0 0 In the third histidine cluster H305R 0.6 17 H306R 0 0 Outside the three conserved clusters H313R 0 0 H315N 0 0 R123N 3.3 91 G136H 0 0 E140Q 0 0 W294G 0 0 D138N 0 0
The values represent the average of three independent experiments. The deviation of the specific activity is within ±0.02. *The specific activity of wild-type Spirulina-Δ6 desaturase enzyme expressed in E. coli in the presence of 300 µM sodium linoleate was 3.6 mg GLA.mg protein-1.h-1.
Figure 12. Continued on next page.
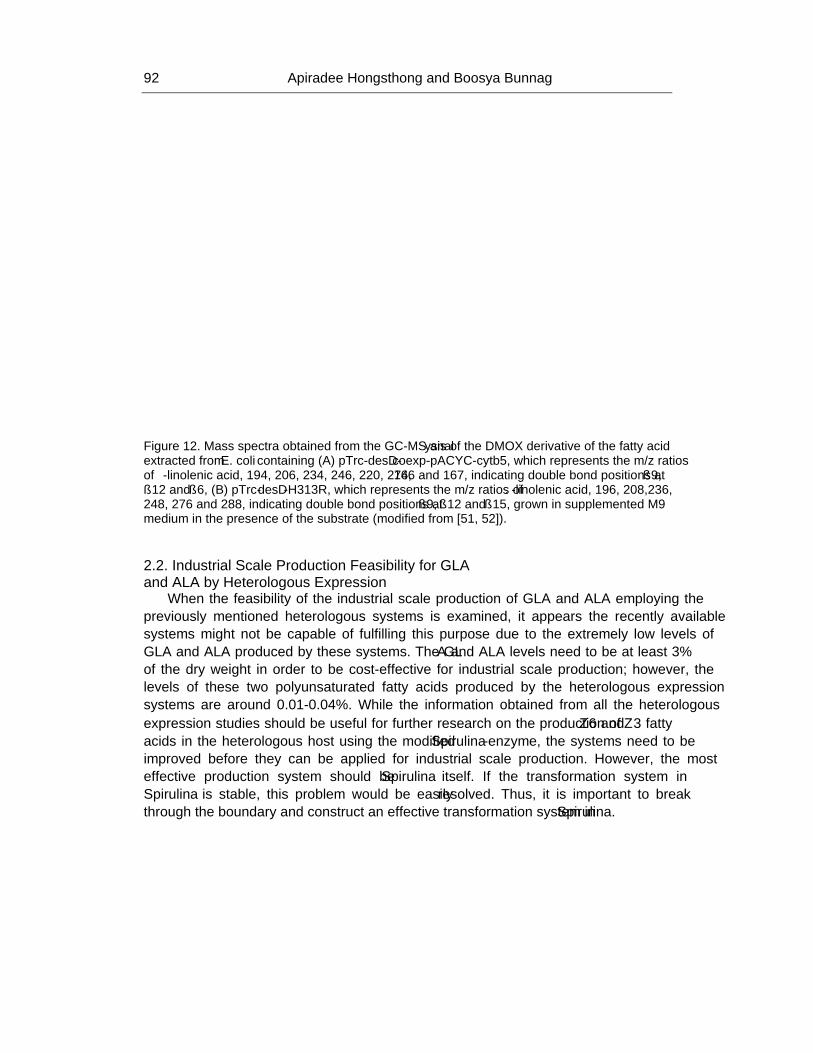
Apiradee Hongsthong and Boosya Bunnag 92
Figure 12. Mass spectra obtained from the GC-MS analysis of the DMOX derivative of the fatty acid extracted from E. coli containing (A) pTrc-desD-coexp-pACYC-cytb5, which represents the m/z ratios of γ-linolenic acid, 194, 206, 234, 246, 220, 274, 166 and 167, indicating double bond positions at Δ9, Δ12 and Δ6, (B) pTrc-desD-H313R, which represents the m/z ratios of α-linolenic acid, 196, 208,236, 248, 276 and 288, indicating double bond positions at Δ9, Δ12 and Δ15, grown in supplemented M9 medium in the presence of the substrate (modified from [51, 52]).
2.2. Industrial Scale Production Feasibility for GLA and ALA by Heterologous Expression
When the feasibility of the industrial scale production of GLA and ALA employing the previously mentioned heterologous systems is examined, it appears the recently available systems might not be capable of fulfilling this purpose due to the extremely low levels of GLA and ALA produced by these systems. The GLA and ALA levels need to be at least 3% of the dry weight in order to be cost-effective for industrial scale production; however, the levels of these two polyunsaturated fatty acids produced by the heterologous expression systems are around 0.01-0.04%. While the information obtained from all the heterologous expression studies should be useful for further research on the production of ω6 and ω3 fatty acids in the heterologous host using the modified Spirulina-enzyme, the systems need to be improved before they can be applied for industrial scale production. However, the most effective production system should be Spirulina itself. If the transformation system in Spirulina is stable, this problem would be easily resolved. Thus, it is important to break through the boundary and construct an effective transformation system in Spirulina.
Overview of Spirulina: Biotechnological, Biochemical… 93
FUTURE PROSPECTS Spirulina has high potential as a human food supplement due to its high levels of protein,
vitamins, minerals, antioxidants and polyunsaturated fatty acids. The ability to grow this cyanobacterium via outdoor mass cultivation year round in a tropical country gives it an advantage over other cyanobacteria and plants. However, in terms of high value chemicals, such as GLA, a major obstacle is the lack of an effective transformation system in Spirulina since the heterologous expression systems are not feasible for industrial scale production. Therefore, if the cost-effectiveness for industrial scale production is considered, the ability to increase the cellular outputs of mass outdoor cultivation as well as the outputs of the high value chemical contents in the cells has to be developed. Therefore, in the near future, after the Spirulina genome project is completed, the mysteries behind the difficulties underlying transformation system construction can be unraveled. Consequently, all the knowledge that we have been gathering during the past decade can be used to achieve the goal regarding the use of Spirulina as a cell factory of high value chemical production. Finally, the knowledge obtained regarding the metabolic pathways of Spirulina can provide models for plants due to the evolutionary relationship of cyanobacteria and plants.
ACKNOWLEDGMENT Research in the authors’ laboratories were supported by grants from the National Center
for Genetic Engineering and Biotechnology (BIOTEC) and King Mongkut’s University of Technology-Thonburi (KMUTT), Bangkok, Thailand. We thank Ms. Phuttawadee Phuengcharoen for helping in manuscript preparation.
REFERENCES
[1] Alsher, RG, Donahue, JL, & Cramer, CL (1997). Reactive oxygen species and antioxidants: relationship in green cells. Physiol. Plant, 100.
[2] Anderson, RG, Hussey, H, & Braddiley, J (1972). The mechanism of wall synthesis in bacteria. Biochem. J., 127, 11-25.
[3] Ausubel, FM, Brent, R, Kingston, RE, Moore, DD, Seidman, JG, & Struhl, K (1993). Current Protocols in Molecular Biology. In: (Eds.), Wiley, New York.
[4] Ayehunie, S, Belay, A, & Baba, TW (1998). Inhibition of HIV-1 replicaiton by an aqueous extract of Spirulina platensis. J. Aquir. Immun. Defic. Syndr. Hum. Retrovirol., 18, 7-12.
[5] Bae, W, Xia, B, Inouye, M, & Severinov, K (2000). Escherichia coli CspA-family RNA chaperones are transcription antiterminators. Proc. Natl. Acad. Sci. USA, 97, 7784-7789.
[6] Baier, K, Lehmann, H, Stephan, DP, & Lockau, W (2004). NblA is essential for phycobilisome degradation in Anabaena sp. strain PCC 7120 but not for development of functional heterocysts. Microbiol., 150, 2739-2749.
Apiradee Hongsthong and Boosya Bunnag 94
[7] Baier, K, Nicklisch, S, Grundner, C, Reinecke, J, & Lockau, W (2001). Expression of two nblA-homologous genes is required for phycobilisome degradation in nitrogen-starved Synechocystis sp. PCC6803. FEMS Microbiol. Lett., 195, 35-39.
[8] Barker-Astrom, K, Schelin, J, Gustafsson, P, Clarke, AK, & Campbell, DA (2005). Chlorosis during nitrogen starvation is altered by carbon dioxide and temperature status and is mediated by the ClpP1 protease in Synechococcus elongatus. Arch. Microbiol., 183, 66-69.
[9] Belay, A (1997). Mass culture of Spirulina outdoors-The Earthrise Farm experience. Spirulina platensis (Arthrospira): Physiology, Cell-biology and Biotechnology.). London, Taylor & Francis.
[10] Belay, A, Ota, Y, Miyakawa, K, & Shimamatsu, H (1993). Current knowledge on potential health benefits of Spirulina. J. Appl. Phycol., 5, 235-241.
[11] Belay, A, Toshimitsu, K, & Ota, Y (1996). Spirulina (Arthrospira): potential application as an animal feed supplement. J. Appl. Phycol., 8, 303-311.
[12] Bhat, VB & Madyastha, KM (2000). C-Phycocyanin: A potent peroxyl radical scavenger in vivo and in vitro. Biochem. Biophys. Res. Commun., 275, 20-25.
[13] Broadwater, JA, Whittle, E, & Shanklin, J (2002). Desaturation and Hydroxylation; residue 148 and 324 of Arabidopsis FAD2, in addition to substrate chain length, exert a major influence in partitioning of catalytic specificity. Biol.Chem., 277, 15613-15620.
[14] Cahoon, E, Mills, LA, & Shanklin, J (1996). Modification of the fatty acid composition of Escherichia coli by coexpression of a plant acyl-acyl carrier protein desaturase and feredoxin. J.Bacteriol., 178, 936-939.
[15] Cahoon, EB, Shah, S, Shanklin, J, & Browse, J (1998). A determinant of substrate specificity predicted from the acyl-acyl carrier protein desaturase of developing cat's claw seed. Plant Physiol., 117, 593-598.
[16] Ceriello, A & Motz, E (2004). Is oxidative stress the pathogenic mechanism underlying insulin resistance, diabetes and cardiovascular disease? The common soil hypothesis revisited. Arterioscler. Thromb. Vas. Biol., 24, 816-823.
[17] Chamot, D & Owttrim, GW (2000). Regulation of cold shock-induced RNA helicase gene expression in the cyanobacterium Anabaena sp. strain PCC7120. J. Bacteriol., 182, 1251-1256.
[18] Cheng, Y, Li, JH, Shi, L, Wang, L, Latifi, A, & Zhang, CC (2006). A pair of iron-responsive genes encoding protein kinases with a Ser/Thr kinase domain and a His kinase domain are regulated by NtcA in the Cyanobacterium Anabaena sp. strain PCC 7120. J. Bacteriol., 188, 4822-4829.
[19] Cherng, SC, Cheng, SN, Tarn, A, & Chou, TC (2007). Anti-inflammatory activity of c-phycocyanin in lipopolysaccharide-stimulated RAW 264.7 macrophages. Life Sciences, 81, 1431-1435.
[20] Ciferri, O (1983). Spirulina, the edible microorganism. Microbiol. Rev., 47, 551-578. [21] Clarke, AK & Eriksson, MJ (2000). The truncated form of the bacterial heat shock
protein ClpB/HSP100 contributes to development of thermotolerance in the cyanobacterium Synechococcus sp. strain PCC 7942. J. Bacteriol., 7092-7096.
[22] Collier, JL & Grossman, AR (1992). Chlorosis induced by nutrient deprivation in Synechococcus sp. strain PCC 7942: not all bleaching is the same. J. Bacteriol., 174, 4718-4726.
Overview of Spirulina: Biotechnological, Biochemical… 95
[23] Collier, JL & Grossman, AR (1994). A small polypeptide triggers complete degradation of light-harvesting phycobiliproteins in nutrient-deprived cyanobacteria. EMBO J., 13, 1039-1047.
[24] Creighton, TE (1993). Proteins: Structures and molecular properties. New York, W. H. Freeman and company.
[25] Curry, JM, Whalan, R, Hunt, DM, Gohil, K, Strom, M, Rickman, L, Colston, MJ, Smerdon, SJ, & Buxton, RS (2005). An ABC transporter containing a Forkhead-associated domain interacts with a Serine-Threonine kinase and is required for growth of Mycobacterium tuberculosis in mice. Infect. Immun., 73, 4471-4477.
[26] Dainippon Ink and Chemicals, ID, Anti-tumeral agents containing phycobillin. 1983: Japan.
[27] Deshnium, P, Paithoonrangsarid, K, Suphatrakul, A, Meesapyodsuk, D, Tanticharoen, M, & Cheevadhanarak, S (2000). Temperature-independent and -dependent expression of desaturase genes in filamentous cyanobacterium Spirulina platensis strain C1 (Arthrospira sp. PCC 99438). FEMS Microbiol. Lett., 184, 207-213.
[28] Devi, MA & Venkataraman, LV (1983). Hypocholestemic effect of bluegreen algae Spirulina platensis in albino rats. Nutr. Rep. Int., 28, 519-530.
[29] Dolganov, N & Grossman, AR (1999). A polypeptide with similarity to phycocyanin alpha-subunit phycocyanobilin lyase involved in degradation of phycobilisomes. J. Bacteriol., 181, 610-617.
[30] Domergue, F, Abbadi, A, Ott, C, Zank, TK, Zahringer, U, & Heinz, E (2003). Acyl carriers used as substrates by the desaturases and elongases involved in very long-chain polyunsatuated fatty acids biosynthesis reconstituted in yeast. J.Biol.Chem., 278, 35115-35126.
[31] Ehling-Schulz, M, Schulz, S, Wait, R, Angelika, G, & Scherer, S (2002). The UV-B stimulon of the terrestrial cyanobacterium Nostoc commune comprises early shock proteins and late acclimation proteins. Mol. Microbiol., 46, 827-843.
[32] Esfahani, M, Barnes, EMJ, & Wakil, S (1969). Control of fatty acid composition in phospholipids of Escherichia coli: response to fatty acid supplements in a fatty acid auxotroph. Proc.Natl.Acad.Sci.USA, 64, 1057-1064.
[33] Fang, F & barnum, SR (2004). Espression of the heat shock gene hsp16.6 and promoter analysis in the cyanobacterium, Synechocystis sp. PCC 6803. Curr. Microbiol., 49, 192-198.
[34] Fujii, Y, Goldberg, P, & Hussain, SNA (1998). Contribution of macrophages to pulmonary nitric oxide production in septic shock. American Journal of Respiratory and Critical Care Medicine, 157, 1645-1651.
[35] Gombos, Z, Wada, H, & Murata, N (1992). Unsaturation of fatty acids in membrane lipids enhances tolerance of the cyanobacterium Synechocystis PCC6803 to low-temperature photoinhibition. Proc. Natl. Acad. Sci. USA, 89, 9959-9963.
[36] Gozales, R, Rodriguez, S, Romay, C, Ancheta, O, Gonzalez, A, Armesto, J, Remirez, D, & Merino, N (1999). Anti-inflammatory activity of phycocyanin extract in acetic acid-induced colitis in rats. Pharmcological Research, 39, 55-59.
[37] Grundner, C, Gay, LM, & Alber, T (2005). Mycobacterium tuberculosis serine/threonine kinases PknB, PknD, PknE and PknF phosphorylated multiple FHA domains. Protein Sci., 14, 1918-1921.
Apiradee Hongsthong and Boosya Bunnag 96
[38] Guillou, H, D'Andrea, S, Rioux, V, Barnouin, R, Dalaine, S, Pedrono, F, Jan, S, & Legrand, P (2004). Distinct roles of endoplasmic reticulum cytochrome and fused cytochrome b5-like domain for rat delta 6 desaturase activity. J. Lipid Res., 45, 32-40.
[39] Han, G & Zhang, CC (2001). On the origin of Ser/Thr kinases in a prokaryote. FEMS Microbiol. Lett., 200, 79-8.
[40] Harley, CB & Reynolds, RP (1987). Analysis of E. coli promoter sequences. Nucleic Acids Res., 15, 2343–2361.
[41] Hayashi, K, Hayashi, T, & Kojima, I (1996). A natural sulfated polysaccharide, calcium spirulan, isolated from Spirulina platensis: in vitro and ex vivo evaluation of anti-Herpes simplex virus and anti-human immunodeficiency virus activities. AIDS Research and Human Retroviruses, 12, 1463-1471.
[42] Hayashi, L, Hayashi, T, & Morita, N (1993). An extract from Spirulina platensis is a selective inhibitor of Herpes simplex virus type I penetration into HeLa cells. Phytother Res., 7, 76-80.
[43] Hayashi, T, Hayashi, K, Maedaa, M, & Kojima, I (1996). Calcium spirulan, an inhibitor of enveloped virus replication, from a blue-green alga Spirulina platensis. J. Nat. Prod., 59, 83-87.
[44] Hecker, M, Schumann, W, & Volker, U (1996). Heat-shock and general stress response in Bacillus subtilis. Mol. Microbiol., 19, 417-428.
[45] Hernandez, JA, Teresa Bes, M, Fillat, MF, Neira, JL, & Peleato, ML (2002). Biochemical analysis of the recombinant Fur (ferric uptake regulator) protein from Anabaena PCC7119: factors affecting its oligomerization state. Biochem. J., 366, 315-322.
[46] Hiemstra, H, Nanninga, N, Woldringh, CL, Inouye, M, & Witholt, B (1987). Distribution of newly synthesized lipoprotein over the outer membrane and the peptidoglycan sacculus of an Escherichia coli lac-lpp strain. J.Bacteriol., 169, 5434-5444.
[47] Hongsthong, A, Deshnium, P, Paithoonrangsarid, K, Cheevadhanarak, S, & Tanticharoen, M (2003). Differential responses of the three acyl-lipid desaturases to immediate temperature reduction occurred in two lipid membranes of Spirulina platensis strain C1. J. Biosci. Bioeng., 96, 519-524.
[48] Hongsthong, A, Paithoonrangsarid, K, Phapugrankul, P, Sirijuntarut, M, Cheevadhanarak, S, & Tanticharoen, M (2004). The expression of three desaturase genes of Spirulina platensis in Escherichia coli DH5α. Mol. Biol. Reports, 31, 177-189.
[49] Hongsthong, A, Sirijuntarut, M, Prommeenate, P, Lertladaluck, K, Porkaew, K, Cheevadahanarak, S, & Tanticharoen, M (2008). Proteome analysis at the subcellular level of the cyanobacterium Spirulina platensis in response to low temperature stress conditions. FEMS Microbiol. Lett., in press.
[50] Hongsthong, A, Sirijuntarut, M, Prommeenate, P, Thammathorn, S, Bunnag, B, Cheevadhanarak, S, & Tanticharoen, M (2007). Revealing differentially expressed proteins in two morphological forms of Spirulina platensis by proteomic analysis. Mol. Biotechnol., 36, 123-130.
[51] Hongsthong, A, Subudhi, S, Sirijuntarat, M, & Cheevadhanarak, S (2004). Mutation study of conserved amino acid residues of Spirulina delta 6-acyl-lipid desaturase showing involvement of histidine 313 in the regioselectivity of the enzyme. Appl.Microbiol.Biotechnol., 66, 74-84.
Overview of Spirulina: Biotechnological, Biochemical… 97
[52] Hongsthong, A, Subudhi, S, Sirijuntarat, M, Kurdrid, P, Cheevadhanarak, S, & Tanticharoen, M (2006). Revealing the complementation of ferredoxin by cytochrome b5 in the Spirulina- 6-desaturation reaction by N-terminal fusion and co-expression of the fungal-cytochrome b5 domain and Spirulina- 6-acyl-lipid desaturase. Appl.Microbiol.Biotechnol., 72, 1192-1201.
[53] Huang, F, Parmryd, I, Nilsson, F, Persson, A, Pakrasi, HB, Andersson, B, & Norling, B (2002). Proteomics of Synechocystis sp. strain PCC 6803. Molecular and Cellular Proteomics, 1, 956-966.
[54] Huckauf, J, Nomura, C, Forchhammer, K, & Hagemann, M (2000). Stress responses of Synechocystis sp. strain PCC 6803 mutants impaired in genes encoding putative alternative sigma factors. Microbiol., 146, 2877-2889.
[55] Im, CS & Grossman, AR (2001). Identification and regulation of high light-induced genes in Chlamydomonas reinhardtii. The Plant Journal, 30, 301-313.
[56] Inagaki, N, Maitra, R, Satoh, K, & Pakrasi, HB (2001). Amino acid residues that are critical for in vivo catalytic activity of CtpA, the carboxyl-terminal processing protease for the D1 protein of photosystem II. J. Biol. Chem., 276, 30099-30105.
[57] J. van Thor, J, Jeanjean, R, Havaux, M, Sjollema, KA, Joset, F, Hellingwerf, KJ, & Matthijs, HCP (2000). Salt shock-inducible photosystem I cyclic electron trnasfer in Synechocystis PCC6803 relies on binding of ferredoxin: NADP+ reductase to the thylakoid membranes via its CpcD phycobilisome-linker homologous N-terminal domain. Biochim. Biophys. Acta, 1457, 129-144.
[58] Jarrett, JT & Wan, JT (2002). Thermal inactivation of reduced ferredoxin (flavodoxin): NADP+ oxidoreductase from Escherichia coli. FEBS Lett., 529, 237-242.
[59] Jeamton, W, Mungpakdee, S, Sirijuntarut, M, Prommeenate, P, Cheevadahanarak, S, Tanticharoen, M, & Hongsthong, A (2008). A combined stress response analysis of Spirulina platensis in terms of global differentially expressed proteins, and mRNA levels and stability of fatty acid biosynthesis genes. FEMS Microbiol. Lett., 281, 121-131.
[60] Jeeji Bai, N (1985). Competitive exclusion or morpholoical transformation? A case study with Spirulina fusiformis. Arch. Hydro. Biol., 71(suppl), Algol. Stud., 38/39, 191-199.
[61] Jeeji Bai, N & Seshadri, CV (1980). On coiling and uncoiling of trichromes in the genus Spirulina. Arch. Hydro. Biol., 60(suppl), Algol. Stud., 26, 32-47.
[62] Joy, AW & Emily, S (1977). Regulation of macrophage cytokine production by prostaglandin E2. Distinct roles of cyclooxygenase-1 and -2. J. Biol. Chem., 272, 25693-25699.
[63] Kaplan, A, Helman, Y, Tchernov, D, & Reinhold, L (2001). Acclimation of photosynthetic microorganisms to changing ambient carbon dioxide concentration. Proc. Natl. Acad. Sci. USA, 98, 4817-4818.
[64] Kim, HJ, Kim, YK, Park, JY, & Kim, J (2002). Light signalling mediated by phytochrome plays an important role in cold-induced gene expression through the C-repeat/dehydration responsive element (C/DRE) in Arabidopsis thaliana. The Plant Journal, 29, 693-704.
[65] Kis, M, Zsiros, O, Farkas, T, Wada, H, Nagy, F, & Gombos, Z (1998). Light-induced expression of fatty acid desatrase genes. Proc. Natl. Acad. Sci. USA, 95, 4209-4214.
Apiradee Hongsthong and Boosya Bunnag 98
[66] Kojima, K & Nakamoto, H (2005). Post-transcriptional control of the cyanobacterial hspA heat-shock induction. Biochem. Biophys. Res. Commun., 331, 583-588.
[67] Kojima, K & Nakamoto, H (2002). Specific binding of a protein to a novel DNA element in the cyanobacterial small heat-shock protein gene. Biochem. Biophys. Res. Commun., 297, 616–624.
[68] Kurdrid, P, Sirijuntarut, M, Subudhi, S, Cheevadahanarak, S, Tanticharoen, M, & Hongsthong, A (2008). Truncation mutants highlight a critical role for the N- and C-termini of the Spirulina Delta(6) desaturase in determining regioselectivity. Mol. Biotechnol., 38, 203-209.
[69] Kurdrid, P, Subudhi, S, Cheevadahanarak, S, Tanticharoen, M, & Hongsthong, A (2007). Effect of two immediate electron donors, NADPH and FADH(2), on Spirulina delta 6 desaturase co-expressed with two different immediate electron donors, cytochrome b5 and ferredoxin in E. coli. Mol.Biol.Reports, 34, 261-266.
[70] Kurdrid, P, Subudhi, S, Hongsthong, A, Ruengjitchatchawalya, M, & Tanticharoen, M (2005). Functional expression of Spirulina-delta 6 desaturase gene in yeast, Saccharomyces cerevisiae. Mol.Biol.Reports, 32, 215-226.
[71] Lahmi, R, Sendersky, E, Perelman, A, Hagemann, M, Forchhammer, K, & Schwarz, R (2006). Alanine Dehydrogenase Activity Is Required for Adequate Progression of Phycobilisome Degradation during Nitrogen Starvation in Synechococcus elongatus PCC 7942. J. Bacteriol., 188, 5258-5265.
[72] Lehoux, IE & Mitra, B (2000). Role of arginine 277 in (S)-mandelate dehydrogenase from Pseudomonas putida in substrate binding and transition state stabilization. Biochemistry, 39, 10055-10065.
[73] Lehoux, IE & Mitra, B (1999). (S)-Mandelate dehydrogenase from Pseudomona putida: Mutations of the catalytic base histidine-274 and chemical rescue activity. Biochemistry, 38, 9948-9955.
[74] Lewin, RA (1980). Uncoil variants of Spirulina platensis (Cyanophyceae: Oscillatoriaceae). Arch. Hydro. Biol., 60(suppl), Algol. Stud., 26, 48-52.
[75] Li, H & Poulos, TL (1999). Fatty acid metabolism, conformational change, and electron transfer in cytochrome P-450BM-3. Biochim. Biophys. Acta, 1441, 141-149.
[76] Li, H & Sherman, LA (2002). Characterization of Synechocystis sp. strain PCC 6803 and nbl mutants under nitrogen-deficient conditions. Arch. Microbiol., 178, 256-266.
[77] Lu, C, Winteler, H, Abdelal, A, & Haas, D (1999). The ArgR regulatory protein, a helper to the anaerobic regulator ANR during transcriptional activation of the arcD promoter in Pseudomonas aeruginosa. J. Bacteriol., 181, 2459-2464.
[78] Luque, I, Ochoa De Alda, JA, Richaud, C, Zabulon, G, Thomas, JC, & Houmard, J (2003). The NblAI protein from the filamentous cyanobacterium Tolypothrix PCC 7601: regulation of its expression and interactions with phycobilisome components. Mol. Microbiol., 50, 1043-1054.
[79] Luque, I, Zabulon, G, Contreras, A, & Houmard, J (2001). Convergence of two global transcriptional regulators on nitrogen induction of the stress acclimation gene nblA in the cyanobacterium Synechococcus sp. PCC 7942. Mol. Microbiol., 41, 937-947.
[80] Maghnouj, A, Sousa Cabral, T, Stalon, V, & Wauven, CV (1998). The arcABCD gene cluster, encoding the arginine deiminase pathway of Bacillus licheniformis, and its activation by arginine repressor ArgR. J.Bacteriol., 180, 6468-6475.
Overview of Spirulina: Biotechnological, Biochemical… 99
[81] Marnett, LJ (1999). Lipid peroxidation-DNA damage by malondialdehyde. Mutation Research, 424, 83-95.
[82] Marquez, FJ, Saski, K, Nishio, N, & Nagai, S (1995). Inhibitory effect of oxygen accumulation of the growth of Spirulina platensis. Biotechnol. Lett., 17, 225.
[83] Martin-Luna, B, Hernandez, JA, Teresa Bes, M, Fillat, MF, & Peleato, ML (2006). Identification of a ferric uptake regulator from Microcystis aeruginosa PCC7806. FEMS Microbiol., 254, 63-70.
[84] Mary, I & Vaulot, D (2003). Two-component systems in Prochlorococcus MED4 genomic analysis and differential expression under stress. FEMS Microbiol. Lett., 226, 135-144.
[85] Mascher, T, Helmann, JD, & Unden, G (2006). Signal perception in bacterial signal-transducing histidine kinases. Microbiol. Mol. Biol. Rev., 70, 910-938.
[86] Michinaka, Y, Aki, T, Inagaki, K, Higashimota, H, Shimada, Y, Nikajima, T, Shimauchi, T, Ono, K, & Suzuki, O (2001). Production of polyunsaturated fatty acids by genetic engineering of yeast. J. Oleo. Sci., 5, 359-365.
[87] Mikami, K, Kanesaki, Y, Suzuki, I, & Murata, N (2002). The histidine kinase Hik33 perceives osmotic stress and cold stress in Synechocystis sp. PCC 6803. Mol. Microbiol., 46, 905-915.
[88] Moncada, S, Palmer, RMJ, & Higgs, EA (1991). Nitric oxide: physiology, pathophysiology and pharmacology. Pharmacological Reviews, 43, 109-142.
[89] Murata, N & Wada, H (1995). Acyl-lipid desaturases and their importance in the tolerance and acclimation to cold of cyanobacteria. Biochem.J., 308, 1-8.
[90] Mustady, L, Los, DA, Gombos, Z, & Murata, N (1996). Immunocytochemical localization of acyl-lipid desaturases in cyanobacterial cells: evidence that both thylakoid membranes and cytoplasmic membranes are the sites for lipid desaturation. Proc. Natl. Acad. Sci. USA, 93, 10524-27.
[91] Nakaya, N, Homma, Y, & Goto, Y (1988). Cholesterol lowering effect of Spirulina. Nutr. Rep. Int., 37, 1329-1337.
[92] Napier, J, Michaelson, LV, & Sayanova, O (2003). The role of cytochrome b5 fusion desaturases in the synthesis of polyunsaturated fatty acids. Prostaglandins Leukot. Essent. Fatty Acids, 68, 135-143.
[93] Narberhaus, F (2002). mRNA-mediated detection of environmental conditions. Arch. Microbiol., 178, 404-410.
[94] Nocker, A, Hausherr, T, Balsiger, S, Krstulovic, NP, Hennecke, H, & Narberhaus, F (2001). A mRNA-based thermosensor controls expression of rhizobial heat shock genes. Nucleic Acids Res., 29, 4800-4807.
[95] Nomsawai, P, Tandeau de Marsac, N, Thomas, JC, Tanticharoen, M, & Cheevadahanarak, S (1999). Light regulation of phycobilisome structure and gene expression in Spirulina platensis C1 (Arthrospira sp. PCC 9438). Plant Cell Physiol., 40, 1194-1202.
[96] Nubel, U, Garcia-Pichel, F, & Muyzer, G (2000). The halotolerance and phylogeny of cyanobacteria with tightly coiled trichromes (Spirulina Turpin) and the describtion of Halospirulina tapeticola gen. nov., sp. nov. Int. J. Sys. Evol. Microbiol., 50, 1265-1277.
[97] Ogawa, T (1991). A gene homologous to the subunit-2 gene of NADH dehydrogenase is essential to inorganic carbon transport of Synechocystis PCC 6803. Proc. Natl. Acad. Sci. USA, 88, 4275-4279.
Apiradee Hongsthong and Boosya Bunnag 100
[98] Olaizola, M (2003). Commercial development of microalgal biotechnology: from the test tube to the marketplace. Biomolecular Engineering, 20, 459-466.
[99] Outten, FW, Wod, MJ, Munoz, FM, & Storz, G (2003). The SufE protein and the SufBCD complex enhance SufS cysteine Desulfurase activity as part of a sulfur transfer pathway for Fe-S Cluster assembly in Escherichia coli. J. Biol. Chem., 278, 45713-45719.
[100] Panadero, J, Pallotti, C, Rodriguez-Vargas, S, Randez-Gil, F, & Prieto, JA (2006). A downshift in temperature activates the high osmolarity glycerol (HOG) pathway, which determines freeze tolerance in Saccharomyces cerevisiae. J Biol. Chem., 281, 4638-4645.
[101] Panichkin, VB, Arakawa-Kobayashi, S, Kanaseki, T, Suzuki, I, Los, DA, Shestakov, SV, & Murata, N (2006). Serine/threonine protein kinase SpkA in Synechocystis sp. strain PCC 6803 is a regulator of expression of three putative pilA operons, formation of thick pili, and cell motility. J. Bacteriol., 188, 7696-7699.
[102] Parsikh, P, Mani, U, & Iyer, U (2001). Role of Spirulina in the control of glycemia and lipidemia in type 2 diabetes mellitus. J. Med. Food, 4, 193-199.
[103] Pattridge, KA, Weber, CH, Friesen, JA, Sanker, S, Kent, C, & Ludwig, ML (2003). Glcerol-3-phosphate cytidylyltransferase: structural changes induced by binding of CDP-glycerol and the role of lysine residues in catalysis. J. Biol. Chem., 278, 51863-51871.
[104] Perry, L, Quan, X, Fang, R, Raj, M, Paula, I, Nunomura, A, Zhu, X, Smith, M, & George, A (2007). Prevention and treatment of Alzheimer disease and aging: Antioxidants. Medicinal Chemistry, 7, 171-180.
[105] Popelkova, H, Im, MM, & Yocum, CF (2002). N-terminal truncations of Manganese stabilizing protein identify two amino acid sequences required for binding of the eukaryotic protein to photosystem II and reveal the absence of one binding-related sequence in cyanobacteria. Biochemistry, 41, 10038-10045.
[106] Promnares, K (2001). Regulation of phycobilisomes expression of Spirulina platensis C1 by nitrogen deprivation. In: School of Bioresources and Technology. Bangkok, King Mongkut's University of Technology Thonburi.
[107] Ramamoorthy, A & Premakumari, S (1996). Effect of supplementation of Spirulina on hypercholesterolemic patients. J. Food Sci. Technol., 33, 124-128.
[108] Reddy, CM, Subhashini, J, Mahipal, SVK, Bhat, BV, Reddy, SP, Kiranmai, G, Madyastha, KM, & Reddanna, P (2003). C-phycocyanin, a selective cyclooxygenase-2 inhibitor, induces apoptosis in lipopolysaccharide-stimulated RAW 2647 macrophages. Biochem. Biophys. Res. Commun., 304, 385-394.
[109] Remirez, D, Ledon, N, & Gonzalez, R (2002). Role of histamine in the inhibitory effects of phycocyanin in experimental models of allergic inflammatory response. Mediators of Inflammation, 11, 81-85.
[110] Richaud, C, Zabulon, G, Joder, A, & Thomas, JC (2001). Nitrogen or sulfur starvation differentially affects phycobilisome degradation and expression of the nblA gene in Synechocystis strain PCC 6803. J. Bacteriol., 183, 2989-2994.
[111] Richmond, A (1986). Microalgae of economic potential. In: Richmond, A (Eds.), CRC Handbook of Microalgal Mass Culture. 199-244). Boca Raton, FL., CRC Press.
[112] Romay, C & Gonzalez, R (2000). Phycocyanin is an antioxidant protector of human erythrocytes against lysis by peroxyl radicals. J. Pharm. Pharmacol., 52, 367-368.
Overview of Spirulina: Biotechnological, Biochemical… 101
[113] Romay, C, Gonzalez, R, Ledon, N, Remeirez, D, & Rimbau, V (2003). C-Phycocyanin: A biliprotein with antioxidant, anti-flammatory and neuroprotective effects. Current Protein and Peptide Science, 4, 207-216.
[114] Routaboul, J, Fischer, SF, & Browse, J (2000). Trienoic fatty acids are required to maintain chloroplast function at low temperature. Plant Physiol., 124, 1697-1705.
[115] Sasata, RJ, Reed, DW, Loewen, MC, & Covello, PS (2004). Domain swapping localizes the structural determinants of regioselectivity in membrane-bound fatty acid desaturases of Caenorhabditis elegans. J. Biol. Chem., 279, 39296-39302.
[116] Saxena, PN, Ahmad, MR, Shyam, R, & Amla, DV (1983). Cultivation of Spirulina in sewage for poultry feed. Experientia, 39, 1077.
[117] Saxena, PN, Ahmad, MR, Shyam, R, Srivastava, HK, Doval, P, & Shinha, D (1982). Effect of feeding sewage-grown Spirulina on yolk pigmentation of white Leghorn eggs. Avian Research, 66, 41-46.
[118] Schwartz, J & Shklar, G (1987). Regression of experimental hamster cancer by beta carotene and algae extracts. J. Oral Maxillofac. Surg., 45, 510-515.
[119] Schwartz, J, Shklar, G, Reid, S, & Tricker, D (1988). Prevention of experimental oral cancer by extracts of Spirulina-Dunaliella algae. Nutr. Cancer, 11, 127-134.
[120] Schwartzbeck, JL, Jung, S, Abbott, AG, Mosley, E, Lewis, S, Pries, GL, & Powell, GL (2001). Endoplasmic oleoyl-PC desaturase references the second double bond. Phytochemistry, 57, 643-652.
[121] Schwarz, R & Forchhammer, K (2005). Acclimation of unicellular cyanobacteria to macronutrient deficiency: emergence of a complex network of cellular responses. Microbiol., 151, 2503-2514.
[122] Shanklin, J & Cahoon, EB (1998). Desaturation and related modifications of fatty acids. Annu.Rev.Plant Physiol.Plant Mol. Biol., 49, 611-641.
[123] Shibato, J, Agrawal, GK, Kato, H, Asayama, M, & Shirai, M (2002). The 5'-upstream cis-acting sequences of a cyanobacterial psbA gene: analysis of their roles in basal, light-dependent and circadian transcription. Mol. Genet. Genomics, 267, 684–694.
[124] Shin-Ru, S, Kun-Nan, T, Yi-Shuane, L, Chuang-Chun, C, & Err-Cheng , C (2003). Inhibition of enterovirus 71-induced apoptosis by allophycocyanin isolated from a blue-green alga Spirulina platensis. J. Med. Virol., 70, 119-125.
[125] Singh, AK & Sherman, LA (2000). Identification of ironresponsive, differential gene expression in the cyanobacterium Synechocystis sp. strain PCC 6803 with a customized amplification library. J. Bacteriol., 182, 3536-3543.
[126] Singh, DP, Singh, N, & Verma, K (1995). Photooxidative damage to the cyanobacterium Spirulina platensis mediated by singlet oxygen. Curr. Microbiol., 31, 44.
[127] Soni, B, Trivedi, U, & Madamwar, D (2008). A novel method of single step hydrophobic interaction chromatography for the purification of phycocyanin from Phormidium fragile and its characterization for antioxidant property. Bioresource Technology, 99, 188-194.
[128] Sperling, P, Ternes, P, Zank, TK, & Heinz, E (2003). The evolution of desaturases. Prostaglandins Leukot. Essent. Fatty Acids, 68, 73-95.
[129] Subhashini, J, Suraneni, VKM, Reddy, MC, Reddy, MM, Rachamallu, A, & Reddanna, P (2004). Molecular mechanisms in C-Phycocyanin induced apoptosis in human chronic myeloid leukemia cell line-K562. Biochemical Pharmacology, 68, 453-462.
Apiradee Hongsthong and Boosya Bunnag 102
[130] Subudhi, S, Kurdrid, P, Hongsthong, A, Sirijuntarut, M, Cheevadahanarak, S, & Tanticharoen, M (2008). Isolation and functional characterization of Spirulina D6D gene promoter: Role of a putative GntR transcription factor in transcriptional regulation of D6D gene expression. Biochem. Biophys. Res. Commun., 365, 643-649.
[131] Sunnerhagen, M, Nilges, M, Otting, G, & Carey, J (1997). Solution structure of the DNA-binding domain and model for the complex of multifunctional hexameric arginine repressor with DNA. Nat. Struct. Biol., 4, 819-826.
[132] Suphatrakul, A, Deshnium, P, Chaisawadi, S, Tanticharoen, M, & Cheevadahanarak, S (1997).The effect of temperature on the expression of the delta12-desaturase gene (desA) in Spirulina platensis C1. In: 3rd Asia-Pacific Conference on Algal Biotechnology. Phuket, Thailand.
[133] Suzuki, I, Los, DA, Kanesaki, Y, Mikami, K, & Murata, N (2000). The pathway for perception and transduction of low temperature signals in Synechocystis. EMBO J., 19, 1327-1334.
[134] Szarbo, C & Thiemermann, C (1995). Regulation of the expression of the inducible isoform of nitric oxide synthase. Advances in Pharmacology, 34, 113-153.
[135] Ta, TD & Vickery, LE (1992). Cloning, sequencing and overexpression of a [2Fe-2S] ferredoxin gene from Escherichia coli. J.Biol.Chem., 267, 11120-11125.
[136] Tewari, AK & Tripathy, BC (1998). Temperature-stress-induced impairment of chlorophyll biosynthetic reactions in cucumber and wheat. Plant Physiol., 117, 851-858.
[137] Thammathron, S (2001). Factors affecting coiling and uncoiling of Spirulina platensis C1. In: School of Bioresources and Biotechnology. Bangkok, King Mongkut's University of Technology Thonburi.
[138] Tirupati, B, Vey, JL, Drennan, CL, & Bollinger, JMJ (2004). Kinetic and structural charactrization of Slr0077/SufS, the essential cysteine desulfurase from Synechocystis sp. PCC 6803. Biochem., 43, 12210-12219.
[139] Tocher, DR, Leaver, MJ, & Hodgson, PA (1998). Recent advances in the biochemistry and molecular biology of fatty acyl desaturases. Pro. Lipid. Res., 37, 73-117.
[140] Torres-Duran, PV, Miranda-Zamora, R, Paredes-Carbajal, MC, Mascher, D, Ble-Castillo, J, Diaz-Zagoya, JC, & Juarez-Oropeza, MA (1999). Studies on the preventive effect of Spirulina maxima on fatty liver development induced by carbon tetrachloride, in the rat. J. Ethnopharmacol., 64, 141-147.
[141] Trushina, E & McMurray, CT (2007). Oxidative stress and mitochondrial dysfunction in neurodegenerative diseases. Neuroscience, 145.
[142] Tsukada, O, Kawahara, T, & Miyachi, S (1977). Mass culture of Chlorella in Asian countries. In: Mitsui, A, Miyachi, S, San Pietro, A, & Tamura, S (Eds.), Biological Solar Energy Conversion. 363-365). New York, Academic Press.
[143] Valko, M, Rhodes, B, Moncola, M, Izakovic, A, & Mazura, M (2006). Free radicals, metals and antioxidants in oxidative stress-induced cancer. Chemico-Biological Interactions, 160, 1-40.
[144] Vane, JR, Mitchell, JA, Appleton, I, Tomlinson, A, Bishop-Bailey, D, Croxtall, J, & Willoughby, DA (1994). Inducible isoforms of cyclooxygenase and nitric oxide synthase in inflammation. Proc. Natl. Acad. Sci. USA, 91, 2046-2050.
[145] Varkonyi, Z, Zsiros, O, Farkas, T, Garab, G, & Gombos, Z (2000). The tolerance of cyanobacterium Cylindrospermopsis raciborskii to low-temperature photo-inhibition
Overview of Spirulina: Biotechnological, Biochemical… 103
affected by the induction of polyunsaturated fatty acid synthesis. Biochem. Soc. Trans., 28, 892-894.
[146] Vergeres, G, Yen, TSB, Aggeler, J, Lausier, J, & Waskell, L (1993). A model system for studying membrane biogenesis: Overexpression of cytochrome b5 in yeast results in marked proliferation of the intracellular membrane. J.Cell Sci., 106, 249-259.
[147] Vijayan, P & Browse, J (2002). Photoinhibition in mutants of Arabidopsis deficient in thylakoid membrane. Plant Physiol., 129, 876-885.
[148] Vollmer, M, Thomsen, N, Wiek, S, & Seeber, F (2001). Apicomplexan parasites possess distinct nuclear-encoded, but apicoplast-localized, plant-type ferredoxin-NADP+ reductase and ferredoxin. J. Biol. Chem., 276, 5483-5490.
[149] von Meyenburg, K, Jorgensen, B, & Deurs, B (1984). Physiological and morphological effects of overexpression of membrane-bound ATP synthase in Escherichia coli K-12. EMBO J., 3, 1791-1797.
[150] Wada, H & Murata, N (1990). Temperature-induced changes in the fatty acid composition of the cyanobacterium, Synechocystis sp. PCC 6803. Plant Physiol., 92, 1062-1069.
[151] Wang, Y, Delettre, J, Guillot, A, Corrieu, G, & Beal, C (2005). Influence of cooling temperature and duration on cold adaptation of Lactobacillus acidophilus RD758. Cryobiology, 50, 294-307.
[152] Wang, ZP, Chen, SM, Jia, XM, Cui, HR, & Xu, BJ (1997). The effect of environmental factors and gamma-rays on the morphology and growth of Spirulina platensis. J. Zhejiang Agric. Univ., 23, 36-40.
[153] Wang, ZP, Cui, HR, Zhu, JX, Jia, XM, & Qian, KX (1998). The comparison of growth rate and photopigments of filament of Spirulina platensis strain Z with different morphology. Acta Microbiol. Sin., 38, 321-324.
[154] Wang, ZP & Zhao, Y (2005). Morphological reversion of Spirulina (Arthrospira) platensis (Cyanophyta): from linear to helical. J. Phycol., 41, 622-628.
[155] Weerasinghe, JP, Dong, T, Schertzberg, MR, Kirchhof, MG, Sun, Y, & Schellhorn, HB (2006). Stationary phase expression of the arginine biosynthetic operon argCBH in Escherichia coli. BMC Microbiol., 6.
[156] Weiner, JH, Lemire, BD, Elmes, ML, Bradley, RD, & Scraba, DG (1984). Overproduction of fumarate reductase in Escherichia coli induces a novel intracellular lipid-protein organelle. J. Bacteriol., 158, 590-596.
[157] Whittle, E & Shanklin, J (2001). Engineering delta9-16:0-acyl carrier protein (ACP) desaturase specificity based on combinatorial saturation mutagenesis and logical redesign of the castor delta9-18:0-ACP desaturase. Biol.Chem., 276, 21500-21505.
[158] Wu, H, Gao, K, Villafane, VE, Watanabe, T, & Helbling, EW (2005). Effects of solar UV radiation on morphology and photosynthesis of filamentous cyanobacterium Arthrospira platensis. Appl. Environ. Microbiol., 71, 5004-5013.
[159] Xia, B, Ke, H, Shinde, U, & Inouye, M (2003). The role of RfbA in 16S rRNA processing and cell growth at low temperature in Escherichia coli. J. Mol. Biol., 332, 575-584.

In: Handbook on Cyanobacteria ISBN: 978-1-60741-092-8 Editors: P. M. Gault and H. J. Marler © 2009 Nova Science Publishers, Inc.
Chapter 3
PHYCOBILISOMES FROM CYANOBACTERIA
Li Sun1*, Shumei Wang2, Mingri Zhao1, Xuejun Fu1, Xueqin Gong1, Min Chen1 and Lu Wang1
1 College of Chemistry and Biology Sciences, Yantai University, Yantai 264005, P. R. China
2 College of Photo-Electronic Information Science and Technology, Yantai University, Yantai 264005, P. R. China
ABSTRACT
Cyanobacteria are prokaryotic oxygen-evolving photosynthetic organisms which had developed a sophisticated linear electron transport chain with two photochemical reaction systems, PSI and PSII, as early as a few billion years ago cyanobacteria. By endosymbiosis, oxygen-evolving photosynthetic eukaryotes are evolved and chloroplasts of the photosynthetic eukaryotes are derived from the ancestral cyanobacteria engulfed by the eukaryotic cells. Cyanobacteria employ phycobiliproteins as major light-harvesting pigment complexes which are brilliantly colored and water-soluble chromophore-containing proteins. Phycobiliproteins assemble to form an ultra-molecular complex known as phycobilisome (PBS). Most of the PBSs from cyanobacteria show hemidiscoidal morphology in electron micrographs. The hemidiscoidal PBSs have two discrete substructural domains: the peripheral rods which are stacks of disk-shaped biliproteins, and the core which is seen in front view as either two or three circular objects which arrange side-by-side or stack to form a triangle. For typical hemidiscoidal PBSs, the rod domain is constructed by six or eight cylindrical rods that radiate outwards from the core domain. The rods are made up of disc-shaped phycobiliproteins, phycoerythrin (PE), phycoerythrocyanin (PEC) and phycocyanin (PC), and corresponding rod linker polypeptides. The core domain is more commonly composed of three cylindrical sub-assemblies. Each core cylinder is made up of four disc-shaped phycobiliprotein trimers, allophycocyanin (AP), allophycocyanin B (AP-B) and AP core-membrane linker complex (AP-LCM). By the core-membrane linkers, PBSs attach on the stromal side surface of thylakoids and are structurally coupled with PSII. PBSs harvest the sun light that chlorophylls poorly absorb and transfer the energy in high efficiency to
* Corresponding author. Address: College of Chemistry and Biology Sciences, Yantai University, Yantai 264005, P. R. China. Tel: +86 535 6902743-8005; E-mail address: [email protected] (Li Sun)
Li Sun, Shumei Wang, Mingri Zhao et al. 106
PSII, PSI or other PBSs by AP-LCM and AP-B, known as the two terminal emitters of PBSs. This directional and high-efficient energy transfer absolutely depends on the intactness of PBS structure. For cyanobacteria, the structure and composition of PBSs are variable in the course of adaptation processes to varying conditions of light intensity and light quality. This feature makes cyanobacteria able to grow vigorously under the sun light environments where the photosynthetic organisms which exclusively employ chlorophyll-protein complexes to harvesting sun light are hard to live. Moreover, under stress conditions of nitrogen limitation and imbalanced photosynthesis, active phycobilisome degradation and phycobiliprotein proteolysis may improve cyanobacterium survival by reducing the absorption of excessive excitation energy and by providing cells with the amino acids required for the establishment of the ‘dormant’ state. In addition, the unique spectroscopic properties of phycobiliproteins have made them be promising fluorescent probes in practical application.
1. INTRODUCTION Life on earth depends on the process of oxygen-evolving photosynthesis, where the
oxygenic photosynthetic organisms use the light energy from the sun to convert CO2 into carbohydrates. Two photochemical reaction systems, named photosystem I (PSI) and photosystem II (PSII), catalyze the first step of this conversion where the light induces charge separation between thylakoid membranes. In both photosystems, the energy of photons from sun light is employed to translocate electrons across the thylakoid membrane via a linear chain of electron carriers. Water that is oxidized to O2 and 4H+ by PSII in the lumenal side of thylakoids acts as electron donor for the whole linear electron transfer process. The electron transfer processes are coupled with a build up of a difference in proton concentration across the thylakoid membrane. The establishing electrochemical potential drives the synthesis of ATP from ADP and inorganic phosphate, which is catalyzed by the ATP-synthase located across the thylakoid membrane. Finally, PS I reduces ferredoxin, which provides the electrons for the reduction of NADP+ to NADPH by feredoxin-NADP+-oxidoreductase (FNR). NADPH and ATP are eventually used to reduce CO2 to carbohydrates in the subsequent dark reactions that the carbon-linked reactions of photosynthesis coordinate with the light-driven photochemical reactions.
Cyanobacteria are prokaryotic oxygen-evolving photosynthetic organisms. They use chlorophyll a (Chla) and phycobiliproteins to function as major photosynthetic pigments. In the history of photosynthetic organism evolution, as early as a few billion years ago cyanobacteria had developed a sophisticated linear electron transport chain with two photochemical reaction systems, PSI and PSII [1-3]. The two photosystems driven by sun light are able to pull electrons from water and give rise to molecular oxygen. Investigations on plasmid evolution of photosynthetic organisms based on phylogenetic relationships as well as morphological and biochemical similarities have adequately demonstrated that chloroplasts of eukaryotic photosynthetic organisms are derived from an ancestral cyanobacterium by means of an endosymbiotic event where the cyanobacterium was incorporated into a heterotrophic and eukaryotic host cell to form a primary symbiotic oxygen-evolving photosynthetic eukaryote. The cyanobacterium engulfed by the eukaryotic cell was then reduced and transformed into a membrane-bounded photosynthetic organelle (plastid), partly by the loss of much of its genome and the transfer of most of the remaining genes to the
Phycobilisomes from Cyanobacteria 107
nucleus of its host eukaryote [2-9]. This original uptake and retention of a cyanobacterium by a heterotrophic eukaryote is referred to primary endosymbiosis, and the correspondingly evolved photosynthetic organelles (chloroplasts) that function oxygen-evolving photosynthesis are called primary plastids. Although oxygenic photosynthesis of cyanobacteria appears to have evolved only once, it subsequently spreads via endosymbiosis to a wide variety of eukaryotes. Therefore, prokaryotic cyanobacteria are primitive oxygenic photosynthetic organisms.
There are three major extant photosynthetic organisms that are believed to originate from the primary endosymbiosis: glaucophytes, red algae and green algae. Glaucophytes are a small group of microscopic algae found in fresh environments. Although there are only 13 species of glaucophytes, they are important because of their occupying a pivotal position in the evolution of photosynthesis in eukaryotes [3-4, 10-11]. Glaucophytes inherit photosynthetic pigments from cyanobacteria: Chla, phycobiliproteins and even phycobilisomes, small particles of phycobiliprotein assemblies found in cyanobacteria. Red algae are a very large and diverse group of microscopic algae and macroalgae which are present in freshwater and more common in marine environments. Red algae take over Chla, phycobiliproteins and also phycobilisomes from their ancestral cyanobacterium [1, 3-4]. By secondary endosymbiosis, the red eukaryotic primary symbionts were incorporated in a variety of heterotrophic and eukaryotic host cells to give rise to cryptophytes, haptophytes, heterokonts and perinnin-containing dinoflagellates [2-4, 6, 12-14]. Rather than the two membranes bounding primary plastids, most secondary plastids are characterized by their four or sometimes three surrounding membranes. Cryptophytes inherit Chla and phycobiliproteins but no phycobilisomes from their ancestral red algae and in the mean time developed their own chlorophyll c (Chlc) and corresponding Chla/c-protein complexes in evolution [1, 3, 15-16]. Haptophytes, heterokonts and perinnin-containing dinoflagellates contain Chla, Chlc but no phycobiliproteins [1, 3]. Green algae are another large and diverse group of predominantly freshwater algae. They conserved Chla, lost phycobiliproteins and developed chlorophyll b (Chlb) and corresponding Chla/b-protein complexes in their evolution [1-4]. Green algae are roughly divided into chlorophytes and charophytes. Charophytes are believed to be one branch of green algae to give rise to land plants. By secondary endosymbiosis, three extant symbionts obtained primary plastids from green algae in association with three different host eukaryotic cells gave rise to euglenophytes, chlorarachnophytes and “green” dinoflagellates [3, 4, 8; 17]. These secondary symbionts contain photosynthetic pigments of Chla and Chlb the same as their ancestral green algae. Conclusively, prokaryotic cyanobacteria are the precursor of various chloroplasts of all oxygen-evolving eukaryotic organisms.
Because of their occupying a predecessor position in the evolution of photosynthesis in oxygenic photosynthetic organisms, scientists have paid a great attention to investigations on cyanobacterium photosynthesis, especially on photochemical reaction systems and other electron transfer complexes, to provide a model for researches on eukaryote photosynthesis. For cyanobacteria, the linear electron transport chain developed in their evolution includes three major multi-polypeptide protein complexes, PSI, PSII and cytochrome b6/f complex, which imbed in thylakoid membranes of cyanobacteria [18-20]. PSI from cyanobacteria consists of 12 protein subunits, 96 Chla molecules, 22 carotenoids, three [4Fe4S] clusters and two phylloquinones [21-23]. Among the 12 protein subunits named according to their genes, there are three stromal subunits, PsaC, PsaD and PsaE, which are located on the stromal-side surface of thylakoid membranes, and nine membrane intrinsic subunits, PsaA, PsaB, PsaF,
Li Sun, Shumei Wang, Mingri Zhao et al. 108
PsaI, PsaJ, PsaK, PsaL, PsaM and PsaX, which are characterized of their transmembrane α-helices in structure. The photochemical reaction center of PSI, where the charge separation is initiated, is the primary electron donor (P700) identified by spectroscopy. P700 was proved to be probably a dimmer of Chla molecules which were located at the lumenal side of thylakoid membranes [21-26]. In PSI, the electron transfers stepwise from P700 to A (a chlorophyll a molecule), A0 (also a chlorophyll a molecule), A1 (a phylloquinone molecule) and from there to the three [4Fe4S] clusters, FX, FA and FB. The distal iron-sulfur cluster FB transfers the electron to ferredoxin, for which the binding site is located at the stromal side of PSI. Being reduced, the ferredoxin leaves the docking site to transfer the electron to the ferredoxin-NADP+ reductase to produce NADPH [27]. In native thylakoid membranes, PSI exists as a trimer with a molecular mass of 1068 kDa for the whole trimeric complex [21-22, 28].
PSII is another chlorophyll-protein complex which works together with PSI in series in the photochemical reaction of cyanobacterium photosynthesis. PSII was proved to exist as a homodimer in native thylakoid membranes and has a molecular mass of 700 kDa [29-30]. Each monomer of PSII complex contains a reaction center (RC) core where light energy is converted into electrochemical potential energy by initiation of the light-driving charge separation across the thylakoid membrane and where the water-oxidizing reaction occurs in the lumenal side of thylakoids. The RC core consists of two homologous proteins known as D1 (PsbA) and D2 (PsbD) each of which contains five transmembrane α-helices and they assemble in a dimeric aggregate [29-32]. The RC proteins of D1 and D2 hold pigment cofactors that take part in the charge separation and primary electron transport. The pigments include six Chla molecules of three pairs (PD1 and PD2, ChlD1 and ChlD2, ChlzD1 and ChlzD2), two pheophytins (PheoD1 and PheoD2) and two plastquinones (QA and QB) which are related by approximate twofold symmetry. The two central Chla molecules of PD1 and PD2 associate together in dimmer to form a special pigment pair that is referred to as P680 [30, 32-33]. Driven by sun light, the excited primary donor is oxidized to P680+. The P680+ is re-reduced via redox-active tyrosine TyrZ (D1 Tyr161) by an electron from a Mn4Ca cluster that catalyzes the oxidation of water to atmospheric oxygen [33-37]. The electron released from P680 travels along the electron transfer chain (ETC) featuring two pairs of Chla, one pair of pheophytin a (Pheoa) and two plastoquinones (QA and QB). After two cycles, doubly reduced QB is protonated by taking up two protons from the stromal side of the thylakoid membrane and released as plastoquinol QBH2 into the plastoquinone pool in the thylakoid membrane. Then QBH2 is oxidized to QB by cytochrome b6f complexes. Closely associated with the D1 and D2 proteins are two Chla-containing proteins called CP43 (PsbB) and CP47 (PsbC). They also are structurally homologous and have six transmembrane α-helices. Each of them contains 12-14 Chla molecules, functioning as inner light-harvesting pigment-proteins in PSII. Cytochrome b559 (Cyt- b559) is another PSII component closely associated with the RC. Besides the subunits mentioned above, PSII from cyanobacteria also have other 13 small protein subunits, PsbH, PsbI, PsbJ, PsbK, PsbL, PsbM, PsbN, PsbO, PsbT, PsbU, PsbV, PsbX and PsbZ [30, 33, 38-39].
In the linear electron transfer process, PSII functions as a light-dependent water-plastquinone-oxidoreductase. Driven by sun light, PSII catalyzes water oxidation to release O2 and 4H+ and in the mean time reduces QB to QBH2 released in the plastquinone pool in thylakoid membranes. By the plastquinone pool, PSII is coupled with a transmembrane multi-subunit electron transfer in the photochemical reaction system of oxygenic organisms, known
Phycobilisomes from Cyanobacteria 109
as the cytochrome b6f complex. The cytochrome b6f complex functions as a plastquinone-plastcyanin oxidoreductase to transfer electrons from reduced plastquinone to oxidized plastcyanin [32, 40]. The plastcyanin is a mobile electron carrier, and a low-molecular-mass (11 kDa) and copper-containing protein in the lumenal side of thylakoid membranes. By acting as the electron accepter of the cytochrome b6f complex and the electron donor of PSI, the plastcyanin links the cytochrome b6f complex and PSI. From this point, PSI functions as a light-dependent plastcyanin-ferredoxin oxidoreductase, getting electrons by oxidizing the reduced plastcyanin at the lumenal side and producing NADPH by reducing NADP+ at the stromal side. In company with the light-dependent electron transfer process, a unidirectional proton accumulation occurs spontaneously across the thylakoid membrane, resulting in a high concentration of protons on the lumenal side of the membrane and a lower concentration of protons on the stromal side of the membrane. By the aid of the proton difference that supplies the proton motive force, the ATP synthase imbedding across thylakoid membranes catalyzes ATP synthesis from ADP and inorganic phosphate at the stromal side of thylakoids. This light-dependent ATP synthesis is known as photosynthetic phosphorylation. NADPH and ATP produced in the stromal side, which is in the cytoplasmal side for cyanobacteria, participate in the subsequent dark reactions where CO2 is reduced and converted to carbohydrates.
Cyanobacteria use Chla and phycobiliproteins as major light-harvesting pigments that exist in pigment-protein complexes. The complexes absorb the sun light from 400 nm to 750 nm to support efficient performance of cyanobacterium photosynthesis. In cyanobacteria, Chla molecules are all combined in PSI and PSII and associated with the certain protein subunits: PsaA and PsaB which carry 79 of the 90 chlorophylls in one PSI monomer [21], CP43 (PsbB) and CP47 (PsbC) that bind 26 of the 32 chlorophylls in each PSII monomer [30]. In this case, these Chla-associating proteins function at most as only the inner light-harvesting pigment-protein complexes of PSI and PSII. In other words, cyanobacteria have no chlorophyll-containing proteins that act as external light-harvesting complexes like those found in green algae and plants (figure 1 I and II) [41-45]. However, cyanobacteria, including glaucophytes, red algae and cryptophytes, employ phycobiliproteins as the external light-harvesting complexes to provide the absorbed energy to PSII and PSI [1-2, 4]. In cyanobacteria, glaucophytes and red algae, phycobiliproteins assemble to form an ultra-molecular complex known as phycobilisome (PBS) [46], whereas the phycobiliproteins in cryptophytes aggregate in rod-shape complex across thylakoid lumena [16]. Phycobilisomes anchor on the stroma side surface of thylakoids and commonly on top of PSII (figure 1 III) [18, 39]. Phycobilisomes harvest the sun light that chlorophylls poorly absorb. The harvested light energy by PBSs predominantly transferred to PSII, under some certain conditions, however, the energy can also be supplied to PSI by means of PBSs moving on thylakoid membranes and attaching to PSI. With the aid of phycobilisomes, cyanobacteria, red algae, glaucophytes and even cryptophytes are able to grow vigorously under the sun light environments where green algae, euglenophytes and chlorarachnophytes are hard to live owing to their using exclusively chlorophyll-protein complexes to harvesting sun light. This review mainly focuses on the phycobilisomes from cyanobacteria, including structural characteristics of the phycobilisomes, phycobiliprotein components and their features, linker polypeptides and their functions, component organization of the phycobilisomes and applications of phycobiliproteins as fluorescent probes.

Li Sun, Shumei Wang, Mingri Zhao et al. 110
I.
II.
Figure 1. Continued on next page.
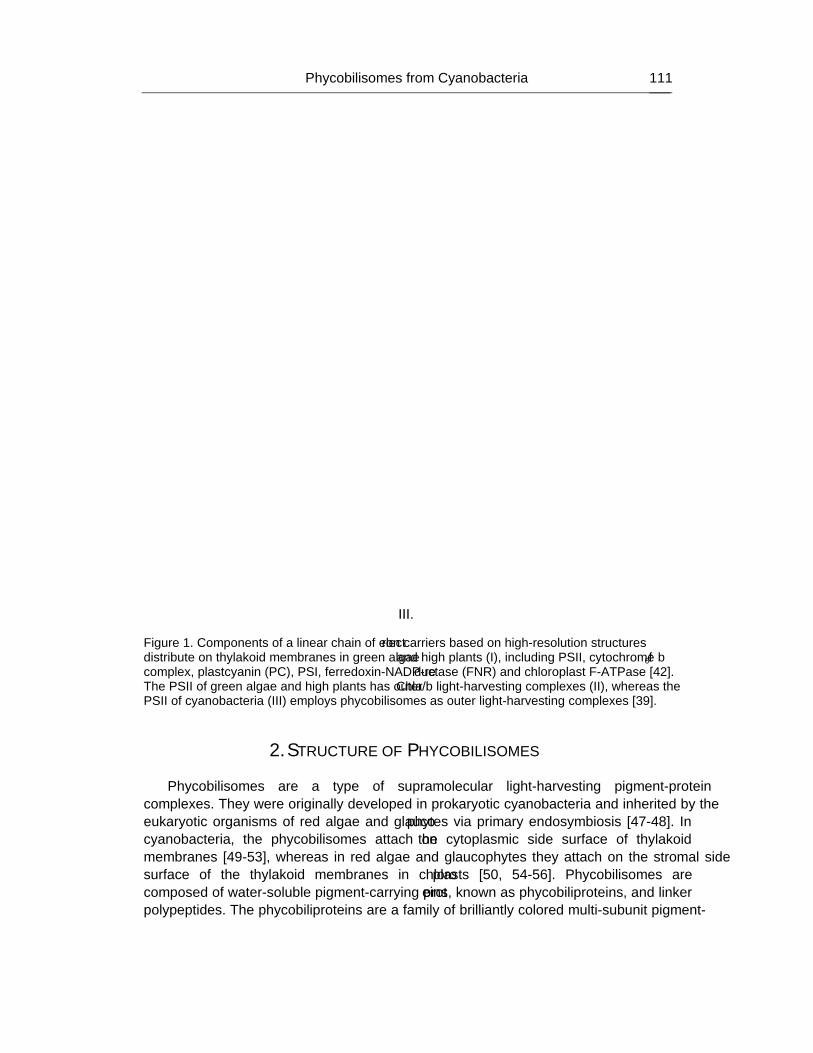
Phycobilisomes from Cyanobacteria 111
III.
Figure 1. Components of a linear chain of electron carriers based on high-resolution structures distribute on thylakoid membranes in green algae and high plants (I), including PSII, cytochrome b6f complex, plastcyanin (PC), PSI, ferredoxin-NADP-reductase (FNR) and chloroplast F-ATPase [42]. The PSII of green algae and high plants has outer Chla/b light-harvesting complexes (II), whereas the PSII of cyanobacteria (III) employs phycobilisomes as outer light-harvesting complexes [39].
2. STRUCTURE OF PHYCOBILISOMES
Phycobilisomes are a type of supramolecular light-harvesting pigment-protein
complexes. They were originally developed in prokaryotic cyanobacteria and inherited by the eukaryotic organisms of red algae and glaucophytes via primary endosymbiosis [47-48]. In cyanobacteria, the phycobilisomes attach on the cytoplasmic side surface of thylakoid membranes [49-53], whereas in red algae and glaucophytes they attach on the stromal side surface of the thylakoid membranes in chloroplasts [50, 54-56]. Phycobilisomes are composed of water-soluble pigment-carrying proteins, known as phycobiliproteins, and linker polypeptides. The phycobiliproteins are a family of brilliantly colored multi-subunit pigment-
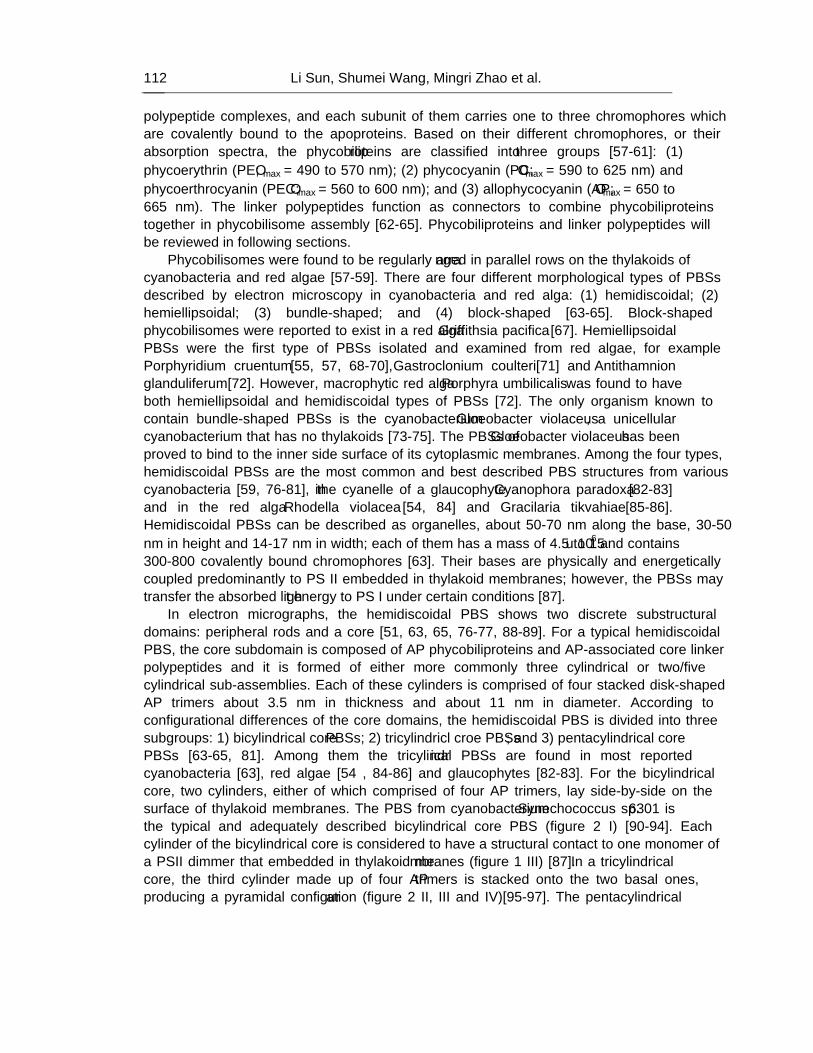
Li Sun, Shumei Wang, Mingri Zhao et al. 112
polypeptide complexes, and each subunit of them carries one to three chromophores which are covalently bound to the apoproteins. Based on their different chromophores, or their absorption spectra, the phycobiliproteins are classified into three groups [57-61]: (1) phycoerythrin (PE; λmax = 490 to 570 nm); (2) phycocyanin (PC; λmax = 590 to 625 nm) and phycoerthrocyanin (PEC; λmax = 560 to 600 nm); and (3) allophycocyanin (AP; λmax = 650 to 665 nm). The linker polypeptides function as connectors to combine phycobiliproteins together in phycobilisome assembly [62-65]. Phycobiliproteins and linker polypeptides will be reviewed in following sections.
Phycobilisomes were found to be regularly arranged in parallel rows on the thylakoids of cyanobacteria and red algae [57-59]. There are four different morphological types of PBSs described by electron microscopy in cyanobacteria and red alga: (1) hemidiscoidal; (2) hemiellipsoidal; (3) bundle-shaped; and (4) block-shaped [63-65]. Block-shaped phycobilisomes were reported to exist in a red alga Griffithsia pacifica [67]. Hemiellipsoidal PBSs were the first type of PBSs isolated and examined from red algae, for example Porphyridium cruentum [55, 57, 68-70], Gastroclonium coulteri [71] and Antithamnion glanduliferum [72]. However, macrophytic red alga Porphyra umbilicalis was found to have both hemiellipsoidal and hemidiscoidal types of PBSs [72]. The only organism known to contain bundle-shaped PBSs is the cyanobacterium Gloeobacter violaceus, a unicellular cyanobacterium that has no thylakoids [73-75]. The PBSs of Gloeobacter violaceus has been proved to bind to the inner side surface of its cytoplasmic membranes. Among the four types, hemidiscoidal PBSs are the most common and best described PBS structures from various cyanobacteria [59, 76-81], in the cyanelle of a glaucophyte Cyanophora paradoxa [82-83] and in the red alga Rhodella violacea [54, 84] and Gracilaria tikvahiae [85-86]. Hemidiscoidal PBSs can be described as organelles, about 50-70 nm along the base, 30-50 nm in height and 14-17 nm in width; each of them has a mass of 4.5 to 15 × 106 and contains 300-800 covalently bound chromophores [63]. Their bases are physically and energetically coupled predominantly to PS II embedded in thylakoid membranes; however, the PBSs may transfer the absorbed light energy to PS I under certain conditions [87].
In electron micrographs, the hemidiscoidal PBS shows two discrete substructural domains: peripheral rods and a core [51, 63, 65, 76-77, 88-89]. For a typical hemidiscoidal PBS, the core subdomain is composed of AP phycobiliproteins and AP-associated core linker polypeptides and it is formed of either more commonly three cylindrical or two/five cylindrical sub-assemblies. Each of these cylinders is comprised of four stacked disk-shaped AP trimers about 3.5 nm in thickness and about 11 nm in diameter. According to configurational differences of the core domains, the hemidiscoidal PBS is divided into three subgroups: 1) bicylindrical core PBSs; 2) tricylindricl croe PBSs; and 3) pentacylindrical core PBSs [63-65, 81]. Among them the tricylindrical PBSs are found in most reported cyanobacteria [63], red algae [54 , 84-86] and glaucophytes [82-83]. For the bicylindrical core, two cylinders, either of which comprised of four AP trimers, lay side-by-side on the surface of thylakoid membranes. The PBS from cyanobacterium Synechococcus sp. 6301 is the typical and adequately described bicylindrical core PBS (figure 2 I) [90-94]. Each cylinder of the bicylindrical core is considered to have a structural contact to one monomer of a PSII dimmer that embedded in thylakoid membranes (figure 1 III) [87]. In a tricylindrical core, the third cylinder made up of four AP trimers is stacked onto the two basal ones, producing a pyramidal configuration (figure 2 II, III and IV) [95-97]. The pentacylindrical

Phycobilisomes from Cyanobacteria 113
core has additional core elements, two half-cylinders each of which is composed of two AP trimers. These two half-cylinders bind on each side of the upper cylinder of the tricylindrical core. Investigations on the PBS from cyanobacterium Mastigocladus laminosus and Anabaena sp. PCC 7120 fully demonstrated and characterized the pentacylindrical core of hemidiscoidal PBSs (figure 2 V) [63, 98-99]. Besides hemidiscoidal PBSs, The core of a pentacylindrical type has recently been revealed and adequately described in the bundle-shaped PBS from the cyanobacterium Gloeobacter violaceus (figure 3) [75].
Figure 2. Continued on next page.
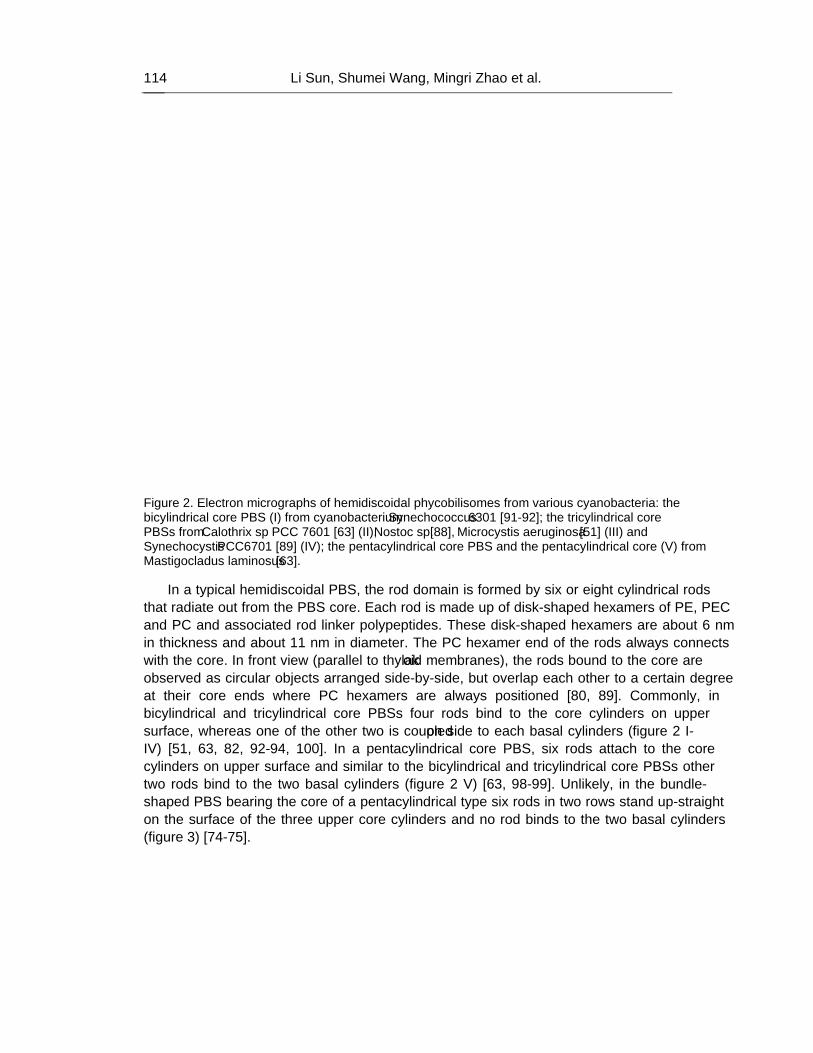
Li Sun, Shumei Wang, Mingri Zhao et al. 114
Figure 2. Electron micrographs of hemidiscoidal phycobilisomes from various cyanobacteria: the bicylindrical core PBS (I) from cyanobacterium Synechococcus 6301 [91-92]; the tricylindrical core PBSs from Calothrix sp. PCC 7601 [63] (II), Nostoc sp. [88], Microcystis aeruginosa [51] (III) and Synechocystis PCC6701 [89] (IV); the pentacylindrical core PBS and the pentacylindrical core (V) from Mastigocladus laminosus [63].
In a typical hemidiscoidal PBS, the rod domain is formed by six or eight cylindrical rods that radiate out from the PBS core. Each rod is made up of disk-shaped hexamers of PE, PEC and PC and associated rod linker polypeptides. These disk-shaped hexamers are about 6 nm in thickness and about 11 nm in diameter. The PC hexamer end of the rods always connects with the core. In front view (parallel to thylakoid membranes), the rods bound to the core are observed as circular objects arranged side-by-side, but overlap each other to a certain degree at their core ends where PC hexamers are always positioned [80, 89]. Commonly, in bicylindrical and tricylindrical core PBSs four rods bind to the core cylinders on upper surface, whereas one of the other two is coupled on side to each basal cylinders (figure 2 I-IV) [51, 63, 82, 92-94, 100]. In a pentacylindrical core PBS, six rods attach to the core cylinders on upper surface and similar to the bicylindrical and tricylindrical core PBSs other two rods bind to the two basal cylinders (figure 2 V) [63, 98-99]. Unlikely, in the bundle-shaped PBS bearing the core of a pentacylindrical type six rods in two rows stand up-straight on the surface of the three upper core cylinders and no rod binds to the two basal cylinders (figure 3) [74-75].
Phycobilisomes from Cyanobacteria 115
Figure 3. The bundle-shaped PBS from cyanobacterium Gloeobacter violaceus: (I) an electron micrograph [74] and (II) a model assembly [75]. The bundle-shaped PBS has a pentacylindrical core and six rods which stand up-straight in two rows on the surface of the three upper core cylinders. In (II), (A) shows six peripheral rods which are bound as a bundle to the allophycocyanin core and corresponding linker polypeptides; (B) shows one cylinder and two halfcylinders (centered) of the second level of the core, where the core cylinders is light blue in color and the six rods are seen in dark blue color; (C) is the side view of the pentacylindrical core; (D) is the bottom view of the pentacylindrical core; (E) is the top view of the pentacylindrical core. More details see reference [75].
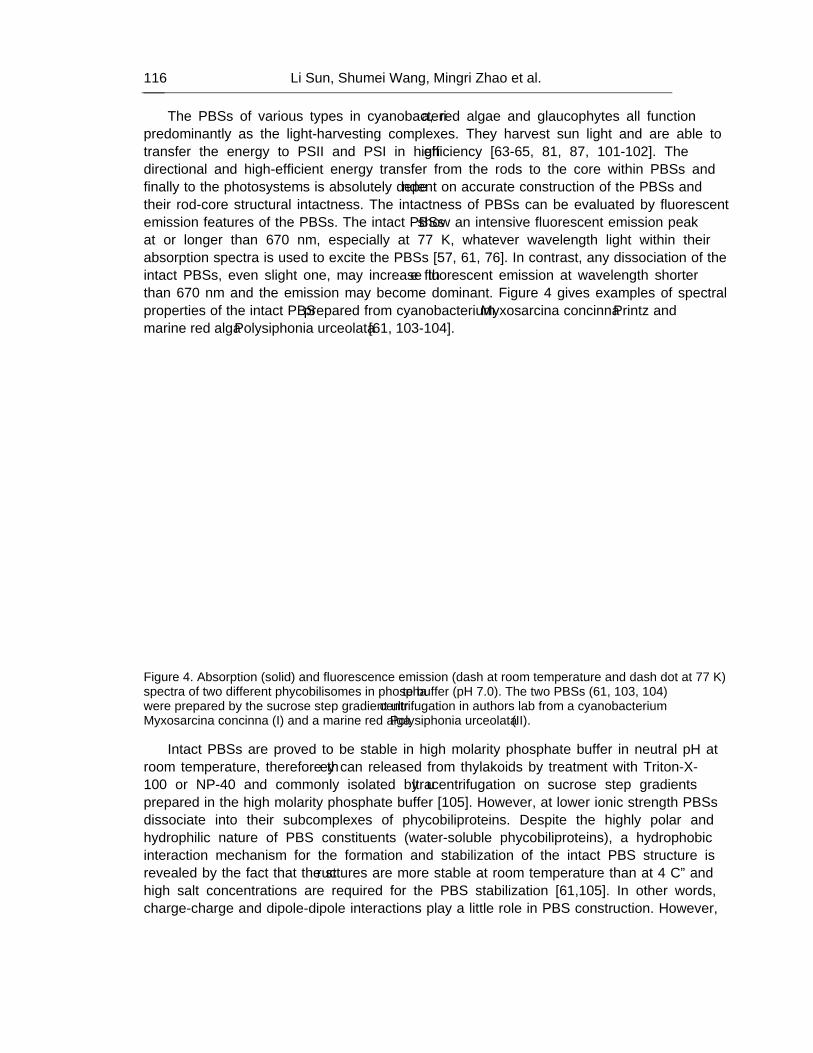
Li Sun, Shumei Wang, Mingri Zhao et al. 116
The PBSs of various types in cyanobacteria, red algae and glaucophytes all function predominantly as the light-harvesting complexes. They harvest sun light and are able to transfer the energy to PSII and PSI in high efficiency [63-65, 81, 87, 101-102]. The directional and high-efficient energy transfer from the rods to the core within PBSs and finally to the photosystems is absolutely dependent on accurate construction of the PBSs and their rod-core structural intactness. The intactness of PBSs can be evaluated by fluorescent emission features of the PBSs. The intact PBSs show an intensive fluorescent emission peak at or longer than 670 nm, especially at 77 K, whatever wavelength light within their absorption spectra is used to excite the PBSs [57, 61, 76]. In contrast, any dissociation of the intact PBSs, even slight one, may increase the fluorescent emission at wavelength shorter than 670 nm and the emission may become dominant. Figure 4 gives examples of spectral properties of the intact PBS prepared from cyanobacterium Myxosarcina concinna Printz and marine red alga Polysiphonia urceolata [61, 103-104].
Figure 4. Absorption (solid) and fluorescence emission (dash at room temperature and dash dot at 77 K) spectra of two different phycobilisomes in phosphate buffer (pH 7.0). The two PBSs (61, 103, 104) were prepared by the sucrose step gradient ultrcentrifugation in authors’ lab from a cyanobacterium Myxosarcina concinna (I) and a marine red alga Polysiphonia urceolata (II).
Intact PBSs are proved to be stable in high molarity phosphate buffer in neutral pH at room temperature, therefore they can released from thylakoids by treatment with Triton-X-100 or NP-40 and commonly isolated by ultracentrifugation on sucrose step gradients prepared in the high molarity phosphate buffer [105]. However, at lower ionic strength PBSs dissociate into their subcomplexes of phycobiliproteins. Despite the highly polar and hydrophilic nature of PBS constituents (water-soluble phycobiliproteins), a hydrophobic interaction mechanism for the formation and stabilization of the intact PBS structure is revealed by the fact that the structures are more stable at room temperature than at 4 Cº and high salt concentrations are required for the PBS stabilization [61,105]. In other words, charge-charge and dipole-dipole interactions play a little role in PBS construction. However,
Phycobilisomes from Cyanobacteria 117
the PBS prepared from the red alga Polysiphonia urceolata showed the stability in SDS solution as well as in 50 mM phosphate buffer at 4 Cº. It demonstrate that the mechanism of charge-charge and dipole-dipole interactions may play some more roles instead of hydrophobic interaction mechanism [61, 104, 106].
3. PHYCOBILIPROTEIN COMPONENTS OF PHYCOBILISOMES Phycobiliproteins are a group of chromophore-containing protein complexes and one of
two type protein components of PBSs. They make PBSs have their spectroscopic characteristics. In the PBS-bearing organisms, the light energy absorbed by the phycobiliproteins in native PBSs is efficiently transferred to the chlorophyll a of the photosystems. However, when the phycobiliproteins are isolated and purified from the organisms, these brilliant-colored and water-soluble pigment proteins become highly fluorescent because they no longer have any nearby acceptors to which to transfer the harvested energy. The phycobiliproteins in solution, therefore, are characteristic of their strong light absorption and intensive fluorescence emission within range of visible spectrum. Phycobiliproteins are commonly found to consist of hetero-monomers and the hetero-monomers are composed of two different subunits, α and β [57-61]. The subunits of α and β are present in equimolar stoichiometry (αβ) and differ in molecular mass, amino acid sequence, and chromophore content. Fundamental configuration of the phycobiliprotein assembly is a stable trimer (αβ)3 forming a toroidal-shaped aggregate [63-65, 81]. The aggregate has a diameter of about 11 nm, a thickness of 3 nm to 3.5 nm, and a central hole about 3 nm in diameter. Some biliproteins exist in hexamers, such as PE. The hexamers are formed by face-to-face aggregation of two trimeric disks with or without the inclusion of a linker-polypeptide in the central cavity [63-65, 81, 89, 98-99].
Brilliant colors of phycobiliproteins originate from linear tetrapyrrole prosthetic groups, known as phycobilins. Generally the pigments are covalently bound to the apoproteins at conserved positions either by one cysteinyl thioether linkage through a pyrrole ring of one end of a four-pyrrole chain, or by two cysteinyl thioether linkages through two end pyrrole rings [58-61, 89,]. There are four common phycobilins, as shown in figure 5, extensively present in the phycobiliproteins from cyanobacteria and red algae: 1) the blue-colored phycocyanobilin (PCB); 2) the red-colored phycoerythrobilin (PEB); 3) the yellow-colored phycourobilin (PUB); 4) the purple-colored phycobiliviolin (PXB). Several additional chromophores have recently been demonstrated to occur in the phycobiliproteins from cryptomonads [63-64, 107-108]. Spectroscopic properties of the phycobilins are determined by their varying numbers of conjugated-double bonds, or delocalization degree of conjugated-π electrons. A number of one to three phycobilins may be bound to a single α- or β-type polypeptide, thus a trimeric phycobiliprotein ((αβ)3) may contain at least six phycobilins. Furthermore, by providing a microenvironment to maintain optimistically configuration of the chromophores, the apoproteins interact with them, and create effects on the spectral features of the biliproteins. Conclusively, the spectroscopic properties of phycobiliproteins are commonly decided: 1) the types of phycobilins they contain; 2) a number of the phycobilins they carry; 3) the microenvironments where the carried phycobilins are positioned in subunits (α and β) and in trimer or hexamer phycobiliproteins [61].

Li Sun, Shumei Wang, Mingri Zhao et al. 118
Figure 5. Continued next page.

Phycobilisomes from Cyanobacteria 119
Figure 5. Continued next page.
Li Sun, Shumei Wang, Mingri Zhao et al. 120
Figure 5. Structures of four phycobilins linked by single/double thiother-linkages to phycobiliproteins [60-61, 63-64].
3.1. Phycocyanin
Phycocyanins are one of the most widespread phycobiliproteins observed in almost all
phycobiliprotein-containing organisms, including cyanobacteria, red algae, glaucophytes and some cryptophytes. They are commonly found the most abundant in most cyanobacterium species that grow in natural environment. The phycocyanin from the PBS-containing algae is subdivided into three types: 1) C-phycocyanin (C-PC) exclusively existing in cyanobacteria, 2) phycoerythrocyanin (PEC) inducible only in some cyanobacteria, and 3) R-phycocyanin (R-PC) mainly in red algae [57-65, 81]. These blue- or blue-purple-colored phycobiliproteins have strong light absorption mainly in range from 580 nm to 630 nm and emit intensive red fluorescence at 635-645 nm. Phycocyanins exist commonly in trimer (αβ)3 from aggregation
Phycobilisomes from Cyanobacteria 121
of three (αβ) monomers. They have a thickness of 3 nm, a diameter of 11 nm and a central hole in diameter of 3.5 nm. In PBSs, phycocyanins commonly occur in disc-shaped hexamers, and a rod-linker polypeptide (LR) or a rod-core-linker polypeptide are attached to the center cavity of hexamers to form (αβ)6LR or (αβ)6LRC complexes [63, 89, 109, 110]. The interaction of phycocyanins with the linker polypeptides may typically causes a large redshift of about 17 nm in their absorption and fluorescence emission maximums [63, 110].
C-Phycocyanin
C-phycocyanin (C-PC) is a blue-colored, deeply red-fluorescent phycobiliprotein and a predominant form among phycocyanins. C-PC is named on the basis of its originating from cyanobacteria and its spectral properties [60, 63-65, 111-113]. Several C-phycocyanins from various cyanobacteria have been fully characterized in crystal structure, for example, those from Anabaena variabilis [114], from the thermophilic cyanobacterium Mastigocladus laminosus [115] from Fremyella diplosiphon [116-117], Synechococcus sp. PCC 7002 [110], Synechococcus vulcanus [118] and cyanobacterium Cyanidium caldarium [119]. Furthermore, C-PC was also found from a unicellular red alga Cyanidium caldarium, a eukaryote at the extremes of habitat [120]. In general, C-PC in trimer shows a 3-fold symmetry of the disk-shaped crystal structure, and it stacks by face-to-face to form a hexamer. In a C-PC protein, three phycocyanobilin chromophores are carried by each (αβ) monomer (table 1). The three PCBs have been determined to bind covalently to certain conservative cysteine residues at Cys α-84, β-84 and β-155. Thus one C-PC in trimer carries 3 αPCBs and 6 βPCBs and in hexamer it contains 6 βPCBs and 6 αPCBs and 12 βPCBs. Investigation of Energy transfer between chromophores in C-PC trimers has demonstrated that α-84 PCB and β-155 PCB function as the two sensitizing chromophores located at the periphery of C-PC trimers, whereas β-84 PCB works as the fluorescing pigment located near the central cavity of C-PC trimers and hexamers. In other words, the α-84 PCB and β-155 PCB in C-PCs function as the excitation energy transfer donors and the β-84 PCB as the terminal accepters [63-64, 117, 119-122]. In addition, the investigation on evolution of phycobiliproteins suggested that the rod phycobiliproteins, PC and PE, may have common ancestral α and β polypeptides and that PC may be the ancestor of PEC [123-124].
Phycoerythrocyanin
Phycoerythrocyanin (PEC) is another PC kind phycobiliprotein found from some cyanobacteria [60, 63-64], for example Mastigocladus laminosus [125-128] and Anabaena variabilis [129-130]. Owing to its carrying phycobiliviolin (PXB), PEC has absorption maximum at about 575 nm and maximum fluorescence emission at about 635 nm. This feature lets the organisms to extent their light absorption into the green portion of sun light spectrum. It unquestionably enhances the light-harvesting capacity of the organisms and enables them to stay alive under medium- or low-light conditions [62]. PEC is usually obtained in assembly of trimeric (αβ)3 or hexameric (αβ)6 with a rod-linker polypeptide (LR) bound to it, and contains three chromophores per (αβ) monomer [63]. In the crystal structure, PEC occurs in a 3-fold symmetry of the disk-shaped trimer or hexamer [125]. The α subunits of the PEC from Mastigocladus laminosus have 162 amino acid residues and carry one red PXB pigment that is covalently linked to Cys α-84 via a thioether bond, whereas the β subunits contain 171 residues and carry two PCBs one of which is attached to Cys β-84 and
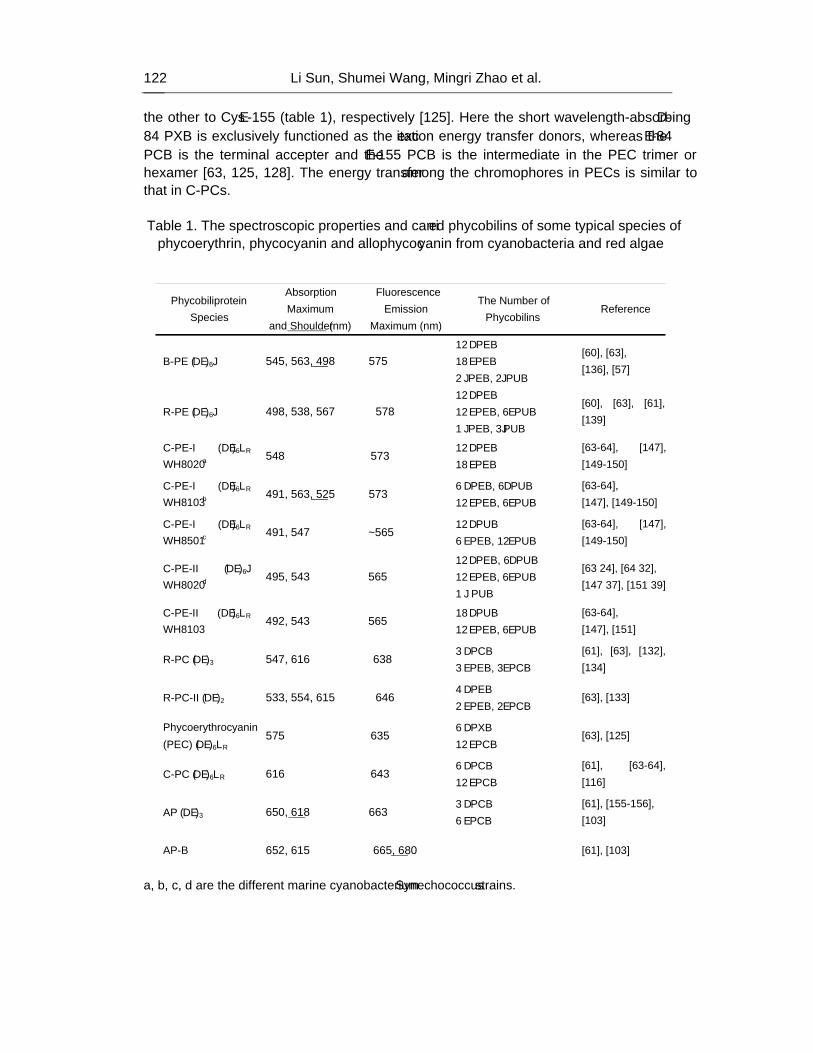
Li Sun, Shumei Wang, Mingri Zhao et al. 122
the other to Cys β-155 (table 1), respectively [125]. Here the short wavelength-absorbing α-84 PXB is exclusively functioned as the excitation energy transfer donors, whereas the β-84 PCB is the terminal accepter and the β-155 PCB is the intermediate in the PEC trimer or hexamer [63, 125, 128]. The energy transfer among the chromophores in PECs is similar to that in C-PCs.
Table 1. The spectroscopic properties and carried phycobilins of some typical species of
phycoerythrin, phycocyanin and allophycocyanin from cyanobacteria and red algae
Phycobiliprotein Species
Absorption Maximum
and Shoulder (nm)
Fluorescence Emission
Maximum (nm)
The Number of Phycobilins
Reference
B-PE (αβ)6γ 545, 563, 498 575 12 αPEB 18 βPEB 2 γPEB, 2 γPUB
[60], [63], [136], [57]
R-PE (αβ)6γ 498, 538, 567 578 12 αPEB 12 βPEB, 6 βPUB 1 γPEB, 3γPUB
[60], [63], [61],[139]
C-PE-I (αβ)6LR
WH8020a 548 573
12 αPEB 18 βPEB
[63-64], [147], [149-150]
C-PE-I (αβ)6LR WH8103b
491, 563, 525 573 6 αPEB, 6 αPUB 12 βPEB, 6 βPUB
[63-64], [147], [149-150]
C-PE-I (αβ)6LR WH8501c
491, 547 ~565 12 αPUB 6 βPEB, 12 βPUB
[63-64], [147], [149-150]
C-PE-II (αβ)6γ WH8020d
495, 543 565 12 αPEB, 6 αPUB 12 βPEB, 6 βPUB 1 γ PUB
[63 24], [64 32], [147 37], [151 39]
C-PE-II (αβ)6LR
WH8103 492, 543 565
18 αPUB 12 βPEB, 6 βPUB
[63-64], [147], [151]
R-PC (αβ)3 547, 616 638 3 αPCB 3 βPEB, 3 βPCB
[61], [63], [132], [134]
R-PC-II (αβ)2 533, 554, 615 646 4 αPEB 2 βPEB, 2 βPCB
[63], [133]
Phycoerythrocyanin (PEC) (αβ)6LR
575 635 6 αPXB 12 βPCB
[63], [125]
C-PC (αβ)6LR 616 643 6 αPCB 12 βPCB
[61], [63-64], [116]
AP (αβ)3 650, 618 663 3 αPCB 6 βPCB
[61], [155-156], [103]
AP-B 652, 615 665, 680 [61], [103]
a, b, c, d are the different marine cyanobacterium Synechococcus strains.
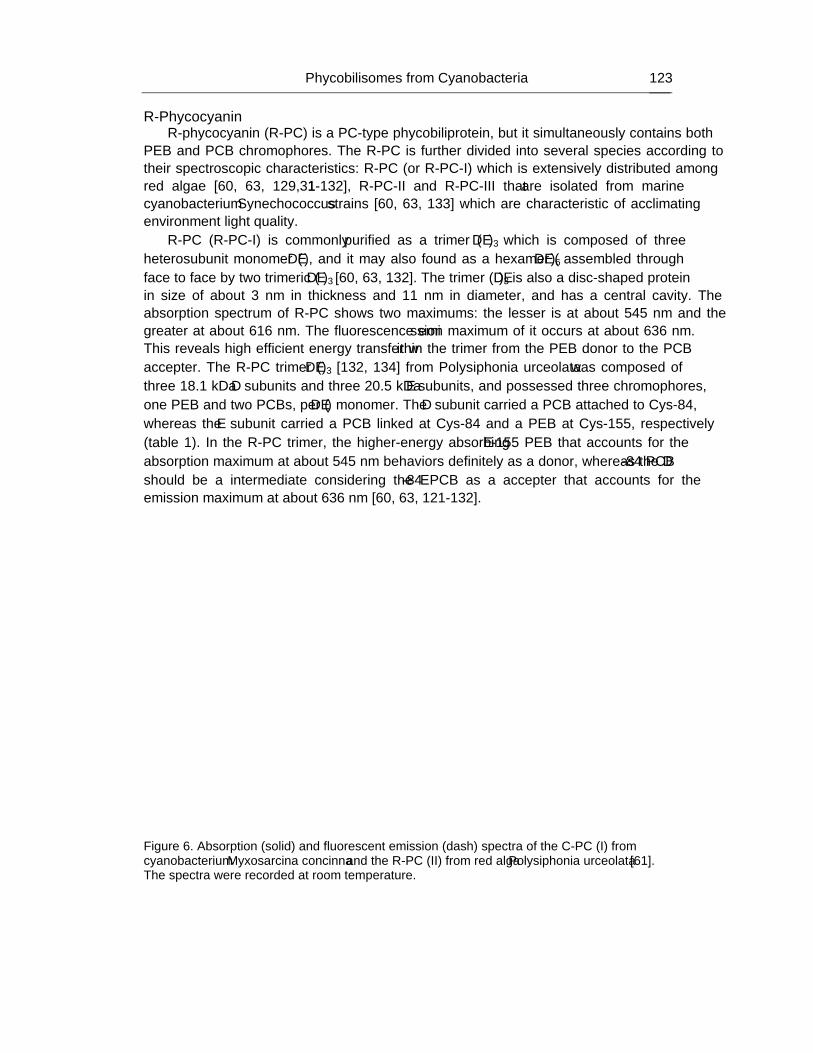
Phycobilisomes from Cyanobacteria 123
R-Phycocyanin R-phycocyanin (R-PC) is a PC-type phycobiliprotein, but it simultaneously contains both
PEB and PCB chromophores. The R-PC is further divided into several species according to their spectroscopic characteristics: R-PC (or R-PC-I) which is extensively distributed among red algae [60, 63, 129, 131-132], R-PC-II and R-PC-III that are isolated from marine cyanobacterium Synechococcus strains [60, 63, 133] which are characteristic of acclimating environment light quality.
R-PC (R-PC-I) is commonly purified as a trimer (αβ)3 which is composed of three heterosubunit monomer (αβ), and it may also found as a hexamer (αβ)6 assembled through face to face by two trimeric (αβ)3 [60, 63, 132]. The trimer (αβ)3 is also a disc-shaped protein in size of about 3 nm in thickness and 11 nm in diameter, and has a central cavity. The absorption spectrum of R-PC shows two maximums: the lesser is at about 545 nm and the greater at about 616 nm. The fluorescence emission maximum of it occurs at about 636 nm. This reveals high efficient energy transfer within the trimer from the PEB donor to the PCB accepter. The R-PC trimer (αβ)3 [132, 134] from Polysiphonia urceolata was composed of three 18.1 kDa α subunits and three 20.5 kDa β subunits, and possessed three chromophores, one PEB and two PCBs, per (αβ) monomer. The α subunit carried a PCB attached to Cys-84, whereas the β subunit carried a PCB linked at Cys-84 and a PEB at Cys-155, respectively (table 1). In the R-PC trimer, the higher-energy absorbing β-155 PEB that accounts for the absorption maximum at about 545 nm behaviors definitely as a donor, whereas the α-84 PCB should be a intermediate considering the β-84 PCB as a accepter that accounts for the emission maximum at about 636 nm [60, 63, 121-132].
Figure 6. Absorption (solid) and fluorescent emission (dash) spectra of the C-PC (I) from cyanobacterium Myxosarcina concinna and the R-PC (II) from red alga Polysiphonia urceolata [61]. The spectra were recorded at room temperature.
Li Sun, Shumei Wang, Mingri Zhao et al. 124
R-phycocyanin-II (R-PC-II) [63, 133] was obtained as a PEB-containing PC of cyanobacterial origin from the marine Synechococcus strains. These cyanobacteria are strongly adapted to green light conditions, and contain mainly PE (I) and PE (II) as light-harvesting complexes (see below). The R-PC-II is made up of α and β subunits in equal amounts and is in an dimmer (αβ)2 aggregation state. Three chromophores which the R-PC-II carried are two PEBs bound at Cys α-84 and β-155, respectively, and one PCB at Cys β-84. Obviously the β-84 PCB, which generates the 615 nm absorption and the 646 nm emission, functions as the terminal excitation energy transfer accepter in the R-PC-II dimmer [63, 133]. As examples, figure 6 shows absorption and fluorescent spectra of the C-PC from cyanobacterium Myxosarcina concinna and the R-PC from red alga Polysiphonia urceolata [61].
3.2. Phycoerythrin Phycoerythrins are one of abundant phycobiliproteins found in most red algae and some
unicellular cyanobacteria which live under certain light conditions [57-59, 60, 63, 79]. They are characterized by strong absorption bands in the green region of the visible spectrum from 480 nm to 570 nm and by intensive fluorescence emissions at about 575 nm. Based on their absorption spectra, these red-colored proteins fall into three distinct species: 1) B-phycoerythrin (B-PE) (λmax ∼540-560 nm, shoulder ∼495 nm); 2) R-phycoerythrin (R-PE) (λmax ∼565, 545 and 495 nm); 3) C-phycoerythrin (C-PE) (λmax ∼563, /543 and ∼492 nm). The prefixes B-, R- and C- were used historically for indicating the type of organisms from which, for example Bangiales, Floridian Rhodophyceae and Cyanophyceae, the pigment proteins were originally extracted. But these prefixes have now evolved to denote the shape of the absorption spectra of the purified phycobiliproteins because it has been believed that differences in spectroscopic and structural properties of phycobiliproteins are not species specific [58-59, 60, 63, 79].
Phycoerythrins from Red Algae
B-PE and R-PE are the two red alga PE species which have been adequately characterized in spectral and structural properties [60, 63, 79]. B-PE from the red alga Porphyridium sordidum is a multi-subunit complex. It is composed of three types of subunits, α, β and γ, and usually exists in a stable composition of hexamer (αβ)6γ. The aggregate is formed by two (αβ)3 trimers assembling face-to-face and the γ subunit is proved to function as a linker to combine the two trimers by locating in the central cavity of the disc-shaped hexamer that is about 6 nm in thickness and 11 nm in diameter [60, 63, 79, 135]. Every (αβ) monomer of B-PE carries five PEB chromophores that show absorption λmax from 540 nm to 575 nm. Two PEB are attached to one α subunit, and the other three to one β subunit. The five PEBs of B-PE from P. sordidum are covalently bound to the cysteine residues at positions α-84, α-140, β-84, β-155 and β-50/β-61 where the PEB is doubly linked. All the singly linked pigments bind to cysteine via ring A, whereas the doubly linked one is attached to the cysteine β-50 by ring A and to the cysteine β-61 by ring D [135, 136]. The γ subunit carries four bilins, two PEBs and two PUBs. Thus a B-PE hexamer contains totally 34 chromophores, 32 PEBs and 2 PUBs (table 1). The two γ PUBs absorb higher-energy light at
Phycobilisomes from Cyanobacteria 125
about 495 nm, whereas the β-84 PEBs located near the central cavity absorb lower-energy light at about 560 nm. The fact that the steady state fluorescence emission at 574 nm was proved to originate exclusively from the β-84 PEBs indicates that there is efficient energy transfer from the γ PUB donors to the β-84 PEB acceptors in the B-PE hexamer.
R-PE is a phycoerythrin abundant in red algae. Although R-phycoerythrins from many red alga species present a three-peak absorption spectrum, they are categorized into three subtypes due to their differences in shape of absorption spectrum [60]. The R-phycoerythrin is commonly composed of three subunits, α, β and γ. Like B-PE, the R-PE from Polysiphonia urceolata usually presents stable in a hexameric aggregate of (αβ)6γ. Two (αβ)3 trimers that assemble face-to-face construct a disc-shaped hexamer (αβ)6γ. The (αβ)6γ is also about 11 nm in diameter and 6 nm in thickness, and has a central hole about 3.5 nm in diameter [137, 138-139]. The γ subunit binds to the both trimers by inserting itself in the central cavity. Each R-PE monomer (αβ) contains five phycobilins, four PEBs and one PUB. The two PEBs are attached to one α subunit, and the other two PEBs and one PUB to one β subunit. The R-PE γ subunit carries four chromophores, one PEB and three PUBs [60, 63, 79, 137, 138-139]. The crystal structure analysis of the R-PE from Polysiphonia urceolata demonstrated that the four PEBs were singly linked to the cysteine residues by ring A at position α-84, α-140, β-84 and β-155, respectively, and the PUB doubly linked by ring A to β-50 and by ring D to β-61 [139]. The γ subunit of R-PE carries one PEB bound singly to Cys-94, and three PUBs to Cys-133, Cys-209 and Cys-297, respectively [138]. One monomer of R-PE contains two PUB bilins more than that of B-PE, but two PEBs less, though they both have the 34 pigments (table 1). For R-PE, the four individual PUBs at position β-50/β-61, γ-133, γ-209 and γ-297 create an absorption peak at about 498 nm, and therefore they function as the higher-energy donors. The absorption peak at 565 nm is attributed mainly to the six β-84 PEBs, whereas the absorption around 545 nm originates exclusively from the PEBs at α-84, α-140, β-155 and γ-94. Because the fluorescence emission peak at about 578 nm originates predominantly from the β-84 PEBs [138], there is efficient exiting energy transfer in the R-PE hexamer from higher-energy absorption donors, the PUBs, to the lower-energy acceptors, the β-84 PEBs. The other PEBs may take part in the energy transfer as intermediates. Based on the spectral and structural characteristics of B-PE and R-PE mentioned above, they make red algae more capable to harvest green light and more favorable to survive in the environments where there is short of the light favorable for PCs and APs to harvest.
C-Phycoerythrin from Cyanobacteria
C-phycoerythrins are a kind of the phycoerythrins that are the most abundant in cyanobacteria. They are the products by some cyanobacteria that acclimate to their environment variations in light quality and intensity, especially green-to-red light ratios, through a process traditionally called complementary chromatic adaptation [88, 140-146]. These cyanobacteria make more of the light-harvesting protein phycocyanin in red light and more of the protein phycoerythrin in green light [60, 63-64, 141-146]. There are two subtype C-phycoerythrins, C-phycoerythrin-I (C-PE-I) or PE (I), and C-phycoerythrin-II (C-PE-II) or PE (II) (table 1). The phycoerythrins originated from freshwater and soil cyanobacteria typically contain only PEBs and exhibit absorption spectra with maximums at about 565 nm and fluorescence emission spectra with peaks at about 575 nm. These are the spectral properties characteristic of C-PE-I (or PE (I)), also known as C-PE. C-PE-I usually carries
Li Sun, Shumei Wang, Mingri Zhao et al. 126
five PEBs per monomer (αβ) [60, 63-64, 147]. The five PEBs are covalently attached to the cysteine residues, in the way very similar to B-PE, at α-84, α-140/143, β-84/82, β-50/β-61 and β-155/159, respectively. The α and β subunits vary with their originations in molecular mass from 15 kDa to 20 kDa. C-PE-I in a disc-shaped hexamer, which is constructed by two trimeric (αβ)3 through face-to-face aggregation, commonly exists in form (αβ)6LR where a rod-linker polypeptide (LR) is bound the central hole of the two stacking trimers.. Unlike the γ subunit from B-PE and R-PE, however, the LR of C-PE-I generally carries no phycobilins [63-64, 147].
Several cyanobacterial genera, such as marine Synechococcus [148], can produce the C-phycoerythrins that have PUBs as well as PEBs to adapt the light quality rich in more blue-green spectrum. The C-PE-I obtained from marine Synechococcus strains may carry one to four PUBs with corresponding counterpart PEBs. By developing the C-phycoerythrins different in PUB/PEB ratios, some certain cyanobacteria can realize environmental adaptation by response to light quality. For example, three C-PE-I type phycobilins [63-64, 147, 149-150] from marine Synechococcus strains WH8020, WH8103 and WH8501, respectively, were proved to contain different content of PUBs in their monomer (αβ) carrying five pigments. The five chromophores in the monomer of the three C-PE-I proteins were determined to be linked to the cysteine residues (table 1): α-84 PEB, α-140 PEB, β-82 PEB, β-50/β-61 PEB and β-159 PEB for WH8020; α-84 PEB, α-140 PUB, β-82 PEB, β-50/β-61 PUB and β-159 PEB for WH8103; and α-84 PUB, α-140 PUB, β-82 PEB, β-50/β-61 PUB and β-159 PUB for WH8501. The WH8020 C-PE-I with no PUB showed a one-peak absorption spectrum with the peak at about 548 nm; the WH8103 C-PE-I with two PUBs exhibited a two-peak absorption spectrum with the peaks at 491 nm and 563 nm, respectively, and a shoulder near 525 nm (figure 7 I); and the WH8501 C-PE-I with four PUBs gave a two-peak absorption spectrum with a strong peak at 491 nm and a weak one at 547 nm [63, 147, 149]. However, these phycoerythrins all emitted the fluorescence maximum in range from 560 to 575 nm, indicating that the PUBs are energy transfer donors, whereas the β-82 PEBs are the terminal acceptors. Moreover, the LR located in the central cavity of these (αβ)6 LR of C-PE-I type hexamers carried no phycobilins with it [63-64].
Besides the C-PE-I type phycoerythrins, another kind of PUB-containing C-phycoerythrins was characterized also from the marine Synechococcus strains, WH8020 and WH8103, which are designed C-phycoerythrin-II (C-PE-II) or phycoerythrin II (PE (II)) (table 1) [147, 151-152]. The C-PE-II contains six phycobilins per monomer (αβ). The sixth phycobilin PUB is attached to α-75 Cys, whereas the other five phycobilins lie at the same positions as those of the C-PE-I. For example, the six chromophores of the C-PE-II from WH8020 were bound to the cysteine residues: α-75 PUB, α-84 PEB, α-140 PEB, β-82 PEB, β-50/β-61 PUB and β-159 PEB, and those from WH8103 to the cysteines, α-75 PUB, α-84 PUB, α-140 PUB, β-82 PEB, β-50/β-61 PUB and β-159 PEB [63-64, 147, 151-152]. In addition, the γ subunit, the LR that takes part in the assembly of C-PE-II hexamers, also carries one PUB at Cys-94 [63-64]. These structural features make the native C-PE-II proteins exhibit two absorption maximums at about 495 nm and 545 nm, as shown in figure 7 II and IV, and the one fluorescence emission peak at about 565 nm [63-64, 147, 153]. Obviously, it is very possible that various C-phycoerythrins may be found from some certain cyanobacteria that are, like marine Synechococcus strains, characterized of generating optimum
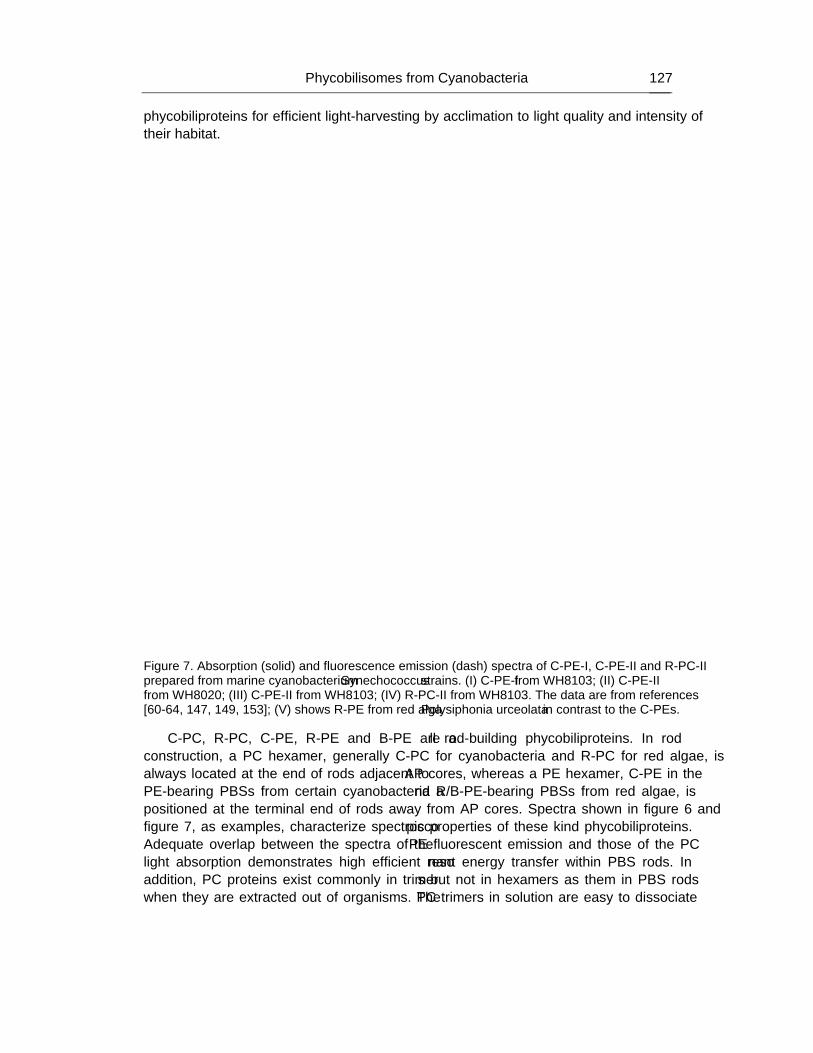
Phycobilisomes from Cyanobacteria 127
phycobiliproteins for efficient light-harvesting by acclimation to light quality and intensity of their habitat.
Figure 7. Absorption (solid) and fluorescence emission (dash) spectra of C-PE-I, C-PE-II and R-PC-II prepared from marine cyanobacterium Synechococcus strains. (I) C-PE-I from WH8103; (II) C-PE-II from WH8020; (III) C-PE-II from WH8103; (IV) R-PC-II from WH8103. The data are from references [60-64, 147, 149, 153]; (V) shows R-PE from red alga Polysiphonia urceolata in contrast to the C-PEs.
C-PC, R-PC, C-PE, R-PE and B-PE are all rod-building phycobiliproteins. In rod construction, a PC hexamer, generally C-PC for cyanobacteria and R-PC for red algae, is always located at the end of rods adjacent to AP cores, whereas a PE hexamer, C-PE in the PE-bearing PBSs from certain cyanobacteria and R/B-PE-bearing PBSs from red algae, is positioned at the terminal end of rods away from AP cores. Spectra shown in figure 6 and figure 7, as examples, characterize spectroscopic properties of these kind phycobiliproteins. Adequate overlap between the spectra of the PE fluorescent emission and those of the PC light absorption demonstrates high efficient resonant energy transfer within PBS rods. In addition, PC proteins exist commonly in trimers but not in hexamers as them in PBS rods when they are extracted out of organisms. The PC trimers in solution are easy to dissociate
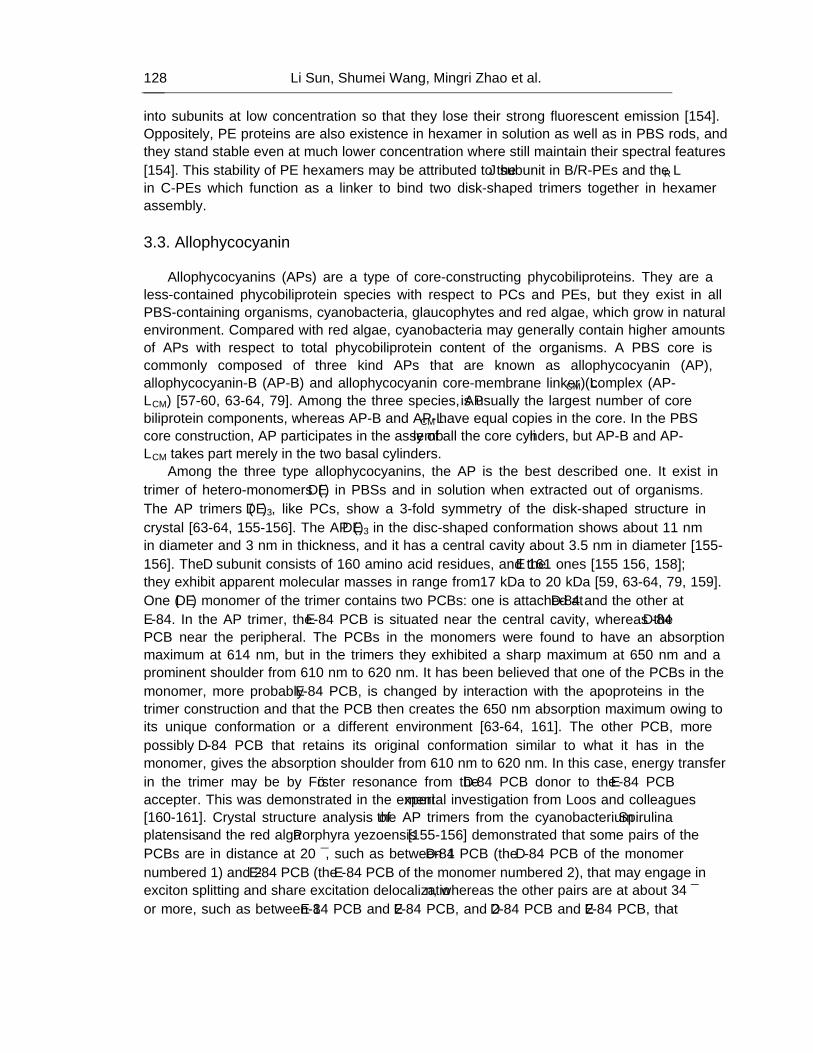
Li Sun, Shumei Wang, Mingri Zhao et al. 128
into subunits at low concentration so that they lose their strong fluorescent emission [154]. Oppositely, PE proteins are also existence in hexamer in solution as well as in PBS rods, and they stand stable even at much lower concentration where still maintain their spectral features [154]. This stability of PE hexamers may be attributed to the γ subunit in B/R-PEs and the LR in C-PEs which function as a linker to bind two disk-shaped trimers together in hexamer assembly.
3.3. Allophycocyanin
Allophycocyanins (APs) are a type of core-constructing phycobiliproteins. They are a
less-contained phycobiliprotein species with respect to PCs and PEs, but they exist in all PBS-containing organisms, cyanobacteria, glaucophytes and red algae, which grow in natural environment. Compared with red algae, cyanobacteria may generally contain higher amounts of APs with respect to total phycobiliprotein content of the organisms. A PBS core is commonly composed of three kind APs that are known as allophycocyanin (AP), allophycocyanin-B (AP-B) and allophycocyanin core-membrane linker (LCM) complex (AP-LCM) [57-60, 63-64, 79]. Among the three species, AP is usually the largest number of core biliprotein components, whereas AP-B and AP-LCM have equal copies in the core. In the PBS core construction, AP participates in the assembly of all the core cylinders, but AP-B and AP-LCM takes part merely in the two basal cylinders.
Among the three type allophycocyanins, the AP is the best described one. It exist in trimer of hetero-monomers (αβ) in PBSs and in solution when extracted out of organisms. The AP trimers (αβ)3, like PCs, show a 3-fold symmetry of the disk-shaped structure in crystal [63-64, 155-156]. The AP (αβ)3 in the disc-shaped conformation shows about 11 nm in diameter and 3 nm in thickness, and it has a central cavity about 3.5 nm in diameter [155-156]. The α subunit consists of 160 amino acid residues, and the β 161 ones [155 156, 158]; they exhibit apparent molecular masses in range from17 kDa to 20 kDa [59, 63-64, 79, 159]. One (αβ) monomer of the trimer contains two PCBs: one is attached at α-84 and the other at β-84. In the AP trimer, the β-84 PCB is situated near the central cavity, whereas the α-84 PCB near the peripheral. The PCBs in the monomers were found to have an absorption maximum at 614 nm, but in the trimers they exhibited a sharp maximum at 650 nm and a prominent shoulder from 610 nm to 620 nm. It has been believed that one of the PCBs in the monomer, more probably β-84 PCB, is changed by interaction with the apoproteins in the trimer construction and that the PCB then creates the 650 nm absorption maximum owing to its unique conformation or a different environment [63-64, 161]. The other PCB, more possibly α-84 PCB that retains its original conformation similar to what it has in the monomer, gives the absorption shoulder from 610 nm to 620 nm. In this case, energy transfer in the trimer may be by Förster resonance from the α-84 PCB donor to the β-84 PCB accepter. This was demonstrated in the experimental investigation from Loos and colleagues [160-161]. Crystal structure analysis of the AP trimers from the cyanobacterium Spirulina platensis and the red alga Porphyra yezoensis [155-156] demonstrated that some pairs of the PCBs are in distance at 20 Å, such as between 1α-84 PCB (the α-84 PCB of the monomer numbered 1) and 2β-84 PCB (the β-84 PCB of the monomer numbered 2), that may engage in exciton splitting and share excitation delocalization, whereas the other pairs are at about 34 Å or more, such as between 1β-84 PCB and 2β-84 PCB, and 2α-84 PCB and 2β-84 PCB, that
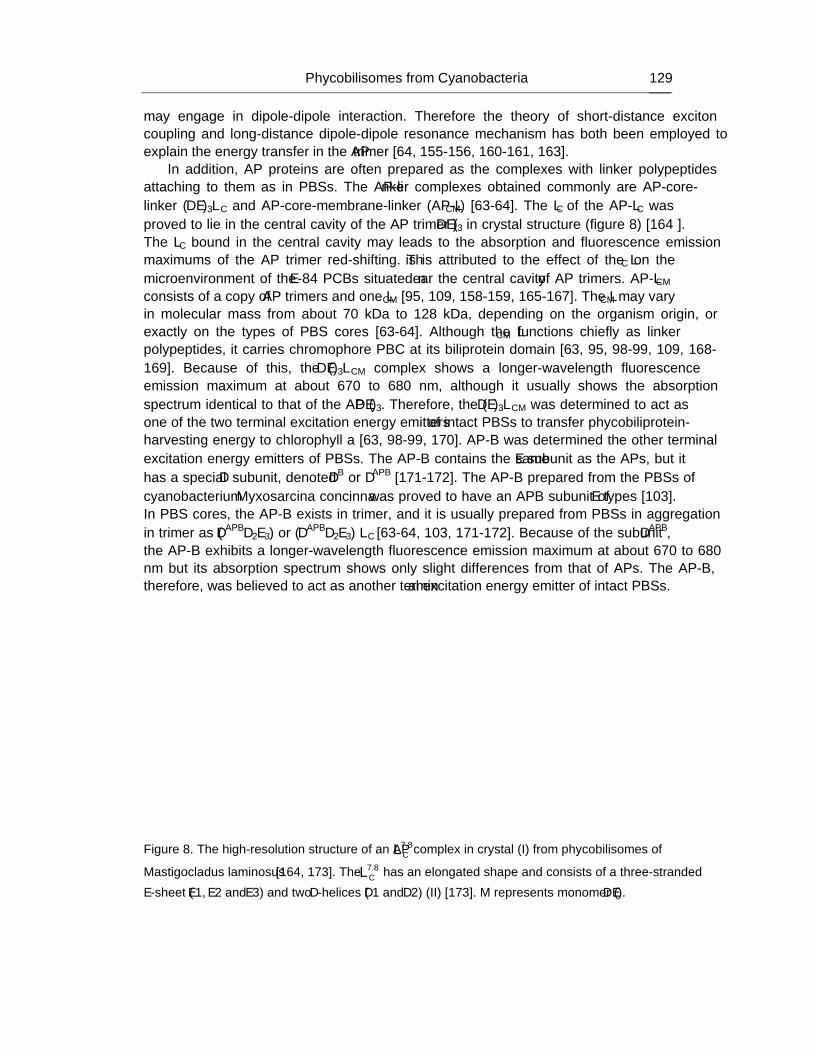
Phycobilisomes from Cyanobacteria 129
may engage in dipole-dipole interaction. Therefore the theory of short-distance exciton coupling and long-distance dipole-dipole resonance mechanism has both been employed to explain the energy transfer in the AP trimer [64, 155-156, 160-161, 163].
In addition, AP proteins are often prepared as the complexes with linker polypeptides attaching to them as in PBSs. The AP-linker complexes obtained commonly are AP-core-linker (αβ)3LC and AP-core-membrane-linker (AP-LCM) [63-64]. The LC of the AP-LC was proved to lie in the central cavity of the AP trimer (αβ)3 in crystal structure (figure 8) [164 ]. The LC bound in the central cavity may leads to the absorption and fluorescence emission maximums of the AP trimer red-shifting. This is attributed to the effect of the LC on the microenvironment of the β-84 PCBs situated near the central cavity of AP trimers. AP-LCM consists of a copy of AP trimers and one LCM [95, 109, 158-159, 165-167]. The LCM may vary in molecular mass from about 70 kDa to 128 kDa, depending on the organism origin, or exactly on the types of PBS cores [63-64]. Although the LCM functions chiefly as linker polypeptides, it carries chromophore PBC at its biliprotein domain [63, 95, 98-99, 109, 168-169]. Because of this, the (αβ)3LCM complex shows a longer-wavelength fluorescence emission maximum at about 670 to 680 nm, although it usually shows the absorption spectrum identical to that of the AP (αβ)3. Therefore, the (αβ)3LCM was determined to act as one of the two terminal excitation energy emitters of intact PBSs to transfer phycobiliprotein-harvesting energy to chlorophyll a [63, 98-99, 170]. AP-B was determined the other terminal excitation energy emitters of PBSs. The AP-B contains the same β subunit as the APs, but it has a special α subunit, denoted αB or αAPB [171-172]. The AP-B prepared from the PBSs of cyanobacterium Myxosarcina concinna was proved to have an APB subunit of β types [103]. In PBS cores, the AP-B exists in trimer, and it is usually prepared from PBSs in aggregation in trimer as (αAPBα2β3) or (αAPBα2β3) LC [63-64, 103, 171-172]. Because of the subunit αAPB, the AP-B exhibits a longer-wavelength fluorescence emission maximum at about 670 to 680 nm but its absorption spectrum shows only slight differences from that of APs. The AP-B, therefore, was believed to act as another terminal excitation energy emitter of intact PBSs.
Figure 8. The high-resolution structure of an AP⋅ 7.8CL complex in crystal (I) from phycobilisomes of
Mastigocladus laminosus [164, 173]. The 7.8CL has an elongated shape and consists of a three-stranded
β-sheet (β1, β2 and β3) and two α-helices (α1 and α2) (II) [173]. M represents monomer (αβ).
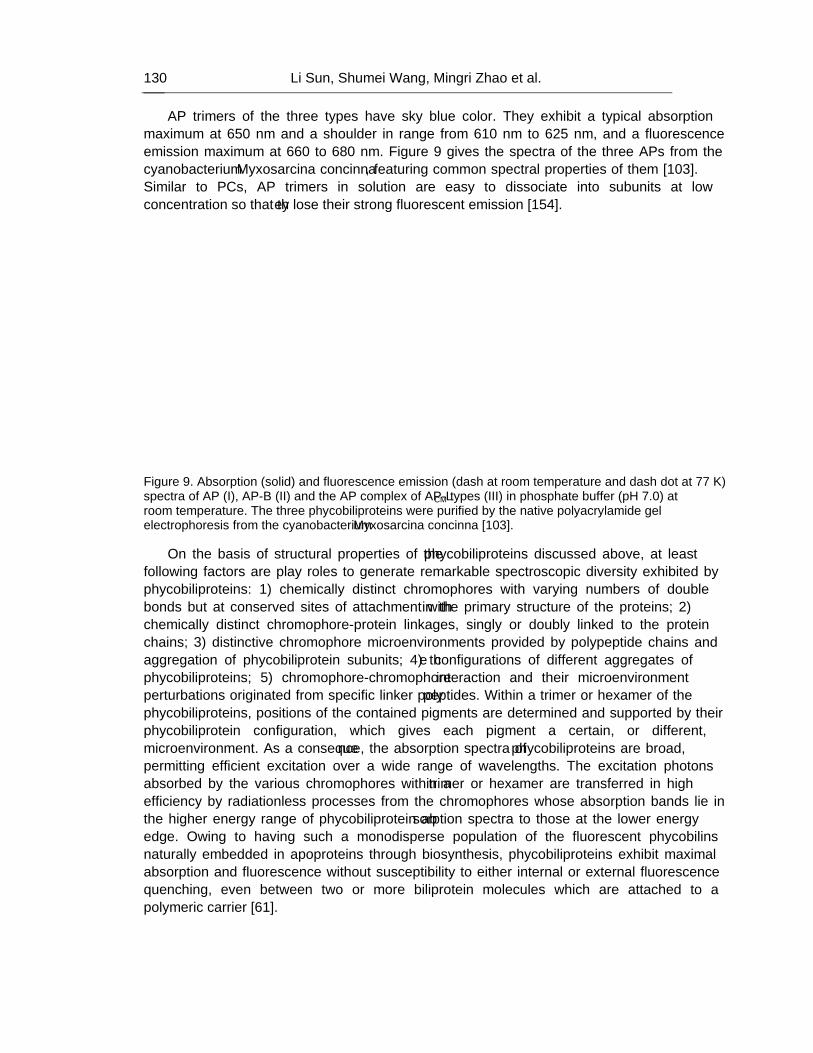
Li Sun, Shumei Wang, Mingri Zhao et al. 130
AP trimers of the three types have sky blue color. They exhibit a typical absorption maximum at 650 nm and a shoulder in range from 610 nm to 625 nm, and a fluorescence emission maximum at 660 to 680 nm. Figure 9 gives the spectra of the three APs from the cyanobacterium Myxosarcina concinna, featuring common spectral properties of them [103]. Similar to PCs, AP trimers in solution are easy to dissociate into subunits at low concentration so that they lose their strong fluorescent emission [154].
Figure 9. Absorption (solid) and fluorescence emission (dash at room temperature and dash dot at 77 K) spectra of AP (I), AP-B (II) and the AP complex of AP-LCM types (III) in phosphate buffer (pH 7.0) at room temperature. The three phycobiliproteins were purified by the native polyacrylamide gel electrophoresis from the cyanobacterium Myxosarcina concinna [103].
On the basis of structural properties of the phycobiliproteins discussed above, at least following factors are play roles to generate remarkable spectroscopic diversity exhibited by phycobiliproteins: 1) chemically distinct chromophores with varying numbers of double bonds but at conserved sites of attachment within the primary structure of the proteins; 2) chemically distinct chromophore-protein linkages, singly or doubly linked to the protein chains; 3) distinctive chromophore microenvironments provided by polypeptide chains and aggregation of phycobiliprotein subunits; 4) the configurations of different aggregates of phycobiliproteins; 5) chromophore-chromophore interaction and their microenvironment perturbations originated from specific linker polypeptides. Within a trimer or hexamer of the phycobiliproteins, positions of the contained pigments are determined and supported by their phycobiliprotein configuration, which gives each pigment a certain, or different, microenvironment. As a consequence, the absorption spectra of phycobiliproteins are broad, permitting efficient excitation over a wide range of wavelengths. The excitation photons absorbed by the various chromophores within a trimer or hexamer are transferred in high efficiency by radiationless processes from the chromophores whose absorption bands lie in the higher energy range of phycobiliprotein absorption spectra to those at the lower energy edge. Owing to having such a monodisperse population of the fluorescent phycobilins naturally embedded in apoproteins through biosynthesis, phycobiliproteins exhibit maximal absorption and fluorescence without susceptibility to either internal or external fluorescence quenching, even between two or more biliprotein molecules which are attached to a polymeric carrier [61].
Phycobilisomes from Cyanobacteria 131
4. LINKER POLYPEPTIDE COMPONENTS OF PHYCOBILISOMES Linker polypeptides are another type PBS component which is critical for assembly.
Most of linker polypeptides, except core-membrane linker LCM and γ subunit, contain no chromophores; this is the chief difference between phycobiliproteins and linker peptides. The linker LCM and the subunit γ are described to have two functions, acting as a linker in PBS construction and a light-harvesting pigment protein [61-65, 81, 173]. On the basis of their apparent molecular weight (Mr) demonstrated by SDS-polyacrylamide gel electrophoresis (SDS-PAGE), linker polypeptides were divided into three groups: 1) Mr from 128 kDa to 70 kDa; 2) Mr from 37 kDa to 27 kDa; 3) Mr from 14 kDa to 7.5 kDa; and the subunits of phycobiliproteins commonly show Mr from 24 kDa to 15 kDa [62]. According to the functions in PBS assembly, the linker polypeptides have been categorized into: 1) core-membrane linker polypeptide LCM; 2) core linker polypeptide LC; 3) rod-core linker polypeptide LRC; 4) rod linker polypeptide LR [61-65, 81, 173]. The linker polypeptides are believed to have more basic and hydrophilic residues than those of phycobiliprotein subunits [63, 173].
4.1. Core Linker Polypeptides There are two core linker polypeptides which have been most reported and adequately
described: core-membrane linker polypeptide LCM and core linker polypeptides of small Mr (LC, ~ 7.5-10.5 kDa), named 10.5-7.5
CL . The LC was demonstrated to combine with the AP trimers located at the two ends of core cylinders; by situated its own in the central cavity of the AP trimers, the LC aggregates with AP and AP-B to form AP- 10.5-7.5
CL and AP-B-10.5-7.5
CL [103, 164, 173, 169]. The AP⋅ 7.8CL from phycobilisomes of Mastigocladus laminosus in
crystal structure was demonstrated that the 7.8CL has an elongated shape and consists of a
three-stranded β-sheet (β1, Leu-3–Leu-9; β2, Tyr-26–Pro-32; β3, Lys-49–Leu-55), two α-helices (α1, Leu-22–Thr-25; α2, Tyr-33–Met-46), one of which has only about one turn, and the connecting random coil segments [164]. The linker polypeptide was showed to be predominantly located between two distinct β-subunits and to interact directly with the corresponding chromophores of these subunits (figure 8). No clear clustering of charged, polar, or hydrophilic residues was found at the protein–protein interface. 45.3% surface area of the linker is buried in the central cavity of the AP trimer [164, 173]. The 10.5-7.5
CL has been believed to function as a terminal linker of core cylinders; in other words, when an AP-
10.5-7.5CL complex is situated at an end of core cylinders, the cylinder cannot be elongated in
core cylinder assembling [62, 64-65, 81, 98-99, 164, 173]. There were three core linker polypeptides, 13.8
CL , 11.3CL and 8.3
CL , reported on the investigation
of the PBS core components from the cyanobacterium Myxosarcina concinna [103]. The 13.8CL
that was associated only with the AP-type trimer to form an AP- 13.8CL complex (named AP1
there) was assumed to be the terminal linker to bind just to AP trimers. The 8.3CL was proved to
Li Sun, Shumei Wang, Mingri Zhao et al. 132
combine with an AP-B-type trimer and to form an AP-B- 8.3CL (named AP3 there). Because
AP-B is situated at one end of the two base core cylinders, 8.3CL may fulfils two possible
functions: as a cylinder-terminal linker like the 13.8CL and as a connector that relates to the
interaction between PBSs and monomers of PS I trimers under certain conditions considering that phycobilisomes may dock to PS I through the AP-B [63-65, 81, 87, 93-94, 102-103]. The
11.3CL was a special core linker; it was proved to be carried by all the three core-AP complexes
of the PBSs from Myxosarcina concinna, the AP- 13.8CL (AP1), the 11.3
CL -containing complex
(AP2, AP-LCM type complex) and the AP-B- 8.3CL (AP3) [103]. Therefore, the 11.3
CL was assumed to act as an inner-core connector among the three core AP proteins in the core assembly [103].
There are three reported core-membrane linker polypeptides different in molecular mass: 70 KDa to 80 KDa, 90 KDa to 105 KDa and 110 KDa to 128 KDa. The three types of LCM are related to bicylindrical, tricylindricl and pentacylindrical cores of PBSs, respectively [63-65, 81, 179]. For example, the PBS prepared from cyanobacterium Synechococcus 6301 was the bicylindrical core PBS; it contained 75 kDa LCM [169, 180]. The tricylindricl cores of PBSs from cyanobacterium Nostoc sp., Calothrix sp. PCC 7601, Synechocystis PCC 6701 and red alga Porphyridium cruentum contained about 95 kDa LCM [89, 167, 169, 181-182]. The pentacylindrical cores of PBSs from cyanobacterium Anabaena sp. PCC 7120 and Mastigocladus laminosus was proved to have about 128 kDa LCM [63, 95, 98-99]. Based on the amino acid sequence examination of various LCM polypeptides, they have four structural domains originated from four specific sequential regions to be considered key to fulfilling different functions in the PBS core configuration. In the N-terminal portion of the LCM there is a sequence region with about 40% homology to phycobiliprotein subunits, known as phycobiliprotein domain (PD). The PD of the sequenced LCM from Mastigocladus laminosus begins at residue 18 and ends at approximately residue 236 and a carried PCB may be bound to Cys-residue 196 [63, 87]. Moreover, in the PD there is a small insertion sequence about 50 to 70 residues forming a special loop domain (Loop). The loop domain is believed to protrude out of the basal cylinders of PBS cores and to function as an anchor to fasten BPSs on thylakoid membranes [63, 87].
In the C-terminal portion of the LCM, there is a sequence region to repeats two to four copies, known as repeat domain (REP), according to the molecular mass of the LCM. These domains are similar in sequence to one another and likewise similar to conserved domains of the rod and rod-core linker polypeptides; therefore they are assumed to be responsible for interactions with AP trimers in PBS core construction. The REP domains are repeated once for the two-cylinder cores with the LCM of about 70 kDa to 80 kDa, twice for the three-cylinder cores with the LCM of about 90 kDa to 105 kDa and three times for the pentacylindrical, or ‘four-cylinder’, cores with the LCM of about 110 kDa to128 kDa. In other words, for the hemidiscoidal PBSs, the number of REP domains that can be deduced indirectly from the molecular mass of the LCM polypeptides may determine the core sizes that depend directly on the number of core cylinders formed by AP trimers via the REP domains. Thus the bicylindrical core with 75 kDa LCM from Synechococcus 6301 [169, 180] has two REP domains, REP1 and REP2, the tricylindrical cores with LCM from cyanobacterium Nostoc sp.and Calothrix sp. PCC 7601 with the LCM about 95 kDa [167, 169, 181] has three
Phycobilisomes from Cyanobacteria 133
REP domains, REP1, REP2 and REP3, and the pentacylindrical cores with the LCM about 128 kDa from cyanobacterium Anabaena sp. PCC 7120 and Mastigocladus laminosus [63, 95, 98-99, 169] has been described to have four REP domains, REP1 to REP4. Moreover, the data from the LCM of Mastigocladus laminosus PBS core also reveals that higher sequence identity is found between REP1 and REP3 and REP2 and REP4, possibly suggesting similar functions for these pairs of domains. Each REP domain is about 120 residues long and they are believed to provide the binding regions that interact with AP trimers [63, 169].
Besides the PD and REP domains, the LCM also contains other 2 to 5 sequence segments dependent on its molecular mass. The segments, denoted as ARMs, form the connections between the PD and REP domains. These domains may also act as the connectors between the core cylinders, for the REP domains of one LCM act in different core cylinders as the linker peptides to connect pairs of AP trimers adjacent to each other [63]. ARM1 is adjacent to the PD domain and is followed by REP1; in others words, ARM1 connects the PD and REP1. Similarly, REP1 is connected with REP2 via ARM2; REP3 is linked to REP2 by ARM3. The calculated pIs for the REP domains were 5.9-9.0 and are typically basic as the other linker polypeptides. The calculated pIs for AMRs were 10.4 to 11.4, while the PD domains were about 4.6 that differ significantly with REPs and ARMs [63, 169, 173]. These pI differences are favorable to the interaction between REPs and ARMs with subunits of core AP trimers by means of their opposite charges. The structural and functional characteristics described above demonstrate that the LCM of PBS cores play a key role in the core construction by not only linking pairs of AP trimers in various core cylinders via its REP domains but also forming the connections between different core cylinders via its ARM domains. Besides by the loop domains of the core LCM, PBS cores are fastened on thylakoid membranes.
4.2. Rod Linker Polypeptides The rod domain of PBSs is constructed by six or eight cylindrical rods that radiate from
the core of PBSs in typical hemidiscoidal PBSs. Each rod consists of disc-shaped PC, PEC and PE trimers or hexamers and rod linker polypeptides. The numbers of the linker polypeptides in a PBS rod are commonly equivalent to that of its phycobiliprotein discs. Because the rod-related linkers vary with each discs adding in the rod construction, the multiple rod linkers are believed to play significantly roles in the assembly of PBS rod domains [63-65, 81]. Rod linker polypeptides can be divided into three groups according to the difference in their molecular masses: 1) linker polypeptides with 8 to 10 kDa molecular masses, denoted as 10-8
RL ; 2) linker polypeptides of 30 to 27 kDa, named -3027RCL , which are
proved to form connection between the rods and the core; 3) linker polypeptides with molecular masses of about 31 to 35 kDa, denoted as 35-31
RL [63-64, 179]. Rod linker polypeptides were demonstrated to contain more basic amino acid residues; this make them quite basic and bearing net positive charges at pH 7.0 [63, 175, 183]. This feature gives a foundation for PBS rod construction by aid of machenism of charge-charge interaction between the rod linkers and the phycobiliprotein subunits.
A small rod linker peptide of 10-8RL types was reported in the PBS rods from
Mastigocladus laminosus, denoted as 8.9RL [62-63, 109, 175, 183]. 8.9
RL was associated with
Li Sun, Shumei Wang, Mingri Zhao et al. 134
PEC or PC complexes in the PBS rods of Mastigocladus laminosus. It is believed to be bound at the core-distal end of the rods, thus limiting the heterogeneity of the rod lengths. The amino acid sequence of 8.9
RL revealed that it was quite basic; it has a net charge of + 6 at pH
7.0 [63, 175]. It has to be concluded that 8.9RL terminates the rods ending with PEC in PBSs
from alga cells grown in low light intensity and also ending with C-PC complexes in PBSs from alga cells grown at high light intensity [62-63, 109].
Connection between PBS cores and rods is key point to structural construction and effective energy transfer of PBSs. The rod-core junction takes place on the interface of rods attaching to core cylinders. The rod phycobiliproteins adjacent directly to APs of the core cylinders are commonly PC-linker complexes in almost all PBSs reported from diverse algae. The linker polypeptides that fulfill the rod-core connection are known as rod-core linker ( RCL ), denoted as -3027
RCL , dependent on their molecular masses reported [59, 63-65, 81, 89, 173]. They differ in molecular mass from various regions of organisms. For example, the RCL is 27 kDa, 27
RCL , in the PBS from Synechococcus 6301[92-94] and from Synechocystis
6701[80, 89, 97]; the RCL is 29 kDa, 29RCL , in the PBS from Nostoc sp. [59, 96, 184-185];
the RCL is 29.5 kDa, 29.5RCL , in the PBS from Mastigocladus laminosus [62, 109, 175, 183];
the RCL is 28.5 kDa, 28.5RCL , in the PBS from Synechocystis sp. Strain BO 8402 and the
derivative Strain BO 9201 [186]. The rod-core linker polypeptides are believed to have two functions: firstly, they associate the peripheral rods of PBSs with the core; secondly, they impart a strong red-shift in the wavelength of maximum of absorption and fluorescence emission of the PC complexes which bind on the core cylinders. The second reveals that the RCL forces some interference on the fluorescing chromophore β-84 PCB near the central
cavity of PCs. Accordingly, the RCL may insert its one end in the central cavity and the other end situates in an interface between two AP trimers of the core cylinder which it attaches on. This enables an optimal rod-core energy transfer as well as the connection of the rod and core domains.
The rod-linker polypeptides of 35-31RL group denote the linker polypeptides associated with
phycobiliproteins at least one hexamer or more distant from the core domain in the peripheral rods. The first hexamer of the disk-shaped units which is bound on the core always contains an RCL , and is involved in the rod-core linkage with AP trimers of core cylinders. PBSs from
cyanobacteria often contain one or more 35-31RL group peptides, which depends on the length of
their rods. In other words, the 35-31RL peptide may increase in number whenever a hexamer is
piled up to elongate the rods. With respect to phycobiliprotein components of PBS rods from various cyanobacteria the different rod linkers of the 35-31
RL family were reported to be
associated with PE, PEC and PC hexamers. For example, the 35-31RL peptides identified in the
PBS rods from Mastigocladus laminosus are two PC linkers of 31 and 34.5 kDa ( 31
RPC L and 34.5
RPC L ) and one PEC linker of 34.5 kDa ( 34.5
RPECL ) [62, 109, 175, 183]; the PBS
rods from Synechocystis 6701 have two PE linkers of 30.5 and 31.5 kDa ( 30.5R
PE L and 31.5R
PE L )
and one PC linker ( 33.5R
PC L ) [80, 89, 97]; the linker polypeptides from Nostoc sp. are two PE
Phycobilisomes from Cyanobacteria 135
linkers ( 32R
PE L and 34R
PE L ) and one PC linker ( 34.5R
PC L ) [59, 96, 184-185]; there are one PEC
linker ( 30.5R
PECL ) and one PC linker ( 32.5R
PC L ) obtained from Anabaena variubilis phycobilisomes [100, 187]; and the two PC linkers characterized in the PBSs from Synechococcus 6301 are 30 and 33 kDa, 30
RPC L , 33
RPC L [92-94].
The linkers of 35-31RL group also bring about a red-shift of the absorption and fluorescence
emission maxima of their biliprotein-linker complexes [63, 64, 110, 187, 188]. This phenomenon demonstrates that the linker polypeptides have interaction with the chromophores that function as terminal emitters of rod phycobiliprotein trimers or hexamers, such as β-82 PEB for C-PE and C-PE-II, β-84 PCB for C-PC and PEC. These chromophores commonly situate near the central cavity of trimers or hexamers. However, crystal structure investigation on a PC trimer-linker complex from Synechococcus sp. PCC 7002 did not visualize the linker peptide by X-ray diffraction [110]. Similarly, γ subunit was also not visualized in the crystal R-PE hexamer from red alga Polysiphonia urceolata and Griffithsia monilis [189-190]. These facts may attributed to no adequate β-sheet and α-helix structures of the linker polypeptides to be exhibited by X-ray diffraction although they are believed to locate, at least a part, in the central cavity of the trimer PC and the hexamer R-PE.
5. ASSEMBLY OF PHYCOBILISOMES The above sections review the structure of phycobilisomes and characteristics of the
phycobiliproteins and the linker polypeptides of PBS components. This section assesses organization and assembly of the phycobilisomes from cyanobacteria in the basis of the above sections. In the meantime, it is outlined that the PBSs response to some certain environment factors, such as light quality and intensity and nitrates variation. The PBSs reported from cyanobacteria, red algae and glaucophytes almost all show the two distinct domains, rod and core, in electron micrographs. The rod domain may be composed of the phycobiliproteins of PE, PEC and PC types and the linker polypeptides of RL and RCL kinds, whereas the core
domain almost exclusively consists of the AP phycobiliproteins, AP, AP- CML and AP-B, and
the corresponding linker polypeptides of CL and CML types. The phycobiliprotein components make a spectroscopic foundation for the PBSs to harvest sun light, whereas the linker polypeptide components make the phycobiliproteins be exactly assembled in the PBS construction. The later not only optimizes the light harvesting of PBSs and the unidirectional energy transfer within PBSs, but also fulfills the structural and energetic couple of PBSs with PS II.
The cores of the PBSs reported from cyanobacteria [59, 62-65, 80-81, 89, 98-99, 103], red algae [55, 57, 68-72] and glaucophytes [82-83] are demonstrated to be assembled by two to five cylindrical substructures, known as core cylinders. Each cylinder is formed by four or two disk-shaped AP trimers which are face-to-face stacked. The two basal cylinders that are sited directly on thylakoid membranes for all bicylindrical, tricylindricl and pentacylindrical PBSs are individually composed of one copy AP- CML , one copy AP-B and two copy AP
trimers. The AP-B trimer adjacent to the AP- CML combines with a small molecular linker
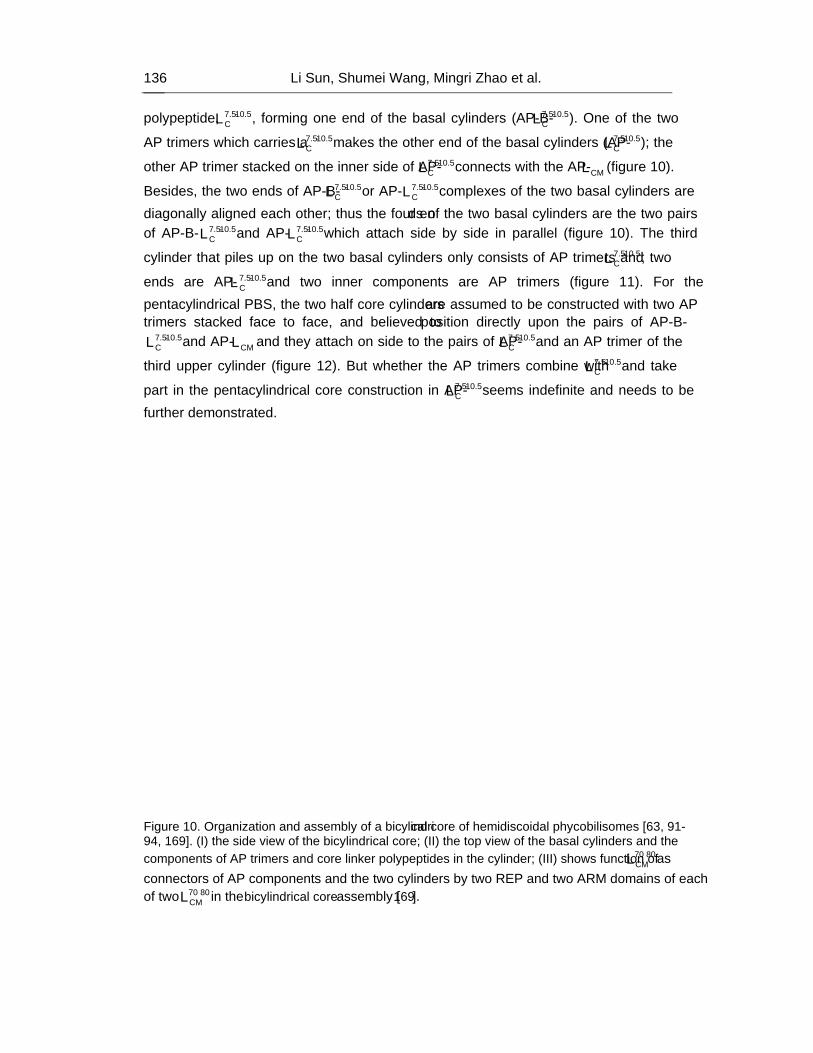
Li Sun, Shumei Wang, Mingri Zhao et al. 136
polypeptide, 10.5-7.5CL , forming one end of the basal cylinders (AP-B- 10.5-7.5
CL ). One of the two
AP trimers which carries a 10.5-7.5CL makes the other end of the basal cylinders (AP- 10.5-7.5
CL ); the
other AP trimer stacked on the inner side of AP- 10.5-7.5CL connects with the AP- CML (figure 10).
Besides, the two ends of AP-B- 10.5-7.5CL or AP- 10.5-7.5
CL complexes of the two basal cylinders are diagonally aligned each other; thus the four ends of the two basal cylinders are the two pairs of AP-B- 10.5-7.5
CL and AP- 10.5-7.5CL which attach side by side in parallel (figure 10). The third
cylinder that piles up on the two basal cylinders only consists of AP trimers and 10.5-7.5CL ; two
ends are AP- 10.5-7.5CL and two inner components are AP trimers (figure 11). For the
pentacylindrical PBS, the two half core cylinders are assumed to be constructed with two AP trimers stacked face to face, and believed to position directly upon the pairs of AP-B-
10.5-7.5CL and AP- CML and they attach on side to the pairs of AP- 10.5-7.5
CL and an AP trimer of the
third upper cylinder (figure 12). But whether the AP trimers combine with 10.5-7.5CL and take
part in the pentacylindrical core construction in AP- 10.5-7.5CL seems indefinite and needs to be
further demonstrated.
Figure 10. Organization and assembly of a bicylindrical core of hemidiscoidal phycobilisomes [63, 91-94, 169]. (I) the side view of the bicylindrical core; (II) the top view of the basal cylinders and the components of AP trimers and core linker polypeptides in the cylinder; (III) shows function of 8070
CML − as connectors of AP components and the two cylinders by two REP and two ARM domains of each of two 8070
CML − in the bicylindrical core assembly [169].
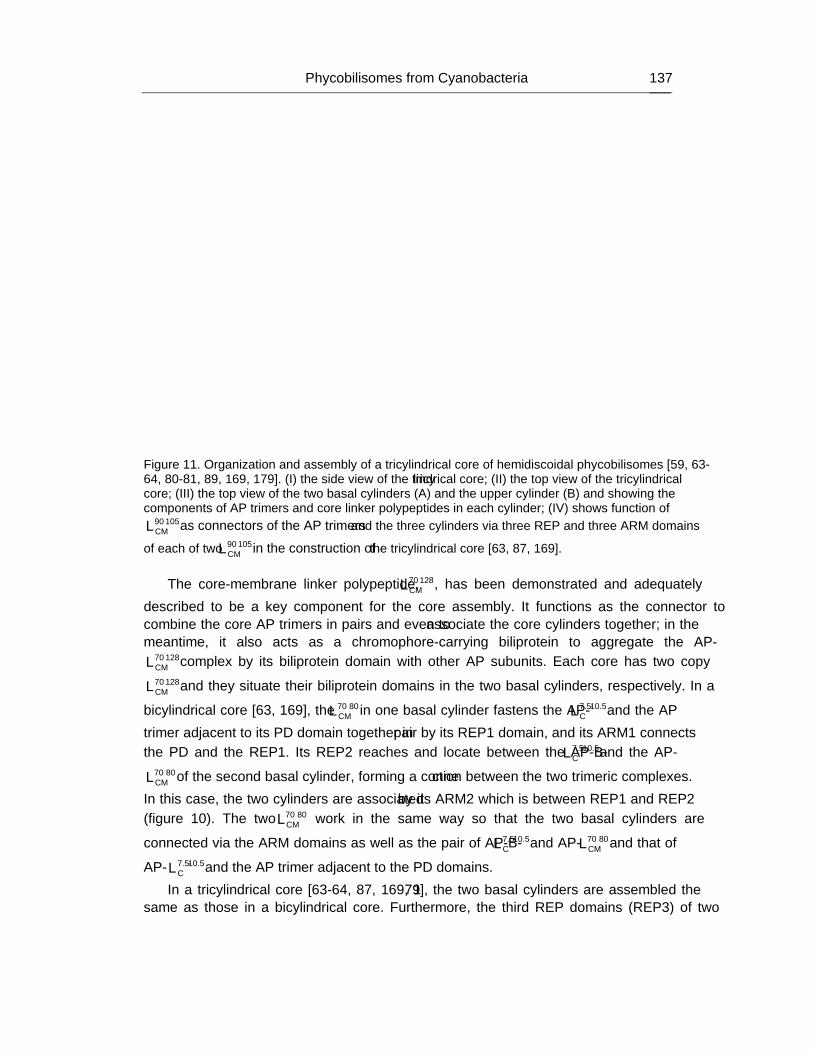
Phycobilisomes from Cyanobacteria 137
Figure 11. Organization and assembly of a tricylindrical core of hemidiscoidal phycobilisomes [59, 63-64, 80-81, 89, 169, 179]. (I) the side view of the tricylindrical core; (II) the top view of the tricylindrical core; (III) the top view of the two basal cylinders (A) and the upper cylinder (B) and showing the components of AP trimers and core linker polypeptides in each cylinder; (IV) shows function of
10590CML − as connectors of the AP trimers and the three cylinders via three REP and three ARM domains
of each of two 10590CML − in the construction of the tricylindrical core [63, 87, 169].
The core-membrane linker polypeptide, 12870CML − , has been demonstrated and adequately
described to be a key component for the core assembly. It functions as the connector to combine the core AP trimers in pairs and even to associate the core cylinders together; in the meantime, it also acts as a chromophore-carrying biliprotein to aggregate the AP-
12870CML − complex by its biliprotein domain with other AP subunits. Each core has two copy
12870CML − and they situate their biliprotein domains in the two basal cylinders, respectively. In a
bicylindrical core [63, 169], the 8070CML − in one basal cylinder fastens the AP- 10.5-7.5
CL and the AP trimer adjacent to its PD domain together in pair by its REP1 domain, and its ARM1 connects the PD and the REP1. Its REP2 reaches and locate between the AP-B- 10.5-7.5
CL and the AP-8070
CML − of the second basal cylinder, forming a connection between the two trimeric complexes. In this case, the two cylinders are associated by its ARM2 which is between REP1 and REP2 (figure 10). The two 8070
CML − work in the same way so that the two basal cylinders are
connected via the ARM domains as well as the pair of AP-B- 10.5-7.5CL and AP- 8070
CML − and that of
AP- 10.5-7.5CL and the AP trimer adjacent to the PD domains.
In a tricylindrical core [63-64, 87, 169, 179], the two basal cylinders are assembled the same as those in a bicylindrical core. Furthermore, the third REP domains (REP3) of two
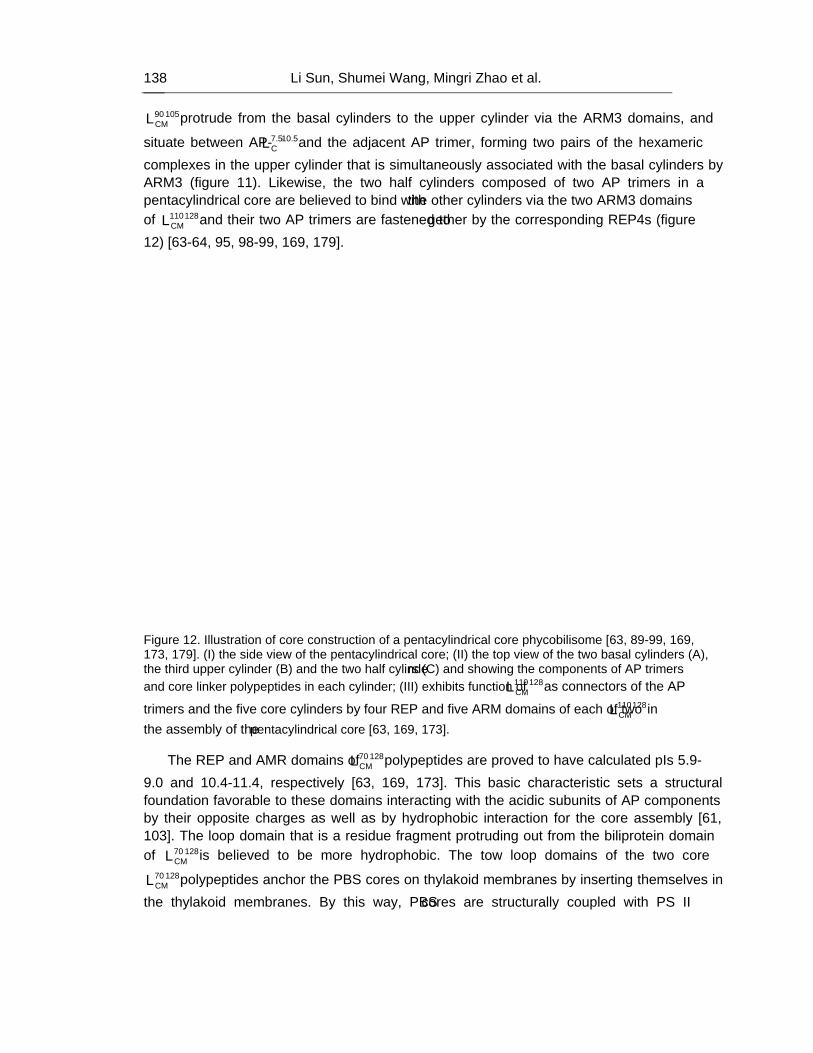
Li Sun, Shumei Wang, Mingri Zhao et al. 138
10590CML − protrude from the basal cylinders to the upper cylinder via the ARM3 domains, and
situate between AP- 10.5-7.5CL and the adjacent AP trimer, forming two pairs of the hexameric
complexes in the upper cylinder that is simultaneously associated with the basal cylinders by ARM3 (figure 11). Likewise, the two half cylinders composed of two AP trimers in a pentacylindrical core are believed to bind with the other cylinders via the two ARM3 domains of 128110
CML − and their two AP trimers are fastened together by the corresponding REP4s (figure 12) [63-64, 95, 98-99, 169, 179].
Figure 12. Illustration of core construction of a pentacylindrical core phycobilisome [63, 89-99, 169, 173, 179]. (I) the side view of the pentacylindrical core; (II) the top view of the two basal cylinders (A), the third upper cylinder (B) and the two half cylinders (C) and showing the components of AP trimers and core linker polypeptides in each cylinder; (III) exhibits function of 128110
CML − as connectors of the AP
trimers and the five core cylinders by four REP and five ARM domains of each of two 128110CML − in
the assembly of the pentacylindrical core [63, 169, 173].
The REP and AMR domains of 12870CML − polypeptides are proved to have calculated pIs 5.9-
9.0 and 10.4-11.4, respectively [63, 169, 173]. This basic characteristic sets a structural foundation favorable to these domains interacting with the acidic subunits of AP components by their opposite charges as well as by hydrophobic interaction for the core assembly [61, 103]. The loop domain that is a residue fragment protruding out from the biliprotein domain of 12870
CML − is believed to be more hydrophobic. The tow loop domains of the two core 12870
CML − polypeptides anchor the PBS cores on thylakoid membranes by inserting themselves in the thylakoid membranes. By this way, PBS cores are structurally coupled with PS II
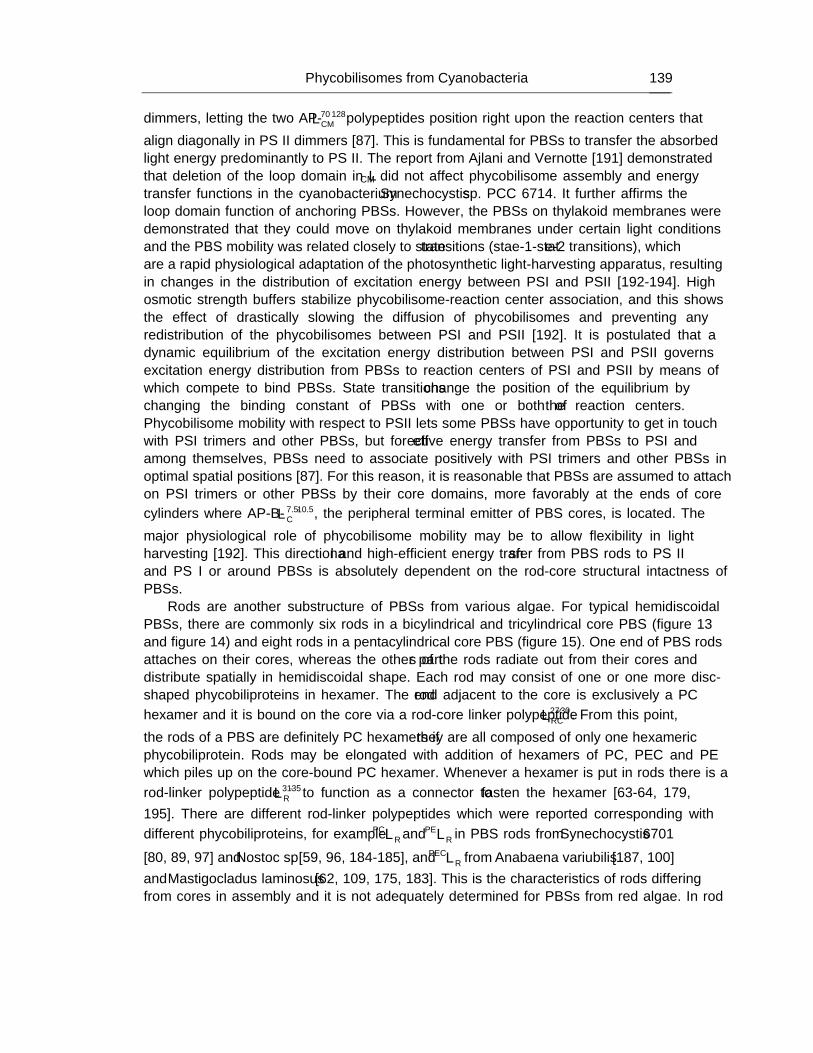
Phycobilisomes from Cyanobacteria 139
dimmers, letting the two AP- 12870CML − polypeptides position right upon the reaction centers that
align diagonally in PS II dimmers [87]. This is fundamental for PBSs to transfer the absorbed light energy predominantly to PS II. The report from Ajlani and Vernotte [191] demonstrated that deletion of the loop domain in LCM did not affect phycobilisome assembly and energy transfer functions in the cyanobacterium Synechocystis sp. PCC 6714. It further affirms the loop domain function of anchoring PBSs. However, the PBSs on thylakoid membranes were demonstrated that they could move on thylakoid membranes under certain light conditions and the PBS mobility was related closely to state transitions (stae-1-state-2 transitions), which are a rapid physiological adaptation of the photosynthetic light-harvesting apparatus, resulting in changes in the distribution of excitation energy between PSI and PSII [192-194]. High osmotic strength buffers stabilize phycobilisome-reaction center association, and this shows the effect of drastically slowing the diffusion of phycobilisomes and preventing any redistribution of the phycobilisomes between PSI and PSII [192]. It is postulated that a dynamic equilibrium of the excitation energy distribution between PSI and PSII governs excitation energy distribution from PBSs to reaction centers of PSI and PSII by means of which compete to bind PBSs. State transitions change the position of the equilibrium by changing the binding constant of PBSs with one or both of the reaction centers. Phycobilisome mobility with respect to PSII lets some PBSs have opportunity to get in touch with PSI trimers and other PBSs, but for effective energy transfer from PBSs to PSI and among themselves, PBSs need to associate positively with PSI trimers and other PBSs in optimal spatial positions [87]. For this reason, it is reasonable that PBSs are assumed to attach on PSI trimers or other PBSs by their core domains, more favorably at the ends of core cylinders where AP-B- 10.5-7.5
CL , the peripheral terminal emitter of PBS cores, is located. The major physiological role of phycobilisome mobility may be to allow flexibility in light harvesting [192]. This directional and high-efficient energy transfer from PBS rods to PS II and PS I or around PBSs is absolutely dependent on the rod-core structural intactness of PBSs.
Rods are another substructure of PBSs from various algae. For typical hemidiscoidal PBSs, there are commonly six rods in a bicylindrical and tricylindrical core PBS (figure 13 and figure 14) and eight rods in a pentacylindrical core PBS (figure 15). One end of PBS rods attaches on their cores, whereas the other parts of the rods radiate out from their cores and distribute spatially in hemidiscoidal shape. Each rod may consist of one or one more disc-shaped phycobiliproteins in hexamer. The rod end adjacent to the core is exclusively a PC hexamer and it is bound on the core via a rod-core linker polypeptide -3027
RCL . From this point, the rods of a PBS are definitely PC hexamers if they are all composed of only one hexameric phycobiliprotein. Rods may be elongated with addition of hexamers of PC, PEC and PE which piles up on the core-bound PC hexamer. Whenever a hexamer is put in rods there is a rod-linker polypeptide 35-31
RL to function as a connector to fasten the hexamer [63-64, 179, 195]. There are different rod-linker polypeptides which were reported corresponding with different phycobiliproteins, for example R
PC L and RPE L in PBS rods from Synechocystis 6701
[80, 89, 97] and Nostoc sp. [59, 96, 184-185], and RPECL from Anabaena variubilis [187, 100]
and Mastigocladus laminosus [62, 109, 175, 183]. This is the characteristics of rods differing from cores in assembly and it is not adequately determined for PBSs from red algae. In rod
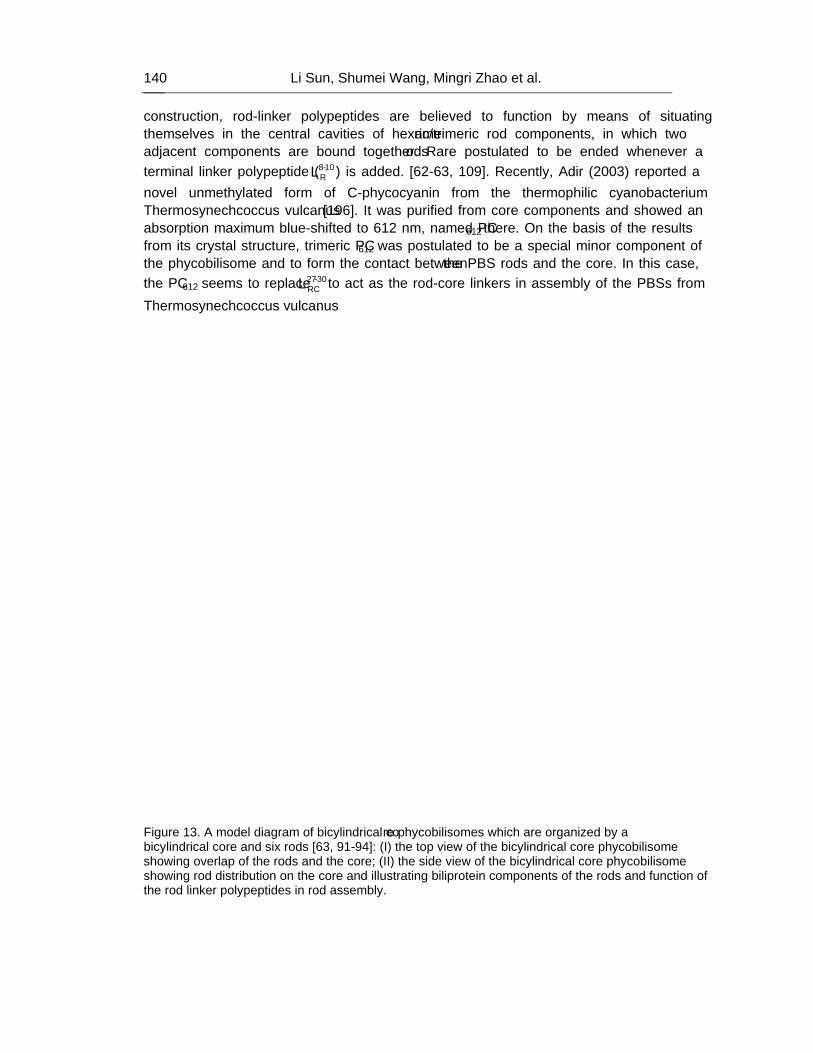
Li Sun, Shumei Wang, Mingri Zhao et al. 140
construction, rod-linker polypeptides are believed to function by means of situating themselves in the central cavities of hexameric/trimeric rod components, in which two adjacent components are bound together. Rods are postulated to be ended whenever a terminal linker polypeptide ( 10-8
RL ) is added. [62-63, 109]. Recently, Adir (2003) reported a novel unmethylated form of C-phycocyanin from the thermophilic cyanobacterium Thermosynechcoccus vulcanus [196]. It was purified from core components and showed an absorption maximum blue-shifted to 612 nm, named PC612 there. On the basis of the results from its crystal structure, trimeric PC612 was postulated to be a special minor component of the phycobilisome and to form the contact between the PBS rods and the core. In this case, the PC612 seems to replace -3027
RCL to act as the rod-core linkers in assembly of the PBSs from Thermosynechcoccus vulcanus.
Figure 13. A model diagram of bicylindrical core phycobilisomes which are organized by a bicylindrical core and six rods [63, 91-94]: (I) the top view of the bicylindrical core phycobilisome showing overlap of the rods and the core; (II) the side view of the bicylindrical core phycobilisome showing rod distribution on the core and illustrating biliprotein components of the rods and function of the rod linker polypeptides in rod assembly.
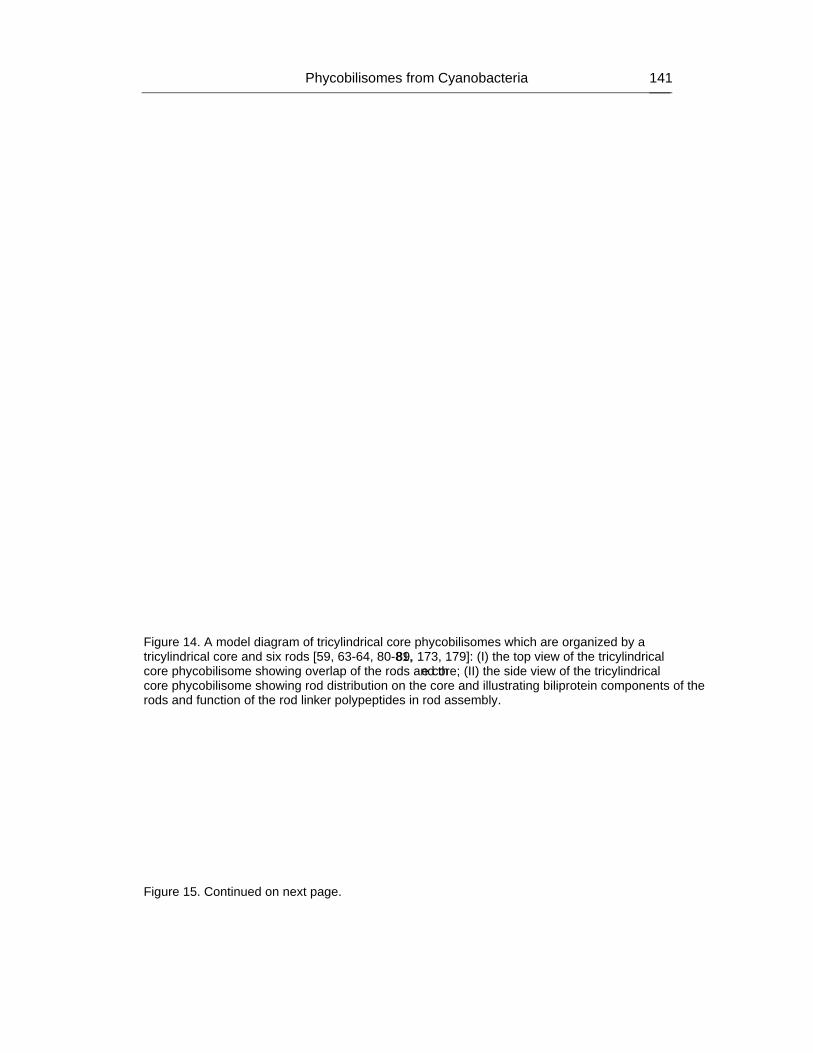
Phycobilisomes from Cyanobacteria 141
Figure 14. A model diagram of tricylindrical core phycobilisomes which are organized by a tricylindrical core and six rods [59, 63-64, 80-81, 89, 173, 179]: (I) the top view of the tricylindrical core phycobilisome showing overlap of the rods and the core; (II) the side view of the tricylindrical core phycobilisome showing rod distribution on the core and illustrating biliprotein components of the rods and function of the rod linker polypeptides in rod assembly.
Figure 15. Continued on next page.
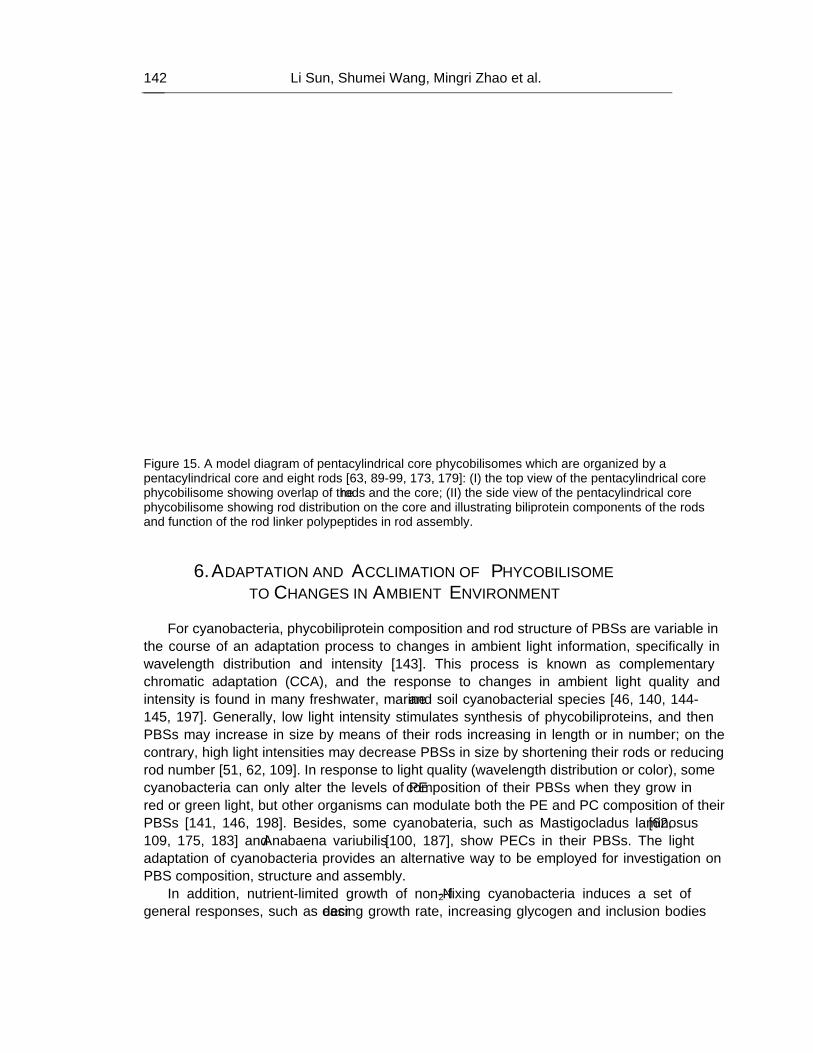
Li Sun, Shumei Wang, Mingri Zhao et al. 142
Figure 15. A model diagram of pentacylindrical core phycobilisomes which are organized by a pentacylindrical core and eight rods [63, 89-99, 173, 179]: (I) the top view of the pentacylindrical core phycobilisome showing overlap of the rods and the core; (II) the side view of the pentacylindrical core phycobilisome showing rod distribution on the core and illustrating biliprotein components of the rods and function of the rod linker polypeptides in rod assembly.
6. ADAPTATION AND ACCLIMATION OF PHYCOBILISOME
TO CHANGES IN AMBIENT ENVIRONMENT For cyanobacteria, phycobiliprotein composition and rod structure of PBSs are variable in
the course of an adaptation process to changes in ambient light information, specifically in wavelength distribution and intensity [143]. This process is known as complementary chromatic adaptation (CCA), and the response to changes in ambient light quality and intensity is found in many freshwater, marine and soil cyanobacterial species [46, 140, 144-145, 197]. Generally, low light intensity stimulates synthesis of phycobiliproteins, and then PBSs may increase in size by means of their rods increasing in length or in number; on the contrary, high light intensities may decrease PBSs in size by shortening their rods or reducing rod number [51, 62, 109]. In response to light quality (wavelength distribution or color), some cyanobacteria can only alter the levels of PE composition of their PBSs when they grow in red or green light, but other organisms can modulate both the PE and PC composition of their PBSs [141, 146, 198]. Besides, some cyanobateria, such as Mastigocladus laminosus [62, 109, 175, 183] and Anabaena variubilis [100, 187], show PECs in their PBSs. The light adaptation of cyanobacteria provides an alternative way to be employed for investigation on PBS composition, structure and assembly.
In addition, nutrient-limited growth of non-N2-fixing cyanobacteria induces a set of general responses, such as decreasing growth rate, increasing glycogen and inclusion bodies
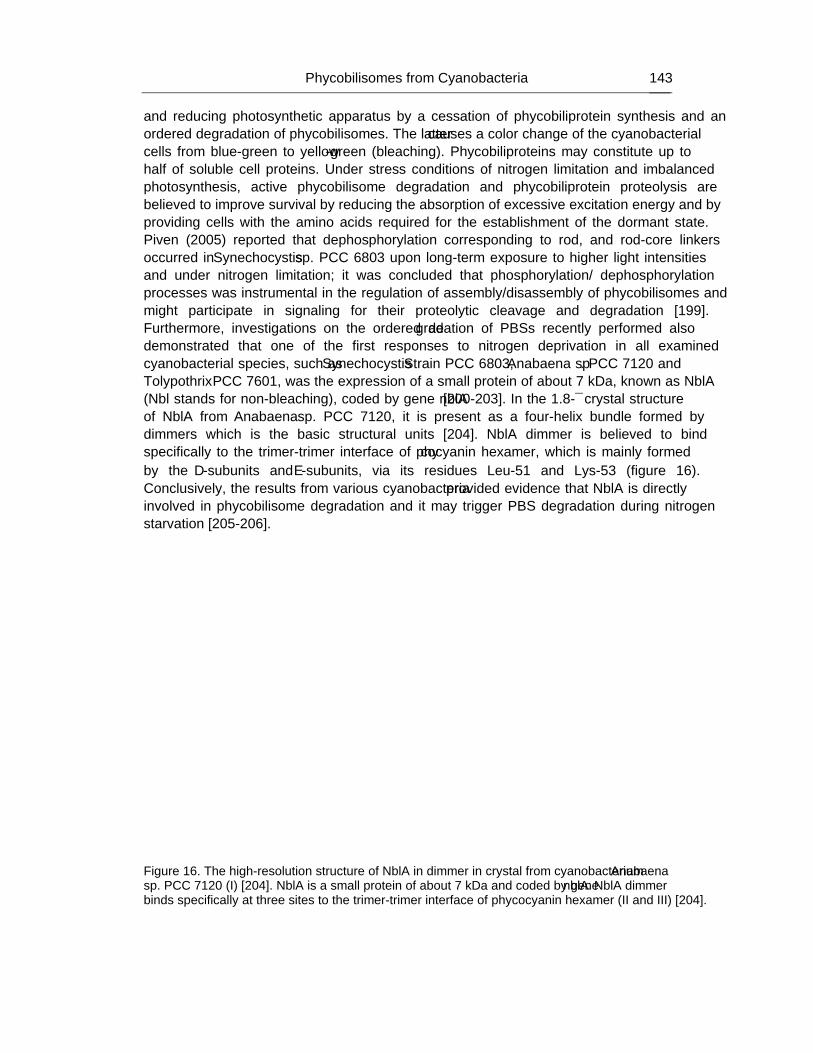
Phycobilisomes from Cyanobacteria 143
and reducing photosynthetic apparatus by a cessation of phycobiliprotein synthesis and an ordered degradation of phycobilisomes. The latter causes a color change of the cyanobacterial cells from blue-green to yellow-green (‘bleaching’). Phycobiliproteins may constitute up to half of soluble cell proteins. Under stress conditions of nitrogen limitation and imbalanced photosynthesis, active phycobilisome degradation and phycobiliprotein proteolysis are believed to improve survival by reducing the absorption of excessive excitation energy and by providing cells with the amino acids required for the establishment of the ‘dormant’ state. Piven (2005) reported that dephosphorylation corresponding to rod, and rod-core linkers occurred in Synechocystis sp. PCC 6803 upon long-term exposure to higher light intensities and under nitrogen limitation; it was concluded that phosphorylation/ dephosphorylation processes was instrumental in the regulation of assembly/disassembly of phycobilisomes and might participate in signaling for their proteolytic cleavage and degradation [199]. Furthermore, investigations on the ordered degradation of PBSs recently performed also demonstrated that one of the first responses to nitrogen deprivation in all examined cyanobacterial species, such as Synechocystis Strain PCC 6803, Anabaena sp. PCC 7120 and Tolypothrix PCC 7601, was the expression of a small protein of about 7 kDa, known as NblA (Nbl stands for non-bleaching), coded by gene nblA [200-203]. In the 1.8-Å crystal structure of NblA from Anabaena sp. PCC 7120, it is present as a four-helix bundle formed by dimmers which is the basic structural units [204]. NblA dimmer is believed to bind specifically to the trimer-trimer interface of phycocyanin hexamer, which is mainly formed by the α-subunits and β-subunits, via its residues Leu-51 and Lys-53 (figure 16). Conclusively, the results from various cyanobacteria provided evidence that NblA is directly involved in phycobilisome degradation and it may trigger PBS degradation during nitrogen starvation [205-206].
Figure 16. The high-resolution structure of NblA in dimmer in crystal from cyanobacterium Anabaena sp. PCC 7120 (I) [204]. NblA is a small protein of about 7 kDa and coded by gene nblA. NblA dimmer binds specifically at three sites to the trimer-trimer interface of phycocyanin hexamer (II and III) [204].
Li Sun, Shumei Wang, Mingri Zhao et al. 144
7. PHYCOBILIPROTEIN UTILIZATION AS FLUORESCENT PROBES The spectroscopic and properties of phycobiliproteins exhibit several unique qualitative
and quantitative features, such as broad absorption in visible light spectrum, enormous extinction coefficient, energy transfer and high fluorescence quantum efficiency [207-209], large Stokes shift and very little fluorescence quenching between multiple chromophores that the proteins contain, even between themselves. It is these features that have made phycobiliproteins be considered as fluorescent probes superior to small conventional synthetic dyes in many practical uses. Previous papers [61, 210-214] fully discussed these advantages: 1) strong and broad absorption in visible light spectrum and enormous extinction coefficient; 2) high fluorescence quantum efficiency in a broad range of pH values of neutral solution; 3) large Stokes shift; 4) very little fluorescence quenching between multiple chromophores that a phycobiliprotein carries and even between the proteins themselves; 5) numerous surface functional groups such as ε –NH2 or β- and γ-carboxyl per molecule, which are readily coupled by using heterobifunctional reagents to variety of small organic dyes or proteins. Labeling of proteins with phycobiliproteins via heterobifunctional reagents was reviewed by Holmes [212]. These features made phycobiliproteins ideal candidates for use as prospect fluorescent labels in practice.
Since phycobiliproteins were employed in immunoassay and single-cell analysis and in sorting by flow cytofluorimetry [210-211, 215-216] in the beginning of the eighties of last century, with development of commercial products of the phycobiliproteins and their conjugates, the utilization of the proteins as fluorescent probes has shown ever-extensive prospects in various fields of biology research: for example, multicolor flow cytometric technology used in cell analysis and sorting [217-221], histochemistry [222] and protein localization, and various particle dynamics within cells by techniques of fluorescence recovery after photobleaching (FRAP) [223] and single particle tracking (SPT) [224-227].
Among phycobiliproteins, B-PE, R-PE and AP are most extensively used as fluorescent probes [212-214]. B-PE and R-PE in hexamer have extinction coefficients as great as 2.4 × 10⁶ M−1 cm−1 at 545 nm and 1.96 × 10⁶ M−1 cm−1 at 565 nm, respectively, and fluorescence quantum efficiency more than 0.8; and even at protein concentration below 10−12 M, they still exist in hexamer form, showing no fluorescence emission decrease [213-214, 228]. AP has an extinction coefficient of 6.96 × 10⁵ M−1 cm−1 in trimer at 650 nm and a high quantum yield, but at concentrations below 10−6 M, AP trimer dissociates to the monomer, showing blue shift of the absorption maximum to 620 nm and a marked decrease in the extinction coefficient and the quantum yield. This dissociation can be surmounted by limited crosslinking of AP trimers with a water-soluble crosslinker carbdiimide and of PC trimers by formaldehyde, exhibiting little alteration in spectroscopic properties and great stability even at extreme dilution [229-230]. Instead of the chemical modification, more recently recombinant C-phycocyanin has been developed by protein engineering; the product similarly overcomes the dissociation of native phycocyanins in dilution state [229-231].
Orange (575 nm) and red (660 nm) emitting from R-PE/B-PE and AP through the efficient energy transfer among the contained chromophores when they are excited at 488 nm and at 633 nm, respectively, not only can easily be discriminated from the fluorescence from some conventional dyes, but also avoid the autofluorescence in biological samples which arises from such ubiquitous components as porphyrins and flavins [213-214]. Furthermore,
Phycobilisomes from Cyanobacteria 145
phycobiliprotein conjugates, such as R-PE cross-linked Cy5 [214], B-PE cross-linked AP [211] and AP cross-linked Cy7 [219], exhibit larger Stokes shift by intermolecular energy transfer from R-PE, B-PE and AP to Cy5, AP and Cy7; and they enhance and widen the applications of the phycobiliprotein fluorescence probes. For example, Roederer and coworkers achieved 8 color, 10-parameter flow cytometry to elucidate complex leuocyte heterogeneity by employing eight probes: cascade blue, fluorescein, R-PE, Cy5-R-PE, Cy7-R-PE, Texas red, AP and Cy7-AP with excitation provided by three spatially separated laser beams of 407 nm, 488 nm and 595 nm [217-219]. Detailed procedures for preparing the dye-phycobiliprotein conjugates can be found on the web [232]. Development of such cross-linked phycobiliprotein conjugates that have displayed their great potential in practice has attracted much attention.
Although the multi-chromophore-containing molecule of the phycobiliproteins creates the fluorescence emission per single labeling point several times more intensive than the organic fluorescent dyes, macromolecular complex phycobilisomes, with 1400 chromophores per phycobilisome, are employed as fluorescence labels after they are stabilized by chemically cross-linking modification [233-234]. In present, commercial products of low-molecular weight cryptomonad-derived phycobiliprotein conjugates have been developed and evaluated for their applicability to flow cytometry, both in extracellular and intracellular labeling applications [234]. In our lab, the researches on the application of phycobiliproteins as fluorescent probes have been focused on for many years. Based on investigation of newly discovered phycobiliproteins, especially from some special algae which grow at extreme habitats, such as thermophilic cyanobacterium Synechococcus lividus and red alga Cyanidium caldarium [120, 235], and from some marine Synechococcus strains [142, 146] which are good at green-light adaptation, there are some certain phycobiliproteins that will continuously be developed into fluorescent probes for application. Recently, phycobiliprotein fluorescent probes have been used in magnetic bead arrays [236].
In addition, owing to their high fluorescence quantum efficiency, phycobiliproteins may possibly be employed as an illuminant substance in photoluminescence, electroluminescence and microcavity laser through procedures under certain moderate conditions. In this case, the phycobiliproteins can be applied to the photoluminescence either alone or together with certain organic polymers in conjugation or doping, whereas to the electroluminescence they are applied most probably as the protein-polymer conjugates. It is also possible that the phycobiliproteins are used as molecular probes to monitor dynamic processes of configuration or conformation transformation of supramolecular polymers. The development of phycobiliprotein applications in the various fields is significantly based on the full understand of the structural and spectroscopic properties of phycobiliproteins.
ACKNOWLEDGMENTS Authors wish to gratefully acknowledge the support of Natural Science Fund of China
(30571720) and that of Prize Fund for Excellent Middle Aged and Young Scientists of Shandong Province (2006BS02016) for the research of authors’ lab.
Li Sun, Shumei Wang, Mingri Zhao et al. 146
REFERENCES
[1] Green, B. R. (2001). Was “molecular opportunism” a factor in the evolution of different photosynthetic light-harvesting pigment systems?. PNAS, 98, 2119-2121.
[2] Stoebe, B. & Maier, Uwe-G. (2002). One, two, three: nature’s tool box for building plastids. Protoplasma, 219, 123-130.
[3] Falkowski, P. G., Katz, M. E., Knoll, A. H., Quigg, A. Raven, J. A., Schofied, O. & Taylor, F. J. R. (2004). The evolution of modern eukaryotic phytoplankton. Science, 305, 354-359.
[4] Keeling, P. J. (2004). Diversity and evolutionary history of plastids and their hosts. Am. J. Bot. 91, 1481-1493.
[5] Douglas, S., Zauner, S., Fraunholz, M., Beaton, M. Penny, S., Deng, Lang-Tuo, Wu, X., Reith, M., Cavaliier-Smith, T. & Maier, Uwe-G. (2001). The highly reduced genome of an enslaved algal nucleus. Nature, 410, 1091-1096.
[6] Nozaki, H., Matsauzaki, M., Takahara, M., Misumi, O., Kuroiwa, H., Hasegawa, M., Shin-I, T., Kohara, Y., Ogasawara, N. & Kuroiwa, T. (2003). The phylogenetic position of red algae revealed by multiple nuclear genes from mitochondria-containing eukaryotes and alternative hypothesis on the origin of plastids. J. Mol. Evol., 56, 485-497.
[7] Yoon, H. S., Hackett, J. D., Ciniglia, C., Pinto, G. & Bhattacharya, D. (2004). A molecular timeline for the origin of photosynthetic eukaryotes. Mol. Biol. Evol., 21, 809-818.
[8] Yoon, H. S., Hackett, J. D., Van Dolah, F. M., Nosenko, T., Lidie, K. L. & Bhattacharya, D. (2005). Tertiary endosymbiosis driven genome evolution in dinoflagellate algae. Mol. Biol. Evol., 22, 1299-1308.
[9] Grossman, A. R. (2005). Paths toward algal genomics. Plant Physiol., 137, 410-427. [10] Keeling, P. J., Archibald, J. M., Fast, N. M. & Palmer, J. D. (2004). Comments on “The
Evolution of Modern Eukaryotic Phytoplankton”. Science, 306, 2191-2195. [11] Plancke, C., Colleon, C., Deschamps, P., Dauvillee, D., Nakamura, Y., Haebel, S.,
Ritte, G. & Steup, M. (2008). Pathway of cytosolic starch synthesis in the model glaucophyte Cyanophora paradoxa. Eukaryotic Cell, 7, 247-257.
[12] Saunders, G. W. & Hommersand, M. H. (2004). Assessing red algal supraordinal diversity and taxonomy in the context of contemporary systematic data. Am. J. Bot., 91, 1494-1507.
[13] Li, S., Nosenko, T., Hackett, J. D. & Bhattacharya, D. (2006). Phylogenomic analysis identifies red algal genes of eudosymbiotic origin in the chromalveolates. Mol. Biol. Evol., 23, 663-674.
[14] Lane, C. E., van den Heuvel, K., Kozera, C., Curtis, B. A., Parsons, B. J., Bowman, S. & Archibald, J. M. (2007). Nucleomorph genome of Hemiselmis andersenii reveals complete itron loss and compaction as a driver of protein structure and function. PANS, 104, 19908-190913.
[15] Fong, A. & Archibald, J. M. (2008). Evolutionary dynamic of light-independent protochlorophyllide oxidoreductase genes in the secondary plastids of cryptophyte algae. Eukaryotic Cell, 7, 550-553.
Phycobilisomes from Cyanobacteria 147
[16] Chen, M., Li, Sihui & Sun, L. (2007). A novel phycocyanin-Chla/c-protein complex isolated from chloroplasts of Chroomonas placoidea. Chinese Chemical Letters, 18, 1374-1378.
[17] Grauvogel, C., Brinkmann, H. & Petersen, J. (2008). Evolution of the glucose-6-phosphate isomerase: The plasticity of primary metabolism in photosynthetic eukaryotes. Mol. Biol. Evol., 24, 1611-1621.
[18] Mullineaux, C. W. (2005). Function and evolution of grana. Trends in Plant Science, 10, 521-525.
[19] Schuber, Wolf-Dieter, Klukas, O. & Saenger, W. (1998). A common ancestor for oxygenic and anoxygenic photosynthetic systems: A comparison based on the structural model of photosystem I. J. Mol. Biol., 280, 297-314.
[20] Hope, A. B. (2000). Electron transfers amongst cytochrome f, plasocyanin and photosystem I: kinetics and mechanisms. Biochim. Biophys. Acta, 1456, 5-26.
[21] Fromme, P., Jordan, P. & Krauβ, N. (2001). Structure of photosystem I. Biochim. Biophys. Acta, 1507, 5-31.
[22] Jordan, P, Fromme, P, Witt, H. T., Klukas, O., Saenger, W. & Krauβ, N. (2001). Three-dimensional structure of cyanobacterial photosystem I at 2.5 Å resolution. Nature, 411, 909-917.
[23] Shen, G., Zhao, J., Reimer, S. K., Antonkine, M. L., Cai, Q., Weiland, S. M., Golbeek, J. H. & Bryant, D. A. (2002). Assembly of photosystem I. J. Biol. Chem., 277, 20343-20353.
[24] Webber, A. N. & Lubitz, W. (2001). P700; the primary electron donor of photosystem I. Biochim. Biophys. Acta, 1507, 61-79.
[25] Guergova-Kuras, M., Boudreaux, B., Joliot, A., Joliot, P. & Redding, K. (2001). Evidence for two active branches for electron transfer in photosystem I. PNAS, 98, 4437-4442.
[26] Ishikita, H., Saenger, W., Biesiadka, J., Loll, B. & Knapp, E. (2006). How photosynthetic reaction centers control oxidation power in chlorophyll pairs P680, P700, and P870. PANS, 103, 9855-9860.
[27] Fromme, P., Melkozernov, A., Jordan, P. & Krauss, N. (2003). Structure and function of photosystem I: interaction with its soluble electron carriers and external antenna systems. FEBS Letters, 555, 40-44.
[28] Wang, Q., Jantaro, S., Lu, B., Majeed, W., Bailey, M. & He, Q. (2008). The high light-inducible polypeptides stabilize trimeric photosystem I complex under high light conditions in Synechocystis PCC 6803. Plant Physiol., 147, 1239-1250.
[29] Zouni, A., Witt, H., Kern, J., Fromme, P., Krauβ, N., Saenger, W. & Orth, P. (2001). Crystal structure of photosystem II from Synechococcus elongates at 3.8 Å resolution. Nature, 409, 739-743.
[30] Barber, j. (2006). Photosystem II: an enzyme of global significance. Biochem. Soc. Trans., 34, 619-631.
[31] Nield, J., Kruse, O., Ruprecht, J., Fonseca, P. & Buchel, C. (2000). Three-dimensional structure of Chlamydomonas reinhardtii and Synechococcus elongatus photosystem II complexes allows for comparison of their oxygen-evolving complex organization. J. Biol. Chem., 275, 27940-27946.
Li Sun, Shumei Wang, Mingri Zhao et al. 148
[32] Buchel, C. & Kuhlbrandt, W. (2005). Structural differences in the inner part of photosystem II between high plants and cyanobacteria. Photosynthesis Research, 85, 3-13.
[33] Loll1, B., Kern, J., Saenger, W., Zouni, A. & Biesiadka, J. (2005). Towards complete cofactor arrangement in the 3.0 Å resolution structure of photosystem II. Nature, 438, 1040-1044.
[34] Biesiadka, J., Loll, B., Kern, J., Irrgang K. & Zouni, A. (2004). Crystal structure of cyanobacterial photosystem II at 3.2 Å resolution: a closer look at the Mn-cluster. Phys. Chem. Chem. Phys., 6, 4733-4736.
[35] Ferreira, K. N., Iverson, T. M., Maghlaoui, K., Barber, J. & Iwata, S. (2004). Architecture of the photosynthetic oxygen-evolving center. Science, 303, 1831-1838.
[36] Ishikita, H. & Knapp, E. (2006). Function of redox-active tyrosine in photosystem II. Biophys. J., 90, 3886–3896.
[37] Pushkar, Y., Yano, J., Sauer, K., Boussac, A. & Yachandra, V. K. (2008). Structural changes in the Mn4Ca cluster and the mechanism of photosynthetic water splitting. PNAS, 105, 1879-1884.
[38] Dobakova, M., Tichy, M. & Komenda, J. (2007). Role of the PsbI protein in photosystem II assembly and repair in the cyanobacterium Synechocystis sp. PCC 6803, Plant Physiol., 145, 1681-1691.
[39] Hankamer, B., Morris, E., Nield, J., Carne, A. & Barber, J. (2001). Subunit positioning and transmembrane helix organisation in the core dimer of photosystem II. FEBS Letters, 504, 142-151.
[40] Nelson, M. E., Finazzi, G., Wang, Q. J., Middleton-Zarka, K. A., Whitmarsh, J. & Kallas. T. (2005). Cytochrome b6 arginine 214 of Synechococcus sp. PCC 7002, a key residue for quinine-reductase site function and turnover of the cytochrome b/f complex. J. Biol. Chem., 280, 10395-10402.
[41] Nield, J., Redding, K. & Hippler, M. (2004). Remodeling of light-harvesting protein complexes in Chlamydomonas in response to environmental changes. Eukaryotic Cell, 3, 1370–1380.
[42] Nelson, N. & Yocum, C. F. (2006). Structure and function of photosystems I and II. Annu. Rev. Plant Biol., 57, 521–65.
[43] Liu, Z., Yan, H., Wang, K., Kuang, T., Zhang, J., Gui, L., An, X. & Chang, W. (2004). Crystal structure of spinach major light-harvesting complex at 2.72 Å resolution. Nature, 428, 287-292.
[44] Takahashi, H., Iwai, M., Takahashi, Y. & Minagawa, J. (2006). Identification of the mobile light-harvesting complex II polypeptides for state transitions in Chlamydomonas reinhardtii. PANS, 103, 477-482.
[45] Koziol, A. G., Borza, T., Ishida, K., Keeling, P., Lee, R. W. & Durnford, D. G. (2007). Tracing the Evolution of the Light-Harvesting Antennae in Chlorophyll a/b-Containing Organisms. Plant Physiol., 143, 1802–1816.
[46] Kehoe, D. M. & Gutu, A. (2006). Responding to color: the regulation of complementary chromatic adaptation. Annu. Rev. Plant Biol., 57, 127–150.
[47] Mimuro, M., Tomo, T. & Tsuchiya, T. (2008). Two unique cyanobacteria lead to a traceable approach of the first appearance of oxygenic photosynthesis. Photosynth Res, 97, 167–176.
Phycobilisomes from Cyanobacteria 149
[48] Gould, S. B., Waller, R. F. & McFadden, G. I. (2008). Plastid Evolution. Annu. Rev. Plant Biol., 59, 491–517.
[49] van de Meene, A. M. L., Hohmann-Marriott, M. F., Vermaas, W. F. J. & Roberson, R. W. (2006). The three-dimensional structure of the cyanobacterium Synechocystis sp. PCC 6803. Arch Microbiol, 184, 259-270.
[50] Samsonoff, W. A. & MacColl, R. (2001). Biliproteins and phycobilisomes from cyanobacteria and red algae at the extremes of habitat. Arch Microbiol., 176, 400-405.
[51] Raps, S., Kycia, J. H., Ledbetter, M. C. & Siegelman, H. W. (1985). Light intensity adaptation and phycobilisome composition of Microcystis aeruginosa. Plant Physiol., 79, 983-987.
[52] Gray, B. H., Lipschultz, C. A. & Gantt, E. (1973). Phycobilisomes from a blue-green alga Nostoc Species. J. Bacteriology, 116, 471-478.
[53] Cosner, J. C. (1978). Phycobilisomes in spheroplasts of Anacystis nidulans. J. Bacteriology, 135, 1137-1140.
[54] Koller, K. P., Wehrmeyer, W. & Schneider, H. (1977). Isolation and characterization of disc-shaped phycobilisomes from the red alga Rhodella violacea. Arch. Microbiol., 112, 61-67.
[55] Wanner, G. & Kost, H.-P. (1980). Investigations on the arrangement and fine structure of Porphyridium cruentum phycobilisomes. Protoplasma, 102, 97-109.
[56] Gantt, E. Supramolecular membrane organization. In: Bryant, D. A., editor. The molecular biology of cyanobacteria. Netherlands: Kluwer Academic Publication; 1994; 119-138.
[57] Gantt, E. (1980). Structure and function of phycobilisomes: light harvesting pigment complexes in red and blue-green algae. Internat. Rew. Cytol., 66, 45-80.
[58] Glazer, A. N. (1984). Phycobilisome: a macromolecular complex optimized for light energy transfer. Biochem. Biophys. Acta, 768, 29 -51.
[59] Zilinskas, B. A. (1986). Phycobilisome structure and function. Photosynthesis Research, 10, 7-35.
[60] Rowan, K.S. Photosynthetic pigments of algae. Edition. New York: Cambridge University Press; 1989; 166-211.
[61] Sun, L., Wang, S., Chen, L. & Gong, X. (2003). Promising fluorescent probes from phycobiliproteins. IEEE J. Selected Topics in Quantum Electronics, 9, 177-188.
[62] Reuter, W. & Muller, C. (1993). Adaptation of the photosynthetic apparatus of cyanobacteria to light and CO2. J. Photochem. Photobiol. B: Biol., 21, 3-27.
[63] Sidler, W. A. Phycobilisome and phycobiliprotein structures. In: Bryant, D. A., editor. The molecular biology of cyanobacteria. Netherlands: Kluwer Academic Publication; 1994; 139-216.
[64] MacColl, R . (1998). Cyanobacterial phycobilisomes. J. Struct. Biol., 124, 311-334. [65] de Marsac, N. T. (2003). Phycobiliproteins and phycobilisomes: the early observations.
Photosynthesis Research, 76, 197–205. [67] Gantt, E. & Lipschultz, C. A. (1980). Structure and phycobiliproteins composition of
phycobilisomes from Griffithsia pacifica Rhodophyceae. J. Phycol., 16, 394-398. [68] Gantt, E. (1969). Properties and ultrastructure of phycoerythrin from Porphyridium
cruentum. Plant Physiol., 44, 1629-1638.
Li Sun, Shumei Wang, Mingri Zhao et al. 150
[69] Arteni, A. A., Liu, L., Aartsma, T. J., Zhang, Y., Zhou, B. & Boekema, E. J. (2008). Structure and organization of phycobilisomes on membranes of the red alga Porphyridium cruentum. Photosynth Res., 95, 169-174.
[70] Dilworth, M. F. & Gantt, E. (1981). Phycobilisome-thylakoid topography on photosynthetically active vesicles of Porphyridium cruentum. Plant Physiol., 67, 608-612.
[71] Glaser, A. N., Lundell, D. J., Yamanaka, G. & Williams, R. C. (1983). The structure of a ‘simple’ phycobilisome. Ann. Microbiol., 134B, 159-180.
[72] Algarra, P., Thomas, J.-C. & Mousseau, A. (1990). Phycobilisome heterogeneity in the red alga Porphyra umbilicalis. Plant Physiol., 92, 570-576.
[73] Rippka, R., Waterbury, J. & Cohen-Bazire, G. (1974). A cyanobacterium which lacks thylakoids. Arch. Microbiol, 100, 419-436.
[74] Guglielmi, G., Cohen-Bazire, G. & Bryant, D. A. (1981). The structure of Gloeobacter violaceus and its phycobilisomes. Arch Microbiol, 129, 181-189.
[75] Krogmann, D. W., Perez-Gomez, B., Gutierrez-Cirlos, E. B., Chagolla-Lopez, A., de la Vara, L. G. & Gomez-Lojero, C. (2007). The presence of multidomain linkers determines the bundle-shape structure of the phycobilisome of the cyanobacterium Gloeobacter violaceus PCC 7421. Photosynth Res., 93, 27–43.
[76] Bryant, D. A., Guglielmi, G., de Marsac, N. T. & Castets, A.-M. (1979). The structure of cyanobacterial phycobilisomes: a model. Arch. Microbiol., 123, 113-127.
[77] Nies, M. & Wehrmeyer, W. (1981). Biliprotein assembly in the hemidiseoidal phycobilisomes of the thermophilic cyanobacterium Mastigocladus laminosus Cohn. Arch Microbiol, 129, 374- 379.
[78] Siegelman, H. W. & Kycia, J. H. (1982). Molecular morphology of cyanobacterial phycobilisomes. Plant Physiol., 70, 887-897.
[79] Glazer, A. N. (1985). Light harvesting by phycobilisomes. Ann. Rev. Biophys. Biophys. Chem., 14, 47-77.
[80] Glazer, A. N. & Clark, J. H. (1986). Phycobilisomes: macromolecular structure and energy flow dynamics. Biophys. J., 49, 115-116
[81] Adir, N. (2005). Elucidation of the molecular structures of components of the phycobilisome: reconstructing a giant. Photosynth. Res., 85, 15-32.
[82] Giddings, T. H., Wasmann, C. & Staehelin, L. A. (1983). Structure of the thylakoids and envelope membranes of the cyanelles of Cyanophora paradoxa. Plant Physiol., 71, 409-419.
[83] Koike, H., Ikeda, Y., Yusa, F., Kashino, Y. & Satoh, K. (2007). Isolation and characterization of outer and inner envelope membranes of cyanelles from a glaucocystophyte, Cyanophora paradoxa. Photosynth. Res., 93, 45–53.
[84] Morschel, E., Koller, K.-P. & Wehrmeyer, W. (1980). Biliprotein assembly in the disc-shaped phycobilisomes of Rhodella violacea electron microscopical and biochemical analyses of C-phycocyanin and aliophycocyanin aggregates. Arch. Microbiol., 125, 43-51.
[85] Kursar, T. A., van der Meer, J. & Alberte, R. S. (1983). Light-Harvesting System of the Red Alga Gracilaria tikvahiae: I. Biochemical analyses of pigment mutations. Plant Physiol., 73, 353-360.
Phycobilisomes from Cyanobacteria 151
[86] Kursar, T. A., van der Meer, J., Alberte, R. S. (1983). Light-Harvesting System of the Red Alga Gracilaria tikvahiae: II. Phycobilisome characteristics of pigment mutants, Plant Physiol., 73, 361-369.
[87] Bald, D., Kruip, J. & Rogner, M. (1996). Supramolecular architecture of cyanobacterial thylakoid membranes: How is the phycobilisome connected with the photosystems?. Photosynth. Res., 49, 103-118.
[88] Ohki, K., Gantt, E., Lipschultz, C. A. & Ernst, M. C. (1985). Constant phycobilisome size in chromatically adapted cells of the cyanobacterium Tolypothrix tennis, and variation in Nostoc sp.. Plant Physiol., 79, 943-948.
[89] Glazer, A. N. (1989). Directional energy transfer in a photosynthetic antenna. J. Biol. Chem., 5, 1-4.
[90] Yamanaka, G., Glazer, A. N. & Williams, R. C. (1978). Cyanobacterial phycobilisomes characterization of the phycobilisomes of Synechococcus sp. 6301. J. Biol. Chem., 253, 8303-8310.
[91] Yamanaka, G., Glazer, A. N. & Williams, R. C. J. (1980). Molecular architecture of a light-harvesting antenna comparison of wild type and mutant Synechococcus 6301 phycobilisomes. J. Biol. Chem., 255, 11004-11010.
[92] Yamanaka, G., Lundellg, D. J. & Glazer, A. N. (1982). Molecular architecture of a light-harvesting antenna: isolation and characterization of phycobilisome subassembly particles. J. Biol. Chem., 257, 4077-4086.
[93] Lundell, D. J. & Glazer, A. N. (1983). Molecular architecture of a light-harvesting antenna: quaternary interactions in the Synechococcus 6301 phycobilisome core as revealed by partial tryptic digestion and circular dichroism studies. J. Biol. Chem., 258, 8708-8513.
[94] Lundell, D. J. & Glazer, A. N. (1983). Molecular architecture of a light-harvesting antenna: structure of the 18 s core-rod subassembly of the Synechococcus 6301 phycobilisome. J. Biol. Chem., 258, 894-901.
[95] 95 Reuter, W. & Wehrmeyer, W. (1990). Core substructure in Mastigocladus laminosus phycobilisomes: II. The central part of the tricylindrical core - APCM - contains the "anchor" polypeptide and no allophycocyanin B. Arch. Microbiol., 153, 111-1 17.
[96] Zilinskas, B. A. & Howell, D. A. (1983). Role of the colorless polypeptides in phycobilisome assembly in Nostoc sp.. Plant Physiol., 71, 379-387.
[97] Gingrich, I. C., Williams, R. C. & Glazer, A. N. (1982). Rod substructure in cyanobacterial phycobilisomes: Phycoerythrin assembly in Synechocystis 6701 phycobilisomes. J. Biol. Chem., 95, 170-178.
[98] Ducret, A., Sidler, W., Wehrli, E., Frank, G. and Zuber, H. (1996). Isolation, characterization and electron microscopy analysis of a hemidiscoidal phycobilisome type from the cyanobacterium Anabaena sp. PCC 7120. Eur. J. Biochem., 236, 1010-1024.
[99] Ducret, A., Muller, S. A., Goldie, K. N., Hefti, A., Sidler, W., Zuber, H. & Engel, A. (1998). Reconstitution, characterisation and mass analysis of the pentacylindrical allphycocyanin core complex from the cyanobacterium Anabaena sp. PCC 7120. J. Mol. Biol., 278, 369-388.
[100] Yu, M.-H. & Glazer, A. N. (1982). Cyanobacterial Phycobilisomes: Role of the linker polypeptides in the assembly of phycocyanin. J. Biol. Chem., 257, 3429-3433.
Li Sun, Shumei Wang, Mingri Zhao et al. 152
[101] Mullineaux, C. W. (2008). Phycobilisome-reaction centre interaction in cyanobacteria. Photosynth. Res, 95, 175–182.
[102] Glazer, A. N., Gindt, Y. M., Chan C. E. & Sauer, K. (1994). Selective disruption of energy flow from phycobilisomes to Photosystem I. Photosynth. Res, 40, 167-173.
[103] Sun, L. & Wang, S. (2003). Allophycocyanin complexes from the phycobilisome of a thermophilic blue-green alga Myxosarcina concinna Printz. J. of Photochem. Photobiol. B: Biol., 72, 45-53.
[104] Sun, L. & Wang, S. (2000). A phycoerythrin-allophycocyanin complex from the intact phycobilisomes of the marine red alga Polysiphonia urceolata. Photosynthetica, 38, 601-605.
[105] Katoh, T. (1988). Phycobilisome stability. Methods in Enzymology, 167, 313-318. [106] Sun, L., Wang, S., Gang, X. & Chen, L. (2004). A rod-linker-contained R-
phycoerythrin complex from the intact phycobilisome of the marine red alga Polysiphonia urceolata. J. Photochem. Photobiol.: B Biol., 76, 1-11.
[107] MacColl, R., Eisele, L. E., Dhar, M., Ecuyer, J. & Hopkins, S. (1999). Bilin organization in cryptomonad biliproteins. Biochem., 38, 4097-4105.
[108] MacColl, R., Eisele, L. E., Marrone, J. (1999). Fluorescence polarization studies on four biliproteins and a bilin model for phycoerythrin 545. Biochim. Biophys. Acta. 1412, 230-239.
[109] Reuter, W. & Nickel-Reuter, C. (1993). Molecular assembly of the phycobilisomes from the cyanobacterium Mastigocladus laminosus. J. Photochem. Photobiol. B: Biol., 18, 51-66.
[110] Pizarro, S. A & Sauer, K. (2001). Spectroscopic study of the light-harvesting protein C-phycocyanin associated with colorless linker peptides. Photochem. Photobiol., 73, 556-563.
[111] De Marsac, N. T. & Cohen-Bazire, G. (1977). Molecular composition of cyanobacterial phycobilisomes. Proc. Natl. Acad. Sci. USA, 74, 1635-1639.
[112] William, V. P. & Glazer Al. N. (1978). Structural studies on phycobiliproteins: I. Bilin-containing peptides of c-phycocyanin. J. Biol. Chem., 253, 202-211.
[113] Glazer, A. N., Fang, S. & Brown, D. M. (1973). Spectroscopic properties of C-phycocyanin and of its α and β Subunits. J. Biol. Chem., 248, 5679-5085.
[114] Fisher, R. G., Woods, N. E., Fuchs, H. E. & Sweet, R. M. (1980). Three-dimensional structures of C-phycocyanin and B-phycoerythrin at 5 Å resolution. J. Biol. Chem., 255, 5082-5089.
[115] Schirmer, T., Bode, W., Huber, R., Sidler, W. & Zuber, H. (19850. X-ray crystallographic structure of the light-harvesting biliprotein C-phycocyanin from the thermophilic cyanobacterium Mastigocladus laminosus and its resemblance to globin structures. J. Mol. Biol., 184, 257–277.
[116] Duerring, M., Schmidt, G. B. & Huber, R. (1991). Isolation, Crystallization, crystal structure analysis and refinement of constitutive C-phycocyanin from the chromatically adapting cyanobacterium Fremylla diplosiphon at 1.66 Å resolution. J. Mol. Biol., 217, 577-592.
[117] Kikuchi, H., Wako, H., Yura, K., Go, M. & Mimuro, M. (2000). Significance of a two-domain structure in subunits of phycobiliproteins revealed by the normal mode analysis. Biophys. J., 79, 1587-1600.
Phycobilisomes from Cyanobacteria 153
[118] Adir, N., Dobrovetsky, Y. & Lerner, N. (2001). Structure of c-phycocyanin from the thermophilic cyanobacterium Synechococcus vulcanus at 2.5 Å: structural implications for thermal stability in phycobilisome assembly. J. Mol. Biol., 313, 71-81.
[119] Stec, B., Troxler, R. F. & Teeter, M. M. (1999). Crystal structure of C-phycocyanin from Cyanidium caldarium provides a new perspective on phycobilisome assembly, Biophysical J., 76, 2912–2921.
[120] Eisele, L. E., Bakhru, S. H., Liu, X. & MacColl, R. (2000). Studies on C-phycocyanin from Cyanidium caldarium, a eukaryote at the extremes of habitat. Biochim. Biophys. Acta, 1456, 99-107.
[121] Debreczeny, M. P., Sauer, K., Zhou, J. & Bryant, D. A. (1995). Comparison of calculated and experimentally resolved rate constants for excitation energy transfer in C-phycocyanin: I. Monomers. J. Phys. Chem., 99, 8412-8419.
[122] Debreczeny, M. P., Sauer, K., Zhou, J. & Bryant, D. A. (1995). Comparison of calculated and experimentally resolved rate constants for excitation energy transfer in C-phycocyanin: II. Trimers. J. Phys. Chem., 99, 8420-8431.
[123] Apt, K. E., Collier, J. L. & Grossman, A. R. (1995). Evolution of the phycobiliproteins. J. Mol Biol. 248, 79–96.
[124] Zhao, F. & Qin, S. (2006). Evolutionary analysis of phycobiliproteins: Implications for their structural and functional relationships. J Mol Evol, 63, 330–340.
[125] Duerring, M., Huber, R., Bode, W., Ruembeli, R. & Zuber, H. (1990). Refined three-dimensional structure of phycoerythrocyanin from the cyanobacterium Mastigocladus laminosus at 2.7 Å. J. Mol. Biol., 211, 633-644.
[126] Wiegand, G., Parbel, A., Seifert, M. H. J., Holak, T. A. & Reuter, W. (2002). Purification, crystallization, NMR spectroscopy and biochemical analyses of a-phycoerythrocyanin peptides. Eur. J. Biochem., 269, 5046–5055.
[127] Zhao, K.-H., Wu, D., Wang, L., Zhou, M., Storf, M., Bubenzer, C., Strohmann, B. & Scheer, H. (2002). Characterization of phycoviolobilin phycoerythrocyanin-a84-cysteinlyase-(isomerizing) from Mastigocladus laminosus. Eur. J. Biochem., 269, 4542–4550.
[128] Zehetmayer, P., Hellerer, T., Parbel, A., Scheer, H. & Zumbusch, A. (2002). Spectroscopy of single phycoerythrocyanin monomers: Dark state identification and observation of energy transfer heterogeneities. Biophys. J., 83, 407–415.
[129] Bryant, D. A., Hixson, C. S. & Glazers, A. N. (1978) Structural studies on phycobiliproteins: III. Comparison of bilin-containing peptides from the β subunits of C-phycocyanin, R-phycocyanin, and phycoerythrocyanin. J. Biol. Chem., 253, 220-225.
[130] Bishop, J. E., Rapoport, H., Klotz, A. V., Chan, C. F., Glazer, A. N., Fuglistaller, P. & Zuber, H. (1987). Chromopeptides from phycoerythrocyanin: Structure and linkage of the three bilin groups. J. Am. Chem. Soc., 109, 875-881.
[131] Glazer, A. N. & Hixson, C. S. (1975). Characterization of R-phycocyanin: Chromophore content of R-phycocyanin and C-phycoerythrin. J. Biol. Chem., 250, 5487-5495.
[132] Jiang, T., Zhang, J., Chang, W. & Liang, D. (2001). Crystal structure of R-phycocycanin and possible energy transfer pathways in the phycobilisome. Biophys. J., 81, 1171-1179.
[133] Ong, L. J. & Glazer, A. N. (1987). R-phycocyanin II, a new phycocyanin occurring in marine Synechococcus species. J. Biol. Chem., 262, 6323-6327.
Li Sun, Shumei Wang, Mingri Zhao et al. 154
[134] Zhang, J. P., Wan, Z. L., Wang, S. G., Chang, W. & Liang, D. (1995). solation, crystallization and preliminary crystallographic analysis of R-phycocyanin from polysiphonia urceolata. Acta. Biophys. Sinica., 11, 481-484.
[135] Schoenleber, R. W., Lundell, D. J., Glazer, A. N. & Rapoport, H. (1984). Bilin attachment sites in the α and β subunits of B-phycoerthrin. J. Biol. Chem., 259, 5481-5484.
[136] Ficner, R., Lobeck, K., Schmidt, G. & Huber, R. (1992). Isolation, crystallization, crystal structure analysis and refinement of B-phycoerythrin from the red alga Porphyridium sordidum at 2.2 Å resolution. J. Mol. Biol., 228, 935-950.
[137] Klotz, A. V. & Glazer, A. N. (1985). Characterization of the bilin attachment sites in R-phycoerythrin. J. Biol. Chem., 260, 4856-4863.
[138] Apt, K. E., Hoffman, N. E. & Grossman, A. R. (1993). The γ subunit of R-phycoerythrin and its possible mode of transport into the plastid of red algae. J. Biol. Chem., 268, 16208-16215.
[139] Chang, W., Jiang, T., Wan, Z., Zhang, J., Yang, Z. & Liang, D. (1996). Crystal structure of R-phycoerythrin from polysiphonia urceolata at 2.8 Å resolution. J. Mol. Biol., 262, 721-731.
[140] Partensky, F., Hess, W. R. & Vaulot, D. (1999). Prochlorococcus, a marine photosynthetic prokaryote of global significance. Microbiol. Molecular Biol. Reviews, 63, 106–127.
[141] Grossman, A. R., Bhaya, D. & He, Q. (2001). Tracking the light environment by cyanobacteria and the dynamic nature of light harvesting. J. Biol. Chem., 276, 11449–11452.
[142] Palenik, B. (2001). Chromatic adaptation in marine synechococcus strains. Appl. Environm. Microbiol., 67, 991-994.
[143] Miskiewicz, E., Ivanov, A. G. & Huner, N. P. A. (2002). Stoichiometry of the photosynthetic apparatus and phycobilisome structure of the cyanobacterium Plectonema boryanum UTEX 485 are regulated by both light and temperature, Plant Physiology 130, 1414–1425
[144] Grossman, A. R. (2003). A molecular understanding of complementary chromatic adaptation. Photosynthesis Research, 76, 207–215.
[145] Everroad, C., Six, C., Partensky, F., Thomas, J.-C., Holtzendorff, J. & Wood, A. M. (2006). Biochemical bases of type IV chromatic adaptation in marine Synechococcus spp. J. Bacteriology, 188, 3345–3356.
[146] Toledo, G., Palenik, B., & Brahamsha, B. (1999). Swimming marine Synechococcus strains with widely different photosynthetic pigment ratios form a monophyletic group. Appl. Environm. Microbiol., 65, 5247-5251.
[147] Ong, L. J. & Glazer, A. N. (1991). Phycoerythrins of marine unicellular cyanobacteria: I Bilin types and locations and energy transfer pathways in synechococcus spp. J. Biol. Chem., 266, 9515-9527.
[148] Alberte, R. S., Wood, A. M., Kursar, T. A. & Guillard, R. R. L. (1984). Novel phycoerythrins in marine Synechococcus spp.: Characterization and evolutionary and ecological implications. Plant Physiol., 75, 732-739.
Phycobilisomes from Cyanobacteria 155
[149] Swanson, R. V., Ong, L. J., Wilbanks, S. M. & Glazer, A. N. (1991). Phycoerythrins of marine unicellular cyanobacteria: II. Characterization of phycobiliproteins with unusually high phycourobilin content. J. Biol. Chem., 266, 9528-9534.
[150] Wilbanks, S. M., de Lorimier, R. & Glazer, A. N. (1991). Phycoerythrins of marine unicellular cyanobacteria: III. Sequence of a class II phycoerythrin. J. Biol. Chem., 266, 9535-9539.
[151] Wilbanks, S. M. & Glazer, A. N. (1993). Rod structure of a phycoerythrin II-containing phycobilisome: I. Organization and sequence of the gene cluster encoding the major phycobiliprotein rod components in the genome of marine Synechococcus sp. WH8020. J. Biol. Chem., 268, 1226-1235.
[152] Wilbanks, S. M. & Glazer, A. N. (1993). Rod structure of a phycoerythrin II-containing phycobilisome: II. Complete sequence and bilin attachment site of a phycoerythrin γ subunit. J. Biol. Chem., 268, 1236-1241.
[153] Six, C., Thomas, J.-C., Thion, L., Lemoine, Y., Zal, F. & Partensky, F. (2005). Two novel phycoerythrin-associated linker proteins in the marine cyanobacterium Synechococcus sp. Strain WH8102. J. Bacteriology, 187, 1685–1694.
[154] Glazer, A. N. (1994). Phycobiliproteins-a family of valuable, widely use fluorophores. J. App. Phycology, 6, 105-112.
[155] Brejc, K., Ficner, R., Huber, R. & Steinbacher, S. (1995). Isolation, crystallization, crystal structure analysis and refinement of allophycocyanin from the cyanobacterium Spirulina platensis at 2.3 Å resolution. J. Mol. Biol., 249, 424-440.
[156] Liu, J., Jiang, T., Zhang, J. & Liang, D. (1999). Crystal structure of allophycocyanin from red algae Porphyra yezoensis at 2.2 Å resolution. J. Biol. Chem., 274, 16945-16952.
[157] DeLange, R. J., Williams, L. C. & Glazer, A. N. (1981). The amino acid sequence of the β subunit of allophycocyanin. J. Biol. Chem., 256, 9558-9566.
[158] Troxler, R. F., Greenwald, L. S. & Zilinskas, B. A. (1980). Allophycocyanin from Nostoc sp. phycobilisomes: Properties and amino acid sequence at the NH2 terminus of the α and β subunits of allophycocyanins I, II, and III. J. Biol. Chem., 255, 9380-9387.
[159] Zilinskas, B. A. (1982). Isolation and characterization of the central component of the phycobilisome core of Nostoc sp.. Plant Physiol., 70, 1060-1065.
[160] Loos, D., Cotlet, M., Schryer, F. D., Habuchi, S. & Hofkens, J. (2004). Single-molecule spectroscopy selectively probes donor and acceptor chromorphores in the phycobiliprotein allophycocyanin. Biophys. J., 87, 2598-2608.
[161] MacColl, R. (2004). Allophycocyanin and energy transfer. Biochim. Biophys. Acta, 1657, 73-81.
[163] Holzwarth, A. R., Bittersmann, E., Reuter, W. & Wehrmeyer, W. (1990). Studies on chromophore coupling in isolated phycobiliproteins: III. Picosecond excited state kinetics and time-resolved fluorescence spectra of different allophycocyanins from Mastigocladus laminosus. Biophys. J., 57, 133-145.
[164] Reuter, W., Wiegand, G., Huber, R. & Than, M. E. (1999). Structual analysis at 2.2 Å of orthorhombic crystals presents the asymmetry of the allophycocyanin-linker complex, AP⋅ 8.7
CL , from phycobilisomes of Mastigocladus laminosus. Proc. Natl. Acad. Sci. USA, 96, 1363-1368.
Li Sun, Shumei Wang, Mingri Zhao et al. 156
[165] Rusckowski, M. & Zilinskas, B. A. (1982). Allophycocyanin I and the 95 kilodalton polypeptide: The bridge between phycobilisomes and membranes, Plant Physiol., 70, 1055-1059.
[166] Reuter, W. & Wehrmeyer, W. (1988). Core substructure in Mastigocladus laminosus phycobilisomes: I. Microheterogeneity in two of three allophycocyanin core complexes. Arch Microbiol., 150, 534- 540.
[167] Houmard, J., Capuano, V., Coursin, T. & de Marsac, N. T. (1988). Genes encoding core components of the phycobilisome in the cyanobacterium Calothrix sp. strain pcc 7601: Occurrence of a multigene family. J. Bacteriol., 170, 5512-5521.
[168] Capuano, V., Thomasv, J.-C., de Marsac, N. T. & Houmard, J. (1993). An in Vivo approach to define the role of the LCM, the key polypeptide of cyanobacterial phycobilisomes. J. Biol. Chem., 268, 8277-8283.
[169] Capuano, V., Braux, A.-S., de Marsac, N. T. & Houmard, J. (1991). The “anchor polypeptide” of cyanobacterial phycobilisomes: Molecular characterization of the Synechococcus sp. pcc 6301 apce gene. J. Biol. Chem., 266, 7239-7247.
[170] Houmard, J., Capuano, V., Colombano, M. V., Coursin, T. & de Marsac, N. T. (1990). Molecular characterization of the terminal energy acceptor of cyanobacterial phycobilisomes. Proc. Natl. Acad. Sci. USA, 87, 2152-21156.
[171] Ley, A. C. & Butler, W. L. (1977). Isolation and function of allophycocyanin B of Porphyridium cruentum. Plant Physiol., 59, 974-980.
[172] Lundell, D. J. & Glazer, A. N. (1981). Allophycocyanin B: A common β subunit in Synechococcus allophycocyanin B (λmax 670 nm) and allophycocyanin (λmax 650 nm). J. Biol. Chem., 256, 12600-12606.
[173] Liu, L., Chen, X., Zhang, Y. & Zhou, B. (2005). Characterization, structure and function of linker polypeptides in phycobilisomes of cyanobacteria and red algae: An overview. Biochem. Biophys. Acta, 1708, 133-142.
[174] Füglistaller, P., Mimuro, M., Suter, F. & Zuber, H. (1987). Allophycocyanin complexes of the phycobilisome from Mastigocladus laminosus: influence of the linker polypeptide LC
8.9 on the spectral properties of the phycobiliprotein subunits. Biol. Chem. Hoppe-Seyler, 368, 353-367.
[175] Füglistaller, P., Suter, F. & Zuber, H. (1985). Linker polypeptides of the phycobilisome from cyanobacterium Mastigocladus laminosus: amino-acid sequences and relationships. Biol. Chem. Hoppe-Seyler, 366, 993-1001.
[176] Füglistaller, P., Suter, F. & Zuber, H. (1986). Linker polypeptides of the phycobilisomes from the cyanobacterium Mastigocladus laminosus. Biol. Chem. Hopper-Seyker, 367, 601-614.
[178] Seiner, J. M. & Pompe, J. A. (2005). Characterization of apcC, the nuclear gene for the phycobilisome core linker polypeptide LC
7.8 from the glaucocystophyte alga Cyanophora paradoxa.Improt of the precursor into isolated cyanelles and integration of the mature protein into intact phycobilisomes. Cur. Genet., 44, 132-137.
[179] Mimuro, M., Kikuchi, H. & Murakami, A. Structure and function of phycobilisomes. In: Signal, G. S., Renger, G., Sopory, S. K., Irrgang, K-D., Govindjee, editor. Concepts in photobiology: Photosynthesis and photomorphogenesis. New Delhi, India: Narosa Publishing House; 1999; 104-135.
Phycobilisomes from Cyanobacteria 157
[180] Lundell, D. J., Yamanaka, G. & Glazer, A. N. (1981). A terminal energy acceptor of the phycobilisome: The 75,000-dalton polypeptide of Synechococcus 6301 phycobilisomes−A new biliprotein. J. Cell Biol., 91, 315-319.
[181] Mimuro, M. & Gantt, E. (1986). A high molecular weight terminal pigment ("anchor polypeptide") and a minor blue polypeptide from phycobilisomes of the cyanobacterium Nostoc sp. (MAC): Isolation and characterization. Photosynthesis Research, 10, 201-208.
[182] Redlinger, T. & Gantt, E. (1982). A Mr 95,000 polypeptide in Porphyridium cruentum phycobilisomes and thylakoids: Possible function in linkage of phycobilisomes to thylakoids and in energy transfer. Proc. Nati Acad. Sci. USA, 79, 5542-5546.
[183] Füglistaller, P., Suter, F. & Zuber, H. (1986). Linker polypeptides of the phycobilisome from cyanobacterium Mastigocladus laminosus: isolation and characterization of phycobiliprotein-linker polypeptide complexes. Biol. Chem. Hoppe-Seyler, 367, 601-614.
[184] Zilinskas, B. A. & Howell, D. A. (1987). Immunological conservation of phycobilisome rod linker polypeptides. Plant Physiol., 85, 322-326.
[185] Glick, R. E. & Zilinskas, B. A. (1982). Role of the colorless polypeptides in phycobilisome reconstitution from separated phycobiliproteins. Plant Physiol., 69, 991-997.
[186] Reuter, W., Westermann, M., Brass, S., Ernst, A., Boger, P. & Wehrmeyer, W. (1994). Structure, composition, and assembly of paracrystalline phycobiliproteins in Synechocystis sp. Strain BO 8402 and of phycobilisomes in the derivative Strain BO 9201. J. Bacreriol., 176, 896-904.
[187] Yu, M.-H. Glazer, A N. & Williamsll, R. C. (1981). Cyanobacterial Phycobilisomes: Phycocyanin assembly in the rod substructures of Anabaena varzabzlis phycobilisomes. J. Biol. Chem., 256, 13130-13136.
[188] Lundellg, D. J., Williams, R. C. & Glazer, A. N. (1981). Molecular architecture of a light-harvesting antenna: In vitro assembly of the rod substructures of synechococcus 6301 phycobilisomes. J. Biol. Chem., 256, 3580-3592.
[189] Chang, W. R., Jiang, T., Wan, Z. L., Zhang, J. P., Yang, Z. X. & Liang, D. C. (1996). Crystal structure of R-phycoerythrin from Polysiphonia urceolata. at 2.8 Å resolution. J. Mol. Biol. 262, 721-731.
[190] Ritter, S., Hiller, R. G., Wrench, P. M., Welte, W. & Diederichs, K. (1999). Crystal structure of a phycourobilin-containing phycoerythrin at 1.90-Å resolution. J. Structural Biol., 126, 86–97.
[191] Ajlani, G. & Vernotte, C. (1998). Deletion of the PB-loop in the LCM subunit does not affect phycobilisome assembly or energy transfer functions in the cyanobacterium Synechocystis sp. PCC 6714. Eur. J. Biochem., 257, 154-159.
[192] Joshua, S. & Mullineaux, C. W. (2004). Phycobilisome diffusion is required for light-state transitions in cyanobacteria. Plant Physiol., 135, 2112–2119.
[193] Aspinwall, C. L., Sarcina, M. & Mullineaux, C. W. (2004). Phycobilisome mobility in the cyanobacterium Synechococcus sp. PCC7942 is influenced by the trimerisation of Photosystem I. Photosynthesis Research, 79, 179–187.
[194] Joshua, S., Bailey, S., Mann, N. H. & Mullineaux, C. W. (2005). Involvement of phycobilisome diffusion in energy quenching in cyanobacteria. Plant Physiology, 138, 1577–1585.
Li Sun, Shumei Wang, Mingri Zhao et al. 158
[195] Ughy, B. & Ajlani, G. (2004). Phycobilisome rod mutants in Synechocystis sp. strain PCC 6803. Microbiology, 150, 4147–4156.
[196] Adir, N. & Lerner, N. (2003). The crystal structure of a novel unmethylated form of C-phycocyanin, a possible connector between cores and rods in phycobilisomes. J. Biol. Chem., 278, 25926–25932.
[197] Montgomery, B. L. (2008). Shedding new light on the regulation of complementary chromatic adaptation. Cent. Eur. J. Biol., 3, 351–358.
[198] Grossman, A. R., Schaefer, M. R., Chiang, G. G. & Collier, J. L. (1993). The phycobilisome, a light-harvesting complex resposive to environmental conditions. Microbiological Reviews, 57, 725-749.
[199] Piven, I., Ajlani, G. & Sokolenko, A. (2005). Phycobilisome linker proteins are phosphorylated in Synechocystis sp. PCC 6803. J. Biol. Chem., 280, 21667–21672.
[200] Richaud, C., Zabulon, G., Joder, A. & Thomas, J.-C. (2001). Nitrogen or sulfur starvation differentially affects phycobilisome degradation and expression of the nbla gene in Synechocystis Strain PCC 6803. J. Bacteriol., 183, 2989–2994.
[201] Strauss, H., Misselwitz, R., Labudde, D., Nicklisch, S. & Baier, K. (2002). NblA from Anabaena sp. PCC 7120 is a mostly a-helical protein undergoing reversible trimerization in solution. Eur. J. Biochem., 269, 4617–4624.
[202] Luque, I., de Alda, J. A. G.O., Richaud, C., Zabulon, G., Thomas, J.-C., Houmard, J. (2003). The NblAI protein from the filamentous cyanobacterium Tolypothrix PCC 7601: regulation of its expression and interactions with phycobilisome components. Molecular Microbiol., 50, 1043–1054.
[203] Baier, K, Lehmann, H., Stephan, D. P. & Lockau, W. (2004). NblA is essential for phycobilisome degradation in Anabaena sp. strain PCC 7120 but not for development of functional heterocysts. Microbiol., 150, 2739–2749.
[204] Bienert, R., Baier, K., Volkmer, R., Lockau, W. & Heinemann, U. (2006). Crystal structure of NblA from Anabaena sp. PCC 7120, a small Protein playing a key role in phycobilisome degradation. J. Biol. Chem., 281, 5216–5223.
[205] Karradt, A., Sobanski, J., Mattow, J., Lockau, W., & Baier, K. (2008). NblA, a key protein of phycobilisome degradation, interacts with CLPC, A HSP100 chaperone partner of a cyanobacterial CLP protease. JBC Papers in Press. Published on September 25, as Manuscript M805823200.
[206] Dines, M., Sendersky, E., David, L., Schwarz, R. & Adir, N. (2008). Structural, functional and mutational analysis of the NblA protein provides insight into possible modes of interaction with the phycobilisome. JBC Papers in Press. Published on August 21, as Manuscript M804241200.
[207] Pellegrino, F. & Alfano, R. R.. Energy transfer in the accessory pigment complexes of red and blue-green algae. In: Alfano, R. R. editor. .Biological Events Probed by Ultrafast Laser Spectroscopy. New York: Academic Press; 1982; 46-49.
[208] Wong, D., Pellegrino, F., Alfano, R. R. & Zilinskas, B. A. (1981). Fluorescence relaxation kinetics and quantum yield from the isolated phycobiliproteins of the blue-green alga Nstoc sp. Measured as a function of single picosecond pulse intensity. J. Photochem. Photobiology, 33, 651-662.
[209] Brody, S. S., Treadwell, C. & Barber, J. (1981). Picosecond energy transfer in Porphyridium cruentum and Anacystis nidulans, Biophys. J., 34, 439-449.
Phycobilisomes from Cyanobacteria 159
[210] Ol, V. T., Glazer, A. N. & Stryer, L. (1982). Fluorescent phycobiliprotein conjugates for analyses of cell and molecules. J. of Cell Biology, 93, 981-986.
[211] Glazer, A. N. & Stryer, L. (1983). Fluorescent tandem phycoboliprotein conjugates: Emission Wavelengh shifting by energy transfer. Biophys. J., 43, 383-386.
[212] Holmes, K. L. & Lantz, L. M. (2001). Protein Labeling with fluorescent probes. Methods in Cell Biology, 63, 185-204.
[213] Kronick, M. N. (1986). The use of phycobiliproteins as fluorescent labels in immunoassay. J. Immunol. Meth., 92, 1-13.
[214] Glazer, A. N. (1994). Phycobiliproteins-a family of valuable, widely use fluorophores. J. App. Phycology, 6, 105-112.
[215] Kronick, M. N. & Grossman, P. D. (1983). Immunoassay techniques with fluorescent phycobiliprotein conjugates. Clin. Chem., 29/9, 1582-1586.
[216] Legender, C. M., Guttmann, R. D., Hou, S. K. & Jean, R. (1985). Two-color immunoflorescence and flow cytometry analysis of lymphocytes in long-term renal allotransplant recipients: identification of a major leu-7+/leu-3+ subpopulation. J. Immunol., 135, 1061-1065.
[217] Herzenberg, L. A., Parks, D., Sahaf, B., Perez, O., Roederer, M. & Herzenberg, L. A. (2002). The history and future of the fluorescence activated cell sorter and flow cytometry: a view from Stanford. Clinical Chemistry, 48, 1819-1827.
[218] Baumgarth, N. & Roederer, M. (2000). A practical approach to multicolor flow cytometry for immunophynotyping. J. Immunol. Methods, 243, 77-97.
[219] Roederer, M., Rose, S. D., Gerstein, R., Anderson, M., Bigos, M., Stovel, R., Nozaki, T., Parks, D., Herzenberg, L. & Heraenberg, L. (1997). 8 color, 10-parameter flow cytometry to elucidate complex leukocyte heterogeneity. Cytometry, 29, 328-339.
[220] Hultin, L. E., Matud, J. L. & Giorgi, J. V. (1998). Quantitation of CD38 activation antigen expression on CD8+ T cells in HIV-1 infection using CD4 expression on CD4+ T lymphocytes as a biological calibrator. Cytometry, 33, 123-132.
[221] Kansas, G. S. & Dailey, M. O. (1989). Expression of adhesion structures during B cell development in man. J. Immunol., 142, 3056-3062..
[222] Kindzelskii, A. L. & Xue, W. (1994). Imaging the Spatial distribution of membrane receptors during neutrophil phagocytosis. J. Struct. Biol., 113, 191-198.
[223] Georgiou, G., Bahra, S. S., Mackie, A. R., Wolfe, C. A., O’Shea, P., Ladha, S., Fernandez, N. & Cherry, R. J, (2002). Measurement of the lateral diffusion of human MHC class I molecules on HeLa cell by fluorescence recovery after photobleaching using a phycoerythrin probe. Biophys. J., 82, 1828-1834.
[224] Wilson, K. M., Morrison, I. E. G., Smith, P. R., Fernandez, N. & Cherry, R. J. (1996). Single partile tracking of cell-surface HLA-DR molecules using R-phycoerythrin labeled monoclonal antibodies and fluorescence digital imaging. J. of cell Science, 109, 2101-2109.
[225] Cherry, R. J., Wilson, K, M., Triantaflou, K., O’Toole, P., Morrion, I. E. G., Smith, P. R. & Fernandev, N. (1998). Detection of of dimmers of dimmers of human leukocyte antigen (HLA)-DR on the surface of living cells by single-particle fluorescence imaging. J. Cell. Biol., 140, 71-79.
[226] Smith, P. R., Morrison, I. E. G., Wilson, K. M., Fernandez, N. & Cherry, R. J. (2002). Anomalous Diffusion of major histocompatibility complex class I molecules on HeLa cells determined by single particle tracking. Biophys. J., 76, 3331-3344.
Li Sun, Shumei Wang, Mingri Zhao et al. 160
[227] Goulian, M. & Simon, S. M. (2000). Tracking single proteins within cells. Biophys. J., 79, 2188-2196.
[228] Cai, Y. A., Murphy, J. T., Wedemayer, G. J. & Gl;azer, A. N. (2001). Recombinant Phycobiliproteins. Analy. Biochem., 290, 186-204.
[229] Yeh, S. W., Ong, L. J., Clark, J. H. & Glazer, A. N. (1987). Fluorescence properties of allophycocyanin and a crosslinked allophycocyanin trimer. Cytometry, 8, 91-95.
[230] Sun, L., Wang, S. & Qiao, Z. (2006). Chemical stabilization of the phycocyanin from cyanobacterium Spirulina platensis, J. Biotechnol. 121, 563-569.
[231] Tooley, A. J., Cai, Y. A. &Glazer, A. N. (2001). Biosynthesis of a fluorescent cyanobacterial C-phycocyanin holo-α subunit in a heterologous host. Proc. Nat. Acad. Sci. USA, 98, 10560-10565.
[232] Roederer, M. (1997). Methods for fluorescent conjugation of monoclonal antibodies. http://www.drmr.com/abcon.
[233] Zoha, S. J., Ramnarain, S. & Allnutt, F. C. T. (1998). Ultrasensitive direct fluorescent immunoassay for thyroid stimulating hormone. Clin. Chem., 44, 9-9.
[234] Telford, W. G., Moss, M. W., Morseman, J. P. & Allnutt, F.C. (2001). Cyanobacterial stabilized phycobilisomes as fluorochromes for extracellular antigen detection by flow cytometry. J. Immunol. Methods, 254, 13-30.
[235] Edwards, M. R., MacColl, R. & Eisele, L. E. (1996). Some physical properties of an unusual C-phycocynin isolated from a photosynthetic thermophile. Biochem. Biophys. Acta, 1276, 64-70.
[236] Mayr, T., Moser, C., Klimant, I. (2008), Performance of fluorescent labels in sedimentation bead arrays—a comparison study, J. Fluoresc. 95, 416-423.
In: Handbook on Cyanobacteria ISBN: 978-1-60741-092-8 Editors: P. M. Gault and H. J. Marler © 2009 Nova Science Publishers, Inc.
Chapter 4
ENIGMATIC LIFE AND EVOLUTION OF PROCHLORON AND RELATED CYANOBACTERIA INHABITING
COLONIAL ASCIDIANS
Euichi Hirose1, Brett A. Neilan2, Eric W. Schmidt3 and Akio Murakami4
1 Department of Chemistry, Biology and Marine Science, Faculty of Science, University of the Ryukyus,
Nishihara, Okinawa 903-0213, Japan 2 School of Biotechnology and Biomolecular Sciences
and the Australian Centre for Astrobiology, University of New South Wales, Sydney, 2052, Australia 3 Department of Medical Chemistry, University of Utha,
Salt Lake City, Utha 84112, USA 4 Kobe University Research Center for Inland Seas,
Iwaya, Hyogo, 656-2401, Japan
ABSTRACT
Prochloron is an oxygenic photosynthetic prokaryotes that possess not only chlorophyll a but also b and lacks any phycobilins. This cyanobacterium lives in obligate symbiosis with colonial ascidians inhabiting tropical/subtropical waters and free-living Prochloron cells have never been recorded so far. There are about 30 species of host ascidians that are all belong to four genera of the family Didemnidae. Asicidian-cyanobacteria symbiosis has attracted considerable attention as a source of biomedicals: many bioactive compounds were isolated from photosymbiotic ascidians and many of them are supposed to be originated from the photosymbionts. Since the stable in vitro culture of Prochloron has never been established, there are many unsolved question about the biology of Prochloron. Recent genetic, physiological, biochemical, and morphological studies are partly disclosing various aspects of its enigmatic life, e.g., photophysiology, metabolite synthesis, symbiosis, and evolution. Here, we tried to draw a rough sketch of the life of Prochloron and some related cyanobacteria.
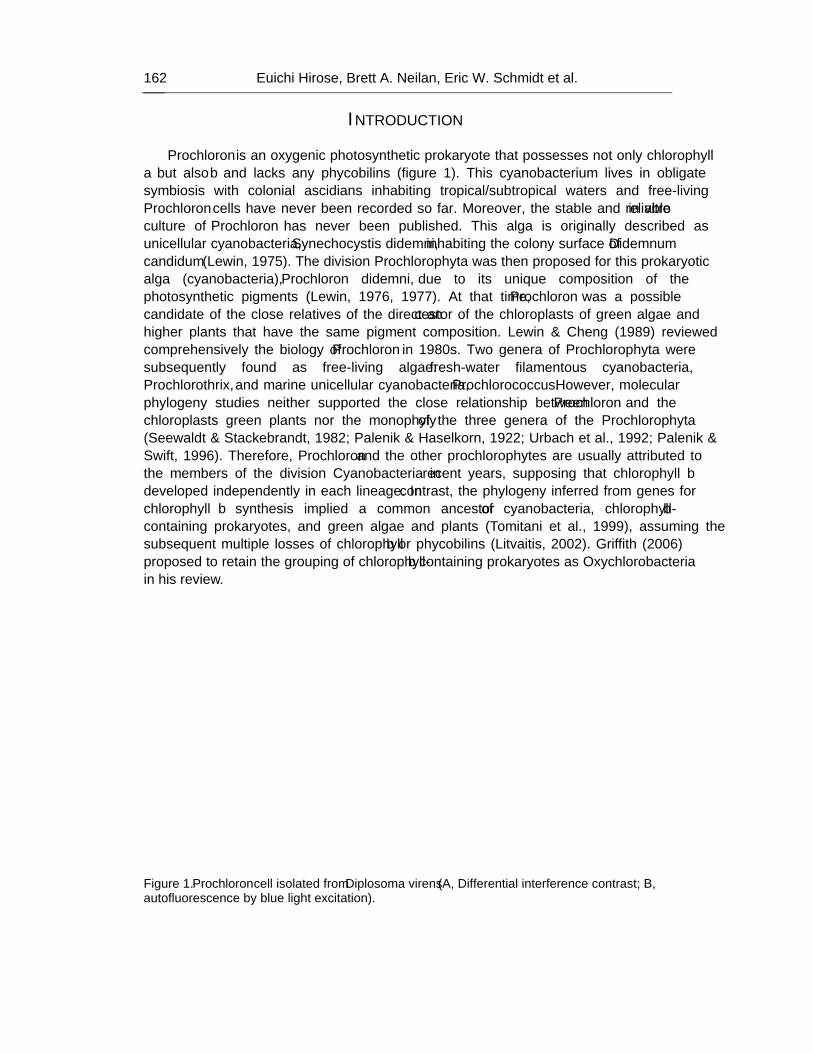
Euichi Hirose, Brett A. Neilan, Eric W. Schmidt et al. 162
INTRODUCTION Prochloron is an oxygenic photosynthetic prokaryote that possesses not only chlorophyll
a but also b and lacks any phycobilins (figure 1). This cyanobacterium lives in obligate symbiosis with colonial ascidians inhabiting tropical/subtropical waters and free-living Prochloron cells have never been recorded so far. Moreover, the stable and reliable in vitro culture of Prochloron has never been published. This alga is originally described as unicellular cyanobacteria, Synechocystis didemni, inhabiting the colony surface of Didemnum candidum (Lewin, 1975). The division Prochlorophyta was then proposed for this prokaryotic alga (cyanobacteria), Prochloron didemni, due to its unique composition of the photosynthetic pigments (Lewin, 1976, 1977). At that time, Prochloron was a possible candidate of the close relatives of the direct ancestor of the chloroplasts of green algae and higher plants that have the same pigment composition. Lewin & Cheng (1989) reviewed comprehensively the biology of Prochloron in 1980s. Two genera of Prochlorophyta were subsequently found as free-living algae: fresh-water filamentous cyanobacteria, Prochlorothrix, and marine unicellular cyanobacteria, Prochlorococcus. However, molecular phylogeny studies neither supported the close relationship between Prochloron and the chloroplasts green plants nor the monophyly of the three genera of the Prochlorophyta (Seewaldt & Stackebrandt, 1982; Palenik & Haselkorn, 1922; Urbach et al., 1992; Palenik & Swift, 1996). Therefore, Prochloron and the other prochlorophytes are usually attributed to the members of the division Cyanobacteria in recent years, supposing that chlorophyll b developed independently in each lineage. In contrast, the phylogeny inferred from genes for chlorophyll b synthesis implied a common ancestor of cyanobacteria, chlorophyll-b containing prokaryotes, and green algae and plants (Tomitani et al., 1999), assuming the subsequent multiple losses of chlorophyll b or phycobilins (Litvaitis, 2002). Griffith (2006) proposed to retain the grouping of chlorophyll-b containing prokaryotes as Oxychlorobacteria in his review.
Figure 1. Prochloron cell isolated from Diplosoma virens (A, Differential interference contrast; B, autofluorescence by blue light excitation).
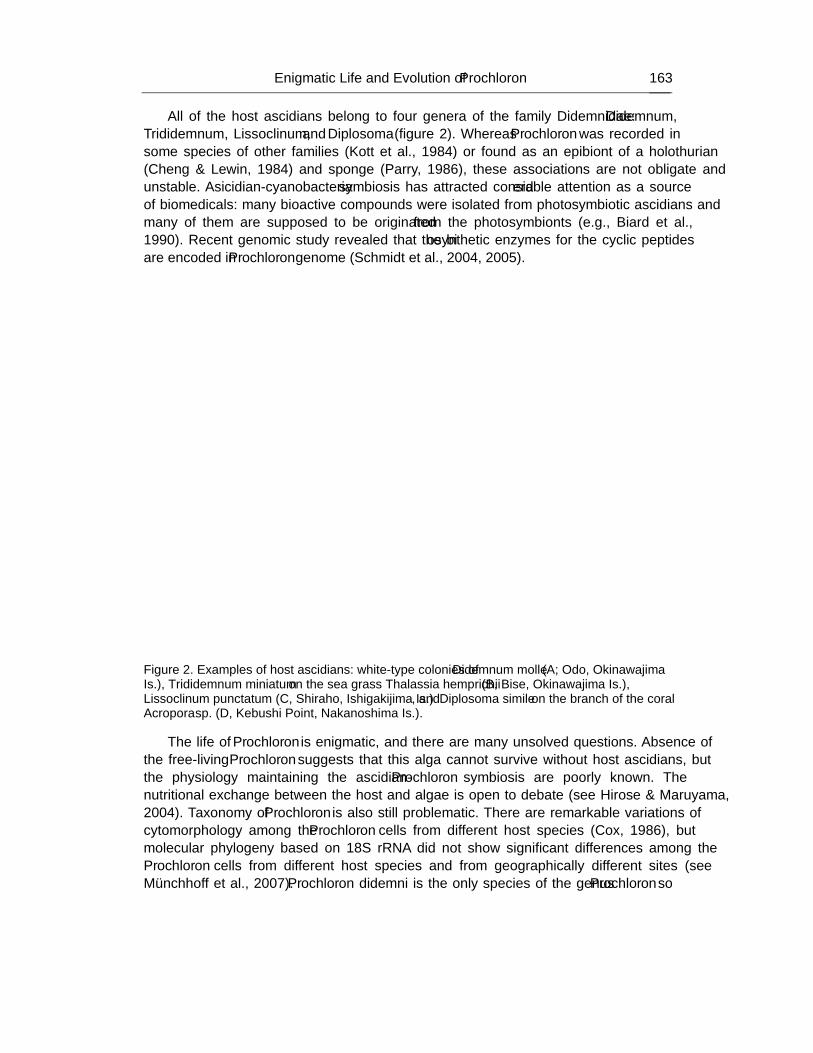
Enigmatic Life and Evolution of Prochloron … 163
All of the host ascidians belong to four genera of the family Didemnidae: Didemnum, Trididemnum, Lissoclinum, and Diplosoma (figure 2). Whereas Prochloron was recorded in some species of other families (Kott et al., 1984) or found as an epibiont of a holothurian (Cheng & Lewin, 1984) and sponge (Parry, 1986), these associations are not obligate and unstable. Asicidian-cyanobacteria symbiosis has attracted considerable attention as a source of biomedicals: many bioactive compounds were isolated from photosymbiotic ascidians and many of them are supposed to be originated from the photosymbionts (e.g., Biard et al., 1990). Recent genomic study revealed that the biosynthetic enzymes for the cyclic peptides are encoded in Prochloron genome (Schmidt et al., 2004, 2005).
Figure 2. Examples of host ascidians: white-type colonies of Didemnum molle (A; Odo, Okinawajima Is.), Trididemnum miniatum on the sea grass Thalassia hemprichii (B, Bise, Okinawajima Is.), Lissoclinum punctatum (C, Shiraho, Ishigakijima Is.), and Diplosoma simile on the branch of the coral Acropora sp. (D, Kebushi Point, Nakanoshima Is.).
The life of Prochloron is enigmatic, and there are many unsolved questions. Absence of the free-living Prochloron suggests that this alga cannot survive without host ascidians, but the physiology maintaining the ascidian-Prochloron symbiosis are poorly known. The nutritional exchange between the host and algae is open to debate (see Hirose & Maruyama, 2004). Taxonomy of Prochloron is also still problematic. There are remarkable variations of cytomorphology among the Prochloron cells from different host species (Cox, 1986), but molecular phylogeny based on 18S rRNA did not show significant differences among the Prochloron cells from different host species and from geographically different sites (see Münchhoff et al., 2007). Prochloron didemni is the only species of the genus Prochloron so
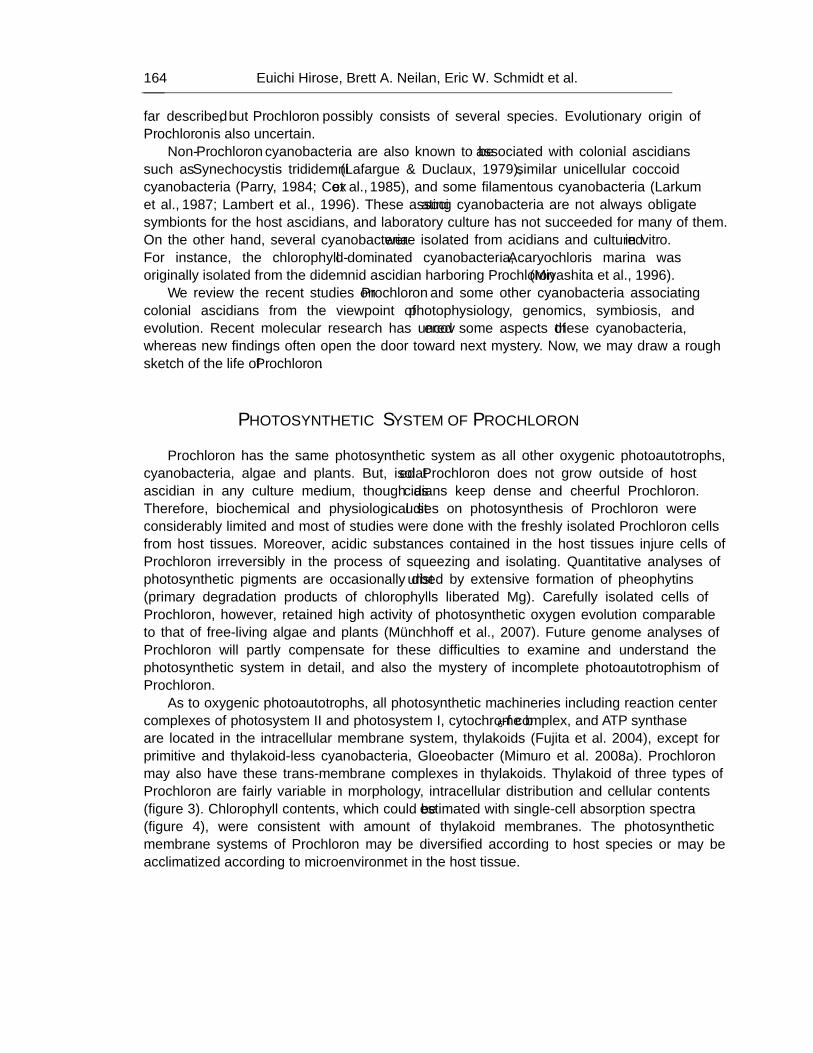
Euichi Hirose, Brett A. Neilan, Eric W. Schmidt et al. 164
far described, but Prochloron possibly consists of several species. Evolutionary origin of Prochloron is also uncertain.
Non-Prochloron cyanobacteria are also known to be associated with colonial ascidians such as Synechocystis trididemni (Lafargue & Duclaux, 1979), similar unicellular coccoid cyanobacteria (Parry, 1984; Cox et al., 1985), and some filamentous cyanobacteria (Larkum et al., 1987; Lambert et al., 1996). These associating cyanobacteria are not always obligate symbionts for the host ascidians, and laboratory culture has not succeeded for many of them. On the other hand, several cyanobacteria were isolated from acidians and cultured in vitro. For instance, the chlorophyll d-dominated cyanobacteria, Acaryochloris marina was originally isolated from the didemnid ascidian harboring Prochloron (Miyashita et al., 1996).
We review the recent studies on Prochloron and some other cyanobacteria associating colonial ascidians from the viewpoint of photophysiology, genomics, symbiosis, and evolution. Recent molecular research has uncovered some aspects of these cyanobacteria, whereas new findings often open the door toward next mystery. Now, we may draw a rough sketch of the life of Prochloron.
PHOTOSYNTHETIC SYSTEM OF PROCHLORON Prochloron has the same photosynthetic system as all other oxygenic photoautotrophs,
cyanobacteria, algae and plants. But, isolated Prochloron does not grow outside of host ascidian in any culture medium, though ascidians keep dense and cheerful Prochloron. Therefore, biochemical and physiological studies on photosynthesis of Prochloron were considerably limited and most of studies were done with the freshly isolated Prochloron cells from host tissues. Moreover, acidic substances contained in the host tissues injure cells of Prochloron irreversibly in the process of squeezing and isolating. Quantitative analyses of photosynthetic pigments are occasionally disturbed by extensive formation of pheophytins (primary degradation products of chlorophylls liberated Mg). Carefully isolated cells of Prochloron, however, retained high activity of photosynthetic oxygen evolution comparable to that of free-living algae and plants (Münchhoff et al., 2007). Future genome analyses of Prochloron will partly compensate for these difficulties to examine and understand the photosynthetic system in detail, and also the mystery of incomplete photoautotrophism of Prochloron.
As to oxygenic photoautotrophs, all photosynthetic machineries including reaction center complexes of photosystem II and photosystem I, cytochrome b6-f complex, and ATP synthase are located in the intracellular membrane system, thylakoids (Fujita et al. 2004), except for primitive and thylakoid-less cyanobacteria, Gloeobacter (Mimuro et al. 2008a). Prochloron may also have these trans-membrane complexes in thylakoids. Thylakoid of three types of Prochloron are fairly variable in morphology, intracellular distribution and cellular contents (figure 3). Chlorophyll contents, which could be estimated with single-cell absorption spectra (figure 4), were consistent with amount of thylakoid membranes. The photosynthetic membrane systems of Prochloron may be diversified according to host species or may be acclimatized according to microenvironmet in the host tissue.
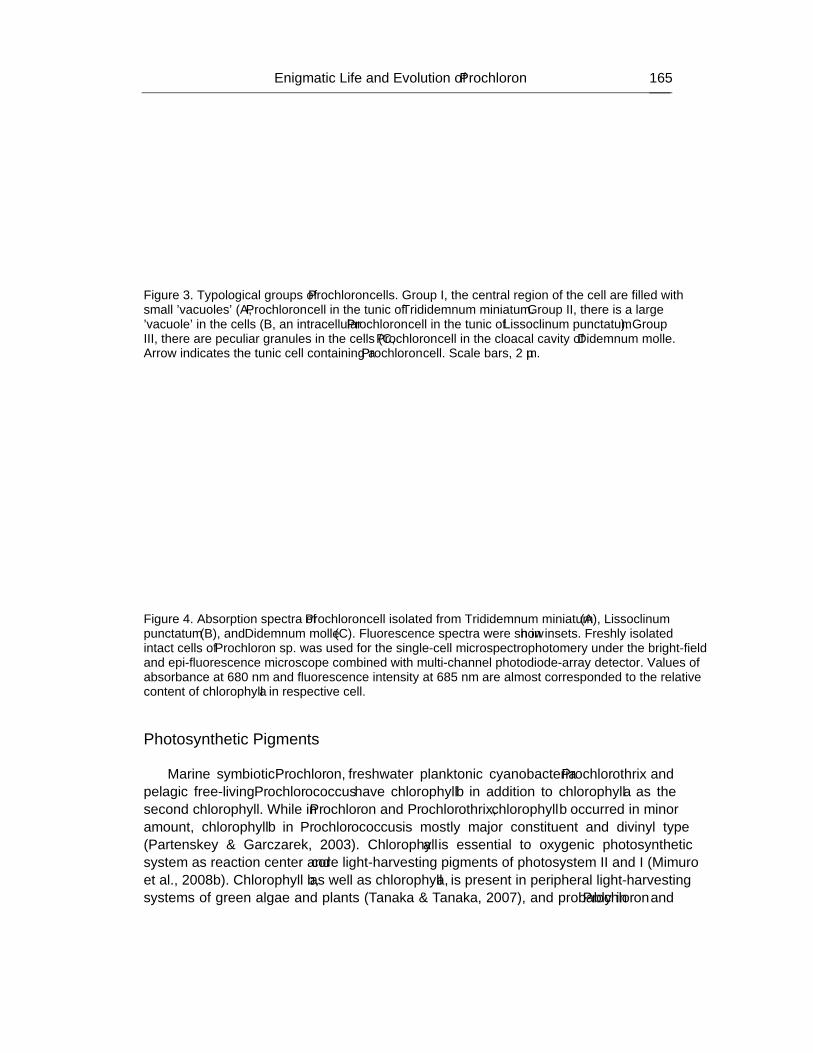
Enigmatic Life and Evolution of Prochloron … 165
Figure 3. Typological groups of Prochloron cells. Group I, the central region of the cell are filled with small 'vacuoles' (A, Prochloron cell in the tunic of Trididemnum miniatum. Group II, there is a large 'vacuole' in the cells (B, an intracellular Prochloron cell in the tunic of Lissoclinum punctatum). Group III, there are peculiar granules in the cells (C, Prochloron cell in the cloacal cavity of Didemnum molle. Arrow indicates the tunic cell containing a Prochloron cell. Scale bars, 2 µm.
Figure 4. Absorption spectra of Prochloron cell isolated from Trididemnum miniatum (A), Lissoclinum punctatum (B), and Didemnum molle (C). Fluorescence spectra were shown in insets. Freshly isolated intact cells of Prochloron sp. was used for the single-cell microspectrophotomery under the bright-field and epi-fluorescence microscope combined with multi-channel photodiode-array detector. Values of absorbance at 680 nm and fluorescence intensity at 685 nm are almost corresponded to the relative content of chlorophyll a in respective cell.
Photosynthetic Pigments
Marine symbiotic Prochloron, freshwater planktonic cyanobacteria Prochlorothrix and
pelagic free-living Prochlorococcus have chlorophyll b in addition to chlorophyll a as the second chlorophyll. While in Prochloron and Prochlorothrix, chlorophyll b occurred in minor amount, chlorophyll b in Prochlorococcus is mostly major constituent and divinyl type (Partenskey & Garczarek, 2003). Chlorophyll a is essential to oxygenic photosynthetic system as reaction center and core light-harvesting pigments of photosystem II and I (Mimuro et al., 2008b). Chlorophyll b, as well as chlorophyll a, is present in peripheral light-harvesting systems of green algae and plants (Tanaka & Tanaka, 2007), and probably in Prochloron and
Euichi Hirose, Brett A. Neilan, Eric W. Schmidt et al. 166
Prochlorothrix. Key enzyme for chlorophyll b synthesis was identified as chlorophyllide a oxygenase (CAO) in green algae (Tanaka et al., 1998) and plants (Oster et al., 2000). In Prochloron and Prochlorothrix, the gene coding the same enzyme was found (Tomitani et al., 1999). Thus, chlorophyll b and its synthetic enzyme in all chlorophyll b-containing photoautotrophs seem to be derived from the same phylogenic linage. Recently, a Rieske-type Fe-S containing oxygenase was reported as CAO of Prochlorococcus, which has divinyl-chlorophyll a and b instead of usual monovinyl-chlorophyll a and b (Satoh & Tanaka, 2006). However, sequence similarity between Prochlorococcus enzyme and CAO of all other chlorophyll b-containing organisms was very low, and phylogenetical relationship of both enzymes was remained obscure.
Prochloron has chlorophyll c-like pigment, [8-divinyl]- prtotochlorophyllide a (3,8-divinyl-pheoporphyrin a-Mg-monomethylester) as the third chlorophyll (Larkum et al., 1994, Helfrich et al., 1999). The physiological function of the pigment has not been revealed fully yet, but the trace amount of same pigment was detected also in Prochlorococcus, Prochlorothrix and chlorophyll d-dominating Acaryochloris, not in ordinary cyanobacteria. β-carotene and zeaxanthin are major carotenoid pigments in Prochloron and Prochlorothrix (Withers et al. 1978; Post & Bullerjahn, 1994). These carotenoids are common to most of ordinary cyanobacteria.
No phycobiliproteins, extrinsic and hydrophylic (water-soluble) light-harvesting proteins of photosystem II in ordinary cyanobacteria (Mimuro et al. 1999), are detected in Prochloron and Prochlorothrix spectrophotometrically and biochemically. In Prochlorococcus, only two genes of phycobiliproteins were found by whole genome analyses (Ting et al., 2001). Phycobilisomes are supracomplex of phycobiliproteins with colorless linker and anchor proteins in ordinary cyanobacteria. Although expression of phycobiliproteins in Prochlorococcus was confirmed by high-sensitive fluorescence spectrometry (Hess et al. 1996, Steglich et al., 2005), formation of supracomplexes and functional coupling in photosynthesis process (light energy capture and energy transfer) were not determined. Incompatibility between chlorophyll b and phycobiliproteins in chlorophyll b-containing cyanobacteria and ordinary cyanobacteria is unaccountable but obvious.
Chlorophyll b and Pcb Antenna Protein Chlorophyll a/chlorophyll b ratio of Prochloron (4-7) was considerably variable in the
previous reports (Partenskey & Garczarek, 2003). The study of unculturable Prochloron is difficult to obtain reproducible results. And acidic substances present in the host ascidian also prevent the accurate determination of chlorophylls. These are invincible problems to study physiology and biochemistry of Prochloron. The chlorophyll a/chlorophyll b ratios of Prochloron and Prochlorothrix (7-18) were higher than those of green algae and plants (Partenskey & Garczarek, 2003). Lower content of chlorophyll b in Prochloron can be confirmed by absorption spectra of intact cells of three types of Prochloron (figure 4). In Prochloron and Prochlorothrix, contribution of chlorophyll b as light-harvesting antenna pigment of photosynthesis seems to be limited. On the other hand, divinyl-chlorophyll b in low-light adapted Prochlorococcus may contribute in main light-harvester, because divinyl-chlorophyll b is advantageous to absorbing the blue-green light in the lower euphotic zone (Partenskey et al., 1993, Ting et al., 2002). This is the most distinct and valuable case in
Enigmatic Life and Evolution of Prochloron … 167
chlorophyll b of oxygenic photoautotrophs. Chlorophyll b content of Prochloron was much lower than that of green seaweeds growing in the same shallow water habitat. It was found that the chlorophyll a/chlorophyll b ratio (2-35) in Prochlorothrix changes depending on salinity (Bergmann et al., 2008), though regulatory mechanism and physiological significance have not been revealed yet. Study on eukaryotic algae and land plants showed that chlorophyll b acts as key regulator in addition to light-harvester. Amount of the light-harvesting chlorophyll protein complex (LHC) and formation of thylakoid stacking were considerably affected by chlorophyll b synthesis in eukaryotic algae and plants (Hoober & Argyroudi-Akoyunoglou, 2004). Chlorophyll b in Prochloron and Prochlorothrix may also have similar regulatory roles in construction of photosynthetic system (Giddings et al., 1980).
Common antenna pigment complexes of chlorophyll b- or chlorophyll d-containing cyanobacteria are “prochlorophyte chlorophyll-binding protein complex (Pcb)” (Chen et al., 2008). On the other hand, light-harvesting chlorophyll proteins (LHC) are chlorophylls-binding antennae in all eukaryotic algae and land plants. Pcb is intrinsic and six transmembrane helical proteins and phylogenetically related to CP43 (PsbC) or CP47 (PsbB) proteins of photosystem II of all oxygenic photoautotrophs and IsiA protein (iron-stress -induced protein) of some cyanobacteria (Murray et al., 2006). Recent analyses showed that chlorophyll a/b-binding Pcb proteins are associated with photosystem I and photosystem II in Prochloron and Prochlorothrix. In Prochlorothrix, cryoelectron microscopic observation and biochemical and spectroscopic analyses suggested that 18 Pcb subunits surround trimeric photosystem I, and 14 Pcb subunits surround dimeric photosystem II (Bumba et al. 2005; Boichenko et al., 2007). Similarly, 18meric Pcb was associated with photosystem I trimer in Prochlorococcus (Bibby et al., 2001b), and 10meric Pcb was associated with PSII dimer of Prochloron (Bibby et al., 2003). These unique light-harvesting system of ring-structured Pcb proteins may be common and essential character among chlorophyll b-containing cyanobacteria, though similar structure was suggested in some ordinary and chlorophyll d-containing cyanobacteria under iron deficient condition (Boekema et al. 2001; Bibby et al. 2001a, Nield et al. 2003; Chen et al., 2005a, 2005b).
Photosynthetic Activity and Photoacclimation Photosynthetic functions of Prochloron were studied with freshly isolated intact cells or
isolated thylakoid membranes by means of oxygen electrode or kinetic fluorometry. Photosynthetic activity (900 -1000 µmol O2 mg Chl a-1 h-1) in freshly isolated Prochloron was comparable to or higher than ordinary cyanobacterium, green alga, Prochlorothrix and Prochlorococcus (Alberte et al. 1986; Post & Bullerjahn, 1994. Flash-induced fluorescence kinetics of chlorophyll a with isolated thylakoid from Prochloron also indicated the presence of functional photosystem II (Christen et al., 1999).
Light intensity acclimation was studied with Prochloron isolated from ascidian adapted under high- and low-light conditions (Alberte et al. 1986, 1987 Lesser & Stochaj, 1990) and cultured Prochlorothrix (Burger-Wiersma & Post, 1989). Their cellular chlorophyll contents and chlorophyll a/chlorophyll b ratios responded to change of light intensity like green algae (Fujita et al., 2001). On the other hand, photosystem I/photosystem II ratio did not responded to light intensity and kept almost equimolar stoichiometric relationship in Prochloron
Euichi Hirose, Brett A. Neilan, Eric W. Schmidt et al. 168
(Arberte et al., 1986) unlike Prochlorothrix (Burger-Wiersma & Post, 1989) and ordinary cyanobacteria (Fujita et al., 1994).
Excessive oxygen (O2) evolved by photosynthesis of photosymbionts generates superoxide radical, which can be harmful to host animal. Superoxide dismutase (SOD) acts as scavenger of superoxide radical. Activity of SOD based on chlorophyll concentration was extremely low in case of Prochloron than in that of coral symbiont, Symbiodinium (Shick & Dykens 1985; Lesser & Stochaj, 1990). The difference of SOD activity was related to symbiont site, extracellular or intracellular.
D1 protein of photosynthetic reaction center of PSII was extremely conserved in amino acids sequences from cyanobacteria to plants. In length of C-terminal extensions of D1 precursor protein (16 in Prochloron as well as ordinary cyanobacteria, 9 in Prochlorothrix as well as plant and green algae, and 15 in Prochlorococcus), evolutional linage (Morden & Golden, 1989; Hess et al. 1995) and functional significance such as grana stacking in thylakoid membranes were sometimes discussed (Hardison et al., 1995).
As discussed above, various topics about photosynthetic system of Prochloron are mysterious and enigmatic. Future detailed analyses are required to understand the most peculiar symbiotic cyanobacteria, Prochloron.
ASSOCIATION WITH COLONIAL ASCIDIANS
Ascidian-Prochloron Symbiosis About 30 ascidian species belonging to four genera of Didemnidae are so far known to be
the host of Prochloron (e.g., Kott, 1982, 2001). Recently, some species were newly added to the list of the didemnids harboring Prochloron (Oka et al., 2005), and more photosymbiotic species should remain to be described. The host ascidian colony always associate with Prochloron cells, except for Didemnum candidum that occasionally harbors Prochloron cells as epibionts (see Lewin & Cheng, 1989). Therefore, Prochloron should be indispensable symbiont for the host ascidians to survive. On the other hand, free-living Prochloron has never been recorded in nature to date, the host ascidians the only known sites for the proliferation of this alga. Therefore, the association between didemnid ascidians and Prochloron is obligate and probably mutual symbiosis. This is the only obligate photosymbiosis so far known in the phylum Chordata. Although occurrence of Prochloron has been also reported in some non-didemnid ascidians and other invertebrates (Cheng & Lewin, 1984; Kott et al., 1984; Parry, 1986), such association is unstable and probably facultative. It is uncertain why any organisms other than didemnids cannot be a stable host of Prochloron. The host ascidians are distributed exclusively in tropical and subtropical waters, probably due to the vulnerability of the photosymbionts at low temperatures (Dionisio-Sese et al., 2001). The species richness of the photosymbiotic didemnids tends to gradually decrease toward higher latitude. In the Ryukyu Archipelago (Japan), ranging from about 24ºN to 31ºN, 15 photosymbiotic species are recorded from Yaeyama Islands (24º–24º30'N), 10 species from Amami-Ohshima Island (28–28º30'N), and only 3 species from Ohsumi Islands (30ºN) (Hirose et al., 2004a; Oka & Hirose, 2005; Oka et al., 2007).
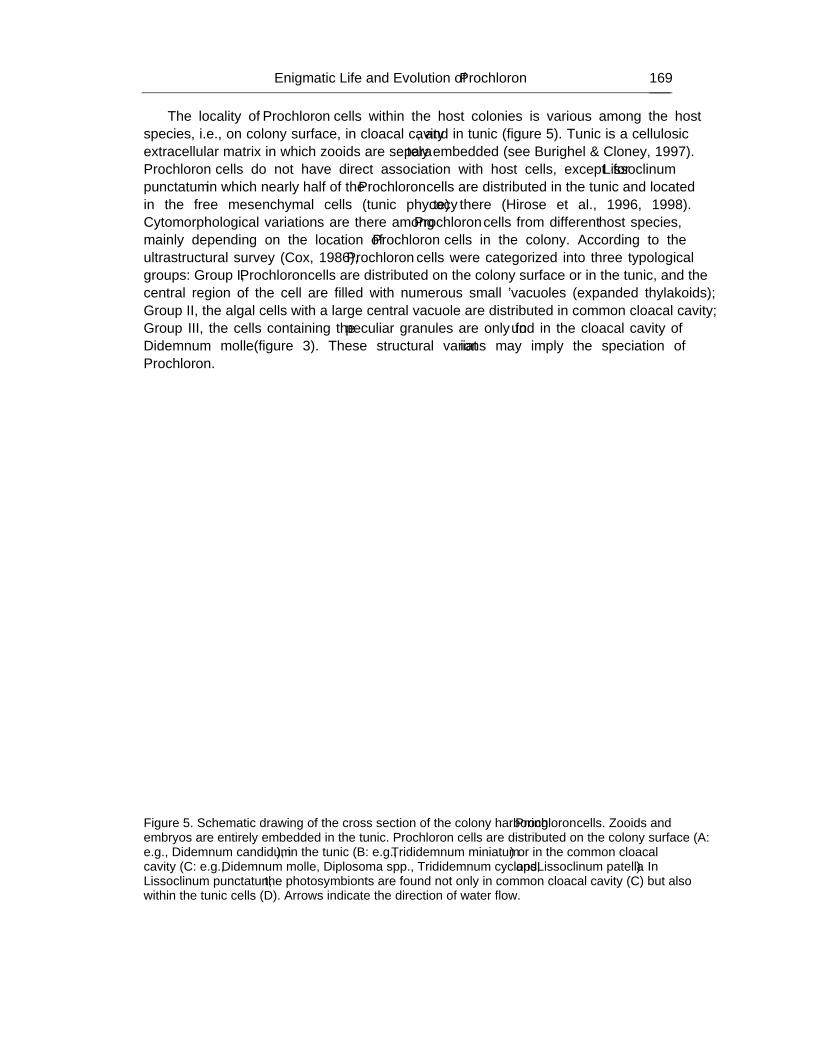
Enigmatic Life and Evolution of Prochloron … 169
The locality of Prochloron cells within the host colonies is various among the host species, i.e., on colony surface, in cloacal cavity, and in tunic (figure 5). Tunic is a cellulosic extracellular matrix in which zooids are separately embedded (see Burighel & Cloney, 1997). Prochloron cells do not have direct association with host cells, except for Lissoclinum punctatum in which nearly half of the Prochloron cells are distributed in the tunic and located in the free mesenchymal cells (tunic phycocyte) there (Hirose et al., 1996, 1998). Cytomorphological variations are there among Prochloron cells from different host species, mainly depending on the location of Prochloron cells in the colony. According to the ultrastructural survey (Cox, 1986), Prochloron cells were categorized into three typological groups: Group I, Prochloron cells are distributed on the colony surface or in the tunic, and the central region of the cell are filled with numerous small 'vacuoles (expanded thylakoids); Group II, the algal cells with a large central vacuole are distributed in common cloacal cavity; Group III, the cells containing the peculiar granules are only found in the cloacal cavity of Didemnum molle (figure 3). These structural variations may imply the speciation of Prochloron.
Figure 5. Schematic drawing of the cross section of the colony harboring Prochloron cells. Zooids and embryos are entirely embedded in the tunic. Prochloron cells are distributed on the colony surface (A: e.g., Didemnum candidum), in the tunic (B: e.g., Trididemnum miniatum) or in the common cloacal cavity (C: e.g., Didemnum molle, Diplosoma spp., Trididemnum cyclops, and Lissoclinum patella). In Lissoclinum punctatun, the photosymbionts are found not only in common cloacal cavity (C) but also within the tunic cells (D). Arrows indicate the direction of water flow.
Euichi Hirose, Brett A. Neilan, Eric W. Schmidt et al. 170
In obligate symbiosis, the host organisms have to acquire the symbionts from the environment (horizontal transmission) and/or may be maternally inherited (vertical transmission). Didemnid ascidians are viviparous: the maternal colony broods their embryos in the colony until the larvae swim out from the colony through the cloacal cavity. The larvae usually harbors Prochloron cell in the all species so far examined, indicating the occurrence of vertical transmission. This means that the photosymbionts are essential for survival of the host ascidians even in juvenile colonies. On the other hand, the mode of vertical transmission varies among the species, mainly depending on the distribution pattern of Prochloron cells in the colony. In Prochloron-bearing Diplosoma species, the pre-hatching embryos have a specialized organ, the rastrum, to collect the photosymbionts in the common cloacal cavity of the mother colony (see, Kott, 1981; Hirose, 2000b). The larvae directly attach the photosymbionts in the cloacal cavity to the their trunk surface in the non-Diplosoma species harboring the algae in the common cloacal cavity, e.g., Didemnum molle, Trididemnum cyclops, Lissoclinum bistratum, and L. timorense (Kott, 2001; Hirose & Fukuda, 2006; Hirose et al., 2006a; Hirose & Nakabayashi, in press). On the other hand, the photosymbionts in the tunic of maternal colony are transported to the tunic of the embryos (Hirose & Hirose, 2007). These modes of vertical transmission and distribution pattern of photosymbionts may represent the diversity of the didemnid-Prochlron symbiosis.
The physiology and biochemistry of this mutual relationship is still unclear. Histological observation of the digestive tracts of the host zooid showed that Prochloron cells are rarely ingested as direct diets by the hosts (e.g., Hirose et al., 1998, 2006b; Hirose 2000a). Some studies demonstrated that Prochloron cells fix radiolabeled carbon and some parts of the labeled molecules are subsequently translocated to the host ascidians (Pardy & Lewin, 1981; Griffiths & Thinh, 1983), indicating the nutritional exchange between the host and algae. Although the amount of transferred carbon was estimated from the difference of the radioactivities of the isolated Prochloron cells and residual host colonies, the amount of Prochloron contaminates might be underestimated in these studies, (see Hirose & Maruyama, 2004). Moreover, the water flow around the Prochloron cells goes directly toward the outside of the colony in the host colonies harboring Prochloron in the common cloacal cavities (arrows in figure 5). The metabolites secreted from the Prochloron cells are supposed to flow out from the host colonies, before the uptake by the host tissue. Accordingly, the occurrence of nutrient transfer is not denied but still questionable at present. Besides the nutrient translocation, Prochloron potentially protect the host colony from the predation by producing various cytotoxic metabolites. Pomacentrid fish ingested Didemnum molle larvae bearing Prochloron cells but immediately egested the larvae (Olson, 1983). The parasitic copepod Loboixis ryukyuensis inhabit the cloacal cavity of the photosymbiotic ascidian Diplosoma virens, but the copepod rarely ingested Prochloron cells that were abundant all over the cavity, indicating that Prochloron cells are unsuitable as a food for the copepod (Hirose, 2000a). These observations may suggest that symbiosis with the toxic algae would be much beneficial for the host ascidians, because predation should be a crucial threat for sessile organisms.
The exclusive occurrence of Prochloron in particular didemnid species implies that the host ascidian provides a special habitat for the symbionts. Solar radiation is a crucial factor restricting the survival of photosynthetic organisms, and the host colony properly shades the radiation with the transparent tunic that contains calcareous spicules, pigment cells, and ultraviolet (UV)-absorbing substances. Mycosporine-like amino acids (MAAs) are UV-
Enigmatic Life and Evolution of Prochloron … 171
absorbing substances widely found in cyanobacteria, dinoflagellates, red algae, and various marine invertebrates including ascidians (see Karents, 2001; Shick & Dunlap, 2002). They are ideal sunscreens for photosynthetic organisms, because they absorb harmful UV but not photosynthetically active radiation. Since the MAAs are thought to be synthesized by the sikimic acid pathway that is not found in animals (Farve-Bonvin et al., 1987; Shick et al., 1999), the diets and/or symbiotic algae/bacteria should be the source of the MAAs for animals. Photosymbiotic ascidians usually contain UV-absorbing substances in the tunic (Hirose et al., 2004b), indicating that the tunic protect the photosymbionts from UV. The components of MAAs extracted from the host ascidians are similar (but not the same) to those of the isolated Prochloron cells, and thus the photosymbionts are probably the major source of the MAAs for the hosts (Hirose et al., 2004b). In Didemnum molle, the MAA concentration bathymetrically decreases among colonies at depths of 10, 15, and 20 m (Hirose et al., 2006c), suggesting that MAA concentration is regulated by ambient light conditions. In Diplosoma spp., UV-light micrographs reveled that the MAAs are probably localized in the cytoplasm of the tunic where no Prochloron cells (Maruyama et al., 2003), suggesting that the MAAs synthesized in Prochloron cells are transported to the host cells. This may indicate the occurrence of metabolite transfer between the host ascidians and Prochloron cells.
Symbiotic Associations with Other Cyanobacteria Some didemnid species associate with non-Prochloron cyanobacteria. Synechocystis
trididemni was originally described as symbiotic cyanobacteria in the tunic of Trididemnum solidum (Lafargue & Duclaux, 1979). Trididemnum nubilum also associates with S. trididemni or its close relative but not with Prochloron. In these Trididemnum species, Synechocystis is supposed to be an obligate symbiont, because the host colonies always associate with this bacterium. Some host species harbor multiple species of cyanobacteria (Parry & Kott, 1988), whereas it is uncertain whether all photosymbionts are obligate. For instance, the colonies of Trididemnum miniatum in the Great Barrier Reef harbor not only Prochloron but also red filamentous cyanobacteria probably Oscillatoria sp. (Parry, 1984; Larkum et al., 1987), whereas Prochloron is the only photosymbionts in the colonies in Okinawajima Islands (Hirose et al., 2006b). In this case, Prochloron is obligate but the red cyanobacterium would be a facultative symbiont of T. miniatum. Interestingly, most of these non-Prochloron cyanophytes are distributed in the tunic of the host colonies but not in the common cloacal cavity. Whereas the ascidian-cyanobacteria association has usually been recorded in tropical and subtropical area, Synechocystis sp. was found on the colony surface Didemnum lahillei and D. granulosum collected from the northeastern coast of Spain (Hernández-Mariné et al., 1990).
Although some cyanobacteria, such as Acaryochloris marina, were isolated from ascidians and cultured in vitro, they were rarely found as epiphytes on ascidians (Kühl et al., 2005) and macrophytic red algae (Murakami et al., 2004) by means of microscopy and microspectroscopy. The amount of these cyanobacteria is probably small in number within the host colony. These microorganisms may preferentially inhabit the ascidian colony, but they would not contribute much to the host.
Euichi Hirose, Brett A. Neilan, Eric W. Schmidt et al. 172
Evolutionary Process of Ascidian-Cyanobacteria Symbiosis The family Didemnidae comprises more than 300 species recorded from tropical waters
to the Antarctic, and many unknown species are yet to be described, particularly in tropical waters (see Kott, 2005). Among them, there are only about 30 photosymbiotic species that almost exclusively inhabit tropical/subtropical waters with many non-symbiotic congeners inhabiting similar environments. Molecular phylogeny inferred from 18S rDNA sequence support a monophyletic origin of the family Didemnidae, as well as each of the didemnid genera (Yokobori et al., 2006). Since four didemnid genera are known to include photosymbiotic species to date, ascidian–cyanobacterial symbioses are supposed to have evolved at least once in each genus. It is unlikely to hypothesize a single origin of the symbiosis, because this scenario requires the occurrence of extensive loss of the symbiosis on several occasions in each photosymbiotic genus.
The establishment of the symbioses at multiple times may cause the diversity of the photosymbionts (Prochloron, Synechocystis, and etc.), distribution patterns of photosymbionts, and the modes of vertical transmission in the ascidian–cyanobacterial symbioses. In Trididemnum species, Prochloron cells are distributed in the cloacal cavity of T. cyclops and in the tunic of T. miniatum, while T. clinides and T. nubilum harbor Synechocystis cells in the tunic. This may indicate that these species have independent origins for the symbiosis. Alternatively, the shift of the microbial location and/or transition of cyanobacterial species may have occurred in the lineage of photosymbiotic Trididemnum spp. While T. clinides harbors multiple species of cyanobacteria (Parry & Kott, 1988), this may represents the intermediate stage of the cyanobacterial transition. The ascidian-cyanobacteria symbioses likely have a complex history of evolution.
The ascidian-Prochloron symbiotic relationship is unique with regards to its exclusive nature. The host is colonized by Prochloron in near monoculture, whereas other known marine symbiotic systems, such as sponges, are very diverse (Lewin & Cheng, 1989; Taylor et al., 2004). To date no free-living Prochloron has been found suggesting that an ancestral form of Prochloron colonized ascidians. On the other hand, if symbiosis was established after evolutionary divergence, free-living forms of Prochloron would be expected to exist or at least have existed at some stage (Shimada et al., 2003).
PROCHLORON DIVERSITY, PHYLOGEOGRAPHY AND MOLECULAR EVOLUTION
The unusual pigment complement of Prochloron, which possesses chlorophyll a and b
but lacks phycobilins (as in chloroplasts but not other photo-oxygenic prokaryotes), prompted its assignment to a new bacterial sub-class, the Prochlorophyta (Lewin, 1976; 1977). Due to their pigment composition, the prochlorophytes were proposed to descend from the protoendosymbiont that gave rise to chloroplasts (Lewin, 1981; Tomitami et al, 1999; Van Valen et al, 1980). For this reason the symbiotic cyanobacterium, Prochloron, can be considered a veritable “missing link” between ancestral plastids and modern day chloroplasts. As is the case for chloroplasts and their plant cell hosts, we don’t know whether the Prochloron-ascidian symbiosis was established from a single or multiple sources. Indeed, it is
Enigmatic Life and Evolution of Prochloron … 173
unclear whether Prochloron strains from various hosts belong to the original species Prochloron didemni or if multiple species exist. Interestingly, both ectosymbiotic and endosymbiotic (intracellular) associations have been identified (Lewin & Cheng, 1989), yet it is unclear whether these disparate levels of “intimacy” correspond to genetic differences between the hosts or their resident bacteria.
Although Prochloron strains from different didemnid species have been reported to be morphologically diverse (e.g., regarding size, thylakoid stacking, vacuolation and pigment ratios) on a level worthy of at least species distinction, the few existing molecular studies on Prochloron diversity found them to be conspecific. Reports in the literature regarding the diversity of Prochloron from different host species are contradictory (Stam et al., 1985; Palenik & Swift, 1996; Holton et al., 1990; Cox, 1986; Lewin & Cheng, 1989). Cox (1986) reported that Prochloron strains from different hosts fall into three groups that are morphologically distinct at the species level of distinction. On the other hand, data from DNA-DNA hybridization studies and analysis of the DNA-dependant RNA polymerase gene found Prochloron strains to be conspecific (Stam et al., 1985; Palenik & Swift, 1996; Holton et al., 1990). The 16S rRNA structures from four Prochloron strains from different hosts found they were nearly identical and a close phylogenetic relationship amongst these strains was demonstrated (Stackebrandt et al., 1982). The phylogeny of the order Prochlorophyta is still disputed. Whereas studies on 16S rDNA and on the gene for the large subunit of Rubisco (rbcL) argue for a polyphyletic origin of prochlorophytes from within the cyanobacteria (Shimada, 1995; Shimada et al., 2003), studies on the chlorophyll a oxygenase gene (the enzyme catalyzing chlorophyll b synthesis) support the view that prochlorophytes are a monophyletic group (Tomitami et al., 1999).
One member of the prochlorophytes, Prochlorococcus marinus, was found to possess functional genes for synthesis of the pigment phycoerythrin (Hess et al., 1996). The presence of a functional or residual phycobilin gene in Prochloron would suggest descent from a common ancestor with the cyanobacteria that lost the ability to synthesize phycobilins upon acquiring chlorophyll b. If this was the case, an integration of the order Prochlorophyta into the cyanobacterial clade would be necessary. Phylogenetic analysis demonstrated that the prochlorophytes are a polyphyletic group within the cyanobacterial radiation, supporting the view that the ability to synthesize chlorophyll b evolved several times separately with consequent loss of the ability to synthesize phycobilins. Furthermore, due to the low genetic diversity amongst Prochloron strains, this genus could be a relatively recent lineage thus contradicting the view that these prochlorophytes are descendants of the ancient organisms that gave rise to chloroplasts (Palenik & Swift, 1996). In contrast, studies of the chlorophyll b synthesis genes from P. didemni, Prochlorothrix hollandica and several green chloroplasts indicated a common origin for these genes in prochlorophytes and chloroplasts (Tomitani et al., 1999). However, considering mounting biochemical and molecular evidence (Lewin, 1976; Shimada et al., 1995; La Roche et al., 1996; Urbach et al., 1992; Lockhardt et al., 1992; Palenik & Haselkorn, 1992; Turner et al., 1989, 1999; McKay et al., 1982), it seems likely that horizontal gene transfer may account for the similarity between the chlorophyll b synthesis genes in these organisms (Lewin, 2002).
Recently, Münchhoff et al (2007) have sampled 27 photo-oxygenic bacteria from eleven ascidian species collected from eight locations across Australia, Japan and the USA. These Prochloron strains were expected to be quite diverse with the geographical separation of strains preventing free exchange between populations. In addition, Prochloron does not seem
Euichi Hirose, Brett A. Neilan, Eric W. Schmidt et al. 174
to exist as a free-living organism, but is reported to be carried by the larvae when a new host colony is established (Kott, 1977, 1982), further hindering the exchange of genomic differences between strains in different host species and locations. Prochloron cells are also subjected to different environments within their hosts and these different environments exert different selection pressures, theoretically resulting in genetic diversity. Phylogenetic analysis of the 16S rRNA gene from 22 Prochloron sp. strains showed they form a defined taxon (figure 6). This was supported by the high nucleotide identities of the 16S rRNA genes (97-99%). HIP1 PCR, a DNA fingerprinting technique that has already proved successful in distinguishing closely related strains of cyanobacteria (Neilan et al., 2003; Orcutt et al., 2002; Smith et al., 1998), was also performed. The data obtained by HIP1 PCR confirmed the 16S rDNA phylogenetic tree topology, however, it still did not allow any additional correlation between symbiont and either host species or geographic location. The vertical transmission of Prochloron cells by the ascidian larvae poses the possibility of co-evolution between the symbiont and its host. However, this study indicated that the Prochloron strains were not specific for the host species. There are several possible explanations for this. Firstly, the high similarity of the strains could be a consequence of lateral transmission of Prochloron cells between their hosts, even over large oceanic distances; secondly, in a very young lineage, divergence within the group might not yet have occurred (Palenik & Swift, 1996); and thirdly, low genetic diversity within a taxonomic group could result from high conservation of the phenotype that is best adapted to the group’s niche. This last point is unlikely for the sampled Prochloron strains since they were subject to varying environments within the hosts.
The high similarity of Prochloron sp. strains from different host species and distant geographic locations suggested that Prochloron cells can survive outside of their host long enough to cross considerable distances prior to recolonization. Correspondingly, Cox (1986) reported numerous free floating Prochloron cells in seawater surrounding reefs with ascidian colonies and concluded that the infection of ascidians carrying superficial Prochloron symbionts must occur from cells carried by seawater. Furthermore, the establishment of the ascidian-Prochloron symbiosis is supposed to have occurred independently at least once in each genus, as discussed above. The multiple origins of this symbiosis may support the existence of free-living Prochloron or its close relatives. In fact, a survey of biodiversity associated with a hypersaline stromatolitic reef in Western Australia revealed the presence of Prochloron in the absence of any didemnid ascidians (Burns et al., 2004). This would support either the possibility for ex-symbiont Prochloron or the existence of as yet unidentified hosts. The data presented by Münchhoff et al. (2007) also demonstrated that three samples from Lizard Island, Australia (LI-84, -92 and –93) were more similar to S. trididemni, the closest relative of Prochloron (figure 6), than to Prochloron. This was verified by microscopy (Lewin, 1981), and recently also by denaturing gradient gel electrophoresis of 16S rRNA PCR products (Schmidt et al., 2004). Cox (1986) reported that in addition to Prochloron and S. trididemni, a third, unidentified photosynthetic bacterium (possibly Acaryochloris sp.) is found as a symbiont in didemnid ascidians.

Enigmatic Life and Evolution of Prochloron … 175
Figure 6. Molecular phylogenetic tree of the 27 samples from this study (bold) and representatives of the major groups of cyanobacteria. The tree is inferred from 1148 bp 16S rRNA sequences and constructed by the Bootstrap-Neighbour-Joining-Method. Positions with gaps were excluded. Bootstrap values (1000 re-sampling cycles) over 500 are presented and indicate the statistical significance of each node. GenBank accession numbers are indicated in brackets next to reference sequences.
Euichi Hirose, Brett A. Neilan, Eric W. Schmidt et al. 176
METAGENOMICS AND METABOLISM Because of the difficulties of cultivating Prochloron, it has been essential to take a
metagenomic approach to obtain genes from the organisms. Prochloron within didemnid ascidians often seem to be mixtures of strains, with other bacteria also present, complicating analysis (Donia et al., 2006). Fortunately, Prochloron can be enriched by physical methods, and from these enriched populations genes have been cloned into vectors or amplified using the polymerase chain reaction (Long et al., 2005; Schmidt et al., 2005). Genome sequencing of a Palau P. didemni sample from the ascidian L. patella has provided much new information, but the genome project is not entirely complete (Ravel et al., unpublished data). Part of the problem is that there is a mixture of two major strains in this sample, in addition to approximately 5% of the sequence arising from L. patella itself. Therefore, some parts of the genome sequence require time-consuming experimental evidence for validation.
Preliminary data from the genome sequencing effort reveal much about the nutritional metabolism of Prochloron (Ravel et al., unpublished data). For example, the bacteria are heavily involved in nitrogen metabolism, but they do not appear to fix nitrogen, in contrast to previous reports. It is possible that nitrogen fixation is a variable property and that the sequenced sample does not belong to the nitrogen-fixing group; alternatively, other bacteria may be responsible for the proposed nitrogen fixation in didemnid ascidians. Prochloron contains genes that should enable the use of ammonia, nitrate / nitrite, amino acids, and urea as nitrogen sources. Interestingly, a urease operon is flanked by transposases. Therefore, although Prochloron lacks the capability to fix nitrogen, it appears to be potentially extremely efficient at recycling nitrogen waste products from the host ascidian. Carbon cycling is also very important to Prochloron symbioses, as described in previous sections. Prochloron clearly fixes CO2 and exchanges carbon with the host; the question has been what is the relevant form of this exchange. One early hypothesis is that glycolate may be the carbon source from Prochloron. However, Prochloron contains the complete suite of glycolate catabolic genes. Finally, it has been speculated that Prochloron may lack some of the essential biosynthetic genes, and this is why cultivation has been so difficult. In one report, tryptophan was added to medium, allowing four doublings of Prochloron cells in culture. The available genome sequence is somewhat at odds with this finding, since Prochloron appears to have all of the genes required for biosynthesis of key cofactors and all amino acids, including tryptophan. The sole exception is that an essential gene in the methionine synthesis pathway is missing from the current assembly. The complete metabolic map of Prochloron will be published in due course.
By contrast, much more metagenomic information is available for the secondary metabolic content of Prochloron. Numerous bioactive small molecules have been isolated from didemnid-Prochloron associations (Davidson, 1993; Sings & Rinehart 1996). These molecules include polyketides, such as patellazoles (Corley et al., 1988; Zabriskie et al., 1988) and bistramides (Gouiffes et al., 1988; Biard et al., 1990), and a large family of cyclic peptides exemplified by patellamides (Ireland & Scheuer, 1980; Ireland et al., 1982) and trunkamide (Carroll et al., 1996). Didemnid-Prochloron natural products have mostly been sought because of their cytotoxic activity against mammalian cell lines, and hence their possible utility in cancer chemotherapy. Because the natural products from didemnid-Prochloron associations resemble compounds isolated from axenic bacteria, it has long been
Enigmatic Life and Evolution of Prochloron … 177
speculated that Prochloron synthesize the compounds (Ireland & Scheuer, 1980). Genetic evidence reveals that Prochloron do indeed synthesize cyclic peptides in these associations (Schmidt et al., 2005), but the source of the polyketides and other compounds remains unknown. The cyclic peptide groups have recently been reclassified as “cyanobactins”, reflecting their structural features and genetic origins (Donia et al., 2008). To date, more than 60 cyanobactins have been reported from didemnid ascidians. In addition, about 40 cyanobactins have been isolated from free-living cyanobacteria and other sources. Cyanobactins in Prochloron are 6-8 amino acid, circular peptides that are highly posttranslationally modified. Prochloron contain other secondary metabolic pathways aside from those to cyanobactins, but the products of these pathways are unknown (Schmidt et al., 2004).
Prochloron are unequivocally the source of cyanobactins in didemnid ascidians. Genes for the synthesis of patellamides, trunkamide, and relatives have been identified in the metagenome of Prochloron (Schmidt et al., 2005; Long et al., 2005; Donia et al., 2006; Donia et al., 2008). From them, cloning and transfer of cloned pathways into lab E. coli leads to recombinant synthesis of natural cyanobactins. These experiments demonstrate that Prochloron have the genetic capacity to make cyanobactins. Moreover, when genes for certain compounds are found in Prochloron, those compounds are found in the host ascidians (Donia et al., 2006). By contrast, as mentioned above, Prochloron do not appear to be species-specific (Münchhoff et al., 2007; Donia et al., 2006). In addition, cyanobactin pathways do not reflect Prochloron diversity; in other words, the pathways appear to be horizontally transferred between bacterial strains. As an extreme example, Prochloron that are 16S identical may not even contain cyanobactin genes, or they may contain entirely different cyanobactin genes, which are chromosomally encoded. Therefore, pathways found within Prochloron are correlated with the presence of certain compounds, but neither host nor symbiont taxonomy reflects compounds or pathways. These data for more than 30 cyanobactin pathways reveal that Prochloron are likely the relevant producers of cyanobactins within ascidian hosts.
Important questions such as the ecological role(s), biosynthetic mechanisms, and even the location of cyanobactins within didemnid-Prochloron associations remain enigmatic. Location of Prochloron metabolites is important in assessing possible ecological roles. In several ascidians, cyanobactins were found specifically within Prochloron cells (Degnan et al., 1989), while in another they were found throughout the ascidian tunic (Salomon et al., 2002). Many of the cyanobactin pathways have been expressed in E. coli, with the resulting cyanobactins isolated exclusively from broth and not from cell pellets (Schmidt et al., 2005). Moderately cytotoxic cyanobactins can be isolated from whole animals in amazing quantities of up to grams per kilogram of dry weight in some cases. Thus, taken together the data currently support a distribution of cyanobactins throughout the ascidian tunic, although it is possible that there is some species specificity involved.
Ecological roles of cyanobactins are probably closely tied to their bioactivities. Because cyanobactins are often moderately potent cytotoxins against mammalian cell lines, it is possible that the chemicals are defensive in nature, preventing predation. However, it should be kept in mind that there is an immense structural diversity within the cyanobactins. Many of the compounds have been shown to bind metals such as Cu(II) in vitro, which may be important in metal detoxification or concentration (Bertram & Pattenden, 2007). One group of cyanobactins from free-living Microcystis cyanobacteria acts as allelochemicals: they are
Euichi Hirose, Brett A. Neilan, Eric W. Schmidt et al. 178
toxic to other cyanobacteria (Todorova et al., 1995; Juttner et al., 2001). This implies the intriguing possibility that cyanobactins are Prochloron defenses against other cyanobacteria. In this scenario, it is even possible that a chemical defense role could evolve later, following an initial anti-cyanobacterial role. These speculations require testing in ecologically relevant assays. In our hands, didemnid cyanobactins are not toxic against yeasts, fungi, or common lab strains of Gram-positive or Gram-negative bacteria (Schmidt et al., unpublished data).
Possibly the most intriguing and enigmatic aspect of Prochloron cyanobactins involves pathway biochemistry and evolution (Schmidt, 2008). Cyanobactins are directly encoded on precursor peptides, PatE and relatives (Schmidt et al., 2005). The patE precursor genes are clustered with genes for enzymes, PatA, PatD, PatF, PatG, and homologs that are required for cyanobactin biosynthesis (Donia et al., 2006). These enzymes modify cyanobactin sequences by posttranslationally adding heterocycles derived from Cys, Ser, and Thr and / or isoprene units. Subsequently, the modified peptides are cleaved from the precursor and cyclized to form the mature peptides. The proteolytic and cyclization enzymes have recently been characterized in vitro (Lee et al., manuscript under review)
Because there are 60 cyanobactins in ascidians, it was of interest to determine how pathways evolve to produce new compounds. While ~200 bp genes encode the precursor peptides, with only ~48 bp encoding the final cyanobactin products, an additional ~11 kbp encode the modifying enzymes. Using didemnid ascidians collected in Palau, Papua New Guinea, the Solomon Islands, and Fiji, 30 related pathways encoding patellamides were discovered (Donia et al., 2006). These pathways were virtually 100% identical to each other across 11 kbp at the DNA level (figure 7). However, in the 48 bp region encoding diverse patellamide products, they were hypervariable, with as low as 46% identity at the nucleotide level. Thus, identical enzymes are capable of processing highly diverse patellamide structures.
In a second example, the trunkamide pathway was cloned from Prochloron (Donia et al., 2008). The trunkamide pathway group differs from the patellamide group in that the former uses isoprene, while the latter does not. The trunkamide pathway was ~98% identical to the patellamide pathway at the DNA sequence level (figure 7). However, in the middle of the pathway, there is a large region of ~4 kbp which is as low as 40% identical to the patellamide pathway. There are no new enzyme classes in the trunkamide pathway, but there is a duplication, with 2 patF homologs in place of the 1 found in the patellamide group. PatF family enzymes have no characterized or structural homologs, yet somehow they appear to control addition of isoprene versus heterocyclization.
These two evolutionary examples have not been previously observed in other, non-symbiotic systems. The mechanisms behind these striking evolutionary patterns remain mysterious: how do the pathways control such vast diversity over small sequence regions while no mutations are observed elsewhere? How do duplications and divergence of a new gene family lead to new functions? And finally, since these compounds are clearly functionally important to Prochloron, how do these evolutionary routes contribute to fitness of the host-bacteria partnership?
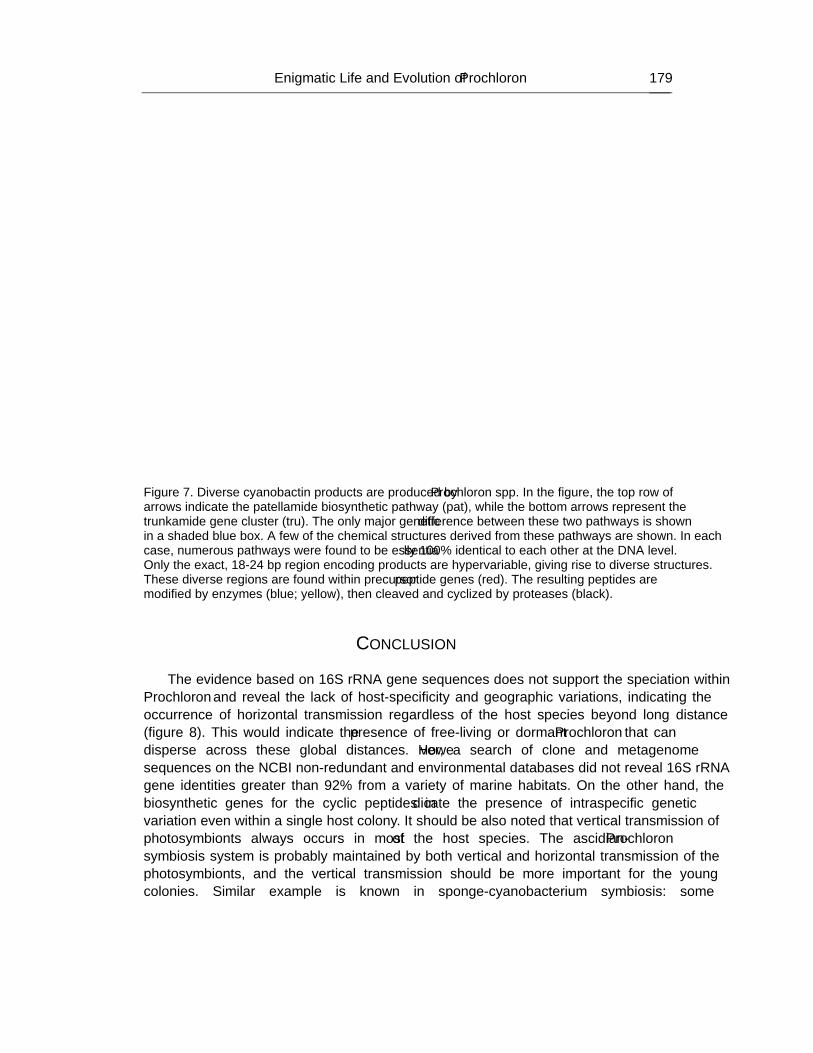
Enigmatic Life and Evolution of Prochloron … 179
Figure 7. Diverse cyanobactin products are produced by Prochloron spp. In the figure, the top row of arrows indicate the patellamide biosynthetic pathway (pat), while the bottom arrows represent the trunkamide gene cluster (tru). The only major genetic difference between these two pathways is shown in a shaded blue box. A few of the chemical structures derived from these pathways are shown. In each case, numerous pathways were found to be essentially 100% identical to each other at the DNA level. Only the exact, 18-24 bp region encoding products are hypervariable, giving rise to diverse structures. These diverse regions are found within precursor peptide genes (red). The resulting peptides are modified by enzymes (blue; yellow), then cleaved and cyclized by proteases (black).
CONCLUSION
The evidence based on 16S rRNA gene sequences does not support the speciation within
Prochloron and reveal the lack of host-specificity and geographic variations, indicating the occurrence of horizontal transmission regardless of the host species beyond long distance (figure 8). This would indicate the presence of free-living or dormant Prochloron that can disperse across these global distances. However, a search of clone and metagenome sequences on the NCBI non-redundant and environmental databases did not reveal 16S rRNA gene identities greater than 92% from a variety of marine habitats. On the other hand, the biosynthetic genes for the cyclic peptides indicate the presence of intraspecific genetic variation even within a single host colony. It should be also noted that vertical transmission of photosymbionts always occurs in most of the host species. The ascidian-Prochloron symbiosis system is probably maintained by both vertical and horizontal transmission of the photosymbionts, and the vertical transmission should be more important for the young colonies. Similar example is known in sponge-cyanobacterium symbiosis: some
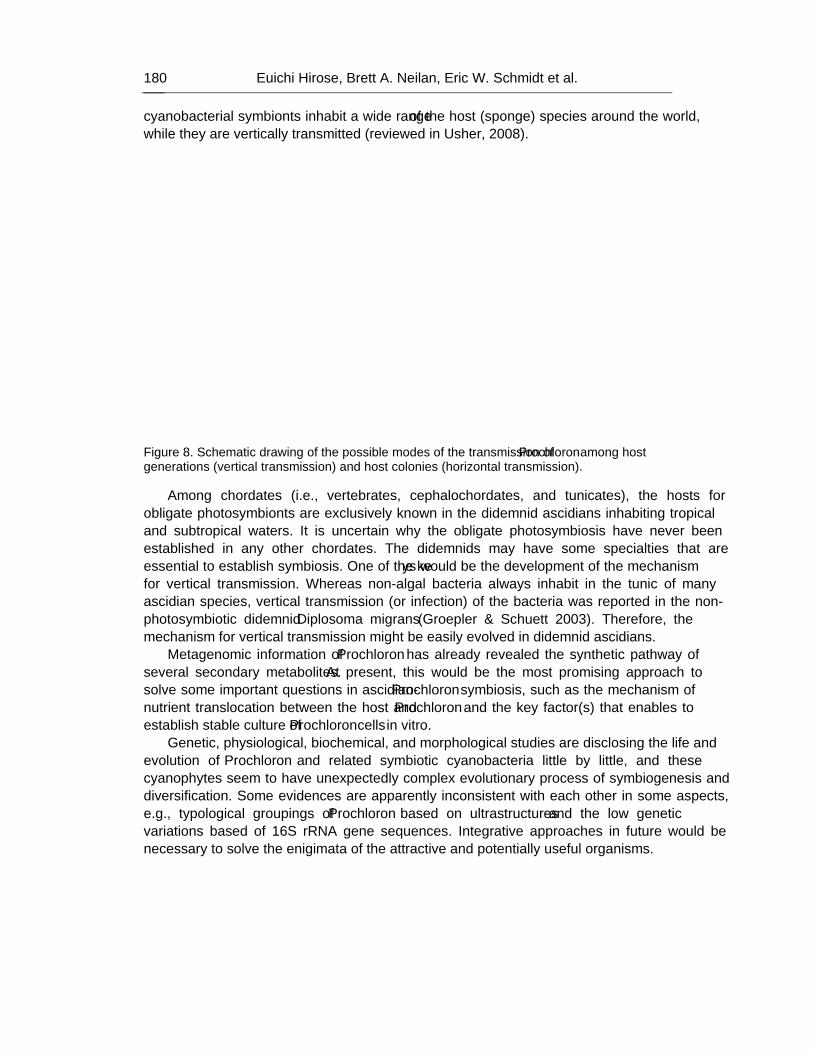
Euichi Hirose, Brett A. Neilan, Eric W. Schmidt et al. 180
cyanobacterial symbionts inhabit a wide range of the host (sponge) species around the world, while they are vertically transmitted (reviewed in Usher, 2008).
Figure 8. Schematic drawing of the possible modes of the transmission of Prochloron among host generations (vertical transmission) and host colonies (horizontal transmission).
Among chordates (i.e., vertebrates, cephalochordates, and tunicates), the hosts for obligate photosymbionts are exclusively known in the didemnid ascidians inhabiting tropical and subtropical waters. It is uncertain why the obligate photosymbiosis have never been established in any other chordates. The didemnids may have some specialties that are essential to establish symbiosis. One of the keys would be the development of the mechanism for vertical transmission. Whereas non-algal bacteria always inhabit in the tunic of many ascidian species, vertical transmission (or infection) of the bacteria was reported in the non-photosymbiotic didemnid Diplosoma migrans (Groepler & Schuett 2003). Therefore, the mechanism for vertical transmission might be easily evolved in didemnid ascidians.
Metagenomic information of Prochloron has already revealed the synthetic pathway of several secondary metabolites. At present, this would be the most promising approach to solve some important questions in ascidian-Prochloron symbiosis, such as the mechanism of nutrient translocation between the host and Prochloron and the key factor(s) that enables to establish stable culture of Prochloron cells in vitro.
Genetic, physiological, biochemical, and morphological studies are disclosing the life and evolution of Prochloron and related symbiotic cyanobacteria little by little, and these cyanophytes seem to have unexpectedly complex evolutionary process of symbiogenesis and diversification. Some evidences are apparently inconsistent with each other in some aspects, e.g., typological groupings of Prochloron based on ultrastructures and the low genetic variations based of 16S rRNA gene sequences. Integrative approaches in future would be necessary to solve the enigimata of the attractive and potentially useful organisms.
Enigmatic Life and Evolution of Prochloron … 181
REFERENCES
Alberte, R. S., Cheng, L. & Lewin, R. A. (1986). Photosynthetic characteristics of Prochloron sp. /ascidian symbioses. I. Light and temperature responses of the algal symbiont of Lissoclinum patella. Mar. Biol., 90:575-587.
Alberte, R. S., Cheng, L. & Lewin, R. A. (1987). Characteristics of Prochloron / Ascidian. symbioses II. Photosynthesis-irradiance relationships and carbon balance of associations from Palau, Micronesia. Symbiosis, 4:147-170.
Bergmann, I., Geiß-Brunschweiger, U., Hagemann, M. & Schoor, A. (2008). Salinity tolerance of the chlorophyll b-synthesizing cyanobacterium Prochlorothrix hollandica strain SAG 10.89. Micob. Ecol. 55:685-696.
Bertram, A. & Pattenden, G. (2007). Marine metabolites: metal binding and metal complexes of azole-based cyclic peptides of marine origin. Nat. Prod. Rep., 24:18-30.
Biard, J. F., Grivois, C., Verbist, J. F., Devitus, C. & Carre, J. B. (1990). Origin of bistramide A identified in Lissoclinum bistratum (Urochordata): possible involvements of symbiotic prochlorophyta. J. Mar. Biol. Ass. UK, 70: 741-746.
Bibby, T. S., Nield, J.& Barber, J. (2001a). Iron deficiency induces the formation of an antenna ring around trimeric photosystem I in cyanobacteria. Nature. 412:743-745.
Bibby, T. S., Nield, J., Partensky, F. & Barber, J. (2001b). Antenna ring around photosystem I. Nature. 413:590.
Bibby, T. S., Nield, J., Chen, M., Larkum, A. W. D. & Barber, J. (2003). Structure of a photosystem II supercomplex isolated from Prochloron didemni retaining its chlorophyll a/b light-harvesting system. Proc. Natl. Acad. Sci. U.S.A., 100:9050-9054.
Boekema, E.J., Hifney, A., Yakushevska, A.E., Piotrowski, M., Keegstra, W., Berry, S., Michel, K.P., Pistorius, E.K. & Kruip, J. (2001). A giant chlorophyll-protein complex induced by iron deficiency in cyanobacteria. Nature. 412:745-748.
Boichenko, V.A., Pinevich, A.V. & Standnichunk, I.N. (2007) Association of chlorophyll a/b-binding Pcb proteins with photosystems I and II in Prochlorothrix hollandica. Biochim. Biophys. Acta. 1767:801-806
Bumba, L., Prasil, O. & Vacha, F. (2005) Antenna ring around trimeric photosystem I in chlorophyll b containing cyanobacterium Prochlorothrix hollandica. Biochim. Biophys. Acta. 1798:1-5.
Burger-Wiersma, T. & Post, A. F. (1989) Functional analysis of the photosynthetic apparatus of Prochlorothrix hollandica (Prochlorales), a chlorophyll b containing prokaryote. Plant Physiol., 770-774.
Burighel, P. & Cloney, R. A. (1997). Urochordata: Ascidiacea. In: F. W. Harrison & E. E. Rupert (Eds), Microscopic anatomy of invertebrates, Vol. 15. Hemichordata, Chaetognatha, and the Invertebrate Chordates, pp 221-347. New York: Wiley-Liss.
Burns, B. P., Goh, F. Allen, M. & Neilan, B. A. (2004) Microbial diversity of extant stromatolites in the hypersaline marine environment of Shark Bay, Australia. Environ. Microbiol., 6: 1096-1101.
Carroll, A. R., Coll, J. C., Bourne, D. J., Macleod, J. K., Zabriskie, T. M., Ireland, C. M. & Bowden, B. F. (1996). Patellins 1-6 and trunkamide A: Novel cyclic hexa-, hepta- and octa-peptides from colonial ascidians, Lissoclinum sp. Aust. J. Chem., 49: 659-667.
Cheng, L. & Lewin, R. A. (1984). Prochloron on Synaptula. Bull. Mar. Sci., 35: 95-98.
Euichi Hirose, Brett A. Neilan, Eric W. Schmidt et al. 182
Chen M., Bibby T.S., Nield J., Larkum A.& Barber J. (2005a). Iron deficiency induces a chlorophyll d-binding Pcb antenna system around Photosystem I in Acaryochloris marina. Biochim. Biophys. Acta. 3:367-374.
Chen M., Bibby T.S., Nield J., Larkum A.& Barber J. (2005b). Structure of a large photosystem II supercomplex from Acaryochloris marina. FEBS Lett. 579:1306-1310.
Chen, M., Zhang, Y. & Blankenship, R. E. (2008) Nomenclature for membrane-bound light-harvesting complexes of cyanobacteria. Photosyn. Res. 95: 147-154.
Christen, G., Stevens, G., Lukins, P. B., Renger, G. & Larkum, A.W.D. (1999) Isolation and characterization of oxygen evolving thylakoids from the marine prokaryote Prochloron didemni. FEBS Lett. 449:264-268.
Corley, D. G., Moore, R. E. & Paul, V. J. (1988). Patellazole B: a novel cytotoxic thiazole-containing macrolide from the marine tunicate Lissoclinum patella. J. Am. Chem. Soc., 110: 7920-7922.
Cox, G. C., Hillar, R. G. & Larkum, A. W. D. (1985). An usual cyanophyte, containing phycourobilin and symbiotic with ascidians and sponges. Mar. Biol., 89: 149–163.
Cox, G. (1986). Comparison of Prochloron from different hosts. I. Structural and ultrastructural characteristics. New Phytol., 104: 429-455.
Davidson, B. S. (1993). Ascidians: producers of amino acid-derived metabolites. Chem. Rev. 9: 1771-1791.
Degnan, B. M., Hawkins, C. J., Lavin, M. F., McCaffrey, E. J., Parry, D. L., Van den Brenk, A. L. & Watters, D. J. (1989). New cyclic peptides with cytotoxic activity from the ascidian Lissoclinum patella. J. Med. Chem., 32: 1349-1354.
Dionisio-Sese, M. L., Maruyama, T. & Miyachi, S. (2001). Photosynthesis of Prochloron as affected by environmental factors. Mar. Biotechnol., 3: 74-79.
Donia, M. S., Hathaway, B. J., Sudek, S., Haygood, M. G., Rosovitz, M. J., Ravel, J. & Schmidt, E. W. (2006). Natural combinatorial peptide libraries in cyanobacterial symbionts of marine ascidians. Nat. Chem. Biol., 2: 729-735.
Donia, M. S., Ravel, J. & Schmidt, E. W. (2008). A global assembly line for cyanobactins. Nat. Chem. Biol., 4:341-343.
Farve-Bonvin, J,, Bernillon, J., Salin, N. & Arpin, N. (1987). Biosynthesis of mycosporines: mycosporine glutaminol in Trichothecium roseum. Phytochemistry 29: 2509–2514.
Fujita, Y., Murakami, A., Aizawa, K. & Ohki, K. (1994) Short-term and long-term adaptation of the photosynthetic apparatus: Homeostatic properties of thylakoids. In: Bryant, D. A., (Ed) The Molecular Biology of Cyanobacteria (Advances in Photosynthesis, Volume 1). pp 677-692. Kluwer Academic Publishers, Dordrecht.
Fujita, Y., Ohki, K. & Murakami, A. (2001) Acclimation of photosynthetic light energy conversion to the light environments. In: L.C. Rai & J. P. Gaur (Eds), Algal adaptation to environmental stresses: Physiological, biochemical and molecular mechanism, pp135-171. Springer-Verlag: Berlin/Heidelberg.
Giddings, T. H., Withers, N. W. & Staehelin, L. A. (1980). Supramolecular structure of stacked and unstacked regions of the photosynthetic membranes of Prochloron sp., a prokaryote. Proc. Natl. Acad. Sci. U.S.A., 77:352-356.
Gouiffes, D., Juge, M., Grimaud, N., Welin, L., Sauviat, M. P., Barbin, Y., Laurent, D., Roussakis, C., Henichart, J. P. & Verbist, J. F. (1988). Bistramide A, a new toxin from the urochordata Lissoclinum bistratum Sluiter: isolation and preliminary characterization. Toxicon, 26: 1129-36.
Enigmatic Life and Evolution of Prochloron … 183
Griffiths, D.J. (2006). Chlorophyll b-containing oxygenic photosynthetic prokaryotes: oxychlorobacteria (prochlorophytes). Bot. Rev., 72: 330-366.
Griffiths, D.J. & Thinh, L-V. (1983). Transfer of photosynthetically fixed carbon between the prokaryotic green alga Prochloron and its ascidian host. Aust. J. Mar. Freshwater Res. 34: 431-440.
Groepler, W. & Schuett, C. (2003). Bacterial community in the tunic matrix of a colonial ascidian Diplosoma migrans. Helgol. Mar. Res. 57: 139–143.
Hardison, L.K., Boczar, B.A. & Cattolico, R.A. (1995) psbA in the marine chromophyte Heterosigma carterae: evolutionary analysis and comparative structure of the D1 carboxyl terminus. Am. J. Bot., 82:893-902.
Helfrich, M., Ross, A., King, G.C., Turner, A.G. & Larkum, A.W.D. (1999) Identification of [8-vinyl]-protochlorophyllide a in phototrophic prochlorophytes and algae: chemical and spectroscopic properties. Biochim. Biophys. Acta, 1410:262–272
Hernández-Mariné, M., Turon, X. & Catalan, J. (1990). A marine Synechocystis (Chroococcales, Cyanophyta) epizoic on didemnid ascidians from the Mediterranean Sea. Phycologia, 29: 275-284.
Hess, W.R., Weihe, A., Loiseaux-de Goër, S., Partensky, F. and Vaulot, D. (1995). Characterization of the single psbA gene of Prochlorococcus marinus CCMP 1375 (Prochlorophyya). Plant Mol. Biol. 27:1189-1196.
Hess, W.R., Partensky, F., Van Der Stay, G.W.M., Garcia-Fernandez, J.M., Boerner, T. & Vaulot, D. (1996). Coexistence of phycoerythrin and a chlorophyll a/b antenna in a marine prokaryote. Proc. Natl. Acad. Sci. USA, 93: 11126-11130.
Hirose, E., Maruyama, T., Cheng, L. & Lewin, R. A. (1996). Intracellular symbiosis of a photosynthetic prokaryote, Prochloron, in a colonial ascidian. Invertebr. Biol., 115: 343–348.
Hirose, E., Maruyama, T., Cheng, L. & Lewin, R. A. (1998). Intra- and extra-cellular distribution of photosynthetic prokaryotes, Prochloron sp., in a colonial ascidian: ultrastractural and quantitative studies. Symbiosis, 25: 301-310.
Hirose, E. (2000a). Diet of a notodelphyid copepod inhabiting in an algal-bearing didemnid ascidian Diplosoma virens. Zool. Sci., 17: 833–838.
Hirose, E. (2000b). Plant rake and algal pouch of the larvae in the tropical ascidian Diplosoma similis: an adaptation for vertical transmission of photosynthetic symbionts Prochloron. Zool. Sci., 17: 233–240.
Hirose, E. & Maruyama, T. (2004) What are the benefits in the ascidian-Prochloron symbiosis? Endocyt. Cell. Res., 15: 51-62.
Hirose, E., Akahori, M., Oka, A. T. & Kurabayashi, A. (2004a). Some Prochloron-bearing didemnid ascidians collected from the reef shores of Iriomote Island (Okinawa, Japan). Biol. Mag. Okinawa, 42: 7-15.
Hirose, E., Otsuka, K., Ishikura, M. & Maruyama, T. (2004b). Ultraviolet absorption in ascidian tunic and ascidian–Prochloron symbiosis. J. Mar. Biol. Assn. UK, 84: 789–794.
Hirose, E. & Fukuda, T. (2006). Vertical transmission of photosymbionts in the colonial ascidian Didemnum molle: the larval tunic prevents symbionts from attaching to the anterior part of larvae. Zool. Sci., 23: 669-674.
Hirose. E., Adachi, R., & Kuze, K. (2006a). Sexual reproduction of the Prochloron-bearing ascidians, Trididemnum cyclops and Lissoclinum bistratum, in subtropical waters:
Euichi Hirose, Brett A. Neilan, Eric W. Schmidt et al. 184
seasonality and vertical transmission of photosymbionts. J. Mar. Biol. Assn. UK, 86: 175–179
Hirose, E., Hirose, M. & Neilan, B. A. (2006b). Localization of symbiotic cyanobacteria in the colonial ascidian Trididemnum miniatum (Didemnidae, Ascidiacea). Zool. Sci., 23: 435-442.
Hirose, E., Hirabayashi, S., Hori, K., Kasai, F. & Watanabe, M. M. (2006c). UV protection in the photosymbiotic ascidian Didemnum molle inhabiting different depths. Zool. Sci., 23: 57-63.
Hirose, E. & Hirose, M. (2007). Morphological process of vertical transmission of photosymbionts in the colonial ascidian Trididemnum miniatum Kott, 1977. Mar. Biol., 150: 359-367.
Hirose, E. & Nakabayashi, S. Algal symbionts in the tunic lamellae on the posterior half of thelarval trunk of the colonial ascidian Lissoclinum timorense (Ascidiacea, Didemnidae). Zool. Sci., in press.
Holton, R.W., Stam, W.T. & Boele-Bos, S.A. (1990). DNA-DNA reassociation studies with DNA from Prochloron (Prochlorophyta) samples of Indo-West pacific origin. J. Phycol., 26: 358-361.
Hoober, J.K. & Argyroudi-Akoyunoglow, J. H. (2004) Asembly of light-harvesting complexes of photosystem II and the role of chlorophyll b. In: C. Papageorgiou & Govindjee (Eds), Chlorophyll a fluorescence: a signature of photosynthesis, pp 679-712. Netherland, Springer.
Ireland, C. M., & Scheuer, P. J. (1980). Ulicyclamide and ulithiacyclamide, 2 new small peptides from a marine tunicate. J. Am. Chem. Soc., 102:5688-5691.
Ireland, C. M., Durso, A. R., Newman, R. A. & Hacker, M. P. (1982). Antineoplastic cyclicpeptides from the marine tunicate Lissoclinum patella. J. Org. Chem., 47:1807-1811.
Juttner, F., Todorova, A. K., Walch, N. & von Philipsborn, W. (2001). Nostocyclamide M: a cyanobacterial cyclic peptide with allelopathic activity from Nostoc 31. Phytochem., 57:613-619.
Karentz, D. (2001). Chemical defenses of marine organisms against solar radiation exposure: UV-absorbing mycosporine-like amino acids and scytonemim. In: J. B. McClintock & B. J. Baker (Eds), Marine Chemical Ecology, pp 481–520. Boca Raton: CRC Press.
Kott, P. (1977). Algal-supporting didemnid ascidians of the Great Barrier Reef. In Proceedings of The International Coral Reef Symposium. Miami: Rosenstiel School of Marine and Atmospheric Science, pp 616-622.
Kott, P. (1981). Didemnid-algal symbiosis: algal transfer to a new host generation. Proc. 4th Int. Coral Reef Symp., 2: 721–723
Kott, P. (1982). Didemnid-algal symbioses: host-specimens in the western Pacific with a note on the symbiosis. Micronesica, 18: 95–127.
Kott, P., Parry, D. L. & Cox, G. C. (1984). Prokaryotic symbionts with a range of ascidian hosts. Bull. Mar. Sci., 34: 308-312.
Kott, P. (2001). The Australian Ascidiacea part 4, Aplousobranchia (3), Didemnidae. Mem. Qld. Mus., 47: 1–408.
Kott, P. (2005). New and little-known species of Didemnidae (Ascidiacea, Tunicata) from Australia (Part 3). J. Nat. Hist., 39: 2409-2497.
Enigmatic Life and Evolution of Prochloron … 185
Kühl, M., Chen, M., Ralph, P.J., Schreiber, U. & Larkum A.W. (2005) Ecology: a niche for cyanobacteria containing chlorophyll d. Nature, 433:820.
Lafargue, F. & Duclaux, D. (1979). Premier exemple, en Atlantique tropical, d’une association symbiotique entre une ascidie didemnidae et une cyanophycée chroococcale: Trididemnum cyanophorum nov. sp. et Synechocystis trididemni nov. sp. Ann. Inst. Océanogr., 55:163-184.
Lambert, G., Lambert, C. C. & Waaland, J. R. (1996). Algal symbionts in the tunic of six New Zealand Ascidians (Chordata, Ascidiacea). Invertebr. Biol., 115: 67-78.
Larkum, A. W. D., Cox, G. C., Hillar, R. G., Parry, D. L. & Dibbayawan, T. P. (1987). Filamentous cyanophytes containing phycourobilin and in symbiosis with sponges and an ascidian of coral reefs. Mar. Biol., 95: 1-13.
Larkum, A. W. D., Scaramuzzi, C., Cox, G. C., Hiller, R. G. & Turner, A. G. (1994). Light-harvesting chlorophyll c-like pigment in Prochloron. Proc. Natl. Acad. Sci. U.S.A., 91:679-683.
La Roche, J., Van Der Stay, G.W.M., Partensky, F., Ducret, A., Aebersold, R., Li, R., Golden, S.S., Hiller, R.G., Wrench, P.M., Larkum, A.W.D., & Green, B. R. (1996) Independent evolution of the prochlorophyte and green plant chlorophyll a/b light-harvesting proteins. Proc. Natl. Acad. Sci. U.S.A., 93: 15244-15248.
Lesser, M. P. & Stochaj, W. R. (1990). Photoadaptation and protection against active forms of oxygen in the symbiotic prokaryote Prochloron sp. and its ascidian host. Appl. Environ. Microbiol., 56:1530-1535.
Lewin, R. A. (1975). A marine Synechocystis (Cyanophyta, Chroococcales) epizoic on ascidians. Phycologia, 14, 153-160.
Lewin, R. A. (1976). Prochlorophyta as a proposed new division of algae. Nature, 261: 697-698.
Lewin, R. A. (1977). Prochloron, type genus of the Prochlorophyta. Phycologia, 16: 217. Lewin, R.A. (1981). Prochloron and the theory of symbiogenesis. Ann. NY Acad. Sci., 361:
325-329. Lewin, R. A. & Lanna, C. (Eds.) (1989). Prochloron: a microbial enigma. New York,
Chapman & Hall. Lewin, R.A. (2002). Prochlorophyta a matter of class distinction. Photosynth. Res., 73: 59-61. Litvaitis, M.K. (2002). A molecular test of cyanobacterial phylogeny: inferences from
constraint analyses. Hydrobiologia, 468: 135-145. Lockhart, P.J., Beanland, T.J., Howe, C.J. & Larkum, A.W. (1992). Sequence of Prochloron
didemni atpBE and the inference of chloroplast origins. Proc. Natl. Acad. Sci. USA, 89: 2742-2746.
Long, P. F., Dunlap, W. C., Battershill, C. N. & Jaspars, M. (2005). Shotgun cloning and heterologous expression of the patellamide gene cluster as a strategy to achieving sustained metabolite production. Chem. Bio. Chem., 6:1760-1765.
McKay, R.M., Salgado, D., Bonen, L., Stackebrandt, E., and Doolittle, W.F. (1982). The 5S ribosomal RNAs of Paracoccus denitrificans and Prochloron. Nucleic Acids Res., 10: 2963.
Maruyama, T., Hirose, E. & Ishikura, M. (2003). Ultraviolet-light-absorbing tunic cells in didemnid ascidians hosting a symbiotic photo-oxygenic prokaryote, Prochloron. Biol. Bull., 204: 109–113.
Euichi Hirose, Brett A. Neilan, Eric W. Schmidt et al. 186
Mimuro, M., Kikuchi, H. & Murakami, A. (1999) Structure and function of phycobilisomes. In: G. S., Singhal, G. Renger, S. K. Sopory, K. D. Irrgang & Govindgee (Eds), Concepts in Photobiology: Photosynthesis and Photomorphogenesis. pp104-135. Kluwer Academic Pub., Dordrecht.
Mimuro, M., Tomo, T. & Tsuchiya, T. (2008a). Two unique cyanobacteria lead to a traceable approach of the first appearance of oxygenic photosynthesis, Photosyn. Res., 97:167-176.
Mimuro, M., Kobayashi, M., Murakami, A., Tsuchiya, T. & Miyashita, H. (2008b) Structure and function of antenna systems: Oxygen evolving cyanobacteria, In: Renger G. (Ed), Primary Processes of Photosynthesis: Basic Principles and Apparatus. Part 1, pp 261-299, Cambridge RSC Publishing, Cambridge.
Miyashita, H., Ikemoto, H., Kurano, N., Adachi, K., Chihara, M. & Miyachi, S. (1996). Chlorophyll d as a major pigment. Nature, 383: 402.
Morden, C. W. & Golden, S. S. (1989). psbA genes indicate common ancestry of prochlorophytes and chloroplasts. Nature, 337: 382-385.
Münchhoff, J., Hirose, E., Maruyama, T., Sunairi, M., Burns, B. P. & Neilan, B. A. (2007). Host specificity and phylogeography of the prochlorophyte Prochloron sp., an obligate symbiont in didemnid ascidians. Environ. Microbiol., 9: 890-899.
Murakami, A., Miyashita, H., Iseki, M., Adachi, K. & Mimuro, M. (2004) Chlorophyll d in an epiphytic cyanobacterium of red algae. Science 303:1633 (and Online Supporting Materials).
Murray, J. W., Duncan, J. & Barber, J. (2006) CP-43-like chlorophyll binding proteins: structural and evolutionary implications. Trend. Plant Sci. 11:152-158.
Neilan, B.A., Saker, M.L., Fastner, J., Toeroekne, A. & Burns, B. (2003). Phylogeography of the invasive cyanobacterium Cylindrospermopsis raciborskii. Mol. Ecol., 12: 133-140.
Nield, J., Morris, E.P., Bibby, T.S. & Barber, J. (2003) Structural analysis of the photosystem I supercomplex of cyanobacteria induced by iron deficiency.. Biochemistry. 42:3180-3188.
Oka, A. T., Suetsugu, M. & Hirose, E. (2005). Two new species of Diplosoma (Ascidiacea: Didemnidae) bearing prokaryotic algae Prochloron from Okinawajima (Ryukyu Archipelago, Japan). Zool. Sci., 22: 367–374.
Oka, A. T. & Hirose, E. (2005). Some didemnid ascidians harboring prokaryotic algae from the reef shores in the Yaeyama Islands, Okinawa, Japan. Biol. Mag. Okinawa, 43: 45-52.
Oka, A. T., Fukuda, T. & Hirose, E. (2007). Didemnid ascidians harboring prokaryotic algae from Amamiohshima Island, Ryukyu Archipelago, Japan. Biol. Mag. Okinawa, 45: 27-31.
Olson, R. R. (1983). Ascidian-Prochloron symbiosis: The role of larval photoadaptations in midday larval release and settlement. Biol. Bull., 165: 221-240.
Orcutt, K.M., Rasmussen, U., Webb, E.A., Waterbury, J.B., Gundersen, K. & Bergman, B. (2002). Characterization of Trichodesmium spp. by genetic techniques. Appl. Environ. Microbiol., 68: 2236-2245.
Oster, U., Tanaka, R., Tanaka, A. & Rüdiger, W. (2000) Cloning and functional expression of the gene encoding the key enzyme for chlorophyll b biosynthesis CAO from Arabidopsis thaliana. Plant J., 21: 305-310.
Paerl, H.W., Lewin, R.A., and Cheng, L. (1984). Variations in chlorophyll and carotenoid pigmentation among Prochloron (Prochlorophyta) symbionts in diverse marine ascidians. Botanica Marina, 27: 257-264.
Enigmatic Life and Evolution of Prochloron … 187
Palenik, B. & Haselkorn, R. (1992). Multiple evolutionary origins of prochlorophytes, the chlorophyll b-containing prokaryotes. Nature, 355: 265-266.
Palenik, B. & Swift, H. (1996). Cyanobacterial evolution and prochlorophyte diversity as seen in DNA-dependent RNA polymerase gene sequences. J. Phycol., 32: 638-646.
Pardy, R. L. & Lewin, R. A. (1981). Colonial ascidians with prochlorophyte symbionts: Evidence for translocation of metabolites from alga to host. Bull. Mar. Sci., 31: 817-823.
Parry, D. L. (1984). Cyanophytes with R-phycoerythrins in association with seven species of ascidians from the Great Barrier Reef. Phycologia, 23: 503-505.
Parry, D. L. (1986). Prochloron on the sponge Aplysilla sp. Bull. Mar. Sci., 38: 388-390. Parry, D. L. & Kott, P. (1988) Co-symbiosis in the Ascidiacea. Bull. Mar. Sci., 42: 149-153. Partensky, F., Hoepffner, N., Li, W. K. W., Ulloa, O. & Vaulot, D. (1993) Photoacclimation of
Prochlorococcus sp. (Prochlorophyta) strains isolated from the north Atlantic and the Mediterranean Sea. Plant Physiol. 101: 285-296.
Partensky, F. & Garczarek, L. (2003). The photosynthetic apparatus of chlorophyll b- and d-containing oxyphotobacteria. In: Larkum, A. W. D., Douglas, S. E. & Raven, J. A. (Eds.), Photosynthesis in Algae, pp 29-62. Dordrecht: Kluwer Acad. Publ.
Post, A. F. & Bullerjahn, G. S. (1994) The photosynthetic machinery in Prochlorophytes: Structural properties and ecological significance. FEMS Microbiol. Rev., 13: 393-414.
Satoh, S. & Tanaka, A. (2006) Identification of chlorophyllide a oxygenase in the Prochlorococcus genome by a comparative genomic approach. Plant Cell Physiol., 47: 1622-1629.
Salomon, C. E. & Faulkner, D. J. (2002). Localization studies of bioactive cyclic peptides in the ascidian Lissoclinum patella. J. Nat. Prod., 65: 689-692.
Schmidt, E. W. (2008). Trading molecules and tracking targets in symbiotic interactions. Nat. Chem. Biol., 4: 466-473.
Schmidt, E. W., Sudek, S. & Haygood, M. G. (2004). Genetic evidence supports secondary metabolic diversity in Prochloron spp., the cyanobacterial symbiont of a tropical ascidian. J. Nat. Prod., 67: 1341-1345
Schmidt, E. W., Nelson, J. T., Rasko, D. A., Sudek, S., Eisen, J. A., Haygood, M. G. & Ravel, J. (2005). Patellamide A and C biosynthesis by a microcin-like pathway in Prochloron didemni, the cyanobacterial symbiont of Lissoclinum patella. Proc. Natl. Acad. Sci., 102: 7315-7320.
Seewaldt, E. & Stackebrandt, E. (1982). Partial sequence of 16S ribosomal RNA and the phylogeny of Prochloron. Nature, 295: 618-620.
Shick, J. M. & Dunlap, W. C. (2002). Mycosporine-like amino acids and related gadusols: biosynthesis, accumulation, and UV-protective functions in aquatic organisms. Ann. Rev. Physiol., 64: 223–262.
Shick, J. M. & Dykens, J. A. (1985) Oxygen detoxication in algal-invertebrate symbioses from the Great Barrier Reef. Oecologia. 66: 33-41.
Shick, J. M., Romaine-Lioud, S., Ferrier-Pagès, C., & Gattuso, J.-P. (1999). Ultraviolet-B radiation stimulates sikimate pathway-dependent accumulation of mycosporine-like amino acids in the coral Stylophora pistillata despite decreases in its population of symbiotic dinoflagellates. Limnol. Oceanogr., 44: 1667–1682
Shimada, A., Kanai, S. & Maruyama, T. (1995). Partial sequence of Ribulose-1,5-Bisphosphate Carboxylase/Oxygenase and the phylogeny of Prochloron and Prochlorococcus (Prochlorales). J. Mol. Evol., 40: 671-677.
Euichi Hirose, Brett A. Neilan, Eric W. Schmidt et al. 188
Shimada, A., Yano, N., Kanai, S., Lewin, R. A. & Maruyama, T. (2003). Molecular phylogenetic relationship between two symbiotic photo-oxygenic prokaryotes, Prochloron sp and Synechocystis trididemni. Phycologia, 42: 193-197.
Sings, H. L. & Rinehart, K. L. (1996). Compounds produced from potential tunicate-blue-green algal symbiosis: A review. J. Ind. Microbiol. Biot., 17: 385-396.
Smith, J.K., Parry, J.D., Day, J.G., & Smith R.J. (1998). A PCR technique based on the Hip1 interspersed repetitive sequence distinguishes cyanobacterial species and strains. Microbiol., 144: 2791-2801.
Stackebrandt, E. & Goebel, B.M. (1994). Taxonomic note: a place for DNA–DNA reassociation and 16S rRNA sequence analysis in the present species definition in bacteriology. Int. J. Syst. Bacteriol., 44: 846-849.
Stam, W.T., Boele-Bos, S.A., & Stulp, B.K. (1985). Genotypic relationships between Prochloron samples from different localities and hosts as determined by DNA-DNA reassociations. Arch. Microbiol., 142: 340-341.
Steglich, C., Frankenberg-Dinkel, N., Penno, S., & Hess, W. R. (2005) A green light-absorbing phycoerythrin is present in the high-light-adapted marine cyanobacterium Prochlorococcus sp. MED4. Environ. Microbiol. 7: 1611-1618.
Tanaka, A., Ito, H., Tanaka, R., Tanaka, N. K., Yoshida, K. & Okada, K. (1998) Chlorophyll a oxygenase (CAO) is involved in chlorophyll b formation from chlorophyll a. Proc. Natl Acad. Sci. U.S.A., 95:12719-12723.
Tanaka, R. & Tanaka, A. (2007) Tetrapyrrole biosynthesis in higher plants. Ann. Rev. Plant Biol. 58:321-346.
Taylor, M.W., Achupp, P. J., Dahllof, I., Kjelleberg, S. & Steinberg, P. (2004) Host specificity in marine sponge-associated bacteria, and potential implications for marine microbial diversity. Environ. Microbiol., 6: 121-130.
Ting, C. S., Rocap, G., King, J. & Chisholm, S. W. (2001) Phycobiliprotein genes of the marine photosynthetic prokaryote Prochlorococcus: evidence for rapid evolution of genetic heterogeneity. Microbiology. 147: 3171-3182.
Ting, C. S., Rocap, G., King, J. & Chisholm, S. W. (2002) Cyanobacterial photosynthesis in the oceans: the origins and significance of divergent light-harvesting strategies. Trend. Micobiol. 10:134-142.
Todorova, A. K., Juettner, F., Linden, A., Pluess,T. & von Philipsborn, W. (1995). Nostocyclamide: A new macrocyclic, thiazole-containing allelochemical from Nostoc sp. 31 (cyanobacteria). J. Org. Chem., 60: 7891-5.
Tomitani, A., Okada, K., Miyashita, H., Matthijs, H. C., Ohno, T. & Tanaka, A. (1999). Chlorophyll b and phycobilins in the common ancestor of cyanobacteria and chloroplasts. Nature, 400: 159–162.
Turner, S., Burger-Wiersma, T., Giovannoni, S.J., Mur, L.R. & Pace, N.R. (1989). The relationship of a Prochlorophyte Prochlorothrix hollandica to green chloroplasts. Nature, 337: 380-382.
Turner, S., Pryer, K.M., Miao, V.P.W. & Palmer, J.D. (1999). Investigating deep phylogenetic relationships among cyanobacteria and plastids by small subunit rRNA sequence analysis. J. Eukaryot. Microbiol., 46: 327-338.
Urbach, E., Robertson, E. L., & Chisholm, S. W. (1992). Multiple evolutionary origins of prochlorophytes within the cyanobacterial radiation. Nature, 355: 267-276.
Enigmatic Life and Evolution of Prochloron … 189
Usher, K. M. (2008) The ecology and phylogeny of cyanobacterial symbionts in sponges. Mar. Ecol., 29: 178-192.
Van Valen, L.M. & Maiorana V. C. (1980). The archaebacteria and eukaryotic origins. Nature, 287: 248-250.
Withers, N. W., Alberte, R. S., Lewin, R. A., Thornber, J. P., Britton, G. & Goodwin, T. W. (1978). Photosynthetic unit size, carotenoids, and chlorophyll-protein composition of Prochloron sp., a procaryotic green alga. Proc. Natl. Acad. Sci. U. S. A., 75:2301-2305.
Yokobori, S., Kurabayashi, A., Neilan, B. A., Maruyama, T. & Hirose, E. (2006). Multiple origins of the ascidian–Prochloron symbiosis: molecular phylogeny of photosymbiotic and nonsymbiotic colonial ascidians inferred from 18S rDNA sequences. Mol. Phylogenet. Evol., 40: 8-19.
Zabriskie, T. M., Mayne, C. L. & Ireland, C. M. (1988). Patellazole C: a novel cytotoxic macrolide from Lissoclinum patella. J. Am. Chem. Soc., 110: 7919-7920.

In: Handbook on Cyanobacteria ISBN: 978-1-60741-092-8 Editors: P. M. Gault and H. J. Marler © 2009 Nova Science Publishers, Inc.
Chapter 5
MICROCYSTIN DETECTION IN CONTAMINATED FISH FROM ITALIAN LAKES USING ELISA IMMUNOASSAYS
AND LC-MS/MS ANALYSIS
M. Bruno*a, S. Melchiorre* a, V. Messineo*a, F. Volpi*a, A. Di Corcia†b, I. Aragona‡c, G. Guglielmone‡ c, C. Di Paolo§d,
M. Cenni§d, P. Ferranti**e and P. Gallo††f a Department of Environment and Primary Prevention,
National Institute of Health, Rome, Italy b Department of Chemistry, University ‘‘La Sapienza’’, Rome, Italy
c Local Sanitary Agency, Lido di Camaiore (Lucca), Italy d Regional Agency of Environment Protection of Tuscany –Dept. of Lucca, Lucca, Italy
e Department of Food Science – University of Naples Portici (NA) Italy f Experimental Zooprophylaxys Institute of Mezzogiorno, Portici (NA) Italy
ABSTRACT
Cyanotoxin contamination in ichthyic fauna is a worldwide occurrence detected in small aquacultures and natural lakes, underlying a new class of risk factors for consumers. Microcystin contamination in fish tissues is a recent finding in Italian lakes, which monitoring requires fast and precise techniques, easy to perform and able to give results in real time.
Three different ELISA immunoassay kits, LC-MS/MS triple quadrupole, MALDI-ToF/MS and LC-Q-ToF-MS/MS techniques were employed to analyze 121 samples of fish and crustaceans (Mugil cephaus, Leuciscus cephalus, Carassius carassius, Cyprinus
* Department of Environment and Primary Prevention, National Institute of Health, viale Regina Elena,
299– 00161, Rome, Italy † Department of Chemistry, University ‘‘La Sapienza’’, P.le Aldo Moro 5, 00185, Rome, Italy ‡ Local Sanitary Agency 12 of Viareggio, via Aurelia 335 - 55043 – Lido di Camaiore (Lucca), Italy § Regional Agency of Environment Protection of Tuscany –Dept. of Lucca, via Vallisneri 6 – 50100 – Lucca, Italy ** Department of Food Science – University of Naples, “Federico II” – Via Salute – 80055 – Portici (NA) Italy †† Experimental Zooprophylaxys Institute of Mezzogiorno, Via Salute 2 - 80055 - Portici (NA) Italy
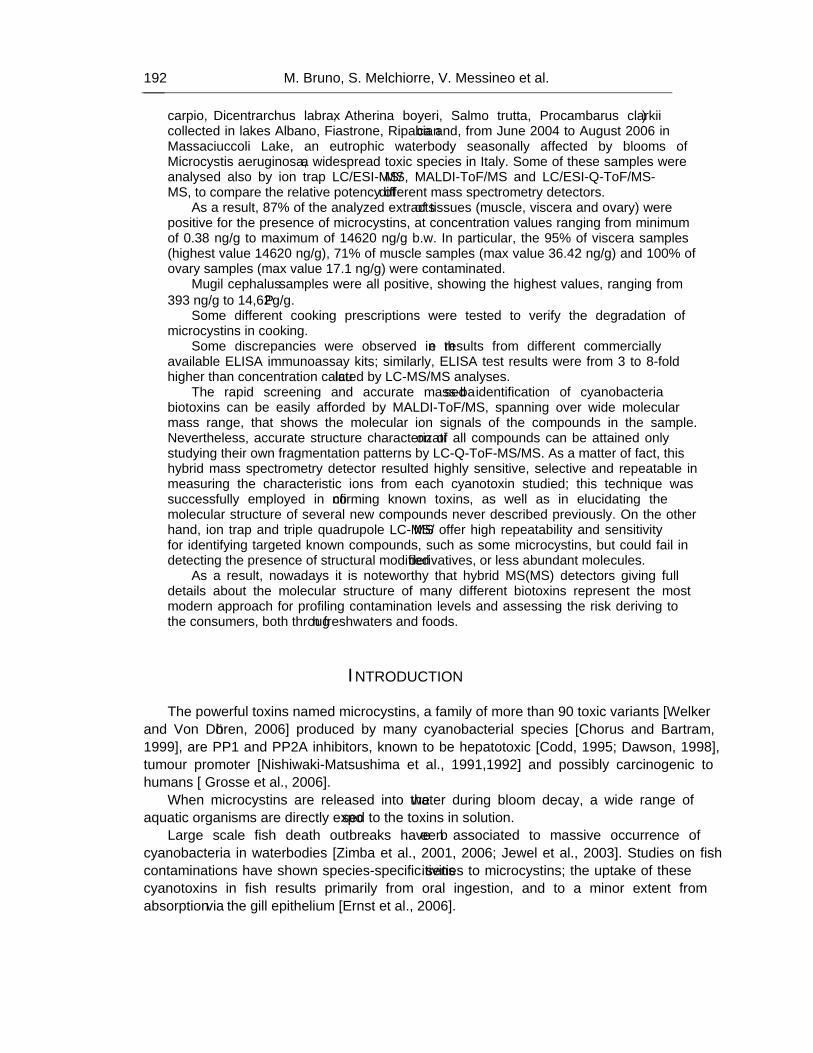
M. Bruno, S. Melchiorre, V. Messineo et al. 192
carpio, Dicentrarchus labrax, Atherina boyeri, Salmo trutta, Procambarus clarkii) collected in lakes Albano, Fiastrone, Ripabianca and, from June 2004 to August 2006 in Massaciuccoli Lake, an eutrophic waterbody seasonally affected by blooms of Microcystis aeruginosa, a widespread toxic species in Italy. Some of these samples were analysed also by ion trap LC/ESI-MS/MS, MALDI-ToF/MS and LC/ESI-Q-ToF/MS-MS, to compare the relative potency of different mass spectrometry detectors.
As a result, 87% of the analyzed extracts of tissues (muscle, viscera and ovary) were positive for the presence of microcystins, at concentration values ranging from minimum of 0.38 ng/g to maximum of 14620 ng/g b.w. In particular, the 95% of viscera samples (highest value 14620 ng/g), 71% of muscle samples (max value 36.42 ng/g) and 100% of ovary samples (max value 17.1 ng/g) were contaminated.
Mugil cephalus samples were all positive, showing the highest values, ranging from 393 ng/g to 14,62 μg/g.
Some different cooking prescriptions were tested to verify the degradation of microcystins in cooking.
Some discrepancies were observed in the results from different commercially available ELISA immunoassay kits; similarly, ELISA test results were from 3 to 8-fold higher than concentration calculated by LC-MS/MS analyses.
The rapid screening and accurate mass-based identification of cyanobacteria biotoxins can be easily afforded by MALDI-ToF/MS, spanning over wide molecular mass range, that shows the molecular ion signals of the compounds in the sample. Nevertheless, accurate structure characterization of all compounds can be attained only studying their own fragmentation patterns by LC-Q-ToF-MS/MS. As a matter of fact, this hybrid mass spectrometry detector resulted highly sensitive, selective and repeatable in measuring the characteristic ions from each cyanotoxin studied; this technique was successfully employed in confirming known toxins, as well as in elucidating the molecular structure of several new compounds never described previously. On the other hand, ion trap and triple quadrupole LC-MS/MS offer high repeatability and sensitivity for identifying targeted known compounds, such as some microcystins, but could fail in detecting the presence of structural modified derivatives, or less abundant molecules.
As a result, nowadays it is noteworthy that hybrid MS(MS) detectors giving full details about the molecular structure of many different biotoxins represent the most modern approach for “profiling” contamination levels and assessing the risk deriving to the consumers, both through freshwaters and foods.
INTRODUCTION The powerful toxins named microcystins, a family of more than 90 toxic variants [Welker
and Von Döhren, 2006] produced by many cyanobacterial species [Chorus and Bartram, 1999], are PP1 and PP2A inhibitors, known to be hepatotoxic [Codd, 1995; Dawson, 1998], tumour promoter [Nishiwaki-Matsushima et al., 1991,1992] and possibly carcinogenic to humans [ Grosse et al., 2006].
When microcystins are released into the water during bloom decay, a wide range of aquatic organisms are directly exposed to the toxins in solution.
Large scale fish death outbreaks have been associated to massive occurrence of cyanobacteria in waterbodies [Zimba et al., 2001, 2006; Jewel et al., 2003]. Studies on fish contaminations have shown species-specific sensitivities to microcystins; the uptake of these cyanotoxins in fish results primarily from oral ingestion, and to a minor extent from absorption via the gill epithelium [Ernst et al., 2006].
Microcystin Detection in Contaminated Fish from Italian Lakes … 193
Microcystins can concentrate in various fish tissues [Xie et al., 2005]: liver, kidney and gill pathologies are present in fish exposed to cyanotoxins, due to specific inhibition of protein phosphatases and other downstream effects, like increased liver enzyme values in the serum. Decreased development of juvenile fish [Malbrouck and Kestermont, 2006] and behavioural changes [Baganz et al., 2004] have been observed after immersion of fish in water containing microcystins, this latter effect probably being caused by the ability of these toxins to cross the blood-brain barrier, carried by anion transporting polypeptides [Fischer et al., 2005; Cazenave et al., 2006].
The toxicity of microcystins in fish depends on the balance between accumulation and metabolism [Ito et al., 2002], and the observed species-specific sensitivities have been interpreted as the result of anatomical, physiological and behavioural differences among the various fish orders [Tencalla and Dietrich, 1997; Fischer and Dietrich, 2000]; the detoxification capacities via the glutathione-S-transferase pathway are species-specific dependent, too [ Cazenave et al., 2006].
In the past the risk of human consumers of gutted fish was traditionally considered low, because microcystins were thought to accumulate mainly in the fish liver.
Recent studies, however, detected microcystin concentrations at 337.3 μg/kg [Tilapia rendalli, Magalhaes et al., 2001], 102 μg/kg [Oreochromis niloticus, Mohamed et al., 2003], 96.5 μg/kg [Hypophthalmichthys molitrix, Chen et al., 2006] and 28 μg/kg [Oncorhynchus mykiss, Wood et al., 2006] in the muscle tissue of wild or farmed fish (WHO recommended TDI 0.04 μg/kg human body weight/ day), indicating that even the consumption of fish muscle might constitute a threat for human health. This potential hazard has lead to the development of several extraction techniques and analytical methods to detect microcystins in fish tissue.
Several methods have been described in the literature, based on protein phosphatase inhibition bioassay, immunoassays (ELISA), mouse test, HPLC with UV detection. Nevertheless, these methods showed some limitations, because they lack of selectivity in identifying the single cyanotoxins in the sample, and sometimes may also be affected by the presence of endogenous activities (protein phosphatase inhibition bioassay). On the contrary, the sensitivity of HPLC based methods is recognised not adequate in determining low contamination levels of cyanotoxins.
Although ELISA based on both polyclonal or monoclonal antibodies resulted sensitive and reliable, the analytical techniques based on liquid chromatography coupled to mass spectrometry (LC-MS) are nowadays considered the best choice for a modern study of cyanotoxin contamination, both in water and tissues. These techniques can be used for both screening and confirmation, allowing to identify unambiguously the single compounds, at ppb or sub-ppb levels; for these reasons, LC-MS analysis fits for the purposes of both official control and monitoring for assessing food safety and consumer protection [for a useful review see Lawton and Edwards, 2008].
Freshwater fish production in Italy consists of 32000 tons/year (7% of total production, year 2005).
So far, only two studies detected cyanotoxin contamination in Italian freshwater fish [Bogialli et al., 2005; Messineo et al., 2008]. The purpose of this study was to investigate the seasonal microcystin contaminations in freshwater vertebrate and invertebrate edible species
M. Bruno, S. Melchiorre, V. Messineo et al. 194
from different Italian lakes affected by cyanobacterial blooms, using different immunological and instrumental detection methods.
MATERIAL AND METHODS
Fish Sampling 121 samples of fishes and crustaceans (Mugil cephalus, Leuciscus cephalus, Carassius
carassius, Cyprinus carpio, Salmo trutta lacustris, Atherina boyeri, Dicentrarchus labrax and Procambarus clarkii) were collected from June 2004 to August 2006 in Massaciuccoli Lake (113 samples), Albano Lake (2 samples), Fiastrone Lake (1 sample) and Ripabianca Lake (1 sample), eutrophic waterbodies seasonally affected by blooms of some of the most widespread toxic species observed in Italy, Microcystis aeruginosa and Planktothrix rubescens. After collection from the lake, fishes were transported to the laboratory and dissected. 5 g (wet weight) of muscle and 5 g of viscera tissue of each fish were extracted. The Atherina boyeri (very small fishes) were extracted full-body.
Tissue Extraction Extraction was performed as follows: tissues were immediately homogenized for 15’
(Ultra-Turrax T8, IKA Werke, Staufen, Germany) with 10 ml of 100% MeOH (HPLC grade), and centrifuged at 5000 g for 5’. Extraction was repeated on the pellet and the collected supernatants were then filtered onto paper filters, pooled and brought to a volume of 25 ml with 100% MeOH. 5 ml of the obtained volume were diluted with 5 ml of distilled water and applied to a C18 SPE (Isolute International Sorbent Technology, Mid-Glamorgan, UK) cartridge preconditioned with 20 ml of 100% MeOH followed by 20 ml of distilled water. The column was washed with 30 ml of distilled water and then 30 ml of 20% MeOH. Microcystins were eluted with 50 ml of 100% MeOH. The 100% MeOH fraction was dried and then dissolved in water (2 ml). This suspension was stored at –30°C for subsequent microcystin (MC) analyses.
Water Extraction Water samples were collected in Massaciuccoli Lake during fish sampling, and extracted
as follows: fresh phytoplankton aliquots (10 – 130 mg) were obtained by centrifugation of water samples, then suspended in 2 ml of sterile bidistilled water.
The solution was stirred, sonicated 5 min. at 30 – 40 °C in an ultrasonic bath (Elgasonic Swiss made), then centrifuged for 10 min. at 11,000 r.p.m. (Beckman L5 – 55 Ultracentrifuge) to eliminate debris. The supernatant was collected, the pellet re-suspended and the whole process repeated twice. The two supernatants were pooled and analyzed for intracellular microcystins. The extracts were analysed by LC-MS/MS-ESI as in Bogialli et al. (2006).
Microcystin Detection in Contaminated Fish from Italian Lakes … 195
Microcystin Analysis
ELISA Analysis All samples were analyzed using three different immunoassay ELISA methods,
according to the manufacturer’s instructions. The EnviroGard Microcystins Plate Kit ( Strategic Diagnostics Inc., Newark, DE, USA)
is a direct competitive ELISA for quantitative detection of microcystins and nodularins (limit of quantification 0.1 ppb). It does not differentiate between microcystins-LR and other microcystins variants but detects their presence to differing degrees. The concentrations at 50% inhibition (50% Bo) for these compounds (ppb) are: microcystin-LR 0.31, microcystin-RR 0.32, microcystin-YR 0.38.
The EnviroLogix QuantiPlate Kit for Microcystins (Envirologix Inc., Portland, ME, USA) is a competitive ELISA with detection limit of 0.147 ppb and quantification limit of 0.175 ppb. The cross-reactivity of this ELISA with microcystin variants is respectively: microcystin-LR 0.50, microcystin-LA 0.81, microcystin-RR 0.92, microcystin-YR 1.42 (50% Bo) .
Both kits are based on the polyclonal antibody of Chu et al. (1989) raised against microcystin-LR, and binding microcystins and their metabolites, e.g. microcystin-glutatione conjugates (Metcalf et al., 2000).
The Beacon’s Microcystin Plate Kit (BEACON Analytical Systems Inc., Portland, ME, USA) is based on a polyclonal antibody too, raised against microcystin-LR as in the previous cases. The percent cross-reactivity versus microcystin-LR in this system is: microcystin-LR 100%, microcystin-RR 87%, microcystin-YR 48%.
The final reaction solution absorbances of the three kits were measured at 450 nm with an Anthos 2010 spectrophotometer ( Anthos – Labtech, Salzburg, Austria).
Triple Quadrupole LC-MS/MS Analysis Eighteen selected fish samples were analysed for their content of microcystin variants. The analysis was carried out as in Bogialli et al., [2006]. Briefly, 200 μL of the extract
were filtered through a regenerated cellulose filter (0.2 μm pore size, 25 mm diameter, Alltech, Sedriano, Italy) and injected The liquid chromatograph consisted of a Waters pump (model 1525μ, Milford, MA), a 200 μL injection loop, and Alltima HP 5 μm C-18 guard (7.5 x 4.6 mm i.d.) and analytical (250 mm x 4.6 mm i.d.) columns (Alltech) thermostated at 35 °C and was interfaced to a benchtop triple-quadrupole mass spectrometer (model Micromass 4 MICRO API, Waters). Mobile phase component A was 10 mM formic acid in acetonitrile, and component B was aqueous 10 mM formic acid. At 1.0 mL/min, the mobile phase gradient profile was as follows (t in minutes): t0, A ) 0%; t5, A ) 0%; t6, A ) 35%; t11, A ) 45%; t12, A ) 57%; t17, A ) 67%; t18, A ) 100%; t20, A ) 100%; t21, 0%; t30, A ) 0%. Analyte retention times varied by ≥0.5% over 2 weeks. A diverter valve led 400 μL/min of the LC column effluent into the ion source that was operated in the PI mode only between 10 and 22 min of the chromatographic run. High-purity nitrogen was used as drying and curtain gases; high-purity argon was used as collision gas. Nebulizer gas was set at 650 L/h, whereas the cone gas was set at 50 L/h; the probe and desolvatation temperatures were maintained,
M. Bruno, S. Melchiorre, V. Messineo et al. 196
respectively, at 100 and 350 °C. The setting for the gas pressure in the collision cell was set at 3 mTorr. Capillary voltage was 3000 V, and extractor voltage was 0 V. Declustering potential, collision energy, and other transmission parameters were optimized for each analyte . Mass axis calibration of each mass-resolving quadrupole Q1 and Q3 was performed by infusion of a sodium and cesium iodide solution at 10 μL/min. Unit mass resolution was established and maintained in each mass-resolving quadrupole by keeping a full width at half-maximum of ~0.7 amu. All of the source and instrument parameters for monitoring cyanotoxins were optimized by standard solutions of 5 μg/mL infused at 10 μL/ min by a syringe pump. The multiple reaction-monitoring (MRM) mode was used for quantitation by selecting at least two fragmentation reactions for each analyte (mass spectrometry data handling system Mass Lab software, Waters, Milford, MA, USA).
The limits (ng/g) of detection for microcystins were: for -RR 1.6, for -YR 2.1, for -LR 2.3, for -LA 1.9, for -LW 1.7. The limits of quantification were, respectively: 1.6, 3.9, 4.0, 3.1 and 3.8.
Ion Trap LC/ESI-MS/MS Analysis Analyses were performed using a LC/ESI-MS system, equipped with P2000 pump, SCM
1000 degasser, AS1000 autosampler and LCQ Advantage ion trap mass spectrometer with an electrospray ion source (ESI) (ThermoElectron, Milan, Italy). Chromatographic separation was performed injecting 50 μL sample volume on a 4 μm particle 250 × 3.0 mm Max RP 80 Å Synergi stainless steel column (Phenomenex, Torrance, CA, USA), at 0.3 mL min-1 flow rate, using 0,05% TFA in water as mobile phase A, and 0,05% TFA in acetonitrile (ACN) as mobile phase B. The chromatography was carried on by linear gradient at room temperature, according to the following programme: 2 minutes at 30% B, then from 30% B at time 2 to 100% B in 16 minutes, holding on for 8 minutes, finally to 30% B in 3 minutes; the equilibrium time between runs was 12 min. The mass spectrometer was periodically calibrated with standard solutions of Ultramark, caffeine and Met-Arg-Phe-Ala peptide provided by the manufacturer. During the LC/ESI-MS/MS experiments, mass spectra were acquired in the positive ionisation mode for MC-RR, MC-LR, and in the negative ion mode for MC-LW and MC-LF. The spectrometer parameters were optimised by tuning on the [M+H]+ ion of MC-RR, at m/z 1038.5, and the [M+H]- ion of MC-LW, at m/z 1023.5. Tuning was performed at 0.3 mL/min LC flow rate. The following experimental LC/ESI-MS/MS parameters were set: capillary temperature 300 °C, spray voltage 4.5 kV, microscan number 3, maximum inject time 200 ms. Other experimental conditions (collision energy, isolation width) were optimised for each compound; the SRM chromatograms were recorded selecting at least 2 diagnostic ions for each microcystin. The LC/ESI-MS/MS analysis was performed by monitoring the signals of the precursor ion → product ion transitions (selected reaction monitoring, SRM mode) from the LC/ESI-MS/MS dataset of each MC; to improve method specificity, MS3 events were introduced for both MC-LW and MC-LF, apart SRM events for MS/MS analysis. The data were acquired and processed using the XcaliburTM software, version 1.3, from ThermoElectron.
The chromatograms obtained extracting the precursor ion→main product ion transition (SRM) signals from the LC/ESI-MS/MS dataset were integrated to calculate the calibration
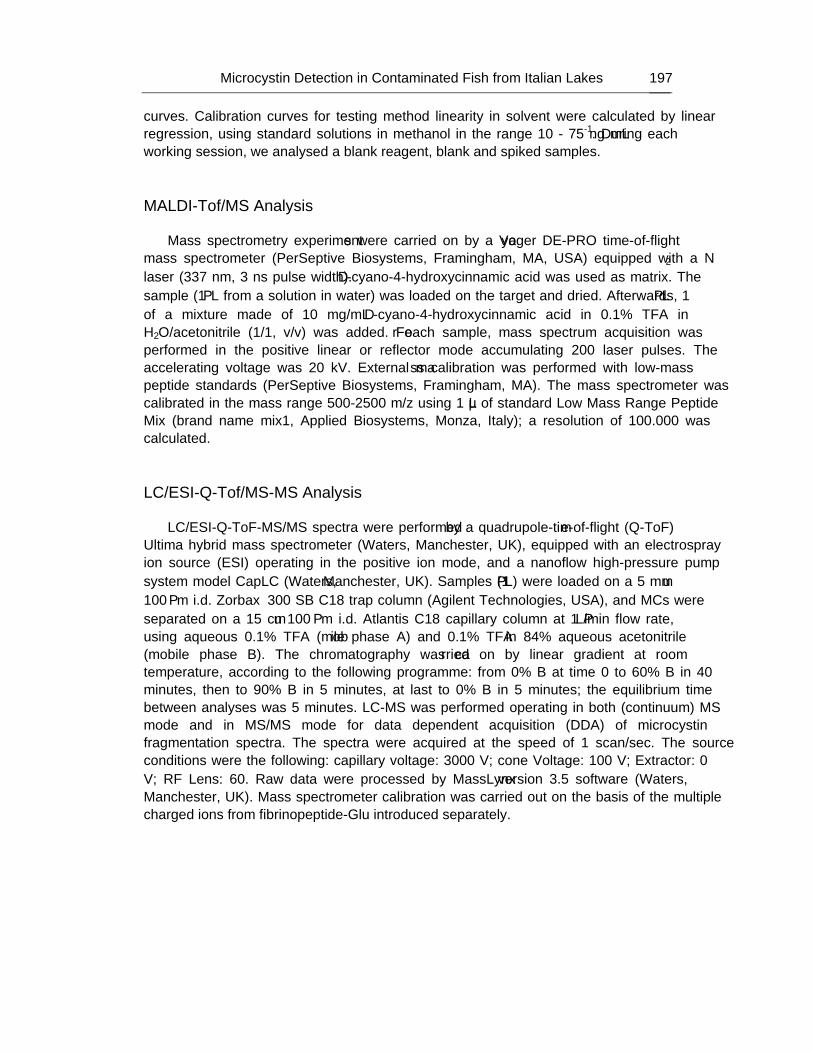
Microcystin Detection in Contaminated Fish from Italian Lakes … 197
curves. Calibration curves for testing method linearity in solvent were calculated by linear regression, using standard solutions in methanol in the range 10 - 75 ng mL-1. During each working session, we analysed a blank reagent, blank and spiked samples.
MALDI-Tof/MS Analysis Mass spectrometry experiments were carried on by a Voyager DE-PRO time-of-flight
mass spectrometer (PerSeptive Biosystems, Framingham, MA, USA) equipped with a N2 laser (337 nm, 3 ns pulse width). α-cyano-4-hydroxycinnamic acid was used as matrix. The sample (1 μL from a solution in water) was loaded on the target and dried. Afterwards, 1 μL of a mixture made of 10 mg/mL α-cyano-4-hydroxycinnamic acid in 0.1% TFA in H2O/acetonitrile (1/1, v/v) was added. For each sample, mass spectrum acquisition was performed in the positive linear or reflector mode accumulating 200 laser pulses. The accelerating voltage was 20 kV. External mass calibration was performed with low-mass peptide standards (PerSeptive Biosystems, Framingham, MA). The mass spectrometer was calibrated in the mass range 500-2500 m/z using 1 µL of standard Low Mass Range Peptide Mix (brand name mix1, Applied Biosystems, Monza, Italy); a resolution of 100.000 was calculated.
LC/ESI-Q-Tof/MS-MS Analysis LC/ESI-Q-ToF-MS/MS spectra were performed by a quadrupole-time-of-flight (Q-ToF)
Ultima hybrid mass spectrometer (Waters, Manchester, UK), equipped with an electrospray ion source (ESI) operating in the positive ion mode, and a nanoflow high-pressure pump system model CapLC (Waters, Manchester, UK). Samples (1 μL) were loaded on a 5 mm × 100 μm i.d. Zorbax™ 300 SB C18 trap column (Agilent Technologies, USA), and MCs were separated on a 15 cm × 100 μm i.d. Atlantis C18 capillary column at 1 μL/min flow rate, using aqueous 0.1% TFA (mobile phase A) and 0.1% TFA in 84% aqueous acetonitrile (mobile phase B). The chromatography was carried on by linear gradient at room temperature, according to the following programme: from 0% B at time 0 to 60% B in 40 minutes, then to 90% B in 5 minutes, at last to 0% B in 5 minutes; the equilibrium time between analyses was 5 minutes. LC-MS was performed operating in both (continuum) MS mode and in MS/MS mode for data dependent acquisition (DDA) of microcystin fragmentation spectra. The spectra were acquired at the speed of 1 scan/sec. The source conditions were the following: capillary voltage: 3000 V; cone Voltage: 100 V; Extractor: 0 V; RF Lens: 60. Raw data were processed by MassLynx™ version 3.5 software (Waters, Manchester, UK). Mass spectrometer calibration was carried out on the basis of the multiple charged ions from fibrinopeptide-Glu introduced separately.
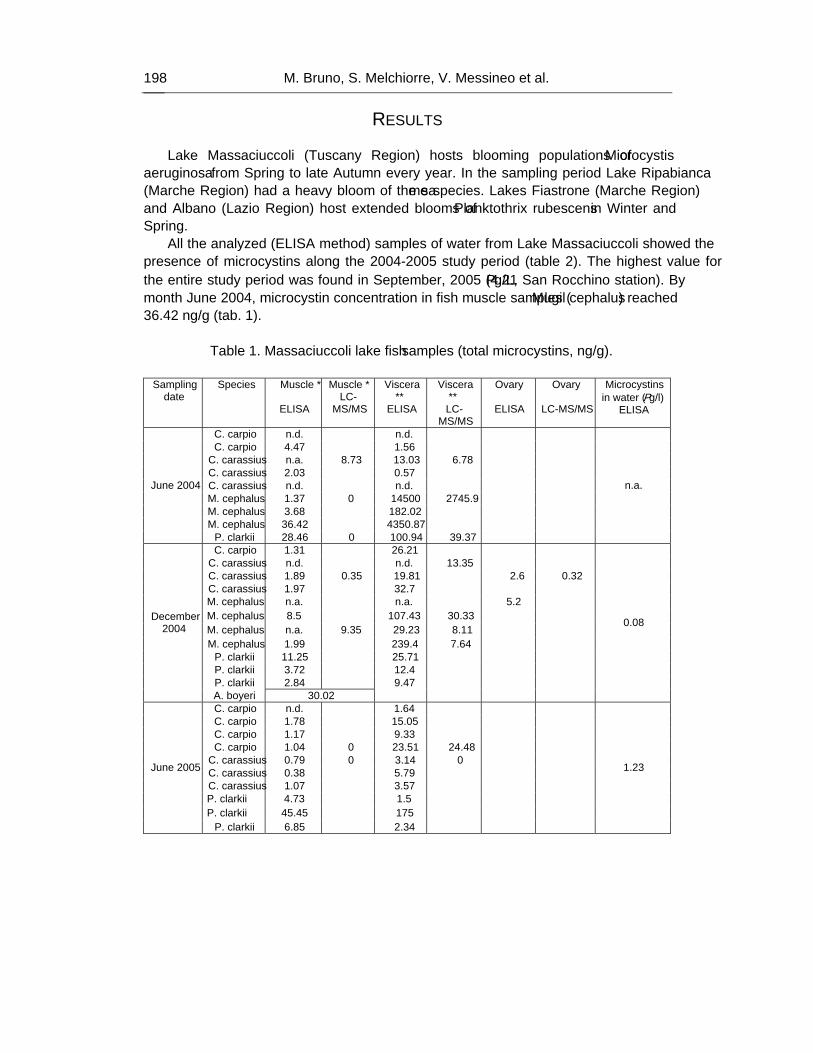
M. Bruno, S. Melchiorre, V. Messineo et al. 198
RESULTS Lake Massaciuccoli (Tuscany Region) hosts blooming populations of Microcystis
aeruginosa from Spring to late Autumn every year. In the sampling period Lake Ripabianca (Marche Region) had a heavy bloom of the same species. Lakes Fiastrone (Marche Region) and Albano (Lazio Region) host extended blooms of Planktothrix rubescens in Winter and Spring.
All the analyzed (ELISA method) samples of water from Lake Massaciuccoli showed the presence of microcystins along the 2004-2005 study period (table 2). The highest value for the entire study period was found in September, 2005 (4.21 μg/L, San Rocchino station). By month June 2004, microcystin concentration in fish muscle samples (Mugil cephalus) reached 36.42 ng/g (tab. 1).
Table 1. Massaciuccoli lake fish samples (total microcystins, ng/g).
Sampling
date Species Muscle *
ELISA
Muscle * LC-
MS/MS
Viscera **
ELISA
Viscera **
LC-MS/MS
Ovary
ELISA
Ovary
LC-MS/MS
Microcystins in water (μg/l)
ELISA
C. carpio n.d. n.d. C. carpio 4.47 1.56
C. carassius n.a. 8.73 13.03 6.78 C. carassius 2.03 0.57 C. carassius n.d. n.d. M. cephalus 1.37 0 14500 2745.9 M. cephalus 3.68 182.02 M. cephalus 36.42 4350.87
June 2004
P. clarkii 28.46 0 100.94 39.37
n.a.
C. carpio 1.31 26.21 C. carassius n.d. n.d. 13.35 C. carassius 1.89 0.35 19.81 2.6 C. carassius 1.97 32.7 M. cephalus n.a. n.a. 5.2 M. cephalus 8.5 107.43 30.33 M. cephalus n.a. 9.35 29.23 8.11 M. cephalus 1.99 239.4 7.64
P. clarkii 11.25 25.71 P. clarkii 3.72 12.4 P. clarkii 2.84 9.47
December 2004
A. boyeri 30.02
0.32
0.08
C. carpio n.d. 1.64 C. carpio 1.78 15.05 C. carpio 1.17 9.33 C. carpio 1.04 0 23.51 24.48
C. carassius 0.79 0 3.14 0 C. carassius 0.38 5.79 C. carassius 1.07 3.57 P. clarkii 4.73 1.5 P. clarkii 45.45 175
June 2005
P. clarkii 6.85 2.34
1.23
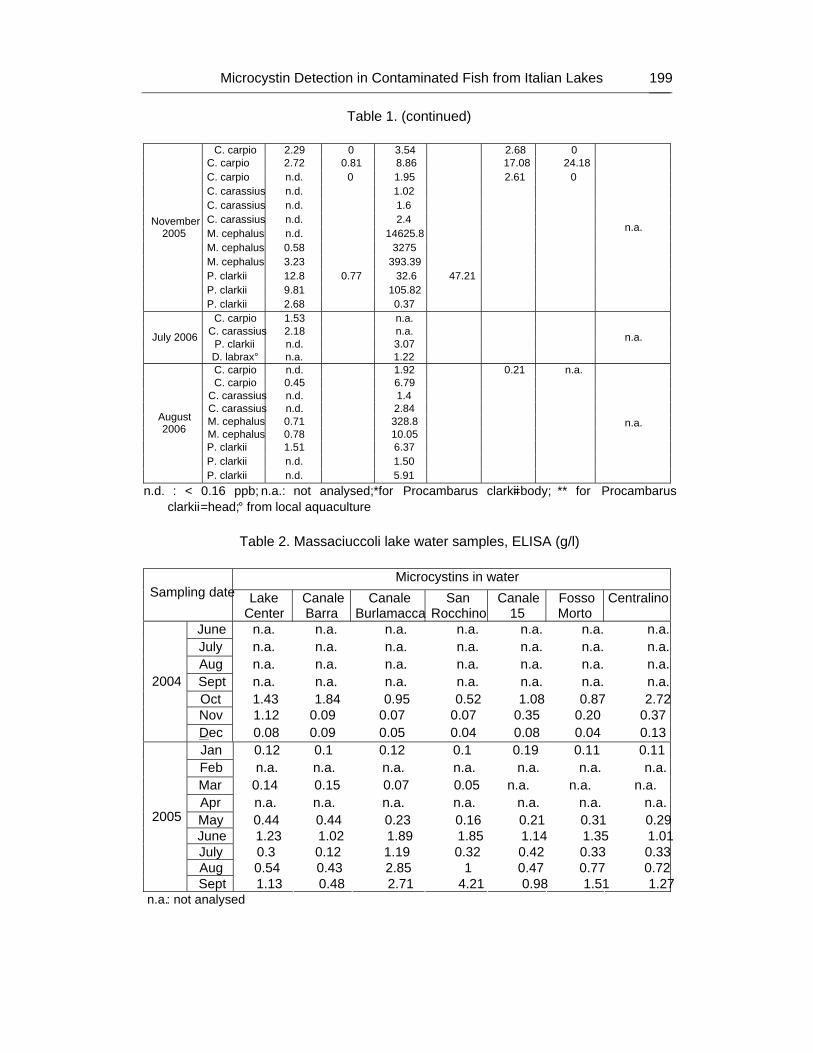
Microcystin Detection in Contaminated Fish from Italian Lakes … 199
Table 1. (continued)
C. carpio 2.29 0 3.54 2.68 0 C. carpio 2.72 0.81 8.86 17.08 24.18 C. carpio n.d. 0 1.95 2.61 0 C. carassius n.d. 1.02 C. carassius n.d. 1.6 C. carassius n.d. 2.4 M. cephalus n.d. 14625.8 M. cephalus 0.58 3275 M. cephalus 3.23 393.39 P. clarkii 12.8 0.77 32.6 47.21 P. clarkii 9.81 105.82
November 2005
P. clarkii 2.68 0.37
n.a.
C. carpio 1.53 n.a. C. carassius 2.18 n.a.
P. clarkii n.d. 3.07 July 2006
D. labrax° n.a. 1.22
n.a.
C. carpio n.d. 1.92 0.21 n.a. C. carpio 0.45 6.79
C. carassius n.d. 1.4 C. carassius n.d. 2.84 M. cephalus 0.71 328.8 M. cephalus 0.78 10.05 P. clarkii 1.51 6.37 P. clarkii n.d. 1.50
August 2006
P. clarkii n.d. 5.91
n.a.
n.d. : < 0.16 ppb; n.a.: not analysed; *for Procambarus clarkii=body; ** for Procambarus clarkii=head; ° from local aquaculture
Table 2. Massaciuccoli lake water samples, ELISA (�g/l)
Microcystins in water Sampling date Lake
Center Canale Barra
Canale Burlamacca
San Rocchino
Canale 15
Fosso Morto
Centralino
June n.a. n.a. n.a. n.a. n.a. n.a. n.a. July n.a. n.a. n.a. n.a. n.a. n.a. n.a. Aug n.a. n.a. n.a. n.a. n.a. n.a. n.a. Sept n.a. n.a. n.a. n.a. n.a. n.a. n.a. Oct 1.43 1.84 0.95 0.52 1.08 0.87 2.72 Nov 1.12 0.09 0.07 0.07 0.35 0.20 0.37
2004
Dec 0.08 0.09 0.05 0.04 0.08 0.04 0.13 Jan 0.12 0.1 0.12 0.1 0.19 0.11 0.11 Feb n.a. n.a. n.a. n.a. n.a. n.a. n.a. Mar 0.14 0.15 0.07 0.05 n.a. n.a. n.a. Apr n.a. n.a. n.a. n.a. n.a. n.a. n.a. May 0.44 0.44 0.23 0.16 0.21 0.31 0.29 June 1.23 1.02 1.89 1.85 1.14 1.35 1.01 July 0.3 0.12 1.19 0.32 0.42 0.33 0.33 Aug 0.54 0.43 2.85 1 0.47 0.77 0.72
2005
Sept 1.13 0.48 2.71 4.21 0.98 1.51 1.27 n.a.: not analysed
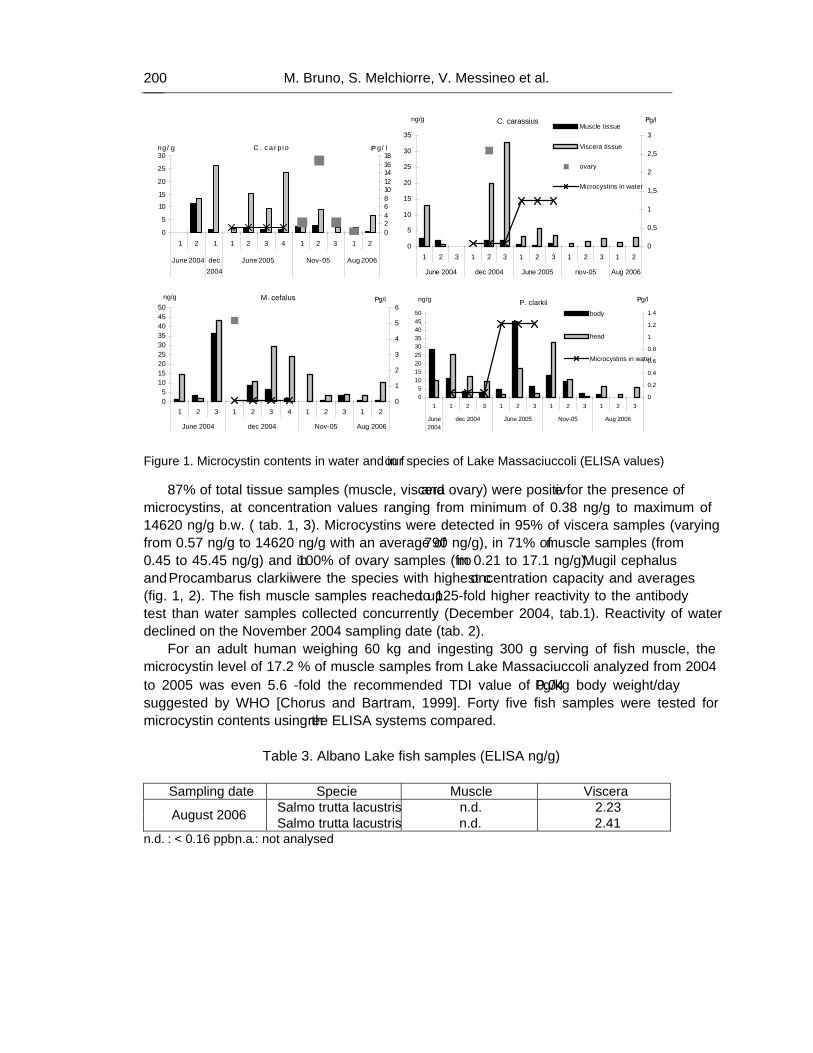
M. Bruno, S. Melchiorre, V. Messineo et al. 200
C. c a r pi o
0
5
10
15
20
25
30
1 2 1 1 2 3 4 1 2 3 1 2
June 2004 dec2004
June 2005 Nov-05 Aug 2006
ng/ g
024681012141618
μ g/ l
C. carassius
0
5
10
15
20
25
30
35
1 2 3 1 2 3 1 2 3 1 2 3 1 2
June 2004 dec 2004 June 2005 nov-05 Aug 2006
ng/g
0
0,5
1
1,5
2
2,5
3
μg/lMuscle tissue
Viscera tissue
ovary
Microcystins in water
M. cefalus
05
101520253035404550
1 2 3 1 2 3 4 1 2 3 1 2
June 2004 dec 2004 Nov-05 Aug 2006
ng/g
0
1
2
3
4
5
6μg/l
P. clarkii
05
101520253035404550
1 1 2 3 1 2 3 1 2 3 1 2 3
June2004
dec 2004 June 2005 Nov-05 Aug 2006
ng/g
0
0.2
0.4
0.6
0.8
1
1.2
1.4
μg/l
body
head
Microcystins in water
Figure 1. Microcystin contents in water and in four species of Lake Massaciuccoli (ELISA values)
87% of total tissue samples (muscle, viscera and ovary) were positive for the presence of microcystins, at concentration values ranging from minimum of 0.38 ng/g to maximum of 14620 ng/g b.w. ( tab. 1, 3). Microcystins were detected in 95% of viscera samples (varying from 0.57 ng/g to 14620 ng/g with an average of 790 ng/g), in 71% of muscle samples (from 0.45 to 45.45 ng/g) and in 100% of ovary samples (from 0.21 to 17.1 ng/g). Mugil cephalus and Procambarus clarkii were the species with highest concentration capacity and averages (fig. 1, 2). The fish muscle samples reached up to 125-fold higher reactivity to the antibody test than water samples collected concurrently (December 2004, tab.1). Reactivity of water declined on the November 2004 sampling date (tab. 2).
For an adult human weighing 60 kg and ingesting 300 g serving of fish muscle, the microcystin level of 17.2 % of muscle samples from Lake Massaciuccoli analyzed from 2004 to 2005 was even 5.6 -fold the recommended TDI value of 0.04 μg/kg body weight/day suggested by WHO [Chorus and Bartram, 1999]. Forty five fish samples were tested for microcystin contents using three ELISA systems compared.
Table 3. Albano Lake fish samples (ELISA ng/g)
Sampling date Specie Muscle Viscera
Salmo trutta lacustris n.d. 2.23 August 2006 Salmo trutta lacustris n.d. 2.41 n.d. : < 0.16 ppb; n.a.: not analysed
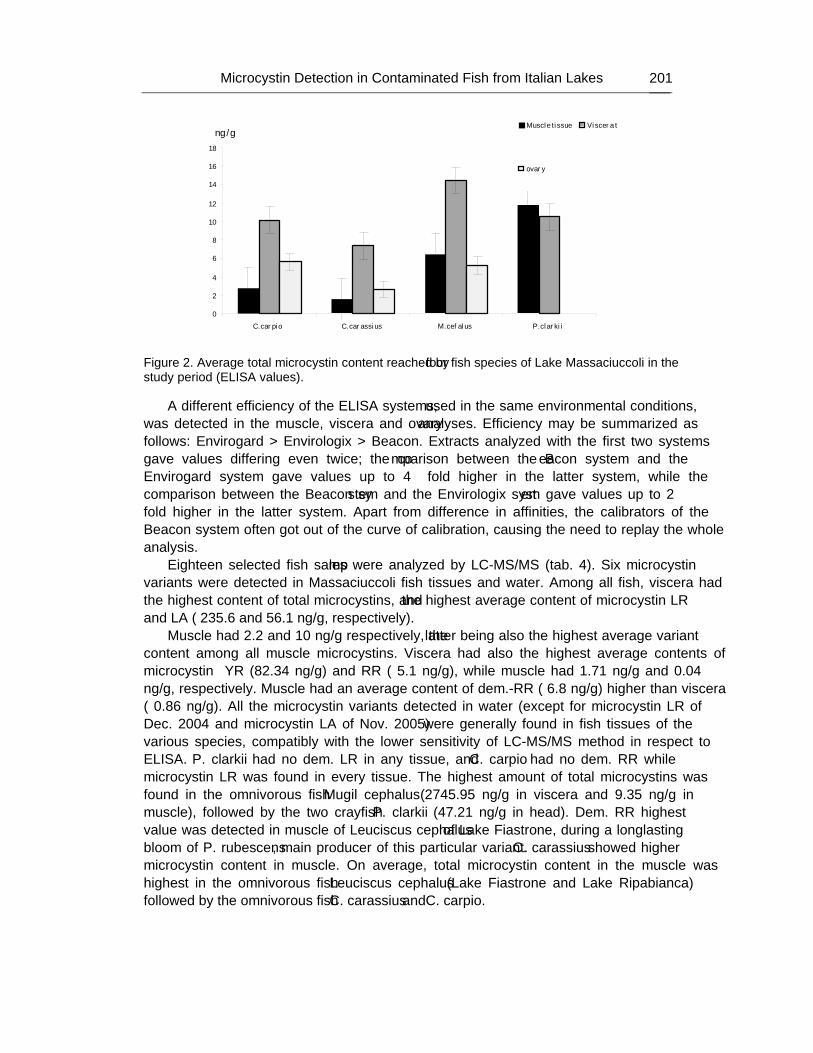
Microcystin Detection in Contaminated Fish from Italian Lakes … 201
0
2
4
6
8
10
12
14
16
18
C.car pio C.car assius M.cef alus P.clar ki i
ng/gMuscle ti ssue Viscer a t
ovar y
Figure 2. Average total microcystin content reached by four fish species of Lake Massaciuccoli in the study period (ELISA values).
A different efficiency of the ELISA systems, used in the same environmental conditions, was detected in the muscle, viscera and ovary analyses. Efficiency may be summarized as follows: Envirogard > Envirologix > Beacon. Extracts analyzed with the first two systems gave values differing even twice; the comparison between the Beacon system and the Envirogard system gave values up to 4 – fold higher in the latter system, while the comparison between the Beacon system and the Envirologix system gave values up to 2 – fold higher in the latter system. Apart from difference in affinities, the calibrators of the Beacon system often got out of the curve of calibration, causing the need to replay the whole analysis.
Eighteen selected fish samples were analyzed by LC-MS/MS (tab. 4). Six microcystin variants were detected in Massaciuccoli fish tissues and water. Among all fish, viscera had the highest content of total microcystins, and the highest average content of microcystin –LR and –LA ( 235.6 and 56.1 ng/g, respectively).
Muscle had 2.2 and 10 ng/g respectively, the latter being also the highest average variant content among all muscle microcystins. Viscera had also the highest average contents of microcystin – YR (82.34 ng/g) and –RR ( 5.1 ng/g), while muscle had 1.71 ng/g and 0.04 ng/g, respectively. Muscle had an average content of dem.-RR ( 6.8 ng/g) higher than viscera ( 0.86 ng/g). All the microcystin variants detected in water (except for microcystin –LR of Dec. 2004 and microcystin –LA of Nov. 2005) were generally found in fish tissues of the various species, compatibly with the lower sensitivity of LC-MS/MS method in respect to ELISA. P. clarkii had no dem. –LR in any tissue, and C. carpio had no dem. –RR while microcystin –LR was found in every tissue. The highest amount of total microcystins was found in the omnivorous fish Mugil cephalus (2745.95 ng/g in viscera and 9.35 ng/g in muscle), followed by the two crayfish P. clarkii (47.21 ng/g in head). Dem. –RR highest value was detected in muscle of Leuciscus cephalus of Lake Fiastrone, during a long–lasting bloom of P. rubescens, main producer of this particular variant. C. carassius showed higher microcystin content in muscle. On average, total microcystin content in the muscle was highest in the omnivorous fish Leuciscus cephalus (Lake Fiastrone and Lake Ripabianca) followed by the omnivorous fish C. carassius and C. carpio.
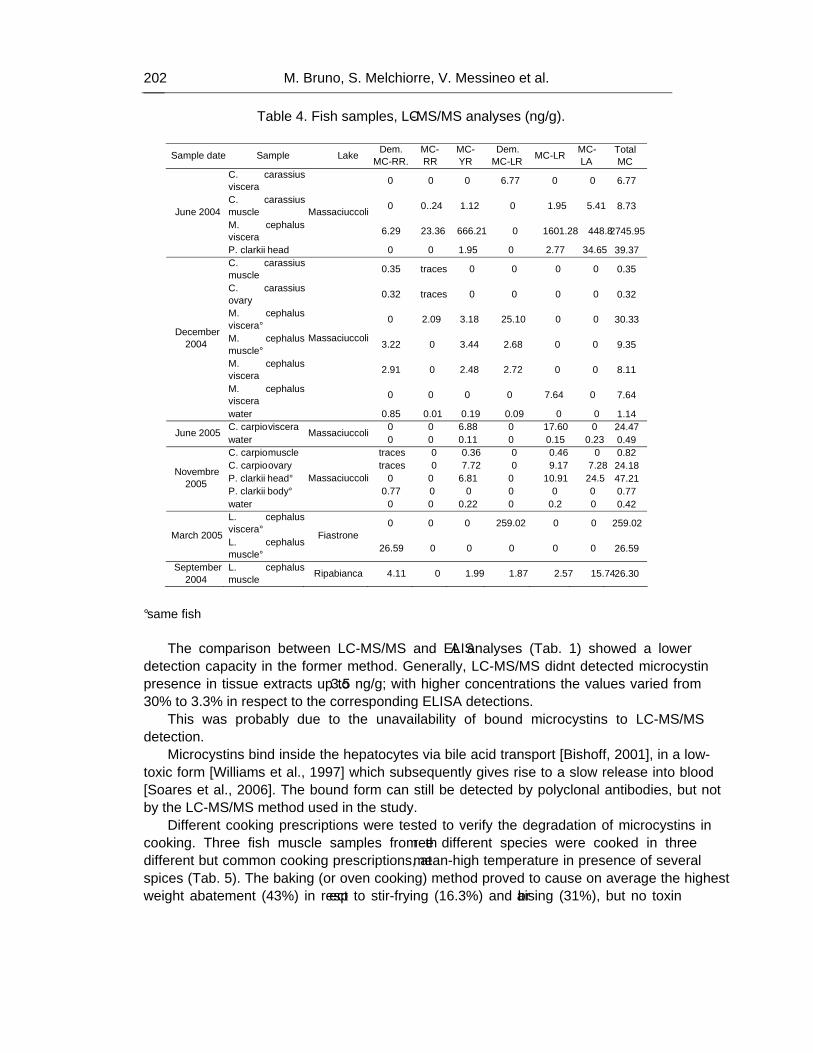
M. Bruno, S. Melchiorre, V. Messineo et al. 202
Table 4. Fish samples, LC-MS/MS analyses (ng/g).
Sample date Sample Lake Dem. MC-RR.
MC-RR
MC-YR
Dem. MC-LR MC-LR MC-
LA Total MC
C. carassius viscera 0 0 0 6.77 0 0 6.77
C. carassius muscle 0 0..24 1.12 0 1.95 5.41 8.73
M. cephalus viscera 6.29 23.36 666.21 0 1601.28 448.8 2745.95
June 2004
P. clarkii head
Massaciuccoli
0 0 1.95 0 2.77 34.65 39.37 C. carassius muscle 0.35 traces 0 0 0 0 0.35
C. carassius ovary 0.32 traces 0 0 0 0 0.32
M. cephalus viscera° 0 2.09 3.18 25.10 0 0 30.33
M. cephalus muscle° 3.22 0 3.44 2.68 0 0 9.35
M. cephalus viscera 2.91 0 2.48 2.72 0 0 8.11
M. cephalus viscera 0 0 0 0 7.64 0 7.64
December 2004
water
Massaciuccoli
0.85 0.01 0.19 0.09 0 0 1.14 C. carpio viscera 0 0 6.88 0 17.60 0 24.47 June 2005 water
Massaciuccoli0 0 0.11 0 0.15 0.23 0.49
C. carpio muscle traces 0 0.36 0 0.46 0 0.82 C. carpio ovary traces 0 7.72 0 9.17 7.28 24.18 P. clarkii head° 0 0 6.81 0 10.91 24.5 47.21 P. clarkii body° 0.77 0 0 0 0 0 0.77
Novembre 2005
water
Massaciuccoli
0 0 0.22 0 0.2 0 0.42 L. cephalus viscera° 0 0 0 259.02 0 0 259.02
March 2005 L. cephalus muscle°
Fiastrone 26.59 0 0 0 0 0 26.59
September 2004
L. cephalus muscle Ripabianca 4.11 0 1.99 1.87 2.57 15.74 26.30
° same fish
The comparison between LC-MS/MS and ELISA analyses (Tab. 1) showed a lower
detection capacity in the former method. Generally, LC-MS/MS didn’t detected microcystin presence in tissue extracts up to 3.5 ng/g; with higher concentrations the values varied from 30% to 3.3% in respect to the corresponding ELISA detections.
This was probably due to the unavailability of bound microcystins to LC-MS/MS detection.
Microcystins bind inside the hepatocytes via bile acid transport [Bishoff, 2001], in a low-toxic form [Williams et al., 1997] which subsequently gives rise to a slow release into blood [Soares et al., 2006]. The bound form can still be detected by polyclonal antibodies, but not by the LC-MS/MS method used in the study.
Different cooking prescriptions were tested to verify the degradation of microcystins in cooking. Three fish muscle samples from three different species were cooked in three different but common cooking prescriptions, at mean-high temperature in presence of several spices (Tab. 5). The baking (or oven cooking) method proved to cause on average the highest weight abatement (43%) in respect to stir-frying (16.3%) and braising (31%), but no toxin
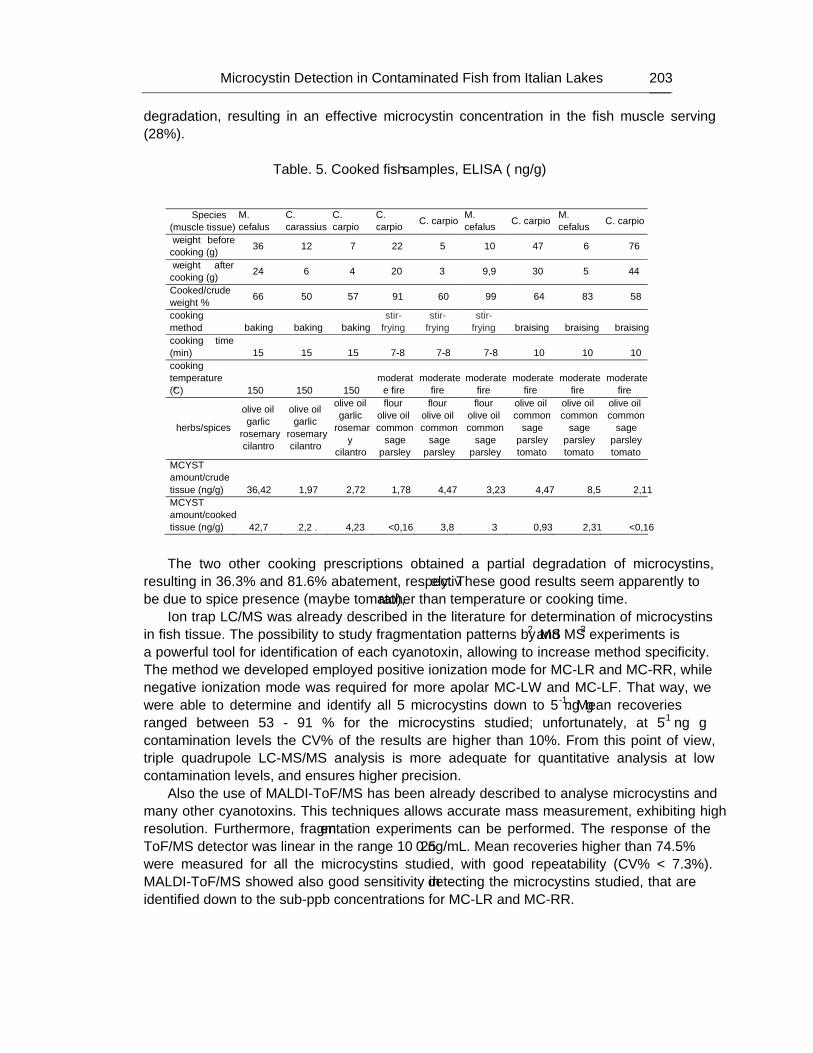
Microcystin Detection in Contaminated Fish from Italian Lakes … 203
degradation, resulting in an effective microcystin concentration in the fish muscle serving (28%).
Table. 5. Cooked fish samples, ELISA ( ng/g)
Species (muscle tissue)
M. cefalus
C. carassius
C. carpio
C. carpio C. carpio M.
cefalus C. carpio M. cefalus C. carpio
weight before cooking (g) 36 12 7 22 5 10 47 6 76
weight after cooking (g) 24 6 4 20 3 9,9 30 5 44
Cooked/crude weight % 66 50 57 91 60 99 64 83 58
cooking method baking baking baking
stir-frying
stir-frying
stir-frying braising braising braising
cooking time (min) 15 15 15 7-8 7-8 7-8 10 10 10 cooking temperature (°C) 150 150 150
moderate fire
moderate fire
moderate fire
moderate fire
moderate fire
moderate fire
herbs/spices
olive oil garlic
rosemary cilantro
olive oil garlic
rosemary cilantro
olive oil garlic
rosemary
cilantro
flour olive oil common
sage parsley
flour olive oil common
sage parsley
flour olive oil common
sage parsley
olive oil common
sage parsley tomato
olive oil common
sage parsley tomato
olive oil common
sage parsley tomato
MCYST amount/crude tissue (ng/g) 36,42 1,97 2,72 1,78 4,47 3,23 4,47 8,5 2,11 MCYST amount/cooked tissue (ng/g) 42,7 2,2 . 4,23 <0,16 3,8 3 0,93 2,31 <0,16 The two other cooking prescriptions obtained a partial degradation of microcystins,
resulting in 36.3% and 81.6% abatement, respectively. These good results seem apparently to be due to spice presence (maybe tomato), rather than temperature or cooking time.
Ion trap LC/MS was already described in the literature for determination of microcystins in fish tissue. The possibility to study fragmentation patterns by MS2 and MS3 experiments is a powerful tool for identification of each cyanotoxin, allowing to increase method specificity. The method we developed employed positive ionization mode for MC-LR and MC-RR, while negative ionization mode was required for more apolar MC-LW and MC-LF. That way, we were able to determine and identify all 5 microcystins down to 5 ng g-1. Mean recoveries ranged between 53 - 91 % for the microcystins studied; unfortunately, at 5 ng g-1 contamination levels the CV% of the results are higher than 10%. From this point of view, triple quadrupole LC-MS/MS analysis is more adequate for quantitative analysis at low contamination levels, and ensures higher precision.
Also the use of MALDI-ToF/MS has been already described to analyse microcystins and many other cyanotoxins. This techniques allows accurate mass measurement, exhibiting high resolution. Furthermore, fragmentation experiments can be performed. The response of the ToF/MS detector was linear in the range 10 – 250 ng/mL. Mean recoveries higher than 74.5% were measured for all the microcystins studied, with good repeatability (CV% < 7.3%). MALDI-ToF/MS showed also good sensitivity in detecting the microcystins studied, that are identified down to the sub-ppb concentrations for MC-LR and MC-RR.
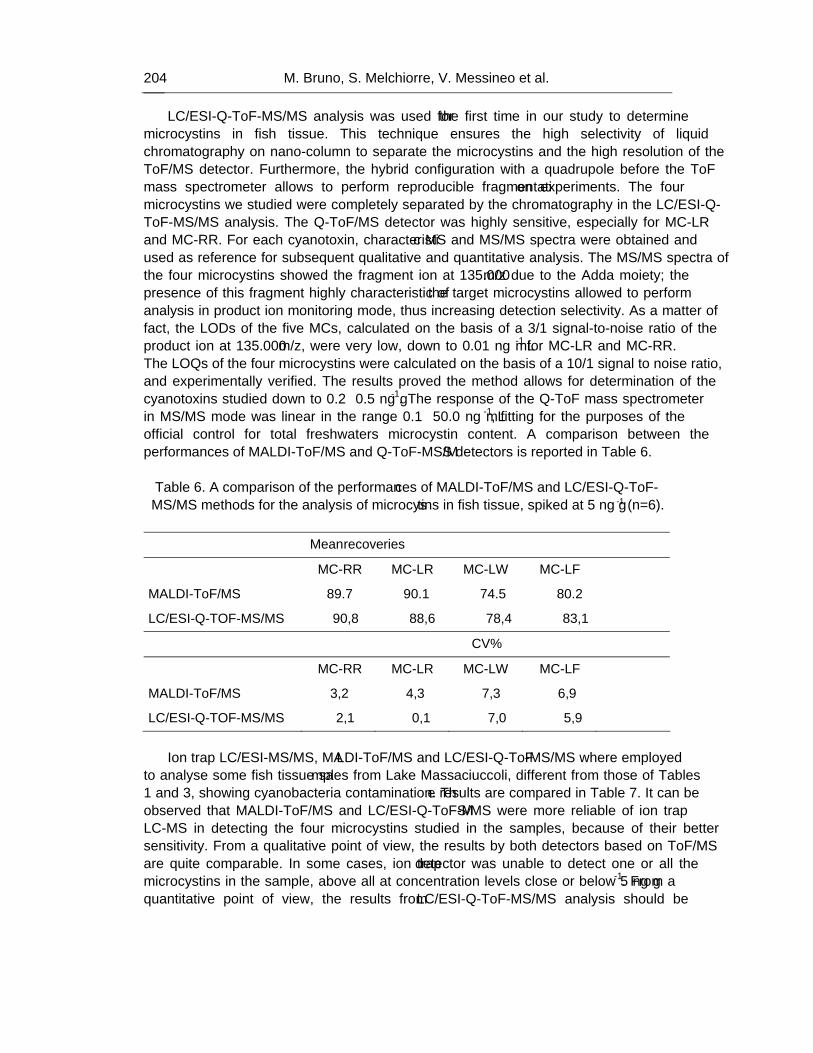
M. Bruno, S. Melchiorre, V. Messineo et al. 204
LC/ESI-Q-ToF-MS/MS analysis was used for the first time in our study to determine microcystins in fish tissue. This technique ensures the high selectivity of liquid chromatography on nano-column to separate the microcystins and the high resolution of the ToF/MS detector. Furthermore, the hybrid configuration with a quadrupole before the ToF mass spectrometer allows to perform reproducible fragmentation experiments. The four microcystins we studied were completely separated by the chromatography in the LC/ESI-Q-ToF-MS/MS analysis. The Q-ToF/MS detector was highly sensitive, especially for MC-LR and MC-RR. For each cyanotoxin, characteristic MS and MS/MS spectra were obtained and used as reference for subsequent qualitative and quantitative analysis. The MS/MS spectra of the four microcystins showed the fragment ion at 135.000 m/z due to the Adda moiety; the presence of this fragment highly characteristic of the target microcystins allowed to perform analysis in product ion monitoring mode, thus increasing detection selectivity. As a matter of fact, the LODs of the five MCs, calculated on the basis of a 3/1 signal-to-noise ratio of the product ion at 135.000 m/z, were very low, down to 0.01 ng mL-1 for MC-LR and MC-RR. The LOQs of the four microcystins were calculated on the basis of a 10/1 signal to noise ratio, and experimentally verified. The results proved the method allows for determination of the cyanotoxins studied down to 0.2 – 0.5 ng g-1. The response of the Q-ToF mass spectrometer in MS/MS mode was linear in the range 0.1 – 50.0 ng mL-1, fitting for the purposes of the official control for total freshwaters microcystin content. A comparison between the performances of MALDI-ToF/MS and Q-ToF-MS/MS detectors is reported in Table 6.
Table 6. A comparison of the performances of MALDI-ToF/MS and LC/ESI-Q-ToF-
MS/MS methods for the analysis of microcystins in fish tissue, spiked at 5 ng g-1 (n=6).
Mean recoveries
MC-RR MC-LR MC-LW MC-LF
MALDI-ToF/MS 89.7 90.1 74.5 80.2
LC/ESI-Q-TOF-MS/MS 90,8 88,6 78,4 83,1
CV%
MC-RR MC-LR MC-LW MC-LF
MALDI-ToF/MS 3,2 4,3 7,3 6,9
LC/ESI-Q-TOF-MS/MS 2,1 0,1 7,0 5,9
Ion trap LC/ESI-MS/MS, MALDI-ToF/MS and LC/ESI-Q-ToF-MS/MS where employed
to analyse some fish tissue samples from Lake Massaciuccoli, different from those of Tables 1 and 3, showing cyanobacteria contamination. The results are compared in Table 7. It can be observed that MALDI-ToF/MS and LC/ESI-Q-ToF-MS/MS were more reliable of ion trap LC-MS in detecting the four microcystins studied in the samples, because of their better sensitivity. From a qualitative point of view, the results by both detectors based on ToF/MS are quite comparable. In some cases, ion trap detector was unable to detect one or all the microcystins in the sample, above all at concentration levels close or below 5 ng g-1. From a quantitative point of view, the results from LC/ESI-Q-ToF-MS/MS analysis should be
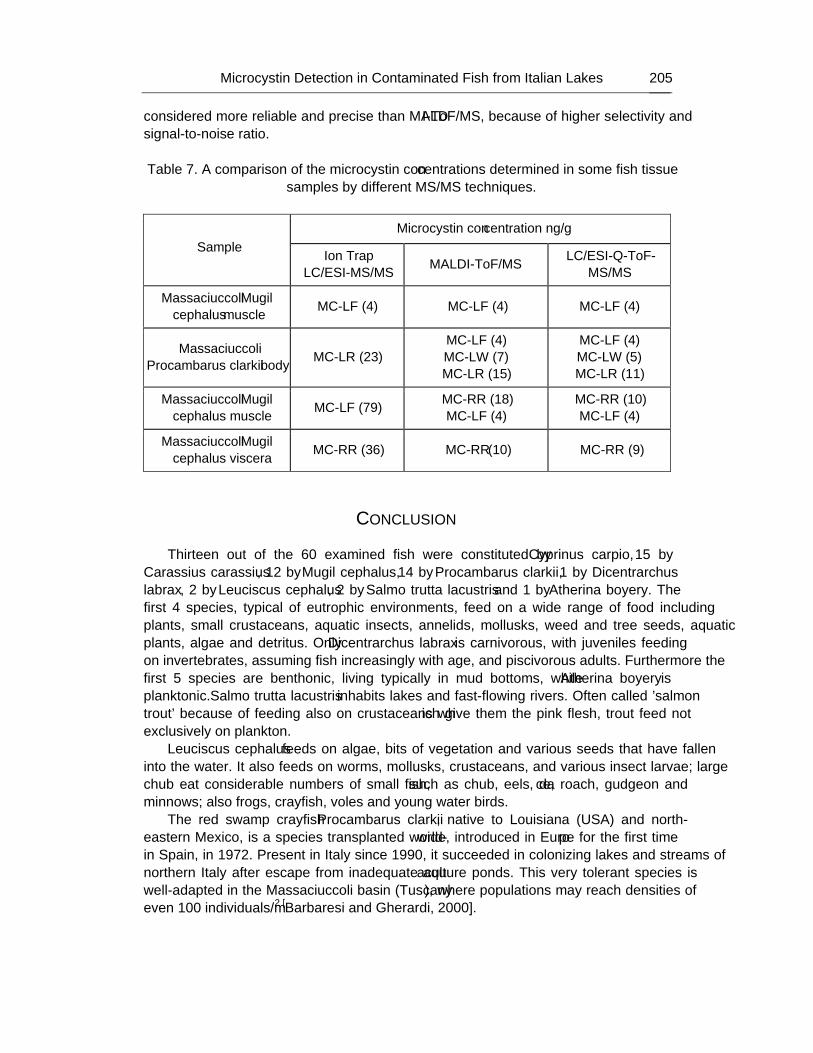
Microcystin Detection in Contaminated Fish from Italian Lakes … 205
considered more reliable and precise than MALDI-ToF/MS, because of higher selectivity and signal-to-noise ratio.
Table 7. A comparison of the microcystin concentrations determined in some fish tissue
samples by different MS/MS techniques.
Microcystin concentration ng/g Sample Ion Trap
LC/ESI-MS/MS MALDI-ToF/MS LC/ESI-Q-ToF- MS/MS
Massaciuccoli Mugil cephalus muscle MC-LF (4) MC-LF (4) MC-LF (4)
Massaciuccoli Procambarus clarkii body MC-LR (23)
MC-LF (4) MC-LW (7) MC-LR (15)
MC-LF (4) MC-LW (5) MC-LR (11)
Massaciuccoli Mugil cephalus muscle MC-LF (79) MC-RR (18)
MC-LF (4) MC-RR (10) MC-LF (4)
Massaciuccoli Mugil cephalus viscera MC-RR (36) MC-RR (10) MC-RR (9)
CONCLUSION Thirteen out of the 60 examined fish were constituted by Cyprinus carpio, 15 by
Carassius carassius, 12 by Mugil cephalus, 14 by Procambarus clarkii, 1 by Dicentrarchus labrax, 2 by Leuciscus cephalus, 2 by Salmo trutta lacustris and 1 by Atherina boyery. The first 4 species, typical of eutrophic environments, feed on a wide range of food including plants, small crustaceans, aquatic insects, annelids, mollusks, weed and tree seeds, aquatic plants, algae and detritus. Only Dicentrarchus labrax is carnivorous, with juveniles feeding on invertebrates, assuming fish increasingly with age, and piscivorous adults. Furthermore the first 5 species are benthonic, living typically in mud bottoms, while Atherina boyery is planktonic. Salmo trutta lacustris inhabits lakes and fast-flowing rivers. Often called 'salmon trout' because of feeding also on crustaceans which give them the pink flesh, trout feed not exclusively on plankton.
Leuciscus cephalus feeds on algae, bits of vegetation and various seeds that have fallen into the water. It also feeds on worms, mollusks, crustaceans, and various insect larvae; large chub eat considerable numbers of small fish, such as chub, eels, dace, roach, gudgeon and minnows; also frogs, crayfish, voles and young water birds.
The red swamp crayfish Procambarus clarkii, native to Louisiana (USA) and north-eastern Mexico, is a species transplanted world-wide, introduced in Europe for the first time in Spain, in 1972. Present in Italy since 1990, it succeeded in colonizing lakes and streams of northern Italy after escape from inadequate aquaculture ponds. This very tolerant species is well-adapted in the Massaciuccoli basin (Tuscany), where populations may reach densities of even 100 individuals/m2 [Barbaresi and Gherardi, 2000].
M. Bruno, S. Melchiorre, V. Messineo et al. 206
Cyanobacteria are normal components of the diet of cyprinids, which feed on non toxic strains of M. aeruginosa in field conditions [Northcott et al., 1991]. In our study, evidences confirmed the observations of Chen et al. [2006], where cyprinids (silver carp) seem to accumulate less microcystins in muscle than other species.
A negative correlation was found between water and fish muscle microcystin concentrations (ELISA results, Dec. 2004-Jun. 2005). Some studies measuring microcystin abundances in seston and fish muscle samples provided a similar negative relationship [Magalhaes et al., 2001; Smith et al., 2006; Wood et al., 2006; Wilson et al., 2008]. Other studies showed positive relations [Magalhaes et al., 2003; Chen et al., 2006]. The different feeding modes of the various fish species may be one reason why microcystins are detected even when M. aeruginosa blooms are absent; studies provided evidence that routes other than the gastrointestinal tract are important for the uptake of microcystins by fish [ Tencalla et al., 1994; Xie et al., 2005]. According to Wilson et al., microcystin concentrations in fish are a direct consequence of various concurrent factors, like circulation of waters and accumulation in planktonic preys during seasonal succession of cyanobacterial populations, or time lag among various biological components. These variations may be responsible for different evidences in the field studies where parameters may be investigated with different approaches (e. g. extracellular and intracellular microcystin contents). In our study we found that ELISA measurements of total microcystins in water may be significantly higher if, instead of analyzing the whole water sample (e. g. after sonication), the intracellular and extracellular compartments are separately analyzed, and the resulting amounts summarized.
Elevated microcystin concentrations may be found with low cell abundances [Wood et al., 2006]. Thus, in case of toxin persistence after cell lysis and death, cell counts alone may not give a valuable indication on microcystin concentrations in order to avoid toxicological consequences.
In our study different microcystin values were detected in ELISA and triple quadrupole LC-MS/MS analyses of the same samples.
Differences in microcystin total concentrations measured by triple quadrupole LC-MS/MS or ELISA in fish tissue have been observed in other studies [Magalhaes et al., 2001; Lawrence et al., 2001; Rapala et al., 2002; Mountford et al., 2004; Wood et al., 2006]. LC-MS/MS in this study only screened for six variants, so it is possible that not all the microcystins contained in samples were detected. The same extraction techniques were adopted for the immunological and instrumental analyses, in order to perform both kinds of measurement starting from the same extraction efficiency. Yuan et al. [2006] provided evidence that the utilized instrumental techniques have basic importance in measurement equivalence (e.g. between ELISA and LC-MS/MS results). The availability of free and bound microcystins to our LC-MS/MS analytical method could give reason for the differences found in our results.
Tencalla et al. [1994] showed that trout died within 96 hours when gavaged with freeze-dried Microcystis at a dose of 6.6 mg of microcystin kg-1 b.w. The presence of a concentration varying from 4 to 14 μg/g in several viscera samples suggests that microcystin concentrations in these fish of Lake Massaciuccoli were close to a sub-lethal or lethal level.
However, microcystins can accumulate in fish to levels that although not lethal to the fish, may lead to levels that are above the recommended limits of microcystin consumption for drinking water.
Microcystin Detection in Contaminated Fish from Italian Lakes … 207
Regarding confirmatory analysis by mass spectrometry techniques, it is recognised that MALDI-ToF/MS can detect all the compounds present in the sample, within a wide range of mass-to-charge ratio. The accurate mass measurements are helpful in identifying the substance. Usually, this techniques is less sensitive and repeatable than triple quadrupole and ion trap LC-MS, therefore it is not the best choice for quantitative analysis. On the contrary, MALDI-ToF/MS resulted a powerful tool for rapid screening over a wide mass range, allowing the simultaneous detection of cyanotoxins from different groups in a single experiment.
In this study, for the first time is described LC/ESI-Q-ToF-MS/MS analysis of fish tissues. The method showed high mean recoveries, and was highly specific, because of chromatographic separation, selective isolation of the ion at 135.000 m/z and ToF detector resolution. No matrix interference from uncontaminated fish samples was observed at the retention times of the four microcystins studied. This technique exhibited the best results in terms of sensitivity, mean recoveries and repeatability (expressed as CV%).
The Q-ToF mass spectrometry detector is highly sensitive and repeatable; the low LOQ value account for the potency of this analytical tool in detecting even early microcystin contamination in fish tissue. Of course, the Q-ToF mass spectrometry detector can be used also for wide mass range screening of the compound in the sample, although a different mechanism for sample ionization is applied in respect to MALDI-ToF/MS instrument. It is noteworthy that LC/ESI-Q-ToF-MS/MS analysis was successfully applied to elucidate the molecular structure of a new microcystin from Planktothrix rubescens bloom in a lake near Naples in Southern Italy (results submitted). Indeed, the possibility to obtain fragmentation patterns and to measure with high resolution the mass of product ions, allows to study the molecular structure of unknown compound, even when non common modification of the backbone and/or variable aminoacids are present.
In conclusion, this study demonstrates that the occurrence of microcystins in aquatic fauna is a widespread phenomenon in several freshwaters in Italy, needing adequate and multiple analytical techniques for effective detection, and that proactive measures should be taken, before microcystins reach in water and fish tissue concentrations deemed a health risk.
REFERENCES
Baganz, D; Staaks, G; Pflugmacher, S; Steinberg, CEW. A comparative study on microcystin-LR induced behavioural changes of two fish species (Danio rerio and Leucaspius delineatus). Environ Toxicol 2004 19, 564-570.
Barbaresi, S; Gherardi, F. The invasion of the alien crayfish Procambarus clarkii in Europe, with particular reference to Italy. Biological Invasions 2000 2, 259-264.
Bischoff, K. The toxicology of microcystin-LR: occurrence, toxicokynetics, toxicodynamics, diagnosis and treatment. Vet Human Toxicol 2001 43(5), 294-297.
Bogialli, S; Bruno, M; Curini, R; Di Corcia, A; Fanali, C; Laganà, A. Monitoring algal toxins in lake water by Liquid Chromatography tandem Mass Spectrometry. Environ Sci Technol 2006 40, 2917-2923.
Bogialli, S; Bruno, M; Curini, R; Di Corcia, A; Laganà, A; Mari, B. Simple assay for analyzing five microcystins and nodularin in fish muscle tissue: hot water extraction
M. Bruno, S. Melchiorre, V. Messineo et al. 208
followed by Liquid Chromatography-tandem Mass Spectrometry. J Agric Food Chem 2005 53, 6586-6592.
Cazenave, J; Wunderlin, DA; de los Angeles Bistoni, M; Ame, MV; Krause, E; Pflugmacher, S; Wiegend, C. Uptake, tissue distribution and accumulation of microcystin-RR in Corydoras paleatus, Jenynsia multidentata and Odontesthes bonariensis. A field and laboratory study. Aquatic Toxicology 2005 75, 178-190.
Chen, J; Xie, P; Zhang, D; Ke, Z; Yang, H. In situ studies on the bioaccumulation of microcystins in the phytoplanktivorous silver carp stocked in Lake Taihu with dense toxic Microcystis blooms. Aquaculture 2006 261, 1026-1028.
Chen, J; Xie, P; Zhang, D; Ke, Z; Yang, H. In situ studies on the bioaccumulation of microcystins in the phytoplanktivorous silver carp (Hypophthalmichthys molitix) stocked in Lake Taihu with dense toxin Microcystis blooms. Aquaculture 2006 261, 1026-1038.
Chorus, I ; Bartram, J. Toxic cyanobacteria in water: A guide to their public health consequences, monitoring and management. London: E & FN Spon, on behalf of the World Health Organization, Geneva; 1999.
Chu, FS; Huang, X; Wie, RD; Carmichael, WW. Production and characterization of antibodies against microcystins. Appl Environ Microbiol 1989 55, 1928-1933.
Codd, GA. Cyanobacterial toxins: occurrence, properties and biological significance. Water Sci Technol 1995 32, 149-156.
Dawson, RM.. The toxicology of microcystins. Toxicon 1998 36, 953-962. Ernst, B; Hoeger, SJ; O’Brien, E; Dietrich, DR. Oral toxicity of the microcystin- containing
cyanobacteium Planktothrix rubescens in European whitefish (Coregonus lavaretus). Aquatic Toxicology 2006 79, 31-40.
Fischer, WJ; Dietrich, DR. Pathological and biochemical characterisation of microcystin-induced hepatopancreas and kidney damage in carp. Toxicol Appl Pharmacol 2000 164, 73-81.
Fischer, WJ; Sltheimer, S; Cattori, V; Meier, PJ; Dietrich, DR; Hagenbuch, B. Organic anion transporting polypeptides expressed in liver and brain mediate uptake of microcystin. Toxicol Appl Pharmacol 2005 203, 257-263.
Grosse, Y; Baan, R; Secretan, B; Straif, K; El Ghissassi, F; Cogliano, V. Carcinogenicity of nitrate, nitrite, and cyanobacterial peptide toxins. 2006 7, 628-629. Available from: http://oncology.thelancet.com
Ito, E; Takai, A; Kondo, F; Masui, H; Imanishi, S; Harada, K. Comparison of protein phospatase inhibitory activity and apparent toxicity of microcystins and related compound. Toxicon 2002 40, 1017-1025.
Jewel, MA; Affan, MA; Khan, S. Fish mortality due to cyanobacterial bloom in an aquaculture pond in Bangladesh. Pakistan Journal of Biological Science 2003 6, 1046-1050
Lawrence, JF; Menard, C. Determination of microcystins in blue-green algae, fish and water using liquid chromatography with ultraviolet detection after sample clean-up employing immuniaffinity chromatography. J Chromatogr A 2001 922, 111-117.
Lawton, LA; Edwards, C. Conventional laboratory methods for cyanotoxins. In: Hudnell KH editor. Cyanobacterial Harmful Algal Blooms: State of the Science and Research Needs. Series: Advances in Experimental Medicine and Biology. Springer, 2008 Vol. 619, pp. 513-537.
Microcystin Detection in Contaminated Fish from Italian Lakes … 209
Magalhaes, VF; Marinhao, MM; Domingos, P; Oliverira, AC; Costa, SM; Azevedo LO; Azevedo, SMFO. Microcystins (cyanobacterial hepatotoxins) bioaccumulation in fish and crustaceans from Sepetiba Bay (Brasil, RJ). Toxicon 2003 42, 289-295.
Magalhaes, VF; Moraes Soares, R; Azevedo, SMFO. Microcystin contamination in fish from the Jacarepagua Lagoon (Rio de Janeiro, Brazil): ecological implication and human health risk. Toxicon 2001 39, 1077-1085.
Malbrouck, C; Kestemont, P. Effect of microcystins on fish. Environmental Toxicology and Chemistry 2006 25 (1), 72-86.
Messineo, V; Melchiorre, S; Di Corcia, A; Gallo, P; Bruno, M. Seasonal succession of Cylindrospermopsis raciborskii and Aphanizomenon ovalisporum blooms with cylindrospermopsin occurrence in the volcanic lake Albano, Central Italy. Environ Toxicol 2008 in press.
Metcalf, JS; Beattie, KA; Pflugmacher, S; Codd, GA. Immunocrossreactivity and toxicity assessment of conjugation products of the cyanobacterial toxin, microcystin-LR. FEMS Microbiol Lett 2000 189, 155-158.
Mohamed, ZA; Carmichael, WW; Hussein, AA.. Estimation of microcystin in the freshwater fish Oreochromis niloticus in an Egyptian fish farm containing a microcystin bloom. Environmental toxicol 2003 18, 137-141.
Nishiwaki-Matushima, R; Nishiwaki, S; Ohta, T; Yoszawa, S; Suganuma, M; Harada, K; Watanabe, MF; Fujiki, H. Structure–function relationships of microcystins, liver-tumor promoters, in interaction with protein phosphatase. Jpn J Cancer Res 1991 82, 993-996.
Nishiwaki-Matushima, R; Ohta, T; Nishiwaki, S; Suganuma, M; Yoszawa, S; Kohyama, K; Ishikaawa, T; Carmichael, WW; Fujiki, H. Liver tumor promotion by the cyanobacterial cyclic peptide toxin microcystins-LR. J Cancer Res Clin 1992 118, 420-424.
Northcott, ME; Beveridge, MCM; Ross, LG. A laboratory investigation on the filtration and ingestion rates of the tilapia Oreochromis niloticus, feeding on two species of blue-green algae. Environ Biol of Fishes 1991 31,75-85.
Rapala, J; Kirsti, E; Jaana; Sivonen K; Lahti, K. Detection of microcystins with protein phosphatase inhibition assay, high-performance liquid chromatography–UV detection and enzyme-linked immunosorbent assay, comparison of methods. Anal Chim Acta 2002 466 (2), 213–231.
Smith, JL; Haney, JF. Foodweb transfer, accumulation and depuration of microcystins, a cyanobacterial toxin in pump-kinseed sunfish (Lepomis gibbosus). Toxicon 2006 48, 580-589.
Soares, MR; Yuan, M; Servaites, JC; Delgado, A; Magalhaes, VF; Hilborn, ED; Carmichael, WW; Azevedo, SMFO. Sublethal exposure from microcystins to renal insufficiency patients in Rio de Janeiro, Brazil. Environmental Toxicology 2006 21, 95-103.
Tencalla, F; Dietrich, DR. Biochemical characterisation of microcystin toxicity in trout (Oncorhynchus mykiss). Toxicon 1997 35, 583-595.
Tencalla, FG; Dietrich, DR; Schlatter, C. Toxicity of Microcystin aeruginosa peptide toxin to yearlingrainbow trout (Oncorynchuss mykiss). Aquat Toxicol 1994 30, 215-224.
Welker, M; Von Dohren, H. Cyanobacterial peptide – nature’ own combinatorial biosynthesis. FEMS Microbiol Rev 2006 30, 530 -563.
Williams, DE; Craig, M; Dawe, SC; Kent, ML; Holmes, CFB; Andersen, RJ. Evidence for a covalent bound form of microcystin-LR in salmon liver and dungeness crab larval. Chem Res Toxicol 1997 10(4), 460-463.
M. Bruno, S. Melchiorre, V. Messineo et al. 210
Wilson, AE; Gossiaux, DC; Hook, TO; Berry, JP; Landrum, PF; Dyble, J; Guildford, J. Evaluation of the human health threat associated with the hepatotoxin microcystin in the musscle and liver of yellow perch (Perca flavescens). Can J Fish Aquat Sci 2008 65, 1487-1497.
Wood, SA; Briggs, LR; Sprosen, J; Ruck, JG; Wear, RG; Holland, PT; Bloxham, M. Changes in concentration of microcystins in Rainbow trout, freshwater mussels, and cyanobacteria in Lakes Rotoiti and Rotoehu. Environmental toxicology 2006 21, 205-222.
Xie, L; Xie, P; Guo, L; Li, L; Miyabara, Y; Park, HD. Organ distribution and bioaccumulation of microcystins in freshwater fish at different trophic levels from the eutrophic lake Chaohu, China. Environ Toxicol 2005 20, 293-300.
Yuan, M; Carmichael, WW; Hilborn, ED. Microcystin analysis in human sera and liver from human fatalities in Caruaru, Brazil 1196. Toxicon 2006 48, 627-640.
Zimba, PV; Camus, A; Allen, EH; Burkholder, JM. Co-occurrence of white shrimp, Litopenaeus vannamei, mortalities and microcystin toxin in a southeastern USA shrimp facility. Aquaculture 2006 261, 1048-1055.
Zimba, PV; Khoo, L; Brittain, S; Carmichael, WW. Confirmation of catfish, Ictalurus punctatus (Rafinesque), mortality from Microcystis toxins. J Fish Dis 2001 24, 41-47.
In: Handbook on Cyanobacteria ISBN: 978-1-60741-092-8 Editors: P. M. Gault and H. J. Marler © 2009 Nova Science Publishers, Inc.
Chapter 6
APPLICATION OF GENETIC TOOLS TO CYANOBACTERIAL BIOTECHNOLOGY AND ECOLOGY
Olga A. Koksharova A.N. Belozersky Institute of Physico-Chemical Biology,
M.V. Lomonosov State University, Moscow 119992, Russian Federation
ABSTRACT
Cyanobacteria, structurally Gram-negative prokaryotes and ancient relatives of chloroplasts, can assist analysis of photosynthesis and its regulation more easily than can studies with higher plants. Many genetic tools have been developed for unicellular and filamentous strains of cyanobacteria during the past three decades. These tools provide abundant opportunity for identifying novel genes; for investigating the structure, regulation and evolution of genes; for understanding the ecological roles of cyanobacteria; and for possible practical applications, such as molecular hydrogen photoproduction; production of phycobiliproteins to form fluorescent antibody reagents; cyanophycin production; polyhydroxybutyrate biosynthesis; osmolytes production; nanoparticles formation; mosquito control; heavy metal removal; biodegradative ability of cyanobacteria; toxins formation by bloom-forming cyanobacteria; use of natural products of cyanobacteria for medicine and others aspects of cyanobacteria applications have been discussed in this chapter.
INTRODUCTION Cyanobacteria, ancient relatives of chloroplasts, are outer membrane-bearing, chlorophyll
a-containing, photosynthetic bacteria that carry out photosynthesis much as do plants. Cyanobacteria are believed to have been responsible for introducing oxygen into the atmosphere of primitive Earth. A small fraction of the cells of certain cyanobacteria may differentiate into heterocysts, in which dinitrogen (N2) fixation can take place in an oxygen-containing milieu. Cyanobacteria are capable of growth, and in some cases differentiation, when provided with little more than sunlight, air, and water. Their potentialities are being enhanced by the availability of genetic tools and genomic sequences. Many vectors and other
Olga A. Koksharova 212
genetic tools have been developed for unicellular and filamentous strains of cyanobacteria. Transformation, electroporation, and conjugation are used for gene transfer. Diverse methods of mutagenesis allow the isolation of many sought-for kinds of mutants, including site-directed mutants of specific genes. Reporter genes permit measurement of the level of transcription of particular genes, and assays of transcription within individual colonies or within individual cells in a filament [for review Koksharova and Wolk, 2002]. Complete genomic sequences have been obtained for today for the 53 strains and species of cyanobacteria. Genomic sequence data provide the opportunity for global monitoring of changes in genetic expression at transcriptional and translational levels in response to variations in environmental conditions. The availability of genomic sequences accelerates the identification, study, modification and comparison of cyanobacterial genes, and facilitates analysis of evolutionary relationships, including the relationship of chloroplasts to ancient cyanobacteria. The many available genetic tools enhance the opportunities for possible biotechnological applications of cyanobacteria.
CYANOBACTERIA ARE PROMISING PRODUCERS OF MOLECULAR HYDROGEN –
FUTURE ECOLOGICALY PURE FUEL Molecular hydrogen is one of the potential future energy sources as an alternative to the
limited fossil fuel resources of today. Its advantages as fuel are numerous: it is ecologically clean, efficient, renewable, and during its production and utilization no CO2 and at most only small amounts of NOx are generated [Dutta et al., 2005]. Advances in hydrogen fuel cell technology and the fact that the oxidation of H2 produces only H2O increase its attractiveness.
The cyanobacteria form a diverse subdivision of prokaryotic oxygenic phototrophs with 2,654 species classified and 55 draft genomes completed or in progress. Genomic DNA sequences are available for 53 different strains and spiecies of cyanobacteria for the moment of this review writing (http://www.ncbi.nlm.nih.gov/sutils/genom_table.cgi). Many, but not all, strains are capable of H2 production. Hydrogenase encoding genes are found in all five major taxonomic groups; at least 50 genera and about a hundred strains so far were found to metabolize H2 [Rupprecht et al., 2006]. Liquid suspension cultures or immobilized cells of cyanobacteria offer opportunities for photoproduction of molecular hydrogen [Gisby et al., 1987; Lindblad, 1999; Serebryakova & Tsygankov, 2007].
To optimize hydrogen production by cyanobacteria we have to learn more about a regulation all the genes and proteins that are involved it this process. Molecular genetic analysis of hydrogen metabolism systems is a prerequisite for the use of genetic and genetic engineering methods to create optimized cyanobacterium strains with high rates of hydrogen production. The genetic control of hydrogen metabolism in cyanobacteria has been discussed in the recent review of S.V. Shestakov and L.E. Mikheeva [2006]. Transcriptional analysis of hydrogenases genes in Anacystis nidulans and Anabaena variabilis has been monitored by RT-PCR [Boison et al., 2000]. In Peter Lindblad laboratory transcription and regulation of the bidirectional hydrogenase have been studied in Nostoc sp. strain PCC 7120 [Sjöholm et al., 2007].
Application of Genetic Tools to Cyanobacterial Biotechnology and Ecology 213
Comparative analysis of several unicellular and filamentous, nitrogen-fixing and non-nitrogen-fixing cyanobacterial strains on the molecular and the phisiological level have been accomplished in order to find the most efficient organisms for photobiological hydrogen production [Schütz et al., 2004]. Among them are symbiotic, marine, and thermophilic cyanobacteria, as well as species, capable of hydrogen production under aerobic conditions. Cyanobacteria possess several enzymes directly involved in hydrogen metabolism: (i) nitrogenase(s), catalyzing the production of H2 as a side product of reduction of N2 to NH3; (ii) an uptake hydrogenase, catalyzing the consumption of H2 produced by the nitrogenase; and (iii) a bidirectional hydrogenase, which has the capacity both to take up and to produce H2 [Papen et al., 1986; Schmitz et al., 1995; Tamagnini et al., 2000; 2002; 2007; Vignais & Colbeau, 2004]. The formation of hydrogen from water via the bioconversion of photon energy is a multistage process involving photosystems I and II responsible for electron transfer to NADP along the chain of transporters. This results in the formation of the transmembrane electrochemical gradient of proton transport that is necessary for ATP synthesis. Cyanobacteria use electrons transported via ferredoxin (or flavodoxin) in the nitrogenase reaction of ammonium synthesis and proton reduction yielding molecular hydrogen, which is reutilized by means of uptake hydrogenase rater than released from cells. This FeNi-containing enzyme provides additional energy, is involved in the control of electron flow, and protects nitrogenase from oxygen inactivation. Cells of all nitrogen-fixing cyanobacteria contain membrane-bound uptake hydrogenase. Another enzyme of hydrogen metabolism is cytoplasmic enzyme, bidirectional hydrogenase, that catalyzes the reversible reaction 2H+ + 2e- ↔ H2. Many but not all cyanobacteria contain bidirectional hydrogenase. Three possible functions are considering for this enzyme: (1) the removal of excess reductants under anaerobic conditions, (2) hydrogen oxidation in the periplasm and electron delivery to the respiratory chain, and (3) a valve for electrons generated in the light reaction of photosynthesis [Tamagnini et al.,2002].
Mutagenesis and genetic engineering methods can be used to create genetically modified strains suitable for commercial use in photobiotechnology. To maximize H2 production, mutants of A. variabilis strain ATCC 29413 defective in H2-utilization first were isolated after chemical mutagenesis by L. Polukhina-Mikheeva and O. Koksharova at Lomonosov M.V. Moscow State University [Mikheeva et al., 1994]. Two mutants altered in hydrogen metabolism were characterized [Mikheeva et al., 1995; Sveshnikov et al., 1997] and one of them, PK 84, has been used for hydrogen production in an automated helical tubular photobioreactor [Borodin et al., 2000; Tsygankov et al., 2002]. Later insertional inactivated Δ hup L mutants of Anabaena sp. PCC 7120 [Masukawa et al., 2002], Nostoc punctiforme strain ATCC 2913 [Lindberg et al., 2002, 2004] and Nostoc sp. PCC 7422 [Yoshino et al., 2007] have been studied. Masukawa and colleagues [2007] demonstrated a strategy for improving H2 production activity over that of the parent ΔhupL strain derived from Nostoc sp. strain PCC 7120, as evidenced by the greater sustained H2 production and higher nitrogenase activities of the ΔhupL ΔnifV1 mutant culture grown under air. Mutants with blocked uptake hydrogenase or inactivated structural hup genes or hyp and hupW genes controlling nickel metabolism, the assemblage and functions of hydrogenase complexes, and regulation of their activity are promising.
Realization of a semiartificial system for biohydrogen production involves the integration of photosynthetic protein complexes and hydrogenases into a bioelectronic or bioelectrochemical device. Practically, this can be achieved by the immobilization of the
Olga A. Koksharova 214
protein complexes on conductive supports (e.g. noble-metals, carbon or semiconductors), in which the first step is the efficient electron transfer from light-driven water splitting by Photosystem 2 (PS2) to the conductive surface. To establish a semiartificial device for biohydrogen production utilizing photosynthetic water oxidation, the immobilization of a PS2 on electrode surfaces has been reported [Badura et al., 2006]. For this purpose, an isolated PS2 with a genetically introduced His tag from the cyanobacterium Thermosynechococcus elongatus was attached onto gold electrodes modified with thiolates bearing terminal Ni(I1)-nitrilotriacetic acid groups. Other artificial system for hydrogen production was presented by engineered a “hard-wired” protein complex consisting of a hydrogenase and photosystem I (hydrogenase-PSI complex) as a direct light-to hydrogen conversion system. The key component was an artificial fusion protein composed of the membrane-bound [NiFe] hydrogenase from the β-proteobacterium Ralstonia eutropha H16 and the peripheral PSI subunit PsaE of the cyanobacterium Thermosynechococcus elongatus. The hydrogenase-PSI complex displayed light-driven hydrogen production [Ihara et al., 2006]. Immobilized culture of Gloeocapsa alpicola CALU 743 placed in a photo-bioreactor (PhBR) operated in a two-stage cyclic regime “photosynthesis- endogenous fermentation” was operated successfully over a period of more then three months, giving stable hydrogen production [Serebryakova & Tsygankov, 2007].
To increase production of hydrogen the strain used, the gas phase composition, irradiance and the medium used during growth and H2 production stages, as well as the specific growth, CO2 consumption, could be optimized [Tsygankov et al., 1998, 1999; Gutthann et al., 2007; Berberoğlu et al., 2008; Yoon et al., 2008]. Some heterological systems could be applyied for hydrogen production. So, enchanced hydrogen production in Escherichia coli cells expressing the cyanobacterial Synechocystis sp. PCC 6803 HoxEFUYH (the reversible or bidirectional hydrogenase) has been obtained by inhibiting hydrogen uptake of both hydrogenase I and hydrogenase 2 [Maeda et al., 2007]. Other example of heterological systems for producing hydrogen is the system in which uptake hydrogenase negative mutants of bloom forming cyanobacteria (Nostoc and Anabaena) and the fermentative bacteria Rhodopseudomonas palustris P4 were used together for producing hydrogen within the reverse micelles as microreactor [Pandey et al., 2007].
To increase the H2 production by heterocyst-forming cyanobacteria different approaches could be undertaken. The main directions are : (i) increasing the efficiency of H2 production by heterocysts, (ii) increasing the heterocysts number, typically up to 10% of cells [Wolk, 2005; Shestakov & Mikheeva, 2006], (iii) reducing the antenna size and redirecting greater H+ and e-fluxes toward the hydrogenase [Kruse et al., 2005]. The efficiency of H2 production by heterocysts could be increased by either (a) genetically modifying Anabaena nitrogenase to produce primarily or exclusively H2, as has been done in Azotobacter vinelandii [Fisher et al., 2000], potentially increasing H2 production 4-fold, or (b) replacing nitrogenase with a different enzyme, an efficient reversible hydrogenase, potentially producing yet more H2. In Anabaena it could be reversible hydrogenase that is encoded by the hoxEFUYH genes [Schmitz et al., 1995]. Other prospective projects are aimed at the creation of strains combining the block of uptake hydrogenase with the substitution of Mo-containing nitrogenase (gene hif1) by vanadium-containing nitrogenase (gene nifDGK), which more efficiently uses the energy of electrons for reducing protons to molecular hydrogen [Prince & Kheshgi].
Application of Genetic Tools to Cyanobacterial Biotechnology and Ecology 215
The amount of heterocysts can be increased via genetic engineering manipulations with genes controlling the formation of heterocysts (e.g., gene hetN, hetR, hetC, patA ) and genes involved in the control of nitrogen metabolism. One of these genes is ntcA, which encodes the DNA-binding protein interacting with the promoters of uptake hydrogenase genes whose transcription is activated in heterocysts [Axelsson et al., 1999; Herrero et al., 2001; Sjöholm et al., 2007]. H2-production aside, no biotechnological use has yet been made of the capacity of heterocyst-forming cyanobacteria, while growing in air, to support reactions that require microoxic conditions.
In theory, significant improvements in the light-driven H2 capacity and stability could be engineered into the cyanobacterial system by reducing the antenna size and by redirecting greater H+ and e-fluxes toward the hydrogenase [Kruse et al., 2005]. For example, a fivefold stimulation in the light-driven H2 production rate was observed in an engineered strain of Synechocystis PCC 6803 by deletion of an assembly gene for the type 1 NADPH dehydrogenase (NDH -1) [Cournac et al. 2004]. This deletion blocks cyclic electron flow from PSI into the PQ pool, thus redirecting the flux of e- into NADP+ reduction. Genetic engineering holds considerable promise for the future because to date, few engineered strains have been reported to test these principles.
There is no doubt that the photobiological production of hydrogen thus represents a potentially valuable renewable energy resource for the future. A prerequisite challenge is to improve current systems at the biochemical level so that they can clearly generate hydrogen at a rate and efficiency that approaches the 10% energy efficiency that has been surpassed in photoelectrical systems.
CYANOBACTERIA ARE SOURCE OF A LARGE VARIETY OF BIOCOMPOUNDS
Cyanobacteria can also perform syntheses that are of biotechnological significance. Like
many genera of eubacteria, they synthesize polyhydroxyalkanoates (PHAs), a thermoplastic class of biodegradable polyesters that includes polyhydroxybutyrate (PHB). PHAs are carbon- and energy-storage compounds that are deposited in the cytoplasm as inclusions. The presence of PHA in about 50 strains of four different phylogenetic subsections of cyanobacteria has been reviewed by Vincenzini & De Philippis [1999]. Eleven different cyanobacteria were investigated with respect to their capabilities to synthesize poly-3-hydroxybutyrate [poly(3HB)] and the type of poly-β-hydroxyalkanoic acid (PHA) synthase accounting for the synthesis of this polyester by using Southern blot analysis, Western blot analysis and sequence analysis of specific PCR products [Hai et al., 2001]. By using the genomic sequence of Synechocystis, Hein et al. [1998] identified and characterized a gene encoding PHB synthase. Two related genes, encoding a PHA-specific β-ketothiolase and an acetoacetyl-CoA reductase, have been identified and characterized [Taroncher-Oldenburg et al., 2000]. Miyake and colleagues [2000] isolated a Tn5 insertion mutant of Synechococcus sp. MA19 with enhanced accumulation of PHB.
Another such synthesis is that of eicosapentaenoic acid (20:5n-3, EPA), a polyunsaturated fatty acid that is an essential nutrient for marine fish larvae and is important for human health. Yu et al. [2000] introduced the EPA-biosynthetic gene cluster from an
Olga A. Koksharova 216
EPA-producing bacterium, Shewanella sp. SCRC-2738 into a marine Synechococcus sp., strain NKBG15041c, by conjugation. Transgenic cyanobacteria produced amounts of EPA and its precursor, 20:4n-3, that depended upon the culture conditions used.
A polymer unique to cyanobacteria, called cyanophycin, is a copolymer of arginine and aspartic acid, multi-L-arginyl-poly(aspartic acid), discovered and structurally analyzed by Simon [1971, 1987], that comprises the so-called structured granules within the cells [Lang et al., 1972]. Simon [1973a,b; 1976] presented evidence that the cyanophycin granule polypeptide (CGP) is synthesized non-ribosomally and can be degraded to serve as a cellular nitrogen reserve, and extensively purified an enzyme involved in its biosynthesis. The cyanophycin synthetase from Anabaena variabilis ATCC 29413 was isolated, microsequenced, and the partial amino acid sequence used to identify the corresponding gene in the Synechocystis PCC 6803 database [Ziegler et al., 1998]. It, in turn, permitted isolation, and then sequencing, of the corresponding gene from Anabaena variabilis ATCC 29413, overexpression of the corresponding protein, and analysis of the mechanism of synthesis of cyanophycin [Berg et al., 2000]. The one gene evidently sufficed for cyanophycin synthesis in E. coli. The cyanophycinase gene of PCC 6803, expressed in E. coli and purified, hydrolyzed CGP to an asp-arg dipeptide [Richter et al., 1999]. On the basis of the sequence of those genes, the corresponding genes from Synechocystis PCC 6308 were then cloned, leading to heterologous expression exceeding 26 % of cell dry mass [Aboulmagd et al., 2000].
C-phycocyanin and allophycocyanin are phycobiliproteins, pigmented components of the photosystem-II antenna structure, the phycobilisome [Glazer, 1988]. Phycocyanin (PC) is a blue, light-harvesting pigment in cyanobacteria and in the two eukaryote algal genera, Rhodophyta and Cryptophyta. It is PC that gives many cyanobacteria their bluish colour and why these cyanobacteria are also known as blue-green algae. PC and related phycobiliproteins are utilised in a number of applications in foods and cosmetics, biotechnology, diagnostics and medicine. Sekar & Chandramohan [2008] counted existing patents on phycobiliproteins and found 55 patents on phycobiliprotein production, 30 patents on applications in medicine, foods and other areas, and 236 patents on applications utilising the fluorescence properties of phycobiliproteins. PC is a water soluble, nontoxic fluorescent protein with potent antioxidant, anti-inflammatory and anticancer properties [Benedetti et al., 2004; Sabarinathan & Ganesan, 2008; Subhashini et al., 2004]. Phycocyanin could be purified directly from cyanobacteria [Benedetti et al., 2006; Soni et al., 2008] or could be synthesized in Escherichia coli cells by using one expression vector containing all necessary five genes (hox1, pcyA, cpcA, cpcE, and cpcF) and a His-tag for convenient purification of recombinant protein [Guang et al., 2007]. Different ways of phycocyanin production has been reviewed recently by N.T. Eriksen [2008].
Phycobiliproteins, coupled to monoclonal and polyclonal antibodies to form fluorescent antibody reagents, are valuable as fluorescent tags in cell sorting, studies of cell surface antigens, and screening of high-density arrays [Sun et al., 2003]. Spirulina is a convenient and inexpensive source of allophycocyanin and C-phycocyanin (C-PC) [Jung & Dailey, 1989]. As an alternative approach, genetic engineering of Anabaena 7120 has permitted the in vivo production of stable phycobiliprotein constructs bearing affinity purification tags, and usable as fluorescent labels without further chemical manipulation [Cai et al., 2001]. Recombinant expression of C-PC and holo-C-PC α–subunits in Anabaena sp. and E. coli has demonstrated that protein engineering can geneate C-PC with improved stability or novel functions. Successful nutraceutical or pharmaceutical applications will depend on C-PC
Application of Genetic Tools to Cyanobacterial Biotechnology and Ecology 217
produced under well-controlled conditions. Recombinant and heterotrophic production procedures seem more promising for novel C-PC synthesis at industrial scales.
Use of Spirulina as a source of protein and vitamins for humans or animals has been reviewed by Ciferri [1983] and Kay [1991]. Spirulina platensis and Spirulina maxima are thought to have been consumed since ancient times as a food in a part of Africa that is now in the Republic of Chad, and in Mexico, respectively [Ciferri & Tiboni, 1985]. These species have an unusually high protein content for photosynthetic organisms, up to 70% of the dry weight. Nostoc flagelliforme is considered a delicacy in China [Gao, 1998; see also Takenaka et al., 1998]. Other cyanobacteria are eaten in India and the Philippines [Tiwari, 1978; Martinez, 1988]. The amino acid composition of S. maxima [Clément et al., 1967], which can grow on animal wastes [Wu and Pond, 1981], is also among the best, for human nutrition, of a photosynthetic organism. Like other microalgae, Spirulina is used as a source of natural colorants in food, and as a dietary supplement [Kay, 1991]. The optimal physiological conditions (temperature and pH) for biomass production and protein biosynthesis were demonstrated recently for new isolate of Spirulina sp. that was found from an oil-polluted brackish water environment in the Niger Delta [Ogbonda et al., 2007]. Beginning in the early 1980s, another species, including Aphanizomenon flos-aquae have been an accepted source of microalgal biomass for food [Carmichael et al., 2000], as well as Nostochopsis lobatus, which could be a promising bioresource for enhanced production of nutritionally rich biomass, pigments and antioxidants [Pandey & Pandey, 2008].
Only in the last few years cyanobacteria have been recognised as a potent source for numerous biologically active natural products. To date about 800 molecules of cyanobacterial origin are known, among which are pharmacologically interesting compounds, including anticancer, antimicrobial and hypertension lowering activities. It can be assumed that these organisms hold a huge potential for a abundance of pharmacologically relevant compounds. Cyanobacteria are reported to produce secondary metabolites of which toxic and bioactive peptides are of scientific and public interest. Certain of these toxins and other natural products of cyanobacteria have potential for medicinal uses [Patterson et al., 1991; Boyd et al., 1997; Liang et al., 2005]. Comprehensive review of Řezanka & Dembitsky [2006] present a diverse range of metabolites producing by “biochemical factories” of cyanobacteria belonging to Nostocaceae.
Wide spectrum of cyanobacterial toxins are poisoning for animals and dangerous for human health. Cyanobacteria synthesize hepatotoxins (microcystins and nodularins), hepato- and cytotoxins (cylindrospermopsins), neurotoxins (anatoxin-a, anatoxin-a(S), and saxitoxins), dermatotoxins, irritant toxins (lipopolysaccharides) and other marine biotoxins (aplysiatoxins, debromoaplysiatoxins, lyngbyatoxin-a) [Wiegand & Pflugmacher, 2005; Stewart et al., 2006; Sivonen & Börner, 2008].
The cyanobacterial hepatotoxins most frequently found in freshwater blooms are the cyclic heptapeptide microcystins, whereas in brackish waters, the cyclic pentapeptide nodularin is common. More than 60 isoforms of microcystins are currently known. Microcystins have been detected in the cyanobactrial genera Anabaena, Anabaenopsis, Hapalosiphon, Microcystis, Nostoc, Planktothrix, Phormidium, and Synechococcus [Sivonen & Börner, 2008]. Microcystins are cyclic heptapeptides with an unusual chemical structure and a number of nonproteinogenic amino acids [Sivonen & Jones , 1999]. These peptides are synthesized by the non-ribosomal peptide synthesis pathway. Microcystins typically contain three variable methyl groups, including N-methyl, O-methyl and C-methyl groups.
Olga A. Koksharova 218
Methylation is a relatively common modification in biologically active natural peptides and is thought to improve stability against proteolytic degradation [Finking & Marahiel, 2004 ; Sieber & Marahiel, 2005]. They are synthesized on large enzyme complexes consisting of non-ribosomal peptide synthetases (NRPS) [Dittmann et al., 1997] and polyketide synthases (PKS) in a variety of distantly related cyanobacterial genera. Non-ribosomal peptide synthetases possess a highly conserved modular structure with each module consisting of catalytic domains responsible for the adenylation, thioester formation and condensation of specific amino acids [Marahiel et al., 1997]. The arrangement of these domains within the multifunctional enzymes determines the number and order of the amino acid constituents of the peptide product [Sieber & Marahiel, 2005]. Additional domains for the modification of amino acid residues such as epimerization, heterocyclization, oxidation, formylation, reduction or N-methylation may also be included in the module [Lautru & Challis, 2004; Marahiel et al., 1997; Sieber & Marahiel, 2005]. So, all these biosynthetic features result in high diversity of cyanobacterial microcystins. For now the biosynthetic gene clusters have been fully sequenced from Microcystis, Planktothrix, Anabaena, Nodularia and Nostoc [reviewed by Sivonen & Börner, 2008]. In Anabaena this enzyme complex is encoded in a 55 kb gene cluster containing 10 genes (mcyA–J) encoding peptide synthetases, polyketide synthases and tailoring enzymes [Rouhiainen et al., 2004]. In all analyzed heterocystous cyanobacteria (Anabaena, Nostoc and Nodularia), the gene order follows the co-linearity rule of peptide synthetases and its products. If genes, which are encoding bioactive compounds, are known, they could be inactivated by directed mutagenesis and corresponding mutants with defective biosynthesis of bioactive compounds could help to search for the functions of these metabolites. In the case of microcystins, such mutants could be generated by insertional disruption or deletion of mcy genes in M. aeruginosa and P. agardhii strains [Dittmann et al., 1997; Nishizawa et al., 2000; Christiansen et al., 2003; Pearson et al., 2004]. Ditmann et al. [1997] for the first time show by knock-out mutagenesis that peptide synthetase genes were involved in the production of a cyanobacterial bioactive compound and demonstrated that one gene cluster was responsible for the production of all microcystin variants in the strain Microcystis aeruginosa PCC 7806. What microcystins significance for cyanobacterial cells is not clear. The lack of all microcystins in an mcyB mutant of M.aeruginosa PCC 7806 [Dittmann et al., 1997] had no effect on growth on the mutant cells under different light laboratory conditions as compared to the wild-type cells [Hesse et al., 2001]. However, comparative two-dimensional protein electrophoresis showed that microcystin-related protein, MrpA, was strongly expressed in the wild-type PCC 7806, but was not detectable in the mcyB mutant [Dittmann et al., 2001]. Application of modern transcriptomic and proteomic approaches in combination with genetical methods could help to reveal key aspects of cyanobacterial toxin biosynthesis in the future experiments.
CYANOBACTERIA AND ENVIRONMENT Cyanobacteria play an important role in diverse ecological systems. They are common in
aqueous environments, including marine, brackish and fresh waters; in soil and rocks, and especially on moist surfaces; and in some habitats that lack eukaryotic life, such as some hot springs and highly alkaline lakes. They form natural and artificial symbioses with algae,
Application of Genetic Tools to Cyanobacterial Biotechnology and Ecology 219
bryophytes, ferns, cycads and an angiosperm, and with invertebrates (corals, sponges, hydroids) [Fogg et al., 1973; Wilkinson & Fay, 1979; Gorelova et al., 1996; Adams 2000; Adams 2002; Gusev et al., 2002; Baulina & Lobakova, 2003; Bergman et al., 2008; Gorelova et al., 2009]. In association with fungi, they form lichens that help to transform rocks to soil in which other forms of life can grow. It is thought that cyanobacteria were the first colonizers of land, providing a physical and chemical substrate for the later growth of eukaryotic plants. Acclimation studies in cyanobacteria offer useful information about adjustment to new environment. Cyanobacteria in particular accumulate a variety of osmolytes depending upon the nature of stress. Trehalose is among the well-known compatible solutes that stabilize membrane and protein during dehydration and is a compound accumulated in cyanobacterial cell during salt or osmotic stress [Potts, 1996; Leslie et al., 1995; Page-Sharp et., 1999; Asthana et al., 2005, 2008; Higo et al., 2006]. How a cyanobacterium survives extreme desiccation is now open to genetic analysis, thanks to the development of a genetic system for Chroococcidiopsis, which dominates microbial communities in the most extremely arid hot and cold deserts [Billi et al., 2001]. Transfer of just the sucrose-6-phosphate synthase gene (spsA) from Synechocystis to desiccation-sensitive E. coli resulted in a 104-fold increase in survival compared to wild-type cells following freeze-drying, air drying, or desiccation over phosphorus pentoxide [Billi et al., 2000]. Modern methods, including DNA microarrays in a combination with insertional mutagenesis of potential sensors and transducers, for the identification of stress-inducible genes and regulatory systems, have allowed identification and study of many genes of Synechocystis sp. PCC 6803 and have led to significant progress in understanding the mechanisms of reaction to environmental stress in cyanobacteria [Los et al., 2008].
Cyanobacteria are living everywhere on our Planet. The cyanobacterial diversity of microbial mats growing in the benthic environment of Antarctic lakes has been exploited for the discovery of novel antibiotic and antitumour activities [Biondi et al., 2008]. If care is not taken in the disposal of phosphate- and nitrate-containing industrial, agricultural, and human wastes, these wastes can eutrophicate lakes and ponds, resulting in massive growth ("blooms") of cyanobacteria [Atkins et al., 2001]. The surface of the water becomes turbid and light cannot penetrate to lower levels. A portion of the cyanobacteria then dies, producing unpleasant odors; bacteria that decompose the cyanobacteria use up available oxygen; and fish then die for lack of oxygen. Some bloom-forming cyanobacteria produce toxins that may render water unsuitable [Hitzfeld et al., 2000; Hoeger et al., 2005]. The microcystins and nodularins may accumulate into aquatic organisms and be transferred to higher trophic levels, and eventually affect vector animals and consumers [Kankaanpää et al., 2005].
Naturally occurring aromatic hydrocarbons [Cerniglia & Gibson, 1979; Cerniglia et al., 1980a,b; Ellis, 1977; Narro et al., 1992] and xenobiotics [Megharaj et al., 1987; Kuritz & Wolk, 1995] can both be degraded by cyanobacteria, and cyanobacteria can be genetically engineered to enhance their biodegradative ability [Kuritz & Wolk, 1995]. Microbial mats rich in cyanobacteria facilitate the remediation of oil-polluted waters and desert in the region of the Arabian Gulf by utilizing crude oil and individual n-alkanes as sources of carbon and energy [Sorkhoh et al., 1992, 1995]. Cyanobacterial nitrogen fixation could provide sufficient nitrogen compounds for heterotrophic oil degradation. Free radicals formed during oxygenic photosynthesis could indirectly enhance photo-chemical oil degradation [Nicodem et al. 1997]. Currently, there is a growing interest in the application of phototrophic biofilms, for instance, in wastewater treatment [Schumacher et al., 2003] and removal of heavy metals [Mehta & Gaur, 2005; Baptista & Vasconcelos, 2006; De Philipps et al., 2007]. Cyanobacteria are effective biological metal
Olga A. Koksharova 220
sorbents, representing an important sink for metals in aquatic environment. Parker et al. [2000] showed that mucilage sheaths isolated from the cyanobacteria Microcystis aeruginosa and Aphanothece halophytica exhibit strong affinity for heavy metal ions such as copper, lead, and zinc. In addition to biosorption and bioaccumulation, the elevated pH inside photosyntetically active biofilms may favor removal of metals by precipitation [Liehr et al., 1994]. Cyanobacteria are able to biotransform Hg(II) into β-HgS and may be useful for bioremediation of mercury [Lefebvre et al., 2007]. Recently Micheletti and colleagues [2008] discovered that sheathless mutant of Gloeothece sp. strain PCC 6909 was even more effective in the removal of the heavy metal (copper ions) than the wild type.
The microorganisms produce extra cellular polymeric substances (EPS) that hold the biofilm together [Wimpenny et al., 2000]. EPS produced by algae and cyanobacteria can improve the soil water-holding capacity and prevent erosion [Rao & Burns 1990]. Filamentous nitrogen-fixing cyanobacteria may be natural biofertilizers for the rice fields [Jha et al., 2001; Pereira et al., 2008].
Cyanobacteria, because they inhabit the same ecological niches as mosquito larvae, and are eaten by them [Thiery et al., 1991; Avissar et al., 1994], are attractive candidates for mosquito control. Transgenic mosquitocidal cyanobacteria, filamentous as well as unicellular, have been engineered [Tandeau de Marsac et al., 1987; Angsuthanasombat & Panyim, 1989; Chungjatupornchai, 1990; Murphy & Stevens, 1992; Soltes-Rak et al., 1993, 1995; Xu et al., 1993, 2000; Wu et al., 1997]. A high level of toxicity was observed with recombinant clones of Anabaena 7120 bearing two δ-endotoxin genes (cryIVA and cryIVD) and gene p20 of Bacillus thuringiensis subsp. israelensis [Wu et al., 1997]. Outdoor tests indicated that genetically altered Anabaena 7120 could keep containers with natural water from being inhabited by Culex larvae for over 2 months [Xu et al., 2000]. Although one might expect laboratory strains to have low competitive ability compared with indigenous species that same characteristic may help to prevent unwanted spread of a genetically modified microorganism. Notably, a lyophilized (and presumably non-proliferative) preparation of the recombinant cells retained the same high mosquitocidal activity as the original culture. It is interesting recombinant cyanobacteria, expressing δ-endotoxin proteins of Bacillus thuringiensis subsp. israelensis, can protect mosquito larvicidal toxins from UV inactivation [Manasherob et al., 2002].
CYANOBACTERIA AND NANOTECHNOLOGY Nanotechnology involves the production, manipulation and use of materials ranging in
size from less than a micron to that of individual atoms. Synthesis of nanoparticles using biological entities has great interest due to their unusual optical [Krolikowska et al. 2003], chemical [Kumar et al. 2003], photoelectrochemical [Chandrasekharan & Kamat 2000], and electronic [Peto et al. 2002] properties. Among different organisms, cyanobacteria also could be useful for nanoparticles synthesis. So, gold nanoparticles could be obtained by using a filamentous cyanobacterium, Plectonema boryanum UTEX 485 [Lengke et al. 2006a]. The mechanisms of gold bioaccumulation by this cyanobacteria from gold(III)- chloride solutions have documented that interaction of cyanobacteria with aqueous gold(III)-chloride initially promoted the precipitation of nanoparticles of amorphous gold(I)-sulfide at the cell walls, and finally deposited metallic gold in the form of octahedral (III) platelets near cell surfaces and
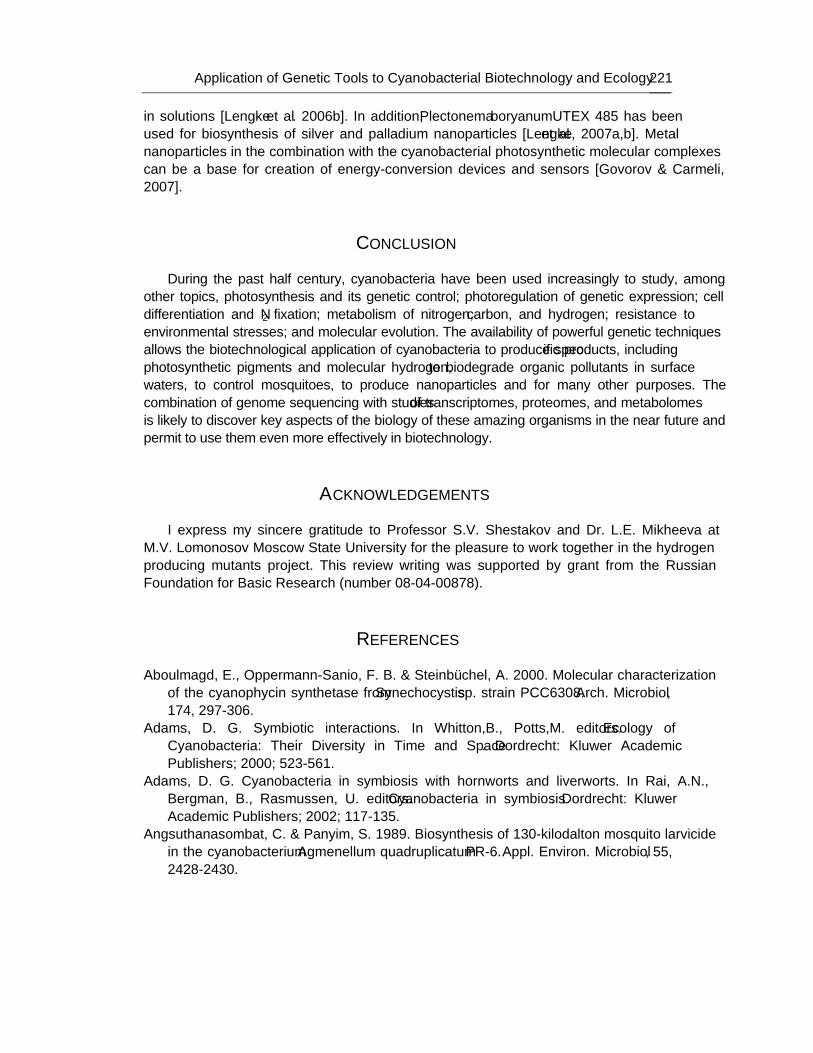
Application of Genetic Tools to Cyanobacterial Biotechnology and Ecology 221
in solutions [Lengke et al. 2006b]. In addition, Plectonema boryanum UTEX 485 has been used for biosynthesis of silver and palladium nanoparticles [Lengke et al., 2007a,b]. Metal nanoparticles in the combination with the cyanobacterial photosynthetic molecular complexes can be a base for creation of energy-conversion devices and sensors [Govorov & Carmeli, 2007].
CONCLUSION During the past half century, cyanobacteria have been used increasingly to study, among
other topics, photosynthesis and its genetic control; photoregulation of genetic expression; cell differentiation and N2 fixation; metabolism of nitrogen, carbon, and hydrogen; resistance to environmental stresses; and molecular evolution. The availability of powerful genetic techniques allows the biotechnological application of cyanobacteria to produce specific products, including photosynthetic pigments and molecular hydrogen, to biodegrade organic pollutants in surface waters, to control mosquitoes, to produce nanoparticles and for many other purposes. The combination of genome sequencing with studies of transcriptomes, proteomes, and metabolomes is likely to discover key aspects of the biology of these amazing organisms in the near future and permit to use them even more effectively in biotechnology.
ACKNOWLEDGEMENTS I express my sincere gratitude to Professor S.V. Shestakov and Dr. L.E. Mikheeva at
M.V. Lomonosov Moscow State University for the pleasure to work together in the hydrogen producing mutants project. This review writing was supported by grant from the Russian Foundation for Basic Research (number 08-04-00878).
REFERENCES
Aboulmagd, E., Oppermann-Sanio, F. B. & Steinbüchel, A. 2000. Molecular characterization of the cyanophycin synthetase from Synechocystis sp. strain PCC6308. Arch. Microbiol, 174, 297-306.
Adams, D. G. Symbiotic interactions. In Whitton,B., Potts,M. editors. Ecology of Cyanobacteria: Their Diversity in Time and Space. Dordrecht: Kluwer Academic Publishers; 2000; 523-561.
Adams, D. G. Cyanobacteria in symbiosis with hornworts and liverworts. In Rai, A.N., Bergman, B., Rasmussen, U. editors.Cyanobacteria in symbiosis. Dordrecht: Kluwer Academic Publishers; 2002; 117-135.
Angsuthanasombat, C. & Panyim, S. 1989. Biosynthesis of 130-kilodalton mosquito larvicide in the cyanobacterium Agmenellum quadruplicatum PR-6. Appl. Environ. Microbiol, 55, 2428-2430.
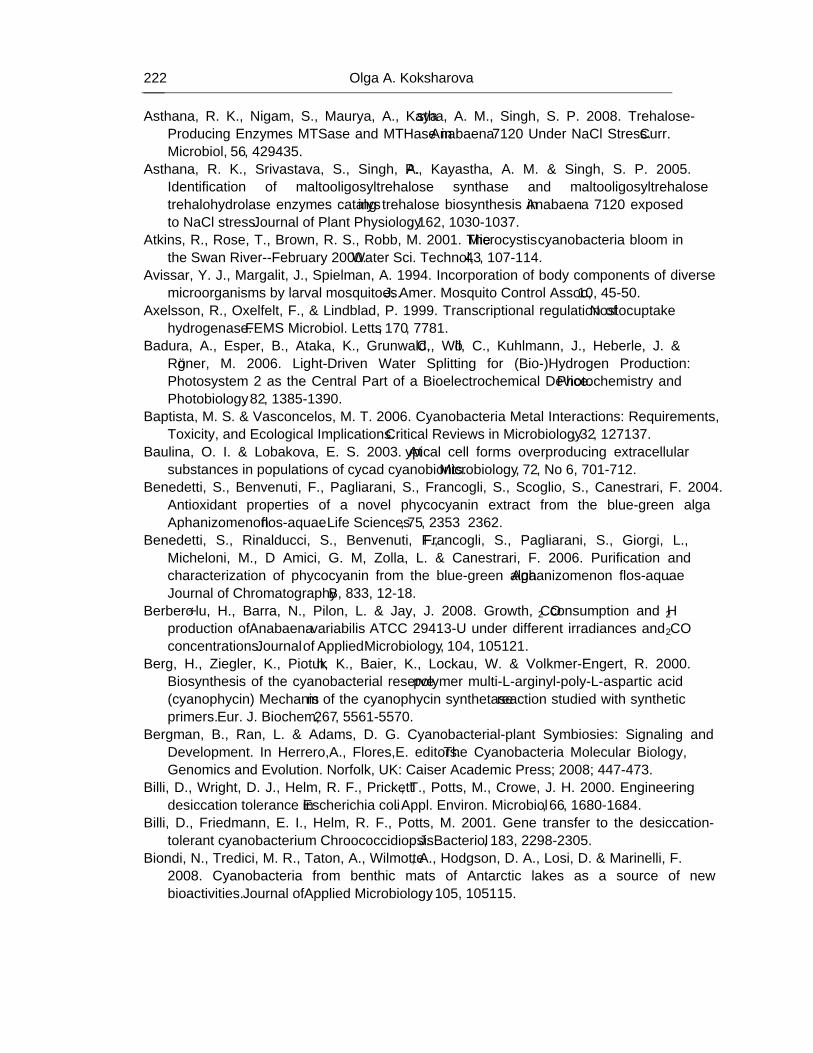
Olga A. Koksharova 222
Asthana, R. K., Nigam, S., Maurya, A., Kayastha, A. M., Singh, S. P. 2008. Trehalose-Producing Enzymes MTSase and MTHase in Anabaena 7120 Under NaCl Stress. Curr. Microbiol, 56, 429–435.
Asthana, R. K., Srivastava, S., Singh, A. P., Kayastha, A. M. & Singh, S. P. 2005. Identification of maltooligosyltrehalose synthase and maltooligosyltrehalose trehalohydrolase enzymes catalysing trehalose biosynthesis in Anabaen a 7120 exposed to NaCl stress. Journal of Plant Physiology, 162, 1030-1037.
Atkins, R., Rose, T., Brown, R. S., Robb, M. 2001. The Microcystis cyanobacteria bloom in the Swan River--February 2000. Water Sci. Technol, 43, 107-114.
Avissar, Y. J., Margalit, J., Spielman, A. 1994. Incorporation of body components of diverse microorganisms by larval mosquitoes. J. Amer. Mosquito Control Assoc, 10, 45-50.
Axelsson, R., Oxelfelt, F., & Lindblad, P. 1999. Transcriptional regulation of Nostoc uptake hydrogenase. FEMS Microbiol. Letts., 170, 77–81.
Badura, A., Esper, B., Ataka, K., Grunwald, C., Wöll, C., Kuhlmann, J., Heberle, J. & Rögner, M. 2006. Light-Driven Water Splitting for (Bio-)Hydrogen Production: Photosystem 2 as the Central Part of a Bioelectrochemical Device. Photochemistry and Photobiology, 82, 1385-1390.
Baptista, M. S. & Vasconcelos, M. T. 2006. Cyanobacteria Metal Interactions: Requirements, Toxicity, and Ecological Implications. Critical Reviews in Microbiology, 32, 127–137.
Baulina, O. I. & Lobakova, E. S. 2003. Atypical cell forms overproducing extracellular substances in populations of cycad cyanobionts. Microbiology, 72, No 6, 701-712.
Benedetti, S., Benvenuti, F., Pagliarani, S., Francogli, S., Scoglio, S., Canestrari, F. 2004. Antioxidant properties of a novel phycocyanin extract from the blue-green alga Aphanizomenon flos-aquae. Life Sciences, 75, 2353 – 2362.
Benedetti, S., Rinalducci, S., Benvenuti, F., Francogli, S., Pagliarani, S., Giorgi, L., Micheloni, M., D’ Amici, G. M, Zolla, L. & Canestrari, F. 2006. Purification and characterization of phycocyanin from the blue-green alga Aphanizomenon flos-aquae. Journal of Chromatography B, 833, 12-18.
Berberoğlu, H., Barra, N., Pilon, L. & Jay, J. 2008. Growth, CO2 consumption and H2 production of Anabaena variabilis ATCC 29413-U under different irradiances and CO2 concentrations. Journal of Applied Microbiology, 104, 105–121.
Berg, H., Ziegler, K., Piotukh, K., Baier, K., Lockau, W. & Volkmer-Engert, R. 2000. Biosynthesis of the cyanobacterial reserve polymer multi-L-arginyl-poly-L-aspartic acid (cyanophycin) Mechanism of the cyanophycin synthetase reaction studied with synthetic primers. Eur. J. Biochem, 267, 5561-5570.
Bergman, B., Ran, L. & Adams, D. G. Cyanobacterial-plant Symbiosies: Signaling and Development. In Herrero,A., Flores,E. editors. The Cyanobacteria Molecular Biology, Genomics and Evolution. Norfolk, UK: Caiser Academic Press; 2008; 447-473.
Billi, D., Wright, D. J., Helm, R. F., Prickett, T., Potts, M., Crowe, J. H. 2000. Engineering desiccation tolerance in Escherichia coli. Appl. Environ. Microbiol, 66, 1680-1684.
Billi, D., Friedmann, E. I., Helm, R. F., Potts, M. 2001. Gene transfer to the desiccation-tolerant cyanobacterium Chroococcidiopsis. J. Bacteriol, 183, 2298-2305.
Biondi, N., Tredici, M. R., Taton, A., Wilmotte, A., Hodgson, D. A., Losi, D. & Marinelli, F. 2008. Cyanobacteria from benthic mats of Antarctic lakes as a source of new bioactivities. Journal of Applied Microbiology, 105, 105–115.
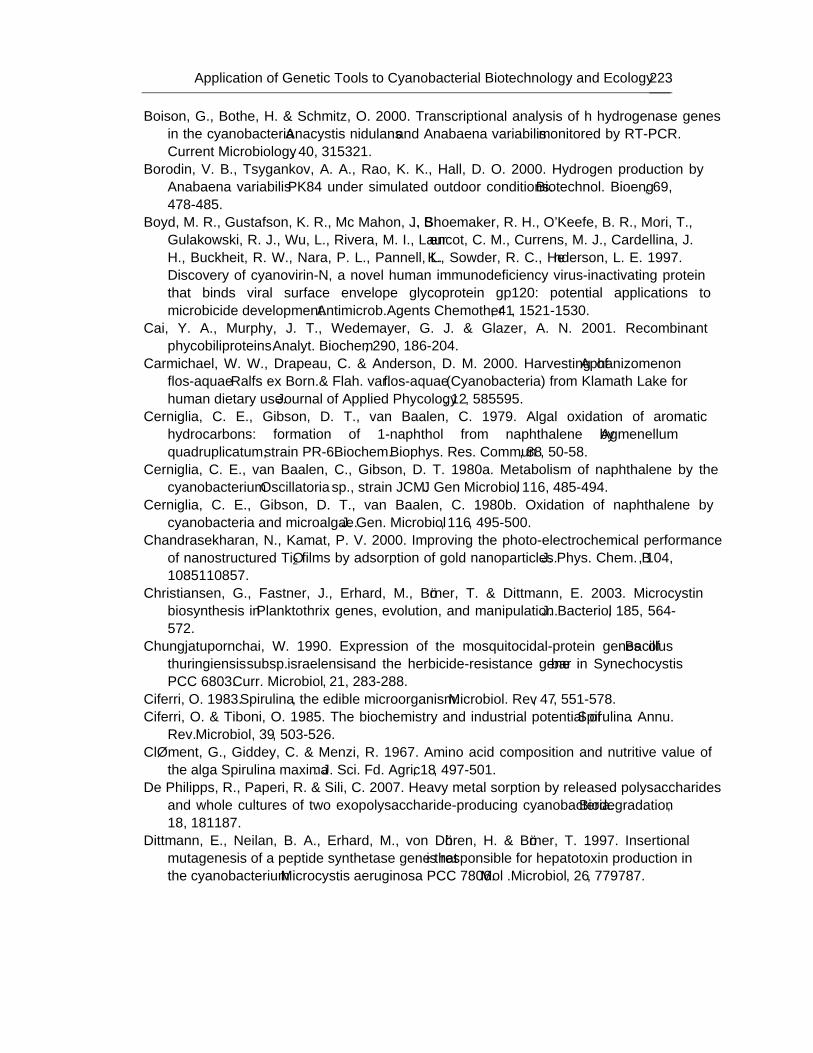
Application of Genetic Tools to Cyanobacterial Biotechnology and Ecology 223
Boison, G., Bothe, H. & Schmitz, O. 2000. Transcriptional analysis of h hydrogenase genes in the cyanobacteria Anacystis nidulans and Anabaena variabilis monitored by RT-PCR. Current Microbiology, 40, 315–321.
Borodin, V. B., Tsygankov, A. A., Rao, K. K., Hall, D. O. 2000. Hydrogen production by Anabaena variabilis PK84 under simulated outdoor conditions. Biotechnol. Bioeng, 69, 478-485.
Boyd, M. R., Gustafson, K. R., Mc Mahon, J. B., Shoemaker, R. H., O'Keefe, B. R., Mori, T., Gulakowski, R. J., Wu, L., Rivera, M. I., Laurencot, C. M., Currens, M. J., Cardellina, J. H., Buckheit, R. W., Nara, P. L., Pannell, L. K., Sowder, R. C., Henderson, L. E. 1997. Discovery of cyanovirin-N, a novel human immunodeficiency virus-inactivating protein that binds viral surface envelope glycoprotein gp120: potential applications to microbicide development. Antimicrob. Agents Chemother, 41, 1521-1530.
Cai, Y. A., Murphy, J. T., Wedemayer, G. J. & Glazer, A. N. 2001. Recombinant phycobiliproteins. Analyt. Biochem, 290, 186-204.
Carmichael, W. W., Drapeau, C. & Anderson, D. M. 2000. Harvesting of Aphanizomenon flos-aquae Ralfs ex Born.& Flah. var. flos-aquae (Cyanobacteria) from Klamath Lake for human dietary use. Journal of Applied Phycology, 12, 585–595.
Cerniglia, C. E., Gibson, D. T., van Baalen, C. 1979. Algal oxidation of aromatic hydrocarbons: formation of 1-naphthol from naphthalene by Agmenellum quadruplicatum, strain PR-6. Biochem. Biophys. Res. Commun, 88, 50-58.
Cerniglia, C. E., van Baalen, C., Gibson, D. T. 1980a. Metabolism of naphthalene by the cyanobacterium Oscillatoria sp., strain JCM. J Gen Microbiol, 116, 485-494.
Cerniglia, C. E., Gibson, D. T., van Baalen, C. 1980b. Oxidation of naphthalene by cyanobacteria and microalgae. J. Gen. Microbiol, 116, 495-500.
Chandrasekharan, N., Kamat, P. V. 2000. Improving the photo-electrochemical performance of nanostructured TiO2 films by adsorption of gold nanoparticles. J. Phys. Chem. B, 104, 10851–10857.
Christiansen, G., Fastner, J., Erhard, M., Börner, T. & Dittmann, E. 2003. Microcystin biosynthesis in Planktothrix: genes, evolution, and manipulation. J. Bacteriol, 185, 564-572.
Chungjatupornchai, W. 1990. Expression of the mosquitocidal-protein genes of Bacillus thuringiensis subsp. israelensis and the herbicide-resistance gene bar in Synechocystis PCC 6803. Curr. Microbiol, 21, 283-288.
Ciferri, O. 1983. Spirulina, the edible microorganism. Microbiol. Rev, 47, 551-578. Ciferri, O. & Tiboni, O. 1985. The biochemistry and industrial potential of Spirulina. Annu.
Rev. Microbiol, 39, 503-526. Clément, G., Giddey, C. & Menzi, R. 1967. Amino acid composition and nutritive value of
the alga Spirulina maxima. J. Sci. Fd. Agric, 18, 497-501. De Philipps, R., Paperi, R. & Sili, C. 2007. Heavy metal sorption by released polysaccharides
and whole cultures of two exopolysaccharide-producing cyanobacteria. Biodegradation, 18, 181–187.
Dittmann, E., Neilan, B. A., Erhard, M., von Döhren, H. & Börner, T. 1997. Insertional mutagenesis of a peptide synthetase gene that is responsible for hepatotoxin production in the cyanobacterium Microcystis aeruginosa PCC 7806. Mol .Microbiol, 26, 779–787.
Olga A. Koksharova 224
Dittmann, E., Erhard, M., Kaebernick, M., Scheler, C., Neilan, B. A., Dohren, H. & Börner, T. 2001. Altered expression of two light-dependent genes in a microcystin-lacking mutant of Microcystis aeruginosa PCC 7806. Microbiology, 147, 3113–3119.
Dutta, D., De, D., Chaudhuri, S. & Bhattacharya, S.K. 2005. Hydrogen production by cyanobacteria. Microbial Cell Factories, 4, 36.
Ellis, B. E. 1977. Degradation of phenolic compounds by fresh-water algae. Plant Sci. Lett, 8, 213-216.
Eriksen, N. T. 2008. Production of phycocyanin – a pigment with applications in biology, biotechnology, foods and medicine. Appl. Microbiol. Biotechnol, 80, 1-14.
Finking, R. & Marahiel, M. A. 2004. Biosynthesis of nonribosomal peptides. Annu Rev. Microbiol, 58, 453–488.
Fisher, K., Dilworth, M. J. & Newton, W. E. 2000. Differential effects on N2 binding and reduction, HD formation, and azide reduction with α-195His- and α-191Gln- substituted MoFe proteins of Azotobacter vinelandii nitrogenase. Biochemistry, 39, 15570-15577.
Fogg, G. E, Stewart, W. D. P., Fay, P. & Walsby, A. E. The Blue-Green Algae. London: Academic Press; 1973.
Gao, K. 1998. Chinese studies on the edible blue-green alga Nostoc flagelliforme: a review. J. Appl. Phycol, 10, 37-49.
Gisby, P. F., Rao, K., Hall, D. O. 1987 Entrapment techniques for chloroplasts, cyanobacteria and hydrogenases. Methods Enzymol, 135, 440-454.
Glazer, A. N. 1988. Phycobiliproteins. Methods Enzymol, 167, 291-303. Gorelova, O. A., Baulina, O. I., Shchelmanova, A. G., Korzhenevskaya, T. G. & Gusev, M.
V. 1996. Heteromorphism of the cyanobacterium Nostoc sp., a microsymbiont of the Blasia pusilla Moss. Microbiology, 65, No 6, 719-726.
Gorelova, O. A, Kosevich, I. A., Baulina, O. I. , Fedorenko, T. A., Torshkhoeva, A. Z. & Lobakova, E. S. 2009. Associations between the White Sea invertebrates and oxygen-evolving phototrophic microorganisms. Moscow University Biological Sciences Bulletin, 64, No. 1,. 16–22. © Allerton Press, Inc., 2009.
Govorov, A. O. & Carmeli, I. 2007. Hybrid structures composed of photosynthetic system and metal nanoparticles: plasmon enhancement effect. Nano Lett., 7, 620-625.
Guang, X., Qin, S., Su, Z., Zhao, F., Ge, B., Li, F. & Tang, X. 2007. Combinational biosynthesis of a fluorescent cyanobacterial holo-α-phycocyanin in Escherichia coli by using one expression vector. Appl. Biochem. Biotechnol, 142, 52-59.
Gusev, M. V., Baulina, O. I., Gorelova, O. A., Lobakova, E. S. & Korzhenevskaya, T. G. Artificial cyanobacterium-plant symbioses. In Rai,A.N., Bergman,B., Rasmussen,U. editors. Cyanobacteria in symbiosis. Dordrecht: Kluwer Academic Publishers; 2002; 253-312.
Gutthann, F., Egert, M., Margues, A. & Appel, J. 2007. Inhibition of respiration and nitrate assimilation enhances photohydrogen evolution under low oxygen concentrations in Synechocystis sp. PCC 6803. Biochimica et Biophysica Acta, 1767, 161-169.
Hai, T., Hein, S. & Steinbüchel, A. 2001. Multiple evidence for wide spread and general occurrence of type-III PHA synthases in cyanobacteria and molecular characterization of the PHA synthases from two thermophilic cyanobacteria: Chlorogloeopsis fritschii PCC 6912 and Synechococcus sp. strain MA19. Microbiology, 147, 3047–3060.
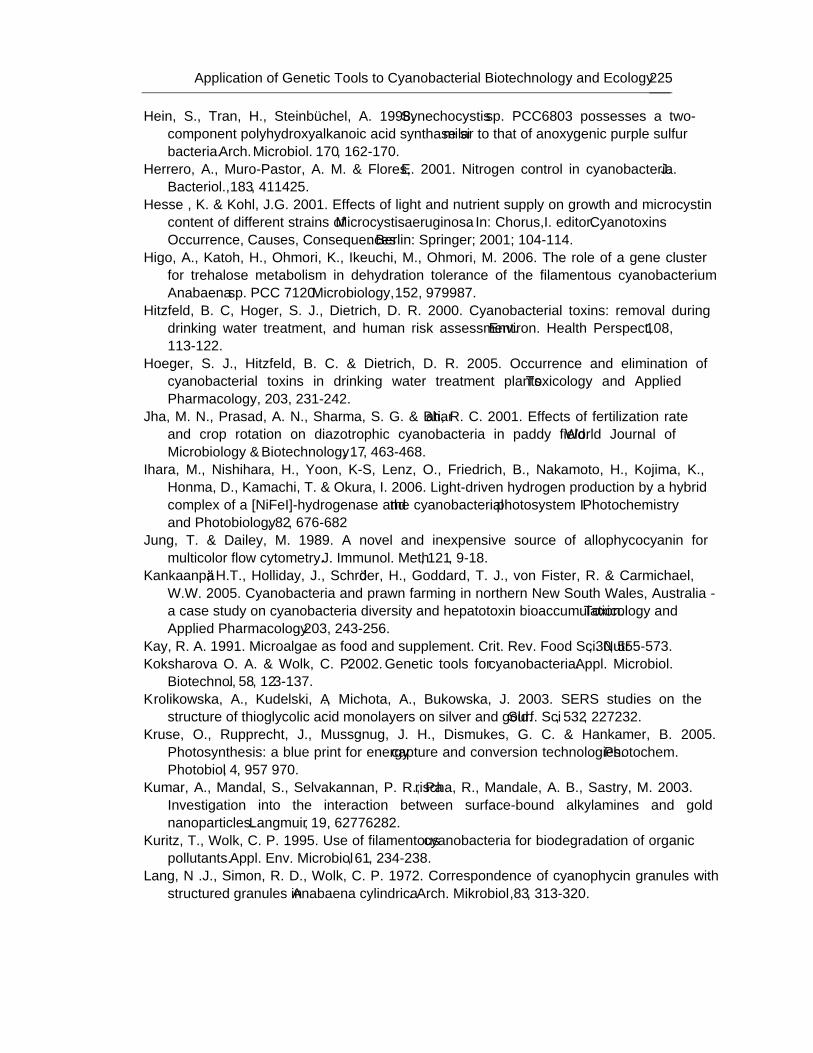
Application of Genetic Tools to Cyanobacterial Biotechnology and Ecology 225
Hein, S., Tran, H., Steinbüchel, A. 1998. Synechocystis sp. PCC6803 possesses a two-component polyhydroxyalkanoic acid synthase similar to that of anoxygenic purple sulfur bacteria. Arch. Microbiol. 170, 162-170.
Herrero, A., Muro-Pastor, A. M. & Flores, E. 2001. Nitrogen control in cyanobacteria. J. Bacteriol., 183, 411–425.
Hesse , K. & Kohl, J.G. 2001. Effects of light and nutrient supply on growth and microcystin content of different strains of Microcystis aeruginosa. In: Chorus,I. editor. Cyanotoxins – Occurrence, Causes, Consequences. Berlin: Springer; 2001; 104-114.
Higo, A., Katoh, H., Ohmori, K., Ikeuchi, M., Ohmori, M. 2006. The role of a gene cluster for trehalose metabolism in dehydration tolerance of the filamentous cyanobacterium Anabaena sp. PCC 7120. Microbiology, 152, 979–987.
Hitzfeld, B. C, Hoger, S. J., Dietrich, D. R. 2000. Cyanobacterial toxins: removal during drinking water treatment, and human risk assessment. Environ. Health Perspect, 108, 113-122.
Hoeger, S. J., Hitzfeld, B. C. & Dietrich, D. R. 2005. Occurrence and elimination of cyanobacterial toxins in drinking water treatment plants. Toxicology and Applied Pharmacology, 203, 231-242.
Jha, M. N., Prasad, A. N., Sharma, S. G. & Bharati, R. C. 2001. Effects of fertilization rate and crop rotation on diazotrophic cyanobacteria in paddy field. World Journal of Microbiology & Biotechnology, 17, 463-468.
Ihara, M., Nishihara, H., Yoon, K-S, Lenz, O., Friedrich, B., Nakamoto, H., Kojima, K., Honma, D., Kamachi, T. & Okura, I. 2006. Light-driven hydrogen production by a hybrid complex of a [NiFeI]-hydrogenase and the cyanobacterial photosystem I. Photochemistry and Photobiology, 82, 676-682
Jung, T. & Dailey, M. 1989. A novel and inexpensive source of allophycocyanin for multicolor flow cytometry. J. Immunol. Meth, 121, 9-18.
Kankaanpää, H.T., Holliday, J., Schröder, H., Goddard, T. J., von Fister, R. & Carmichael, W.W. 2005. Cyanobacteria and prawn farming in northern New South Wales, Australia - a case study on cyanobacteria diversity and hepatotoxin bioaccumulation. Toxicology and Applied Pharmacology, 203, 243-256.
Kay, R. A. 1991. Microalgae as food and supplement. Crit. Rev. Food Sci. Nutr, 30, 555-573. Koksharova O. A. & Wolk, C. P. 2002. Genetic tools for cyanobacteria. Appl. Microbiol.
Biotechnol., 58, 123-137. Krolikowska, A., Kudelski, A., Michota, A., Bukowska, J. 2003. SERS studies on the
structure of thioglycolic acid monolayers on silver and gold. Surf. Sci, 532, 227–232. Kruse, O., Rupprecht, J., Mussgnug, J. H., Dismukes, G. C. & Hankamer, B. 2005.
Photosynthesis: a blue print for energy capture and conversion technologies. Photochem. Photobiol, 4, 957 –970.
Kumar, A., Mandal, S., Selvakannan, P. R., Parischa, R., Mandale, A. B., Sastry, M. 2003. Investigation into the interaction between surface-bound alkylamines and gold nanoparticles. Langmuir, 19, 6277–6282.
Kuritz, T., Wolk, C. P. 1995. Use of filamentous cyanobacteria for biodegradation of organic pollutants. Appl. Env. Microbiol, 61, 234-238.
Lang, N .J., Simon, R. D., Wolk, C. P. 1972. Correspondence of cyanophycin granules with structured granules in Anabaena cylindrica. Arch. Mikrobiol ,83, 313-320.
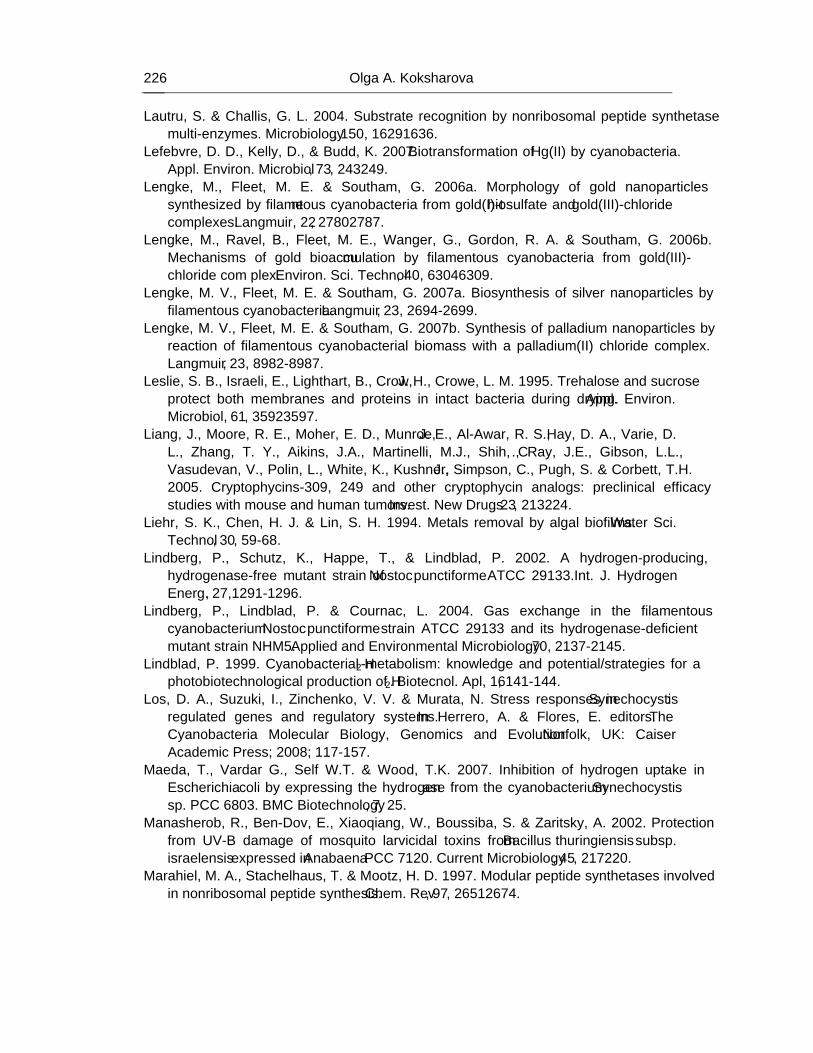
Olga A. Koksharova 226
Lautru, S. & Challis, G. L. 2004. Substrate recognition by nonribosomal peptide synthetase multi-enzymes. Microbiology, 150, 1629–1636.
Lefebvre, D. D., Kelly, D., & Budd, K. 2007. Biotransformation of Hg(II) by cyanobacteria. Appl. Environ. Microbiol, 73, 243–249.
Lengke, M., Fleet, M. E. & Southam, G. 2006a. Morphology of gold nanoparticles synthesized by filamentous cyanobacteria from gold(I)-thiosulfate and gold(III)-chloride complexes. Langmuir, 22, 2780–2787.
Lengke, M., Ravel, B., Fleet, M. E., Wanger, G., Gordon, R. A. & Southam, G. 2006b. Mechanisms of gold bioaccumulation by filamentous cyanobacteria from gold(III)-chloride com plex. Environ. Sci. Technol, 40, 6304–6309.
Lengke, M. V., Fleet, M. E. & Southam, G. 2007a. Biosynthesis of silver nanoparticles by filamentous cyanobacteria. Langmuir, 23, 2694-2699.
Lengke, M. V., Fleet, M. E. & Southam, G. 2007b. Synthesis of palladium nanoparticles by reaction of filamentous cyanobacterial biomass with a palladium(II) chloride complex. Langmuir, 23, 8982-8987.
Leslie, S. B., Israeli, E., Lighthart, B., Crow, J. H., Crowe, L. M. 1995. Trehalose and sucrose protect both membranes and proteins in intact bacteria during drying. Appl. Environ. Microbiol, 61, 3592–3597.
Liang, J., Moore, R. E., Moher, E. D., Munroe, J. E., Al-Awar, R. S., Hay, D. A., Varie, D. L., Zhang, T. Y., Aikins, J.A., Martinelli, M.J., Shih, C., Ray, J.E., Gibson, L.L., Vasudevan, V., Polin, L., White, K., Kushner, J., Simpson, C., Pugh, S. & Corbett, T.H. 2005. Cryptophycins-309, 249 and other cryptophycin analogs: preclinical efficacy studies with mouse and human tumors. Invest. New Drugs, 23, 213–224.
Liehr, S. K., Chen, H. J. & Lin, S. H. 1994. Metals removal by algal biofilms. Water Sci. Technol, 30, 59-68.
Lindberg, P., Schutz, K., Happe, T., & Lindblad, P. 2002. A hydrogen-producing, hydrogenase-free mutant strain of Nostoc punctiforme ATCC 29133. Int. J. Hydrogen Energ., 27,1291-1296.
Lindberg, P., Lindblad, P. & Cournac, L. 2004. Gas exchange in the filamentous cyanobacterium Nostoc punctiforme strain ATCC 29133 and its hydrogenase-deficient mutant strain NHM5. Applied and Environmental Microbiology, 70, 2137-2145.
Lindblad, P. 1999. Cyanobacterial H2-metabolism: knowledge and potential/strategies for a photobiotechnological production of H2. Biotecnol. Apl, 16, 141-144.
Los, D. A., Suzuki, I., Zinchenko, V. V. & Murata, N. Stress responses in Synechocystis: regulated genes and regulatory systems. In Herrero, A. & Flores, E. editors. The Cyanobacteria Molecular Biology, Genomics and Evolution.Norfolk, UK: Caiser Academic Press; 2008; 117-157.
Maeda, T., Vardar G., Self W.T. & Wood, T.K. 2007. Inhibition of hydrogen uptake in Escherichia coli by expressing the hydrogenase from the cyanobacterium Synechocystis sp. PCC 6803. BMC Biotechnology, 7, 25.
Manasherob, R., Ben-Dov, E., Xiaoqiang, W., Boussiba, S. & Zaritsky, A. 2002. Protection from UV-B damage of mosquito larvicidal toxins from Bacillus thuringiensis subsp. israelensis expressed in Anabaena PCC 7120. Current Microbiology, 45, 217–220.
Marahiel, M. A., Stachelhaus, T. & Mootz, H. D. 1997. Modular peptide synthetases involved in nonribosomal peptide synthesis. Chem. Rev, 97, 2651–2674.
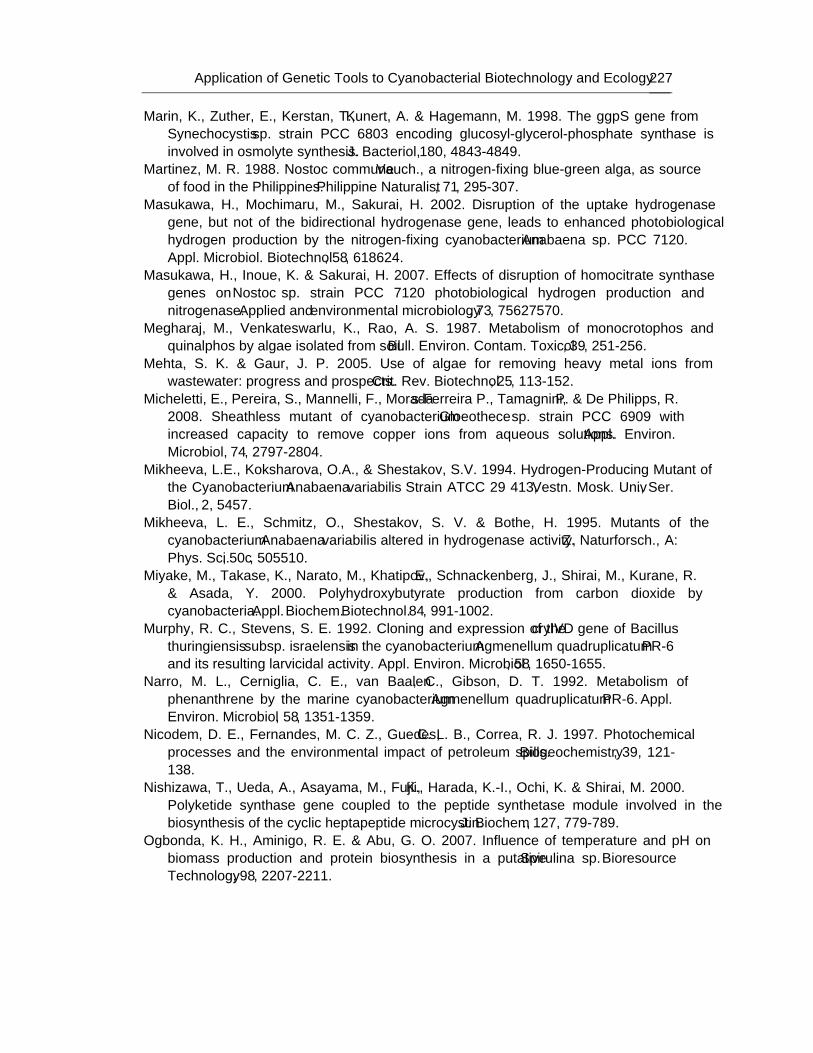
Application of Genetic Tools to Cyanobacterial Biotechnology and Ecology 227
Marin, K., Zuther, E., Kerstan, T., Kunert, A. & Hagemann, M. 1998. The ggpS gene from Synechocystis sp. strain PCC 6803 encoding glucosyl-glycerol-phosphate synthase is involved in osmolyte synthesis. J. Bacteriol, 180, 4843-4849.
Martinez, M. R. 1988. Nostoc commune Vauch., a nitrogen-fixing blue-green alga, as source of food in the Philippines. Philippine Naturalist, 71, 295-307.
Masukawa, H., Mochimaru, M., Sakurai, H. 2002. Disruption of the uptake hydrogenase gene, but not of the bidirectional hydrogenase gene, leads to enhanced photobiological hydrogen production by the nitrogen-fixing cyanobacterium Anabaena sp. PCC 7120. Appl. Microbiol. Biotechnol, 58, 618–624.
Masukawa, H., Inoue, K. & Sakurai, H. 2007. Effects of disruption of homocitrate synthase genes on Nostoc sp. strain PCC 7120 photobiological hydrogen production and nitrogenase. Applied and environmental microbiology, 73, 7562–7570.
Megharaj, M., Venkateswarlu, K., Rao, A. S. 1987. Metabolism of monocrotophos and quinalphos by algae isolated from soil. Bull. Environ. Contam. Toxicol, 39, 251-256.
Mehta, S. K. & Gaur, J. P. 2005. Use of algae for removing heavy metal ions from wastewater: progress and prospects. Crit. Rev. Biotechnol, 25, 113-152.
Micheletti, E., Pereira, S., Mannelli, F., Moradas-Ferreira P., Tamagnini, P. & De Philipps, R. 2008. Sheathless mutant of cyanobacterium Gloeothece sp. strain PCC 6909 with increased capacity to remove copper ions from aqueous solutions. Appl. Environ. Microbiol, 74, 2797-2804.
Mikheeva, L.E., Koksharova, O.A., & Shestakov, S.V. 1994. Hydrogen-Producing Mutant of the Cyanobacterium Anabaena variabilis Strain ATCC 29 413, Vestn. Mosk. Univ., Ser. Biol., 2, 54–57.
Mikheeva, L. E., Schmitz, O., Shestakov, S. V. & Bothe, H. 1995. Mutants of the cyanobacterium Anabaena variabilis altered in hydrogenase activity, Z. Naturforsch., A: Phys. Sci., 50c, 505–510.
Miyake, M., Takase, K., Narato, M., Khatipov, E., Schnackenberg, J., Shirai, M., Kurane, R. & Asada, Y. 2000. Polyhydroxybutyrate production from carbon dioxide by cyanobacteria. Appl. Biochem. Biotechnol. 84, 991-1002.
Murphy, R. C., Stevens, S. E. 1992. Cloning and expression of the cryIVD gene of Bacillus thuringiensis subsp. israelensis in the cyanobacterium Agmenellum quadruplicatum PR-6 and its resulting larvicidal activity. Appl. Environ. Microbiol, 58, 1650-1655.
Narro, M. L., Cerniglia, C. E., van Baalen, C., Gibson, D. T. 1992. Metabolism of phenanthrene by the marine cyanobacterium Agmenellum quadruplicatum PR-6. Appl. Environ. Microbiol, 58, 1351-1359.
Nicodem, D. E., Fernandes, M. C. Z., Guedes, C. L. B., Correa, R. J. 1997. Photochemical processes and the environmental impact of petroleum spills. Biogeochemistry, 39, 121-138.
Nishizawa, T., Ueda, A., Asayama, M., Fujii, K., Harada, K.-I., Ochi, K. & Shirai, M. 2000. Polyketide synthase gene coupled to the peptide synthetase module involved in the biosynthesis of the cyclic heptapeptide microcystin. J. Biochem., 127, 779-789.
Ogbonda, K. H., Aminigo, R. E. & Abu, G. O. 2007. Influence of temperature and pH on biomass production and protein biosynthesis in a putative Spirulina sp. Bioresource Technology, 98, 2207-2211.
Olga A. Koksharova 228
Page-Sharp, M., Behm, C. A. & Smith G. D. 1999. Involvement of the compatible solutes trehalose and sucrose in the response to salt stress of a cyanobacterial Scytonema species isolated from desert soils. Biochimica et Biophysica Acta, 1472, 519-528.
Pandey, A., Pandey, A., Srivastava, P. & Pandey, A. 2007. Using reverse micelles as microreactor for hydrogen production by coupled systems of Nostoc/R. palustris and Anabaena/R. palustris. World J. Microbiol. Biotechnol, 23, 269-274.
Papen, H., Kentemich, T., Schmülling, T., Bothe, H. 1986. Hydrogenase activities in cyanobacteria. Biochimie, 68, 121-132.
Parker, D. L., Mihalick, J. E., Plude, J .L., Plude, M. J., Clark, T. P., Egan, L., Flom, J. J., Rai, L. C., Kumar, H. D. 2000. Sorption of metals by extracellular polymers from the cyanobacterium Microcystis aeruginosa f. flos-aquae strain C3-40. J. Appl. Phycol, 12, 219 – 224.
Patterson, M. L. G., Baldwin, C. L., Bolis, C. M., Caplan, F. R., Karuso, H., Larsen, L. K., Levine, I. A., Moore, R. E., Nelson, C. S., Tschappat, K. D., Tuang, G. D., Furusawa, E., Furusawa, S., Norton, T. R., Raybourne, R. B. 1991. Antineoplastic activity of cultured blue-green algae (Cyanophyta). J. Phycol, 27, 530-536.
Pearson, L. A., Hisbergues, M., Börner, T., Dittmann, E. & Neilan, B.A. 2004. Inactivation of an ABC transporter gene, mcyH, results in loss of microcystin production in the cyanobacterium Microcystis aeruginosa PCC 7806. Appl. Environ. Microbiol, 70, 6370-6378.
Pereira, I., Ortega, R., Barrientos, L., Moya, M., Reyes, G. & Kramm, V. 2008. Development of a biofertilizer based on filamentous nitrogen-fixing cyanobacteria for rice crops in Chile. J. Appl. Phycol, on line.
Peto, G., Molnar, G. L., Paszti, Z., Geszti, O., Beck, A., Guczi, L. 2002. Electronic structure of gold nanoparticles deposited on SiOx/Si. Mater. Sci. Eng. C, 19, 95–99.
Potts, M. 1996. The anhydrobiotic cyanobacterial cell. Physiol. Plant, 97,788–794. Prince, R. C. & Kheshgi, H. S. 2005. The photobiological production of hydrogen: potential
efficiency and effectiveness as a renewable fuel. Crit. Rev. Microbiol., 31, 19–31. Rao, D. L. N. & Burns, R. G. 1990. The effect of surface growth of blue-green-algae and
bryophytes on some microbiological, biochem ical, and physical soil properties. Biol. Fertil. Soils, 9, 239-244.
Řezanka, T. & Dembitsky, V. M. 2006. Metabolites produced by cyanobacteria belonging to several species of the family Nostocaceae. Folia Microbiol., 51, 159-182.
Richter, R., Hejazi, M., Kraft, R., Ziegler, K., Lockau, W. 1999. Cyanophycinase, a peptidase degrading the cyanobacterial reserve material multi-L-arginyl-poly-L-aspartic acid (cyanophycin). Molecular cloning of the gene of Synechocystis sp. PCC 6803, expression in Escherichia coli, and biochemical characterization of the purified enzyme. Eur. J. Biochem, 263, 163-169.
Rouhiainen, L., Vakkilainen, T., Siemer, B.L., Buikema, W., Haselkorn, R. & Sivonen, K. 2004. Genes coding for hepatotoxic heptapeptides (microcystins) in the cyanobacterium Anabaena strain 90. Appl. Environ. Microbiol, 70, 686-692.
Rupprecht, J., Hankamer, B., Mussgnung, J.H., Ananyev, G., Dismukes, C. & Kruse O. 2006. Perspectives and advances of biological H2 production in microorganisms. Appl. Microbiol. Biotechnol, 72, 442– 449.
Application of Genetic Tools to Cyanobacterial Biotechnology and Ecology 229
Sabarinathan, K. G. & Ganesan, G. 2008. Antibacterial and toxicity evaluation of C-phycocyanin and cell extract of filamentous freshwater cyanobacterium- Westiellopsis sps. Eur. Rev. Med. Pharmacol Sci, 12, 79-82.
Schmitz, O., Boison, G., Hilscher, R., Hundeshagen, B., Zimmer, W., Lottspeich, F. & Bothe, H. 1995. Molecular biological analysis of a bidirectional hydrogenase from cyanobacteria. Eur. J. Biochem. 233, 266-276.
Schumacher, G., Blume T. & Sekoulov I. 2003. Bacteria reduction and nutrient removal in small wastewater treatment plants by an algal biofilm. Water Sci. Technol, 47, 195– 202.
Schütz, K., Happe, T., Troshina, O., Lindblad, P., Leitão, E., Oliveira, P. & Tamagnini, P. 2004. Cyanobacterial H2 production – a comparative analysis. Planta, 218, 350-359.
Schwartz, S. H., Black, T. A., Jäger, K., Panoff, J-M, Wolk, C. P. 1998. Regulation of an osmoticum-responsive gene in Anabaena sp. strain PCC 7120. J. Bacteriol, 180, 6332-6337.
Shestakov, S. V & Mikheeva, L. E. 2006. Genetic control of hydrogen metabolism in cyanobacteria. Russian Journal of Genetics, 42, 1272-1284.
Sekar, S. & Chandramohan, M. 2008. Phycobiliproteins as a commodity: trends in applied research, patents and commercialization. J. Appl. Phycol, 20, 113-136.
Serebryakova, L. T. & Tsygankov, A. A., 2007. Two-stage system for hydrogen production by immobilized cyanobacterium Gloeocapsa alpicola CALU 743. Biotechnol. Prog., 23, 1106-1110.
Sieber, S. A. & Marahiel, M. A. 2005. Molecular mechanisms underlying non-ribosomal peptide synthesis: approaches to new antibiotics. Chem. Rev, 105, 715-738.
Simon, R. D. 1971. Cyanophycin granules from the blue-green alga Anabaena cylindrica: a reserve material consisting of copolymers of aspartic acid and arginine. Proc. Natl. Acad. Sci. USA, 68, 265-267.
Simon, R. D. 1973a. The effect of chloramphenicol on the production of cyanophycin granule polypeptide in the blue-green alga Anabaena cylindrica. Arch. Mikrobiol , 92, 115-123.
Simon, R. D. 1973b. Measurement of the cyanophycin granule polypeptide contained in the blue-green alga Anabaena cylindrica. J. Bacteriol, 114, 1213-1216.
Simon, R. D. 1976. The biosynthesis of multi-L-arginyl-poly(L-aspartic acid) in the filamentous cyanobacterium Anabaena cylindrica. Biochim. Biophys. Acta, 422, 407-418.
Simon, R. D. Inclusion bodies in the cyanobacteria: cyanophycin, polyphosphate, polyhedral bodies. In: FayP,Van BaalenC. editors. The Cyanobacteria. Amsterdam: Elsevier Science Publishers B.V.; 1987; 199-225.
Sivonen, K. & Jones, G. Cyanobacterial toxins. In: Chorus, I., Bartram, J. editors. Toxic Cyanobacteria in Water. London: E&FN Spon; 1999; 41-111.
Sivonen, K. & Börner, T. Bioactive compounds produced by cyanobacteria. In: Herrero,A.,Flores, E. editors. The Cyanobacteria Molecular Biology, Genomics and Evolution. Norfolk, UK: Caiser Academic Press; 2008; 158-197.
Sjöholm, J., Oliveira, P. & Lindblad, P. 2007. Transcription and regulation of the bidirectional hydrogenase in the cyanobacterium Nostoc sp. strain PCC 7120. Appl. Environ. Microbiol, 73, 5435–5446.
Soltes-Rak, E., Kushner, D. J., Williams, D. D, Coleman, J. R. 1993. Effect of promoter modification on mosquitocidal cryIVB gene expression in Synechococcus sp. strain PCC 7942. Appl. Environ. Microbiol, 59, 2404-2410.
Olga A. Koksharova 230
Soltes-Rak, E., Kushner, D. J., Williams, D. D., Coleman, J. R. 1995. Factors regulating cryIVB gene expression in the cyanobacterium Synechococcus PCC 7942. Mol. Gen. Genet, 246, 301-308.
Soni, B., Trivedi, U. & Madamwar, D. 2008. A novel method of single step hydrophobic interaction chromatography for the purification of phycocyanin from Phormidium fragile and its characterization for antioxidant property. Bioresource Technology, 99, 188-194.
Sorkhoh, N., Al-Hasan, R., Radwan, S. & Höpner, T. 1992. Self-cleaning of the Gulf. Nature, 359, 109.
Sorkhoh, N. A., Al-Hasan, R. H., Khanafer, M. & Radwan, S. S. 1995. Establishment of oil-degrading bacteria associated with cyanobacteria in oil-polluted soil. J. Appl. Bacteriol, 78, 194-199.
Stewart, I., Schluter, P. J. & Shaw, G. R. 2006. Cyanobacterial lipopolysaccharides and human health – a review. Environmental Health: A Global Access Science Source, 5, 7.
Subhashini, J., Mahipal, S. V., Reddy, M. C., Mallikarjuna Reddy, M. Rachamallu, A. & Reddanna, P. 2004. Molecular mechanisms in C-Phycocyanin induced apoptosis in human chronic myeloid leukemia cell line-K562. Biochemical Pharmacology, 68, 453-462.
Sun, L., Wang, S., Chen, L. & Gong, X. 2003. Promising fluorescent probes from phycobiliproteins. IEEE J. Sel. Top Quantum Electron, 9, 177-188.
Suzuki, I., Kanesaki, Y., Mikami, K., Kanehisa, M., Murata, N. 2001. Cold-regulated genes under control of the cold sensor Hik33 in Synechocystis. Mol. Microbiol, 40, 235-244.
Sveshnikov, D. A., Sveshnikova, N. V., Rao, K. K., Hall, D. O. 1997. Hydrogen metabolism of mutant forms of Anabaena variabilis in continuous cultures and under nutritional stress. FEMS Microbiol. Lett, 147, 297-301.
Takenaka, H., Yamaguchi, Y., Sakaki, S., Watarai, K., Tanaka, N., Hori, M., Seki, H., Tsuchida, M., Yamada, A., Nishimori, T. & Morinaga, T. 1998. Safety evaluation of Nostoc flagelliforme (nostocales [sic], Cyanophyceae) as a potential food. Food Chem. Toxicol, 36, 1073-1077.
Tamagnini, P., Costa, J.-L., Almeida, L., Olivera, M.-J., Salema, R.& Lindblad, P. 2000. Diversity of cyanobacterial hydrogenases, a molecular approach. Curr. Microbiol,40, 356-361.
Tamagnini, P., Axelsson, R., Lindberg, P., Oxelfelt, F., Wünschiers, R. & Lindblad, P. 2002. Hydrogenases and hydrogen metabolism of cyanobacteria. Microbiol. Mol. Biol. Rev., 66, 1–20.
Tamagnini, P., Leitão, E., Oliveira, P., Ferreira, D., Pinto, F., Harris, D. J., Heidorn, T.& Lindblad, P. 2007. Cyanobacterial hydrogenases: diversity, regulation and applications. FEMS Microbiol. Rev, 31, 692–720.
Tandeau de Marsac, N., de la Torre, F. & Szulmajster, J. 1987. Expression of the larvicidal gene of Bacillus sphaericus 1593M in the cyanobacterium Anacystis nidulans R2. Mol. Gen. Genet, 209, 396-398.
Taroncher-Oldenburg, G., Nishina, K. & Stephanopoulos, G. 2000. Identification and analysis of the polyhydroxyalkanoate-specific β-ketothiolase and acetoacetyl coenzyme A reductase genes in the cyanobacterium Synechocystis sp. strain PCC6803. Appl. Environ. Microbiol, 66, 4440-4448.
Application of Genetic Tools to Cyanobacterial Biotechnology and Ecology 231
Thiery, I., Nicolas, L., Rippka, R., Tandeau de Marsac, N. 1991. Selection of cyanobacteria isolated from mosquito breeding sites as a potential food source for mosquito larvae. Appl. Environ. Microbiol, 57, 1354-1359.
Tiwari, D. N. 1978. The heterocysts of the blue-green alga Nostochopsis lobatus: effects of cultural conditions. New Phytol, 81, 853-856.
Tsygankov, A. A., Borodin, V. B., Rao, K. K. & Hall, D. O.1999. H2 photoproduction by batch culture of Anabaena variabilis ATCC 29413 and its mutant PK84 in a photo-bioreactor. Biotechnol. Bioeng., 64, 709– 715.
Tsygankov, A. A., Serebryakova, L. T., Rao, K. K., & Hall, D. O. 1998. Acetylene reduction and hydrogen photo-production by wild type and mutant strains of Anabaena at different CO2 and O2 concentrations. FEMS Microbiol. Lett., 167, 13–17.
Tsygankov, A. A., Fedorov, A. S., Kosourov, S. N. & Rao, K. 2002. Hydrogen production by cyanobacteria in an automated outdoor photobioreactor under aerobic conditions. Biotechnology and Bioengineering, 80, 777-783.
Vignais, P.M. & Colbeau, A. 2004. Molecular biology of microbial hydrogenases. Curr. Issues Mol. Biol., 6, 159-188.
Vincenzini, M. & De Philippis, R. Polyhydroxyalkanoates. In Cohen,Z., editor. Chemicals from Microalgae. London: Taylor & Francis; 1999; 292-312.
Vinnemeier, J. & Hagemann, M. 1999. Identification of salt-regulated genes in the genome of the cyanobacterium Synechocystis sp. strain PCC 6803 by subtractive RNA hybridization. Arch. Microbiol, 172, 377-386.
Wiegand, C. & Pflugmacher, S. 2005. Ecotoxicological effects of selected cyanobacterial secondary metabolites a short review. Toxicology and Applied Pharmacology, 203, 201 – 218.
Wilkinson, C. R. & Fay, P. 1979. Nitrogen fixation in coral reef sponges with symbiotic cyanobacteria. Nature, 279, 527-529.
Wimpenny, J., Manz, W. & Szewzyk, U. 2000. Heterogeneity in biofilms. FEMS Microbiol Rev, 24, 661-671.
Wolk, C. P. Developmental biology of nitrogen-fixing cyanobacteria.In: Bird K., editor, MSU-DOE Plant Research Laboratory, Fortieth Annual Report; Howard Printing Company, Kalamazoo, MI, 2005; 81-90.
Wu, J. & Pond, W. 1981. Amino acid composition and microbial contamination of Spirulina maxima, a blue-green alga, grown on the effluent of different fermented animal wastes. Bull . Environ. Contam. Toxicol, 27, 151-159.
Wu, X., Vennison, S. J., Liu, H., Ben-Dov, E., Zaritsky, A. & Boussiba, S. 1997. Mosquito larvicidal activity of transgenic Anabaena strain PCC 7120 expressing combinations of genes from Bacillus thuringiensis subsp. israelensis. Appl. Environ. Microbiol, 63, 4971-4975.
Xu, X., Kong, R. & Hu, Y 1993. High larvicidal activity of intact recombinant cyanobacterium Anabaena sp. PCC 7120 expressing gene 51 and gene 42 of Bacillus sphaericus sp. 2297. FEMS Microbiol. Lett, 107, 247-250.
Xu, X., Yan, G., Kong, R., Liu, X., Yu, L. 2000. Analysis of expression of the binary toxin genes from Bacillus sphaericus in Anabaena and the potential in mosquito control. Curr. Microbiol, 41, 352-356.
Yoon, J. H., Shin, J-H. & Park T.H. 2008. Characterization of factors influencing the growth of Anabaena variabilis in a bubble column reactor. Bioresource Technology, 99, 1204-1210.
Olga A. Koksharova 232
Yoshino, F., Ikeda, H., Masukawa, H. & Sakurai, H. 2007. High photobiological hydrogen production activity of a Nostoc sp. PCC 7422 uptake hydrogenase-deficient mutant with high nitrogenase activity. Marine Biotechnology, 9, 101–112.
Yu, R., Yamada, A., Watanabe, K., Yazawa, K., Takeyama, H., Matsunaga, T. & Kurane, R. 2000. Production of eicosapentaenoic acid by a recombinant marine cyanobacterium, Synechococcus sp. Lipids, 35, 1061-1064.
Ziegler, K., Diener, A., Herpin, C., Richter, R., Deutzmann, R. & Lockau, W. 1998. Molecular characterization of cyanophycin synthetase, the enzyme catalyzing the biosynthesis of the cyanobacterial reserve material multi-L-arginyl-poly-L-aspartate (cyanophycin). Eur. J. Bch, 254, 154-159.
In: Handbook on Cyanobacteria ISBN: 978-1-60741-092-8 Editors: P. M. Gault and H. J. Marler © 2009 Nova Science Publishers, Inc.
Chapter 7
PENTAPEPTIDE REPEAT PROTEINS AND CYANOBACTERIA
Garry W. Buchko Biological Sciences Division, Pacific Northwest National Laboratory,
Richland, WA 99352, U.S.A.
ABSTRACT
Cyanobacteria are unique in many ways and one unusual feature is the presence of a suite of proteins that contain at least one domain with a minimum of eight tandem repeated five-residues (Rfr) of the general consensus sequence A[N/D]LXX. The function of such pentapeptide repeat proteins (PRPs) are still unknown, however, their prevalence in cyanobacteria suggests that they may play some role in the unique biological activities of cyanobacteria. As part of an inter-disciplinary Membrane Biology Grand Challenge at the Environmental Molecular Sciences Laboratory (Pacific Northwest National Laboratory) and Washington University in St. Louis, the genome of Cyanothece 51142 was sequenced and its molecular biology studied with relation to circadian rhythms. The genome of Cyanothece encodes for 35 proteins that contain at least one PRP domain. These proteins range in size from 105 (Cce_3102) to 930 (Cce_2929) amino acids with the PRP domains ranging in predicted size from 12 (Cce_1545) to 62 (cce_3979) tandem pentapeptide repeats. Transcriptomic studies with 29 out of the 35 genes showed that at least three of the PRPs in Cyanothece 51142 (cce_0029, cce_3083, and cce_3272) oscillated with repeated periods of light and dark, further supporting a biological function for PRPs. Using X-ray diffraction crystallography, the structure for two pentapeptide repeat proteins from Cyanothece 51142 were determined, cce_1272 (aka Rfr32) and cce_4529 (aka Rfr23). Analysis of their molecular structures suggests that all PRP may share the same structural motif, a novel type of right-handed quadrilateral β-helix, or Rfr-fold, reminiscent of a square tower with four distinct faces. Each pentapeptide repeat occupies one face of the Rfr-fold with four consecutive pentapeptide repeats completing a coil that, in turn, stack upon each other to form “protein skyscrapers”. Details of the structural features of the Rfr-fold are reviewed here together with a discussion for the possible role of end-to-end aggregation in PRPs.
Garry W. Buchko 234
1. INTRODUCTION As complete genome sequence information became available for many organisms,
Bateman et al. [1] recognized the existence of a novel family of proteins containing tandem pentapeptide repeats that was approximately described as A[D/N]LXX. Today, the Pfam database [2] lists over 4700 pentapeptide repeat proteins (PRPs) (Pfam00805) and the pentapeptide repeat sequence has been more accurately defined as [S,T,A,V][D,N][L,F][S,T,R][G] [3]. It is now apparent that these tandem pentapeptide repeats adopt a regular three-dimensional structure called the repeated five-residue (Rfr) domain or fold [4-6]. In the majority of PRPs, the Rfr-fold itself is the only recognizable domain [3]. In the remaining PRPs the Rfr-domain is attached to domains with many diverse annotated functions such as the WD40 β-transduction repeat, Ser/Thr protein kinase, and tetratricopeptide repeat [3]. Pentapeptide repeat proteins are found primarily in prokaryotes, however, they are also observed in the genomes of eukaryotes, including humans. In prokaryotes, the number of chromosomal PRPs is not evenly distributed with cyanobacteria genomes especially endowed with PRPs. For example 16, 35, and 40 PRPs have been identified in the genomes of Synechocystis sp. strain PCC6803 [1], Cyanothece sp. strain 51142 [5, 7] and Nostoc punctiforme [3], respectively. The ubiquitous presence of PRPs in cyanobacteria, and their predicted location in all the cyanobacteria cellular compartments, suggests that may play some role in the two primary activities of these organisms, photosynthesis and nitrogen fixation, although a function for the Rfr-fold has not yet been identified.
The first protein identified with pentapeptide repeats was described in 1995 with the discovery of the hglK gene in the cyanobacterium Anabaena sp. strain PCC 7120 [8]. The N-terminus of the protein encoded by the 727-residue hglK gene was predicted to contain four membrane-spanning regions followed by a region containing 36 consecutive pentapeptide repeats. Chemical mutagenesis was used to insert a stop-codon just before the Rfr-domain of the hglK gene in Anabaena. The consequence was mutants incapable of forming a thick glycolipid layer external to the cell wall. The conclusions were that the HglK protein was membrane-associated and the Rfr-domain was necessary for glycolipid transport and/or localization during heterocyst formation [8]. However, the precise biochemical function and the three-dimensional structure of the HglK protein still remains unknown.
A few years later a 398-residue PRP with a motif organization similar to the Anabaena 7120 HglK protein was identified in the photosynthetic bacterium Synechocystis sp. strain 6803 [4]. This protein, called RfrA, contained four membrane-spanning regions at its N-terminus followed by 12 consecutive pentapeptide repeats at its C-terminus [4]. Biochemical data suggested that RfrA was involved in the regulation of a manganese transport system different from the more fully characterized ABC-transporter system in Synechocystis 6803. However, if RfrA is involved in manganese transport, the mechanism of regulation is still unknown. Two hypotheses are that RfrA alters the expression of a second “mystery” manganese transporter (transcriptional) that has yet to be identified, or, it may reversibly modify this second transporter (posttranslational) [4].
Both the hglK and rfrA genes are found in the chromosomes of the cyanobacteria Anabaena and Synechocystis, respectively. Plasmids encoding protein containing an Rfr-fold have been identified in many species of non-photosynthethic Enterobacteriaceae [9, 10].
Pentapeptide Repeat Proteins and Cyanobacteria 235
Biochemical characterization of one such protein, Qnr, shows that it protects Escherichia coli DNA gyrase and DNA topoisomerase IV from the inhibitory effects of powerful fluoroquinolone antibiotics in vitro [9, 11]. Fluoroquinolones manifest their antibacterial properties by binding reversibly to the complexes formed between DNA and the proteins DNA gyrase and DNA topoisomerase IV [12]. They stabilize a covalent tyrosyl-DNA phosphate ester that normally is a transient intermediate, and thus, prevents regulation of the DNA. The ensuing phospho-phenolic linkage is eventually hydrolyzed and a DNA double-strand break is generated. Accumulation of double-strand breaks is fatal to the cell [13]. Because the Qnr protein was observed to compete with DNA for binding to DNA gyrase [11] it was hypothesized that the antibiotic resistance provided by this PRP may be due to its interaction with DNA gyrase that prevents normal DNA binding. Structural evidence for such a mechanism was recently provided with the crystal structure of the first PRP, Rv3361c from Mycobacterium tuberculosis [14].
Rv3361c is a 183-residue protein [14] that was targeted for study because it was identified as a homolog (67% identical) to a 193-residue protein in Mycobacterium smegmatis that was shown to be responsible for fluoroquinolone resistance in this fast-growing mycobacterium [14, 15]. In M. smegmatis the mycobacterial fluoroquinoline resistance protein, MfpA, is expressed on a multi-copy plasmid while in M. tuberculosis the protein is part of the chromosomal DNA. The Rv3361c protein forms a dimer in solution with each monomer containing 30 consecutive pentapeptide repeats. The crystal structure revealed that the tandem pentapeptide repeats formed a novel protein fold described as a right-handed quadrilateral β-helix, or Rfr-fold [14]. In Rv3361c the tower-like motifs are aligned head-to-head to form a long, rod-like dimer that exhibits characteristics similar to B-form DNA, including size, shape, and predominately electronegative surface potential distribution. Indeed, the Rv3361c structure can be readily docked on to the crystal structure of an N-terminal construct of E. coli DNA gyrase A subunit [16], a protein with a large electropositive surface potential at the position where DNA is believe to bind, and act as a DNA mimic. This structural data showing that the Rv3361c dimer and E. coil DNA gyrase have the potential to interact was supported by biochemical data showing that Rv3361c inhibits the supercoiling and relaxing activity of E. coli DNA gyrase [14].
There are at least two other examples of bacterial plasmids that offer antibiotic resistance via proteins that also contain tandem pentapeptide repeats in their amino acid sequence, E. coli McbG [17] and Bacillus magaterium oxetanocin A [18]. The McbG protein is responsible for resistance to the peptide antibiotic Microsin B17 [17]. Microsin B17, like fluoroquinolones, kill bacteria by generating DNA double-strand breaks. However, while McbG interacts with the same protein as fluoroquinolones to produce DNA damage (DNA gyrase [19]) details of the biochemical mechanism differ as Microsin B17 traps a transient intermediate in the C-terminal domain of GyrB instead [20]. The oxetanocin A protein and its derivatives are powerful inhibitors of HIV reverse transcriptase and viral DNA polymerases [21]. McbG and OxrA contain 13 and nine tandem pentapeptide repeats, respectively, and it has been suggested that this may be enough consecutive repeats to provide antibiotic resistance in a mechanism similar to that proposed for MfpA and fluoroquinolones; by acting as a DNA mimic for the antibiotic’s target enzyme [3].
Providing resistance to fluoroquinolones and other antibiotics is clearly one biochemical function of PRPs expressed from bacterial plasmids. Persuasive evidence suggests that the mechanism of resistance is via DNA mimicry [3, 14]. The origins of antibiotic resistance
Garry W. Buchko 236
genes on these bacterial plasmids are likely PRP genes from chromosomal DNA of other organisms that have functions removed from antibiotic resistance. However, little is known about the biochemical function of chromosomal PRP genes. Overexpression of a protein that is essentially all pentapeptide repeats, hetL from Anabaena 7120, has been shown to stimulate heterocyst formation in this organism [22]. In Anabaena and other similar cyanobacteria, heterocysts are specially differentiated cells that carry out nitrogen fixation, a process that is intolerant of the oxygen generated during photosynthesis [23]. However, in Cyanothece, to perform the mutually exclusive functions of photosynthesis and nitrogen fixation, these organisms have temporally separated them into daytime and nighttime activities, respectively. Indeed, cyanobacteria are the simplest known organisms that display circadian rhythms [24-26]. Hence, unless the PRPs in Cyanothece and other non-heterocyst forming cyanobacteria are evolutionary vestiges from heterocyst-forming bacteria, chromosomal PRP likely have other biochemical roles.
In order to gain insights into the potential molecular function(s) of PRPs, the three-dimensional structure of proteins in the PRP family have recently been determined. To date, only four PRP crystal structures have been determined from the 4700 plus predicted PRPs identified in all the sequenced genomes [5, 6, 14, 27]. However, as predicted from the repeating nature of their primary amino acid sequence [1], the structure adopted by the tandem pentapeptide repeats, the Rfr-fold, is similar in these four structures. Some details of the general structural features of the Rfr-fold are summarized here along with a discussion for the possible role of type II β-turns in end-to-end aggregation.
2. PRPS AND CYANOTHECE 51142 As mentioned, the genome of Cyanothece 51142 has recently been sequenced (GenBank
accession number CP000806-CP000811) and observed to contain 35 PRP genes [5, 7]. Table 1 summarizes the features of these PRPs including the predicting number of pentapeptide repeats in the Rfr-fold, predicted location of the PRP in the cyanobacterium based on SOSUIsignal analysis of the sequences [28], and BLAST results [5]. In Cyanothece, the PRPs range in size from 105 to 930 residues, however, 80% are under 400 residues. Four of the 35 PRPs are predicted to contain two or more predicted Rfr-folds in the sequence, cce_4397, cce_0029, cce_1979, and cce_4799. It will be necessary to solve the structure of these proteins to determine if the Rfr-regions are separate individual domains in these proteins, or, like cce_4529, stack upon each other to form one continuous Rfr-domain. Only five of the PRPs contained BLAST-identified additional domains. SOSUIsignal analysis suggests that these proteins will be found in all three major cellular compartments, the cytoplasmic space [20], membrane [10], and luminal/periplasmic space [5], providing circumstantial evidence that these proteins may have some type of biochemical role [5]. Physical evidence that PRPs may play a biochemical role in cyanobacteria comes from transcriptomics microarray data on 29 of the 35 PRP genes for Cyanothece sp. 51142 cultures grown as previously described [29] for 48 h in alternating 12-hour periods of light and dark [30]. Figure 1 shows the results of global transcriptomic data (European Bioinformatics Institute AssayExpress database - accession numbers A-MEXP-864 and E-TABM-337) for three of the PRP genes that showed distinct oscillations with periods of light and dark. It is difficult to imagine why these PRPs
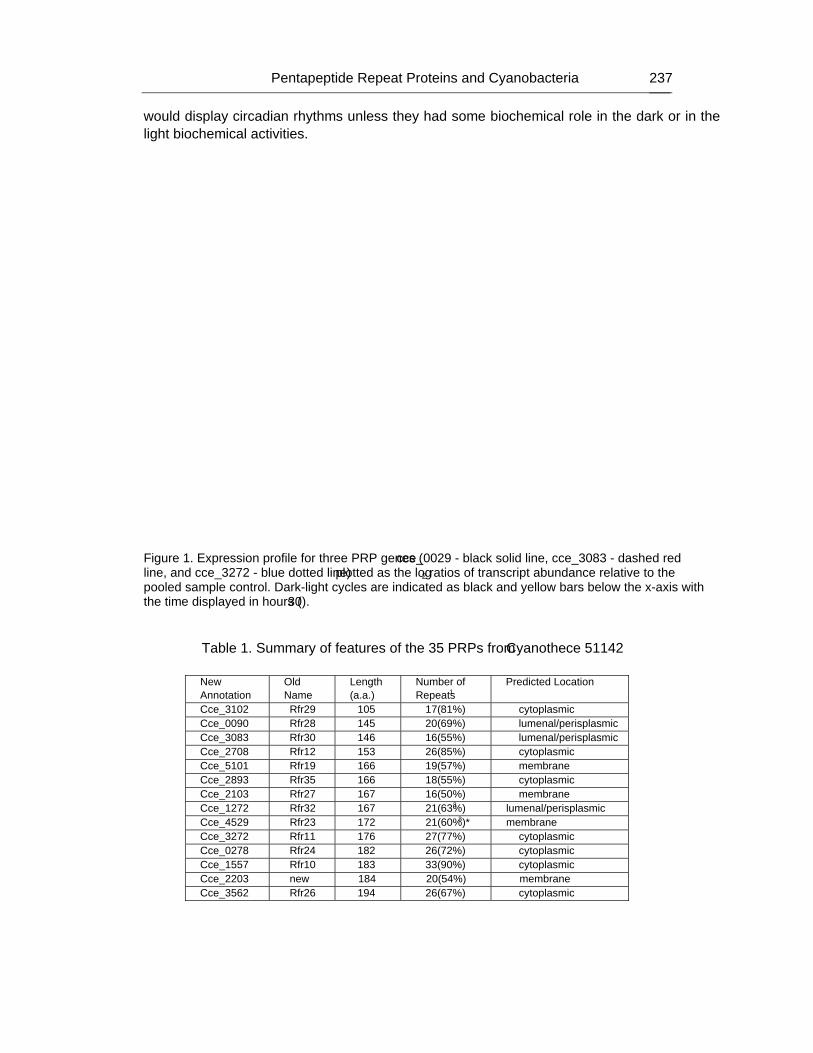
Pentapeptide Repeat Proteins and Cyanobacteria 237
would display circadian rhythms unless they had some biochemical role in the dark or in the light biochemical activities.
Figure 1. Expression profile for three PRP genes (cce_0029 - black solid line, cce_3083 - dashed red line, and cce_3272 - blue dotted line) plotted as the log2 ratios of transcript abundance relative to the pooled sample control. Dark-light cycles are indicated as black and yellow bars below the x-axis with the time displayed in hours (30).
Table 1. Summary of features of the 35 PRPs from Cyanothece 51142
New Annotation
Old Name
Length (a.a.)
Number of Repeats1
Predicted Location
Cce_3102 Rfr29 105 17(81%) cytoplasmic Cce_0090 Rfr28 145 20(69%) lumenal/perisplasmic Cce_3083 Rfr30 146 16(55%) lumenal/perisplasmic Cce_2708 Rfr12 153 26(85%) cytoplasmic Cce_5101 Rfr19 166 19(57%) membrane Cce_2893 Rfr35 166 18(55%) cytoplasmic Cce_2103 Rfr27 167 16(50%) membrane Cce_1272 Rfr32 167 21(63%)3 lumenal/perisplasmic Cce_4529 Rfr23 172 21(60%)*3 membrane Cce_3272 Rfr11 176 27(77%) cytoplasmic Cce_0278 Rfr24 182 26(72%) cytoplasmic Cce_1557 Rfr10 183 33(90%) cytoplasmic Cce_2203 new 184 20(54%) membrane Cce_3562 Rfr26 194 26(67%) cytoplasmic
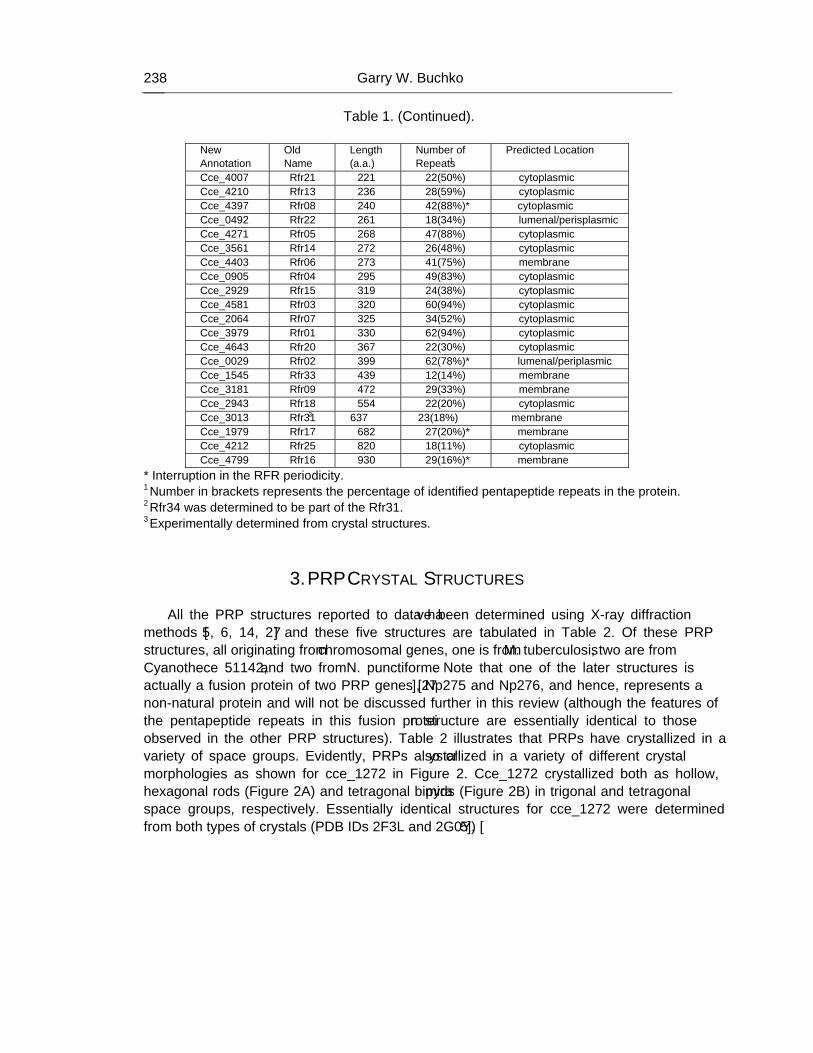
Garry W. Buchko 238
Table 1. (Continued).
New Annotation
Old Name
Length (a.a.)
Number of Repeats1
Predicted Location
Cce_4007 Rfr21 221 22(50%) cytoplasmic Cce_4210 Rfr13 236 28(59%) cytoplasmic Cce_4397 Rfr08 240 42(88%)* cytoplasmic Cce_0492 Rfr22 261 18(34%) lumenal/perisplasmic Cce_4271 Rfr05 268 47(88%) cytoplasmic Cce_3561 Rfr14 272 26(48%) cytoplasmic Cce_4403 Rfr06 273 41(75%) membrane Cce_0905 Rfr04 295 49(83%) cytoplasmic Cce_2929 Rfr15 319 24(38%) cytoplasmic Cce_4581 Rfr03 320 60(94%) cytoplasmic Cce_2064 Rfr07 325 34(52%) cytoplasmic Cce_3979 Rfr01 330 62(94%) cytoplasmic Cce_4643 Rfr20 367 22(30%) cytoplasmic Cce_0029 Rfr02 399 62(78%)* lumenal/periplasmic Cce_1545 Rfr33 439 12(14%) membrane Cce_3181 Rfr09 472 29(33%) membrane Cce_2943 Rfr18 554 22(20%) cytoplasmic Cce_3013 Rfr312 637 23(18%) membrane Cce_1979 Rfr17 682 27(20%)* membrane Cce_4212 Rfr25 820 18(11%) cytoplasmic Cce_4799 Rfr16 930 29(16%)* membrane
* Interruption in the RFR periodicity. 1 Number in brackets represents the percentage of identified pentapeptide repeats in the protein. 2 Rfr34 was determined to be part of the Rfr31. 3 Experimentally determined from crystal structures.
3. PRP CRYSTAL STRUCTURES All the PRP structures reported to data have been determined using X-ray diffraction
methods [5, 6, 14, 27] and these five structures are tabulated in Table 2. Of these PRP structures, all originating from chromosomal genes, one is from M. tuberculosis, two are from Cyanothece 51142, and two from N. punctiforme. Note that one of the later structures is actually a fusion protein of two PRP genes [27], Np275 and Np276, and hence, represents a non-natural protein and will not be discussed further in this review (although the features of the pentapeptide repeats in this fusion protein structure are essentially identical to those observed in the other PRP structures). Table 2 illustrates that PRPs have crystallized in a variety of space groups. Evidently, PRPs also crystallized in a variety of different crystal morphologies as shown for cce_1272 in Figure 2. Cce_1272 crystallized both as hollow, hexagonal rods (Figure 2A) and tetragonal bipyramids (Figure 2B) in trigonal and tetragonal space groups, respectively. Essentially identical structures for cce_1272 were determined from both types of crystals (PDB IDs 2F3L and 2G0Y) [5].
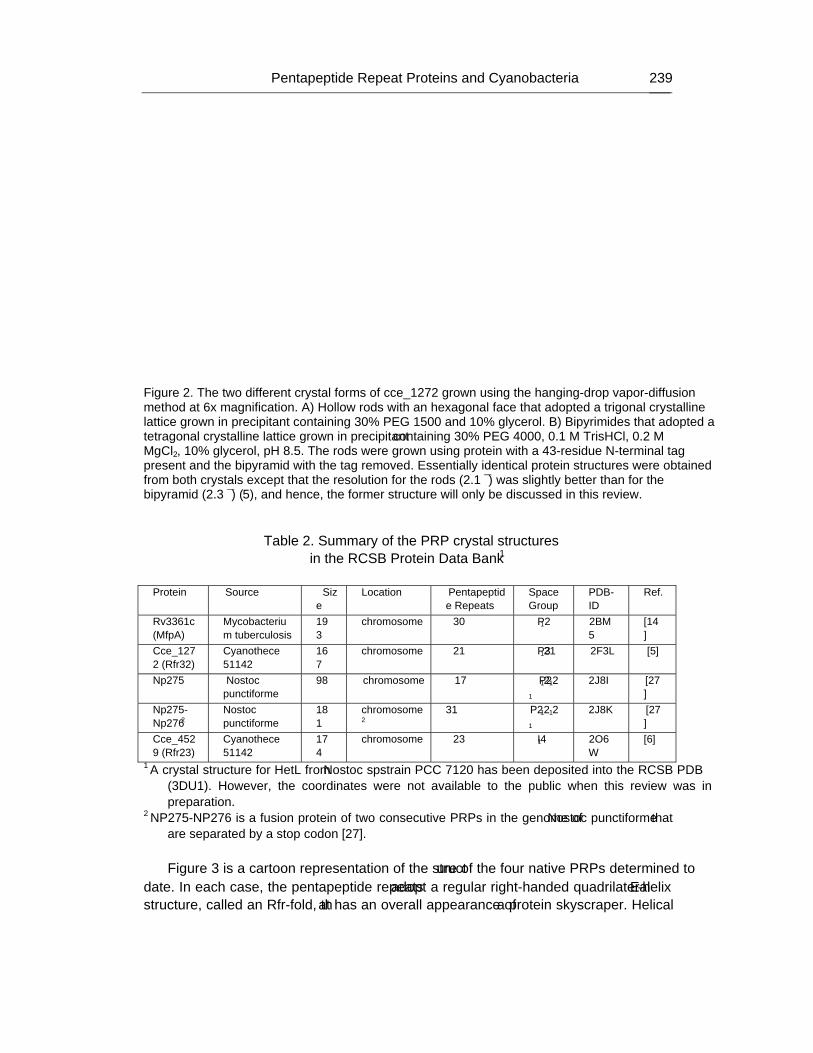
Pentapeptide Repeat Proteins and Cyanobacteria 239
Figure 2. The two different crystal forms of cce_1272 grown using the hanging-drop vapor-diffusion method at 6x magnification. A) Hollow rods with an hexagonal face that adopted a trigonal crystalline lattice grown in precipitant containing 30% PEG 1500 and 10% glycerol. B) Bipyrimides that adopted a tetragonal crystalline lattice grown in precipitant containing 30% PEG 4000, 0.1 M TrisHCl, 0.2 M MgCl2, 10% glycerol, pH 8.5. The rods were grown using protein with a 43-residue N-terminal tag present and the bipyramid with the tag removed. Essentially identical protein structures were obtained from both crystals except that the resolution for the rods (2.1 Å) was slightly better than for the bipyramid (2.3 Å) (5), and hence, the former structure will only be discussed in this review.
Table 2. Summary of the PRP crystal structures
in the RCSB Protein Data Bank1
Protein Source Siz
e Location Pentapeptid
e Repeats Space Group
PDB- ID
Ref.
Rv3361c (MfpA)
Mycobacterium tuberculosis
193
chromosome 30 P21 2BM5
[14]
Cce_1272 (Rfr32)
Cyanothece 51142
167
chromosome 21 P3121 2F3L [5]
Np275 Nostoc punctiforme
98 chromosome 17 P212121
2J8I [27]
Np275-Np2762
Nostoc punctiforme
181
chromosome2
31 P212121
2J8K [27]
Cce_4529 (Rfr23)
Cyanothece 51142
174
chromosome 23 I41 2O6W
[6]
1 A crystal structure for HetL from Nostoc sp. strain PCC 7120 has been deposited into the RCSB PDB (3DU1). However, the coordinates were not available to the public when this review was in preparation.
2 NP275-NP276 is a fusion protein of two consecutive PRPs in the genome of Nostoc punctiforme that are separated by a stop codon [27]. Figure 3 is a cartoon representation of the structure of the four native PRPs determined to
date. In each case, the pentapeptide repeats adopt a regular right-handed quadrilateral β-helix structure, called an Rfr-fold, that has an overall appearance of a “protein skyscraper.” Helical
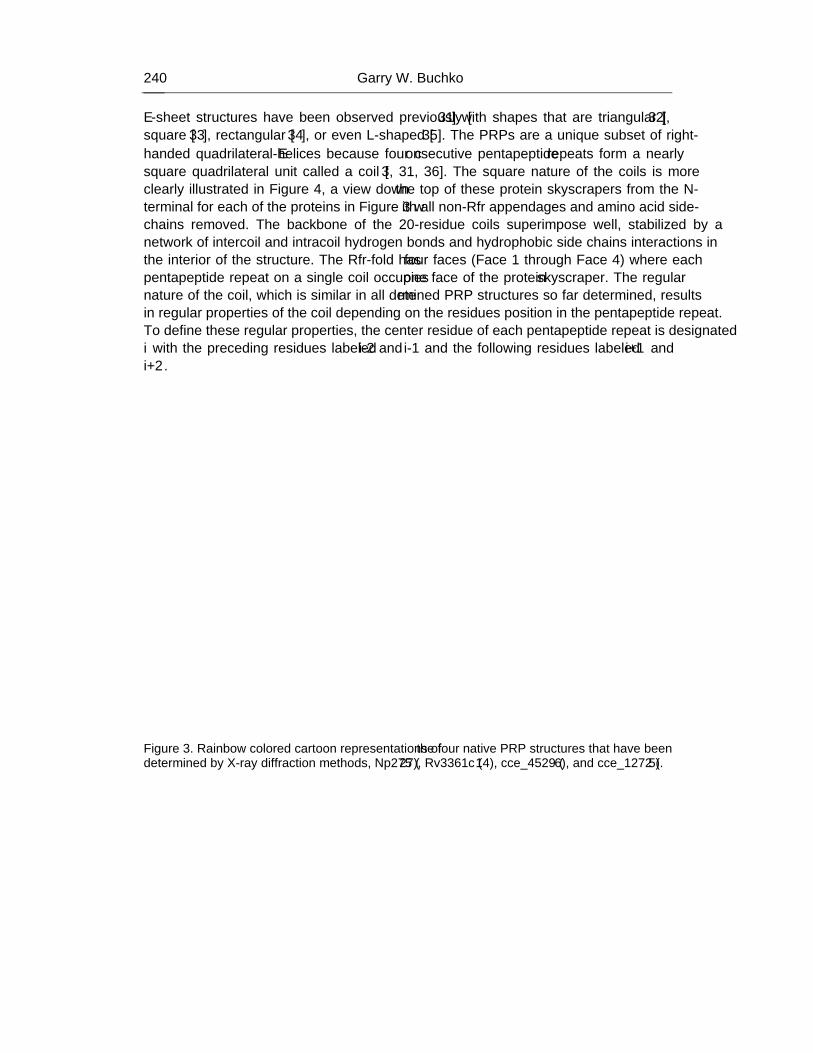
Garry W. Buchko 240
β-sheet structures have been observed previously [31] with shapes that are triangular [32], square [33], rectangular [34], or even L-shaped [35]. The PRPs are a unique subset of right-handed quadrilateral β-helices because four consecutive pentapeptide repeats form a nearly “square” quadrilateral unit called a coil [3, 31, 36]. The square nature of the coils is more clearly illustrated in Figure 4, a view down the top of these protein skyscrapers from the N-terminal for each of the proteins in Figure 3 with all non-Rfr appendages and amino acid side-chains removed. The backbone of the 20-residue coils superimpose well, stabilized by a network of intercoil and intracoil hydrogen bonds and hydrophobic side chains interactions in the interior of the structure. The Rfr-fold has four faces (Face 1 through Face 4) where each pentapeptide repeat on a single coil occupies one face of the protein skyscraper. The regular nature of the coil, which is similar in all determined PRP structures so far determined, results in regular properties of the coil depending on the residue’s position in the pentapeptide repeat. To define these regular properties, the center residue of each pentapeptide repeat is designated i with the preceding residues labeled i-2 and i-1 and the following residues labeled i+1 and i+2.
Figure 3. Rainbow colored cartoon representations of the four native PRP structures that have been determined by X-ray diffraction methods, Np275 (27), Rv3361c (14), cce_4529 (6), and cce_1272 (5).
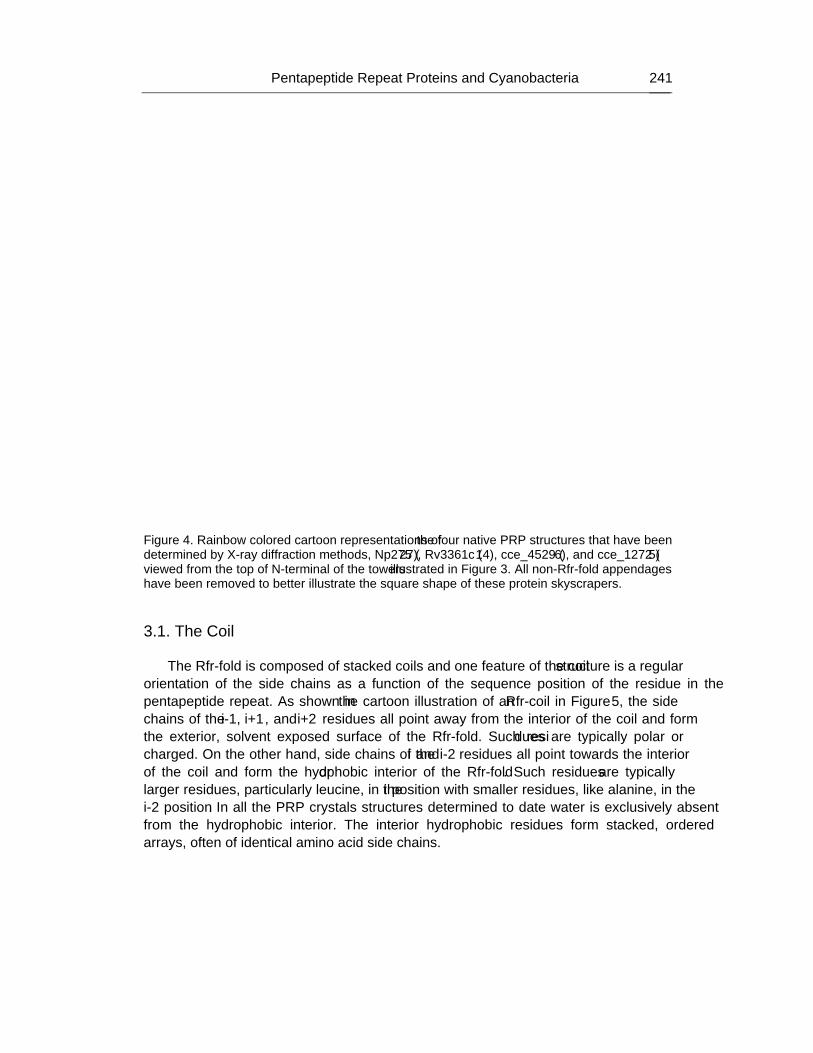
Pentapeptide Repeat Proteins and Cyanobacteria 241
Figure 4. Rainbow colored cartoon representations of the four native PRP structures that have been determined by X-ray diffraction methods, Np275 (27), Rv3361c (14), cce_4529 (6), and cce_1272 (5) viewed from the top of N-terminal of the towers illustrated in Figure 3. All non-Rfr-fold appendages have been removed to better illustrate the square shape of these protein skyscrapers.
3.1. The Coil
The Rfr-fold is composed of stacked coils and one feature of the coil structure is a regular
orientation of the side chains as a function of the sequence position of the residue in the pentapeptide repeat. As shown in the cartoon illustration of an Rfr-coil in Figure 5, the side chains of the i-1, i+1, and i+2 residues all point away from the interior of the coil and form the exterior, solvent exposed surface of the Rfr-fold. Such residues are typically polar or charged. On the other hand, side chains of the i and i-2 residues all point towards the interior of the coil and form the hydrophobic interior of the Rfr-fold. Such residues are typically larger residues, particularly leucine, in the i position with smaller residues, like alanine, in the i-2 position. In all the PRP crystals structures determined to date water is exclusively absent from the hydrophobic interior. The interior hydrophobic residues form stacked, ordered arrays, often of identical amino acid side chains.
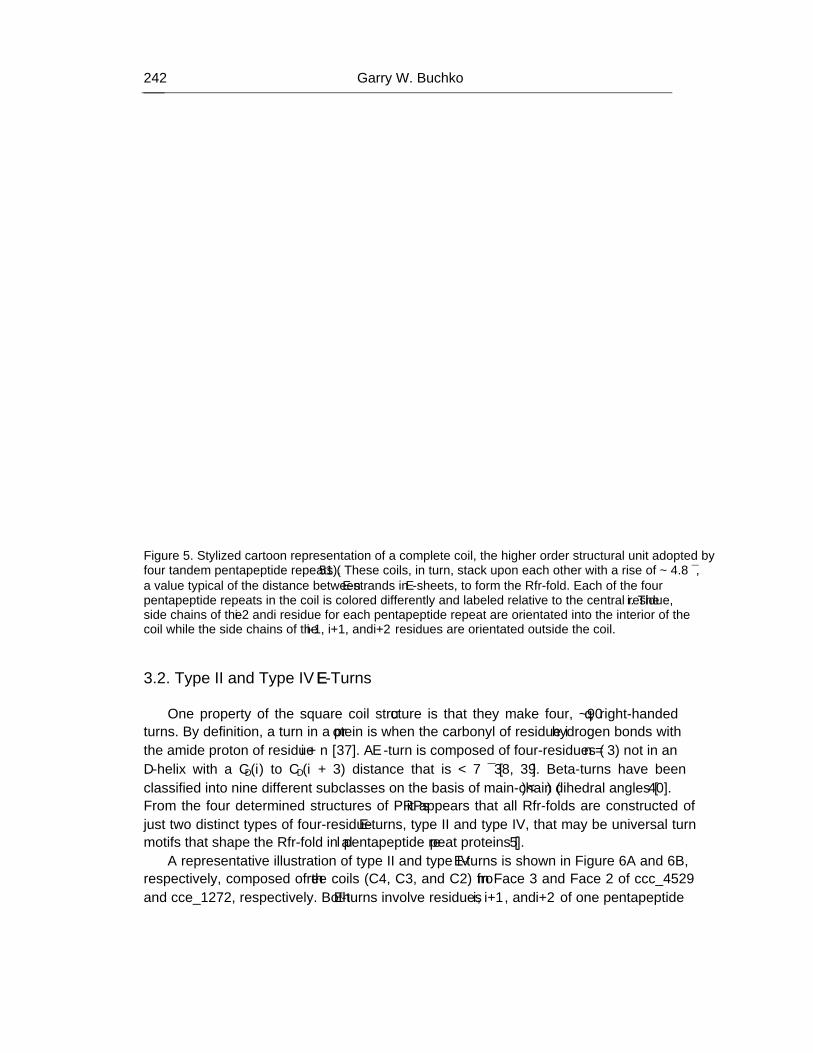
Garry W. Buchko 242
Figure 5. Stylized cartoon representation of a complete coil, the higher order structural unit adopted by four tandem pentapeptide repeats (51). These coils, in turn, stack upon each other with a rise of ~ 4.8 Å, a value typical of the distance between β-strands in β-sheets, to form the Rfr-fold. Each of the four pentapeptide repeats in the coil is colored differently and labeled relative to the central residue, i. The side chains of the i-2 and i residue for each pentapeptide repeat are orientated into the interior of the coil while the side chains of the i-1, i+1, and i+2 residues are orientated outside the coil.
3.2. Type II and Type IV β-Turns
One property of the “square” coil structure is that they make four, ~90°, right-handed
turns. By definition, a turn in a protein is when the carbonyl of residue i hydrogen bonds with the amide proton of residue i + n [37]. A β-turn is composed of four-residues (n = 3) not in an α-helix with a Cα(i) to Cα(i + 3) distance that is < 7 Å [38, 39]. Beta-turns have been classified into nine different subclasses on the basis of main-chain (Φ,Ψ) dihedral angles [40]. From the four determined structures of PRPs it appears that all Rfr-folds are constructed of just two distinct types of four-residue β-turns, type II and type IV, that may be universal turn motifs that shape the Rfr-fold in all pentapeptide repeat proteins [5].
A representative illustration of type II and type IV β-turns is shown in Figure 6A and 6B, respectively, composed of three coils (C4, C3, and C2) from Face 3 and Face 2 of ccc_4529 and cce_1272, respectively. Both β-turns involve residues i, i+1, and i+2 of one pentapeptide
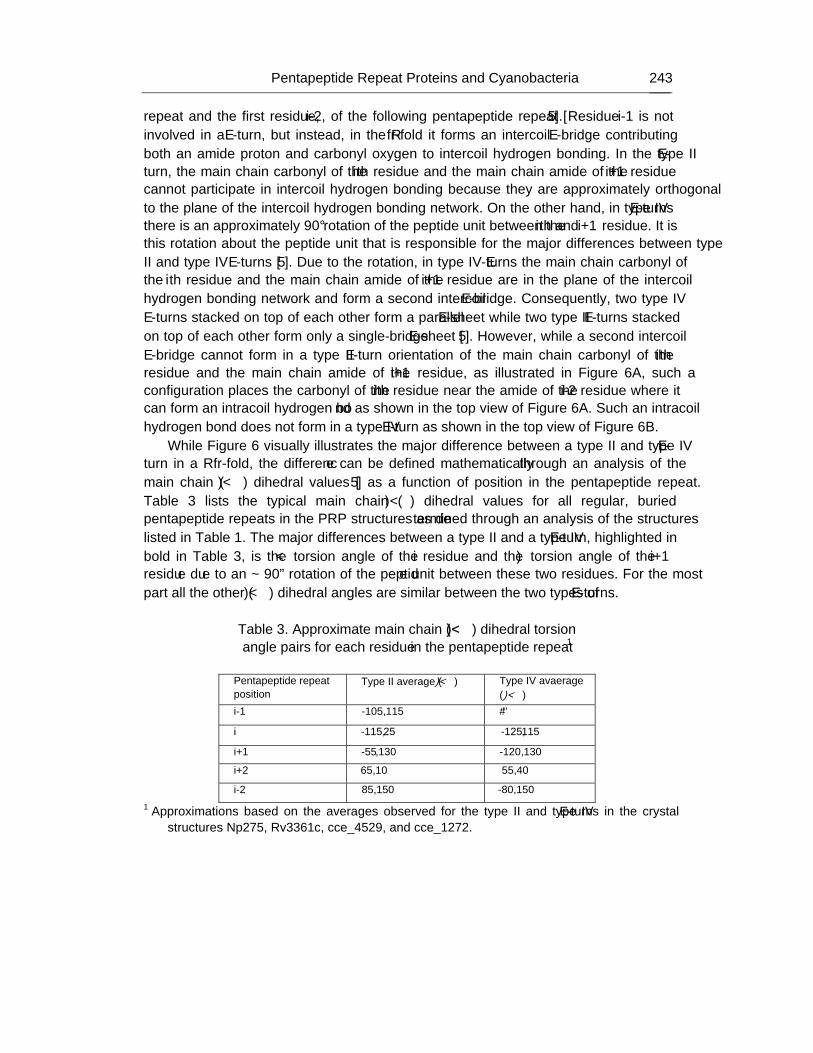
Pentapeptide Repeat Proteins and Cyanobacteria 243
repeat and the first residue, i-2, of the following pentapeptide repeat [5]. Residue i-1 is not involved in a β-turn, but instead, in the Rfr-fold it forms an intercoil β-bridge contributing both an amide proton and carbonyl oxygen to intercoil hydrogen bonding. In the type II β-turn, the main chain carbonyl of the ith residue and the main chain amide of the i+1 residue cannot participate in intercoil hydrogen bonding because they are approximately orthogonal to the plane of the intercoil hydrogen bonding network. On the other hand, in type IV β-turns there is an approximately 90° rotation of the peptide unit between the ith and i+1 residue. It is this rotation about the peptide unit that is responsible for the major differences between type II and type IV β-turns [5]. Due to the rotation, in type IV β-turns the main chain carbonyl of the ith residue and the main chain amide of the i+1 residue are in the plane of the intercoil hydrogen bonding network and form a second intercoil β-bridge. Consequently, two type IV β-turns stacked on top of each other form a parallel β-sheet while two type II β-turns stacked on top of each other form only a single-bridge β-sheet [5]. However, while a second intercoil β-bridge cannot form in a type II β-turn orientation of the main chain carbonyl of the ith residue and the main chain amide of the i+1 residue, as illustrated in Figure 6A, such a configuration places the carbonyl of the ith residue near the amide of the i-2 residue where it can form an intracoil hydrogen bond as shown in the top view of Figure 6A. Such an intracoil hydrogen bond does not form in a type IV β-turn as shown in the top view of Figure 6B.
While Figure 6 visually illustrates the major difference between a type II and type IV β-turn in a Rfr-fold, the difference can be defined mathematically through an analysis of the main chain (Φ,Ψ) dihedral values [5] as a function of position in the pentapeptide repeat. Table 3 lists the typical main chain (Φ,Ψ) dihedral values for all regular, “buried” pentapeptide repeats in the PRP structures as determined through an analysis of the structures listed in Table 1. The major differences between a type II and a type IV β-turn, highlighted in bold in Table 3, is the Ψ torsion angle of the i residue and the Φ torsion angle of the i+1 residue due to an ~ 90º rotation of the peptide unit between these two residues. For the most part all the other (Φ,Ψ) dihedral angles are similar between the two types of β-turns.
Table 3. Approximate main chain (Φ,Ψ) dihedral torsion angle pairs for each residue in the pentapeptide repeat1
Pentapeptide repeat position
Type II average (Φ,Ψ) Type IV avaerage (Φ,Ψ)
i-1 -105,115 ����
i -115,25 -125,115
i+1 -55,130 -120,130
i+2 65,10 55,40
i-2 –85,150 -80,150 1 Approximations based on the averages observed for the type II and type IV β-turns in the crystal
structures Np275, Rv3361c, cce_4529, and cce_1272.
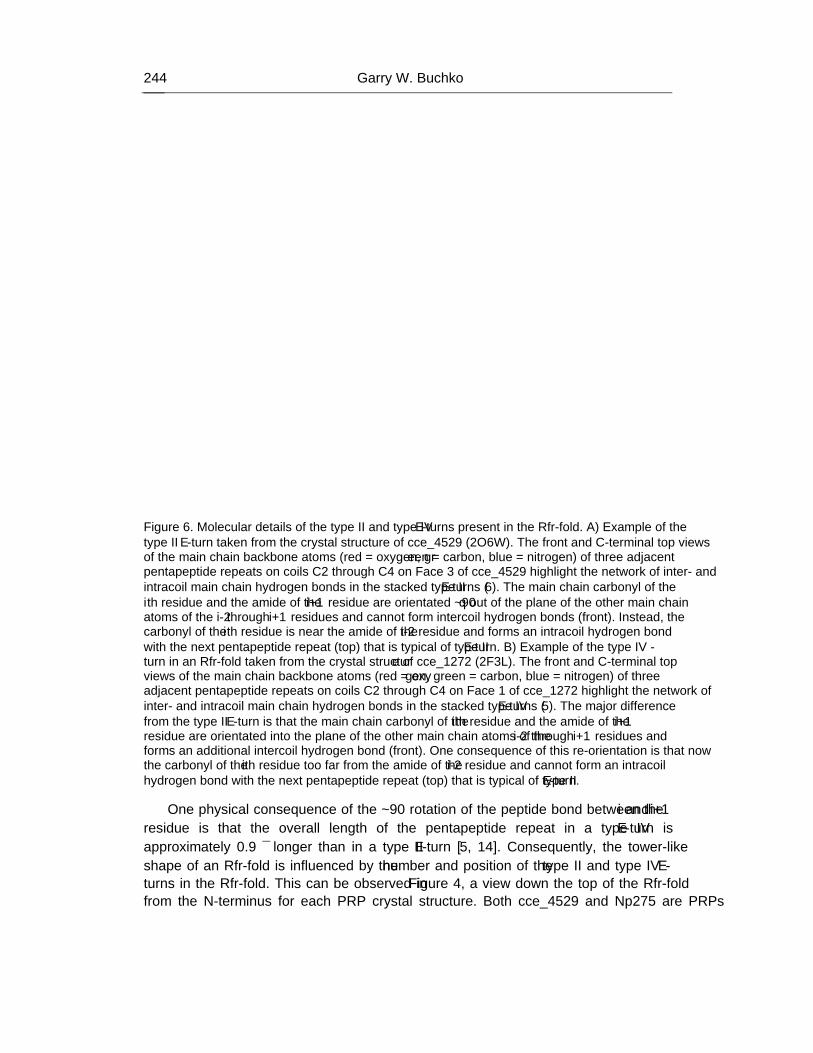
Garry W. Buchko 244
Figure 6. Molecular details of the type II and type IV β-turns present in the Rfr-fold. A) Example of the type II β-turn taken from the crystal structure of cce_4529 (2O6W). The front and C-terminal top views of the main chain backbone atoms (red = oxygen, green = carbon, blue = nitrogen) of three adjacent pentapeptide repeats on coils C2 through C4 on Face 3 of cce_4529 highlight the network of inter- and intracoil main chain hydrogen bonds in the stacked type II β-turns (6). The main chain carbonyl of the ith residue and the amide of the i+1 residue are orientated ~90° out of the plane of the other main chain atoms of the i-2 through i+1 residues and cannot form intercoil hydrogen bonds (front). Instead, the carbonyl of the ith residue is near the amide of the i-2 residue and forms an intracoil hydrogen bond with the next pentapeptide repeat (top) that is typical of type II β-turn. B) Example of the type IV �-turn in an Rfr-fold taken from the crystal structure of cce_1272 (2F3L). The front and C-terminal top views of the main chain backbone atoms (red = oxygen, green = carbon, blue = nitrogen) of three adjacent pentapeptide repeats on coils C2 through C4 on Face 1 of cce_1272 highlight the network of inter- and intracoil main chain hydrogen bonds in the stacked type IV β-turns (5). The major difference from the type II β-turn is that the main chain carbonyl of the ith residue and the amide of the i+1 residue are orientated into the plane of the other main chain atoms of the i-2 through i+1 residues and forms an additional intercoil hydrogen bond (front). One consequence of this re-orientation is that now the carbonyl of the ith residue too far from the amide of the i-2 residue and cannot form an intracoil hydrogen bond with the next pentapeptide repeat (top) that is typical of type II β-turn.
One physical consequence of the ~90 rotation of the peptide bond between the i and i+1 residue is that the overall length of the pentapeptide repeat in a type IV β-turn is approximately 0.9 Å longer than in a type II β-turn [5, 14]. Consequently, the tower-like shape of an Rfr-fold is influenced by the number and position of the type II and type IV β-turns in the Rfr-fold. This can be observed in Figure 4, a view down the top of the Rfr-fold from the N-terminus for each PRP crystal structure. Both cce_4529 and Np275 are PRPs
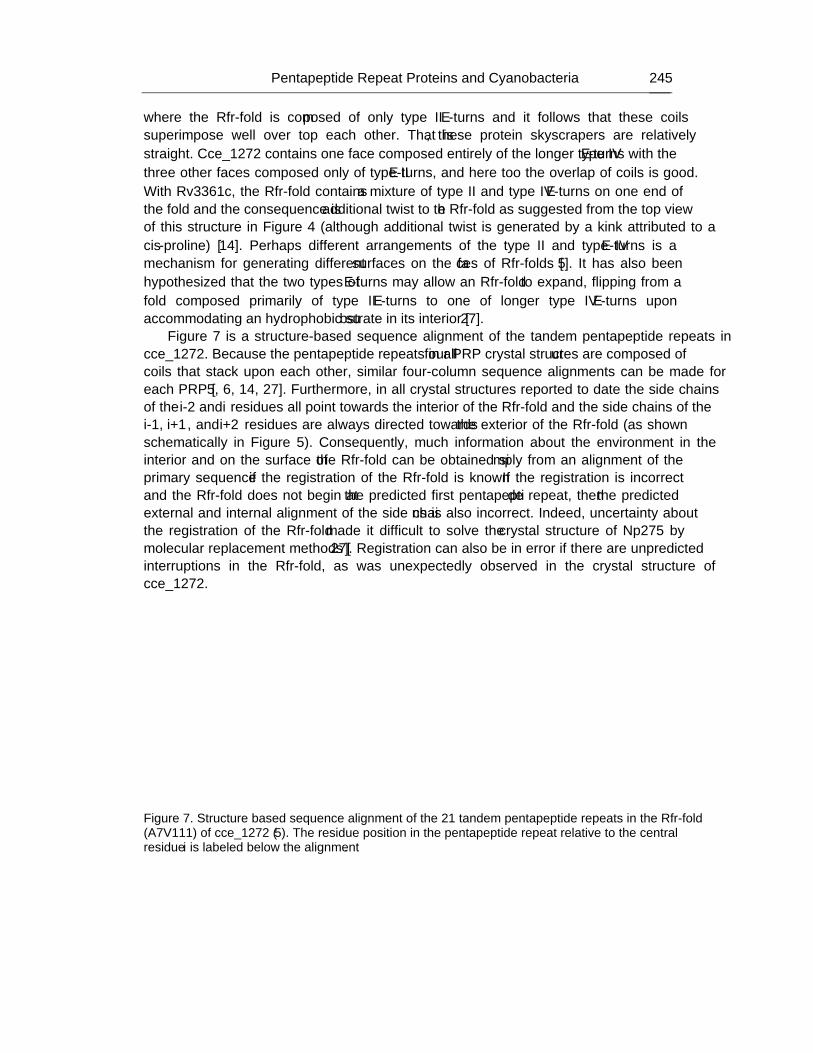
Pentapeptide Repeat Proteins and Cyanobacteria 245
where the Rfr-fold is composed of only type II β-turns and it follows that these coils superimpose well over top each other. That is, these protein skyscrapers are relatively straight. Cce_1272 contains one face composed entirely of the longer type IV β-turns with the three other faces composed only of type II β-turns, and here too the overlap of coils is good. With Rv3361c, the Rfr-fold contains a mixture of type II and type IV β-turns on one end of the fold and the consequence is additional twist to the Rfr-fold as suggested from the top view of this structure in Figure 4 (although additional twist is generated by a kink attributed to a cis-proline) [14]. Perhaps different arrangements of the type II and type IV β-turns is a mechanism for generating different surfaces on the faces of Rfr-folds [5]. It has also been hypothesized that the two types of β-turns may allow an Rfr-fold to expand, flipping from a fold composed primarily of type II β-turns to one of longer type IV β-turns upon accommodating an hydrophobic substrate in its interior [27].
Figure 7 is a structure-based sequence alignment of the tandem pentapeptide repeats in cce_1272. Because the pentapeptide repeats in all four PRP crystal structures are composed of coils that stack upon each other, similar four-column sequence alignments can be made for each PRP [5, 6, 14, 27]. Furthermore, in all crystal structures reported to date the side chains of the i-2 and i residues all point towards the interior of the Rfr-fold and the side chains of the i-1, i+1, and i+2 residues are always directed towards the exterior of the Rfr-fold (as shown schematically in Figure 5). Consequently, much information about the environment in the interior and on the surface of the Rfr-fold can be obtained simply from an alignment of the primary sequence if the registration of the Rfr-fold is known. If the registration is incorrect and the Rfr-fold does not begin at the predicted first pentapeptide repeat, then the predicted external and internal alignment of the side chains is also incorrect. Indeed, uncertainty about the registration of the Rfr-fold made it difficult to solve the crystal structure of Np275 by molecular replacement methods [27]. Registration can also be in error if there are unpredicted interruptions in the Rfr-fold, as was unexpectedly observed in the crystal structure of cce_1272.
Figure 7. Structure based sequence alignment of the 21 tandem pentapeptide repeats in the Rfr-fold (A7–V111) of cce_1272 (5). The residue position in the pentapeptide repeat relative to the central residue i is labeled below the alignment.
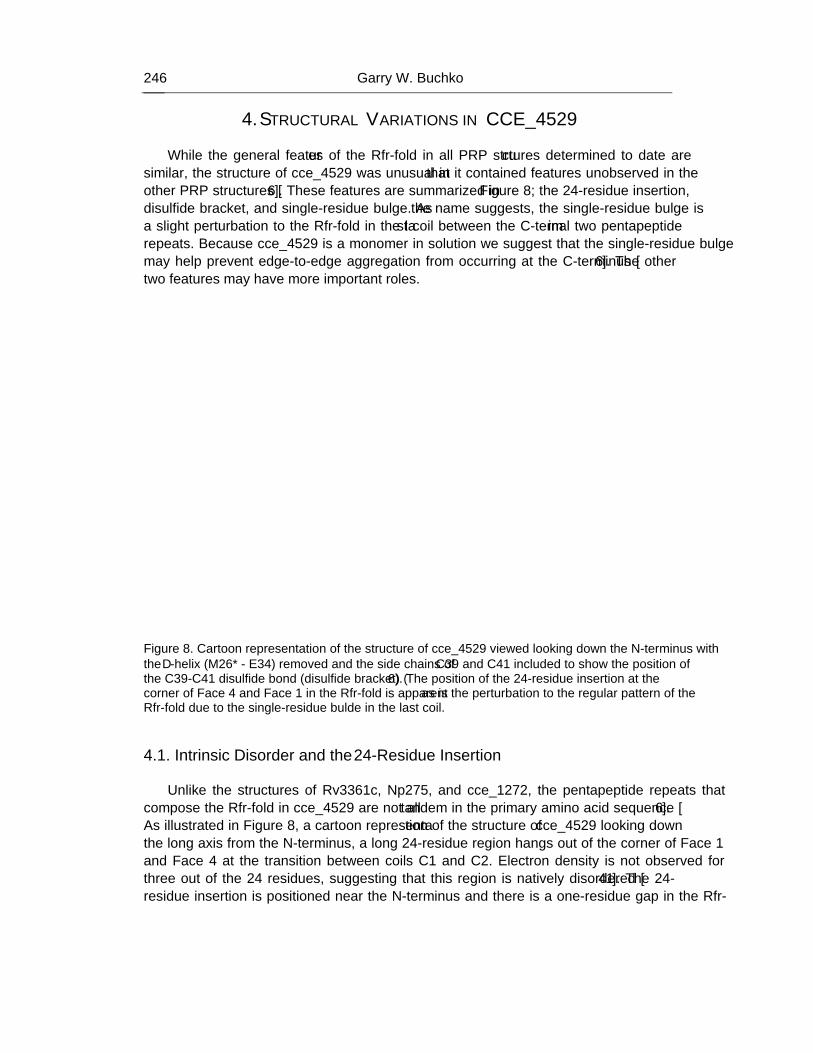
Garry W. Buchko 246
4. STRUCTURAL VARIATIONS IN CCE_4529 While the general features of the Rfr-fold in all PRP structures determined to date are
similar, the structure of cce_4529 was unusual in that it contained features unobserved in the other PRP structures [6]. These features are summarized in Figure 8; the 24-residue insertion, disulfide bracket, and single-residue bulge. As the name suggests, the single-residue bulge is a slight perturbation to the Rfr-fold in the last coil between the C-terminal two pentapeptide repeats. Because cce_4529 is a monomer in solution we suggest that the single-residue bulge may help prevent edge-to-edge aggregation from occurring at the C-terminus [6]. The other two features may have more important roles.
Figure 8. Cartoon representation of the structure of cce_4529 viewed looking down the N-terminus with the α-helix (M26* - E34) removed and the side chains of C39 and C41 included to show the position of the C39-C41 disulfide bond (disulfide bracket) (6). The position of the 24-residue insertion at the corner of Face 4 and Face 1 in the Rfr-fold is apparent as is the perturbation to the regular pattern of the Rfr-fold due to the single-residue bulde in the last coil.
4.1. Intrinsic Disorder and the 24-Residue Insertion
Unlike the structures of Rv3361c, Np275, and cce_1272, the pentapeptide repeats that
compose the Rfr-fold in cce_4529 are not all tandem in the primary amino acid sequence [6]. As illustrated in Figure 8, a cartoon representation of the structure of cce_4529 looking down the long axis from the N-terminus, a long 24-residue region hangs out of the corner of Face 1 and Face 4 at the transition between coils C1 and C2. Electron density is not observed for three out of the 24 residues, suggesting that this region is natively disordered [41]. The 24-residue insertion is positioned near the N-terminus and there is a one-residue gap in the Rfr-
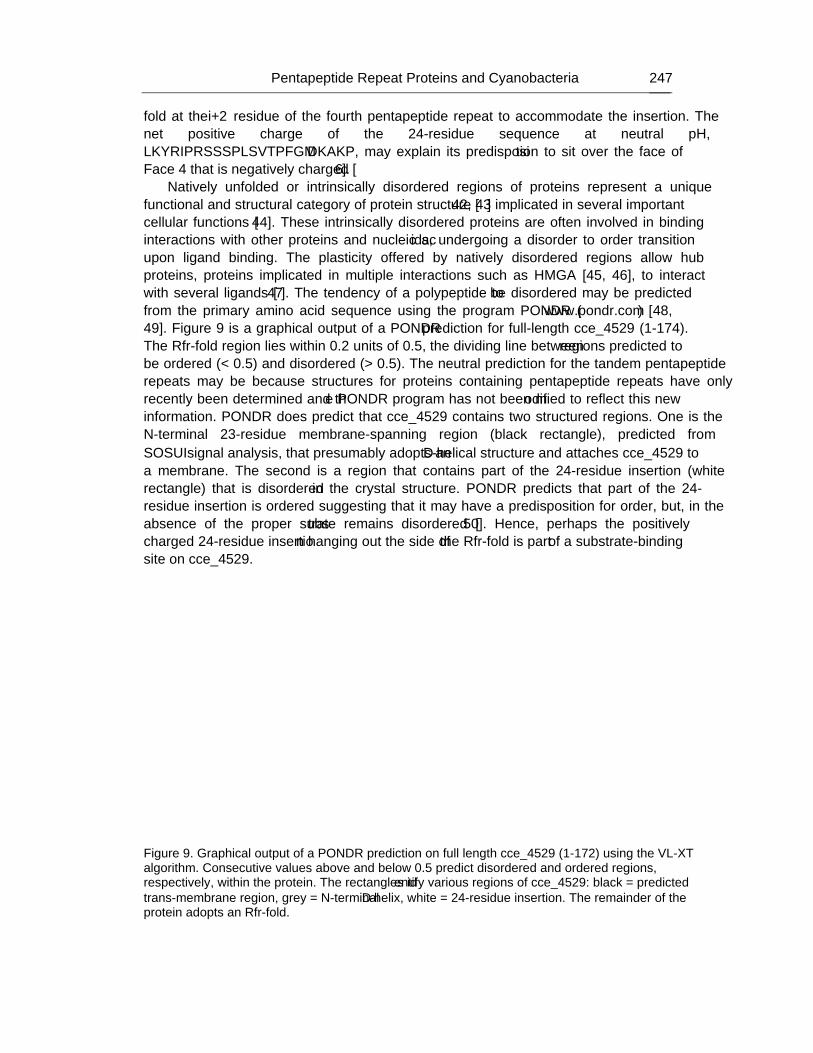
Pentapeptide Repeat Proteins and Cyanobacteria 247
fold at the i+2 residue of the fourth pentapeptide repeat to accommodate the insertion. The net positive charge of the 24-residue sequence at neutral pH, LKYRIPRSSSPLSVTPFGMDKAKP, may explain its predisposition to sit over the face of Face 4 that is negatively charged [6].
Natively unfolded or intrinsically disordered regions of proteins represent a unique functional and structural category of protein structure [42, 43] implicated in several important cellular functions [44]. These intrinsically disordered proteins are often involved in binding interactions with other proteins and nucleic acids, undergoing a disorder to order transition upon ligand binding. The plasticity offered by natively disordered regions allow ‘hub proteins’, proteins implicated in multiple interactions such as HMGA [45, 46], to interact with several ligands [47]. The tendency of a polypeptide to be disordered may be predicted from the primary amino acid sequence using the program PONDR (www.pondr.com) [48, 49]. Figure 9 is a graphical output of a PONDR prediction for full-length cce_4529 (1-174). The Rfr-fold region lies within 0.2 units of 0.5, the dividing line between regions predicted to be ordered (< 0.5) and disordered (> 0.5). The neutral prediction for the tandem pentapeptide repeats may be because structures for proteins containing pentapeptide repeats have only recently been determined and the PONDR program has not been modified to reflect this new information. PONDR does predict that cce_4529 contains two structured regions. One is the N-terminal 23-residue membrane-spanning region (black rectangle), predicted from SOSUIsignal analysis, that presumably adopts an α-helical structure and attaches cce_4529 to a membrane. The second is a region that contains part of the 24-residue insertion (white rectangle) that is disordered in the crystal structure. PONDR predicts that part of the 24-residue insertion is ordered suggesting that it may have a predisposition for order, but, in the absence of the proper substrate remains disordered [50]. Hence, perhaps the positively charged 24-residue insertion hanging out the side of the Rfr-fold is part of a substrate-binding site on cce_4529.
Figure 9. Graphical output of a PONDR prediction on full length cce_4529 (1-172) using the VL-XT algorithm. Consecutive values above and below 0.5 predict disordered and ordered regions, respectively, within the protein. The rectangles identify various regions of cce_4529: black = predicted trans-membrane region, grey = N-terminal α-helix, white = 24-residue insertion. The remainder of the protein adopts an Rfr-fold.
Garry W. Buchko 248
4.2. Importance of the Disulfide Bracket in Cce_4529. One of the interesting features of the crystal structure of cce_4529 is that unlike the other
PRP crystal structures, this protein contains a disulfide bracket [51]. Cysteine-39 and cysteine-42 are in the i and i-2 position, respectively, in adjacent pentapeptide repeats and both point into the interior of the coil where they oxidize to form an intramolecular disulfide bond. Figure 8 illustrates that the formation of the disulfide bond does not distort the coil structure. Disulfide bonds contribute to protein stability, activity, and folding [52, 53] and the disulfide bracket on the first coil of cce_4529 may serve a similar role [51]. To assess the structural importance of the lone disulfide bond in cce_4529, the reducing agent dithiothreitol (DTT) was added to the protein to reduce the disulfide bond and the structural consequences probed using a variety of methods.
Size exclusion chromatography separates molecules on the basis of size and shape with effectively bigger molecules eluting before smaller molecules because they do not get lost in the matrix. As tabulated in Table 4, cce_4529 (16.4 kDa) elutes with a retention time of 62 minutes when the eluting buffer contains 1 mM DTT. On the other hand, in the absence of DTT in the eluting buffer, cce_4529 elutes with a retention time of 75 minutes. A similar trend in eluting time was also observed for tagged cce_4529 (21.2 kDa) in the presence and absence of 1 mM DTT. Hence, the addition of DTT to cce_4529 manifested an increase in the effective size of the protein. Such an effective increase in size occurs in the transition from a folded to an unfolded state and is often compounded by aggregation after unfolding.
Table 4. Summary of the effect of DTT on retention
times for tagged and untagged cce_45291
Condition Tagged Rfr23 (21.2 kDa)
Untagged Rfr23 (16.4 kDa)
+DTT 58 62
-DTT 68 75 1 Rention times are on a Superdex75 26/60 column using a flow rate of 2.5 mL/min. +DTT: injection
solution made 1 mM in DTT immediately prior to injection and the elution buffer contains 1 mM DTT. –DTT: no DTT added to the injection solution prior to injection and no DTT included in the elution buffer. Note that simply making the injection solution 1 mM in DTT prior to injection and applying to a column pre-equilibrated in crystallization buffer containing no DTT resulted in retention times identical to those for +DTT. Circular dichroism is a powerful spectroscopy used to probe the conformation of proteins
in solution [54, 55] and to monitor protein structure and stability under a variety of conditions [56]. The crystal structure of cce_4529 shows ~75% of the protein forms a right-handed quadrilateral β-helix structure composed entirely of type II β-turns. In each coil of this structure, 80% of the residues form a β-turn (i to i-2) while 20% form a single-bridge β-sheet (i+1). Of the remaining ~25% of the protein, ~7% is α-helical and the remainder disordered. Consequently, cce_4529 should serve as a good model compound of a protein composed entirely of one type of β-turn. The CD spectrum for cce_4529 in the oxidized form (product with 75 min retention time in Table 4) is shown in Figure 10A. The spectrum is dominated by
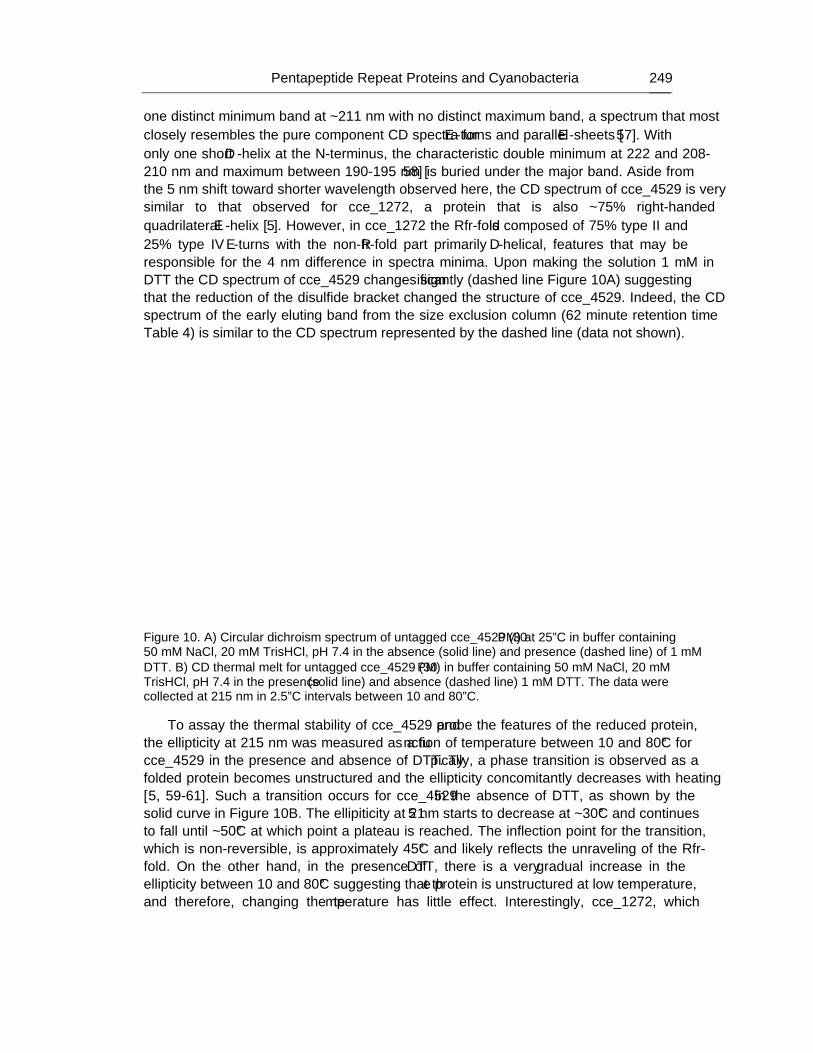
Pentapeptide Repeat Proteins and Cyanobacteria 249
one distinct minimum band at ~211 nm with no distinct maximum band, a spectrum that most closely resembles the pure component CD spectra for β-turns and parallel β-sheets [57]. With only one short α-helix at the N-terminus, the characteristic double minimum at 222 and 208-210 nm and maximum between 190-195 nm [58] is buried under the major band. Aside from the 5 nm shift toward shorter wavelength observed here, the CD spectrum of cce_4529 is very similar to that observed for cce_1272, a protein that is also ~75% right-handed quadrilateral β-helix [5]. However, in cce_1272 the Rfr-fold is composed of 75% type II and 25% type IV β-turns with the non-Rfr-fold part primarily α-helical, features that may be responsible for the 4 nm difference in spectra minima. Upon making the solution 1 mM in DTT the CD spectrum of cce_4529 changes significantly (dashed line Figure 10A) suggesting that the reduction of the disulfide bracket changed the structure of cce_4529. Indeed, the CD spectrum of the early eluting band from the size exclusion column (62 minute retention time Table 4) is similar to the CD spectrum represented by the dashed line (data not shown).
Figure 10. A) Circular dichroism spectrum of untagged cce_4529 (30 μM) at 25ºC in buffer containing 50 mM NaCl, 20 mM TrisHCl, pH 7.4 in the absence (solid line) and presence (dashed line) of 1 mM DTT. B) CD thermal melt for untagged cce_4529 (30 μM) in buffer containing 50 mM NaCl, 20 mM TrisHCl, pH 7.4 in the presence (solid line) and absence (dashed line) 1 mM DTT. The data were collected at 215 nm in 2.5ºC intervals between 10 and 80ºC.
To assay the thermal stability of cce_4529 and probe the features of the reduced protein, the ellipticity at 215 nm was measured as a function of temperature between 10 and 80°C for cce_4529 in the presence and absence of DTT. Typically, a phase transition is observed as a folded protein becomes unstructured and the ellipticity concomitantly decreases with heating [5, 59-61]. Such a transition occurs for cce_4529 in the absence of DTT, as shown by the solid curve in Figure 10B. The ellipiticity at 215 nm starts to decrease at ~30°C and continues to fall until ~50°C at which point a plateau is reached. The inflection point for the transition, which is non-reversible, is approximately 45°C and likely reflects the unraveling of the Rfr-fold. On the other hand, in the presence of DTT, there is a very gradual increase in the ellipticity between 10 and 80°C suggesting that the protein is unstructured at low temperature, and therefore, changing the temperature has little effect. Interestingly, cce_1272, which
Garry W. Buchko 250
contains two fewer pentapeptide repeats in its Rfr-fold (21 versus 23 for cce_4529), has a slightly larger thermal inflection point (~48°C) suggesting it is a marginally more stable.
In summary, size exclusion chromotography suggests the effective size of cce_4529 increases upon reducing the disulfide bond and circular dichroism spectroscopy suggests that the reduction of the disulfide bond significantly alters the structure of the protein. The structural consequences of reducing the disulfide bond was corroborated by NMR spectroscopy [6]. The pattern of a protein’s 1H-15N HSQC spectrum differs markedly between structured and unstructured states, with structured proteins (less the ~30 kDa) generating an HSQC pattern of cross peaks that are widely dispersed in both the nitrogen and proton dimension while unstructured proteins generate an 1H-15N HSQC spectrum of cross peaks that fall within a vary narrow chemical shift range (especially in the proton dimension). Added DTT to a 15N-labelled sample of cce_4529 resulted in such a change in the 1H-15N HSQC spectra, going from a widely to poorly dispersed pattern [6] indicating the reduction of the lone disulfide bond in cce_4529 completely destroyed the structure of the native protein. Consequently, the disulfide bond appears to be important to the stability of the Rfr-fold in cce_4529.
The biological significance of the disulfide bracket in cce_4529 is not known. The cytoplasmic environment is known to be reducing and unfavorable to proteins with disulfide bonds. However, if proteins with oxidized cysteines are not secreted outside the cell they may remain protected from reduction in extracytoplasmic compartments. SignalP analysis [62] predicts that cce_4529 contains an N-terminal sequence that could direct the protein outside the cell or into extracytoplasmic compartments. Alternatively, it has been observed that the activity of some protein with disulfide bonds are regulated by disulfide bond reduction [63], and therefore, the disulfide bond in cce_4529 may have some regulatory role [6]. Regardless of the biological significance (if any) of the disulfide bond in cce_4529, such bonds do contribute up to 6 kcal /mol to the stability of a protein [64-66]. Perhaps it may be possible to design de novo extremely robust Rfr-folds by selectively introducing cysteine residues into Rfr sequences.
5. EDGE-TO-EDGE AGGREGATION Richardson and Richardson [67] observed that the outer edges of β-sheet helical proteins
contain exposed hydrogen donors and acceptors in position to form “edge-to-edge” β-bridges and β-sheets with another molecule. Such β-sheet proteins would aggregate through edge-to-edge aggregation. However, most β-sheet helical proteins contain polypetides, in the form of α-helices or loops, that physically prevent such edge-to-edge aggregation from forming [67]. One of the functions of the N- and C-terminal sequences that straddle pentapeptide repeat proteins may be to afford edge-to-edge protection [5]. Indeed, crystal structure of cce_1272, Rv3361c, Np275, and cce_4529 show an α-helix sitting over top of the N- (cce_1272 and Rv3362c) or C-terminus (Np275 and cce_4529) of the Rfr-fold. At the other end of each of these proteins, cce_4529 contains a single-residue bulge in the C-terminal coil that could serve such a function [6].
While N- and C-terminal regions straddling Rfr-folds may serve to prevent edge-to-edge aggregation, analysis of the primary amino acid sequence of identified PRPs suggests that
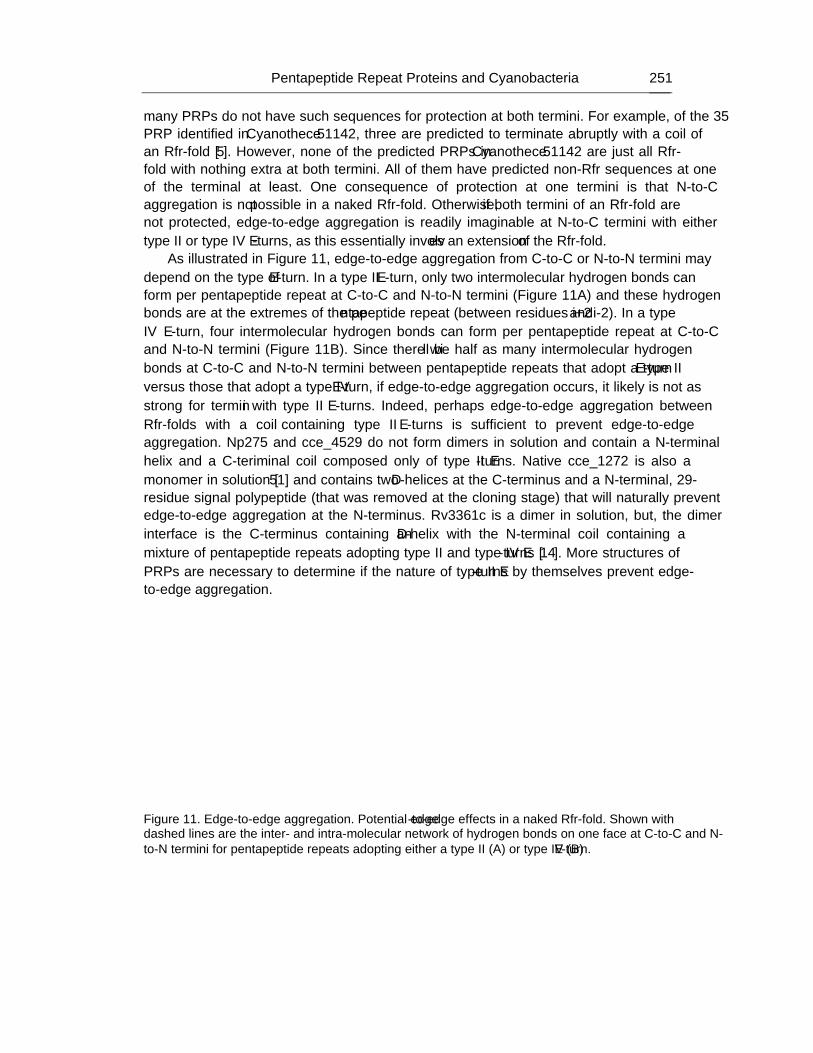
Pentapeptide Repeat Proteins and Cyanobacteria 251
many PRPs do not have such sequences for protection at both termini. For example, of the 35 PRP identified in Cyanothece 51142, three are predicted to terminate abruptly with a coil of an Rfr-fold [5]. However, none of the predicted PRPs in Cyanothece 51142 are just all Rfr-fold with nothing extra at both termini. All of them have predicted non-Rfr sequences at one of the terminal at least. One consequence of protection at one termini is that N-to-C aggregation is not possible in a naked Rfr-fold. Otherwise, if both termini of an Rfr-fold are not protected, edge-to-edge aggregation is readily imaginable at N-to-C termini with either type II or type IV β-turns, as this essentially involves an extension of the Rfr-fold.
As illustrated in Figure 11, edge-to-edge aggregation from C-to-C or N-to-N termini may depend on the type of β-turn. In a type II β-turn, only two intermolecular hydrogen bonds can form per pentapeptide repeat at C-to-C and N-to-N termini (Figure 11A) and these hydrogen bonds are at the extremes of the pentapeptide repeat (between residues i+2 and i-2). In a type IV β-turn, four intermolecular hydrogen bonds can form per pentapeptide repeat at C-to-C and N-to-N termini (Figure 11B). Since there will be half as many intermolecular hydrogen bonds at C-to-C and N-to-N termini between pentapeptide repeats that adopt a type II β-turn versus those that adopt a type IV β-turn, if edge-to-edge aggregation occurs, it likely is not as strong for termini with type II β-turns. Indeed, perhaps edge-to-edge aggregation between Rfr-folds with a coil containing type II β-turns is sufficient to prevent edge-to-edge aggregation. Np275 and cce_4529 do not form dimers in solution and contain a N-terminal helix and a C-teriminal coil composed only of type II β-turns. Native cce_1272 is also a monomer in solution [51] and contains two α-helices at the C-terminus and a N-terminal, 29-residue signal polypeptide (that was removed at the cloning stage) that will naturally prevent edge-to-edge aggregation at the N-terminus. Rv3361c is a dimer in solution, but, the dimer interface is the C-terminus containing an α-helix with the N-terminal coil containing a mixture of pentapeptide repeats adopting type II and type IV β-turns [14]. More structures of PRPs are necessary to determine if the nature of type II β-turns by themselves prevent edge-to-edge aggregation.
Figure 11. Edge-to-edge aggregation. Potential edge-to-edge effects in a naked Rfr-fold. Shown with dashed lines are the inter- and intra-molecular network of hydrogen bonds on one face at C-to-C and N-to-N termini for pentapeptide repeats adopting either a type II (A) or type IV (B) β-turn.
Garry W. Buchko 252
6. CONCLUSIONS From the determination of a few PRP structures it is apparent that the general features of
the Rfr-fold is conserved in all pentapeptide repeat proteins. This makes it possible to predict the structure of this region of PRPs solely on the basis of the primary amino acid sequence. If the registration of pentapeptide repeats is known, then it is even possible to predict the surface properties on each face of the Rfr-fold. But even though the general features of the Rfr-fold may be common in all PRPs, perhaps they each contain unique features, such as disulfide brackets, insertions, single-residue bulges, and cis-proline induced kinks, that impart each PRP some individuality that has biological significance. Further genetic and molecular characterization of PRPs is necessary to determine their biological role(s). Such studies may be hampered by their redundancy in cyanobacteria, as other PRPs may be able to cover for an individual PRP that is mutated or knocked-out as is hypothesized for the redundancy in the Nudix proteins in Deinococcus radiodurans [68, 69]. Regardless of the biological role of PRPs, by further characterizing the structural properties of additional PRPs it may be possible to exploit the regular, predictable, nature of the Rfr-fold dictated by the primary amino acid sequence to design de novo proteins with specialized traits.
ACKNOWLEDGEMENTS This work is part of a Membrane Biology EMSL Scientific Grand Challenge project at
the W.R. Wiley Environmental Molecular Sciences Laboratory, a national scientific user facility sponsored by U.S. Department of Energy’s Office of Biological and Environmental Research (BER) program located at Pacific Northwest National Laboratory (PNNL). PNNL is operated for the U.S. Department of Energy by Battelle. Dr. Howard Robinson and the assistance of the X29A beam line scientists at the National Synchrotron Light Source at Brookhaven National Laboratory is appreciated for XRD data collection on cce_4529 and cce_1272. Support for beamline X29A at the National Synchrotron Light Source comes principally from the Offices of Biological and Environmental Research and of Basic Energy Sciences of the US Department of Energy, and from the National Center for Research Resources of the National Institutes of Health. This manuscript has been authored by Battelle Memorial Institute, Pacific Northwest Division, under Contract No. DE-AC05-76RL0 1830 with the U.S. Department of Energy. The United States Government retains and the publisher, by accepting the article for publication, acknowledges that the United States Government retains a non-exclusive, paid-up, irrevocable, worldwide license to publish or reproduce the published form of this manuscript, or allow others to do so, for United States Government purposes.
REFERENCES
[1] Bateman, A., Murzin, A. G., and Teichmann, S. A. (1998) Structure and distribution of pentapeptide repeats in bacteria, Protein Sci. 7, 1477-1480.
Pentapeptide Repeat Proteins and Cyanobacteria 253
[2] Bateman, A., Birney, E., Durbin, R., Eddy, S. R., Howe, K. L., and Sonnhammer, E. L. (2000) The Pfam protein families database, Nucleic Acids Res. 28, 263-266.
[3] Vetting, M. W., Hegde, S. S., Fajardo, J. E., Fiser, A., Roderick, S. L., Takiff, H. E., and Blanchard, J. S. (2006) Pentapeptide repeat proteins, Biochemistry 45, 1-10.
[4] Chandler, L. E., Bartsevich, V. V., and Pakrasi, H. B. (2003) Regulation of manganese uptake in Synechocystis 6803 by RfrA, a member of a novel family of proteins containing a repeated five-residue domain, Biochemistry 42, 5508-5514.
[5] Buchko, G. W., Ni, S., Robinson, H., Welsh, E. A., Pakrasi, H. B., and Kennedy, M. A. (2006) Characterization of two potentially universal turn motifs that shape the repeated five-residues fold - Crystal structure of a luminal pentapeptide repeat protein from Cyanothece 51142, Protein Sci. 15, 2579-2595.
[6] Buchko, G. W., Robinson, H., Pakrasi, H. B., and Kennedy, M. A. (2008) Insights into the structural variation between pentapeptide repeat proteins - crystal structure of Rfr23 from Cyanothece 51142, J. Struct. Biol. 162, 184-192.
[7] Welsh, E. A., Liberton, M., Stöckel, J., Loh, T., Elvitigala, T., Wang, C., Woolam, A., R.S., F., Clifton, S. W., Jacobs, J. M., Aurora, R., Ghosh, B. K., Sherman, L. A., Smith, R. D., Wilson, R. K., and Pakrasi, H. B. (2008) The genome of Cyanothece 51142, a unicellular diazotrophic cyanobacterium important in the marine nitrogen cycle, Proc. Natl. Acad. Sci. USA 105, 15094-15099.
[8] Black, K., Buikema, W. J., and Haselkorn, R. (1995) The hglK gene is required for localization of heterocyst-specific glycolipids in cyanobacterium Anabaena sp. strain PCC 7120, J. Bacteriol. 177, 6440-6448.
[9] Tran, J. H., and Jacoby, G. A. (2002) Mechanism of plasmid-mediated quinolone resistance, Proc. Natl. Acad. Sci. U.S.A. 99, 5638-5642.
[10] Nordmann, P., and Poirel, L. (2005) Emergence of plasmid-mediated resistance to quinolones in Enterobacteriaceae, J. Antimicrob. Chemother. 56, 463-469.
[11] Tran, J. H., Jacoby, G. A., and Hooper, D. C. (2005) Interaction of the plasmid-encoded quinolone resistance protein QnrA with Escherichia coli topoisomerase IV, Antimicrob. Agents Chemother. 49, 3050-3052.
[12] Drlica, K., and Malik, M. (2003) Fluoroquinolones: action and resistance, Curr. Top, Med. Chem. 3, 249-282.
[13] van Gent, D. C., Hoeijmakers, J. H. J., and Kanaar, R. (2001) Chromosomal stability and the DNA double-stranded break connection, Nat. Rev. Genet. 2, 196-206.
[14] Hegde, S. S., Vetting, M. W., Roderick, S. L., Mitchenall, L. A., Maxwell, A., Takiff, H. E., and Blanchard, J. S. (2005) A fluoroquinoline resistance protein from Mycobacterium tuberculosis that mimics DNA, Science 308, 1480-1483.
[15] Montero, C., Mateu, G., Rodriguez, R., and Takiff, H. E. (2001) Intrinsic resistence of Mycobacterium smegmatis to fluoroquinolines may be influenced by new pentapeptide protein MfpA, Antimicrob. Agents Chemother. 45, 3387-3392.
[16] Morais Cabral, J. H., Jackson, A. P., Smith, C. V., Shikotra, N., Maxwell, A., and Liddington, R. C. (1997) Crystal structure of the breakage-reunion domain of DNA gyrase, Nature 388, 903-906.
[17] Garrido, M. C., Herrero, R., Kolter, R., and Moreno, F. (1988) The export of the DNA-replication inhibitor Microsin B17 provides immunity for the host-cell, EMBO J. 7, 1853-1862.
Garry W. Buchko 254
[18] Morita, M., Tomita, K., Ishizawa, M., Tagaki, K., Kawamura, F., Takahashi, H., and Morino, T. (1999) Cloning of oxetanocin A biosynthetic and resistance genes that reside on a plasmid of Bacillus magaterium strain NK84-0128, Biosci. Biotechnol. Biochem. 63, 563-566.
[19] Vizan, J. L., Hernandez-Chico, C., del Castillo, I., and Moreno, F. (1991) The peptide antibiotic Microcin B17 induces double-strand cleavage of DNA mediated by E. coli DNA gyrase, EMBO J. 10, 467-476.
[20] Pierrat, O. A., and Maxwell, A. (2005) Evidence of the role of DNA strand passage in the mechanism of action of Microcin B17 on DNA gyrase, Biochemistry 44, 4204-4215.
[21] Izuta, S., Shimada, N., Kitigawa, M., Suzuki, M., Kojimia, K., and Yoshida, S. (1992) Inhibitory effects of triphosphate derivatives of oxetanocin G and related compounds on eukaryotic and viral DNA polymerases and human immunodeficiency virus reverse transcriptase, J. Biochem. 112, 81-87.
[22] Lui, D., and Golden, J. W. (2002) hetL Overexpression stimulates heterocyst formation in Anabaena sp. strain PCC 7120, J. Bacteriol. 184, 6873-6881.
[23] Wolk, C. P. (2000) Heterocyst formation in Anabaena, American Society of Microbiology, Washington, D.C.
[24] Kondo, T., Strayer, C. A., Kulkarni, R. D., Taylor, W., Ishiura, M., Golden, S. S., and Johnson, C. H. (1993) Circadian rhythms in prokaryotes: luciferase as a reporter of circadian gene expression in cyanobacteria, Proc. Natl. Acad. Sci. USA 90, 5672-5681.
[25] Golden, S. S., and Canales, S. R. (2003) Cyanobacterial circadian clocks--timing is everything, Nat. Rev. Microbiol. 1, 191-199.
[26] Woeffle, M. A., Ouyang, Y., Phanvijhitsiri, K., and Johnson, C. H. (2004) The adaptive value of circadian clocks: an experimental assessment in cyanobacteria, Curr. Biol. 14, 1481-1486.
[27] Vetting, M. W., Hedge, S. S., Hazleton, K. Z., and Blanchard, J. S. (2007) Structural characterization of the fusion of two pentapeptide repeat proteins, Np275 and Np276, from Nostoc punctiforme: Resurrection of an ancestral protein, Protein Sci. 16, 755-760.
[28] Gomi, M., Sonoyama, M., and Mitaku, S. (2004) High performance system for signal peptide prediction: SOSUIsignal, Chem.-Bio. Info. J. 4, 142-147.
[29] Reddy, K. J., Haskell, J. B., Sherman, D. M., and Sherman, L. A. (1993) Unicellular, aerobic nitrogen-fixing cyanobacteria of the genus Cyanothece, J. Bact. 175, 1284-1292.
[30] Stöckel, J., Welsch, E. A., Liberton, M., Kunnvakkam, R., Aurora, R., and Pakrasi, H. B. (2008) Global transcriptomic analysis of Cyanothece 51142 reveals robust diurnal oscillation of central metabolic process, Proc. Natl. Acad. Sci. USA 105, 6156-6161.
[31] Jenkins, J., and Pickersgill, R. (2001) The architecture of parallel β-helices and related folds, Prog. Biophys. Mol. Biol. 77, 111-175.
[32] Graether, S. P., Kuiper, M. J., Gagne, S. M., Walker, V. K., Jia, Z., Sykes, B. D., and Davies, P. L. (2000) β-Helix structure and ice-binding properties of a hyperactive antifreeze protein from an insect, Nature. 406, 325-328.
[33] Liou, Y. C., Tocilj, A., Davies, P. L., and Jia, Z. (2000) Mimicry of ice structure by surface hydroxyls and water of a β-helix antifreeze protein, Nature 406, 322-324.
Pentapeptide Repeat Proteins and Cyanobacteria 255
[34] Badger, J., Sauder, J. M., Adams, J. M., Antonysamy, S., Bain, K., Bergseid, M. G., Buchanan, S. G., Buchanan, M. D., Batiyenko, Y., Christopher, J. A., Emtage, S., Eroshkina, A., Feil, I., Furlong, E. B., Gajiwala, K. S., Gao, X., He, D., Hendle, J., Huber, A., Hoda, K., Kearins, P., Kissinger, C., Laubert, B., Lewis, H. A., Lin, J., Loomis, K., Lorimer, D., Louie, G., Maletic, M., Marsh, C. D., Miller, I., Molinari, J., Muller-Dieckmann, H. J., Newman, J. M., Noland, B. W., Pagarigan, B., Park, F., Peat, T. S., Post, K. W., Radojicic, S., Ramos, A., Romero, R., Rutter, M. E., Sanderson, W. E., Schwinn, K. D., Tresser, J., Winhoven, J., Wright, T. A., Wu, L., Xu, J., and Harris, T. J. R. (2005) Structural analysis of a set of proteins resulting from a bacterial genomics project, Proteins 60, 787-796.
[35] Emsley, P., Charles, I. G., Fairweather, N. F., and Isaacs, N. W. (1996) Structure of Bordetella pertussis virulence facter P69 pertactin, Nature 381, 90-92.
[36] Yoder, M. D., and Jurnak, F. (1995) The parallel β helix and other coiled folds, FASEB J. 9, 335-342.
[37] Kabsch, W., and Sander, C. (1983) Dictionary of protein secondary structure: Pattern recognition of hydrogen-bonding and geometrical features, Biopolymers 22, 2577-2637.
[38] Richardson, J. S. (1981) The anatomy and taxonomy of protein structure, Adv. Protein Chem. 34, 167-339.
[39] Shepherd, A. J., Gorse, D., and Thornton, J. M. (1999) Prediction of the location and type of β-turns in proteins using neural networks, Protein Sci. 8, 1045-1055.
[40] Wilmot, C. M., and Thornton, J. M. (1988) Analysis and prediction of the different types of β-turn in proteins, J. Mol. Biol. 203, 221-232.
[41] Stogios, P. J., Chen, L., and Prive, G. G. (2007) Crystal structure of the BTB domain from the LRF/ZBTB7 transcriptional regulator, Protein Sci. 16, 336-342.
[42] Tompa, P. (2002) Instrinsically unstructured proteins, Trends Biochem. Sci. 27, 527-533.
[43] Fink, A. L. (2005) Natively unfolded proteins, Curr. Opin. Struct. Biol. 15, 35-41. [44] Dunker, A. K., Brown, C. J., Lawsor, J. D., Iahoucheva, L. M., and Obradovic, Z.
(2002) Intrinsic disorder and protein function, Biochemistry 41, 6573-6582. [45] Reeves, R. (2001) Molecular biology of HMGA proteins: hubs of nuclear function,
Gene 277, 63-81. [46] Buchko, G. W., Ni, S., Lourette, N. M., Reeves, R., and Kennedy, M. A. (2007) NMR
resonance assignments of the high mobility group protein HMGA1, J. Biomol. NMR 38, 185.
[47] Singh, G. P., Ganapathi, M., and Dash, D. (2007) Role of intrinsic disorder in transient interactions of hub proteins, Proteins 66, 761-765.
[48] Li, X., Romero, P., Rani, M., Dunker, A. K., and Obradovic, Z. (1999) Predicting protein disorder for N-, C- and internal regions, Genome Info. 10, 30-40.
[49] Romero, P., Obradovic, Z., Li, X., Garner, E. C., Brown, C. J., and Dunker, A. K. (2001) Sequence complexity of disordered protein, Proteins 42, 38-48.
[50] Dunker, A. K., Lawson, J. D., Brown, C. J., Williams, R. M., Romero, P., Oh, J. S., Oldfield, C. J., Campen, A. M., Ratliff, C. M., Hipps, K. W., Aussio, J., Nissen, M. S., Reeves, R., Kang, C., Kissinger, C. R., Bailey, R. W., Griswold, M. D., Chiu, W., Garner, E. C., and Obradovic, Z. (2001) Intrinsically disordered protein, J. Mol. Graphics Modeling 19, 26-59.
Garry W. Buchko 256
[51] Buchko, G. W., Robinson, H., Ni, S., Pakrasi, H. B., and Kennedy, M. A. (2006) Cloning, expression, crystallization and preliminary crystallographic analysis of a pentapeptide-repeat protein (Rfr23) from the bacterium Cyanothece 51142, Acta. Cryst. F62, 1251-1254.
[52] Thornton, J. M. (1981) Disulphide bridges in globular proteins, J. Mol. Biol. 151, 261-287.
[53] Kadokura, H. (2006) Oxidative protein folding: Many different ways to introduce disulfide bonds, Antioxid. Redox Signal. 8, 731-733.
[54] Woody, R. W. (1974) Studies of theoretical circular dichroism of polypeptides: Contributions of β-turns, John Wiley & Sons, New York.
[55] Smith, J. A., and Pease, L. G. (1980) Reverse turns in peptides and proteins, CRC Crit. Rev. Biochem. 8, 315-399.
[56] Kelly, S. M., Jess, T. J., and Price, N. C. (2005) How to study proteins by circular dichroism, Biochim. Biophys. Acta 1751, 119-139.
[57] Perczel, A., Park, K., and Fasman, G. D. (1992) Deconvolution of the circular dichroism spectra of proteins: the circular dichroism spectra of the antiparallel β-sheet in proteins., Proteins 13, 57-69.
[58] Holzwarth, G. M., and Doty, P. (1965) The ultraviolet circular dichroism of polypeptides, J. Amer. Chem. Soc. 87, 218-228.
[59] Buchko, G. W., Hess, N. J., Bandaru, V., Wallace, S. S., and Kennedy, M. A. (2000) Spectroscopic studies of zinc(II)- and colbalt(II)-associated Escherichia coli formamidopyrimidine-DNA glycosylase: Extended X-ray absorption fine structure evidence for a metal-binding domain, Biochemistry 40, 12441-12449.
[60] Chang, J.-F., Hall, B. E., Tanny, J. C., Moazed, D., Filman, D., and Ellenberger, T. (2003) Structure of the coiled-coil dimerization motif of Sir4 and its interaction with Sir3, Structure 11, 637-649.
[61] Kwok, S. C., and Hodges, R. S. (2003) Clustering of large hydrophobes in the hydrophobic core of two-stranded α-helical coiled-coils controls protein folding and stability, J. BIol. Chem. 278, 35248-35254.
[62] Bendtsen, J. D., Nielson, H., von Heijne, G., and Brunak, S. (2004) Improved prediction of signal peptides: SignalP 3.0, J. Mol. Biol. 340, 783-795.
[63] Hogg, P. J. (2003) Disulfide bonds as switches for protein function, Trends Biochem. Sci. 28, 210-214.
[64] Betz, S. F. (1993) Disulfide bonds and the stability of globular proteins, Protein Sci. 2, 1551-1558.
[65] Darby, N., and Creighton, T. E. (1995) Disulfide bonds in protein folding and stability, Methods Mol. Biol. 40, 219-252.
[66] Matsumura, M., and Matthews, B. W. (1991) Stabilization of functional proteins by introduction of multiple disulfide bonds, Methods Enzymol. 202, 336-356.
[67] Richardson, J. S., and Richardson, D. C. (2002) Natural β-sheet proteins use negative design to avoid edge-to-edge aggregation, Proc. Natl. Acad. Sci. U.S.A. 99, 2754-2759.
[68] Fisher, D. J., Cartwright, J. L., Harashima, H., Kamiya, H., and McLennan, A. G. (2004) Characterization of a Nudix hydrolase from Deinococcus radiodurans with a marked specificity for deoxyribonucleoside 5'-diphosphates, BMC Biochem. 5, 7-14.

Pentapeptide Repeat Proteins and Cyanobacteria 257
[69] Buchko, G. W., Litvinova, O., Robinson, H., Yakunin, A. F., and Kennedy, M. A. (2008) Functional and structural characterization of DR_0079 from Deinococcus radiodurans, a novel Nudix hydrolase with a preference for cytosine (deoxy)ribonucleoside 5'-di- and triphosphates, Biochemistry 47, 6571-6582.

In: Handbook on Cyanobacteria ISBN: 978-1-60741-092-8 Editors: P. M. Gault and H. J. Marler © 2009 Nova Science Publishers, Inc.
Chapter 8
THE STATUS AND POTENTIAL OF CYANOBACTERIA AND THEIR TOXINS AS
AGENTS OF BIOTERRORISM
J. S. Metcalf and G. A. Codd Division of Molecular and Environmental Microbiology,
College of Life Sciences, University of Dundee, Dundee DD1 4HN, UK
ABSTRACT
Cyanobacteria (blue-green algae) are ancient photosynthetic prokaryotes which inhabit a wide range of terrestrial and aquatic environments. Under certain aquatic conditions, they are able to proliferate to form extensive blooms, scums and mats, particularly in nutrient-rich waters which may be used for the preparation of drinking water and for recreation, fisheries and crop irrigation. Although not pathogens, many cyanobacteria can produce a wide range of toxic compounds (cyanotoxins) which act through a variety of molecular mechanisms. Cyanotoxins are predominantly characterised as hepatotoxins, neurotoxins and irritant toxins, and further bioactive cyanobacterial metabolites, with both harmful and beneficial properties, are emerging. Human and animal poisoning episodes have been documented and attributed to cyanotoxins, ranging from the deaths of haemodialysis patients in Brazil to a wide range of animal species, including cattle, sheep, dogs, fish and birds. Some purified cyanotoxins are classified as Scheduled Chemical Weapons as they are among the most toxic naturally-occurring compounds currently known and several countries have introduced Anti-Terrorism Legislation to monitor the use and supply of certain purified cyanobacterial toxins. A wide range of physico-chemical and biological methods is available to analyse the toxins and genes involved in their synthesis, which may be applicable to monitoring aspects of cyanobacteria and bioterrorism.
INTRODUCTION Cyanobacteria, also known as blue-green algae, are photosynthetic Gram negative
prokaryotes. They are among some of the oldest known organisms on Earth, with an
J. S. Metcalf and G. A. Codd 260
approximate age of 3 billion years, and they are thought to be responsible for the oxygenation of the primitive Earth atmosphere (Schopf, 2000). Molecular phylogenetic studies indicate ancestral cyanobacteria to have been the ancestors of plant chloroplasts (Adams, 2000; Raymond and Swingley, 2008). Although they are Gram negative bacteria, there have been no reports concerning the ability of cyanobacteria to act as pathogens in the sense that they can grow and cause harm in a susceptible animal or plant host. Cyanobacteria are able to live in symbiosis with plants such as Gunnera and Azolla, and as partners with fungi in lichens, e.g. Peltigera, where they are able to fix atmospheric nitrogen in order to produce organic nitrogen compounds which can be used by the host plant (Adams, 2000). Cyanobacteria have even been reported to live within the hollow hairs of coats of Polar Bears that are kept in zoos (Lewin and Robinson, 1979).
Cyanobacteria harvest light energy using a wide variety of pigments, including chlorophyll a, phycobiliproteins and carotenoids (Fogg et al., 1973). This range of pigment types is responsible for cyanobacteria appearing in a wide variety of colours, from red to almost black, although the blue-green coloration is the most common and the main reason for their originally being termed blue-green algae. Cyanobacteria are found worldwide, in a wide range of environments, from the poles to the tropics, from terrestrial to marine environments. In deserts, for example, they are responsible for helping to stabilise the environment through the production of extracellular polysaccharides to which sand grains adhere and subsequently permit other organisms to become established (Wynn-Williams, 2000). In aquatic environments, under eutrophic conditions, cyanobacteria can “bloom” to form mass populations in the water column and, with the ability of some to form gas vesicles, can float to the surface of a water body and concentrate into a visible scum. Furthermore, through the action of gentle winds over a waterbody, such scums can be further concentrated and will often accumulate on the leeward shore of a lake, near to where people and animals may use the water (Falconer et al., 1999). Investigations into the causes of poisoning episodes have historically led to the identification of specific toxic products of cyanobacteria and research into toxigenic cyanobacteria and their toxins continues apace.
TOXINS PRODUCED BY CYANOBACTERIA AND THEIR MODES OF ACTION
Cyanobacteria produce a range of diverse, low molecular weight and highly toxic
molecules which can adversely affect a number of eukaryotic biochemical mechanisms. The known toxins of cyanobacteria are generally classified into three groups, hepatotoxins, neurotoxins and irritant toxins (Codd et al., 2005a). The hepatotoxins include two principal groups, cylic peptides and guanidine alkaloid hepatotoxins (figure 1).
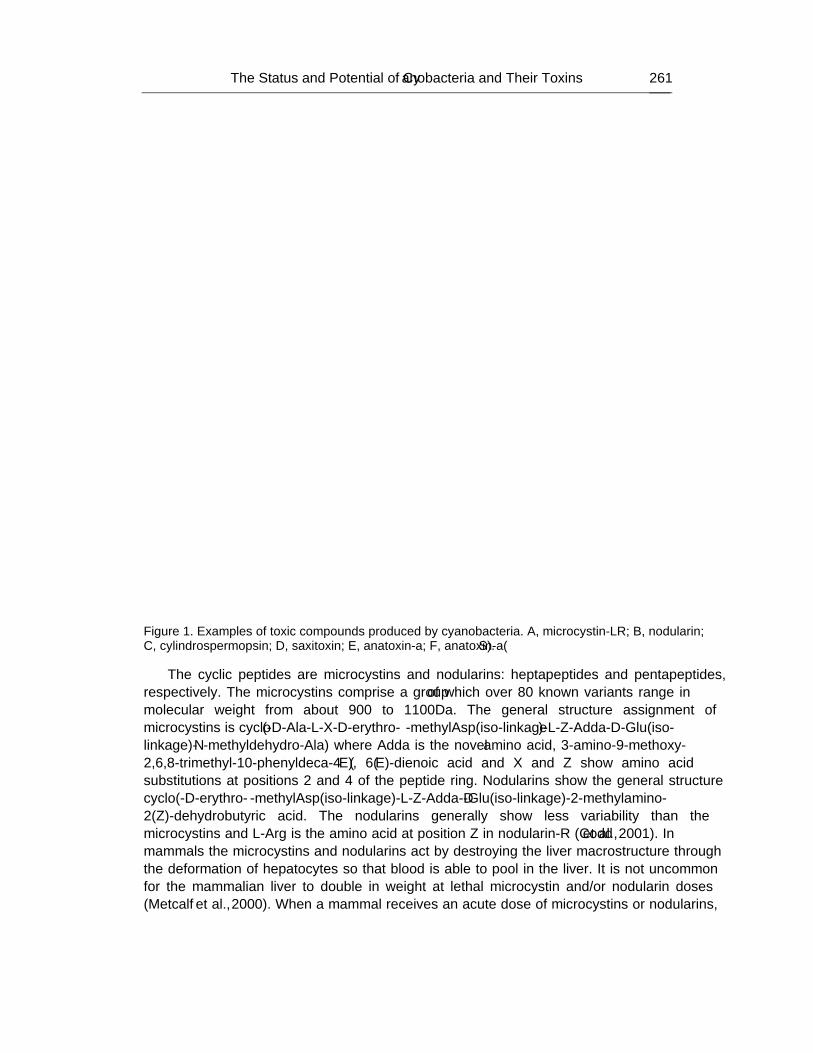
The Status and Potential of Cyanobacteria and Their Toxins … 261
Figure 1. Examples of toxic compounds produced by cyanobacteria. A, microcystin-LR; B, nodularin; C, cylindrospermopsin; D, saxitoxin; E, anatoxin-a; F, anatoxin-a(S).
The cyclic peptides are microcystins and nodularins: heptapeptides and pentapeptides, respectively. The microcystins comprise a group of which over 80 known variants range in molecular weight from about 900 to 1100Da. The general structure assignment of microcystins is cyclo(-D-Ala-L-X-D-erythro-β-methylAsp(iso-linkage)-L-Z-Adda-D-Glu(iso-linkage)-N-methyldehydro-Ala) where Adda is the novel β amino acid, 3-amino-9-methoxy-2,6,8-trimethyl-10-phenyldeca-4 (E), 6(E)-dienoic acid and X and Z show amino acid substitutions at positions 2 and 4 of the peptide ring. Nodularins show the general structure cyclo(-D-erythro-β-methylAsp(iso-linkage)-L-Z-Adda-D-Glu(iso-linkage)-2-methylamino-2(Z)-dehydrobutyric acid. The nodularins generally show less variability than the microcystins and L-Arg is the amino acid at position Z in nodularin-R (Codd et al., 2001). In mammals the microcystins and nodularins act by destroying the liver macrostructure through the deformation of hepatocytes so that blood is able to pool in the liver. It is not uncommon for the mammalian liver to double in weight at lethal microcystin and/or nodularin doses (Metcalf et al., 2000). When a mammal receives an acute dose of microcystins or nodularins,
J. S. Metcalf and G. A. Codd 262
death may occur from hypovolaemic shock or a lack of circulating blood for other organs within the body (Carmichael, 1994). At the molecular level, microcystins and nodularins inhibit a range of protein phosphatases (Mackintosh et al., 1990; Hastie et al., 2005). Microcystins possessing the methyldehydroalanine moiety are able to covalently bind to cysteine 273 of protein phosphatase PP2A and inactivate the enzyme. Consistent with potent phosphatase inhibition is the ability of microcystins to act as tumour promoters in the presence of a primary carcinogen (Nishiwaki-Matsushima et al., 1991). The possibility that microcystins have functioned as tumour promoters in a human population exposed to these toxins was raised by Ueno et al. (1996). In this study, a higher incidence of primary liver cancer was recorded among a population in China who drank from cyanobacteria- and microcystin-containing surface water and had a diet containing tumour initiators, compared to a neighboring population who drank water from underground supplies, apparently free from cyanobacteria (Ueno et al., 1996). The toxicological significance of the tumour promoting ability of microcystins is something that requires further research. Nodularins and a limited number of microcystins possess methyldehydrobutyrine instead of methyldehydroalanine (Beattie et al., 1998) and although this substituted amino acid is unable to bind covalently to protein phosphatases, such cyanobacterial toxins are still able to inhibit protein phosphatases. Furthermore, with the ability to inhibit the enzyme and then allow it to resume its activity once the toxin leaves the active site means that potentially such cyanobacterial toxins may be defined as carcinogens in the future (Lankoff et al., 2006).
The cylindrospermopsins are bicyclic guanidine alkaloid hepatotoxins which were discovered following a human health incident in 1979 (Byth, 1980). From the reservoir used for the preparation of drinking water, a strain of the cyanobacterium Cylindrospermopsis raciborskii was isolated and mouse bioassay analysis indicated that this organism was toxic. Eventually cylindrospermopsin, molecular weight 415Da, was isolated and although a number of organs were considered to be affected by this toxin, the liver appeared to be the primary organ targeted (Hawkins et al., 1985). Cylindrospermopsin, a related toxic variant 7-epi-cylindrospermopsin, and a non-toxic variant, deoxycylindrospermopsin, are known. Molecular studies on the action of cylindrospermopsin showed that this toxin inhibits protein synthesis in animals (Froscio et al., 2001) and plants (Metcalf et al., 2004). Furthermore, due to the planar nature of the cylindrospermopsin molecule, the possibility exists that this compound may interact with DNA, such that its potential role as a carcinogen is something that requires further examination and assessment (Falconer, 2005). However, due to the initial characterisation as a toxin of the mammalian liver, cylindrospermopsin is still referred to as a hepatotoxin, although such a definition may change as research progresses and an understanding of its toxicity increases.
The neurotoxins produced by cyanobacteria comprise a group of alkaloid, low molecular weight toxins. The saxitoxins are a group of over 20 alkaloids of high toxicity (Codd et al., 2001). They are more commonly known for their occurrence in marine waters, where they are produced by dinoflagellates (Anderson, 1994). In such environments they may cause “paralytic shellfish poisoning” where bivalve molluscs concentrate the algal cells (and the toxins) in the hepatopancreas. As molluscs are able to filter litres of water per day, they have the potential to concentrate cells and toxins. Consequently, when the molluscs are consumed, human and animal fatalities can occur. Depuration of molluscs, by leaving the organisms in clean seawater for a few days, permits the shellfish to flush the algae and toxins from their tissues leaving them safe for human consumption. As a result of such problems, the European
The Status and Potential of Cyanobacteria and Their Toxins … 263
Union has introduced legislation concerning the maximum admissible concentration of saxitoxins in mollusc meat destined for human consumption (European Commission, 1991) and such legislation has proven to be extremely useful for the development of analytical methods by driving research on detection systems and analytical methods.
Although dinoflagellates are more commonly known for their ability to produce saxitoxins, several cyanobacterial genera have also been shown to produce these toxins in aquatic environments. These include species of Aphanizomenon, Cylindrospermopsis, Anabaena and Planktothrix. Based on current knowledge, saxitoxins have only been reported in cyanobacteria from freshwaters, with dinoflagellates producing the toxins in the marine environment.
The anatoxins comprise two unrelated alkaloid toxins, anatoxin-a and anatoxin-a(S) (Codd et al., 2005). Anatoxin-a is a nicotinic acetylcholine mimic and four structural variants are known, although some may be breakdown products of anatoxin-a. This cyanotoxin is a structural analogue of cocaine (Carmichael et al., 1979) and has resulted in a number of acute animal toxicoses, including dogs and birds (Codd et al., 1999a). Anatoxin-a(S) is a naturally-occurring organophosphate, where the S denotes hypersalivation which, along with lachryrmation is indicative of poisoning with acetylcholinesterase inhibitors (Matsunaga et al., 1989).
β-N-methylamino-L-alanine (BMAA) is a neurotoxic amino acid. This is acutely neurotoxic to primates (Spencer et al., 1987). BMAA has been known for over 40 years as a product of the tropical tree fern, Cycas circinalis (Vega and Bell, 1967) and has been more recently assigned to symbiotic cyanobacteria (Nostoc sp.) growing in the Cycas tissue (Cox et al., 2003). BMAA now appears to be widely-produced by cyanobacteria, including free-living species in freshwater, seawater and terrestrial environments (Cox et al., 2005; Metcalf et al., 2008; Esterhuizen and Downing, 2008).
Several more toxic compounds are known to be produced by cyanobacteria including irritant and gastrointestinal toxins. The irritant toxins aplysiatoxin, debromoaplysiatoxin and lyngbyatoxin are produced by marine cyanobacteria and are potent tumour promoters (Codd et al., 1999a). A characteristic of Gram negative bacteria, including the cyanobacteria, is the production of lipopolysaccharide and the potential exists for this material to contribute to waterborne gastrointestinal and inflammatory outbreaks (Codd et al., 1999a).
Of the cyanobacterial genera assessed for the production of toxic compounds, Anabaena requires special mention as members of this genus appear to be capable of producing one or more of all of the known types of cyanotoxins, although not all cyanotoxins are produced by one species or strain.
CYANOTOXIN EXTRACTION METHODS If cyanotoxins were to be used for the purposes of bioterrorism, methods would be
required to extract and concentrate the toxins from cyanobacterial cells. Cyanotoxins can be obtained by the laboratory culture of toxigenic cyanobacteria or from cyanobacterial biomass growing in aquatic environments e.g. lakes. Indeed, mass accumulations of toxigenic cyanobacteria when present as scums or mats in waterbodies represent an abundant source of cyanotoxins. Furthermore, cyanobacterial blooms in waterbodies may retain the toxins when
J. S. Metcalf and G. A. Codd 264
the cells are metabolically active and intact, but release these as the cyanobacterial cells lyse. Such decomposition can be from the loss of nutrients in a waterbody or to the action of viruses which specifically affect certain cyanobacteria and offer the potential of lysing a bloom within a few hours. Other methods are available in the laboratory for the release of cyanotoxins and these generally involve mechanical shock and/or solvent extraction (Codd et al., 2001). In terms of mechanical shock, ultrasonication devices or boiling water baths are useful for releasing e.g. microcystins (Metcalf & Codd, 2000), although with the application of heat, consideration should be given so as to be certain that the toxin will not be thereby modified or inactivated. This may certainly be the case with saxitoxins as boiling can convert saxitoxin classes into more toxic variants (Harada et al., 1982). Therefore for bioterrorism purposes, methods that use heat would certainly provide the simplest means of releasing toxins. However, such methods provide very little concentration and purification of the compound(s) and in essence, the mixture is lysed bloom material, similar to that which can be found in the natural environment. The use of solvents for toxin extraction offers a similar level of-, or slightly more- selectivity than mechanical or thermal cell disruption and toxin release although, again, the spectrum of compounds extracted can be similar to that found with lysing cyanobacteria in environmental material. Such facile methods of extraction, although not only useful for offensive bioterrorism purposes, are useful for defensive bioterrorism purposes as they would allow rapid and simple extraction of cyanotoxins for analysis.
Purification methods are available that allow relatively high levels of purification for cyanotoxins. The amount of purified cyanotoxins required will influence the quantity of source material to be processed. Cyanotoxins generally account for approximately ≤0.5% of cell dry weight biomass. Therefore, to produce an amount of cyanotoxin that would be a significant population threat during a bioterrorism incident would require the lyophilisation of many litres of cyanobacterial bloom or scum. The cyanobacterial powder would present a significant health hazard to those persons handling the material.
However, once the material was dried and ready for preparation, then solvent extraction and solid phase extraction (SPE) methods would permit a significant purification step, resulting in semi-pure cyanotoxins, which although not specifically covered by anti-terrorism legislation, could present significant toxicity. SPE systems for microcystins usually involve the use of C18 cartridges, which can bind microcystins, in addition to other compounds, and be washed with low concentrations of methanol (approx. 20% v/v methanol), before elution with higher (30-100%) methanol concentrations (Lawton et al., 1994). Furthermore, by altering the methanol concentrations applied to the SPE cartridge, of the >80 microcystin variants known, different microcystin variants can be separated into fractions (Lawton et al., 1994). With the increasing production and application of antibodies against microcystins, immunoaffinity columns have been developed and, if produced on a large scale, may be useful for both defensive bioterrorism research and offensive bioterrorism acts. SPE methods for anatoxin-a also commonly use C18 toxin recovery and concentration systems, although due to the charged nature of anatoxin-a, a pH of about 9.6 is required for successful retention by this phase (Rapala et al. 1993). Cylindrospermopsin is not retained by C18 materials, although these can be used for the removal of contaminants in extracts before retention by polygraphite carbon (Metcalf et al., 2002) or polymeric SPE phases (Kubo et al., 2005). The small-scale SPE systems generally used would be of little use for bioterrorism purposes,
The Status and Potential of Cyanobacteria and Their Toxins … 265
although with the introduction of flash SPE systems, which use multiple gram sorbents, large quantities of semi-purified cyanotoxins may be produced.
The purified cyanotoxins currently available commercially are, in the main, HPLC-purified compounds obtained from freeze-dried cyanobacteria. From a bioterrorism aspect, the most likely source, if not commercial, would either be the addition of lysing or dried cyanobacterial material, or semi-purified cyanotoxins, to vectors that may be used for bioterrorism.
METHODS FOR THE DETECTION AND ANALYSIS OF CYANOTOXINS
Due to the potential threat of cyanobacteria and their toxins to the environment and to
humans and animals, analytical methods have been developed and refined over the past 30 years. Originally, analytical methods for cyanotoxins employed bioassays, commencing with the mouse bioassay. Alternatives were subsequently introduced, due mainly to the ethical concerns raised over the use of animals in toxicity testing and these include invertebrate and plant-based bioassays (Codd et al., 2001). Certainly, the use of invertebrates has two main advantages over mammals, in addition to the ethical concerns. First, the bioassays can be more sensitive than those using small mammals due to size (and weight) differences and second, they permit a greater statistical analysis of the effects of cyanobacterial extracts and purified compounds, aiding risk assessment. However, bioassays, although advantageous in examining toxicity are, nonetheless, non-specific in that toxic compounds from non-cyanobacterial sources may produce the same adverse response, e.g. a physiological impairment or death. However, bioassays will remain useful for investigating the toxicity of cyanobacterial crude cell-extracts, unidentified cyanobacterial compounds and novel cyanobacterial bioactive products as they continue to be discovered.
Several biochemical and molecular methods of cyanotoxin analysis have been developed on the basis of the modes of action of the toxins. Microcystins and nodularins inhibit protein phosphatases (e.g. MacKintosh et al., 1990) and this mode of action was subsequently used as the basis of analytical methods for their detection, firstly using radiolabelled substrates (e.g. Xu et al., 2000) before the introduction of colorimetric substrates (e.g. Ward et al., 1997).
The knowledge that cylindrospermopsin inhibits eukaryotic protein translation has led to this mode of action being adopted for use as an analytical method for the toxin. The rabbit reticulocyte lysate assay permits the quantification of compounds which inhibit protein translation and cylindrospermopsin inhibits this assay between 0.5 and 3µM (Froscio et al., 2001).
Toxicity assessment of anatoxin-a revealed that this alkaloid binds to acetylcholine receptors at neuromuscular junctions (Carmichael et al., 1975) and is able to bind to nicotinic acetylcholine receptors in Torpedo ocellata tissue (Aronstam and Witkop, 1981). Although this principle has been known for some time, it was only recently that this system was used as an analytical method to detect anatoxin-a in cyanobacterial extracts using competition assays with radiolabelled- (Aroaz et al., 2005) and non-radioactive- (Aroaz et al., 2008) acetylcholine inhibitors.
J. S. Metcalf and G. A. Codd 266
Anatoxin-a(S) was found to have a completely different mode of action with toxicity occurring through inhibition of acetylcholine esterase. As no other analytical methods are currently available for this cyanotoxin, with the exception of bioassays, a colorimetric (or radiometric) acetylcholine esterase inhibition assay (Mahmood and Carmichael, 1987) is the only method which can test for anatoxin-a(S) in cyanobacterial or water samples. Several molecular targets have been observed for the saxitoxins. These include sodium channels which can be blocked by saxitoxins, and saxiphilin, a saxitoxin-binding protein from the bullfrog, Rana catesbeiana (Mahar et al., 1991). A homologue of transferrin (Li and Moczydlowski, 1991), which binds to radiolabelled saxitoxin, saxiphilin is also used to measure non-radioactive saxitoxin in cyanobacterial and/or algal samples using a competition reaction. The use of enzymes or other proteins, although providing simple, rapid and often sensitive molecular bioassays, can be reduced by a lack of specificity. Although an enzyme may be specifically inhibited or bind a class of compound, such enzymes may potentially be inhibited by multiple classes. For example, although microcystins and nodularins inhibit protein phosphatases, so do calyculin A, tautomycin and okadaic acid, all naturally-occurring biotoxins which may occur in environments with, or without cyanotoxins. Furthermore, in the case of anatoxin-a(S), although naturally-occurring organophosphorous toxins may be rare, synthetic organophosphates are numerous. They can be widespread in polluted environments and have been developed for their ability to inhibit acetylcholine esterase for use as pesticides and insecticides (Davis and Richardson, 1980). This makes the specific identification of naturally-occurring anatoxin-a(S) difficult.
Other biochemical methods for detecting cyanotoxins, in particular microcystins, nodularins and saxitoxins include immunoassays. Antibodies have been raised against members of these haptenic cyanotoxin classes and developed into a range of formats for the sensitive and, potentially, specific detection of the cyanotoxins (Metcalf and Codd, 2003). In terms of their application for cyanotoxin detection in bioterrorism events, immunoassays offer the potential for rapid, sensitive detection. Furthermore, due to their adaptability they can be developed and produced as “lateral flow” devices, similar to those used for pregnancy testing in the home. Such devices could be carried on the person or in vehicles and then used when responding to potential incidents. Antibodies against microcystins have been produced against several structural variants, namely MC-LA (Kfir et al., 1986) and MC-LR using carbodiimide (Chu et al., 1989) and glutaraldehyde conjugation methods (Metcalf et al., 2000a), MC-RR (Young et al., 2006) and nodularin (Mikhailov et al., 2001). Some immunoassays have been developed using antibodies raised against a fragment of the microcystin and nodularin molecule: Adda (Fischer et al., 2001). Polyclonal and monoclonal antibodies have been produced against microcystins and they all show differing cross-reactivities when tested with different microcystin variants (Metcalf and Codd, 2003). Only a handful of the >80 microcystin variants have been tested in ELISA systems. From the limited information obtained, some polyclonal antibodies against MC-RR (Young et al., 2006) and Adda have shown consistent results.
Immunoassays for saxitoxins have been developed and although they have only been tested against these neurotoxins from marine dinoflagellates, such assays may be useful for the detection of cyanobacterial saxitoxins from fresh- and brackish waters (Usleber et al., 2001).
Antibodies produced to detect microcystins have been incorporated into standard ELISA kits, immunoassay test strips and immunoaffinity columns. Along with enzyme-based
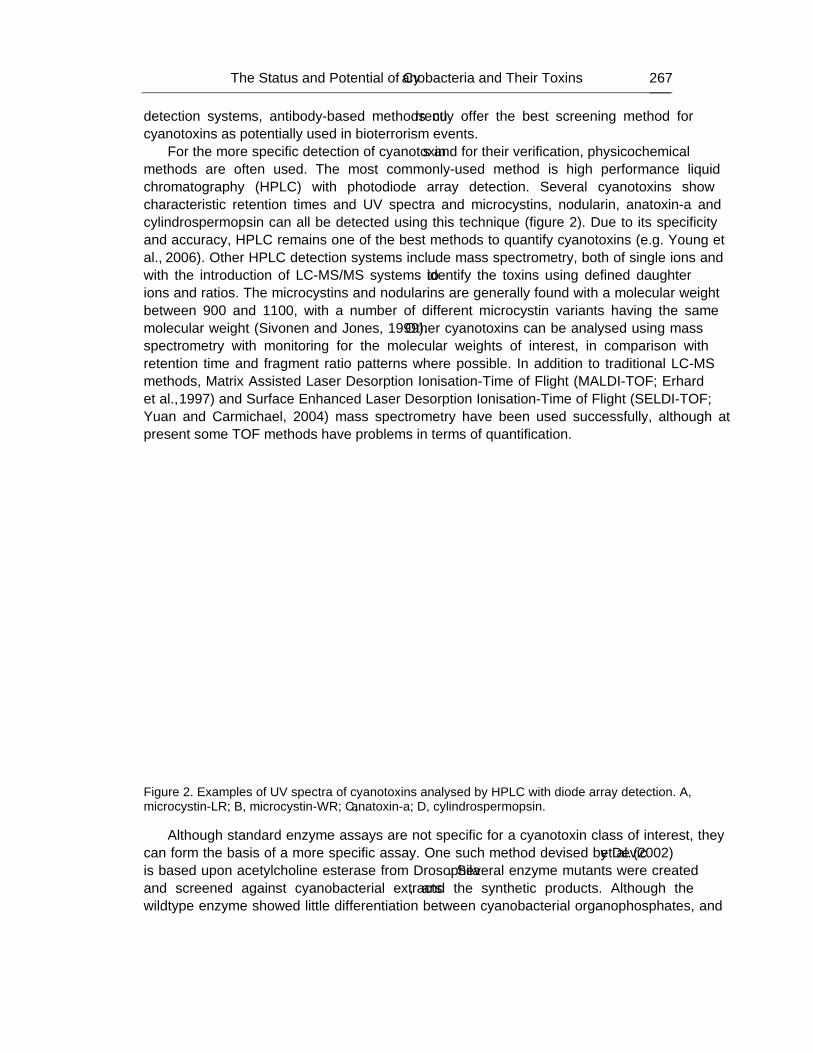
The Status and Potential of Cyanobacteria and Their Toxins … 267
detection systems, antibody-based methods currently offer the best screening method for cyanotoxins as potentially used in bioterrorism events.
For the more specific detection of cyanotoxins and for their verification, physicochemical methods are often used. The most commonly-used method is high performance liquid chromatography (HPLC) with photodiode array detection. Several cyanotoxins show characteristic retention times and UV spectra and microcystins, nodularin, anatoxin-a and cylindrospermopsin can all be detected using this technique (figure 2). Due to its specificity and accuracy, HPLC remains one of the best methods to quantify cyanotoxins (e.g. Young et al., 2006). Other HPLC detection systems include mass spectrometry, both of single ions and with the introduction of LC-MS/MS systems to identify the toxins using defined daughter ions and ratios. The microcystins and nodularins are generally found with a molecular weight between 900 and 1100, with a number of different microcystin variants having the same molecular weight (Sivonen and Jones, 1999). Other cyanotoxins can be analysed using mass spectrometry with monitoring for the molecular weights of interest, in comparison with retention time and fragment ratio patterns where possible. In addition to traditional LC-MS methods, Matrix Assisted Laser Desorption Ionisation-Time of Flight (MALDI-TOF; Erhard et al., 1997) and Surface Enhanced Laser Desorption Ionisation-Time of Flight (SELDI-TOF; Yuan and Carmichael, 2004) mass spectrometry have been used successfully, although at present some TOF methods have problems in terms of quantification.
Figure 2. Examples of UV spectra of cyanotoxins analysed by HPLC with diode array detection. A, microcystin-LR; B, microcystin-WR; C, anatoxin-a; D, cylindrospermopsin.
Although standard enzyme assays are not specific for a cyanotoxin class of interest, they can form the basis of a more specific assay. One such method devised by Devic et al. (2002) is based upon acetylcholine esterase from Drosophila. Several enzyme mutants were created and screened against cyanobacterial extracts, and the synthetic products. Although the wildtype enzyme showed little differentiation between cyanobacterial organophosphates, and
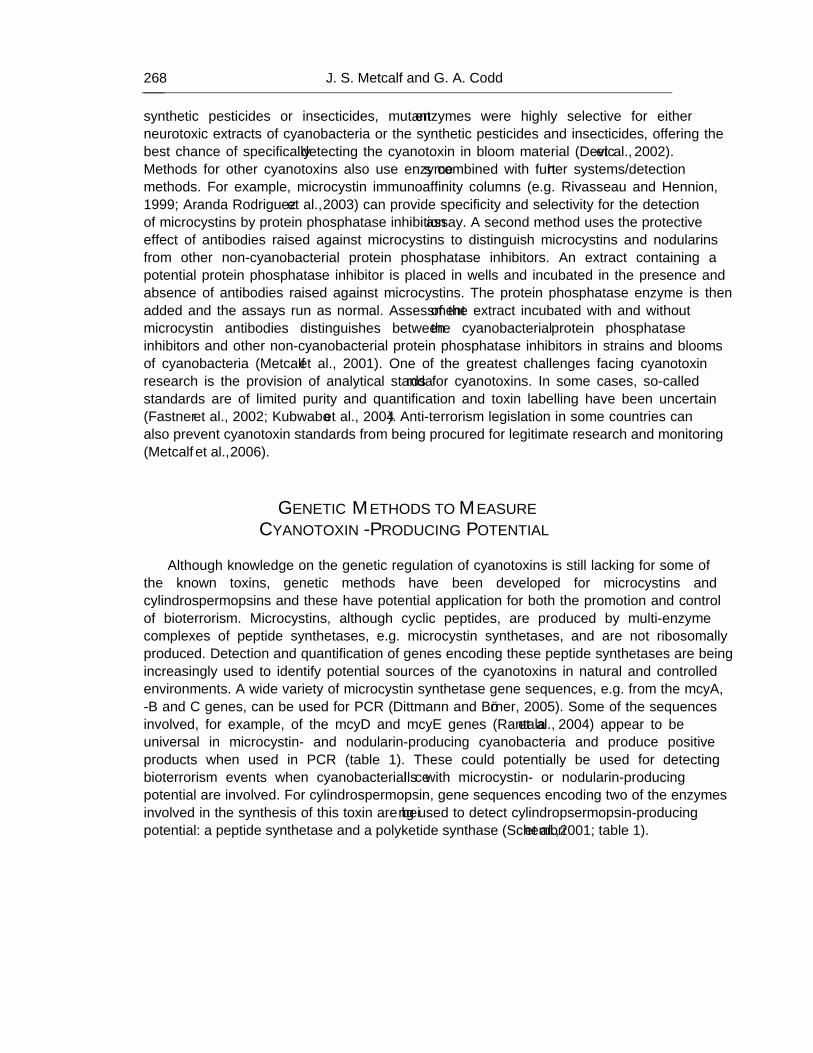
J. S. Metcalf and G. A. Codd 268
synthetic pesticides or insecticides, mutant enzymes were highly selective for either neurotoxic extracts of cyanobacteria or the synthetic pesticides and insecticides, offering the best chance of specifically detecting the cyanotoxin in bloom material (Devic et al., 2002). Methods for other cyanotoxins also use enzymes combined with further systems/detection methods. For example, microcystin immunoaffinity columns (e.g. Rivasseau and Hennion, 1999; Aranda Rodriguez et al., 2003) can provide specificity and selectivity for the detection of microcystins by protein phosphatase inhibition assay. A second method uses the protective effect of antibodies raised against microcystins to distinguish microcystins and nodularins from other non-cyanobacterial protein phosphatase inhibitors. An extract containing a potential protein phosphatase inhibitor is placed in wells and incubated in the presence and absence of antibodies raised against microcystins. The protein phosphatase enzyme is then added and the assays run as normal. Assessment of the extract incubated with and without microcystin antibodies distinguishes between the cyanobacterial protein phosphatase inhibitors and other non-cyanobacterial protein phosphatase inhibitors in strains and blooms of cyanobacteria (Metcalf et al., 2001). One of the greatest challenges facing cyanotoxin research is the provision of analytical standards for cyanotoxins. In some cases, so-called standards are of limited purity and quantification and toxin labelling have been uncertain (Fastner et al., 2002; Kubwabo et al., 2004). Anti-terrorism legislation in some countries can also prevent cyanotoxin standards from being procured for legitimate research and monitoring (Metcalf et al., 2006).
GENETIC METHODS TO MEASURE CYANOTOXIN-PRODUCING POTENTIAL
Although knowledge on the genetic regulation of cyanotoxins is still lacking for some of
the known toxins, genetic methods have been developed for microcystins and cylindrospermopsins and these have potential application for both the promotion and control of bioterrorism. Microcystins, although cyclic peptides, are produced by multi-enzyme complexes of peptide synthetases, e.g. microcystin synthetases, and are not ribosomally produced. Detection and quantification of genes encoding these peptide synthetases are being increasingly used to identify potential sources of the cyanotoxins in natural and controlled environments. A wide variety of microcystin synthetase gene sequences, e.g. from the mcyA, -B and –C genes, can be used for PCR (Dittmann and Börner, 2005). Some of the sequences involved, for example, of the mcyD and mcyE genes (Rantala et al., 2004) appear to be universal in microcystin- and nodularin-producing cyanobacteria and produce positive products when used in PCR (table 1). These could potentially be used for detecting bioterrorism events when cyanobacterial cells with microcystin- or nodularin-producing potential are involved. For cylindrospermopsin, gene sequences encoding two of the enzymes involved in the synthesis of this toxin are being used to detect cylindropsermopsin-producing potential: a peptide synthetase and a polyketide synthase (Schembri et al., 2001; table 1).
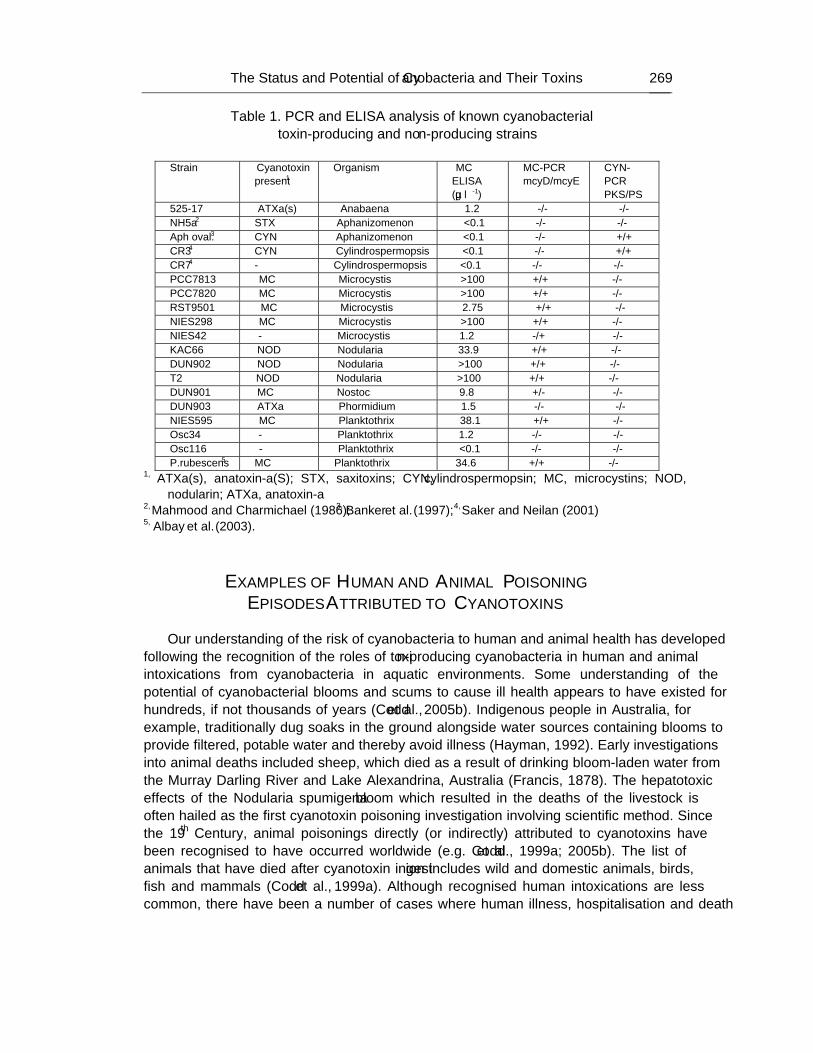
The Status and Potential of Cyanobacteria and Their Toxins … 269
Table 1. PCR and ELISA analysis of known cyanobacterial toxin-producing and non-producing strains
Strain Cyanotoxin
present1 Organism MC
ELISA (µg l-1)
MC-PCR mcyD/mcyE
CYN-PCR PKS/PS
525-17 ATXa(s) Anabaena 1.2 -/- -/- NH5a2 STX Aphanizomenon <0.1 -/- -/- Aph oval.3 CYN Aphanizomenon <0.1 -/- +/+ CR34 CYN Cylindrospermopsis <0.1 -/- +/+ CR74 - Cylindrospermopsis <0.1 -/- -/- PCC7813 MC Microcystis >100 +/+ -/- PCC7820 MC Microcystis >100 +/+ -/- RST9501 MC Microcystis 2.75 +/+ -/- NIES298 MC Microcystis >100 +/+ -/- NIES42 - Microcystis 1.2 -/+ -/- KAC66 NOD Nodularia 33.9 +/+ -/- DUN902 NOD Nodularia >100 +/+ -/- T2 NOD Nodularia >100 +/+ -/- DUN901 MC Nostoc 9.8 +/- -/- DUN903 ATXa Phormidium 1.5 -/- -/- NIES595 MC Planktothrix 38.1 +/+ -/- Osc34 - Planktothrix 1.2 -/- -/- Osc116 - Planktothrix <0.1 -/- -/- P.rubescens5 MC Planktothrix 34.6 +/+ -/-
1, ATXa(s), anatoxin-a(S); STX, saxitoxins; CYN, cylindrospermopsin; MC, microcystins; NOD, nodularin; ATXa, anatoxin-a
2, Mahmood and Charmichael (1986); 3, Banker et al. (1997); 4, Saker and Neilan (2001) 5, Albay et al. (2003).
EXAMPLES OF HUMAN AND ANIMAL POISONING EPISODES ATTRIBUTED TO CYANOTOXINS
Our understanding of the risk of cyanobacteria to human and animal health has developed
following the recognition of the roles of toxin-producing cyanobacteria in human and animal intoxications from cyanobacteria in aquatic environments. Some understanding of the potential of cyanobacterial blooms and scums to cause ill health appears to have existed for hundreds, if not thousands of years (Codd et al., 2005b). Indigenous people in Australia, for example, traditionally dug soaks in the ground alongside water sources containing blooms to provide filtered, potable water and thereby avoid illness (Hayman, 1992). Early investigations into animal deaths included sheep, which died as a result of drinking bloom-laden water from the Murray Darling River and Lake Alexandrina, Australia (Francis, 1878). The hepatotoxic effects of the Nodularia spumigena bloom which resulted in the deaths of the livestock is often hailed as the first cyanotoxin poisoning investigation involving scientific method. Since the 19th Century, animal poisonings directly (or indirectly) attributed to cyanotoxins have been recognised to have occurred worldwide (e.g. Codd et al., 1999a; 2005b). The list of animals that have died after cyanotoxin ingestion includes wild and domestic animals, birds, fish and mammals (Codd et al., 1999a). Although recognised human intoxications are less common, there have been a number of cases where human illness, hospitalisation and death
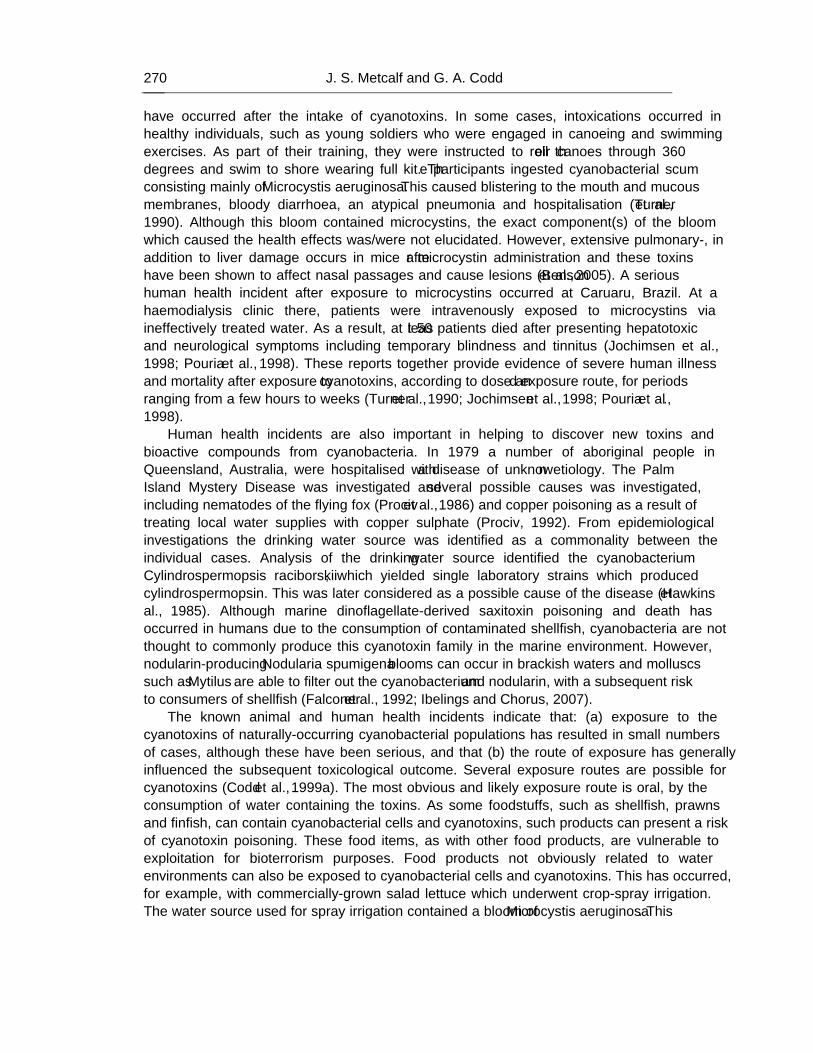
J. S. Metcalf and G. A. Codd 270
have occurred after the intake of cyanotoxins. In some cases, intoxications occurred in healthy individuals, such as young soldiers who were engaged in canoeing and swimming exercises. As part of their training, they were instructed to roll their canoes through 360 degrees and swim to shore wearing full kit. The participants ingested cyanobacterial scum consisting mainly of Microcystis aeruginosa. This caused blistering to the mouth and mucous membranes, bloody diarrhoea, an atypical pneumonia and hospitalisation (Turner et al., 1990). Although this bloom contained microcystins, the exact component(s) of the bloom which caused the health effects was/were not elucidated. However, extensive pulmonary-, in addition to liver damage occurs in mice after microcystin administration and these toxins have been shown to affect nasal passages and cause lesions (Benson et al., 2005). A serious human health incident after exposure to microcystins occurred at Caruaru, Brazil. At a haemodialysis clinic there, patients were intravenously exposed to microcystins via ineffectively treated water. As a result, at least 50 patients died after presenting hepatotoxic and neurological symptoms including temporary blindness and tinnitus (Jochimsen et al., 1998; Pouria et al., 1998). These reports together provide evidence of severe human illness and mortality after exposure to cyanotoxins, according to dose and exposure route, for periods ranging from a few hours to weeks (Turner et al., 1990; Jochimsen et al., 1998; Pouria et al., 1998).
Human health incidents are also important in helping to discover new toxins and bioactive compounds from cyanobacteria. In 1979 a number of aboriginal people in Queensland, Australia, were hospitalised with a disease of unknown etiology. The “Palm Island Mystery Disease” was investigated and several possible causes was investigated, including nematodes of the flying fox (Prociv et al., 1986) and copper poisoning as a result of treating local water supplies with copper sulphate (Prociv, 1992). From epidemiological investigations the drinking water source was identified as a commonality between the individual cases. Analysis of the drinking water source identified the cyanobacterium Cylindrospermopsis raciborskii, which yielded single laboratory strains which produced cylindrospermopsin. This was later considered as a possible cause of the disease (Hawkins et al., 1985). Although marine dinoflagellate-derived saxitoxin poisoning and death has occurred in humans due to the consumption of contaminated shellfish, cyanobacteria are not thought to commonly produce this cyanotoxin family in the marine environment. However, nodularin-producing Nodularia spumigena blooms can occur in brackish waters and molluscs such as Mytilus are able to filter out the cyanobacterium and nodularin, with a subsequent risk to consumers of shellfish (Falconer et al., 1992; Ibelings and Chorus, 2007).
The known animal and human health incidents indicate that: (a) exposure to the cyanotoxins of naturally-occurring cyanobacterial populations has resulted in small numbers of cases, although these have been serious, and that (b) the route of exposure has generally influenced the subsequent toxicological outcome. Several exposure routes are possible for cyanotoxins (Codd et al., 1999a). The most obvious and likely exposure route is oral, by the consumption of water containing the toxins. As some foodstuffs, such as shellfish, prawns and finfish, can contain cyanobacterial cells and cyanotoxins, such products can present a risk of cyanotoxin poisoning. These food items, as with other food products, are vulnerable to exploitation for bioterrorism purposes. Food products not obviously related to water environments can also be exposed to cyanobacterial cells and cyanotoxins. This has occurred, for example, with commercially-grown salad lettuce which underwent crop-spray irrigation. The water source used for spray irrigation contained a bloom of Microcystis aeruginosa. This
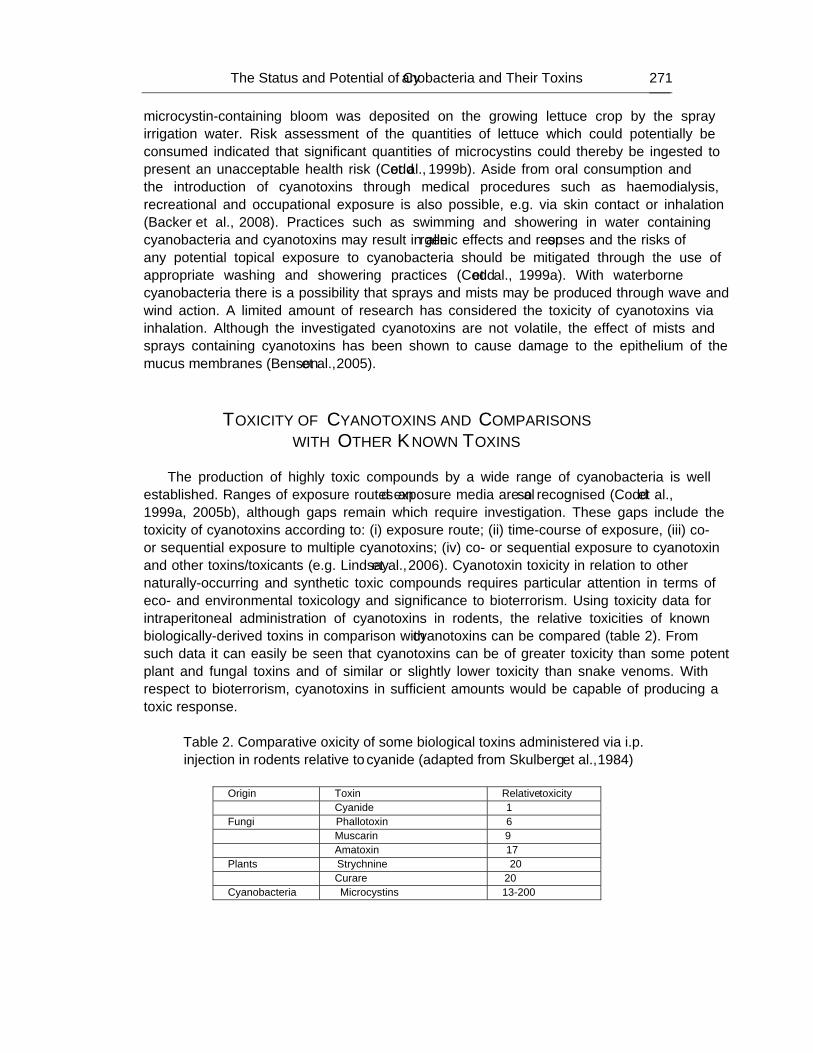
The Status and Potential of Cyanobacteria and Their Toxins … 271
microcystin-containing bloom was deposited on the growing lettuce crop by the spray irrigation water. Risk assessment of the quantities of lettuce which could potentially be consumed indicated that significant quantities of microcystins could thereby be ingested to present an unacceptable health risk (Codd et al., 1999b). Aside from oral consumption and the introduction of cyanotoxins through medical procedures such as haemodialysis, recreational and occupational exposure is also possible, e.g. via skin contact or inhalation (Backer et al., 2008). Practices such as swimming and showering in water containing cyanobacteria and cyanotoxins may result in allergenic effects and responses and the risks of any potential topical exposure to cyanobacteria should be mitigated through the use of appropriate washing and showering practices (Codd et al., 1999a). With waterborne cyanobacteria there is a possibility that sprays and mists may be produced through wave and wind action. A limited amount of research has considered the toxicity of cyanotoxins via inhalation. Although the investigated cyanotoxins are not volatile, the effect of mists and sprays containing cyanotoxins has been shown to cause damage to the epithelium of the mucus membranes (Benson et al., 2005).
TOXICITY OF CYANOTOXINS AND COMPARISONS WITH OTHER KNOWN TOXINS
The production of highly toxic compounds by a wide range of cyanobacteria is well
established. Ranges of exposure routes and exposure media are also recognised (Codd et al., 1999a, 2005b), although gaps remain which require investigation. These gaps include the toxicity of cyanotoxins according to: (i) exposure route; (ii) time-course of exposure, (iii) co- or sequential exposure to multiple cyanotoxins; (iv) co- or sequential exposure to cyanotoxin and other toxins/toxicants (e.g. Lindsay et al., 2006). Cyanotoxin toxicity in relation to other naturally-occurring and synthetic toxic compounds requires particular attention in terms of eco- and environmental toxicology and significance to bioterrorism. Using toxicity data for intraperitoneal administration of cyanotoxins in rodents, the relative toxicities of known biologically-derived toxins in comparison with cyanotoxins can be compared (table 2). From such data it can easily be seen that cyanotoxins can be of greater toxicity than some potent plant and fungal toxins and of similar or slightly lower toxicity than snake venoms. With respect to bioterrorism, cyanotoxins in sufficient amounts would be capable of producing a toxic response.
Table 2. Comparative oxicity of some biological toxins administered via i.p. injection in rodents relative to cyanide (adapted from Skulberg et al., 1984)
Origin Toxin Relative toxicity Cyanide 1 Fungi Phallotoxin 6 Muscarin 9 Amatoxin 17 Plants Strychnine 20 Curare 20 Cyanobacteria Microcystins 13-200
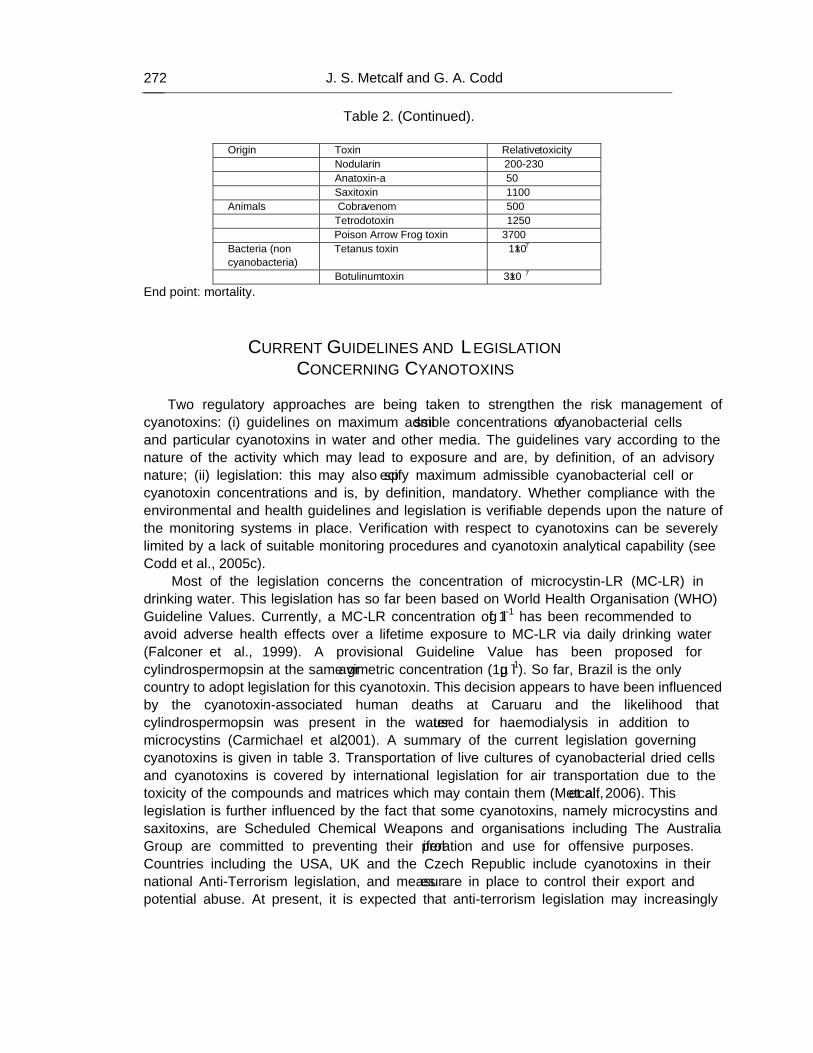
J. S. Metcalf and G. A. Codd 272
Table 2. (Continued).
Origin Toxin Relative toxicity Nodularin 200-230 Anatoxin-a 50 Saxitoxin 1100 Animals Cobra venom 500 Tetrodotoxin 1250 Poison Arrow Frog toxin 3700 Bacteria (non cyanobacteria)
Tetanus toxin 1×10⁷
Botulinum toxin 3×10⁷
End point: mortality.
CURRENT GUIDELINES AND LEGISLATION CONCERNING CYANOTOXINS
Two regulatory approaches are being taken to strengthen the risk management of
cyanotoxins: (i) guidelines on maximum admissible concentrations of cyanobacterial cells and particular cyanotoxins in water and other media. The guidelines vary according to the nature of the activity which may lead to exposure and are, by definition, of an advisory nature; (ii) legislation: this may also specify maximum admissible cyanobacterial cell or cyanotoxin concentrations and is, by definition, mandatory. Whether compliance with the environmental and health guidelines and legislation is verifiable depends upon the nature of the monitoring systems in place. Verification with respect to cyanotoxins can be severely limited by a lack of suitable monitoring procedures and cyanotoxin analytical capability (see Codd et al., 2005c).
Most of the legislation concerns the concentration of microcystin-LR (MC-LR) in drinking water. This legislation has so far been based on World Health Organisation (WHO) Guideline Values. Currently, a MC-LR concentration of 1μg l-1 has been recommended to avoid adverse health effects over a lifetime exposure to MC-LR via daily drinking water (Falconer et al., 1999). A provisional Guideline Value has been proposed for cylindrospermopsin at the same gravimetric concentration (1µg l-1). So far, Brazil is the only country to adopt legislation for this cyanotoxin. This decision appears to have been influenced by the cyanotoxin-associated human deaths at Caruaru and the likelihood that cylindrospermopsin was present in the water used for haemodialysis in addition to microcystins (Carmichael et al., 2001). A summary of the current legislation governing cyanotoxins is given in table 3. Transportation of live cultures of cyanobacterial dried cells and cyanotoxins is covered by international legislation for air transportation due to the toxicity of the compounds and matrices which may contain them (Metcalf et al., 2006). This legislation is further influenced by the fact that some cyanotoxins, namely microcystins and saxitoxins, are Scheduled Chemical Weapons and organisations including The Australia Group are committed to preventing their proliferation and use for offensive purposes. Countries including the USA, UK and the Czech Republic include cyanotoxins in their national Anti-Terrorism legislation, and measures are in place to control their export and potential abuse. At present, it is expected that anti-terrorism legislation may increasingly
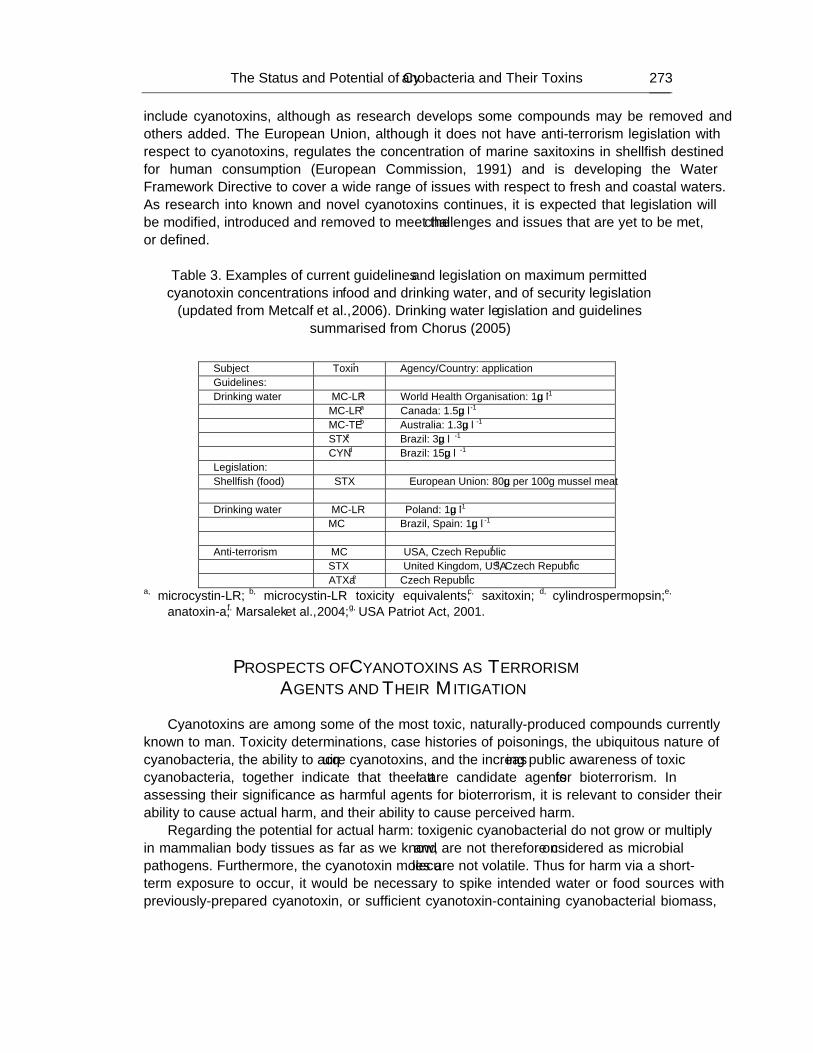
The Status and Potential of Cyanobacteria and Their Toxins … 273
include cyanotoxins, although as research develops some compounds may be removed and others added. The European Union, although it does not have anti-terrorism legislation with respect to cyanotoxins, regulates the concentration of marine saxitoxins in shellfish destined for human consumption (European Commission, 1991) and is developing the Water Framework Directive to cover a wide range of issues with respect to fresh and coastal waters. As research into known and novel cyanotoxins continues, it is expected that legislation will be modified, introduced and removed to meet the challenges and issues that are yet to be met, or defined.
Table 3. Examples of current guidelines and legislation on maximum permitted
cyanotoxin concentrations in food and drinking water, and of security legislation (updated from Metcalf et al., 2006). Drinking water legislation and guidelines
summarised from Chorus (2005)
Subject Toxin* Agency/Country: application Guidelines: Drinking water MC-LRa World Health Organisation: 1µg l-1 MC-LRa Canada: 1.5µg l-1
MC-TEb Australia: 1.3µg l-1
STXc Brazil: 3µg l-1
CYNd Brazil: 15µg l-1
Legislation: Shellfish (food) STX European Union: 80µg per 100g mussel meat Drinking water MC-LR Poland: 1µg l-1
MC Brazil, Spain: 1µg l-1
Anti-terrorism MC USA, Czech Republicf STX United Kingdom, USAg, Czech Republicf
ATXae Czech Republicf
a, microcystin-LR; b, microcystin-LR toxicity equivalents; c, saxitoxin; d, cylindrospermopsin; e, anatoxin-a; f, Marsalek et al., 2004; g, USA Patriot Act, 2001.
PROSPECTS OF CYANOTOXINS AS TERRORISM AGENTS AND THEIR MITIGATION
Cyanotoxins are among some of the most toxic, naturally-produced compounds currently
known to man. Toxicity determinations, case histories of poisonings, the ubiquitous nature of cyanobacteria, the ability to acquire cyanotoxins, and the increasing public awareness of toxic cyanobacteria, together indicate that the latter are candidate agents for bioterrorism. In assessing their significance as harmful agents for bioterrorism, it is relevant to consider their ability to cause actual harm, and their ability to cause perceived harm.
Regarding the potential for actual harm: toxigenic cyanobacterial do not grow or multiply in mammalian body tissues as far as we know, and are not therefore considered as microbial pathogens. Furthermore, the cyanotoxin molecules are not volatile. Thus for harm via a short-term exposure to occur, it would be necessary to spike intended water or food sources with previously-prepared cyanotoxin, or sufficient cyanotoxin-containing cyanobacterial biomass,
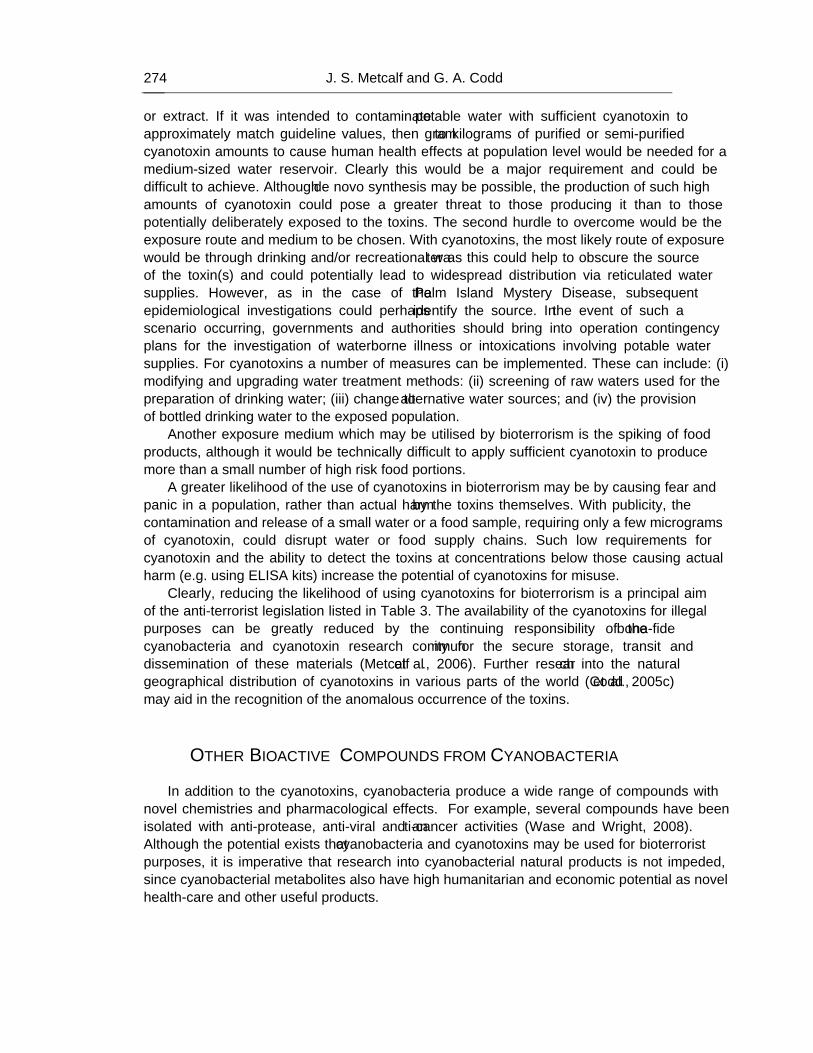
J. S. Metcalf and G. A. Codd 274
or extract. If it was intended to contaminate potable water with sufficient cyanotoxin to approximately match guideline values, then gram to kilograms of purified or semi-purified cyanotoxin amounts to cause human health effects at population level would be needed for a medium-sized water reservoir. Clearly this would be a major requirement and could be difficult to achieve. Although de novo synthesis may be possible, the production of such high amounts of cyanotoxin could pose a greater threat to those producing it than to those potentially deliberately exposed to the toxins. The second hurdle to overcome would be the exposure route and medium to be chosen. With cyanotoxins, the most likely route of exposure would be through drinking and/or recreational water as this could help to obscure the source of the toxin(s) and could potentially lead to widespread distribution via reticulated water supplies. However, as in the case of the Palm Island Mystery Disease, subsequent epidemiological investigations could perhaps identify the source. In the event of such a scenario occurring, governments and authorities should bring into operation contingency plans for the investigation of waterborne illness or intoxications involving potable water supplies. For cyanotoxins a number of measures can be implemented. These can include: (i) modifying and upgrading water treatment methods: (ii) screening of raw waters used for the preparation of drinking water; (iii) change to alternative water sources; and (iv) the provision of bottled drinking water to the exposed population.
Another exposure medium which may be utilised by bioterrorism is the spiking of food products, although it would be technically difficult to apply sufficient cyanotoxin to produce more than a small number of high risk food portions.
A greater likelihood of the use of cyanotoxins in bioterrorism may be by causing fear and panic in a population, rather than actual harm by the toxins themselves. With publicity, the contamination and release of a small water or a food sample, requiring only a few micrograms of cyanotoxin, could disrupt water or food supply chains. Such low requirements for cyanotoxin and the ability to detect the toxins at concentrations below those causing actual harm (e.g. using ELISA kits) increase the potential of cyanotoxins for misuse.
Clearly, reducing the likelihood of using cyanotoxins for bioterrorism is a principal aim of the anti-terrorist legislation listed in Table 3. The availability of the cyanotoxins for illegal purposes can be greatly reduced by the continuing responsibility of the bona-fide cyanobacteria and cyanotoxin research community for the secure storage, transit and dissemination of these materials (Metcalf et al., 2006). Further research into the natural geographical distribution of cyanotoxins in various parts of the world (Codd et al., 2005c) may aid in the recognition of the anomalous occurrence of the toxins.
OTHER BIOACTIVE COMPOUNDS FROM CYANOBACTERIA In addition to the cyanotoxins, cyanobacteria produce a wide range of compounds with
novel chemistries and pharmacological effects. For example, several compounds have been isolated with anti-protease, anti-viral and anti-cancer activities (Wase and Wright, 2008). Although the potential exists that cyanobacteria and cyanotoxins may be used for bioterrorist purposes, it is imperative that research into cyanobacterial natural products is not impeded, since cyanobacterial metabolites also have high humanitarian and economic potential as novel health-care and other useful products.
The Status and Potential of Cyanobacteria and Their Toxins … 275
FUTURE AND CURRENT CONCERNS WITH RESPECT TO BIOTERRORISM
A potential conflicting problem with respect to the containment of the use of cyanotoxins
for bioterrorism is the need to continue to permit and support research into toxigenic cyanobacteria and their toxins. This research includes studies on environmental detection and analysis, toxin (bio)synthesis and toxicity, environmental occurrence, persistence and detoxication. By promoting such legitimate research on cyanobacteria and their toxins, it is necessary to examine how progress can be applied to preventing cyanotoxin use for terrorist purposes. For example, advances in analytical capabilities can be applied to rapid response strategies in the event of a threatened, or actual, bioterrorism event. Greater understanding of cyanotoxin detoxication (Metcalf et al., 2000a) and the removal of cyanotoxins during water treatment (e.g. Rodriguez et al., 2007) may be useful to help reduce and overcome the impacts of a potential bioterrorist event. Finally, it is important that advances in knowledge of the production, properties and health significance of cyanobacteria and cyanotoxins are taken into account by the relevant experts and authorities in the security- and risk management of bioterrorism.
CONCLUSIONS Cyanobacteria are capable of producing a range of toxic substances which have the
potential to be used for offensive illegitimate acts. Although the cyanotoxin quantities required to cause large scale human toxicity are most likely unfeasible, smaller quantities could potentially be used to cause fear and panic among the general population. Further research into the toxicity and fates of cyanotoxins should continue to inform the formulation of appropriate guidelines and legislation to minimise the likelihood that the toxins could be used as bioterrorism agents.
REFERENCES
Adams, D. G. (2000). Symbiotic interactions. In B. A. Whitton & M. Potts (Eds), The Ecology of Cyanobacteria: Their diversity in time and space (523-561). Dordrecht, The Netherlands: Kluwer Academic Publishers.
Albay, M., Akcaalan, R., Tufecki, H., Metcalf, J. S., Beattie, K. A. & Codd, G. A. (2003). Depth profiles of cyanobacterial hepatotoxins (microcystins) in three Turkish freshwater lakes. Hydrobiologia, 505, 89-95.
Anderson, D. M. (1994). Red tides. Sci. Amer., 271, 62-68. Aranda-Rodriguez, R., Kubwabo, C. & Benoit, F.M. (2003). Extraction of 15 microcystins
and nodularin using immunoaffinity columns Toxicon, 42, 587-599. Aráoz, R., Nghiem, H.-O., Rippka, R., Palibroda, N., Tandeau de Marsac, N. & Herdman, M.
(2005). Neurotoxins in axenic oscillatorian cyanobacteria: coexistence of anatoxin-a and homoanatoxin-a determined by ligand-binding assay and GC/MS. Microbiology, 151,1263-1273.
J. S. Metcalf and G. A. Codd 276
Aráoz, R., Herdman, M., Rippka, R., Ledreux, A., Molgó, J., Changeux, J.-P., Tandeau de Marsac, N. & Nghiem, H.-O. (2008). A non-radioactive ligand-binding assay for detection of cyanobacterial anatoxins using Torpedo electrocyte membranes Toxicon, 52,163-174.
Aronstam, R.S. & Witkop, B. (1981) Anatoxin-a interactions with cholinergic synaptic molecules. PNAS, 78, 4639-4643.
Backer, L.C., Carmichael, W., Kirkpatrick, B., Williams,C., Irvin, M., Zhou, Y., Johnson, T.B., Nierenberg, K., Hill, Y.R., Kieszak, S.M. & Cheng, Y-S. (2008). Recreational exposure to low concentrations of microcystins during an algal bloom in a shallow lake. Marine Drugs, 6, 389-406.
Banker, R., Carmeli, S., Hadas, O., Teltsch, B., Porat, R. & Sukenik, A. (1997). Identification of cylindrospermopsin in Aphanizomenon ovalisporum (Cyanophyceae) isolated from Lake Kinneret, Israel. J. Phycol., 33, 613-616.
Bartram, J., Carmichael, W. W., Chorus, I., Jones, G. and Skulberg, O. M. (1999). Introduction. In J. Bartram & I. Chorus (Eds), Toxic Cyanobacteria in Water (1-14). London, U.K., E & F.N. Spon.
Beattie, K.A., Kaya, K., Sano, T. & Codd, G.A. (1998). Three dehydrobutyrine-containing microcystins from Nostoc. Phytochemistry, 47, 1289-1292.
Benson, J.M., Hutt, J.A., Rein, K., Boggs, S.E., Barr, E.B. & Fleming, L.E. (2005). The toxicity of microcystinLR in mice following 7 days of inhalation exposure. Toxicon, 45, 691-698.
Byth, S. (1980). Palm Island Mystery Disease. Med. J. Austr., 2, 40-42. Carmichael, W.W. (1994) The toxins of cyanobacteria. Sci. Amer., 270, 78-86. Carmichael, W.W., Biggs, D.F. & Gorham, P.R. (1975). Toxicology and pharmacological
action of Anabaena flosaquae toxin. Science, 187, 542-544. Carmichael, W.W., Biggs, D.F. & Peterson, M.A. (1979). Pharmacology of anatoxin-a,
produced by the freshwater cyanophyte Anabaena flos-aquae NRC-44-1 Toxicon, 17, 229-236.
Carmichael, W. W., Azevedo, S. M. F. O., An, J. S., Molica, R. J. R., Jochimsen, E. M., Lau, S., Rinehart, K. L., Shaw, G. R. & Eaglesham, G. K. (2001). Human fatalities form cyanobacteria: Chemical and biological evidence for cyanotoxins. Environ. Hlth. Perspec., 109, 663-668.
Chorus, I., (2005). Current approaches to cyanotoxin risk assessment, risk management and regulations in different countries. Umweltbundesamt, Berlin 117pp.
Chu, F.S., Huang, X., Wei, R.D. & Carmichael, W.W. (1989). Production and characterization of antibodies against microcystins. Applied Environ. Microbiol., 55, 1928-1933.
Codd, G. A., Bell, S. G., Kaya, K., Ward, C. J., Beattie, K. A. & Metcalf, J. S. (1999a). Cyanobacterial toxins, exposure routes and human health. Eur. J. Phycol., 34, 405-415.
Codd, G. A., Metcalf, J. S. & Beattie, K. A. (1999b). Retention of Microcystis aeruginosa and microcystin by salad lettuce (Lactuca sativa) after spray irrigation with water containing cyanobacteria. Toxicon, 37, 1181-1185.
Codd, G. A., Metcalf, J. S., Ward, C. J., Beattie, K. A., Bell, S. G., Kaya, K. & Poon, G. K. (2001). Analysis of cyanobacterial toxins by physicochemical and biochemical methods. J. AOAC Int., 84, 1626-1635.
The Status and Potential of Cyanobacteria and Their Toxins … 277
Codd, G. A., Morrison, L. F. & Metcalf, J. S. (2005a). Cyanobacterial toxins: risk management for health protection. Toxicol. Appl. Pharmacol., 203, 264-272.
Codd, G.A., Lindsay, J., Young, F.M., Morrison, L.F. & Metcalf, J.S. (2005b): Harmful cyanobacteria. From mass mortalities to management measures. In J. Huisman, H.C.P.Matthijs & P.M.Visser (Eds), Harmful Cyanobacteria (1-23). Dordrecht , The Netherlands, Springer.
Codd, G.A., Azevedo, S.M.F.O., Bagchi, S.N., Burch, M.D., Carmichael, W.W., Harding, W.R., Kaya, K. & Utkilen, H.C. (Eds.) (2005c).CYANONET A Global Network for Cyanobacterial bloom and Toxin Risk Management. Initial Situation Assessment and Recommendations. International Hydrobiological Programme, Technical Documents in Hydrology No. 76, UNESCO, Paris, pp. 138.
Cox, P. A., Banack, S. A. & Murch, S. J. (2003). Biomagnification of cyanobacterial neurotoxins and neurodegenerative disease among the Chamorro people of Guam. PNAS, 100, 13380-13383.
Cox, P. A., Banack, S. A., Murch, S. J., Rasmussen, U., Tien, G., Bidigare, R. R., Metcalf, J. S., Morrison, L. F., Codd, G. A. & Bergman, B. (2005). Diverse taxa of cyanobacteria produce β-N-methylamino-L-alanine, a neurotoxic amino acid. PNAS, 102, 5074-5078.
Davis, C.S. & Richardson, R.J. (1980). Organophosphorus compounds. In P. S. Spencer & H. H. Schaumburg. Experimental and Clinical Neurotoxicology (527-544). Baltimore, USA., Williams and Wilkins.
Devic, E., Li, D., Dauta, A., Henriksen, P., Codd, G.A., Marty, J.-L. & Fournier, D. (2002). Detection of anatoxin-a(s) in environmental samples of cyanobacteria by using a biosensor with engineered acetylcholinesterases. Appl. Environ. Microbiol., 68, 4102-4106.
Dittmann, E. & Börner, T. (2005). Genetic contributions to the risk assessment of microcystin in the environment. Toxicol. Appl. Pharmacol., 203, 192-200.
Erhard, M., Von Dohren, H. & Jungblut, P. (1997). Rapid typing and elucidation of new secondary metabolites of intact cyanobacteria using MALDI-TOF mass spectrometry. Nature Biotechnol., 15, 906-909.
Esterhuizen, M. & Downing, T. G. (2008). β-N-methylamino-L-alanine (BMAA) in novel South African cyanobacterial isolates. Ecotoxicol. Env. Safety, 71, 309-313.
European Commission, 1991. Council Directive 91/492/EEC laying down the health conditions for the production and placing on the market of live bivalve molluscs. The Official Journal of the European Union L268, 24/09/1991, 1-14.
Falconer, I. R. (2005). Cyanobacterial Toxins of Drinking Water Supplies: Cylindrospermopsins and Microcystins. CRC Press, Boca Raton.
Falconer, I.R., Choice, A. & Hosja, W. (1992). Toxicity of edible mussels (Mytilus edulis) growing naturally in an estuary during a water bloom of the blue-green alga Nodularia spumigena. Environ. Toxicol. Wat. Qual., 7, 119-123.
Falconer, I., Bartram, J., Chorus, I., Kuiper-Goodman, T., Utkilen, H., Burch, M. & Codd, G. A. (1999). Safe levels and safe practices. . In J. Bartram & I. Chorus (Eds), Toxic Cyanobacteria in water (155-178). London, U.K., E & F. N. Spon.
Fastner, J., Codd, G.A., Metcalf, J.S., Woitke, P., Wiedner, C. & Utkilen, H. (2002). An international comparison exercise for the determination of purified microcystin-LR and microcystins in field material. Anal. Bioanal. Chem., 374, 437-444.
J. S. Metcalf and G. A. Codd 278
Fischer, W.J., Garthwaite, I., Miles, C.O., Ross, K.M., Aggen, J.B., Richard Chamberlin, A., Towers, N.R. & Dietrich, D.R. (2001). Congener-independent immunoassay for microcystins and nodularins. Environ. Sci. Technol., 35, 4849-4856.
Fogg, G. E., Stewart, W.D.P., Fay, P. & Walsby, A.E. (1973). The Blue-Green Algae. Academic Press, London and New York.
Francis, G. (1878). Poisonous Australian lake. Nature, 18, 11-12. Froscio, S. M., Humpage, A. R., Burcham, P. C. & Falconer, I. R. (2001). Cell-free protein
synthesis inhibition assay for the cyanobacterial toxin cylindrospermopsin. Environm. Toxicol., 16, 408-412.
Harada, T., Oshima, Y. & Yasumoto, T. (1982). Structures of two paralytic shellfish toxins, gonyautoxins V and VI isolated from a tropical dinoflagellate, Pyrodinium bahamense var. compressa. Agric. Biol. Chem., 46, 1861-1864.
Hastie, C.J., Borthwick, E.B., Morrison. L.F., Codd, G.A. & Cohen, P.T.W. (2005). Inhibition of several protein phosphatases by a non-covalently interacting microcystin and anovel cyanobacterial peptide, nostocyclin. Biochim. Biophys. Acta, 1726, 187-193.
Hawkins, P. R., Runnegar, M. T. C., Jackson, A. R. B. & Falconer, I. R. (1985). Severe hepatotoxicity caused by the tropical cyanobacterium (blue-green alga) Cylindrospermopsis raciborskii (Woloszynska) Seenaya and Subba Raju isolated from a domestic water supply reservoir. Appl. Environ. Microbiol., 50, 1292-1295.
Hayman, J. (1992). Beyond the Barcoo – probable human tropical cyanobacterial poisoning in outback Australia. Med. J. Aust., 157, 794-796.
Ibelings, B. W. & Chorus, I. (2007). Accumulation of cyanobacterial toxins in freshwater “seafood” and its consequences for public health: a review. Environ. Poll., 150, 177-192.
Jochimsen, E. M., Carmichael, W. W., An, J., Cardo, D. M., Cookson, S. T., Holmes, C. E. M., De Antunes, M. B. C., de Melo, D. A., Lyra, T. M., Barreto, V. S. T., Azevedo, S. M. F. O. & Jarvis, W. R. (1998). Liver failure and death after exposure to microcystins at a hemodialysis center in Brazil. New Engl. J. Med., 338, 873-878.
Kfir, R., Johannsen, E. & Botes, D. P. (1986). Monoclonal antibodies specific for cyanoginosin-LA: Preparation and characterisation. Toxicon, 24, 543-552.
Kubo, T., Sano, T., Hosoya, K., Tanaka, N. & Kaya, K. (2005). A new simple and effective fractionation method for cylindrospermopsin analyses. Toxicon, 46, 104-107.
Kubwabo, C., Vais, N. & Benoit, F. M. (2004). Identification of microcystin-RR and [Dha7]microcystin-RR in commercial standards by electrospray ionization mass spectrometry. J. AOAC Int., 87, 1028-1031.
Lankoff, A., Wojcik, A., Fessard, V. & Meriluoto, J. (2006). Nodularin-induced genotoxicity following oxidative DNA damage and aneuploidy in HepG2 cells. Toxicol. Letts., 164, 239-248.
Lawton, L. A., Edwards, C. & Codd, G. A. (1994). Extraction and high-performance liquid chromatographic method for the determination of microcystins in raw and treated waters. Analyst, 119, 1525-1530.
Lewin, R. A. & Robinson, P. T. (1979). The greening of polar bears in zoos. Nature, 278, 445-447.
Li, Y. & Moczydlowski, E. (1991). Purification and partial sequencing of saxiphilin, a saxitoxin-binding protein from the bullfrog, reveals homology to transferring. J. Biol. Chem., 266, 15481-15487.
The Status and Potential of Cyanobacteria and Their Toxins … 279
Lindsay, J., Metcalf, J.S. & Codd, G.A. (2006).: Protection against the toxicity of microcystin-LR and cylindrospermopsin in Artemia salina and Daphnia spp. by pre-treatment with cyanobacterial lipopolysaccharide (LPS). Toxicon, 48, 995-1001.
MacKintosh, C., Beattie, K. A., Klumpp, S., Cohen, P. & Codd, G. A. (1990). Cyanobacterial microcystin-LR is a potent and specific inhibitor of protein phosphatases 1 and 2A from both mammals and higher plants. FEBS Letts., 264, 187-192.
Mahar, J., Lukacs, G. L., Li, Y., Hall, S. & Moczydlowski, E. (1991). Pharmacological and biochemical properties of saxiphilin, a soluble saxitoxin-binding protein from the bullfrog (Rana catesbeiana). Toxicon, 29, 53-71.
Mahmood, N.A. & Carmichael, W.W. (1986). Paralytic shellfish poisons produced by the freshwater cyanobacterium Aphanizomenon flos-aquae NH-5. Toxicon, 24, 175-186.
Mahmood, N.A. & Carmichael, W.W. (1987). Anatoxin-a(s), an anticholinesterase from the cyanobacterium Anabaena flos-aquae NRC-525-17. Toxicon, 25, 1221-1227.
Marsalek, B., Blaha, L. and Babica, P., 2004. Microcystins regulation in the Czech Republic. In Abstracts of the Sixth International Conference on Toxic Cyanobacteria, Bergen, Norway, 21-27 June 2004, p. 15.
Matsunaga, S., Moore, R.E., Niemczura, W.P. & Carmichael, W.W. (1989). Anatoxin-a(s), a potent anticholinesterase from Anabaena flos-aquae. J. Am. Chem. Soc., 111, 8021-8023.
Metcalf, J. S. & Codd, G. A. (2003). Analysis of cyanobacterial toxins by immunological methods. Chem. Res. Toxicol., 16, 103-112.
Metcalf, J. S., Beattie, K. A., Pflugmacher. S. & Codd. G. A. (2000a) Immuno-cross reactivity and toxicity assessment of conjugation products of the cyanobacterial toxin, microcystin-LR. FEMS Microbiol. Letts., 189, 155-158.
Metcalf, J. S., Bell, S. G. & Codd, G. A. (2000b) Production of novel polyclonal antibodies against the cyanobacterial toxin microcystin-LR and their application for the detection and quantification of microcystins and nodularin. Wat. Res., 34, 2761-2769.
Metcalf, J. S., Bell, S. G. & Codd, G. A. (2001) Colorimetric immuno-protein phosphatase inhibition assay for specific detection of microcystins and nodularins of cyanobacteria. Appl. Environm. Microbiol., 67, 904-909.
Metcalf, J. S., Beattie, K. A., Saker, M. L., & Codd, G. A. (2002). Effects of organic solvents on the high performance liquid chromatographic analysis of the cyanobacterial toxin cylindrospermopsin and its recovery from environmental eutrophic waters by solid phase extraction. FEMS Microbiol. Letts., 216, 159-164.
Metcalf, J. S., Barakate, A. & Codd, G. A. (2004). Inhibition of plant protein synthesis by the cyanobacterial hepatotoxin cylindrospermopsin. FEMS Microbiol. Letts., 235, 125-129.
Metcalf, J. S., Meriluoto, J. A. O. & Codd, G. A. (2006). Legal and security requirements for the air transportation of cyanotoxins and toxigenic cyanobacterial cells for legitimate research and analytical purposes. Toxicol. Letts., 163, 85-90.
Metcalf, J. S., Banack, S. A., Lindsay, J., Morrison, L. F., Cox, P. A. & Codd, G. A. (2008). Co-occurrence of β-N-methylamino-L-alanine, a neurotoxic amino acid with other cyanobacterial toxins in British waterbodies. Env. Microbiol., 10, 702-708.
Mikhailov, A., Ha rma la-Braskén, A.-S., Polosukhina, E., Hanski, A., Wahlsten, M., Sivonen, K. & Eriksson, J. E. (2001). Production and specificity of monoclonal antibodies against nodularin conjugated through N-methyldehydrobutyrine. Toxicon, 39, 1453-1459.
Nishiwaki-Matsushima, R., Nishiwaki, S., Ohta, T., Yoshizawa, S., Suganuma, M., Harada, K., Watanabe, M. F. & Fujiki, H. (1991). Structure-function relationships of
J. S. Metcalf and G. A. Codd 280
microcystins, liver tumor promoters, in interaction with protein phosphatase. Jap. J. Cancer Res., 82, 993-996.
Pouria, S. De Andrade, A., Barbosa, J., Cavalcanti, R. L., Barreto, V. T. S., Ward, C. J., Preiser, W., Poon, G. K., Neild, G. H. & Codd, G. A. (1998). Fatal microcystin intoxication in haemodialysis unit in Caruaru, Brazil. Lancet, 352, 21-26.
Prociv, P., Moorhouse, D. E. & Wah, M. J. (1986). Toxocariasis - An unlikely cause of Palm Island mystery disease. Med. J. Austr., 145, 14-15.
Prociv, P. (1992). Blue-green algae: Fact or fantasy? Med. J. Austr., 156, 366-367. Rantala, A., Fewer, D. P., Hisbergues, M., Rouhiainen, L., Vaitomaa, J., Börner, T. &
Sivonen, K. (2004). Phylogenetic evidence for the early evolution of microcystin synthesis. PNAS, 101, 568-573.
Rapala, J., Sivonen, K., Luukkainen, R. & Niemela, S. I. (1993). Anatoxin-a concentration in Anabaena and Aphanizomenon under different environmental conditions and comparison of growth by toxic and non-toxic Anabaena-strains - A laboratory study. J. Appl. Phycol., 5, 581-591.
Raymond, J. & Swingley, W.D. (2008). Phototrophic genomics ten years on. Photosynth. Res., 97, 5-19.
Rivasseau, C. & Hennion, M.-C. (1999). Potential of immunoextraction coupled to analytical and bioanalytical methods (liquid chromatography, ELISA kit and phosphatase inhibition test) for an improved environmental monitoring of cyanobacterial toxins. Anal. Chim. Acta, 399, 75-87.
Rodriguez, E., Onstad, G. D., Kull, T. P. J., Metcalf, J. S., Acero, J. L. & von Gunten, U. (2007). Oxidative elimination of cyanotoxins: Comparisons of ozone, chlorine, chlorine dioxide and permanganate. Wat. Res., 41, 3381-3393.
Saker, M. L. & Neilan, B. A. (2001). Varied diazotrophies, morphologies and toxicities of genetically similar isolates of Cylindrospermopsis raciborskii (Nostocales, Cyanophyceae) from northern Australia. Appl. Environ. Microbiol., 67, 1839-1845.
Schembri, M. A., Neilan, B. A. & Saint, C. P. (2001). Identification of genes implicated in toxin production in the cyanobacterium Cylindrospermosis raciborskii. Environm. Toxicol., 16, 413-421.
Schopf, J. W. (2000). The fossil record: Tracing the roots of the cyanobacterial lineage. In B. A. Whitton & M. Potts (Eds), The Ecology of Cyanobacteria: Their Diversity in Time and Space (13-35). Dordrecht, The Netherlands, Kluwer Academic Publishers.
Sivonen, K. and Jones, G. J., 1999. Cyanobacterial toxins. In J. Bartram & I. Chorus (Eds.), Toxic Cyanobacteria in Water (41-111). London, U.K., E & F. N. Spon.
Skulberg, O. A., Codd, G. A. & Carmichael, W. W. (1984). Toxic blue-green algal blooms in Europe: A growing problem. AMBIO, 13, 244-247.
Spencer, P. S., Nunn, P. B. & Hugon, J. (1987). Guam amyotrophic lateral sclerosis-Parkinsonism-dementia linked to a plant excitant neurotoxin. Science, 237, 517-522.
Turner, P. C., Gammie, A. J., Hollinrake, K. & Codd, G. A. (1990). Pneumonia associated with contact with cyanobacteria. Brit. Med. J., 300, 1440-1441.
Ueno, Y., Nagata, S., Tsutsumi, T., Hasegawa, A., Watanabe, M.F., Park, H.-D., Chen, G.-C., Chen, G. & Yu, S.-Z. (1996). Detection of microcystins, a blue-green algal hepatotoxin, in drinking water sampled in Haimen and Fusui, endemic areas of primary liver cancer in China, by highly sensitive immunoassay. Carcinogenesis, 17, 1317-1321.
The Status and Potential of Cyanobacteria and Their Toxins … 281
USA Patriot Act, 2001. Uniting and Strengthening America by Providing Appropriate Tools Required to Intercept and Obstruct Terrorism (USA PATRIOT ACT) Act of 2001. H. R. 3162 in the senate of the United States, 342 pp.
Usleber, E., Dietrich, R., Burk, C., Schneider, E. & Martlbauer, E. (2001). Immunoassay methods for paralytic shellfish poisoning toxins. J. AOAC Int., 84, 1649-1656.
Vega, A. & Bell, E. A. (1967). α-amino-β-methylaminopropionic acid, a new amino acid from seeds of Cycas circinalis. Phytochem., 6, 759-762.
Ward, C. J., Beattie, K. A., Lee, E. Y. C. and Codd, G. A. (1997). Colorimetric protein phosphatase inhibition assay of laboratory strains and natural blooms of cyanobacteria: comparisons with high performance liquid chromatographic analysis for microcystins. FEMS Microbiol. Lett., 153, 465-473.
Wase, N. V. & Wright, P. C. (2008). Systems biology of cyanobacterial secondary metabolite production and its role in drug discovery. Exp. Opin. Drug Discov., 3, 903-929.
Wynn-Williams, D. D. (2000). Cyanobacteria in deserts- life at the limit? In B. A. Whitton & M. Potts (Eds), The Ecology of Cyanobacteria: Their Diversity in Time and Space (341-366). Dordrecht, The Netherlands, Kluwer Academic Publishers.
Xu, L. H., Lam, P. K. S., Chen, J. P., Xu, J. M., Wong, B. S. F., Zhang, Y. Y., Wu, R. S. S. & Harada, K. I. (2000). Use of protein phosphatase inhibition assay to detect microcystins in Donghu Lake and a fish pond in China. Chemosphere, 41, 53-58.
Yuan, M. & Carmichael, W. W. (2004). Detection and analysis of the cyanobacterial peptide hepatotoxins microcystin and nodularin using SELDI-TOF mass spectrometry. Toxicon, 44, 561-570.
Young, F. M., Metcalf, J. S., Meriluoto, J. A. O., Spoof, L., Morrison, L. F. & Codd, G. A. (2006). Production of antibodies against microcystin-RR for the assessment of purified microcystins and cyanobacterial environmental samples. Toxicon, 48, 295-306.

In: Handbook on Cyanobacteria ISBN: 978-1-60741-092-8 Editors: P. M. Gault and H. J. Marler © 2009 Nova Science Publishers, Inc.
Chapter 9
USE OF LUX-MARKED CYANOBACTERIAL BIOREPORTERS FOR ASSESSMENT OF INDIVIDUAL
AND COMBINED TOXICITIES OF METALS IN AQUEOUS SAMPLES
Ismael Rodea-Palomares, Francisca Fernández-Piñas, Coral González-García and Francisco Leganés Department of Biology. Universidad Autónoma de Madrid.
Cantoblanco. 28049 Madrid. Spain
ABSTRACT
Available freshwater resources are polluted by industrial effluents, domestic and commercial sewage, as well as mine drainage, agricultural run-off and litter. Among water pollutants, heavy metals are priority toxicants that pose potential risks to human health and the environment. Bacterial bioreporters may complement physical and chemical analytical methods by detecting the bioavailable (potentially hazardous to biological systems) fraction of metals in environmental samples. Most bacterial bioreporters are based on heterotrophic organisms; cyanobacteria, although important primary producers in aquatic ecosystems, are clearly underrepresented. In this chapter, the potential use of self-luminescent cyanobacterial strains for ecotoxicity testing in aqueous samples has been evaluated; for this purpose, a self-luminescent strain of the freshwater cyanobacterium Anabaena sp. PCC 7120 which bears in the chromosome a Tn5 derivative with luxCDABE from the luminescent terrestrial bacterium Photorhabdus luminescens (formerly Xenorhabdus luminescens) and shows a high constitutive luminescence has been used. The ecotoxicity assay that has been developed is based on the inhibition of bioluminescence caused by biologically available toxic compounds; as a toxicity value, we have used the effective concentration of each tested compound needed to reduce bioluminescence by 50% from that of the control (EC50). The bioassay allowed for acute as well as chronic toxicity testing. Cyanobacterial bioluminescence responded sensitively to a wide range of metals; furthermore, the sensitivity of the cyanobacterial bioreporter was competitive with that of published bacterial bioreporters. In contaminated environments, organisms are usually exposed to a mixture of pollutants rather than single
Ismael Rodea-Palomares, Francisca Fernández-Piñas, Coral González-García et al. 284
pollutants. The toxicity of composite mixtures of metals using the cyanobacterial bioreporter was tested; to understand the toxicity of metal interactions, the combination index CI-isobologram equation, a widely used method for analysis of drug interactions that allows computerized quantitation of synergism, additive effect and antagonism has been used. Finally, this study indicates that cyanobacterial-based bioreporters may be useful tools for ecotoxicity testing in contaminated environments and that the CI-Isobologram equation can be applied to understand the toxicity of complex mixtures of contaminants in environmental samples.
INTRODUCTION Available freshwater resources are polluted by industrial effluents, domestic and
commercial sewage, as well as mine drainage, agricultural run-off and litter. Among water pollutants, heavy metals are priority toxicants that pose potential risks to human health and the environment. The evaluation of heavy metal contamination traditionally relies on highly sensitive and specific physical and chemical techniques such as atomic absorption spectroscopy or mass spectrometry; however, such methods are not able to distinguish between available (potentially hazardous to biological systems) and non-available (potentially non-hazardous) fraction of metals that exist in the environment in inert or complexed forms. Whole-cell bioreporters may complement physical and chemical methods by detecting the toxicity related with bioavailable metals in environmental samples, effectively integrating the complexity of environmental factors (pH, redox potential, exchangeable cations, biological activity, etc) that contribute to bioavailability (Köhler et al. 2000). Bacterial bioluminescence (lux genes) has been extensively used in the construction of bioreporters (Belkin, 2003; Fernández-Piñas et al. 2000). Bacterial luciferase (luxAB) catalyzes the oxidation of a long-chain aliphatic aldehyde and reduced flavin mononucleotide (FMNH2) producing visible light at 490 nm as a by-product. In naturally luminescent bacteria, the long-chain fatty aldehyde is synthesized by the reductase, transferase and synthetase encoded by luxCD,E (Meighen, 1991). The lux genes may be either be fused to promoters involved in the response to a particular toxin (“lights-on” concept) or used to indicate general metabolic status (“lights-off” concept) (Belkin, 2003); in the latter case, general toxicity or metabolic bioreporters are used to assess the overall toxicity of samples; in these “lights-off” bioreporters, the light reaction is directly proportional to the metabolic status of the cell and any inhibition of cellular activity is reflected in a decrease of bioluminescence. There are several general toxicity assays, already commercially available, which use the naturally bioluminescent marine bacterium Vibrio fischeri such as Microtox® (Azur Environmental), LUMISTOX® (Beckman instruments) or Toxalert® (Merck). The assays based on Vibrio fischeri have been frequently used because they are well introduced and standardized (Steinberg et al. 1995); although these tests offer rapid, easy handling and cost effective responses, the use of marine microorganisms for ecotoxicity testing to soil or freshwater ecosystems presents a number of problems, mainly related to the necessity of maintaining high saline concentrations in the analyte under test. Salinity may enhance insolubility of some organic substances (Steinberg et al. 1995) and/or affect bioavailability of heavy metals (Riba et al. 2003). To solve the issue of ecological relevance for terrestrial environments, the lights-off concept has been expanded to
Use of Lux-Marked Cyanobacterial Bioreporters… 285
the construction of lux-marked bioreporters that are based mainly on soil heterotrophic bacteria (for a review see Belkin, 2007).
Cyanobacteria, as a dominant component of marine and freshwater phytoplankton are well-suited for detecting contaminants in aqueous samples (Bachman, 2003). They could represent an alternative/complement to the use of heterotrophic organisms in the development of bioreporters. So far, some cyanobacterial “lights-on” bioreporters have been reported (Mbeunkui, 2002; Schreiter, 2001; Erbe, 1996), but only one lights-off cyanobacterial bioreporter has been described (Shao et al., 2002). It is a luc-marked construct of the unicellular Synechocystis sp. PCC6803; this strain is not self-luminescent and the luciferase substrate, firefly luciferin, has to be added exogenously.
Contaminated environments are usually polluted by a number of different mixtures of pollutants; the number and concentrations of the different chemicals in these mixtures may be highly variable. Thus, organisms may be exposed to multiple pollutants at the same time; however, most toxicity assays have been done with individual contaminants and the few mixture analyses deal mostly with binary combinations of pollutants (Preston et al., 2000; Fulladosa et al., 2005; Dawson et al., 2006). Due to the difficulty to deal with complex mixtures of contaminants, different empirical (Utgikar et al., 2004; Robers et al., 1990; Newman and McCloskey, 1996) and statistical (Ince et al., 1999; 2004; Gennings et al., 2005; Ishaque et al., 2006; Dawson et al., 2006) approaches have been used to determine the nature of the combination effect of a mixture of pollutants. All these authors agree with the difficulty to establish a valid model for interpretation of results. A mixture of pollutants may have an additive, synergistic or antagonistic effect on a given organism (Gennings et al., 2005; Chou, 2006). One model that has proved useful to interpret drug interactions is the combination index CI-isobologram equation (Chou, 2006) that allows quantitative determination of pollutant interactions where CI < 1, = 1 and > 1 indicate synergism, additive effect, and antagonism, respectively.
Finally, one important issue on bioassay development is the difficulty to control biological systems and to standardize assay conditions in order to obtain reproducible results (Sorensen et al. 2006; Belkin, 2007). In classical toxicological bioassays, (Dhapnia magna, selenastrum capricornutum, Oncorhynchus mykiss etc.), there are some acceptability criteria for validity of test results that are mainly related to the definition and maintenance of normalized assay conditions, the control of the internal variability of the controls, and the determination of the intra-laboratory precision with a reference toxicant in order to demonstrate the capability of the laboratory to obtain reproducible results (EPA, 1994, 2002).
In this chapter, an application of a cyanobacterial lights-off bioreporter for assessment of acute and chronic toxicity of a range of heavy metals (cations and anions) in aqueous samples is described. CuSO4 was shown to be appropriate as a reference toxicant to be used in any toxicity assay with this cyanobacterial bioreporter and finally, the response of the bioreporter to a combination of three metals that displayed different toxicity: Cu2+, Zn2+ and Cd2+ is shown; the effects of heavy metal interaction were analysed by the combination index CI-isobologram equation.
Ismael Rodea-Palomares, Francisca Fernández-Piñas, Coral González-García et al. 286
DEVELOPMENT OF A TOXICITY ASSAY BASED ON THE BIOLUMINESCENT CYANOBACTERIAL BIOREPORTER:
AN APPLICATION TO SINGLE AND COMBINED HEAVY METAL TOXICITY
Assay Procedures
Strain and Culture Conditions
Anabaena sp. PCC 7120 strain CPB4337, which bears in the chromosome a Tn5 derivative with luxCDABE from the luminescent terrestrial bacterium Photorhabdus luminescens (formerly Xenorhabdus luminescens), was used in this study to assess the toxicity of a range of cationic and anionic heavy metals. This strain shows a high constitutive self-luminescence with no need to add exogenous aldehyde; also cell viability is not significantly affected by the Tn5 insertion and the endogenous generation of aldehyde (Fernandez-Piñas and Wolk, 1994). Luminescence was shown to be high in this strain in a range of temperatures between 20 and 30º C, in accord with Photorhabdus luminescens luciferase having the greatest thermal stability (Fernandez-Piñas et al. 2000; Szittner and Meighen, 1990). Anabaena sp. PCC 7120 strain CPB4337 was routinely grown at 28ºC in the light, Ca. 65 µmol photons m2 s-1 on a rotary shaker in 50 ml AA/8 (Allen and Arnon, 1955) supplemented with nitrate (5mM) in 125 ml Erlenmeyer flasks. The strain was grown in liquid cultures with 10 µg of neomycin sulphate (Nm) per ml.
Effect of External pH on Constitutive Luminescence
Cells grown as indicated above, were washed twice and resuspended in ddH2O buffered with 2 mM of either MES (2-[N-morpholino] ethanesulfonic acid) for external pHs 4 and 5 or MOPS (3-[N-morpholino] propanesulfonic acid) for external pHs 5.8, 7 and 8. For luminescence measurements, 200 µl of the cell suspension were transferred to wells of an opaque white 96-well microtiter plate (PS white, Porvair Sciences Ltd. Shepperton, UK). Luminescence was continuously recorded for at least three hours in a Centro LB 960 luminometer (Berthold Technologies GmbH and Co.KG, Bald Wilbad, Germany) and was expressed in the instrument′ s arbitrary relative light units (RLU). All measurements were conducted in quadruplicate and were repeated at least twice.
Metal Bioassays for Acute and Chronic Toxicity Testing
Standard metal test solutions in ddH2O were prepared for Cu (CuSO4), Hg [HgCl2], Pb [Pb(NO3)2], Ag (AgSO4), Cd (CdCl2), Zn (ZnCl2), Co (CoCl2), Ni (NiSO4), Mn (MnCl2), As (Na2HAsO4), Cr (K2CrO4), Mo (Na2MoO4) and V (VO3NH4) at a concentration of 125 mg/l and were serially diluted for the toxicity experiments. Serial dilutions of metal solutions were buffered with 2 mM MOPS and adjusted to pH 5.8. The use of most buffers (like Tris or Tricine) might not be appropriate as precipitation and complexation of metals might occur (Fernandez-Piñas et al. 1991). The alkylsulfonate derivatives of morpholine, like MOPS, are reported to be non-complexing for metals (Kandegedara and Rorabacher, 1999). The USEPA (1991) recommended MOPS for environmental studies as it does not change the toxicity of effluents and sediment pore waters. Preliminary experiments in the current study showed that
Use of Lux-Marked Cyanobacterial Bioreporters… 287
2 mM MOPS did not affect growth or alter metal sensitivity of the cyanobacterium and was suitable to maintain constant pH during the time of the assay.
Determination of Acute and Chronic Toxicity of Heavy Metals
Five to seven serial dilutions of metals and a control (cells not treated with metal) were tested. 160 µl of the appropriate metal were disposed in an opaque white 96-well microtiter plates. Cells, grown as described, were removed, centrifuged, washed twice, resuspended in ddH2O buffered with MOPS at pH 5.8 and added to the microtiter plate wells to reach a final cell density of 0.5. Three independent experiments with quadruplicate samples were carried out. Luminescence of each sample was recorded every 5 min for up to 1 h in the Centro LB 960 luminometer. For chronic toxicity testing (24 h), the 96-well microtiter plates were kept at room temperature (28 ºC) at low light (Ca. 30 µmol photons m2 s-1) during 24 h and luminescence was recorded for five minutes. All manipulations were conducted under controlled conditions, avoiding metal and microbial contamination and using disposable polystyrene supplies.
Toxicity response of the cyanobacterium was estimated as EC50 values: the median effective concentration (mg/l) of a toxicant that causes a 50% of bioluminescence inhibition with respect to a non-treated control. EC50 and its related statistical parameters, standard deviation (SD), coefficient of variation (CV) and confidence intervals (CI) were estimated using the linear interpolation method. (Norberg-King, T.J., 1993; USEPA, 1994; USEPA; 2002).
Reference Toxicant and Inter-Assay Variability Calibration
Copper sulfate (CuSO4) was selected as reference toxicant for calibration in all assays (USEPA, 1994, 2002). The final objective of the calibration was to calculate the mean EC50-1h
and EC50-24h and the range of sensibility, represented by the upper and lower control limits at 95% of confidence of the bioluminescence inhibition assay when Anabaena CPB4337 is exposed to the reference toxicant; to achieve this, five copper dilutions were tested by quadruplicate in control wells of each assay to demonstrate good precision and low inter-assay variation.
Toxicity of Heavy Metal Combinations
For metal combination experiments, metal solution of Cu (CuSO4), Cd (CdCl2) and Zn (ZnCl2) and their two (Cu+Cd, Cu+Zn, Cd+Zn) and three (Cu+Zn+Cd) combinations were prepared. A constant ratio design (1:1) based on EC50 values was selected as recommended by Chou (2006). Five dilutions (serial dilution factor = 2) of each metal and combination plus a control were tested in replicate in three independent experiments; the experimental design is shown in table 1. All individual metals and two and three combinations assays were carried out at the same time as recommended by Chou (2006) to maximize computational analysis of data.
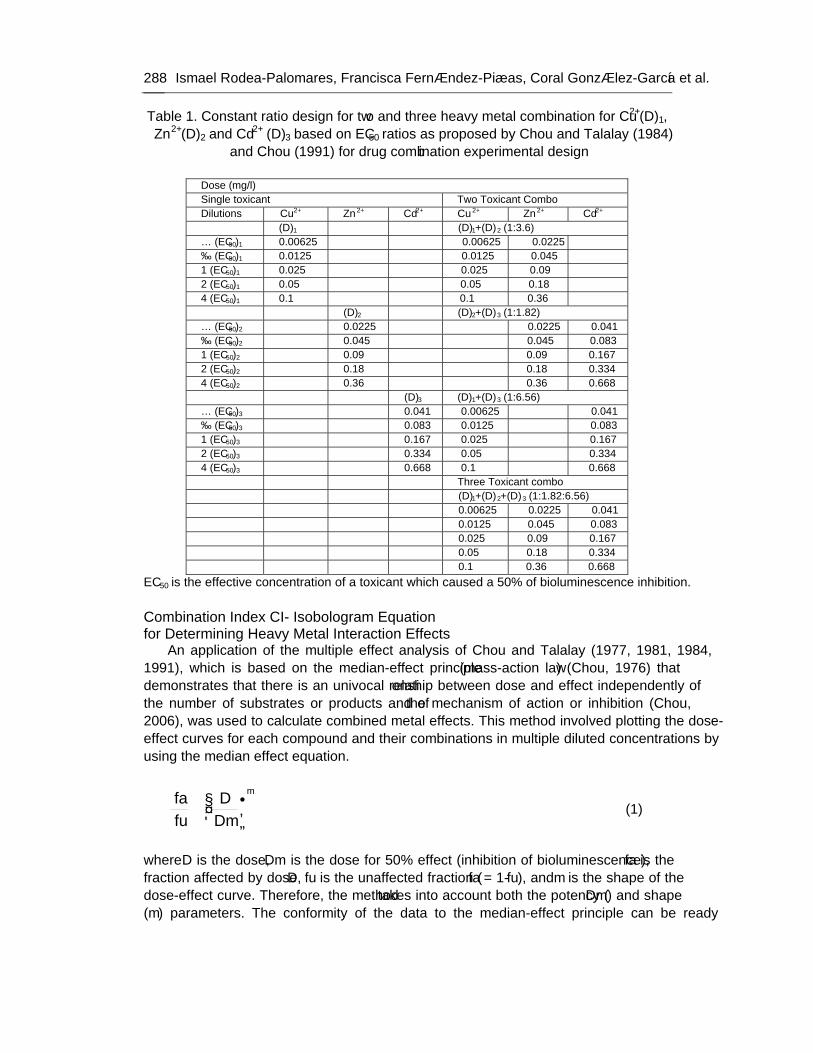
Ismael Rodea-Palomares, Francisca Fernández-Piñas, Coral González-García et al. 288
Table 1. Constant ratio design for two and three heavy metal combination for Cu2+(D)1, Zn2+(D)2 and Cd2+ (D)3 based on EC50 ratios as proposed by Chou and Talalay (1984)
and Chou (1991) for drug combination experimental design
Dose (mg/l) Single toxicant Two Toxicant Combo Dilutions Cu 2+ Zn 2+ Cd2+ Cu 2+ Zn 2+ Cd2+ (D)1 (D)1+(D)2 (1:3.6) ¼ (EC50)1 0.00625 0.00625 0.0225 ½ (EC50)1 0.0125 0.0125 0.045 1 (EC50)1 0.025 0.025 0.09 2 (EC50)1 0.05 0.05 0.18 4 (EC50)1 0.1 0.1 0.36 (D)2 (D)2+(D)3 (1:1.82) ¼ (EC50)2 0.0225 0.0225 0.041 ½ (EC50)2 0.045 0.045 0.083 1 (EC50)2 0.09 0.09 0.167 2 (EC50)2 0.18 0.18 0.334 4 (EC50)2 0.36 0.36 0.668 (D)3 (D)1+(D)3 (1:6.56) ¼ (EC50)3 0.041 0.00625 0.041 ½ (EC50)3 0.083 0.0125 0.083 1 (EC50)3 0.167 0.025 0.167 2 (EC50)3 0.334 0.05 0.334 4 (EC50)3 0.668 0.1 0.668 Three Toxicant combo (D)1+(D)2+(D)3 (1:1.82:6.56) 0.00625 0.0225 0.041 0.0125 0.045 0.083 0.025 0.09 0.167 0.05 0.18 0.334 0.1 0.36 0.668
EC50 is the effective concentration of a toxicant which caused a 50% of bioluminescence inhibition.
Combination Index CI- Isobologram Equation for Determining Heavy Metal Interaction Effects
An application of the multiple effect analysis of Chou and Talalay (1977, 1981, 1984, 1991), which is based on the median-effect principle (mass-action law) (Chou, 1976) that demonstrates that there is an univocal relationship between dose and effect independently of the number of substrates or products and of the mechanism of action or inhibition (Chou, 2006), was used to calculate combined metal effects. This method involved plotting the dose-effect curves for each compound and their combinations in multiple diluted concentrations by using the median effect equation.
m
DmD
fufa
⎟⎠⎞
⎜⎝⎛= (1)
where D is the dose, Dm is the dose for 50% effect (inhibition of bioluminescence), fa is the fraction affected by dose D, fu is the unaffected fraction (fa = 1-fu), and m is the shape of the dose-effect curve. Therefore, the method takes into account both the potency (Dm) and shape (m) parameters. The conformity of the data to the median-effect principle can be ready
Use of Lux-Marked Cyanobacterial Bioreporters… 289
manifested by the linear correlation coefficient (r) of the data to the logarithmic form of equation 1 (Chou, 2006).
The combination index CI-isobologram equation (Chou, 1991; Chou and Talalay, 1984):
CI = 2
2
1
1
)()(
)()(
DxD
DxD
+ (2)
has been used for data analysis of two-metal combinations. For three metal combinations a third term, (D)3/(Dx)3, is added (Chou, 1991). From equation 2, CI < 1, CI = 1 and CI > 1 indicates synergism, additive effect and antagonism, respectively (Chou, 2006). Equation 2 dictates that metal 1, i.e, (D)1, and metal 2, i.e, (D)2 in the numerators in combination inhibits luminescence by x%, (Dx)1 and (Dx)2 in the denominators of equation 2 are the doses of metal 1 and 2 alone, respectively, that also inhibit bioluminescence by x%. Dx can be readily calculated from equation 1, where D is designated for x% luminescence inhibition. When equation 2 equals 1 (i.e, CI = 1), it represents the classical isobologram equation. (Chou, 2006).
Data where also evaluated by the isobologram technique (Chou, 1991, Chou and Talalay, 1984), a dose-oriented geometric method of assessing chemical interactions. This method yields conclusions quantitatively identical to those of the effect-oriented CI method described above. Computer program CompuSyn (Chou and Martin, 2005, Combosyn.inc) was used for calculation of dose-effect curve parameters, CI values, conventional isobolograms, fa-CI plot (plot representing CI versus fa, the fraction affected by a particular dose; see equation 1) and Polygonograms (a polygonal graphic representation depicting synergism, additive effect and antagonism for three or more drug combinations) .
Effect of pH on Constitutive Self-Luminescence The bioluminescence response of strain CPB4337 was investigated across a wide range
of pH values. Cells were washed and resuspended in ddH2O buffered with either MES or MOPS to a range of pH values between 4 and 8 and their luminescence recorded as a function of time (figure 1). Self-luminescence remained high and stable during at least 3 h at pH values of 5.8, 7 and 8 with an optimum at pH 5.8 reaching luminescence levels above 30000 RLUs at 1 h. Luminescence significantly decreased to levels around 5000-4000 RLUs at pHs 5 and 4; at pH 5 luminescence remained quite stable during the time of measurement; at pH 4, however, luminescence was stable during 40-60 min but showed a steady decrease thereafter. The data indicated that this strain was able to emit high and steady levels of luminescence in a wide pH range.
The optimum pH of luminescence, 5.8, was therefore chosen for the standard metal toxicity assays; besides, at this pH value, most heavy metals are biologically available as the free ion species and should be fully toxic to the cyanobacterial strain.
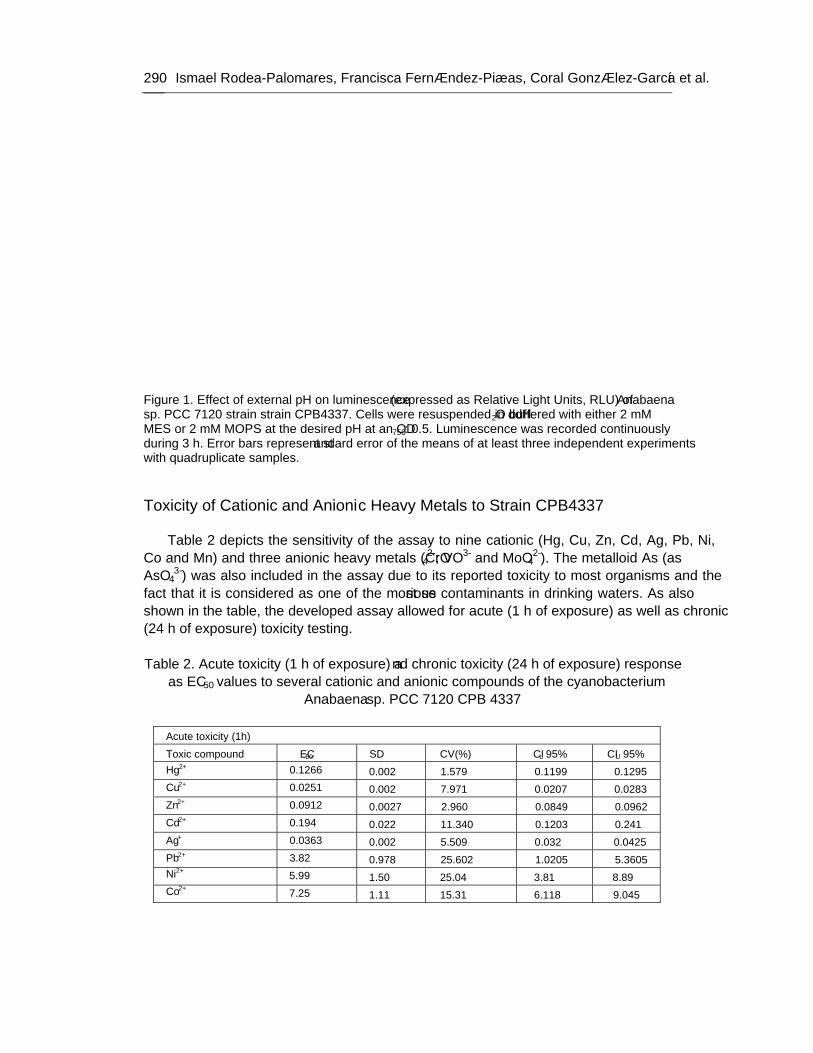
Ismael Rodea-Palomares, Francisca Fernández-Piñas, Coral González-García et al. 290
Figure 1. Effect of external pH on luminescence (expressed as Relative Light Units, RLU) of Anabaena sp. PCC 7120 strain strain CPB4337. Cells were resuspended in ddH2O buffered with either 2 mM MES or 2 mM MOPS at the desired pH at an OD750: 0.5. Luminescence was recorded continuously during 3 h. Error bars represent standard error of the means of at least three independent experiments with quadruplicate samples.
Toxicity of Cationic and Anionic Heavy Metals to Strain CPB4337
Table 2 depicts the sensitivity of the assay to nine cationic (Hg, Cu, Zn, Cd, Ag, Pb, Ni,
Co and Mn) and three anionic heavy metals (CrO42-; VO3- and MoO4
2-). The metalloid As (as AsO4
3-) was also included in the assay due to its reported toxicity to most organisms and the fact that it is considered as one of the most serious contaminants in drinking waters. As also shown in the table, the developed assay allowed for acute (1 h of exposure) as well as chronic (24 h of exposure) toxicity testing.
Table 2. Acute toxicity (1 h of exposure) and chronic toxicity (24 h of exposure) response
as EC50 values to several cationic and anionic compounds of the cyanobacterium Anabaena sp. PCC 7120 CPB 4337
Acute toxicity (1h)
Toxic compound EC50 SD CV(%) CIL 95% CIU 95% Hg2+ 0.1266 0.002 1.579 0.1199 0.1295 Cu2+ 0.0251 0.002 7.971 0.0207 0.0283 Zn2+ 0.0912 0.0027 2.960 0.0849 0.0962 Cd2+ 0.194 0.022 11.340 0.1203 0.241 Ag+ 0.0363 0.002 5.509 0.032 0.0425 Pb2+ 3.82 0.978 25.602 1.0205 5.3605 Ni2+ 5.99 1.50 25.04 3.81 8.89 Co2+ 7.25 1.11 15.31 6.118 9.045
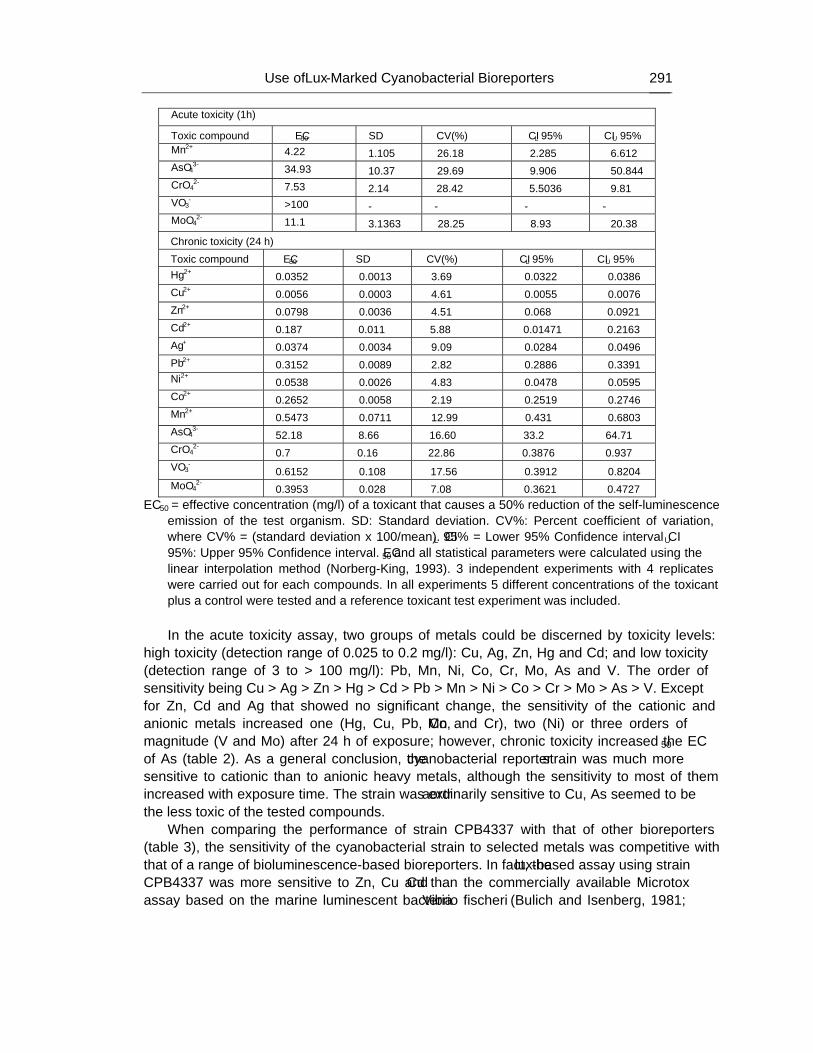
Use of Lux-Marked Cyanobacterial Bioreporters… 291
Acute toxicity (1h)
Toxic compound EC50 SD CV(%) CIL 95% CIU 95% Mn2+ 4.22 1.105 26.18 2.285 6.612 AsO4
3- 34.93 10.37 29.69 9.906 50.844 CrO4
2- 7.53 2.14 28.42 5.5036 9.81 VO3
- >100 - - - - MoO4
2- 11.1 3.1363 28.25 8.93 20.38
Chronic toxicity (24 h)
Toxic compound EC50 SD CV(%) CIL 95% CIU 95% Hg2+ 0.0352 0.0013 3.69 0.0322 0.0386 Cu2+ 0.0056 0.0003 4.61 0.0055 0.0076 Zn2+ 0.0798 0.0036 4.51 0.068 0.0921 Cd2+ 0.187 0.011 5.88 0.01471 0.2163 Ag+ 0.0374 0.0034 9.09 0.0284 0.0496 Pb2+ 0.3152 0.0089 2.82 0.2886 0.3391 Ni2+ 0.0538 0.0026 4.83 0.0478 0.0595 Co2+ 0.2652 0.0058 2.19 0.2519 0.2746 Mn2+ 0.5473 0.0711 12.99 0.431 0.6803 AsO4
3- 52.18 8.66 16.60 33.2 64.71 CrO4
2- 0.7 0.16 22.86 0.3876 0.937 VO3
- 0.6152 0.108 17.56 0.3912 0.8204 MoO4
2- 0.3953 0.028 7.08 0.3621 0.4727 EC50 = effective concentration (mg/l) of a toxicant that causes a 50% reduction of the self-luminescence
emission of the test organism. SD: Standard deviation. CV%: Percent coefficient of variation, where CV% = (standard deviation x 100/mean). CIL 95% = Lower 95% Confidence interval CIU 95%: Upper 95% Confidence interval. EC50 and all statistical parameters were calculated using the linear interpolation method (Norberg-King, 1993). 3 independent experiments with 4 replicates were carried out for each compounds. In all experiments 5 different concentrations of the toxicant plus a control were tested and a reference toxicant test experiment was included. In the acute toxicity assay, two groups of metals could be discerned by toxicity levels:
high toxicity (detection range of 0.025 to 0.2 mg/l): Cu, Ag, Zn, Hg and Cd; and low toxicity (detection range of 3 to > 100 mg/l): Pb, Mn, Ni, Co, Cr, Mo, As and V. The order of sensitivity being Cu > Ag > Zn > Hg > Cd > Pb > Mn > Ni > Co > Cr > Mo > As > V. Except for Zn, Cd and Ag that showed no significant change, the sensitivity of the cationic and anionic metals increased one (Hg, Cu, Pb, Co, Mn and Cr), two (Ni) or three orders of magnitude (V and Mo) after 24 h of exposure; however, chronic toxicity increased the EC50 of As (table 2). As a general conclusion, the cyanobacterial reporter strain was much more sensitive to cationic than to anionic heavy metals, although the sensitivity to most of them increased with exposure time. The strain was extraordinarily sensitive to Cu, As seemed to be the less toxic of the tested compounds.
When comparing the performance of strain CPB4337 with that of other bioreporters (table 3), the sensitivity of the cyanobacterial strain to selected metals was competitive with that of a range of bioluminescence-based bioreporters. In fact, the lux-based assay using strain CPB4337 was more sensitive to Zn, Cu and Cd than the commercially available Microtox assay based on the marine luminescent bacteria Vibrio fischeri (Bulich and Isenberg, 1981;
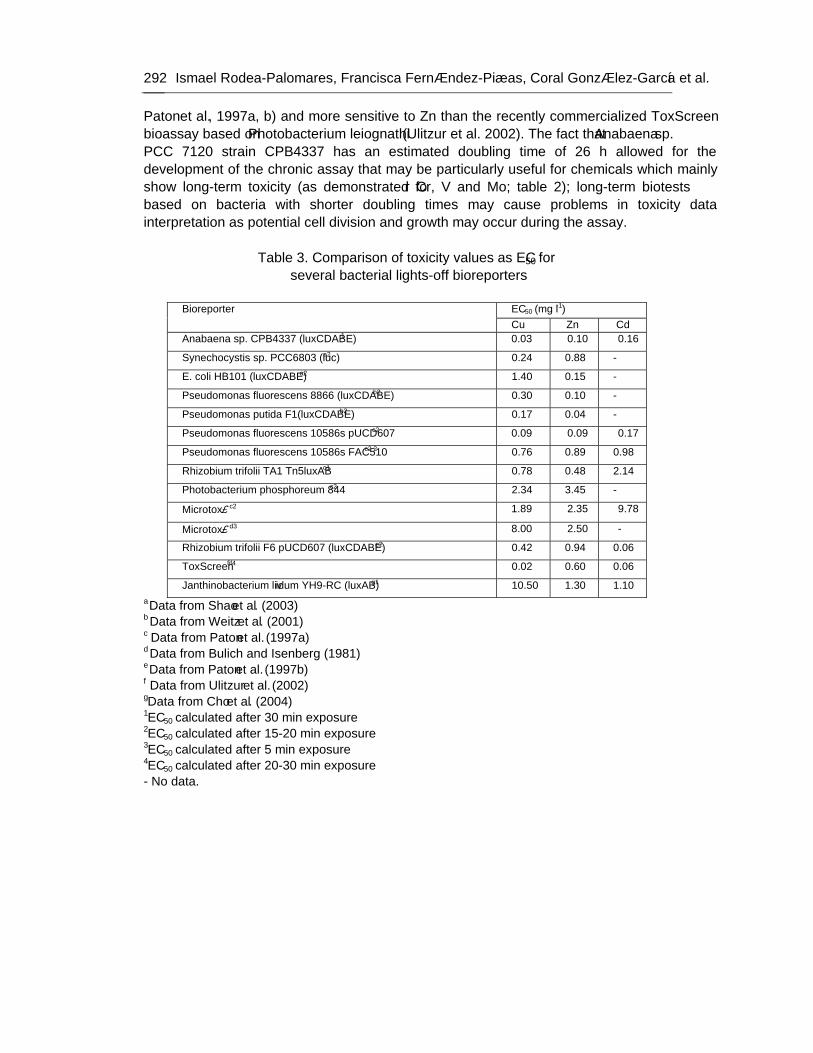
Ismael Rodea-Palomares, Francisca Fernández-Piñas, Coral González-García et al. 292
Paton et al., 1997a, b) and more sensitive to Zn than the recently commercialized ToxScreen bioassay based on Photobacterium leiognathi (Ulitzur et al. 2002). The fact that Anabaena sp. PCC 7120 strain CPB4337 has an estimated doubling time of 26 h allowed for the development of the chronic assay that may be particularly useful for chemicals which mainly show long-term toxicity (as demonstrated for Cr, V and Mo; table 2); long-term biotests based on bacteria with shorter doubling times may cause problems in toxicity data interpretation as potential cell division and growth may occur during the assay.
Table 3. Comparison of toxicity values as EC50 for
several bacterial lights-off bioreporters
EC50 (mg l-1) Bioreporter Cu Zn Cd
Anabaena sp. CPB4337 (luxCDABE)1 0.03 0.10 0.16
Synechocystis sp. PCC6803 (luc)a2 0.24 0.88 -
E. coli HB101 (luxCDABE)a2 1.40 0.15 -
Pseudomonas fluorescens 8866 (luxCDABE)b2 0.30 0.10 -
Pseudomonas putida F1(luxCDABE)b2 0.17 0.04 -
Pseudomonas fluorescens 10586s pUCD607c2 0.09 0.09 0.17
Pseudomonas fluorescens 10586s FAC510c2 2 0.76 0.89 0.98
Rhizobium trifolii TA1 Tn5luxABc1 0.78 0.48 2.14
Photobacterium phosphoreum 844c2 2.34 3.45 -
Microtox®c2 1.89 2.35 9.78
Microtox®d3 8.00 2.50 -
Rhizobium trifolii F6 pUCD607 (luxCDABE)e2 0.42 0.94 0.06
ToxScreen®f4 0.02 0.60 0.06
Janthinobacterium lividum YH9-RC (luxAB)g1 10.50 1.30 1.10 a Data from Shao et al. (2003) b Data from Weitz et al. (2001) c Data from Paton et al. (1997a) d Data from Bulich and Isenberg (1981) e Data from Paton et al. (1997b) f Data from Ulitzur et al. (2002) gData from Cho et al. (2004) 1EC50 calculated after 30 min exposure 2EC50 calculated after 15-20 min exposure 3EC50 calculated after 5 min exposure 4EC50 calculated after 20-30 min exposure - No data.
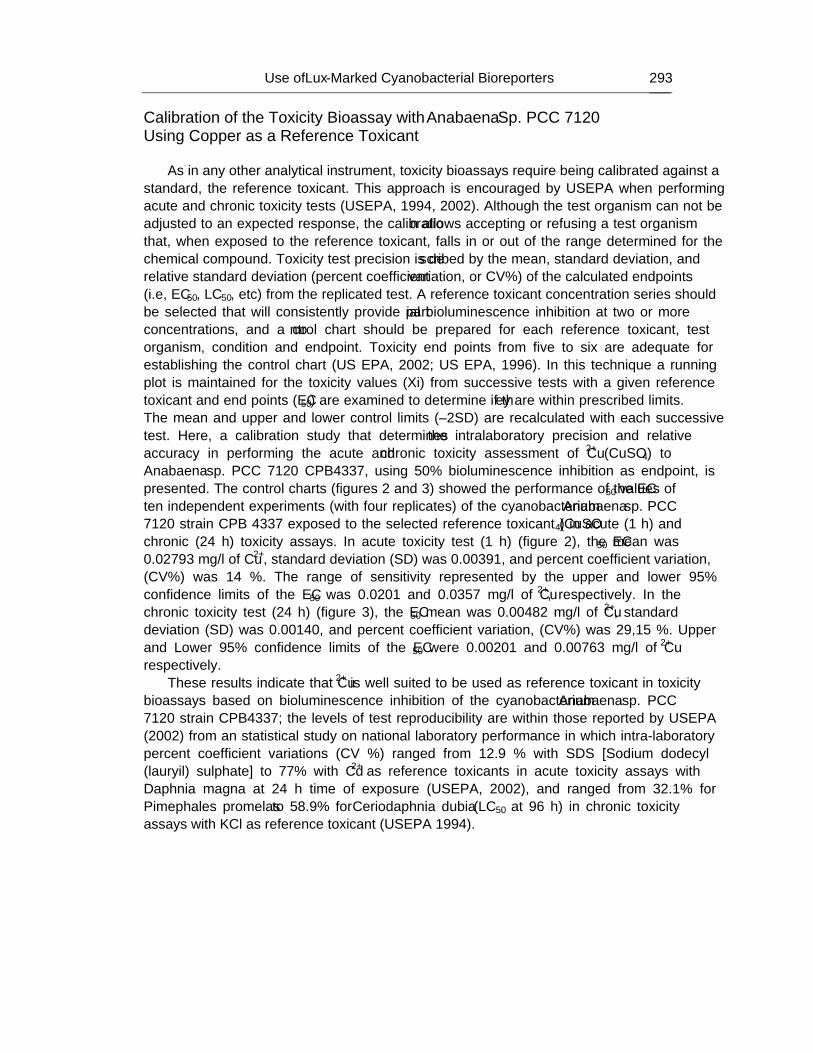
Use of Lux-Marked Cyanobacterial Bioreporters… 293
Calibration of the Toxicity Bioassay with Anabaena Sp. PCC 7120 Using Copper as a Reference Toxicant
As in any other analytical instrument, toxicity bioassays require being calibrated against a
standard, the reference toxicant. This approach is encouraged by USEPA when performing acute and chronic toxicity tests (USEPA, 1994, 2002). Although the test organism can not be adjusted to an expected response, the calibration allows accepting or refusing a test organism that, when exposed to the reference toxicant, falls in or out of the range determined for the chemical compound. Toxicity test precision is described by the mean, standard deviation, and relative standard deviation (percent coefficient variation, or CV%) of the calculated endpoints (i.e, EC50, LC50, etc) from the replicated test. A reference toxicant concentration series should be selected that will consistently provide partial bioluminescence inhibition at two or more concentrations, and a control chart should be prepared for each reference toxicant, test organism, condition and endpoint. Toxicity end points from five to six are adequate for establishing the control chart (US EPA, 2002; US EPA, 1996). In this technique a running plot is maintained for the toxicity values (Xi) from successive tests with a given reference toxicant and end points (EC50) are examined to determine if they are within prescribed limits. The mean and upper and lower control limits (±2SD) are recalculated with each successive test. Here, a calibration study that determines the intralaboratory precision and relative accuracy in performing the acute and chronic toxicity assessment of Cu2+ (CuSO4) to Anabaena sp. PCC 7120 CPB4337, using 50% bioluminescence inhibition as endpoint, is presented. The control charts (figures 2 and 3) showed the performance of the EC50 values of ten independent experiments (with four replicates) of the cyanobacterium Anabaena sp. PCC 7120 strain CPB 4337 exposed to the selected reference toxicant (CuSO4) in acute (1 h) and chronic (24 h) toxicity assays. In acute toxicity test (1 h) (figure 2), the EC50 mean was 0.02793 mg/l of Cu2+, standard deviation (SD) was 0.00391, and percent coefficient variation, (CV%) was 14 %. The range of sensitivity represented by the upper and lower 95% confidence limits of the EC50 was 0.0201 and 0.0357 mg/l of Cu2+, respectively. In the chronic toxicity test (24 h) (figure 3), the EC50 mean was 0.00482 mg/l of Cu2+, standard deviation (SD) was 0.00140, and percent coefficient variation, (CV%) was 29,15 %. Upper and Lower 95% confidence limits of the EC50 were 0.00201 and 0.00763 mg/l of Cu2+ respectively.
These results indicate that Cu2+ is well suited to be used as reference toxicant in toxicity bioassays based on bioluminescence inhibition of the cyanobacterium Anabaena sp. PCC 7120 strain CPB4337; the levels of test reproducibility are within those reported by USEPA (2002) from an statistical study on national laboratory performance in which intra-laboratory percent coefficient variations (CV %) ranged from 12.9 % with SDS [Sodium dodecyl (lauryil) sulphate] to 77% with Cd2+ as reference toxicants in acute toxicity assays with Daphnia magna at 24 h time of exposure (USEPA, 2002), and ranged from 32.1% for Pimephales promelas to 58.9% for Ceriodaphnia dubia (LC50 at 96 h) in chronic toxicity assays with KCl as reference toxicant (USEPA 1994).
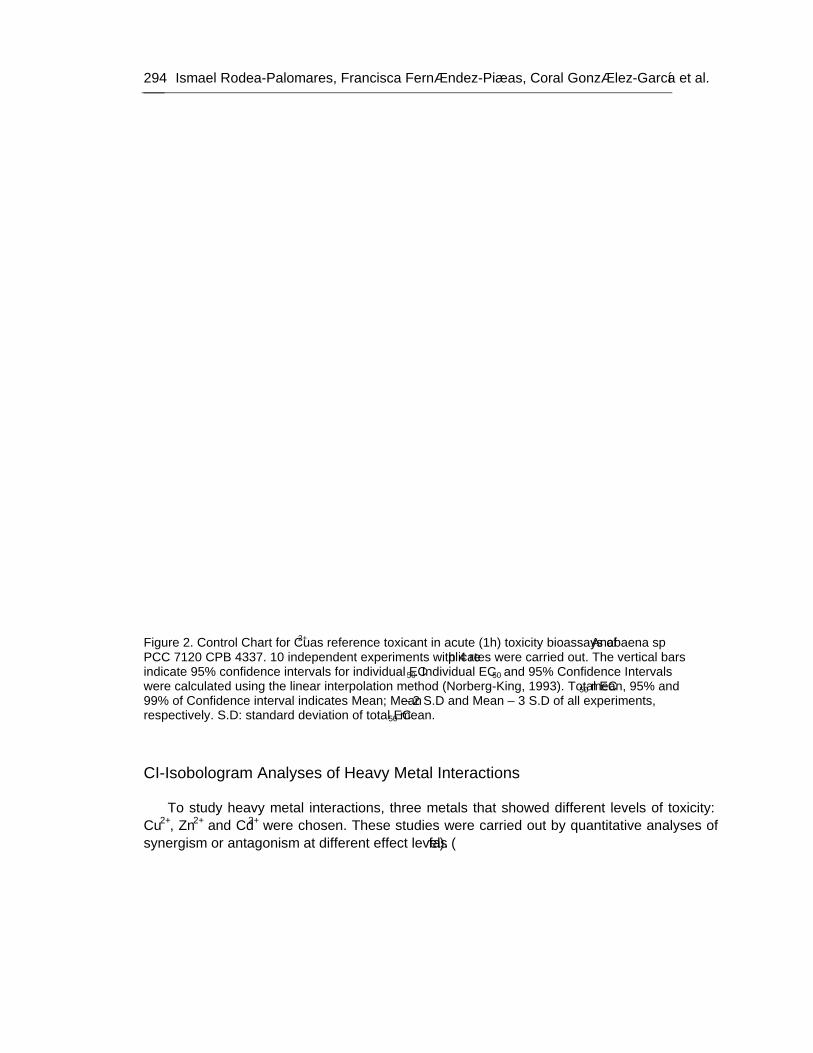
Ismael Rodea-Palomares, Francisca Fernández-Piñas, Coral González-García et al. 294
Figure 2. Control Chart for Cu2+ as reference toxicant in acute (1h) toxicity bioassays of Anabaena sp PCC 7120 CPB 4337. 10 independent experiments with 4 replicates were carried out. The vertical bars indicate 95% confidence intervals for individual EC50. Individual EC50 and 95% Confidence Intervals were calculated using the linear interpolation method (Norberg-King, 1993). Total EC50 mean, 95% and 99% of Confidence interval indicates Mean; Mean ± 2 S.D and Mean ± 3 S.D of all experiments, respectively. S.D: standard deviation of total EC50 mean.
CI-Isobologram Analyses of Heavy Metal Interactions To study heavy metal interactions, three metals that showed different levels of toxicity:
Cu2+, Zn2+ and Cd2+ were chosen. These studies were carried out by quantitative analyses of synergism or antagonism at different effect levels (fa).
Use of Lux-Marked Cyanobacterial Bioreporters… 295
Figure 3. Control Chart for Cu2+ as reference toxicant in Chronic (24 h) toxicity bioassay of Anabaena sp PCC 7120 CPB 4337. 10 independent experiments with 4 replicates were carried out. The vertical bars indicate 95% confidence intervals for individual EC50. Individual EC50 and 95% Confidence Intervals were calculated using the linear interpolation method (Norberg-King, 1993). Total EC50 mean, 95% and 99% of Confidence interval indicates Mean; Mean ± 2 S.D and Mean ± 3 S.D of all experiments, respectively. S.D: standard deviation of total EC50 mean.
Table 4 showed the dose-effect curve parameters [Dm (EC50), m (Shape of the curve), and r (the conformity of data to the mass-action law)] of Cu2+, Zn2+ and Cd2+ and their two and three combinations. Dm values are in good agreement with these obtained with the linear interpolation method (Norberg-King, T.J., 1993) (see table 2). And r values ranged from 0.895 to 0.971, indicating good agreement to the mass-action law (Chou, 1994, 2006).
The Dm and m values for single metals and for their combination mixtures were used for calculating synergism or antagonism based on the CI equation (2) (Chou, 2006).
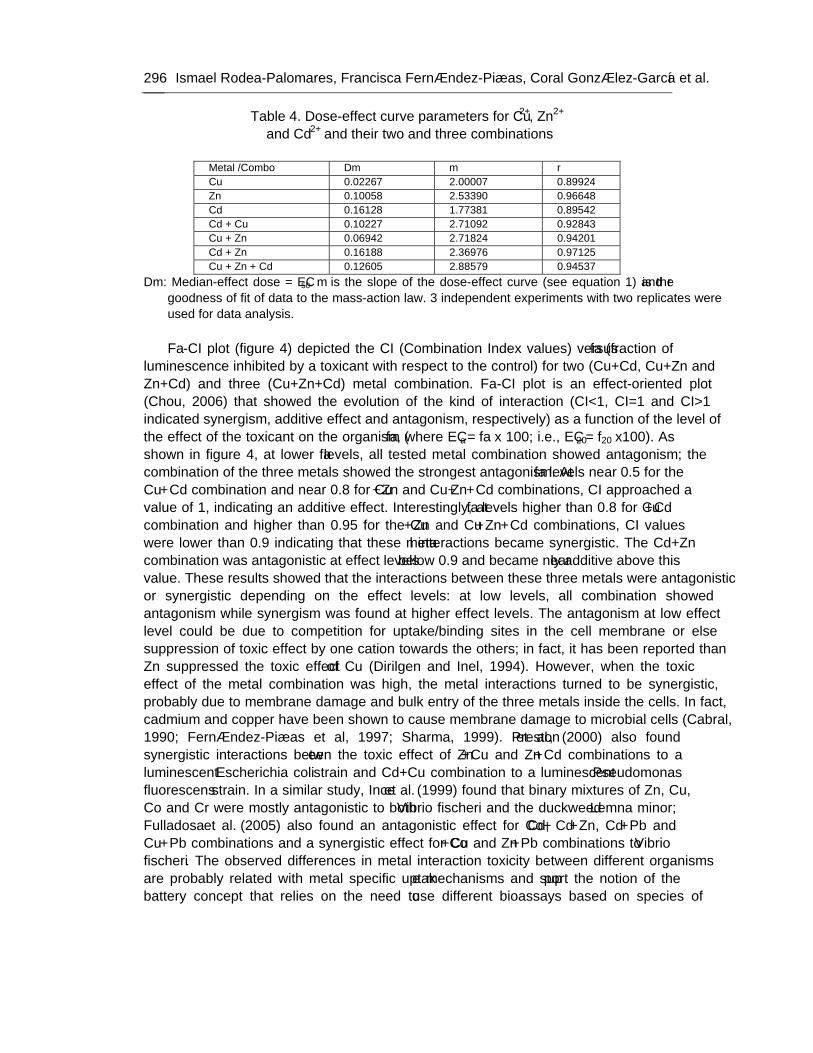
Ismael Rodea-Palomares, Francisca Fernández-Piñas, Coral González-García et al. 296
Table 4. Dose-effect curve parameters for Cu2+, Zn2+
and Cd2+ and their two and three combinations
Metal /Combo Dm m r Cu 0.02267 2.00007 0.89924 Zn 0.10058 2.53390 0.96648 Cd 0.16128 1.77381 0.89542 Cd + Cu 0.10227 2.71092 0.92843 Cu + Zn 0.06942 2.71824 0.94201 Cd + Zn 0.16188 2.36976 0.97125 Cu + Zn + Cd 0.12605 2.88579 0.94537
Dm: Median-effect dose = EC50. m is the slope of the dose-effect curve (see equation 1) and r is the goodness of fit of data to the mass-action law. 3 independent experiments with two replicates were used for data analysis. Fa-CI plot (figure 4) depicted the CI (Combination Index values) versus fa (fraction of
luminescence inhibited by a toxicant with respect to the control) for two (Cu+Cd, Cu+Zn and Zn+Cd) and three (Cu+Zn+Cd) metal combination. Fa-CI plot is an effect-oriented plot (Chou, 2006) that showed the evolution of the kind of interaction (CI<1, CI=1 and CI>1 indicated synergism, additive effect and antagonism, respectively) as a function of the level of the effect of the toxicant on the organism (fa, where ECa = fa x 100; i.e., EC20= f20 x100). As shown in figure 4, at lower fa levels, all tested metal combination showed antagonism; the combination of the three metals showed the strongest antagonism. At fa levels near 0.5 for the Cu+Cd combination and near 0.8 for Cu+Zn and Cu+Zn+Cd combinations, CI approached a value of 1, indicating an additive effect. Interestingly, at fa levels higher than 0.8 for Cu+Cd combination and higher than 0.95 for the Cu+Zn and Cu+Zn+Cd combinations, CI values were lower than 0.9 indicating that these metal interactions became synergistic. The Cd+Zn combination was antagonistic at effect levels below 0.9 and became nearly additive above this value. These results showed that the interactions between these three metals were antagonistic or synergistic depending on the effect levels: at low levels, all combination showed antagonism while synergism was found at higher effect levels. The antagonism at low effect level could be due to competition for uptake/binding sites in the cell membrane or else suppression of toxic effect by one cation towards the others; in fact, it has been reported than Zn suppressed the toxic effect of Cu (Dirilgen and Inel, 1994). However, when the toxic effect of the metal combination was high, the metal interactions turned to be synergistic, probably due to membrane damage and bulk entry of the three metals inside the cells. In fact, cadmium and copper have been shown to cause membrane damage to microbial cells (Cabral, 1990; Fernández-Piñas et al, 1997; Sharma, 1999). Preston et al., (2000) also found synergistic interactions between the toxic effect of Zn+Cu and Zn+Cd combinations to a luminescent Escherichia coli strain and Cd+Cu combination to a luminescent Pseudomonas fluorescens strain. In a similar study, Ince et al. (1999) found that binary mixtures of Zn, Cu, Co and Cr were mostly antagonistic to both Vibrio fischeri and the duckweed Lemna minor; Fulladosa et al. (2005) also found an antagonistic effect for Co+Cd, Cd+Zn, Cd+Pb and Cu+Pb combinations and a synergistic effect for Co+Cu and Zn+Pb combinations to Vibrio fischeri. The observed differences in metal interaction toxicity between different organisms are probably related with metal specific uptake mechanisms and support the notion of the “battery” concept that relies on the need to use different bioassays based on species of
Use of Lux-Marked Cyanobacterial Bioreporters… 297
different origin to assess the ecological impacts of pollutant release into natural environments (Ince et al.,1999).
Figure 4. Combination index Plot (fa-CI plot) for a set of 4 heavy metal combinations (Cd+Zn, Cu+Cd, Zn+Cu and Cu+Zn+Cd). CI values are plotted as a function of the fractional inhibition of bioluminescence (fa) by computer simulation (CompuSyn) from fa= 0.10 to 0.95. CI< 1, = 1 and > 1 indicates synergism, additive effect and antagonism, respectively. Three independent experiments with two replicates were used. The vertical bars indicate 95% of confidence intervals for CI values based on SDA (Sequential Deletion Analysis) (Chou and Martin, 2005). Figure generated by using CompuSyn (Chou and Martin, 2005).
The CI plot is an effect-oriented graphic while the isobologram is a dose-oriented graphic but both should yield exactly identical conclusions for metal interactions (Chou, 1994, 2006). Figures 5, 6 and 7 showed classic isobolograms for Cu+Cd, Cu+Zn and Zn+Cd combinations, respectively, at fa levels of 0.5 (EC50), 0.75 (EC75) and 0.9 (EC90). Figure 5 showed a classic isobologram for Cu+Cd combination; the relationship of Cu+Cd combination could be appropriately described as antagonistic at fa=0.5, additive at fa=0.75 and synergistic at fa=0.9. Figure 6 showed a classic isobologram for Cu+Zn combinations, their relationship could be appropriately described as antagonistic at fa=0.5 and fa=0.75 and as additive at fa=0.9. Figure 7 showed a classic isobologram for Zn+Cd combination and their relationship could be described as slightly antagonistic at all effect levels (fa=0.5, 0.75 and 0.9). As expected, both the fa-CI plot and isobolograms yielded identical results at the shown effect levels.
Ismael Rodea-Palomares, Francisca Fernández-Piñas, Coral González-García et al. 298
Figure 5: Classic isobologram for the combination of Cu2+ (Dose A) and Cd2+ (Dose B) in mg/l as calculated by CompuSyn (Chou and Martin, 2005). Lines indicate simple addition at the fa levels of 0.5, 0.75 and 0.9. fa is the fractional inhibition of bioluminescence of the sample. Combination data points on the hypotenuse, on the lower left and on the upper right indicate an additive effect, synergism and antagonism respectively. Figure generated by using CompuSyn (Chou and Martin, 2005).
Figure 6: Classic isobologram for the combination of Cu2+ (Dose A) and Zn2+ (Dose B) in mg/l as calculated by CompuSyn (Chou and Martin, 2005). Lines indicate simple addition at the fa levels of 0.5, 0.75 and 0.9. fa is the fractional inhibition of bioluminescence of the sample. Combination data
Use of Lux-Marked Cyanobacterial Bioreporters… 299
points on the hypotenuse, on the lower left and on the upper right indicate an additive effect, synergism and antagonism respectively. Figure generated by using CompuSyn (Chou and Martin, 2005).
Figure 7. Classic isobologram for the combination of Zn2+ (Dose A) and Cd2+ (Dose B) in mg/l as calculated by CompuSyn (Chou and Martin, 2005). Lines indicate simple addition at the fa levels of 0.5, 0.75 and 0.9. fa is the fractional inhibition of bioluminescence of the sample. Combination data points on the hypotenuse, on the lower left and on the upper right indicate an additive effect, synergism and antagonism respectively. Figure generated by using CompuSyn (Chou and Martin, 2005).
A polygonogram is a semiquantitative method of representing interactions between three or more compounds at a determined fa level. Figure 8 showed polygonograms at fa=0.5 and fa=0.9 for three metals (Cu, Zn and Cd) in two metal combinations. As already expected, at fa=0.5 Zn+Cd and Zn+Cu combination exhibited moderate antagonism and Cu+Cd slight antagonism. Cu+Zn and Zn+Cd combinations showed nearly additive interactions at fa=0.9 and Cu+Cd moderate synergism.
In general, the results reported in this chapter show that the mass action low (Chou, 1976) and the CI-Isobologram analyses (Chou and Talalay, 1981) are applicable for toxicity interpretation of single and combined heavy metal toxicities in bioluminescence- inhibition based bioassays. The fa-CI plot was useful for a rapid visual interpretation of general trends of interactions, isobologram offered more partial and clear vision of those interactions but it couldn’t represent in two dimensional graphics interactions of more than two components; but, since it is dose-oriented, it allows to represent not only constant ratio interactions but also non-constant ratio interactions in order to know ratios of maximal synergy or antagonism (Chou, 2006; Chou and Martin, 2005). Finally polygonograms offered a whole overview of interactions of three or more compounds and allowed rapid interpretations of interactions.
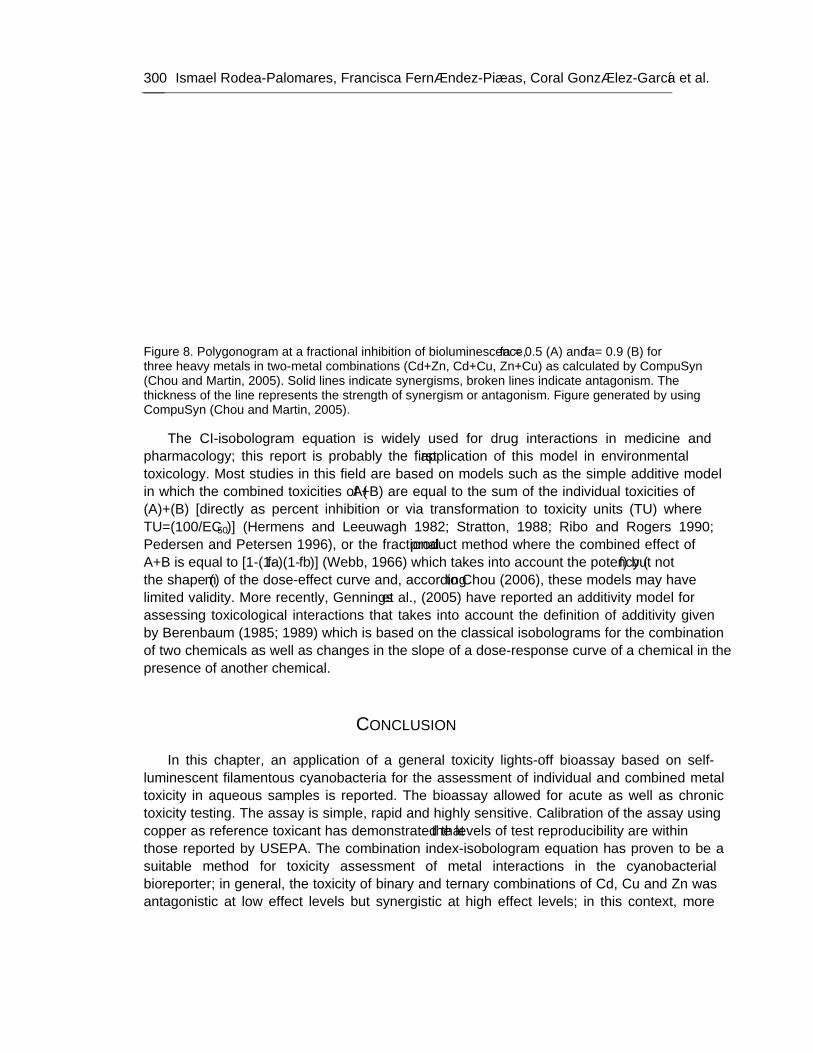
Ismael Rodea-Palomares, Francisca Fernández-Piñas, Coral González-García et al. 300
Figure 8. Polygonogram at a fractional inhibition of bioluminescence, fa = 0.5 (A) and fa= 0.9 (B) for three heavy metals in two-metal combinations (Cd+Zn, Cd+Cu, Zn+Cu) as calculated by CompuSyn (Chou and Martin, 2005). Solid lines indicate synergisms, broken lines indicate antagonism. The thickness of the line represents the strength of synergism or antagonism. Figure generated by using CompuSyn (Chou and Martin, 2005).
The CI-isobologram equation is widely used for drug interactions in medicine and pharmacology; this report is probably the first application of this model in environmental toxicology. Most studies in this field are based on models such as the simple additive model in which the combined toxicities of (A+B) are equal to the sum of the individual toxicities of (A)+(B) [directly as percent inhibition or via transformation to toxicity units (TU) where TU=(100/EC50)] (Hermens and Leeuwagh 1982; Stratton, 1988; Ribo and Rogers 1990; Pedersen and Petersen 1996), or the fractional product method where the combined effect of A+B is equal to [1-(1-fa)(1-fb)] (Webb, 1966) which takes into account the potency (f) but not the shape (m) of the dose-effect curve and, according to Chou (2006), these models may have limited validity. More recently, Gennings et al., (2005) have reported an additivity model for assessing toxicological interactions that takes into account the definition of additivity given by Berenbaum (1985; 1989) which is based on the classical isobolograms for the combination of two chemicals as well as changes in the slope of a dose-response curve of a chemical in the presence of another chemical.
CONCLUSION In this chapter, an application of a general toxicity lights-off bioassay based on self-
luminescent filamentous cyanobacteria for the assessment of individual and combined metal toxicity in aqueous samples is reported. The bioassay allowed for acute as well as chronic toxicity testing. The assay is simple, rapid and highly sensitive. Calibration of the assay using copper as reference toxicant has demonstrated that the levels of test reproducibility are within those reported by USEPA. The combination index-isobologram equation has proven to be a suitable method for toxicity assessment of metal interactions in the cyanobacterial bioreporter; in general, the toxicity of binary and ternary combinations of Cd, Cu and Zn was antagonistic at low effect levels but synergistic at high effect levels; in this context, more
Use of Lux-Marked Cyanobacterial Bioreporters… 301
systematic studies on toxicity of combinations of pollutants towards a range of organisms are needed as any possible synergistic enhancement in toxicity should be taken into account when establishing environmental safety regulations. Due to its sensitive response, low maintenance cost and ecological relevance, the freshwater luminescent filamentous cyanobacterial strain Anabaena sp. PCC 7120 CPB4337 expand the battery of available bacterial bioreporters and may be particularly well suited to provide information on potential environmental damage of various freshwater environments.
ACKNOWLEDGEMENTS This research was funded by Comunidad de Madrid grants 07M/0052/2002,
GR/AMB/0084/2004 and S-0505/AMB/0321. Ismael Rodea-Palomares is the recipient of a Ph.D. research contract from Comunidad de Madrid.
REFERENCES
Allen, M. B. & Arnon, D. I. (1955). Studies on nitrogen-fixing blue grenn algae. I Growth and nitrogen fixation by Anabaena cylindrica Lemm. Plant. Physiol, 30, 366-372.
Belkin, S. (2003). Microbial whole-cell sensing systems of environmental pollutants. Curr Opin Microbiol, 6, 206-212.
Belkin, S. (2007). Recombinant bacterial reporter systems. In H.H. Weetall, R.S. Marks, I. Berenbaum, M. C. (1985). The expected effect of a combination of agents: the general solution. J. Theor. Biol, 114, 413-431.
Berenbaum, M. C. (1989). What is synergy? Pharmacol. Rev, 41, 93-141. Bulich, A. A. & Isenberg, D. L. (1981). Use of the luminescent bacterial system for the rapid
assessment of aquatic toxicity. ISA Trans, 20, 29-33. Cabral, J. P. S. (1990). Cupric ions induce both an efflux of potassium and low-molecular
mass metabolites in Pseudomonas syringae. FEMS Microbiol. lett, 72, 109-112. Cho, J.-C., K.-J Park, H.-s. Ihm, J.-E. Park, S.-Y. Kim, I. Kang, K.-H. Lee, D. Hahng, Lee,
D.-H. & Kim, S.-J. (2004). A novel continuous toxicity test system using a luminously modified freshwater bacterium. Biosens. Bioelectron, 20, 338-344.
Chou, T. C. (1976). Derivation and properties of Michaelis-Menten type and Hill type equations for reference ligands. J. Theor. Biol, 59, 253-276.
Chou, T. C. (1991). The median effect principle and the combination index for quantification of synergism and antagonism. In T. C. Chou & D. C. Rideout, Synergism and Antagonism in Chemoterapy. New York: Academic Press.
Chou, T. C. (2006). Theoretical basis, experimental design, and computerized simulation of synergism and antagonism in drug combination studies. Pharmacol. Rev, 58, 621-681.
Chou, T. C. & Martin, N. (2005). CompuSyn for Drug Combinations: PC Software and User´s Guide: A Computer Program for Quantification of Synergism and Antagonism in Drug Combinations and the Determination of IC50 and ED50 and LD50 Values. Paramus, NJ., ComboSyn, Inc.
Ismael Rodea-Palomares, Francisca Fernández-Piñas, Coral González-García et al. 302
Chou, T. C., Motzer, R. J., Tong, Y. & Bosl, G. J. (1994). Computerized quantitation of synergism and antagonism of taxol, topotecan, and cisplatin against human teratocarcinoma cell growth: a rational approach to clinical protocol design. J. Natl. Cancer Inst, 86, 1517-1524.
Chou, T. C. & Talalay, P. (1981). Generalized equations for the analysis of inhibitions of Michaelis-Menten and higher-order kinetic systems with two or more mutually exclusive and nonexclusive inhibitors. Eur. J. Biochem, 115, 207-216.
Chou, T. C. & Talalay, P. (1984). Quantitative analysis of dose-effect relationships: the combined effects of multiple drugs or enzyme inhibitors. Adv. Enzyme Regul, 22, 27-55.
Chou, T. C. & Talaly, P. (1977). A simple generalized equation for the analysis of multiple inhibitions of Michaelis-Menten kinetic systems. J. Biol. Chem, 252, 6438-6442.
Corbisier, P., Ji, G., Nuyts, G., Mergeay, M. & Silver, S. (1993). luxAB gene fusions with the arsenic and cadmium resistance operons of Staphylococcus aureus plasmid pI258. FEMS Microbiol Lett, 110, 231-238.
Dawson, D. A., Pöch, G. & Schultz, T. W. (2006). Chemical mixture toxicity testing with Vibrio fischeri: Combined effects of binary mixtures for ten soft electrophiles. Ecotoxicology and Environmental Safety, 65, 171-180.
Dirilgen, N. & Inel, Y. (1994). Effects of zinc and copper on growth and metal accumulation in duckweed, Lemna minor. Bull. Environ. Contam. Toxicol, 53, 442-449.
Erbe, J. L., Adams, A. C., Taylor, K. B. & Hall, L. M. (1996). Cyanobacteria carrying an smt-lux transcriptional fusion as biosensors for the detection of heavy metal cations. J. Ind. Microbiol, 17, 80-83.
Fernandez-Pinas, F., Leganes, F. & Wolk, C. P. (2000). Bacterial lux genes as reporters in cyanobacteria. Methods Enzymol, 305, 513-527.
Fernandez-Pinas, F., Mateo, P. & Bonilla, I. (1991). Binding of cadmium by cyanobacterial growth media: free ion concentration as a toxicity index to the cyanobacterium Nostoc UAM 208. Arch. Environ. Contam. Toxicol, 21, 425-431.
Fernandez-Pinas, F. & Wolk, C. P. (1994). Expression of luxCD-E in Anabaena sp. can replace the use of exogenous aldehyde for in vivo localization of transcription by luxAB. Gene, 150, 169-174.
Fulladosa, E., Murat, J. C. & Villaescusa, I. (2005). Study on the toxicity of binary equitoxic mixtures of metals using the luminescent bacteria Vibrio fischeri as a biological target. Chemosphere, 58, 551-557.
Garcia-Dominguez, M., Lopez-Maury, L., Florencio, F. J. & Reyes, J. C. (2000). A gene cluster involved in metal homeostasis in the cyanobacterium Synechocystis sp. strain PCC 6803. J. Bacteriol, 182, 1507-1514.
Gennings, C., Carter, W. H., Jr., Carchman, R. A., Teuschler, L. K., Simmons, J. E. & Carney, E. W. (2005). A unifying concept for assessing toxicological interactions: changes in slope. Toxicol. Sci, 88, 287-297.
Gronow, M. (1984). Biosensors. Trends Biochem. Sci, 9, 336-340. Hermens, J. & Leeuwangh, P. (1982). Joint toxicity of mixtures of 8 and 24 chemicals to the
guppy (Poecilia reticulata). Ecotoxicol. Environ. Saf, 6, 302-310. Ince, N. H., Dirilgen, N., Apikyan, I. G., Tezcanli, G. & Üstün, B. (1999). Assessmet of
Toxic Interactions of Heavy Metals in Binary Mixtures: A Statistical Approach. Archives of Environmental Contamination and Toxicology, 36, 365-372.
Use of Lux-Marked Cyanobacterial Bioreporters… 303
Ishaque, A. B., Johnson, L., Gerald, T., Boucaud, D., Okoh, J. & Tchounwou, P. B. (2006). Assessment of individual and combined toxicities of four non-essential metals (As, Cd, Hg and Pb) in the microtox assay. Int. J. Environ. Res. Public Health, 3, 118-120.
Kandegedara, A. & Rorabacher, D. B. (1999). tertiary amines as better buffers covering the range of pH 3-11. Temperature dependence of their dissociation contants. Anal. Chem, 71, 3140-3144.
Köhler, S., Belkin, S. & Schmid, R. D. (2000). Reporter gene bioassays in environmental analysis. Fresenius J. Anal. Chem, 366, 769-779.
Mbeunkui, F., Richaud, C., Etienne, A. L., Schmid, R. D. & Bachmann, T. T. (2002). Bioavailable nitrate detection in water by an immobilized luminescent cyanobacterial reporter strain. Appl. Microbiol. Biotechnol, 60, 306-312.
Meighen, E. A. (1991). Molecular biology of bacterial bioluminescence. Microbiol. Rev, 55, 123-142.
Newman, M. C. & McCloskey, T. J. (1996). Predicting relative toxicity and interactions of divalent metal ions: Microtox bioluminescence assay. Environ. Toxicol. Chem, 15, 275-281.
Norberg-King, T. J. (1993). A linear interpolation method for sublethal toxicity: The Inhibition Concentration (ICp) Approach program and user manual, Version 2.0. Duluth, MN, U.S. Environmental Protection Agency Environmental Research Laboratory. National Effluent Toxicity Assessment Center Technical Report 03-93.
Paton, G. I., E. A .S Rattray, C. D. Campbell, M. S. Cresser, L. A. Glover, S. C.L. Meeussen & Killham, K. (1997a). Use of genetically modified microbial biosensors for soil ecotoxicity testing. In B. M. D. C.F Pankhurst, V.V.S.R Gupta, Biological indicators of soil health. (394-418). Oxon, United Kingdom: CAB 1 International Press.
Paton, G. I., Palmer, G., Burton, M., Rattray, E. A., McGrath, S. P., Glover, L. A. & Killham, K. (1997b). Development of an acute and chronic ecotoxicity assay using lux-marked Rhizobium leguminosarum biovar trifolii. Lett. Appl. Microbiol, 24, 296-300.
Pedersen, F. & Petersen, G. I. (1996). Variability of species sensitivity to complex mixtures. Wat. Sci. Tech, 33, 109-119.
Preston, S., Coad, N., Townend, J., Killham, K. & Paton, G. I. (2000). Biosensing the acute toxicity of metal interactions: Are they additive, Synergistic, or Antagonistic? Environmental Toxicology and Chemistry, 19, 775-780.
Riba. F., E. Garcia-Luque, J. Blasco & Valls., T. A. D. (2003). Bioavailability of heavy metals bound to estuarine sediments as a function of pH and salinity. Chem. Spec. Bioavail, 15, 101-114.
Ribo, J. M. & Rogers, F. (1990). Toxicity of mixtures of aquatic contaminants using luminescent bacteria bioassay. Toxicity Asses, 5, 135-152.
Robers, S., Vasseur, P. & Dive, D. (1990). Combined effects between atrazine, copper and pH, on target and non target species. Water Res, 24, 485-491.
Robinson, N. J., Whitehall, S. K. & Cavet, J. S. (2001). Microbial metallothioneins. Adv. Microb. Physiol, 44, 183-213.
Schreiter, P. P., Gillor, O., Post, A., Belkin, S., Schmid, R. D. & Bachmann, T. T. (2001). Monitoring of phosphorus bioavailability in water by an immobilized luminescent cyanobacterial reporter strain. Biosens. Bioelectron, 16, 811-818.
Shao, C. Y., Howe, C. J., Porter, A. J. & Glover, L. A. (2002). Novel cyanobacterial biosensor for detection of herbicides. Appl. Environ. Microbiol, 68, 5026-5033.
Ismael Rodea-Palomares, Francisca Fernández-Piñas, Coral González-García et al. 304
Sharma, S. S., Schat, H., Vooijs, R. & Van Heerwaarden, L. M. (1999). Combination toxicology of copper, zinc and cadmium in binary mixtures: Concentration-dependent antagonitic, nonadditive, and synergistic effects on root growth in Silene vulgaris. Environ. Toxicol. Chem, 18, 348-355.
Sorensen, S. J., Burmolle, M. & Hansen, L. H. (2006). Making bio-sense of toxicity: new developments in whole-cell biosensors. Curr. Opin. Biotechnol, 17, 11-16.
Steinberg S. M., E. J. Poziomek, W. H. Engelmann & K. R. Rogers. (1995). A review of environmental applications of bioluminescence measurements. Chemosphere, 30, 2155-2197.
Stratton, G. W. (1988). Method for determinig toxicant interaction effects towrds microorganism. Toxic. Assess, 3, 343-353.
Szittner, R. & Meighen, E. (1990). Nucleotide sequence, expression, and properties of luciferase coded by lux genes from a terrestrial bacterium. J. Biol. Chem, 265, 16581-16587.
Ulitzur, S., Lahav, T. & Ulitzur, N. (2002). A novel and sensitive test for rapid determination of water toxicity. Environ. Toxicol, 17, 291-296.
U.S EPA. (1991). Methods for aquatic toxicity identification evaluations. Phase I Toxicity Characterization Procedures (second ed), U. S. Environmental Protection Agency. US Govt Print Office, Washington DC. EPA-600-6-91-1003.
U.S EPA. (1994). Short-term methods for estimating the chronic toxicity of effluents and receiving waters to freshwaters organism (Third Edition), U.S. Environmental Protection Agency, Cincinnati, Ohio. EPA/600/4-91/002.
U.S EPA. (2002). Methods for Measuring the Acute Toxicity of Effluents and Receiving Waters to Freshwater and Marine Organism (Fifth edition), U.S. Environmental Protection Agency, Washington, DC, EPA-812-R02-012.
Utgikar, V. P., Chaudhary, N., Koeniger, A., Tabak, H. H., Haines, J. R. & Govind, R. (2004). Toxicity of metals and metal mixtures: analysis of concentration and time dependence for zinc and copper. Water Res, 38, 3651-3658.
Webb, J. L. (1963). Effect of more than one inhibitor. In Enzyme and metabollic inhibitors. (63-69; 488-512). New York: Academic Press.
In: Handbook on Cyanobacteria ISBN: 978-1-60741-092-8 Editors: P. M. Gault and H. J. Marler © 2009 Nova Science Publishers, Inc.
Chapter 10
CRUDE OIL BIODEGRADATION BY CYANOBACTERIA FROM MICROBIAL MATS: FACT OR FALLACY?
Olga Sánchez and Jordi Mas Departament de Genètica i Microbiologia,
Universitat Autònoma de Barcelona, 08193 Bellaterra, Spain
ABSTRACT
Microbial mats consist of multi-layered microbial communities organized in space as a result of steep physicochemical gradients. They can be found in sheltered and shallow coastal areas and intertidal zones where they flourish whenever extreme temperatures, dryness or saltiness act to exclude plants and animals. Several metabolically active microorganisms, such as phototrophs (i.e., diatoms, cyanobacteria, purple and green sulfur bacteria) develop in microbial mats together with chemoautotrophic and heterotrophic bacteria.
These communities have been observed to grow in polluted sites where their ability to degrade petroleum components has been demonstrated. Furthermore, several investigations have attributed to cyanobacteria an important role in the biodegradation of organic pollutants. Nevertheless, it is still a matter of discussion whether cyanobacteria can develop using crude oil as the sole carbon source. In an attempt to evaluate their role in hydrocarbon degradation we have developed an illuminated packed tubular reactor filled with perlite soaked with crude oil inoculated with samples from Ebro Delta microbial mats. A continuous stream of nutrient-containing water was circulated through the system. Crude oil was the only carbon source and the reactor did not contain inorganic carbon. Oxygen tension was kept low in order to minimize possible growth of cyanobacteria at the expense of CO2 produced from the degradation of oil by heterotrophic bacteria. Different microorganisms were able to develop attached to the surface of the filling material, and analysis of microbial diversity within the reactor using culture-independent molecular techniques revealed the existence of complex assemblages of bacteria diverse both taxonomically and functionally, but cyanobacteria were not among them. However, cyanobacteria did grow in parallel oil-containing reactors in the presence of carbonate.
Olga Sánchez and Jordi Mas 306
INTRODUCTION Crude oil is the major source of energy for industry and daily life. As a result, oil spills
constitute a problem of increasing concern due to the ecological and environmental impact on open sea and coastal areas. Chemical pollution by petroleum hydrocarbons can cause serious damage to aquatic as well as to foreshore marine life. Changes in diversity, abundance and activity of autochthonous populations as a result of oil spills abound in the literature [10, 33, 37, 51]. The sources of marine hydrocarbon pollution are mainly runoff from land and municipal/industrial wastes, routine ship maintenance like bilge cleaning, natural seeps, tanker accidents and offshore oil production.
After the massive oil spills of the Gulf War in 1991 (ca. 10.8 million barrels contaminating ca. 640 km of the Saudi Gulf coast), heavily thick cyanobacterial mats were observed on the top of the sediments [6, 52]. As a consequence, a possible implication of cyanobacteria in oil biodegradation was considered. This fact was consistent with the observation of higher biodegradation potential in the coast than in open waters [43].
Marine microbial mats develop mostly in sheltered and shallow coastal areas and intertidal zones and they are composed of complex stratified microbial communities dominated by photoautotrophic cyanobacteria [35, 55, 56]. They present a vertical zonation due to steep physicochemical gradients and to their own physiology. While cyanobacteria, which develop in the upper layers, are usually the most important photosynthetic supporters of microbial mats, other microorganisms such as purple sulphur bacteria, purple nonsulphur bacteria, as well as heterotrophic bacteria also develop.
There is evidence that microbial communities dominated by cyanobacteria can be actively involved in oil biodegradation. Abed et al. [3] concluded that Phormidium and Oscillatoria-like cyanobacterial morphotypes dominated benthic microbial mats inhabiting a heavily polluted site in a coastal stream (Wadi Gaza); other microorganisms, such as members of the Cytophaga-Flavobacterium-Bacteroides group (CFB), the G���� and Beta subclasses of proteobacteria, and the green non-sulfur bacteria were also detected. These communities effectively degraded both aliphatic and aromatic compounds.
In other studies, the biodegradation potential of microbial mats was also demonstrated. Grötzschel et al. [25] found that pristine hypersaline microbial mats were able to degrade different petroleum compounds (phenanthrene, pristane, octadecane and dibenzothiopene), although at low rates, and molecular analysis did not reveal changes in the microbial community. Abed et al. [1] demonstrated that microbial mats from Saudi Arabia were rich in microorganisms able to degrade petroleum compounds at elevated salinities and temperatures; bacteria belonging to Beta, Gamma and Deltaproteobacteria, Cytophaga-Flavobacterium-Bacteroides group and Spirochetes were detected. Chaillan et al. [14] also showed that a tropical cyanobacterial mat located in Indonesia was able to degrade efficiently the crude oil present in the environment and under laboratory conditions. Furthermore, Llirós et al. [32] investigated the effect of Casablanca and Maya crude oils, rich in aliphatic and aromatic hydrocarbons respectively, on pristine Ebro Delta microbial mats and concluded that the indigenous community had a considerable potential to degrade oil components.
On the other hand, in other works partial elimination of the spilled oil was attributed to the combined effects of physico-chemical weathering and microbial degradation [22, 50].
Crude Oil Biodegradation by Cyanobacteria from Microbial Mats: Fact or Fallacy? 307
However, although the ability of microbial mats to grow on oil-polluted sediments has been throughly documented, there is controversy about the capacity of cyanobacteria to grow at the expense of crude oil. Some authors point to these organisms as potential biodegraders [4, 12, 13, 39, 44], while others conclude that heterotrophic bacteria associated to cyanobacteria may be carrying out oil biodegration [2, 5, 15, 16].
The purpose of this work was to evaluate whether and to what extent cyanobacteria from microbial mats can grow attached to crude oil using hydrocarbons as the only carbon source. Since oil polluted environments are open systems in which cyanobacteria must be able to attach to the oil surface in order to grow, we tried to simulate this situation by using a tubular reactor packed with perlite through which a continuous stream of nutrient containing water was circulated.
BIOREACTOR DESIGN AND OPERATION Experiments were carried out in a fixed-biomass reactor modified from the system
described by Ferrera et al. [20]. The reactor consisted of a glass column (15.6 mm inner diameter, 275 mm length, 52.5 mL total volume) surrounded by a double wall through which water circulated at 25 oC. The column was packed with perlite, mixed with glass beads and rings to increase porosity and improve fluid circulation, that provided a large surface for biofilm development. The column was attached at the basis to a stirred reactor vessel containing the pH sensor, sampling ports, effluent collector and the inlets for the synthetic medium. The contents of the reactor circulated in an upward flow through the column in a closed loop powered by a peristaltic pump (Watson Marlow 313S) at a constant flow rate of 0.1 L.min-1 during 24 hours, after which pumping of external culture medium through the reactor started at a constant rate by means of a Watson Marlow 501U pump. One liter of medium contained: NH4Cl (300 mg), K2HPO4 (300 mg), CaCl2.2H2O (200 mg), MgCl2.6H2O (200 mg), KCl (200 mg), NaCl (30 g), vitamin B12 (20 µg), Na2-EDTA (5 mg), FeSO4.7H2O (2 mg), ZnSO4.7H2O (0,1 mg), MnCl2.4H2O (30 µg), H3BO3 (0,3 mg), CoCl2.6H2O (0,2 mg), CuCl2.2H2O (10 µg), NiCl2.6H2O (20 µg) and Na2MoO4.2H2O (30 µg). The column was continuously illuminated by two incandescent light bulbs with an incident irradiance of 117 µE.m-2.s-1, while the vessel was kept in the dark (figure 1).
Three separate sets of experiments were run (table 1). In the main experiment (experiment 1), crude oil was the only carbon source. In this case, the column was packed with perlite soaked with Casablanca crude oil (Tarragona basin, Spain). In a second set of conditions considered as a positive control (experiment 2), crude oil was excluded and carbonate (200 mM) was incorporated in the medium for enhancing cyanobacterial growth. In a third control experiment, carbonate and also oil-soaked perlite were utilized in order to eliminate the possibility that hydrocarbons could be toxic for cyanobacterial growth.
In all these experiments, the system was inoculated with a sample from Ebro Delta microbial mats, located in Tarragona, NE Spain. One hundred grams of sediment were resuspended in 250 mL of saline solution (0.9% Na Cl), and were used to startup the system.
For all the experiments, all the components of the system, except the crude oil, were autoclaved. Casablanca crude oil contains mainly aliphatic hydrocarbons (59.5%) and, to a

Olga Sánchez and Jordi Mas 308
lesser extent, aromatic hydrocarbons (27%). Asphaltenes and polar compounds are present only in minor amounts.
Figure 1. (A) The bioreactor consisted of a stirred vessel and a column packed with oil soaked perlite to provide a large surface for biofilm development. The vessel contained the pH sensor, sampling ports, effluent collector and inlets for synthetic medium. Two incandescent light bulbs illuminated the column. (B) Detail ot the column filled with oil-soaked perlite and glass beads and rings.
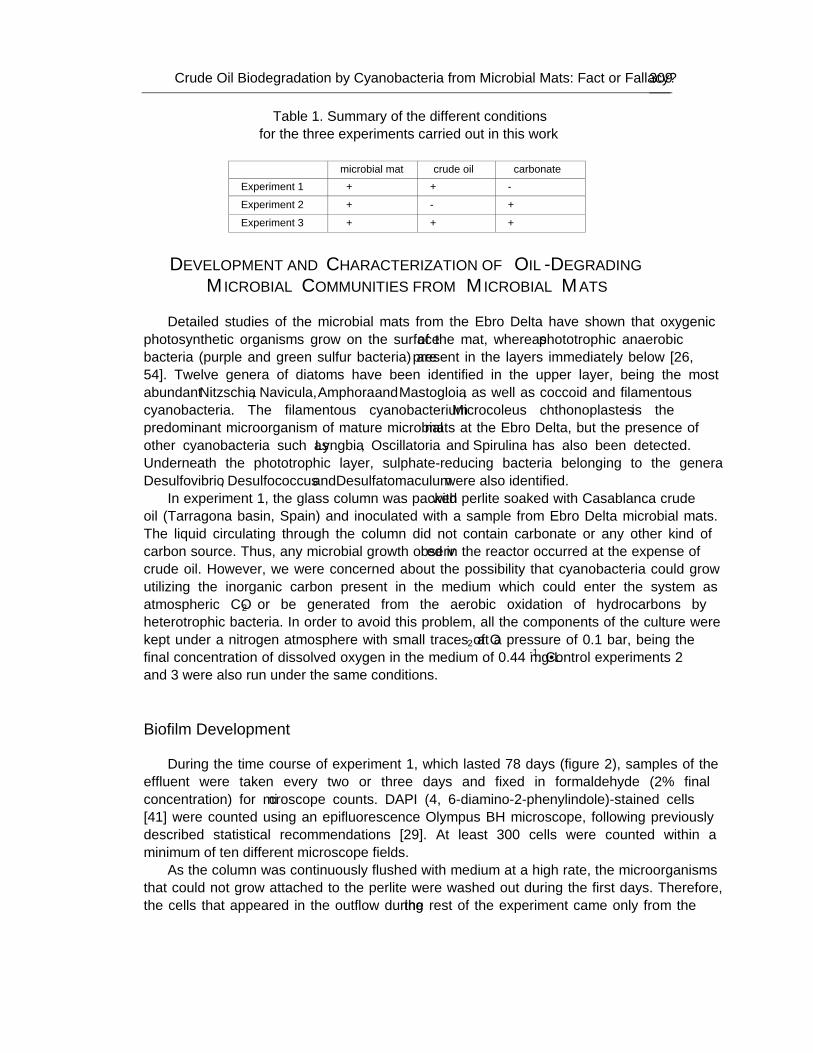
Crude Oil Biodegradation by Cyanobacteria from Microbial Mats: Fact or Fallacy? 309
Table 1. Summary of the different conditions for the three experiments carried out in this work
DEVELOPMENT AND CHARACTERIZATION OF OIL-DEGRADING MICROBIAL COMMUNITIES FROM MICROBIAL MATS
Detailed studies of the microbial mats from the Ebro Delta have shown that oxygenic
photosynthetic organisms grow on the surface of the mat, whereas phototrophic anaerobic bacteria (purple and green sulfur bacteria) are present in the layers immediately below [26, 54]. Twelve genera of diatoms have been identified in the upper layer, being the most abundant Nitzschia, Navicula, Amphora and Mastogloia, as well as coccoid and filamentous cyanobacteria. The filamentous cyanobacterium Microcoleus chthonoplastes is the predominant microorganism of mature microbial mats at the Ebro Delta, but the presence of other cyanobacteria such as Lyngbia, Oscillatoria and Spirulina has also been detected. Underneath the phototrophic layer, sulphate-reducing bacteria belonging to the genera Desulfovibrio, Desulfococcus and Desulfatomaculum were also identified.
In experiment 1, the glass column was packed with perlite soaked with Casablanca crude oil (Tarragona basin, Spain) and inoculated with a sample from Ebro Delta microbial mats. The liquid circulating through the column did not contain carbonate or any other kind of carbon source. Thus, any microbial growth observed in the reactor occurred at the expense of crude oil. However, we were concerned about the possibility that cyanobacteria could grow utilizing the inorganic carbon present in the medium which could enter the system as atmospheric CO2 or be generated from the aerobic oxidation of hydrocarbons by heterotrophic bacteria. In order to avoid this problem, all the components of the culture were kept under a nitrogen atmosphere with small traces of O2 at a pressure of 0.1 bar, being the final concentration of dissolved oxygen in the medium of 0.44 mg·L-1. Control experiments 2 and 3 were also run under the same conditions.
Biofilm Development During the time course of experiment 1, which lasted 78 days (figure 2), samples of the
effluent were taken every two or three days and fixed in formaldehyde (2% final concentration) for microscope counts. DAPI (4’, 6’-diamino-2-phenylindole)-stained cells [41] were counted using an epifluorescence Olympus BH microscope, following previously described statistical recommendations [29]. At least 300 cells were counted within a minimum of ten different microscope fields.
As the column was continuously flushed with medium at a high rate, the microorganisms that could not grow attached to the perlite were washed out during the first days. Therefore, the cells that appeared in the outflow during the rest of the experiment came only from the
microbial mat crude oil carbonate
Experiment 1 + + -
Experiment 2 + - +
Experiment 3 + + +

Olga Sánchez and Jordi Mas 310
biofilm that was growing at the expense of crude oil. The effluent cell number increased progressively the first 10 days until reaching a stable average of 8.6x10⁶ cells·mL-1 (figure 3).
Microscope observations showed that initially the effluent consisted of microorganisms typically present in microbial mats, such as algae, cyanobacteria, and sulfide-oxidizing bacteria, but after three days, small rods of different lengths were the predominant morphologies (figure 4).
Figure 2. (A) Sequence of different images showing the development of the biofilm from experiment 1 (B) Detail of the oil-soaked filling covered with a biofilm at the end of the experiment (78 days).
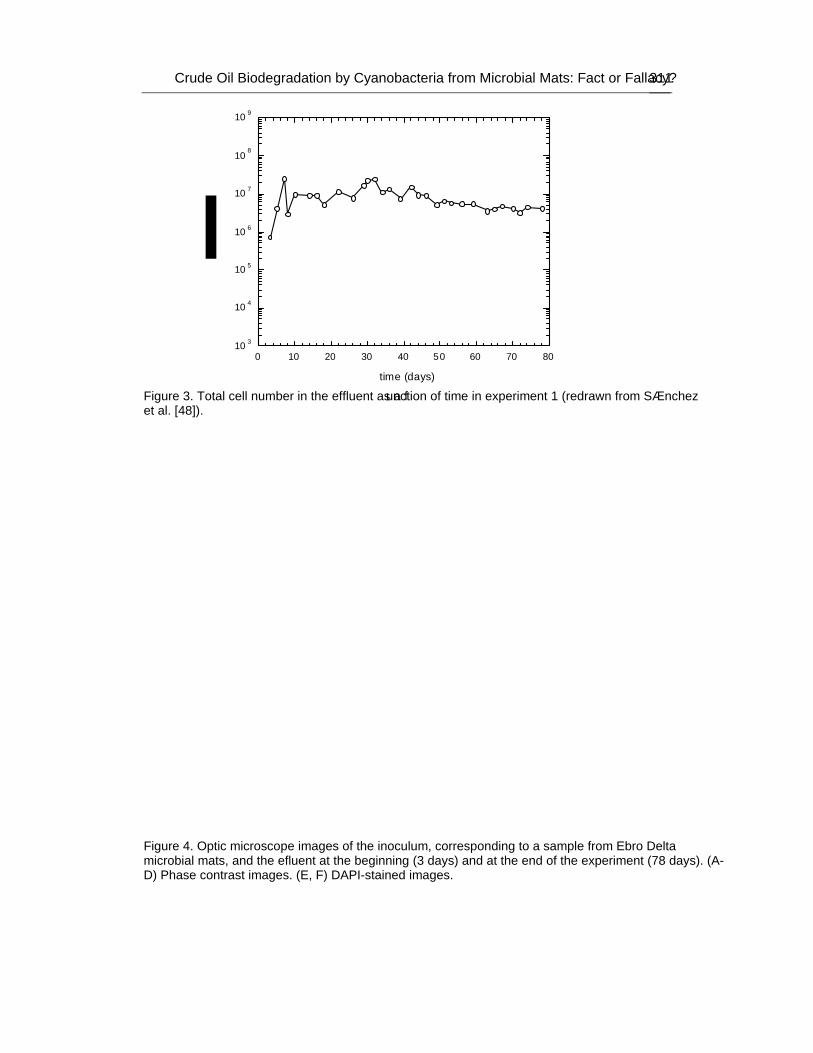
Crude Oil Biodegradation by Cyanobacteria from Microbial Mats: Fact or Fallacy? 311
Figure 3. Total cell number in the effluent as a function of time in experiment 1 (redrawn from Sánchez et al. [48]).
Figure 4. Optic microscope images of the inoculum, corresponding to a sample from Ebro Delta microbial mats, and the efluent at the beginning (3 days) and at the end of the experiment (78 days). (A-D) Phase contrast images. (E, F) DAPI-stained images.
10 3
10 4
10 5
10 6
10 7
108
10 9
0 10 20 30 40 50 60 70 80
time (days)
Olga Sánchez and Jordi Mas 312
Degradation of Crude Oil Oil-soaked perlite samples were analyzed for hydrocarbon composition by gas
chromatography at the beginning (day 0) and at the end of experiment 1 (day 78). A washing control, in which only water and sodium chloride were pumped into the system instead of medium, was carried out under the same conditions as biodegradation experiment 1 in order to determine which hydrocarbons were removed by wash-out with the effluent.
The hydrocarbons were separated by gas chromatography using a Varian Model Star 3400 equipped with a flame ionization detector and a Varian 8200 CX injector. A DB-5 capillary column (30 m x 0.25 mm i.d.; film thickness 0.25 μm) was used. Hydrogen was the carrier gas (50 cm/s). The oven temperature program was 70 to 140°C at 10°C·min-1, 140 to 310°C at 4°C·min-1 (holding time 20 min). The Injector temperature program was 100 to 300°C at 200°C·min-1, and the detector temperature was 330°C. For SPI injection nitrogen was used as the make up gas (30 ml·min-1). Detector gas flows were hydrogen (30 ml·min-1) and air (300 ml·min-1).
The samples were also analyzed with a GC coupled to a mass spectrometer (GC-MS) using a Fisons MD-800 instrument. Spectra were obtained in the electron ionization mode (70 eV) scanning from mass 50 to 550 every second. A HP-5 capillary column (30 m x 0.25 mm i.d.; film thickness 0.25 μm) was used. Helium was the carrier gas (1 ml·min-1). The oven temperature programme was 70 to 140°C at 10°C·min-1, 140 to 310°C at 4°C·min-1 (holding time 20 min). Injector, transfer line and ion source temperatures were 300, 280 and 200°C, respectively. Injection was in the splitless mode (iso-octane, hot needle technique) keeping the split valve closed for 48 s.
The samples (± 100-200 μl of crude oil) were dissolved in n-hexane to precipitate the asphaltenes. Neutral silica gel (70-230 mesh, Merck) and alumina (70-230 mesh, Merck) were extracted with (2:1, v/v) dichloromethane-methanol in a Soxhlet apparatus for 24 h. After solvent evaporation, the silica and alumina were heated for 12 h at 120°C and 350°C, respectively, and 5% of Milli-Q-grade water was added for deactivation.
The maltenes were fractionated by chromatography using a 34 cm x 0.9 cm i.d. column filled with 8 g of 5% water-deactivated alumina (top) and silica (bottom). Six fractions were separated by elution with 20 ml of n-hexane, 20 ml of 10% dichloromethane in n-hexane, 40 ml of 20% dichloromethane in n-hexane, 40 ml of 25% n-hexane in dichloromethane, 20 ml of 5 % methanol in dichloromethane and 40 ml of 10% methanol in dichloromethane. The hydrocarbon fractions were evaporated to dryness and dissolved in iso-octane. The resin fractions were dissolved in dichloromethane and derivatized with diazomethane.
We used the n-alkane vs phytane ratio for monitoring oil biodegradation, since light to moderate changes in hydrocarbon composition were observed in our experiment [17]. The distribution of steranes and hopanes was virtually the same before and after the experiment. Other saturated hydrocarbons, such as cycloalkanes, also remained unchanged.
Figure 5 shows the n-alkane vs phytane ratio in the original crude oil sample, the washing control, and at the end of the experiment. In the water-washing control, the lighter n-alkanes (up to C17) were depleted in relation to phytane, while from C18 n-alkane on, all the compounds remained in the same proportion. The biodegradaded sample (t = 78 days) followed the same pattern, although the lighter hydrocarbons were slightly more depleted than the washing sample.
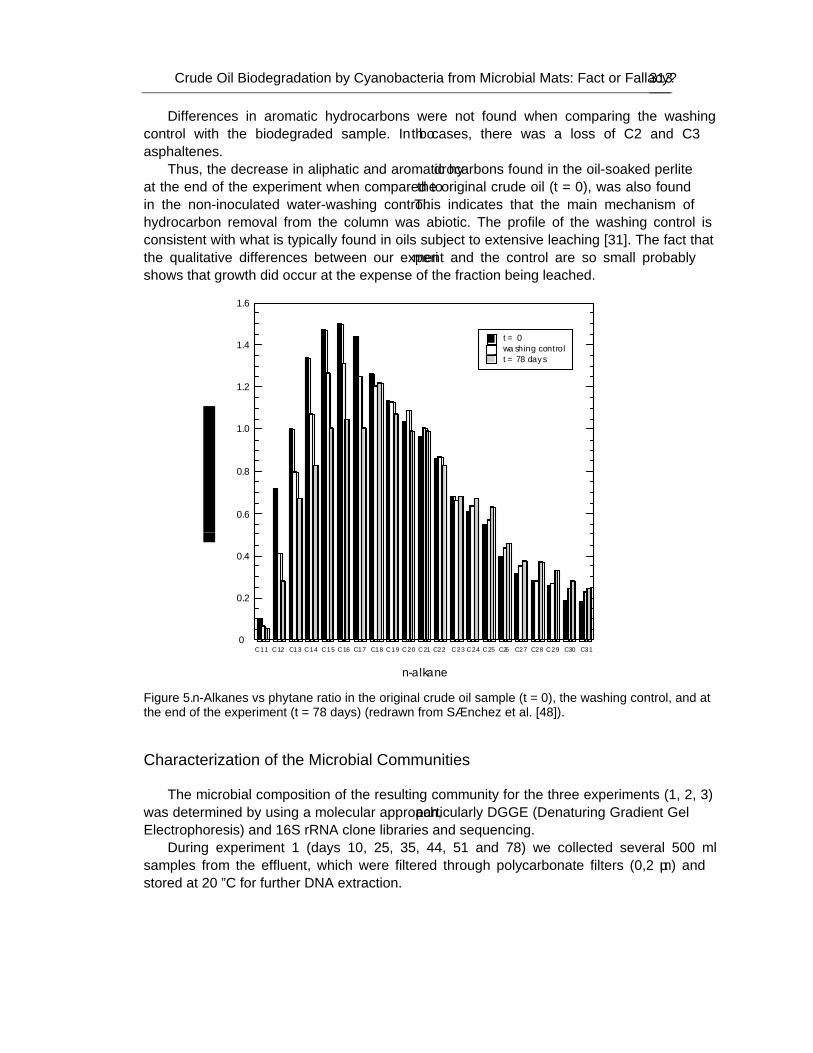
Crude Oil Biodegradation by Cyanobacteria from Microbial Mats: Fact or Fallacy? 313
Differences in aromatic hydrocarbons were not found when comparing the washing control with the biodegraded sample. In both cases, there was a loss of C2 and C3 asphaltenes.
Thus, the decrease in aliphatic and aromatic hydrocarbons found in the oil-soaked perlite at the end of the experiment when compared to the original crude oil (t = 0), was also found in the non-inoculated water-washing control. This indicates that the main mechanism of hydrocarbon removal from the column was abiotic. The profile of the washing control is consistent with what is typically found in oils subject to extensive leaching [31]. The fact that the qualitative differences between our experiment and the control are so small probably shows that growth did occur at the expense of the fraction being leached.
Figure 5. n-Alkanes vs phytane ratio in the original crude oil sample (t = 0), the washing control, and at the end of the experiment (t = 78 days) (redrawn from Sánchez et al. [48]).
Characterization of the Microbial Communities
The microbial composition of the resulting community for the three experiments (1, 2, 3)
was determined by using a molecular approach, particularly DGGE (Denaturing Gradient Gel Electrophoresis) and 16S rRNA clone libraries and sequencing.
During experiment 1 (days 10, 25, 35, 44, 51 and 78) we collected several 500 ml samples from the effluent, which were filtered through polycarbonate filters (0,2 µm) and stored at –20 ºC for further DNA extraction.
0
0.2
0.4
0.6
0.8
1.2
1.4
1.6
C11 C12 C13 C14 C15 C16 C17 C18 C19 C20 C21 C22 C23 C24 C25 C26 C27 C28 C29 C30 C31
1.0
n-alkane
t = 0wa shing controlt = 78 days
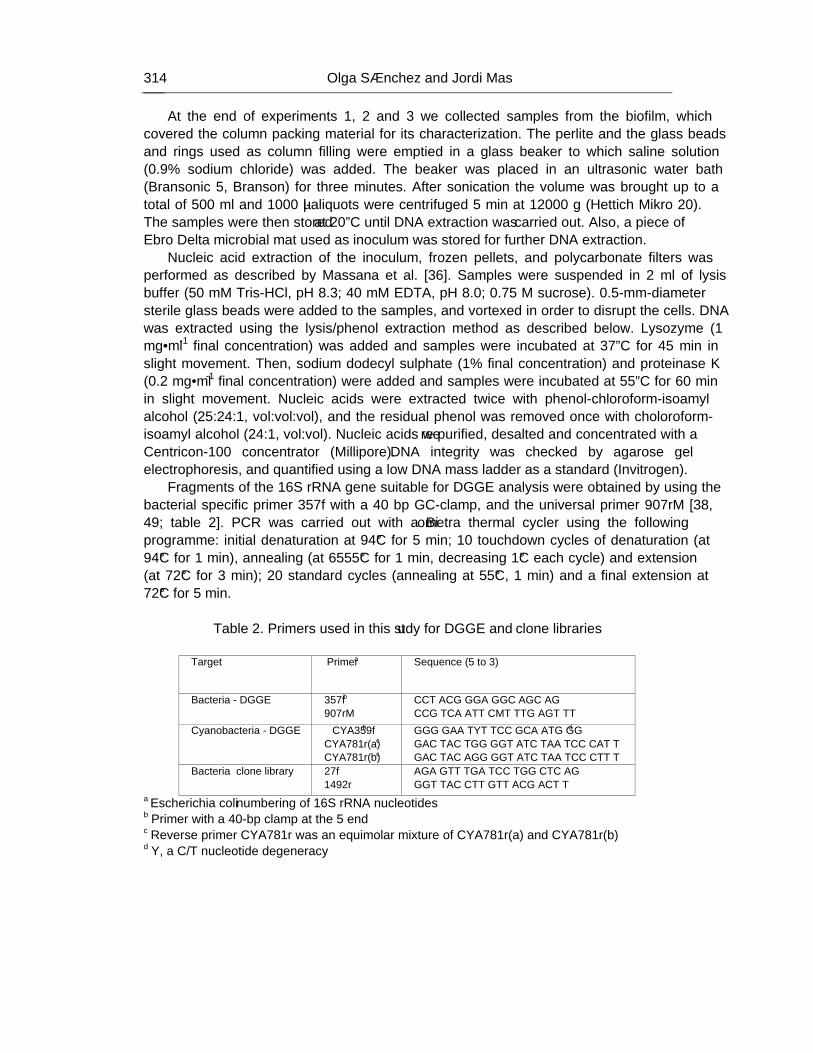
Olga Sánchez and Jordi Mas 314
At the end of experiments 1, 2 and 3 we collected samples from the biofilm, which covered the column packing material for its characterization. The perlite and the glass beads and rings used as column filling were emptied in a glass beaker to which saline solution (0.9% sodium chloride) was added. The beaker was placed in an ultrasonic water bath (Bransonic 5, Branson) for three minutes. After sonication the volume was brought up to a total of 500 ml and 1000 µl-aliquots were centrifuged 5 min at 12000 g (Hettich Mikro 20). The samples were then stored at –20ºC until DNA extraction was carried out. Also, a piece of Ebro Delta microbial mat used as inoculum was stored for further DNA extraction.
Nucleic acid extraction of the inoculum, frozen pellets, and polycarbonate filters was performed as described by Massana et al. [36]. Samples were suspended in 2 ml of lysis buffer (50 mM Tris-HCl, pH 8.3; 40 mM EDTA, pH 8.0; 0.75 M sucrose). 0.5-mm-diameter sterile glass beads were added to the samples, and vortexed in order to disrupt the cells. DNA was extracted using the lysis/phenol extraction method as described below. Lysozyme (1 mg·ml-1 final concentration) was added and samples were incubated at 37ºC for 45 min in slight movement. Then, sodium dodecyl sulphate (1% final concentration) and proteinase K (0.2 mg·ml-1 final concentration) were added and samples were incubated at 55ºC for 60 min in slight movement. Nucleic acids were extracted twice with phenol-chloroform-isoamyl alcohol (25:24:1, vol:vol:vol), and the residual phenol was removed once with choloroform-isoamyl alcohol (24:1, vol:vol). Nucleic acids were purified, desalted and concentrated with a Centricon-100 concentrator (Millipore). DNA integrity was checked by agarose gel electrophoresis, and quantified using a low DNA mass ladder as a standard (Invitrogen).
Fragments of the 16S rRNA gene suitable for DGGE analysis were obtained by using the bacterial specific primer 357f with a 40 bp GC-clamp, and the universal primer 907rM [38, 49; table 2]. PCR was carried out with a Biometra thermal cycler using the following programme: initial denaturation at 94°C for 5 min; 10 touchdown cycles of denaturation (at 94°C for 1 min), annealing (at 65–55°C for 1 min, decreasing 1°C each cycle) and extension (at 72°C for 3 min); 20 standard cycles (annealing at 55°C, 1 min) and a final extension at 72°C for 5 min.
Table 2. Primers used in this study for DGGE and clone libraries
Target Primera Sequence (5’ to 3’)
Bacteria - DGGE 357fb 907rM
CCT ACG GGA GGC AGC AG CCG TCA ATT CMT TTG AGT TT
Cyanobacteria - DGGE CYA359fb CYA781r(a)c CYA781r(b)c
GGG GAA TYT TCC GCA ATG GGd GAC TAC TGG GGT ATC TAA TCC CAT T GAC TAC AGG GGT ATC TAA TCC CTT T
Bacteria – clone library 27f 1492r
AGA GTT TGA TCC TGG CTC AG GGT TAC CTT GTT ACG ACT T
a Escherichia coli numbering of 16S rRNA nucleotides b Primer with a 40-bp clamp at the 5’ end c Reverse primer CYA781r was an equimolar mixture of CYA781r(a) and CYA781r(b) d Y, a C/T nucleotide degeneracy
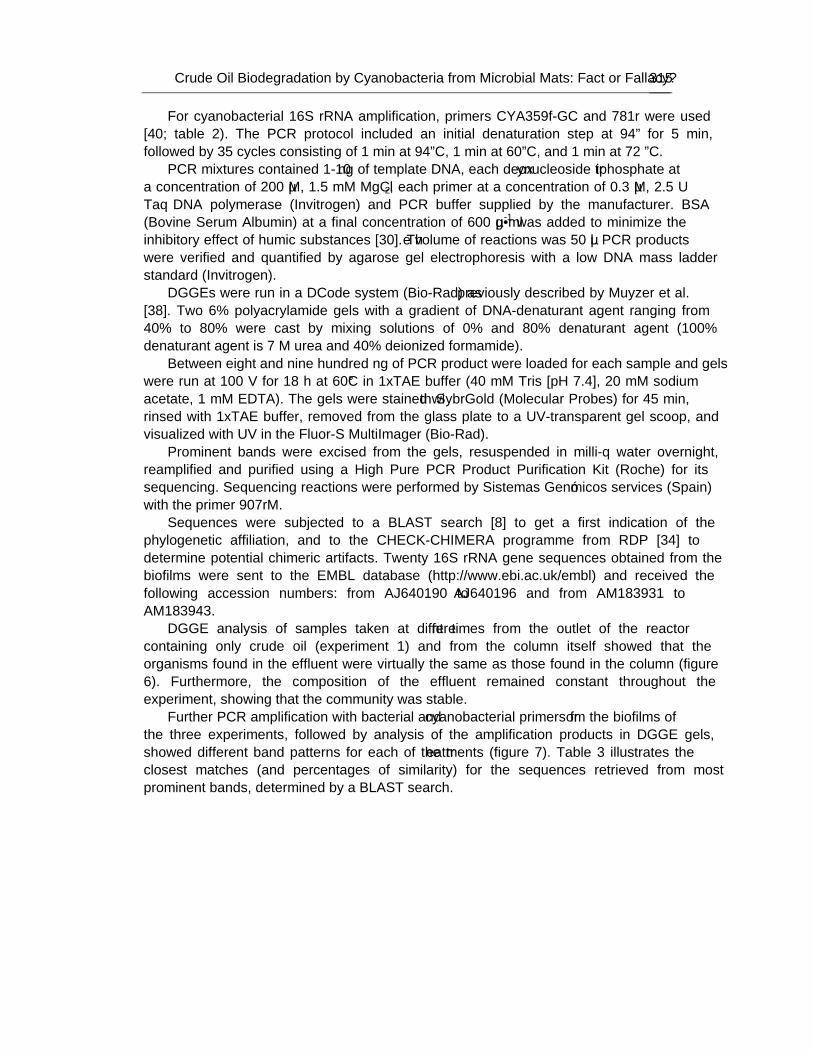
Crude Oil Biodegradation by Cyanobacteria from Microbial Mats: Fact or Fallacy? 315
For cyanobacterial 16S rRNA amplification, primers CYA359f-GC and 781r were used [40; table 2). The PCR protocol included an initial denaturation step at 94º for 5 min, followed by 35 cycles consisting of 1 min at 94ºC, 1 min at 60ºC, and 1 min at 72 ºC.
PCR mixtures contained 1-10 ng of template DNA, each deoxynucleoside triphosphate at a concentration of 200 µM, 1.5 mM MgCl2, each primer at a concentration of 0.3 µM, 2.5 U Taq DNA polymerase (Invitrogen) and PCR buffer supplied by the manufacturer. BSA (Bovine Serum Albumin) at a final concentration of 600 µg·ml-1 was added to minimize the inhibitory effect of humic substances [30]. The volume of reactions was 50 µl. PCR products were verified and quantified by agarose gel electrophoresis with a low DNA mass ladder standard (Invitrogen).
DGGEs were run in a DCode system (Bio-Rad) as previously described by Muyzer et al. [38]. Two 6% polyacrylamide gels with a gradient of DNA-denaturant agent ranging from 40% to 80% were cast by mixing solutions of 0% and 80% denaturant agent (100% denaturant agent is 7 M urea and 40% deionized formamide).
Between eight and nine hundred ng of PCR product were loaded for each sample and gels were run at 100 V for 18 h at 60°C in 1xTAE buffer (40 mM Tris [pH 7.4], 20 mM sodium acetate, 1 mM EDTA). The gels were stained with SybrGold (Molecular Probes) for 45 min, rinsed with 1xTAE buffer, removed from the glass plate to a UV-transparent gel scoop, and visualized with UV in the Fluor-S MultiImager (Bio-Rad).
Prominent bands were excised from the gels, resuspended in milli-q water overnight, reamplified and purified using a High Pure PCR Product Purification Kit (Roche) for its sequencing. Sequencing reactions were performed by “Sistemas Genómicos” services (Spain) with the primer 907rM.
Sequences were subjected to a BLAST search [8] to get a first indication of the phylogenetic affiliation, and to the CHECK-CHIMERA programme from RDP [34] to determine potential chimeric artifacts. Twenty 16S rRNA gene sequences obtained from the biofilms were sent to the EMBL database (http://www.ebi.ac.uk/embl) and received the following accession numbers: from AJ640190 to AJ640196 and from AM183931 to AM183943.
DGGE analysis of samples taken at different times from the outlet of the reactor containing only crude oil (experiment 1) and from the column itself showed that the organisms found in the effluent were virtually the same as those found in the column (figure 6). Furthermore, the composition of the effluent remained constant throughout the experiment, showing that the community was stable.
Further PCR amplification with bacterial and cyanobacterial primers from the biofilms of the three experiments, followed by analysis of the amplification products in DGGE gels, showed different band patterns for each of the treatments (figure 7). Table 3 illustrates the closest matches (and percentages of similarity) for the sequences retrieved from most prominent bands, determined by a BLAST search.
Olga Sánchez and Jordi Mas 316
Figure 6. Negative image of a DGGE gel of samples taken at different times (10, 25, 35, 44, 51, 78 days) from the effluent of the oil-containing reactor (experiment 1), and amplified with primers for bacteria. For the sake of comparison, a sample from the inoculum (I) and a sample from the final biofilm (C) have also been included (extracted from Sánchez et al. [48]).
Figure 7. Negative images of DGGE gels with PCR products amplified with bacterial and cyanobacterial primer sets from samples of the column biofilms. The three sets of experiments, which differ in carbon source, are included (E1: crude oil, E3: carbonate+crude oil, E2: carbonate). No cyanobacterial PCR product was obtained when crude oil was the only carbon source.
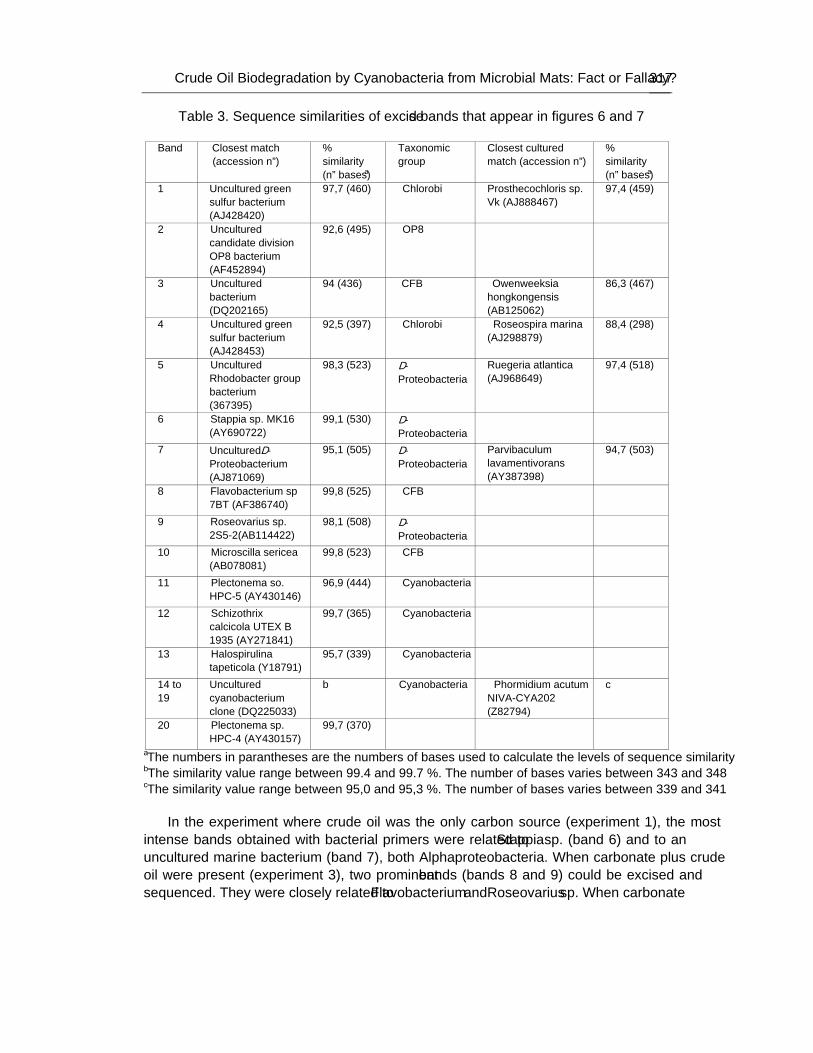
Crude Oil Biodegradation by Cyanobacteria from Microbial Mats: Fact or Fallacy? 317
Table 3. Sequence similarities of excised bands that appear in figures 6 and 7
Band Closest match (accession nº)
% similarity (nº bases)a
Taxonomic group
Closest cultured match (accession nº)
% similarity (nº bases)a
1
Uncultured green sulfur bacterium (AJ428420)
97,7 (460) Chlorobi
Prosthecochloris sp. Vk (AJ888467)
97,4 (459)
2 Uncultured candidate division OP8 bacterium (AF452894)
92,6 (495) OP8
3 Uncultured bacterium (DQ202165)
94 (436) CFB Owenweeksia hongkongensis (AB125062)
86,3 (467)
4 Uncultured green sulfur bacterium (AJ428453)
92,5 (397) Chlorobi Roseospira marina (AJ298879)
88,4 (298)
5 Uncultured Rhodobacter group bacterium (��367395)
98,3 (523) α- Proteobacteria
Ruegeria atlantica (AJ968649)
97,4 (518)
6 Stappia sp. MK16 (AY690722)
99,1 (530) α- Proteobacteria
7 Uncultured α- Proteobacterium (AJ871069)
95,1 (505) α- Proteobacteria
Parvibaculum lavamentivorans (AY387398)
94,7 (503)
8 Flavobacterium sp 7BT (AF386740)
99,8 (525) CFB
9 Roseovarius sp. 2S5-2(AB114422)
98,1 (508) α- Proteobacteria
10 Microscilla sericea (AB078081)
99,8 (523) CFB
11 Plectonema so. HPC-5 (AY430146)
96,9 (444) Cyanobacteria
12 Schizothrix calcicola UTEX ‘B 1935’ (AY271841)
99,7 (365) Cyanobacteria
13 Halospirulina tapeticola (Y18791)
95,7 (339) Cyanobacteria
14 to 19
Uncultured cyanobacterium clone (DQ225033)
b Cyanobacteria Phormidium acutum NIVA-CYA202 (Z82794)
c
20 Plectonema sp. HPC-4 (AY430157)
99,7 (370)
aThe numbers in parantheses are the numbers of bases used to calculate the levels of sequence similarity bThe similarity value range between 99.4 and 99.7 %. The number of bases varies between 343 and 348 cThe similarity value range between 95,0 and 95,3 %. The number of bases varies between 339 and 341
In the experiment where crude oil was the only carbon source (experiment 1), the most intense bands obtained with bacterial primers were related to Stappia sp. (band 6) and to an uncultured marine bacterium (band 7), both Alphaproteobacteria. When carbonate plus crude oil were present (experiment 3), two prominent bands (bands 8 and 9) could be excised and sequenced. They were closely related to Flavobacterium and Roseovarius sp. When carbonate
Olga Sánchez and Jordi Mas 318
was the only carbon source (experiment 2), the most intense band (band 11) was closely affiliated to the filamentous cyanobacteria Plectonema sp.
PCR amplification with cyanobacterial primers 359f-GC and 781r could not detect the presence of cyanobacteria when crude oil was used as the only carbon source. On the contrary, when carbonate was present in the medium, with or without oil, amplification was observed. DGGE analysis of these samples showed different band patterns (figure 7). When carbonate was the only carbon source, a single band was observed corresponding to Plectonema sp. When both carbonate and oil were present, several bands could be detected belonging to the order Oscillatoriales.
Several studies exist claiming a direct role of cyanobacteria in hydrocarbon utilization [4, 12, 13, 39, 44]. However, we did not detect the growth of cyanobacteria attached to the column at the end of the experiment when crude oil was the only carbon source. Microscopic observations showed that the first days cyanobacteria were present in the culture overflow, but they disappeared after a few days and where replaced by a nondistinct population of rod-shaped bacteria of different sizes. At the end of the experiment, 16S rRNA gene molecular analysis by DGGE and PCR amplification using cyanobacterial primers pointed to the absence of cyanobacteria in the biofilm. This result shows that cyanobacteria would not be actively degrading crude oil since they were washed out by the system, and that bacteria would have a more important role in petroleum biodegradation in microbial mats. Growth of cyanobacteria from Ebro Delta microbial mats was only detected when carbonate was added to the medium, indicating that they needed this carbon source for their growth instead of crude oil (figure 8). The appearance of cyanobacteria when crude oil and carbonate were present showed also that hydrocarbons were not toxic at least for some of these organisms.
We also investigated the composition of the final bacterial population from experiment 1 by another molecular technique, a clone library, in order to carry out a precise phylogenetic analysis of the final community. For cloning, the bacterial 16S rRNA gene was amplified using primers 27f and 1492r (table 2). PCR mixtures contained 10 ng of template DNA, each deoxynucleoside triphosphate at a concentration of 200 µM, 1.5 mM MgCl2, each primer at a concentration of 0.3 µM, 2.5 U Taq DNA polymerase (Invitrogen) and PCR buffer supplied by the manufacturer. Reactions were carried out in an automated thermocycler (Biometra) with the following cycle: an initial denaturation step at 94ºC for 5 min, followed by 30 cycles of 1 min at 94ºC, 1 min at 55ºC and 2 min at 72ºC, and a final extension step of 10 min at 72ºC.
The PCR product was cloned with the TOPO TA cloning kit (Invitrogen) according to manufacturer’s instructions. Ninety-five putative positive colonies were picked, transferred to a multi-well plate containing Luria-Bertani medium and 7% glycerol, and stored at –80ºC. Recombinant plasmids were extracted using the QIAprep spin miniprep kit (QIAgen), following manufacturer’s instructions. Purified plasmids were digested at 37ºC overnight with HaeIII (Invitrogen) and the product was run in 2.5% low melting point agarose gel. Fourty-eight clones with different band patterns were chosen for partial sequencing. The coverage of the clone library was calculated according to the following equation: C=1-(n/N), where n is the number of unique clones and N is the total number of clones examined [46]. The coverage value was 73%, which indicated that most of the diversity had been determined.
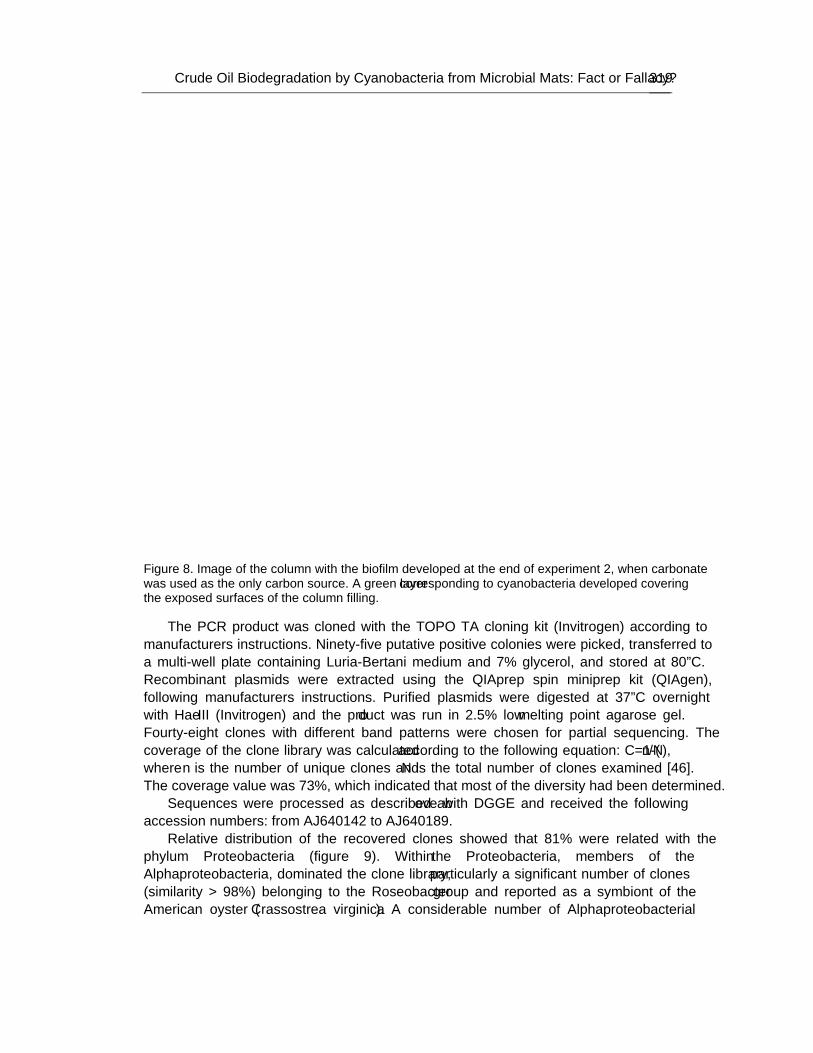
Crude Oil Biodegradation by Cyanobacteria from Microbial Mats: Fact or Fallacy? 319
Figure 8. Image of the column with the biofilm developed at the end of experiment 2, when carbonate was used as the only carbon source. A green layer corresponding to cyanobacteria developed covering the exposed surfaces of the column filling.
The PCR product was cloned with the TOPO TA cloning kit (Invitrogen) according to manufacturer’s instructions. Ninety-five putative positive colonies were picked, transferred to a multi-well plate containing Luria-Bertani medium and 7% glycerol, and stored at –80ºC. Recombinant plasmids were extracted using the QIAprep spin miniprep kit (QIAgen), following manufacturer’s instructions. Purified plasmids were digested at 37ºC overnight with HaeIII (Invitrogen) and the product was run in 2.5% low melting point agarose gel. Fourty-eight clones with different band patterns were chosen for partial sequencing. The coverage of the clone library was calculated according to the following equation: C=1-(n/N), where n is the number of unique clones and N is the total number of clones examined [46]. The coverage value was 73%, which indicated that most of the diversity had been determined.
Sequences were processed as described above with DGGE and received the following accession numbers: from AJ640142 to AJ640189.
Relative distribution of the recovered clones showed that 81% were related with the phylum Proteobacteria (figure 9). Within the Proteobacteria, members of the Alphaproteobacteria, dominated the clone library, particularly a significant number of clones (similarity > 98%) belonging to the Roseobacter group and reported as a symbiont of the American oyster (Crassostrea virginica). A considerable number of Alphaproteobacterial

Olga Sánchez and Jordi Mas 320
clones was also related to well-known groups, but with lower similarities. Thus, several clones were similar to Roseivivax halodurans, a member of the Rhodobacteraceae.
������������������� ������� ������������ ��� ����������
������������������� ������������������ ��������� �������� ���������� ���������� ������������� ��� ����������
���������� ������� �������� ���
��� ����������������
�������� ����������������
Figure 9. Relative abundance (%) of phylogenetic groups in a 16S rRNA clone library from the biofilm recovered at the end of experiment 1 (crude oil as the only carbon source; extracted from Sánchez et al. [48]).
The Gammaproteobacteria constituted 36.8% of the clones, and several organisms closely related (similarity > 97%) to species of the genus Marinobacter (including Marinobacter hydrocarbonoclasticus) were identified within this phylum. Marinobacter sp. can usually be isolated from oil-contaminated sites and enriched on different hydrocarbons [24].
The presence of species of the genus Bacillus (Firmicutes or low G + C gram-positive bacteria) was also detected. In fact, many species belonging to the genus Bacillus have been isolated from petroleum-contaminated environments. For example, Sorkoh et al. [53] obtained 368 isolates belonging predominantly to the thermophilic B. stearothermophilus from oil-polluted areas in Kuwait. Other strains of Bacillus have been isolated from oil-polluted environments under high temperature [7], deep sea-ecosystems [9], contaminated seawater and marine sediments [57], and soils [45].
The Chlorobi group included 6.3% of the clones, while the CFB (Cytophaga-Flavobacterium-Bacteroides) was represented by only one clone.
The bacterial diversity of oil-polluted microbial mats has also been assessed by other investigators using molecular tools. Hernandez-Raquet et al. [27] studied the biodiversity of microbial mats inhabiting the oil-contaminated lagoon Etang de Berre and found as well that Gamma and Alphaproteobacteria were the most abundant groups, while Abed et al. [3] detected bacteria belonging to Beta-, Gammaproteobacteria, the CFB group and the green nonsulfur bacteria in microbial mats from Wadi Gaza (Palestine). Abed et al. [1] also showed that microbial mats from Saudi Arabia were rich in microorganisms able to degrade petroleum compounds at elevated salinities and temperatures; the molecular analyses revealed that bacteria belonging to Beta, Gamma and Deltaproteobacteria, Cytophaga-Flavobacterium-Bacteroides group and Spirochetes were abundant. On the other hand, Bordenave et al. [11] found that “Bacilli” and Alphaproteobacteria were the dominant microorganisms in petroleum contaminated microbial mats from Salins-de-Giraud (Camargue, France).
Crude Oil Biodegradation by Cyanobacteria from Microbial Mats: Fact or Fallacy? 321
ROLE OF CYANOBACTERIA IN OIL BIODEGRADATION Different authors attribute to cyanobacteria an important role in the biodegradation of
organic pollutants. Cerniglia et al. [12, 13] observed the degradation of naphthalene, a major component of the water-soluble fraction of crude oil, and byphenyl, by the same strain of Oscillatoria. It has also been reported phenanthrene metabolization by the unicellular marine cyanobacterium Agmenellum quadruplicatum PR-6 [39], and the filamentous Microcoleus chtonoplastes and Phormidium corium, isolated from microbial mats of the Arabian Gulf, consumed and oxidized n-alkanes [4]. The marine cyanobacteria Oscillatoria salina, Plectonema tenebrans and Aphanocapsa sp. degraded crude oil when grown in artificial medium and natural seawater [44].
However, Radwan and Al-Hasan [42] reported that part of the results showing cyanobacterial biodegradation activity were ambiguous, and consequently, no real abilities of cyanobacteria to degrade crude oil were demonstrated. It is by no means clear whether oil degradation is carried out by cyanobacteria alone or by heterotrophic bacteria associated to cyanobacteria. In our experiments, cyanobacteria were not able to grow utilizing hydrocarbons as carbon source, and other bacteria had a more important role in petroleum biodegradation. In fact, some studies point to the importance of heterotrophic bacteria in hydrocarbon degradation. Al-Hasan et al. [4] demonstrated that non-axenic cyanobacterial samples containing Microcoleus chthonoplastes and Phormidium corium consumed and oxidized n-alkanes. They found that cyanobacterial growth steadily declined with progressive axenity, and they identified four genera and species of associated heterotrophic bacteria able to oxidize n-alkanes, such as Rhodococcus rhodochrous, Arthrobacter nicotianae, Pseudomonas sp. and Bacillus sp., although cyanobacteria contributed directly to hydrocarbon uptake and oxidation. On the other hand, Al-Hasan et al. [5] demonstrated that picocyanobacteria from the Arabian Gulf accumulated hydrocarbons from the water body, but did not utilize these compounds, and the authors assumed that associated bacteria may be carrying out the degradation of these contaminants. Cohen [16], despite showing efficient degradation of crude oil by microbial mats, followed by development of an intense bloom of Phormidium spp. and Oscillatoria spp., concluded that isolated cyanobacterial strains were not able to degrade crude oil in axenic cultures; moreover, strains of sulfate-reducing bacteria and aerobic heterotrophs were capable of degrading model compounds of aliphatic and aromatic hydrocarbons. Furthermore, Abed and Köster [2] confirmed that Oscillatoria-associated aerobic heterotrophic bacteria were responsible for the biodegradation of n-alkanes. Also, Chaillan et al. [14] demonstrated that the cyanobacterium Phormidium animale, though originating from a highly active oil-contaminated Indonesian cyanobacterial mat, did not exhibit any degradative capacity either in autotrophic or heterotrophic conditions; on the contrary, the biodegradation activity was exclusively achieved by the other microorganisms present in the microbial consortium of the mat, such as heterotrophic bacteria and fungi [15].
On the other hand, Diestra et al. [19] have been able to isolate and characterize an oil-degrading Microcoleus chthonoplastes consortium. Ultrathin section of this cyanobacterium revealed the presence of different bacterial morphotypes inside the polysacharidic Microcoleus sheath. This consortium could grow in the presence of sulfur-rich petrolum, although the changes in crude oil composition were small, essentially involving degradation
Olga Sánchez and Jordi Mas 322
of aliphatic heterocyclic organo-sulfur compounds such as alkylthiolanes and alkylthianes [21]. Molecular characterization through the analysis of the 16S rRNA gene sequences of this consortium in cultures of Microcoleus grown in mineral medium and in cultures of the cyanobacterium grown in mineral medium supplemented with crude oil showed that most of the clones found in the polluted culture corresponded to well-known oil-degrading and nitrogen-fixing microorganisms [47]. They belonged to different phylogenetic groups, such as the Alpha, Beta, and Gamma subclasses of Proteobacteria, and the CFB (Cytophaga-Flavobacterium-Bacteroides). The control culture without oil was dominated by an organism closely affiliated to Pseudoxanthomonas mexicana (similarity of 99.8%) (figure 10).
���������� ������� ���
������������������� ������������������������ ������������������� ��������
������������������� ���������������� ������������������ ����������
�������������������
������������ ����������
������������������� ���������������� ������������ ��������������������� ��������������������� ��������������� �������������������������
������������������� ������� ����������� �������� ����������
������������������ ����������������
�������������������
Figure 10. Relative abundance (%) of phylogenetic groups in 16S rRNA clone libraries from oil-polluted and control cultures from a Microcoleus chthonoplastes consortium (extracted from Sánchez et al. [47]).
Although these investigations do not confirm the direct role of the accompanying heterotrophic bacteria in oil biodegradation, they suggest that the microorganisms associated with Microcoleus could be carrying out most of the nitrogen fixation and degradation of hydrocarbon compounds inside the polysaccharidic sheath. Thus, degradation of crude oil is unlikely to be characteristic for cyanobacteria, although they could play an indirect role in mixed populations such as microbial mats by supporting the growth and activity of the actual degraders. Cyanobacteria would provide a habitat and a readily available source of oxygen
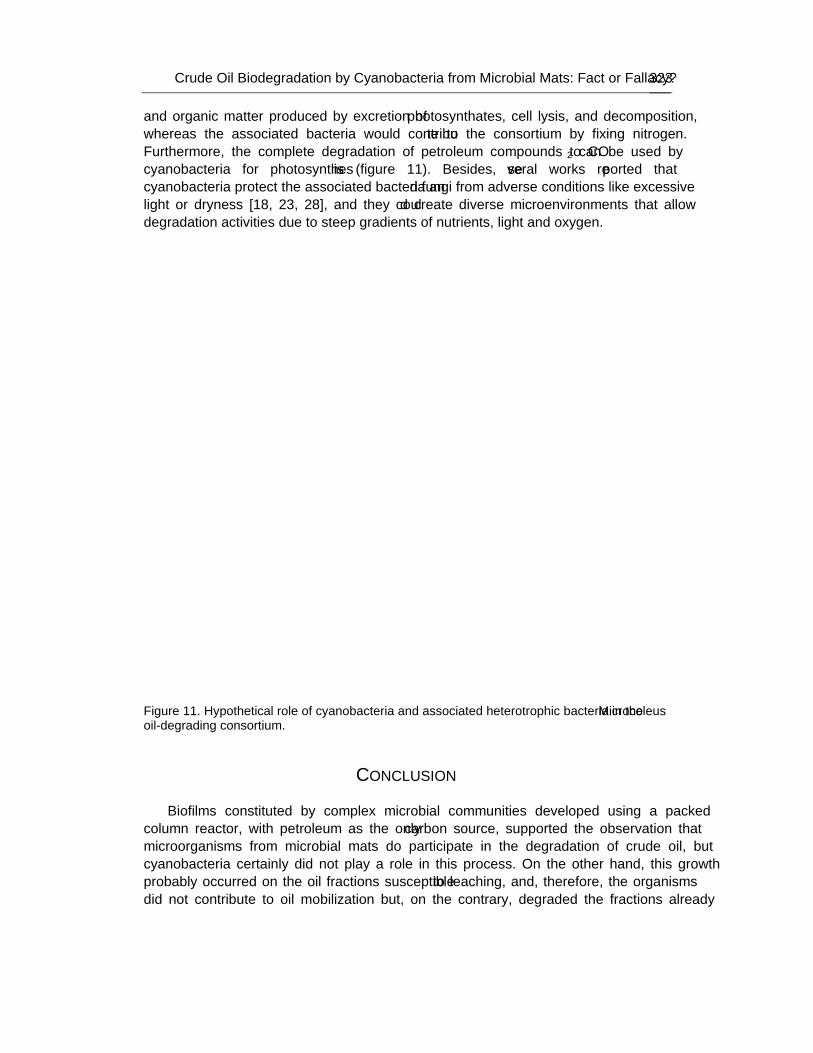
Crude Oil Biodegradation by Cyanobacteria from Microbial Mats: Fact or Fallacy? 323
and organic matter produced by excretion of photosynthates, cell lysis, and decomposition, whereas the associated bacteria would contribute to the consortium by fixing nitrogen. Furthermore, the complete degradation of petroleum compounds to CO2 can be used by cyanobacteria for photosynthesis (figure 11). Besides, several works reported that cyanobacteria protect the associated bacteria and fungi from adverse conditions like excessive light or dryness [18, 23, 28], and they could create diverse microenvironments that allow degradation activities due to steep gradients of nutrients, light and oxygen.
Figure 11. Hypothetical role of cyanobacteria and associated heterotrophic bacteria in the Microcoleus oil-degrading consortium.
CONCLUSION
Biofilms constituted by complex microbial communities developed using a packed
column reactor, with petroleum as the only carbon source, supported the observation that microorganisms from microbial mats do participate in the degradation of crude oil, but cyanobacteria certainly did not play a role in this process. On the other hand, this growth probably occurred on the oil fractions susceptible to leaching, and, therefore, the organisms did not contribute to oil mobilization but, on the contrary, degraded the fractions already
Olga Sánchez and Jordi Mas 324
mobilized by abiotic means. DNA-based molecular tools showed that oil-polluted microbial mats contain significant hidden diversity of unknown and uncultured microorganisms that can contribute to oil biodegradation. Therefore, further attempts to isolate the key microorganisms involved in these processes will be essential in order to explore the individual degradation capacity of hydrocarbon compounds.
ACKNOWLEDGEMENTS This work was supported by the Spanish projects Consolider TRAGUA (CSD2006-
00044), TEC2006-13109-C02-02/MIC and PET2008-0165-02.
REFERENCES
[1] Abed, R. M. M., Al-Thukair, A. & de Beer, D. (2006). Bacterial diversity of a cyanobacterial mat degrading compounds at elevated salinities and temperatures. FEMS Microbiology Ecology, 57, 290-301.
[2] Abed, R. M. M. & Köster, J. (2005). The direct role of aerobic heterotrophic bacteria associated with cyanobacteria in the degradation of oil compounds. International Biodeterioration and Biodegradation, 55, 29-37.
[3] Abed, R. M. M., Safi, N. M. D., Köster, J., de Beer, D., El-Nahhal, Y., Rullkötter, J. & García-Pichel, F. (2002). Microbial diversity of a heavily polluted microbial mat and its community changes following degradation of petroleum compounds. Applied and Environmental Microbiology, 68, 1674-83.
[4] Al-Hasan, R. H., Al-Bader, D. A., Sorkhoh, N. A. & Radwan, S. S. (1998). Evidence for n-alkane consumption and oxidation by filamentous cyanobacteria from oil-contaminated coasts of the Arabian Gulf. Marine Biology, 130, 521-27.
[5] Al-Hasan, R. H., Khanafer, M., Eliyas, M. & Radwan, S. S. (2001). Hydrocarbon accumulation by picocyanobacteria from the Arabian Gulf. Journal of Applied Microbiology, 91, 533-40.
[6] Al-Hasan, R. H., Sorkhoh, N. A., Al-Bader, D. A. & Radwan, S. S. (1994). Utilization of hydrocarbons by cyanobacteria from microbial mats on oily coasts of the Gulf. Applied Microbiology and Biotechnology, 41, 290-301.
[7] Al-Maghrabi, I. M. A., Bin Aquil, A. O., Isla, M. R. & Chaalal O. (1999). Use of thermophilic bacteria for bioremediation of petroleum compounds. Energy Sources, 21, 17-29.
[8] Altschul, S. F., Madden, T. L., Schäffer, A. A., Zhang, J., Zhang, Z., Miller W. & Lipman, D. J. (1997). Gapped BLAST and PSI-BLAST: a new generation of protein database search programs. Nucleic Acids Research, 25, 3389-3402.
[9] Aono, R. & Inoue, A. (1998). Organic solvent tolerance in microorganisms. In K. Horikoshi, & W. D. Grant (Eds.), Extremophiles: Microbial life in extreme environments (pp. 287-310). New York:Wiley-Liss.
Crude Oil Biodegradation by Cyanobacteria from Microbial Mats: Fact or Fallacy? 325
[10] Bode, A., González, N., Lorenzo, J., Valencia, J., Varela, M. M. & Varela, M. (2006). Enhanced bacterioplankton activity after the ‘Prestige’ oil spill off Galicia, NW Spain. Aquatic Microbial Ecology, 43, 33-41.
[11] Bordenave, S., Goñi-Urriza, M. S., Caumette, P. & Duran, R. (2007). Effect of heavy fuel oil on the bacterial community structure of a pristine microbial mat. Applied and Environmental Microbiology, 73, 6089-97.
[12] Cerniglia, C. E., Van Baalen, C. & Gibson, D. T. (1980). Metabolism of naphtalene by the cyanobacterium Oscillatoria sp., strain JCM. Archives of Microbiology, 125, 485-94.
[13] Cerniglia, C. E., Van Baalen, C. & Gibson, D. T. (1980). Oxidation of biphenyl by the cyanobacterium Oscillatoria sp., strain JCM. Archives of Microbiology, 125, 203-7.
[14] Chaillan, F., Gugger, M., Saliot, A., Couté, A. & Oudot, J. (2006). Role of cyanobacteria in the biodegradation of crude oil by a tropical cyanobacterial mat. Chemosphere, 62, 1574-82.
[15] Chaillan, F., Le Flèche, A., Bury, E., Phantavong, Y., Grimont, P., Saliot, A. & Oudot, J. (2004). Identification and biodegradation potential of tropical aerobic hydrocarbon-degrading microorganisms. Research in Microbiology, 155, 587-95.
[16] Cohen, Y. (2002). Bioremediation of oil by marine microbial mats. International Microbiology, 5, 189-93.
[17] Connan, J. (1984). Biodegradation of crude oils in reservoirs, vol. 1. London:Academic Press.
[18] Des Marais, D. J. (2003). Biogeochemistry of hypersaline microbial mats illustrates the dynamics of modern microbial ecosystems and the early evolution of the biosphere. The Biological Bulletin, 204, 160-7.
[19] Diestra, E., Solé, A., Martí, M., García de Oteyza, T., Grimalt, J. O. & Esteve, I. (2005). Characterization of an oil-degrading Microcoleus consortium by means of confocal scanning microscopy, scanning electron microscopy and transmission electron microscopy. Scanning, 27, 176-80.
[20] Ferrera, I., Sánchez, O. & Mas, J. (2004). A new non-aerated illuminated packed column reactor for the development of sulfide-oxidizing biofilms. Applied Microbiology and Biotechnology, 64, 659-64.
[21] García de Oteyza, T., Grimalt, J. O., Diestra, E., Solé, T. & Esteve, I. (2004). Changes in the composition of the polar and apolar crude oil fractions under the action of Microcoleus consortia. Applied Microbiology and Biotechnology, 66, 226-32.
[22] García de Oteyza, T., Grimalt, J. O., Llirós, M. & Esteve, I. (2006). Microcosm experiments of oil degradation by microbial mats. Science of the Total Environment, 357, 12-24.
[23] García-Pichel, F. & Pringault, O. (2001). Microbiology: cyanobacteria track water in desert soils. Nature, 413, 380-1.
[24] Gauthier, M. J., Lafay, B., Christen, R., Fernandez, L., Acquaviva, M., Bonin, P. & Bertrand, J. C. (1992). Marinobacter hydrocarbonoclasticus gen nov, sp nov, a new, extremely halotolerant, hydrocarbon-degrading marine bacterium. International Journal of Systematic Bacteriology, 42, 568-76.
[25] Grötzschel, S., Köster, J., Abed, R. M. M. & de Beer, D. (2002). Degradation of petroleum compounds immobilized on clay by a hypersaline microbial mat. Biodegradation, 13, 273-83.
Olga Sánchez and Jordi Mas 326
[26] Guerrero, R., Urmeneta, J. & Rampone, G. (1993). Distribution of types of microbial mats at the Ebro Delta, Spain. Biosystems, 31, 135-44.
[27] Hernández-Raquet, G., Budzinski, H., Caumette, P., Dabert, P., Le Ménach, K., Muyzer, G. & Duran, R. (2006). Molecular diversity studies of bacterial communities of oil polluted microbial mats from the Etang de Berre (France). FEMS Microbiology Ecology, 58, 550-62.
[28] Joergensen, B. B. & Des Marais, D. J. (1998). Optical properties of benthic photosynthetic communities: fiber-optic studies of cyanobacterial mats. Limnology and Oceanography, 33, 99-113.
[29] Kirchman, D., Sigda, J, Kapuscinski, R. & Mitchell, R. (1982). Statistical analysis of the direct count method for enumerating bacteria. Applied and Environmental Microbiology, 44, 376-82.
[30] Kreader, C. A. (1996). Relief of amplification inhibition in PCR with bovine serum albumin or T4 gene 32 protein. Applied and Environmental Microbiology, 62, 1102-6.
[31] Kuo, L. C. (1994). An experimental study of crude oil alteration in reservoir rocks by water washing. Organic Geochemistry, 21, 465-79.
[32] Llirós, M., Gaju, N., García de Oteyza, T., Grimalt, J. O., Esteve, I. & Martínez-Alonso, M. (2008). Microcosm experiments of oil degradation by microbial mats. II. The changes in microbial species. Science of the Total Environment, 393, 39-49.
[33] Macnaughton, S. J., Stephen, J. R., Venosa, A. D., Davis, G. A., Chang Y-J. & White, D. C. (1999). Microbial population changes during bioremediation of an experimental oil spill. Applied and Environmental Microbiology, 65, 3566-74.
[34] Maidak, B. L., Cole, J. R., Lilburn, T. G., Parker, C. T. Jr., Saxman, P. R., Stredwick, J. M., Garrity, G. M., Li, B., Olsen, G. J., Pramanik, S., Schmidt, T. M. & Tiedje, J. M. (2000). The RDP (Ribosomal Database Project) continues. Nucleic Acids Research, 28, 73-174.
[35] Martínez-Alonso, M., Mir, J., Caumette, P., Gaju, N., Guerrero, R. & Esteve, I. (2004). Distribution of phototrophic populations and primary production in a microbial mat from the Ebro Delta, Spain. International Microbiology, 7, 19-25.
[36] Massana, R., Murray, A. E., Preston, M. & DeLong, E. F. (1997). Vertical distribution and phylogenetic characterization of marine planktonic Archaea in the Santa Barbara Channel. Applied and Environmental Microbiology, 63, 50-6.
[37] Megharaj, M., Singleton, I., McClure, N. C. & Naidu, R. (2000). Influence of petroleum hydrocarbon contamination on microalgae and microbial activities in a long-term contaminated soil. Environmental Contamination and Toxicology, 38, 439-45.
[38] Muyzer, G. Brinkhoff, T., Nübel, U., Santegoeds, C., Schäfer, H. & Wawer, C. (1998). Denaturing gradient gel electrophoresis (DGGE) in microbial ecology. In A. D. L. Akkermans, J. D. van Elsas, & F. J. Brujin (Eds.), Molecular Microbial Ecology Manual, vol. 3.4.4. (pp. 1-27). Dordrecht: Academic Publishers.
[39] Narro, M. L., Cerniglia, C. E., Van Baalen, C. & Gibson, D. T. (1992). Metabolism of phenanthrene by the marine cyanobacterium Agmenellum triplicatum PR-6. Applied and Environmental Microbiology, 58, 1351-59.
[40] Nübel, U., García-Pichel, F. & Muyzer, G. (1997). PCR primers to amplify 16S rRNA genes from cyanobacteria. Applied and Environmental Microbiology, 63, 3327-32.
[41] Porter, K. G. & Feig, Y. S. (1980). The use of DAPI for identifying and counting aquatic microflora. Limnology and Oceanography, 25, 943-8.
Crude Oil Biodegradation by Cyanobacteria from Microbial Mats: Fact or Fallacy? 327
[42] Radwan, S. S. & Al-Hasan, R. H. (2000). Oil pollution and cyanobacteria. In B. A. Whitton, & M. Potts (Eds.), The ecology of cyanobacteria: their diversity in time and space (pp. 307-19). Dordrecht, The Netherlands:Kluwer Academic Publishers.
[43] Radwan, S. S., Al-Hasan, R. H., Al-Awadhi, H., Salamah, S. & Abdullah, H. M. (1999). Higher oil biodegradation potential at the Arabian Gulf coast than in the water body. Marine Biology, 135, 741-5.
[44] Raghukumar, C., Vipparty, V., David,J. J. & Chandramohan, D. (2001). Degradation of crude oil by cyanobacteria. Applied Microbiology and Biotechnology, 57, 433-6.
[45] Rahman, K. S., Rahman, T., Lakshmanaperumalsamy, P. & Banat, I. M. (2002). Occurrence of crude oil degrading bacteria in gasoline and diesel station soils. Journal of Basic Microbiology, 42, 284-91.
[46] Ravenschlag, K., Sahm, K., Pernthaler, J. & Amann, T. (1999). High bacterial diversity in permanently cold marine sediments. Applied and Environmental Microbiology, 65, 3982-9.
[47] Sánchez, O., Diestra, E., Esteve, I. & Mas, J. (2005). Molecular characterization of an oil-degrading cyanobacterial consortium. Microbial Ecology, 50, 580-8.
[48] Sánchez, O., Ferrera, I., Vigués, N., García de Oteyza, T., Grimalt, J. & Mas, J. (2006). Role of cyanobacteria in oil biodegradation by microbial mats. International Biodeterioration and Biodegradation, 58, 186-95.
[49] Sánchez, O., Gasol, J. M., Massana, R., Mas, J. & Pedrós-Alió, C. (2007). Comparison ot different denaturing gradient gel electrophoresis primer sets for the study of marine bacterioplankton communities. Applied and Environmental Microbiology, 73, 5962-7.
[50] Sauer, T. S., Michel, J., Hayes, M. O. & Aurand, D. V. (1998). Hydrocarbon characterization and weathering of oiled intertidal sediments along the Saudi Arabian coast two years after the Gulf war oil spill. Environment International, 24, 43-60.
[51] Saul, D. J., Aislabie, J. M., Brown, C. E., Harris, L. & Foght, J. M. (2005). Hydrocarbon contamination changes the bacterial diversity of soil from around Scott Base, Antarctica. FEMS Microbiology Ecology, 53, 141-55.
[52] Sorkhoh, N. A., Al-Hasan, R. H., Radwan, S. S. & Höpner, T. (1992). Self-cleaning of the Gulf. Nature, 359, 109.
[53] Sorkhoh, N. A., Ibrahim, A. S., Ghannoum, M. A. & Radwan, S. S. (1993) High-temperature hydrocarbon degradation by Bacillus stearothermophilus from oil-polluted Kuwait desert. Applied Microbiology and Biotechnology, 39, 123-6.
[54] Urmeneta, J., Navarrete, A., Huete, J. & Guerrero, R. (2003). Isolation and characterization of cyanobacteria from microbial mats of the Ebro Delta, Spain. Current Microbiology, 46, 199-204.
[55] Van den Ende, F. P. & Van Gemerden, H. (1994). Relationship between functional groups of organisms in microbial mats. In L. J. Stal & P. Caumette (Eds), NATO ASI Series (Vol G 35). Berlin: Springer-Verlag.
[56] Van Gemerden, H. (1994). Microbial mats: a joint venture. Marine Geology, 113, 3-25. [57] Zhuang, W. Q., Tay, J. H., Maszenan, A. M., Krumholz, L. R. & Tay, S. T. L. (2003).
Importance of gram-positive naphtalene-degrading bacteria in oil-contaminated tropical marine sediments. Letters of Applied Microbiology, 36, 251-77..

In: Handbook on Cyanobacteria ISBN: 978-1-60741-092-8 Editors: P. M. Gault and H. J. Marler © 2009 Nova Science Publishers, Inc.
Chapter 11
BIOLUMINESCENCE REPORTER SYSTEMS FOR MONITORING GENE EXPRESION
PROFILE IN CYANOBACTERIA
Shinsuke Kutsuna*1 and Setsuyuki Aoki2 1 International Graduate School of Arts and Sciences, Yokohama City University, 22-2 Seto, Kanazawa-ku,
Yokohama 236-0027, Japan 2 Graduate School of Information Science, Nagoya University,
Furo-cho, Chikusa-ku, Nagoya 464-8601, Japan
ABSTRACT
In cyanobacteria, bioluminescence reporters have been applied to the measurement of physiological phenomenon, such as in the study of circadian clock and nitrite, ferric, and light responses. Cyanobacterial researchers have so far used several types of bioluminescence reporter systems—consisting of luminescence genes, genetically tractable host cells, and a monitoring device—because their studies require a method that offers gene expression data with high fidelity, high resolution for time, and enough dynamic range in data collection. In addition, no extraction of the products of the reporter gene from the culture is required to measure the luminescence, even in the living cell. In this chapter, applications using the bioluminescence genes luxAB (and luxCDE for substrate production) and insect genes are introduced. For measurement and imaging, general apparatuses, such as a luminometer and a luminoimager, have been used with several methods of substrate administration. Automated bioluminescence monitoring apparatuses were also newly developed. The initial machine was similar to that used to measure the native circadian rhythms in bioluminescence of the marine dinoflagellate Gonyaulax polyedra. Then, the machine with a cooled CCD camera which was automatically operated by a computer was used to screen mutant colonies representing abnormal bioluminescence profile or level from a mutagen-treated cyanobacterial cell with a luxAB reporter. Recently, different two promoter activities could be examined in the same cell culture and with the same timing by using railroad-worm luciferase genes.
* Corresponding author: Shinsuke Kutsuna; TEL & FAX: +81-45-787-2401; e-mail: [email protected]
Shinsuke Kutsuna and Setsuyuki Aoki 330
The bioluminescence rhythm monitoring technology of the living single-cell in micro chamber was developed. These might expand our knowledge to understand other cyanobacterial fields and microorganisms. Here, we provide a guide on the genes, the targeting loci in the genome, the apparatus and machines, and the studies utilizing the bioluminescence.
INTRODUCTION The reporter genes that produce luciferase or fluorescence proteins have been applied to
examine expression or localization of tested genes (or the gene products) in cyanobacterial cells (Elhai and Wolk 1990, Zang 2006, Chabot 2007). Luminescence genes have been used in organisms to dissect their molecular aspects (Kondo 1993, Maeda 1998, Michel 2001, Nair 2001). The photon-counting-based systems are composed of a luciferase reporter gene, host-vector combination, and bioluminescence monitoring apparatus. In present molecular biological studies, luciferase genes derived from bacteria, copepod, noctiluca, railroad worm, firefly and other organisms are used (Elhai and Walk 1990, Ruecker 2008, Yamagishi 2006, Kitayama 2007, Mackey 2007). While several analytical device suppliers and researchers provide the monitoring apparatuses by which we can measure bioluminescence for longer than a week (Millar 1992, Kondo 1993, Kondo and Ishiura 1994, Okamoto 2005 & 2007), adequate choices or settings of the system for cyanobacteria should be introduced for practical applications (Fernández-Piñas 2000, Andersson 2000, Mackey 2007), such as interference for measurements of auto-fluorescence of chlorophyll. In addition, the enzymatic activity and the light wavelength of most luciferases are significantly dependent on measurement conditions (i.e., temperature and pH) including changes in intracellular metabolisms due to experimental stimuli. Therefore, the obtained luminescence data representing gene expression level should be confirmed by RNA blotting or real-time RT-PCR analysis. Notwithstanding these critical concerns regarding bioluminescence monitoring, reporter genes have significant value because their resolution in analytical time and signal-noise ratio (S/N) are significantly high. In addition, they are noninvasive to the cell in a long-term experiment. The linearity on the correlation between numbers of luciferase molecules and photons expands in a broad dynamic range, suggesting the potentiality of the establishment of a useful and reliable measurement system for gene expression. These properties are due to the quantification of the signal photon and short half life of the reporter proteins. There are no reports of side effects caused by the luciferase expressed in cyanobacteria even by using high level expression promoter PpsbAI or an E. coli synthetic promoter Ptrc. The high S/N of the signal allows the possibility of a representative experiment of the gene expressed at a low level. In addition, the properties of luciferase are suitable for the mapping of the cis-acting element of a promoter or screening of an expression mutant in colonies. In this chapter, differences of luciferases, the experiments, and luminescence monitoring apparatuses are introduced.
Bioluminescence Reporter Systems for Monitoring Gene Expresion Profile… 331
I. LUCIFERASE USED IN CYANOBACTERIA The enzyme for bioluminescence luciferase has been isolated from a variety of
organisms, ranging from bacteria to eukaryotes such as the firefly, and applied to cyanobacterial study as a reporter of gene expression (table 1). Cyanobacteria inhabit fresh water, sea water, hot springs and land. Therefore, it is important to choose a luciferase suitable for the species of interst. The bacterial luciferase complex of LuxA and LuxB proteins has been expressed in the genome for a long time (Elhai &Wolk 1990). These enzymes were derived from marine luminous bacteria belonging to genera Vibrio, Photorhabdus, and Xhenorhabdus (table 2). The luminescence based on an enzymatic reaction, whose substrates are reduced flavin mononucleotide (FMNH2), long-chain aldehyde (RCHO), and oxygen, is shown below. The maximum rate of the reaction is observed at 28°C, while it is adequate between 15–35°C (Baldwin 1984, Mackey 2007, Hakkila 2002). Recently, Onai reported bioluminescence monitoring in Thermosynechococcus elongatus BP-1 by using the luxAB from Xenorhabdus luminescence in the thermophilic range (30–60°C; Onai 2004).
FMNH2 + RCHO + O2 <-> FMN + RCOOH + H2O + light (490 nm) In the cyanobacterial experiments with the enzyme, FMNH2 exists as the endogenous
metabolite, though generally the substrate aldehyde (n-decanal) must be administrated to the cell. For example, it is possible that vapor of n-decanal is absorbed by the cells even in a liquid medium. On the other hand, n-decanal emulsion prepared by sonication was directly added into an aliquot from a liquid culture and then its luminescence was immediately measured, as described in the paragraphs below (figure 1, Maeda 1998, Kondo 1993, Liu 1995, Hastings 1978). It is reasonable that the aldehyde is produced within the cell by introducing three heterogenous genes luxCDE in the genome (Mackey 2007).
While eukaryote luciferases from fireflies and railroad worms have different properties when functioning in a cyanobacterial cell (Mackey 2007, Kitayama 2004), these enzymes emit light with adenosine triphosphate (ATP), D-luciferin, and O2, as shown below:
ATP + D-luciferin + O2 <-> CO2 + AMP + PPi + oxyluciferin + light (560 nm, firefly) The solution of luciferin is directly added to the cell because of its weak toxicity. The one
different point among the enzymes is on emission spectrum. That of fireflies peak at 560 nm. Railroad-worms (Phrixothrix vivianii and Phrixothrix hirtus) have luciferases that emit wavelength at 549 and 622 nm, respectively. In addition to this feature, the railroad worm enzymes have wavelength stability against pH changes (Viviani 1999). Therefore, these two might become appropriate reporters in the cell. Kitayama introduced these genes as the reporter in the cell and distinguished the output of the green and red light from the obtained colony; thus, a real-time dual-reporter system has established in cyanobacteria (Kitayama 2007).
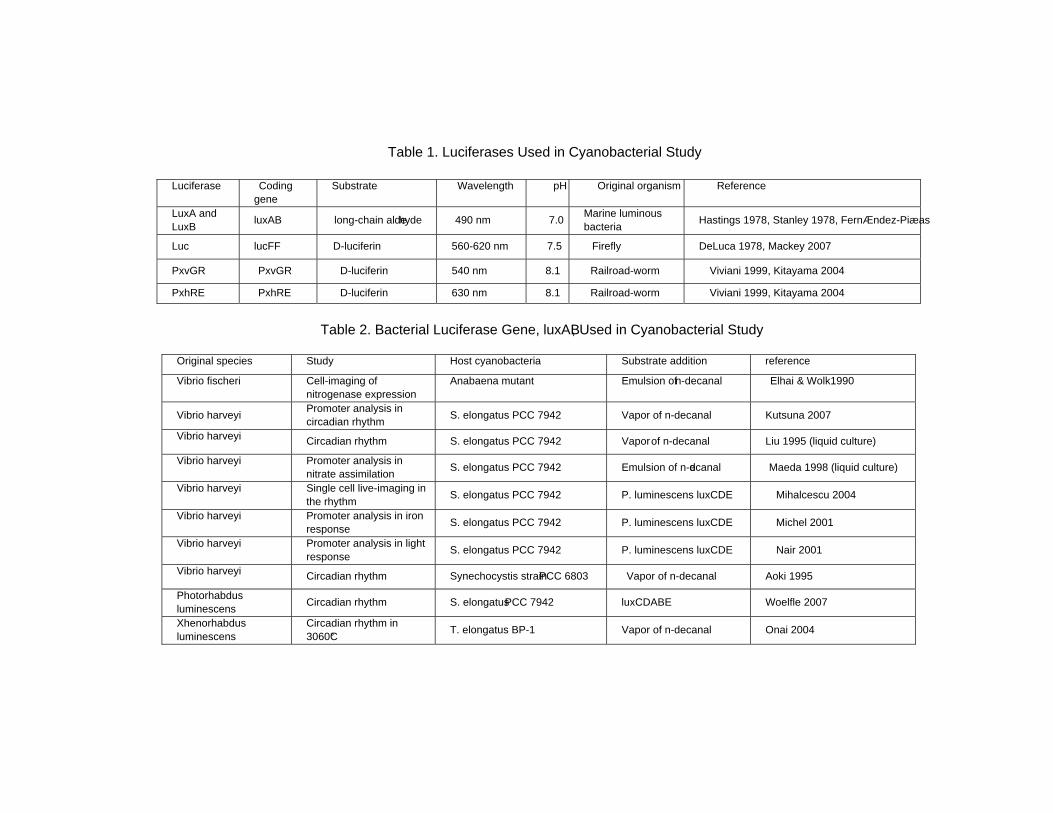
Table 1. Luciferases Used in Cyanobacterial Study
Luciferase Coding gene
Substrate Wavelength pH Original organism Reference
LuxA and LuxB luxAB long-chain aldehyde 490 nm 7.0 Marine luminous
bacteria Hastings 1978, Stanley 1978, Fernández-Piñas
Luc lucFF D-luciferin 560-620 nm 7.5 Firefly DeLuca 1978, Mackey 2007
PxvGR PxvGR D-luciferin 540 nm 8.1 Railroad-worm Viviani 1999, Kitayama 2004
PxhRE PxhRE D-luciferin 630 nm 8.1 Railroad-worm Viviani 1999, Kitayama 2004
Table 2. Bacterial Luciferase Gene, luxAB, Used in Cyanobacterial Study
Original species Study Host cyanobacteria Substrate addition reference
Vibrio fischeri Cell-imaging of nitrogenase expression
Anabaena mutant Emulsion of n-decanal Elhai & Wolk1990
Vibrio harveyi Promoter analysis in circadian rhythm S. elongatus PCC 7942 Vapor of n-decanal Kutsuna 2007
Vibrio harveyi Circadian rhythm S. elongatus PCC 7942 Vapor of n-decanal Liu 1995 (liquid culture)
Vibrio harveyi Promoter analysis in nitrate assimilation S. elongatus PCC 7942 Emulsion of n-decanal Maeda 1998 (liquid culture)
Vibrio harveyi Single cell live-imaging in the rhythm S. elongatus PCC 7942 P. luminescens luxCDE Mihalcescu 2004
Vibrio harveyi Promoter analysis in iron response S. elongatus PCC 7942 P. luminescens luxCDE Michel 2001
Vibrio harveyi Promoter analysis in light response S. elongatus PCC 7942 P. luminescens luxCDE Nair 2001
Vibrio harveyi Circadian rhythm Synechocystis strain PCC 6803 Vapor of n-decanal Aoki 1995
Photorhabdus luminescens Circadian rhythm S. elongatus PCC 7942 luxCDABE Woelfle 2007
Xhenorhabdus luminescens
Circadian rhythm in 30–60°C T. elongatus BP-1 Vapor of n-decanal Onai 2004
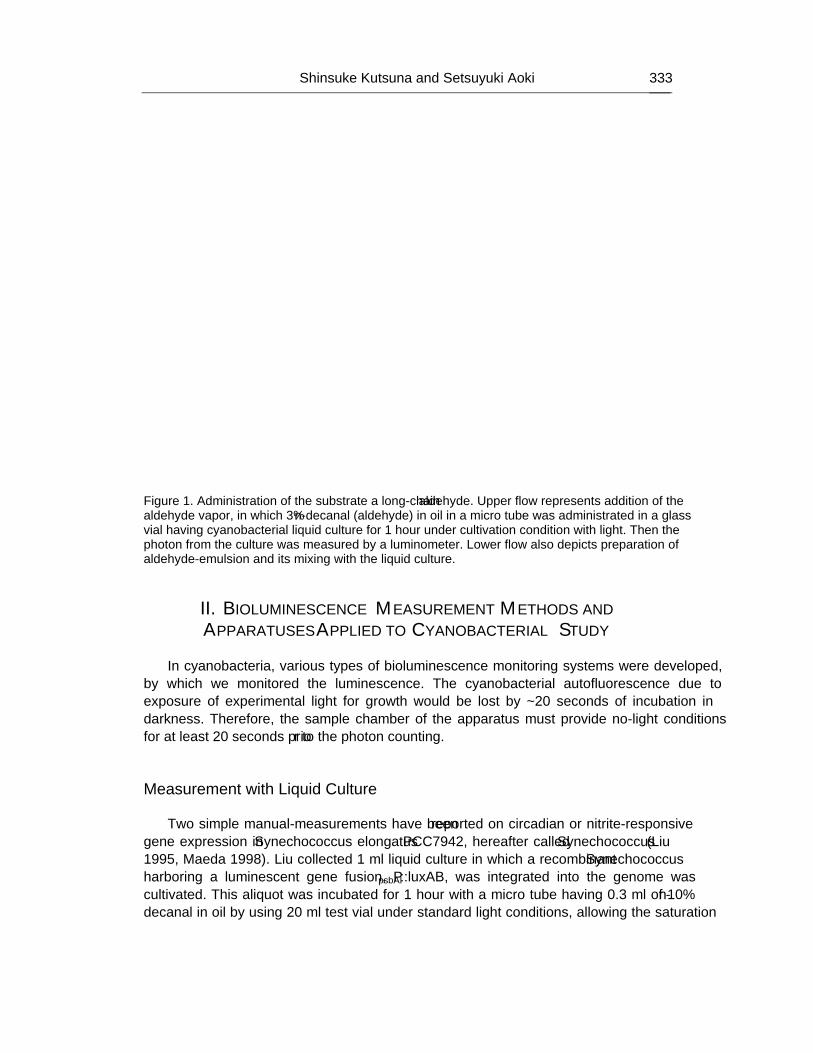
Shinsuke Kutsuna and Setsuyuki Aoki 333
Figure 1. Administration of the substrate a long-chain aldehyde. Upper flow represents addition of the aldehyde vapor, in which 3% n-decanal (aldehyde) in oil in a micro tube was administrated in a glass vial having cyanobacterial liquid culture for 1 hour under cultivation condition with light. Then the photon from the culture was measured by a luminometer. Lower flow also depicts preparation of aldehyde-emulsion and its mixing with the liquid culture.
II. BIOLUMINESCENCE MEASUREMENT METHODS AND APPARATUSES APPLIED TO CYANOBACTERIAL STUDY
In cyanobacteria, various types of bioluminescence monitoring systems were developed,
by which we monitored the luminescence. The cyanobacterial autofluorescence due to exposure of experimental light for growth would be lost by ~20 seconds of incubation in darkness. Therefore, the sample chamber of the apparatus must provide no-light conditions for at least 20 seconds prior to the photon counting.
Measurement with Liquid Culture Two simple manual-measurements have been reported on circadian or nitrite-responsive
gene expression in Synechococcus elongatus PCC7942, hereafter called Synechococcus (Liu 1995, Maeda 1998). Liu collected 1 ml liquid culture in which a recombinant Synechococcus harboring a luminescent gene fusion, PpsbAI::luxAB, was integrated into the genome was cultivated. This aliquot was incubated for 1 hour with a micro tube having 0.3 ml of 10% n-decanal in oil by using 20 ml test vial under standard light conditions, allowing the saturation
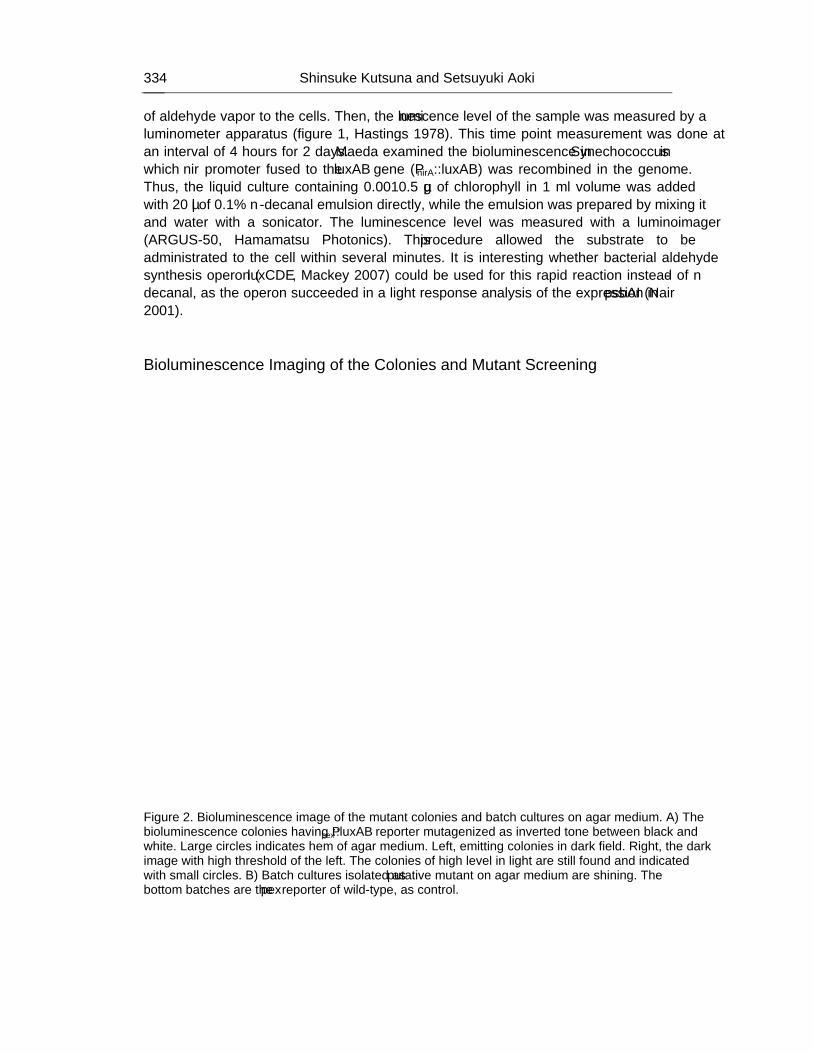
Shinsuke Kutsuna and Setsuyuki Aoki 334
of aldehyde vapor to the cells. Then, the luminescence level of the sample was measured by a luminometer apparatus (figure 1, Hastings 1978). This time point measurement was done at an interval of 4 hours for 2 days. Maeda examined the bioluminescence in Synechococcus in which nir promoter fused to the luxAB gene (PnirA::luxAB) was recombined in the genome. Thus, the liquid culture containing 0.001–0.5 µg of chlorophyll in 1 ml volume was added with 20 µl of 0.1% n-decanal emulsion directly, while the emulsion was prepared by mixing it and water with a sonicator. The luminescence level was measured with a luminoimager (ARGUS-50, Hamamatsu Photonics). This procedure allowed the substrate to be administrated to the cell within several minutes. It is interesting whether bacterial aldehyde synthesis operon (luxCDE, Mackey 2007) could be used for this rapid reaction instead of n-decanal, as the operon succeeded in a light response analysis of the expression in psbAI (Nair 2001).
Bioluminescence Imaging of the Colonies and Mutant Screening
Figure 2. Bioluminescence image of the mutant colonies and batch cultures on agar medium. A) The bioluminescence colonies having Ppex::luxAB reporter mutagenized as inverted tone between black and white. Large circles indicates hem of agar medium. Left, emitting colonies in dark field. Right, the dark image with high threshold of the left. The colonies of high level in light are still found and indicated with small circles. B) Batch cultures isolated as putative mutant on agar medium are shining. The bottom batches are the pex reporter of wild-type, as control.
Bioluminescence Reporter Systems for Monitoring Gene Expresion Profile… 335
In our laboratory, screening of mutants that exhibited aberrant phenotypes in circadian
resetting was carried out. In Synechococcus, a transcriptional repressor Pex, increases in darkness to directly regulate a clock essential gene, kaiA (Takai 2006, Arita 2007, Kutsuna 2007). Then, the mutants that express the pex gene at a higher level than a wild-type strain was screened by using the bioluminescence reporter Synechococcus strain YCC1. This harbored Ppex::luxAB in the genome to monitor the pex expression as luminescence. An E. coli plasimid-based random genomic DNA library was used for the mutagenesis, which caused random insertion mutagenesis with a kanamycin resistant gene cassette. The mutagenized cell suspension was plated onto 10 cm agar medium in diameter and prepared 1,000 colonies each plate. A lid of plastic microcentrifugation tube was filled with 3% n-decanal in oil and put at the center of the plate to provide its vapor into the colonies. To reset the clock, the colonies were subjected to a dark box for 12 hours at 30°C. Then, the plate with the colonies were put into a luminescence-imager (Fluor-S MultiImager, BioRad) and subjected to 30 seconds of darkness. Then, a bioluminescence image was captured (figure 2A). Apparently brighter colonies are isolated as putative mutants on pex expression. The clones were further cultivated on an agar plate (figure 2B). This second screening found five candidates. Three of the candidates accumulated pex mRNA more than wild-type. Others might have an abnormality in metabolism related to the cellular substrate FMNH2 or status of O2 production.
The Measurement Apparatus Equipped with Automatically Controlled Cultivation and Sample Exchange
In 1992, Kondo first reported the prokaryotic circadian rhythm which satisfied common
physiological properties to the rhythms in eukaryotes by using the artificial bioluminescence reporter gene fusion PpsbAI::luxAB. To examine the rhythm precisely, error due to the researcher’s manipulation over several days must be avoided. Then, the automatically moving a light-tight box in which a photomultiplier tube (PT) counted bioluminescence and the rail with serial cultivation chambers and growth lamp were developed (figure 3). This machine has enough ability to measure the bioluminescence rhythm precisely for several days and found the properties, i.e., the free-running under continuous condition of light and temperature, the temperature compensation, and entrainment to environmental signal (Kondo1992).
To measure weaker light signal than that of PpsbAI::luxAB, which exhibited a strong promoter activity, an advanced automatic luminometer with a cultivation turntable for uniform growth light condition was developed (figure 4). A PT that has larger photon sensor part (Hamamatsu photonics) was loaded into it, which enabled highly efficient photon-counting. The turntable with chambers exchanges sample plate of 35 mm in diameter with colonies. The bioluminescence rhythms of circadian clock gene reporter PkaiA and PkaiBC::luxAB were quantified by this machine (Kutsuna 2005, Kutsuna 2007).
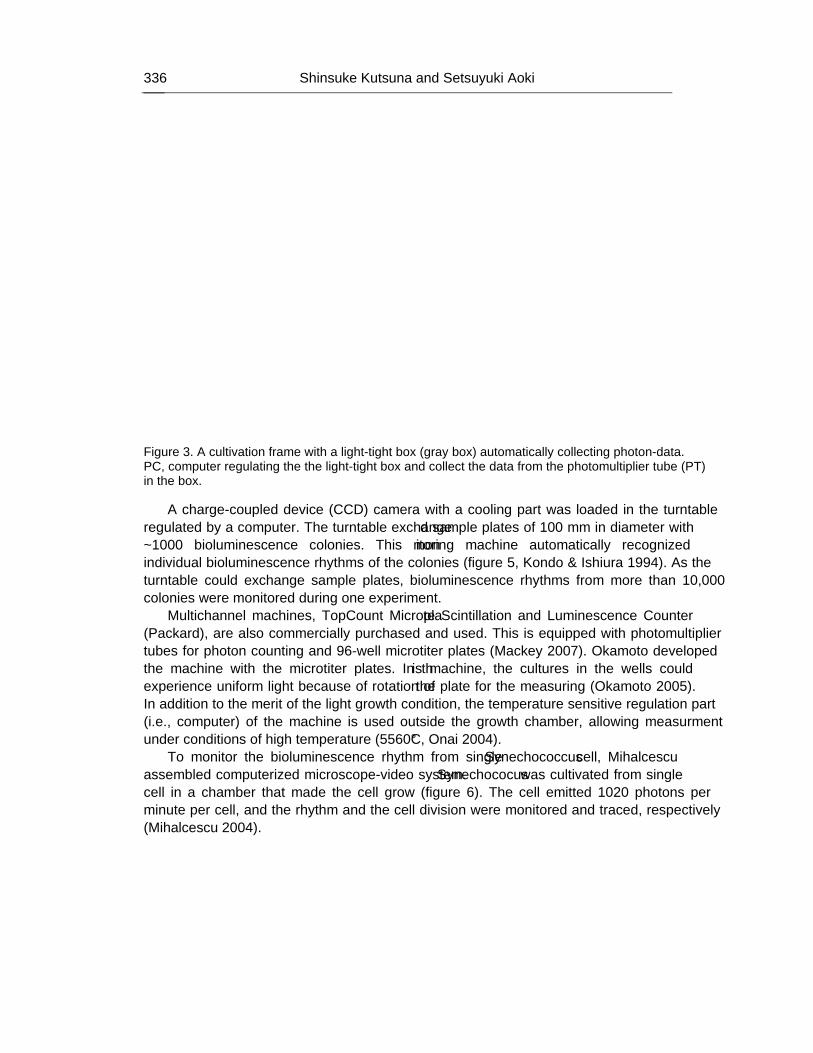
Shinsuke Kutsuna and Setsuyuki Aoki 336
Figure 3. A cultivation frame with a light-tight box (gray box) automatically collecting photon-data. PC, computer regulating the the light-tight box and collect the data from the photomultiplier tube (PT) in the box.
A charge-coupled device (CCD) camera with a cooling part was loaded in the turntable regulated by a computer. The turntable exchanged sample plates of 100 mm in diameter with ~1000 bioluminescence colonies. This monitoring machine automatically recognized individual bioluminescence rhythms of the colonies (figure 5, Kondo & Ishiura 1994). As the turntable could exchange sample plates, bioluminescence rhythms from more than 10,000 colonies were monitored during one experiment.
Multichannel machines, TopCount Microplate Scintillation and Luminescence Counter (Packard), are also commercially purchased and used. This is equipped with photomultiplier tubes for photon counting and 96-well microtiter plates (Mackey 2007). Okamoto developed the machine with the microtiter plates. In this machine, the cultures in the wells could experience uniform light because of rotation of the plate for the measuring (Okamoto 2005). In addition to the merit of the light growth condition, the temperature sensitive regulation part (i.e., computer) of the machine is used outside the growth chamber, allowing measurment under conditions of high temperature (55–60°C, Onai 2004).
To monitor the bioluminescence rhythm from single Synechococcus cell, Mihalcescu assembled computerized microscope-video system. Synechococus was cultivated from single cell in a chamber that made the cell grow (figure 6). The cell emitted 10–20 photons per minute per cell, and the rhythm and the cell division were monitored and traced, respectively (Mihalcescu 2004).
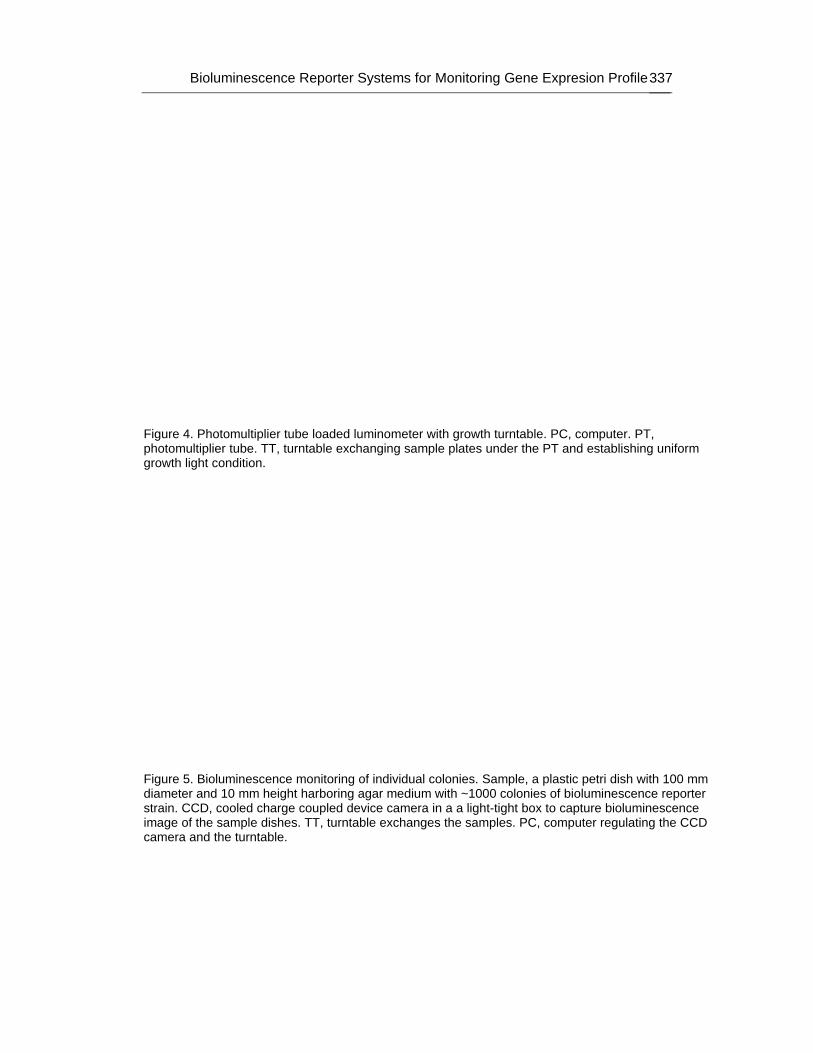
Bioluminescence Reporter Systems for Monitoring Gene Expresion Profile… 337
Figure 4. Photomultiplier tube loaded luminometer with growth turntable. PC, computer. PT, photomultiplier tube. TT, turntable exchanging sample plates under the PT and establishing uniform growth light condition.
Figure 5. Bioluminescence monitoring of individual colonies. Sample, a plastic petri dish with 100 mm diameter and 10 mm height harboring agar medium with ~1000 colonies of bioluminescence reporter strain. CCD, cooled charge coupled device camera in a a light-tight box to capture bioluminescence image of the sample dishes. TT, turntable exchanges the samples. PC, computer regulating the CCD camera and the turntable.
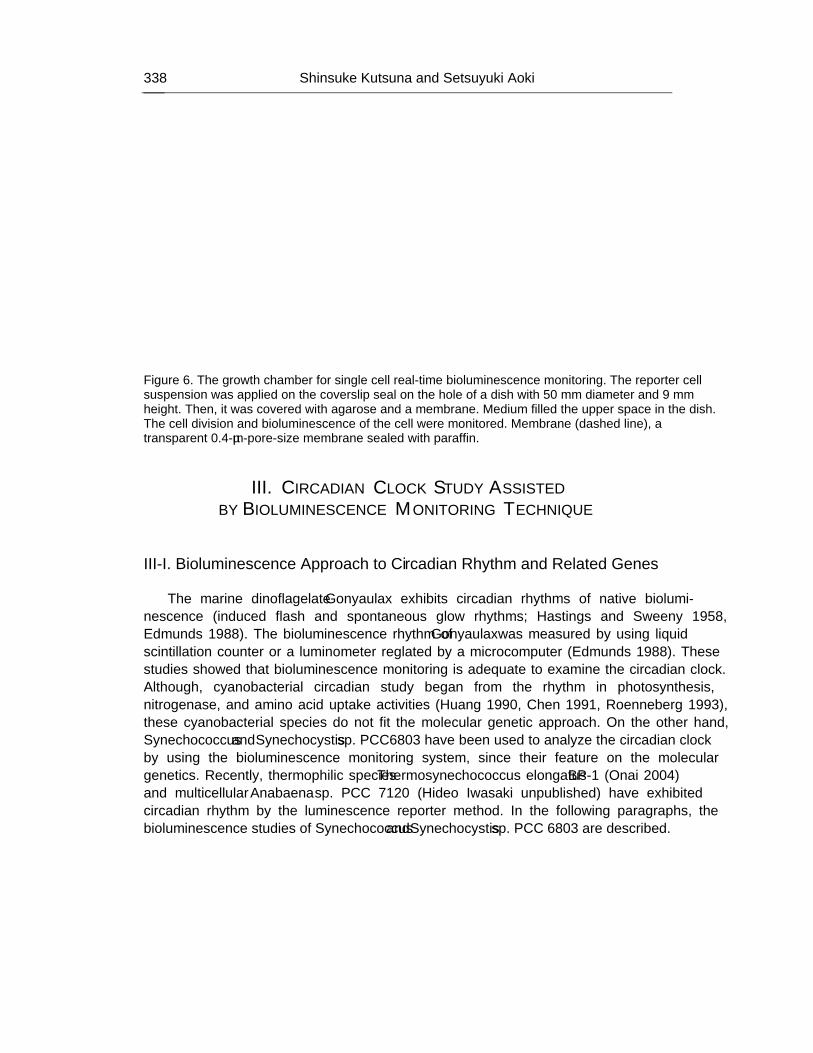
Shinsuke Kutsuna and Setsuyuki Aoki 338
Figure 6. The growth chamber for single cell real-time bioluminescence monitoring. The reporter cell suspension was applied on the coverslip seal on the hole of a dish with 50 mm diameter and 9 mm height. Then, it was covered with agarose and a membrane. Medium filled the upper space in the dish. The cell division and bioluminescence of the cell were monitored. Membrane (dashed line), a transparent 0.4-µm-pore-size membrane sealed with paraffin.
III. CIRCADIAN CLOCK STUDY ASSISTED
BY BIOLUMINESCENCE MONITORING TECHNIQUE
III-I. Bioluminescence Approach to Circadian Rhythm and Related Genes The marine dinoflagelate Gonyaulax exhibits circadian rhythms of native biolumi-
nescence (induced flash and spontaneous glow rhythms; Hastings and Sweeny 1958, Edmunds 1988). The bioluminescence rhythm of Gonyaulax was measured by using liquid scintillation counter or a luminometer reglated by a microcomputer (Edmunds 1988). These studies showed that bioluminescence monitoring is adequate to examine the circadian clock. Although, cyanobacterial circadian study began from the rhythm in photosynthesis, nitrogenase, and amino acid uptake activities (Huang 1990, Chen 1991, Roenneberg 1993), these cyanobacterial species do not fit the molecular genetic approach. On the other hand, Synechococcus and Synechocystis sp. PCC6803 have been used to analyze the circadian clock by using the bioluminescence monitoring system, since their feature on the molecular genetics. Recently, thermophilic species Thermosynechococcus elongatus BP-1 (Onai 2004) and multicellular Anabaena sp. PCC 7120 (Hideo Iwasaki unpublished) have exhibited circadian rhythm by the luminescence reporter method. In the following paragraphs, the bioluminescence studies of Synechococcus and Synechocystis sp. PCC 6803 are described.
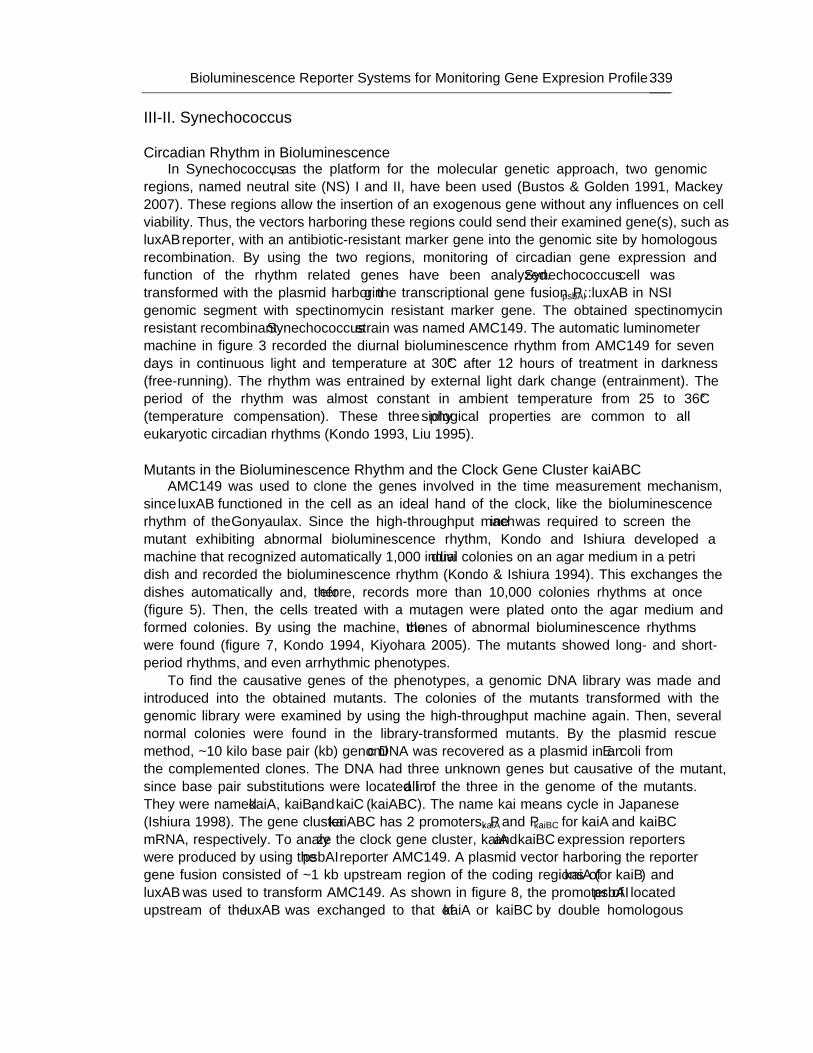
Bioluminescence Reporter Systems for Monitoring Gene Expresion Profile… 339
III-II. Synechococcus
Circadian Rhythm in Bioluminescence In Synechococcus, as the platform for the molecular genetic approach, two genomic
regions, named neutral site (NS) I and II, have been used (Bustos & Golden 1991, Mackey 2007). These regions allow the insertion of an exogenous gene without any influences on cell viability. Thus, the vectors harboring these regions could send their examined gene(s), such as luxAB reporter, with an antibiotic-resistant marker gene into the genomic site by homologous recombination. By using the two regions, monitoring of circadian gene expression and function of the rhythm related genes have been analyzed. Synechococcus cell was transformed with the plasmid harboring the transcriptional gene fusion PpsbAI::luxAB in NSI genomic segment with spectinomycin resistant marker gene. The obtained spectinomycin resistant recombinant Synechococcus strain was named AMC149. The automatic luminometer machine in figure 3 recorded the diurnal bioluminescence rhythm from AMC149 for seven days in continuous light and temperature at 30°C after 12 hours of treatment in darkness (free-running). The rhythm was entrained by external light dark change (entrainment). The period of the rhythm was almost constant in ambient temperature from 25 to 36°C (temperature compensation). These three physiological properties are common to all eukaryotic circadian rhythms (Kondo 1993, Liu 1995).
Mutants in the Bioluminescence Rhythm and the Clock Gene Cluster kaiABC
AMC149 was used to clone the genes involved in the time measurement mechanism, since luxAB functioned in the cell as an ideal hand of the clock, like the bioluminescence rhythm of the Gonyaulax. Since the high-throughput machine was required to screen the mutant exhibiting abnormal bioluminescence rhythm, Kondo and Ishiura developed a machine that recognized automatically 1,000 individual colonies on an agar medium in a petri dish and recorded the bioluminescence rhythm (Kondo & Ishiura 1994). This exchanges the dishes automatically and, therefore, records more than 10,000 colonies’ rhythms at once (figure 5). Then, the cells treated with a mutagen were plated onto the agar medium and formed colonies. By using the machine, the clones of abnormal bioluminescence rhythms were found (figure 7, Kondo 1994, Kiyohara 2005). The mutants showed long- and short- period rhythms, and even arrhythmic phenotypes.
To find the causative genes of the phenotypes, a genomic DNA library was made and introduced into the obtained mutants. The colonies of the mutants transformed with the genomic library were examined by using the high-throughput machine again. Then, several normal colonies were found in the library-transformed mutants. By the plasmid rescue method, ~10 kilo base pair (kb) genomic DNA was recovered as a plasmid in an E. coli from the complemented clones. The DNA had three unknown genes but causative of the mutant, since base pair substitutions were located in all of the three in the genome of the mutants. They were named kaiA, kaiB,and kaiC (kaiABC). The name “kai” means “cycle” in Japanese (Ishiura 1998). The gene cluster kaiABC has 2 promoters, PkaiA and PkaiBC for kaiA and kaiBC mRNA, respectively. To analyze the clock gene cluster, kaiA and kaiBC expression reporters were produced by using the psbAI reporter AMC149. A plasmid vector harboring the reporter gene fusion consisted of ~1 kb upstream region of the coding regions of kaiA (or kaiB) and luxAB was used to transform AMC149. As shown in figure 8, the promoter of psbAI located upstream of the luxAB was exchanged to that of kaiA or kaiBC by double homologous
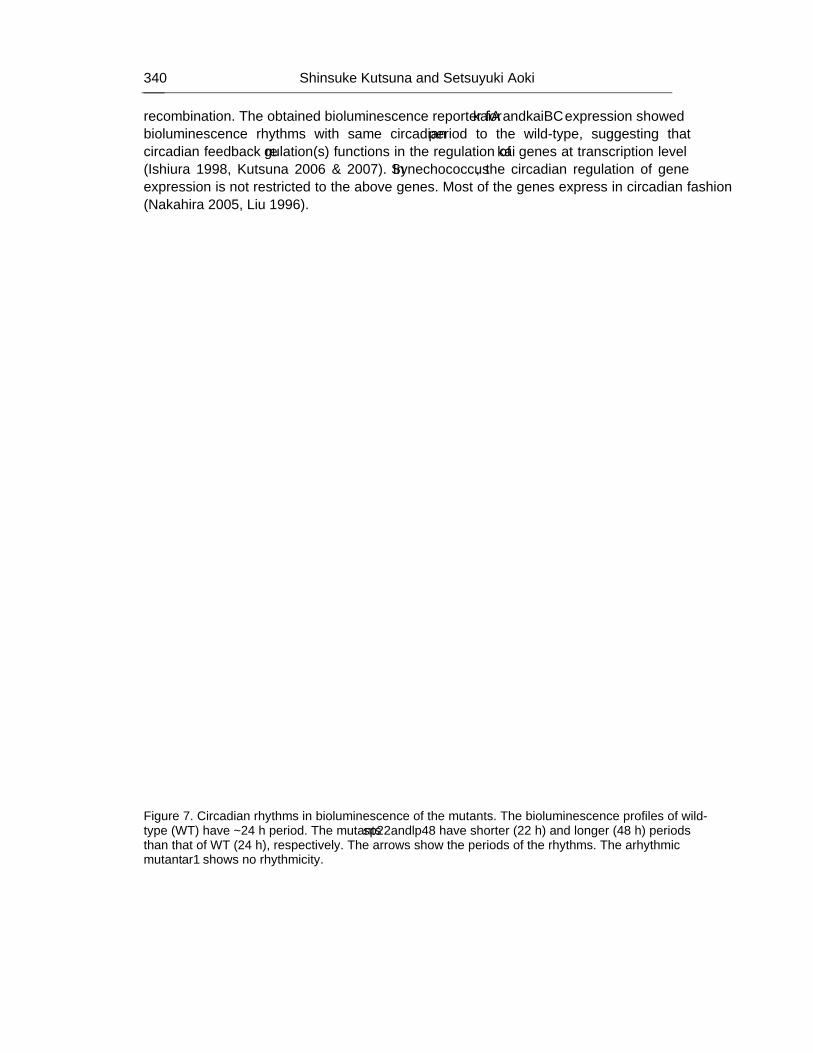
Shinsuke Kutsuna and Setsuyuki Aoki 340
recombination. The obtained bioluminescence reporter for kaiA and kaiBC expression showed bioluminescence rhythms with same circadian period to the wild-type, suggesting that circadian feedback regulation(s) functions in the regulation of kai genes at transcription level (Ishiura 1998, Kutsuna 2006 & 2007). In Synechococcus, the circadian regulation of gene expression is not restricted to the above genes. Most of the genes express in circadian fashion (Nakahira 2005, Liu 1996).
Figure 7. Circadian rhythms in bioluminescence of the mutants. The bioluminescence profiles of wild-type (WT) have ~24 h period. The mutants sp22 and lp48 have shorter (22 h) and longer (48 h) periods than that of WT (24 h), respectively. The arrows show the periods of the rhythms. The arhythmic mutant ar1 shows no rhythmicity.
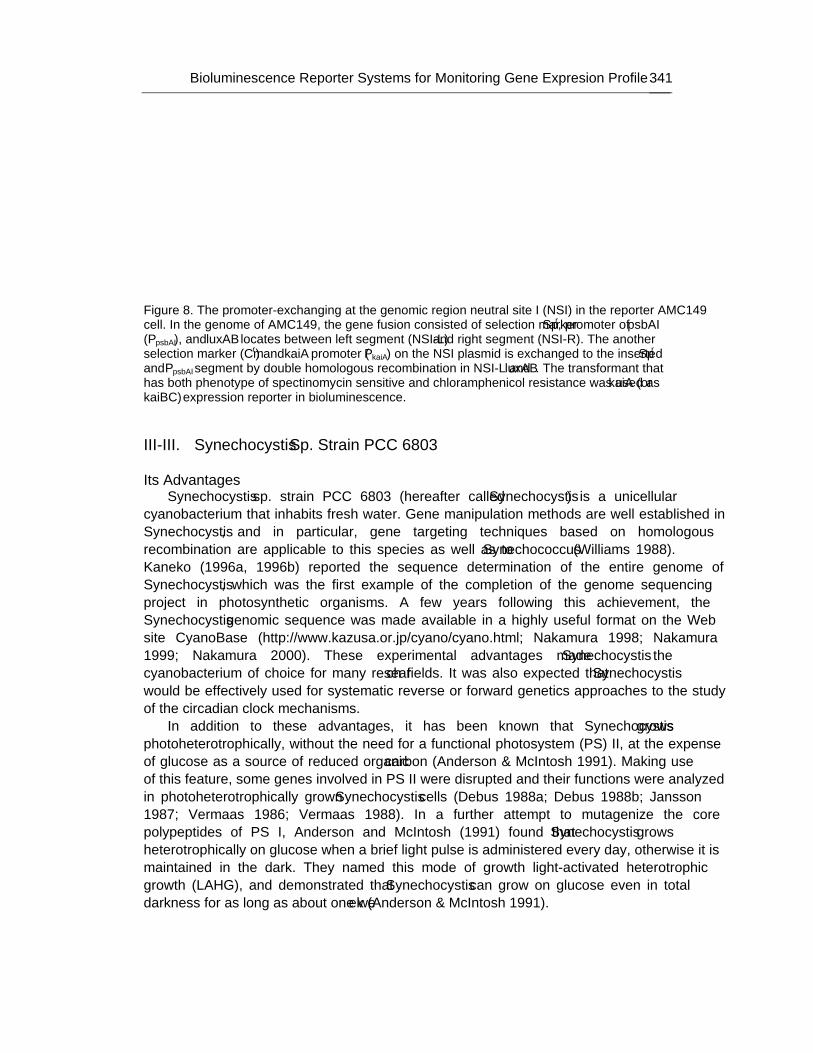
Bioluminescence Reporter Systems for Monitoring Gene Expresion Profile… 341
Figure 8. The promoter-exchanging at the genomic region neutral site I (NSI) in the reporter AMC149 cell. In the genome of AMC149, the gene fusion consisted of selection marker Spr, promoter of psbAI (PpsbAI), and luxAB locates between left segment (NSI-L) and right segment (NSI-R). The another selection marker (Cmr) and kaiA promoter (PkaiA) on the NSI plasmid is exchanged to the inserted Spr and PpsbAI segment by double homologous recombination in NSI-L and luxAB. The transformant that has both phenotype of spectinomycin sensitive and chloramphenicol resistance was used as kaiA (or kaiBC) expression reporter in bioluminescence.
III-III. Synechocystis Sp. Strain PCC 6803
Its Advantages
Synechocystis sp. strain PCC 6803 (hereafter called Synechocystis) is a unicellular cyanobacterium that inhabits fresh water. Gene manipulation methods are well established in Synechocystis, and in particular, gene targeting techniques based on homologous recombination are applicable to this species as well as to Synechococcus (Williams 1988). Kaneko (1996a, 1996b) reported the sequence determination of the entire genome of Synechocystis, which was the first example of the completion of the genome sequencing project in photosynthetic organisms. A few years following this achievement, the Synechocystis genomic sequence was made available in a highly useful format on the Web site CyanoBase (http://www.kazusa.or.jp/cyano/cyano.html; Nakamura 1998; Nakamura 1999; Nakamura 2000). These experimental advantages made Synechocystis the cyanobacterium of choice for many research fields. It was also expected that Synechocystis would be effectively used for systematic reverse or forward genetics approaches to the study of the circadian clock mechanisms.
In addition to these advantages, it has been known that Synechocystis grows photoheterotrophically, without the need for a functional photosystem (PS) II, at the expense of glucose as a source of reduced organic carbon (Anderson & McIntosh 1991). Making use of this feature, some genes involved in PS II were disrupted and their functions were analyzed in photoheterotrophically grown Synechocystis cells (Debus 1988a; Debus 1988b; Jansson 1987; Vermaas 1986; Vermaas 1988). In a further attempt to mutagenize the core polypeptides of PS I, Anderson and McIntosh (1991) found that Synechocystis grows heterotrophically on glucose when a brief light pulse is administered every day, otherwise it is maintained in the dark. They named this mode of growth “light-activated heterotrophic growth (LAHG)”, and demonstrated that Synechocystis can grow on glucose even in total darkness for as long as about one week (Anderson & McIntosh 1991).
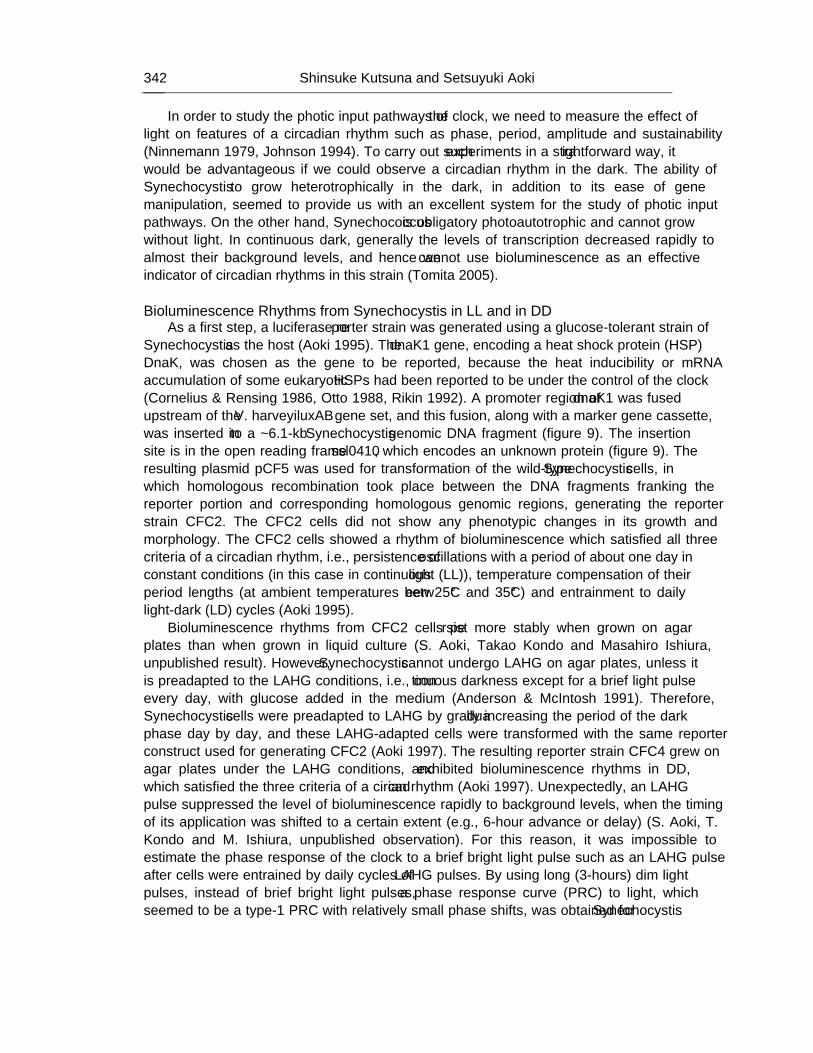
Shinsuke Kutsuna and Setsuyuki Aoki 342
In order to study the photic input pathways of the clock, we need to measure the effect of light on features of a circadian rhythm such as phase, period, amplitude and sustainability (Ninnemann 1979, Johnson 1994). To carry out such experiments in a straightforward way, it would be advantageous if we could observe a circadian rhythm in the dark. The ability of Synechocystis to grow heterotrophically in the dark, in addition to its ease of gene manipulation, seemed to provide us with an excellent system for the study of photic input pathways. On the other hand, Synechococcus is obligatory photoautotrophic and cannot grow without light. In continuous dark, generally the levels of transcription decreased rapidly to almost their background levels, and hence we cannot use bioluminescence as an effective indicator of circadian rhythms in this strain (Tomita 2005).
Bioluminescence Rhythms from Synechocystis in LL and in DD
As a first step, a luciferase reporter strain was generated using a glucose-tolerant strain of Synechocystis as the host (Aoki 1995). The dnaK1 gene, encoding a heat shock protein (HSP) DnaK, was chosen as the gene to be reported, because the heat inducibility or mRNA accumulation of some eukaryotic HSPs had been reported to be under the control of the clock (Cornelius & Rensing 1986, Otto 1988, Rikin 1992). A promoter region of dnaK1 was fused upstream of the V. harveyi luxAB gene set, and this fusion, along with a marker gene cassette, was inserted into a ~6.1-kb Synechocystis genomic DNA fragment (figure 9). The insertion site is in the open reading frame ssl0410, which encodes an unknown protein (figure 9). The resulting plasmid pCF5 was used for transformation of the wild-type Synechocystis cells, in which homologous recombination took place between the DNA fragments franking the reporter portion and corresponding homologous genomic regions, generating the reporter strain CFC2. The CFC2 cells did not show any phenotypic changes in its growth and morphology. The CFC2 cells showed a rhythm of bioluminescence which satisfied all three criteria of a circadian rhythm, i.e., persistence of oscillations with a period of about one day in constant conditions (in this case in continuous light (LL)), temperature compensation of their period lengths (at ambient temperatures between 25°C and 35°C) and entrainment to daily light-dark (LD) cycles (Aoki 1995).
Bioluminescence rhythms from CFC2 cells persist more stably when grown on agar plates than when grown in liquid culture (S. Aoki, Takao Kondo and Masahiro Ishiura, unpublished result). However, Synechocystis cannot undergo LAHG on agar plates, unless it is preadapted to the LAHG conditions, i.e., continuous darkness except for a brief light pulse every day, with glucose added in the medium (Anderson & McIntosh 1991). Therefore, Synechocystis cells were preadapted to LAHG by gradually increasing the period of the dark phase day by day, and these LAHG-adapted cells were transformed with the same reporter construct used for generating CFC2 (Aoki 1997). The resulting reporter strain CFC4 grew on agar plates under the LAHG conditions, and exhibited bioluminescence rhythms in DD, which satisfied the three criteria of a circadian rhythm (Aoki 1997). Unexpectedly, an LAHG pulse suppressed the level of bioluminescence rapidly to background levels, when the timing of its application was shifted to a certain extent (e.g., 6-hour advance or delay) (S. Aoki, T. Kondo and M. Ishiura, unpublished observation). For this reason, it was impossible to estimate the phase response of the clock to a brief bright light pulse such as an LAHG pulse after cells were entrained by daily cycles of LAHG pulses. By using long (3-hours) dim light pulses, instead of brief bright light pulses, a phase response curve (PRC) to light, which seemed to be a type-1 PRC with relatively small phase shifts, was obtained for Synechocystis
Bioluminescence Reporter Systems for Monitoring Gene Expresion Profile… 343
(Aoki 1997). Though long dim light pulses did not suppress bioluminescence levels as brief bright pulses, they reduced the amplitude of the rhythms to varying degrees. This sometimes led to difficulties in precise estimation of period and/or phase of the rhythms (S. Aoki, T. Kondo and M. Ishiura, unpublished observation).
Figure 9. Schematic representation of the introduction of the dnaK reporter construct into the Synechocystis genome. The open rectangles with arrowheads represent a promoterless segment of the luciferase luxAB genes from V. harveyi. The hatched rectangle with an arrowhead represents the Ω fragment carrying the spectinomycin/streptomycin resistance gene (Spr). An upstream region segment of the dnaK gene (USRdnaK) is followed by an amino-terminal coding region of the dnaK gene (solid rectangle with arrowhead), which is fused upstream of the luxA gene. The arrows indicate the direction of transcription. The direction of the terminators (ter) of the Ω fragment is also shown by the arrows. The reporter portion including the Ω fragment was integrated into the BglII site (not shown in the figure) located in an open reading frame ssl0410, encoding an unknown protein.
Improvement of Synechocystis Bioluminescence Reporter Strains
Bioluminescence intensity of CFC2 was much lower (~1/20) than that of AMC149, the psbA1 reporter strain of Synechococcus (Aoki 1995). On the other hand, though bioluminescence intensity of CFC4 was nearly comparable to that of AMC149, the amplitude of its rhythm was considerably lower than that of CFC2 (Aoki 1997). For these reasons, neither of the Synechocystis reporter strains were used for further studies such as screening of clock mutants by using the cooled-CCD camera system. Kucho (2005) improved the Synechocystis bioluminescent reporter system by generating transgenic strains of Synechocystis with newly designed reporter constructs. These constructs carry a dnaK promoter fragment that is fused to the luxA coding sequence seamlessly, i.e., with no additive sequence between the end of the promoter fragment and the start codon of luxA. On the other hand, CFC2 contained an N-terminal part of the dnaK coding sequence immediately upstream of luxA, resulting in the addition of a short peptide extension to the N-terminus of the LuxA protein, which might be a reason for the low bioluminescence levels of CFC2. Moreover, the selectable marker gene (SpR) cassette was designed to be placed in antiparallel to luxAB so that transcription of the SpR gene does not interfere with the access of RNA polymerase to the dnaK promoter. A resulting reporter strain PdnaK::luxAB(+) exhibited bioluminescence rhythms whose levels were comparable to those of AMC149, and their amplitudes were 10% higher than that of CFC2 (Kucho 2005).
Problems and Future Perspectives
The light sensitivities of the Synechocystis circadian rhythm in the dark have hampered further exploitation of this species for the study of light input pathways. Therefore, it still
Shinsuke Kutsuna and Setsuyuki Aoki 344
remains a future problem to establish a reporter strain that can be used for studying the effect of light signals on the clock. Generating a Synechocystis mutant insensitive to the negative effect of light may be a possible solution to this problem, although there could be some overlaps between signal transduction systems involved in these light sensitivities and the light input pathways of the clock. An attempt is underway to use another species Leptolyngbya boryana, which grows heterotrophically in complete darkness, as a model system for observation of a circadian rhythm in the dark (Terauchi 2005). On the other hand, circadian bioluminescence rhythms in LL, in particular those improved by Kucho (2005), have now allowed us to use Synechocystis for a large-scale screen for mutants with abnormal patterns of circadian gene expression. Therefore, Synechocystis is, like Synechococcus, a cyanobacterium of choice for molecular-genetic analyses of clock genes and clock-related genes.
CONCLUSION The luciferase genes are successfully applied to explore gene expressions and regulatory
mechanisms. In particular, the bacterial gene set luxAB has been used in research in cyanobacteria. Recently, bioluminescence real-time monitoring systems with many merits (tables 1 and 2) have been established. As alternative reporters of gene expression, green fluorescent proteins and their derivatives were used in localization and temporal variation of interested gene products in vivo with appropriate choice of monitoring apparatus and the reporter proteins (Fernández-Piñas 2000, Zang 2006, Chabot 2007). Recently, several combinations of fluorogen and its partner, binding-peptide, have been screened in eukaryotic cells (Szent-Gyorgyi 2008). Therefore, these developing techniques could also be used efficiently in cyanobacterial cells in not too distant future.
ACKNOWLEDGEMENTS We thank Dr. Kazuhisa Okamoto (Center for Gene Research, Nagoya University) for
cooperation in the development of our bioluminescence monitoring devices. Drs. Shinichi Maeda (Dept. Agricultural Sciences, Nagoya University), Irina Mihalcescu (Laboratoire de Spectrométrie Physique, Université Joseph Fourier), and Tokitaka Oyama (Dept. Botany, Kyoto University) gave critical advice regarding our manuscript. We also thank Dr. Hideo Iwasaki (Dept. Electric Engineering and Bioscience, Waseda University) for his information on circadian study.
REFERENCES
Andersson, C. A., Tsinoremas, N. F., Shelton, J., Lebedeva N. V., Yarrow, J., Min, H., & Golden, S. S. Application of bioluminescence to the study of circadian rhythms in cyanobacteria. In: Ziegler M. M. & Baldwin, T. O. Bioluminescence and chemilumin-escence Part C: Vol. 305. Methods in enzymology. San Diego, California, USA: Academic Press; 2000; 527-542.
Bioluminescence Reporter Systems for Monitoring Gene Expresion Profile… 345
Anderson, S. L. & McIntosh, L. (1991) Light-activated heterotrophic growth of the cyanobacterium Synechocystis sp. strain PCC 6803: a blue-light-requiring process. J. Bacteriol. 173, 2761-2767
Aoki, S., Kondo, T. & Ishiura, M. (1995) Circadian expression of the dnaK gene in the cyanobacterium Synechocystis sp. strain PCC 6803. J. Bacteriol. 177, 5606-5611
Aoki, S., Kondo, T., Wada, H. & Ishiura, M. (1997) Circadian rhythm of the cyanobacterium Synechocystis sp. strain PCC 6803 in the dark. J. Bacteriol. 179, 5751-5755
Arita, K., Hashimoto, H., Igari, K., Akaboshi, M., Kutsuna, S., Sato, M., & Shimizu, T. (2007) Structural and biochemical characterization of a cyanobacterium circadian clock-modifier protein. J. Biol. Chem. 282, 1128-1135
Baldwin, T. O., Berends, T., Bunch, T. A., Holzman, T.F., Rausch, S. K., Shamansky, L., Treat, M. L., and Ziegler, M. M. (1984). Cloning of the luciferase structural genes from Vibrio harveyi and expression of bioluminescence in Escherichia coli. Biochemistry. 23, 3663-3667
Bustos, S. A. & Golden, S. S. (1991). Expression of the psbDII gene in Synechococcus sp. PCC 7942 requires sequences downstream of the transcription start site. J. Bacteriol. 173, 7525-7533
Chabot, J. R, Pedraza, J. M., Luitel, P., & van Oudenaarden, A. (2007). Stochastic gene expression out-of-steady-state in the cyanobacterial circadian clock. Nature. 450, 1249-1252
Chen, T. H., Chen, T. L., Hung L. M., & Huang T. C. (1990). Circadian rhythm in amino acid uptake by Synechococcus RF-1. Plant. Physiol. 97, 55-59
Cornelius, G. & Rensing, L. (1986) Circadian rhythm of heat shock protein synthesis of Neurospora crassa. Eur. J. Cell Biol. 40, 130–132
Debus, R. J., Barry, B. A., Babcock, G. T. & McIntosh, L. (1988a) Site-directed mutagenesis identifies a tyrosine radical involved in the photosynthetic oxygen-evolving system. Proc. Natl. Acad. Sci. USA 85, 427-430
Debus, R. J., Barry, B. A., Sithole, I., Babcock, G. T. & McIntosh, L. (1988b) Directed mutagenesis indicates that the donor to P+680 in photosystem II is tyrosine-161 of the D1 polypeptide. Biochemistry. 27, 9071-9074
DeLuca, M. & McElroy, W. D.: Purification and properties of firefly luciferase. In: DeLuca, M. A. Bioluminescence and chemiluminescence: Vol. 57. Methods in enzymology. New York, USA: Academic Press; 1978; 3-15.
Edmunds, L. N. (1988). Cellular and molecular bases of biological clocks: Models and mechanisms for circadian timekeeping. New York, 175 Fifth Avenue: Springer-Verlag.
Elhai, J. & Wolk, C. P. (1990). Developmental regulation and spatial pattern of expression of the structural genes for nitrogenase in the cyanobacterium Anabaena. EMBO J. 9, 3379-3388
Fernández-Piñas, F., Leganés, F., & Wolk, C. P. Bacterial lux genes as reporters in cyanobacteria. In: Ziegler M. M. & Baldwin, T. O. Bioluminescence and chemilumin-escence Part C: Vol. 305. Methods in enzymology. San Diego, California, USA: Academic Press; 2000; 517-527.
Hakkila, K., Maksimow, M., Karp, M., and Virta, M. (2002). Reporter genes lucFF, luxCDABE, gfp, and dsred have different characteristics in whole-cell bacterial sensors. Anal. Biochem. 30, 235-242
Shinsuke Kutsuna and Setsuyuki Aoki 346
Hastings, J. W. & Sweeny, B. M. (1958). A persistent diurnal rhythm of luminescence in Gonyaulax polyedra. Biol. Bull. 115, 440-458
Hastings, J. W., Baldwin, T. O., & Nicoli, M. Z.: Bacterial bioluminescence: Assay, purification, and properties. In: DeLuca, M. A. Bioluminescence and chemiluminescence: Vol. 57. Methods in enzymology. New York, USA: Academic Press; 1978; 135-152.
Huang, T. C., Tu, J., Chow, T. J., & Chen, T. H. (1989). Circadian rhythm of the prokaryote Synechococcus sp. RF-1. Plant. Physiol. 92, 531-533
Jansson, C., Debus, R. J., Osiewacz, H. D., Gurevitz, M. & McIntosh, L. (1987) Construction of an obligate photoheterotrophic mutant of the cyanobacterium Synechocystis 6803: Inactivation of the psbA gene family. Plant. Physiol. 85, 1021-1025
Johnson, C. H. (1994) Illuminating the clock: circadian photobiology. Semin Cell Biol. 5, 355-362
Kaneko, T., Sato, S., Kotani, H., Tanaka, A., Asamizu, E., Nakamura, Y., Miyajima, N., Hirosawa, M., Sugiura, M., Sasamoto, S., Kimura, T., Hosouchi, T., Matsuno, A., Muraki, A., Nakazaki, N., Naruo, K., Okumura, S., Shimpo, S., Takeuchi, C., Wada, T., Watanabe, A., Yamada, M., Yasuda, M. & Tabata, S (1996a) Sequence analysis of the genome of the unicellular cyanobacterium Synechocystis sp. strain PCC6803. II. Sequence determination of the entire genome and assignment of potential protein-coding regions. DNA Res. 3, 109-136
Kaneko, T., Sato, S., Kotani, H., Tanaka, A., Asamizu, E., Nakamura, Y., Miyajima, N., Hirosawa, M., Sugiura, M., Sasamoto, S., Kimura, T., Hosouchi, T., Matsuno, A., Muraki, A., Nakazaki, N., Naruo, K., Okumura, S., Shimpo, S., Takeuchi, C., Wada, T., Watanabe, A., Yamada, M., Yasuda, M. & Tabata, S. (1996b) Sequence analysis of the genome of the unicellular cyanobacterium Synechocystis sp. strain PCC6803. II. Sequence determination of the entire genome and assignment of potential protein-coding regions (supplement). DNA Res. 3, 185-209
Kitayama, Y., Kondo, T., Nakahira, Y., Nishimura, H., Ohmiya, Y., and Oyama, T. (2004). An in vivo dual-reporter system of cyanobacteria using two railroad-worm luciferases with different color emissions. Plant. Cell. Physiol. 45,109-113
Kiyohara, Y. B., Katayama, M., & Kondo T (2005). A novel mutation in kaiC affects resetting of the cyanobacterial circadian clock. J. Bacteriol. 187, 2559-2564
Kondo, T., Strayer, C. A., Kulkarni, R. D., Taylor, W., Ishiura, M., Golden, S. S., & Johnson, C. H. (1993). Circadian rhythms in prokaryotes: luciferase as a reporter of circadian gene expression in cyanobacteria. Proc. Natl. Acad. Sci. USA. 90, 5672–5676
Kondo, T., & Ishiura, M. (1994). Circadian rhythms of cyanobacteria: monitoring the biological clocks of individual colonies by bioluminescence. J. Bacteriol. 176,1881-1885
Kondo, T., Tsinoremas, N. F., Golden, S. S., Johnson, C. H., Kutsuna, S., & Ishiura, M. (1994). Circadian clock mutants of cyanobacteria. Science. 266, 1233-1236
Kucho, K., Aoki, K., Itoh, S. & Ishiura, M. (2005) Improvement of the bioluminescence reporter system for real-time monitoring of circadian rhythms in the cyanobacterium Synechocystis sp. strain PCC 6803. Genes Genet. Syst. 80, 19-23
Kutsuna, S., Nakahira, Y., Katayama, M., Ishiura, M., & Kondo, T. (2005). Transcriptional regulation of the circadian clock operon kaiBC by upstream regions in cyanobacteria. Mol. Microbiol. 57, 1474-1484.

Bioluminescence Reporter Systems for Monitoring Gene Expresion Profile… 347
Kutsuna, S., Kondo, T., Ikegami, H., Uzumaki, T., Katayama, M., and Ishiura, M. (2007). The circadian clock-related gene pex regulates a negative cis element in the kaiA promoter region. J. Bacteriol. 189, 7690-7696.
Liu, Y., Golden, S. S., Kondo, T., Ishiura, M., & Johnson, C. H. (1995). Bacterial luciferase as a reporter of circadian gene expression in cyanobacteria. J. Bacteriol., 177, 2080-2086
Liu, Y., Tsinoremas, N. F., Johnson, C. H., Lebedeva, N. V., Golden, S. S., Ishiura, M., and Kondo, T. (1995). Circadian orchestration of gene expression in cyanobacteria. Genes & Dev. 9, 1469-1478
Maeda, S., Kawaguchi, Y., Ohe, T. A., Omata, T., (1998). cis-acting sequences required for NtcB-dependent, nitrite-responsive positive regulation of the nitrate assimilation operon in the cyanobacterium Synechococcus sp. strain PCC 7942. J. Bacteriol. 180, 4080-4088
Mackey, S. R., Ditty, J. L., Clerico, E. M., & Golden, S. S.: Detection of rhythmic bioluminescence from luciferase reporters in cyanobacteria. In: Rosato, E. Circadian rhythms: Methods and protocols. Vol. 362. Methods in Molecular Biology. Towana, NJ: Humana Press Inc; 2007; 115-129
Michel, K. P., Pistorius, E. K., & Golden, S. S. (2001). Unusual regulatory elements for iron deficiency induction of the idiA gene of Synechococcus elongatus PCC 7942. J. Bacteriol. 183, 5015-5024
Mihalcescu, I., Hsing, W., & Leibler, S., (2004). Resilient circadian oscillator revealed in individual cyanobacteria. Nature. 430, 81-85
Millar, A. J., Short, S. R., Chua, N. H., & Kay, S. A. (1992) A novel circadian phenotype based on firefly luciferase expression in transgenic plants. Plant. Cell. 4, 1075-1087
Nair, U., Thomas, C., & Golden, S. S. (2001). Functional elements of the strong psbAI promoter of Synechococcus elongatus PCC 7942. J. Bacteriol. 183, 1740-1747
Nakahira, Y., Katayama, M., Miyashita, H., Kutsuna, S., Iwasaki, H., Oyama, T., & Kondo, T. (2004) Global gene repression by KaiC as a master process of prokaryotic circadian system. Proc. Natl. Acad. Sci. USA. 101, 881-885
Nakamura, Y., Kaneko, T., Hirosawa, M., Miyajima, N. & Tabata, S. (1998) CyanoBase, a www database containing the complete nucleotide sequence of the genome of Synechocystis sp. strain PCC6803. Nucleic Acids Res. 26, 63-67
Nakamura, Y., Kaneko, T., Miyajima, N. & Tabata, S. (1999) Extension of CyanoBase. CyanoMutants: repository of mutant information on Synechocystis sp. strain PCC6803. Nucleic Acids Res. 27, 66-68
Nakamura, Y., Kaneko, T. & Tabata, S. (2000) CyanoBase, the genome database for Synechocystis sp. strain PCC6803: status for the year 2000. Nucleic Acids Res. 28, 72
Ninnemann, H. (1979) Photoreceptors for circadian rhythms. Photochem. Phobiol. Rev. 4, 207-266
Okamoto, K., Onai, K., Ezaki, N., Ofuchi, T., & Ishiura, M. (2005). An automated apparatus for the real-time monitoring of bioluminescence in plants. Anal. Biochem. 340, 187-192
Okamoto, K., Ishiura, M., Torii, T., & Aoki, S. (2007). A compact multi-channel apparatus for automated real-time monitoring of bioluminescence. J. Biochem. Biophys. Methods. 70, 535-538
Onai, K., Morishita, M., Itoh, S., Okamoto, K., & Ishiura, M. (2004) Circadian rhythms in the Thermophilic Cyanobacterium Thermosynechococcus elongatus: Compensation of period length over a wide temperature range. J. Bacteriol., 186, 4972-4977
Shinsuke Kutsuna and Setsuyuki Aoki 348
Otto, B., Grimm, B., Ottersbach, P. & Kloppstech, K. (1988) Circadian control of the accumulation of mRNAs for light- and heat-inducible chloroplast proteins in pea (Pisum sativum L.). Plant. Physiol. 88, 21–25
Rikin, A. (1992) Circadian rhythm of heat resistance in cotton seedlings: synthesis of heat-shock proteins. Eur. J. Cell Biol. 59, 160–165
Roenneberg, T. & Carpenter, E. J. (1993). Daily rhythm of O2-evolution in the cyanobacterium Trichodesmium thiebautii under natural and constant conditions. Marine boil. 117, 693-697
Ruecker, O., Zillner, K., Groebner-Ferreira, R., & Heitzer, M. (2008) Gaussia-luciferase as a sensitive reporter gene for monitoring promoter activity in the nucleus of the green alga Chlamydomonas reinhardtii. Mol. Genet Genomics. 280, 153-162
Szent-Gyorgyi C, Schmidt B. F., Creeger, Y., Fisher, G. W., Zakel, K. L., Adler, S., Fitzpatrick, J. A., Woolford, C. A., Yan, Q., Vasilev, K. V., Berget, P. B., Bruchez, M. P., Jarvik, J. W., & Waggoner, A. (2008) Fluorogen-activating single-chain antibodies for imaging cell surface proteins. Nat. Biotechnol. 2, 235-240
Stanley, E. P., Quantitation of picomole amounts of NADH, NADPH, and FMN using bacterial luciferase. In: DeLuca, M. A. Bioluminescence and chemiluminescence: Vol. 57. Methods in enzymology. New York, USA: Academic Press; 1978; 215-222.
Takai, N., Ikeuchi, S., Manabe, K., & Kutsuna, S. (2006). Expression of the circadian clock-related gene pex in cyanobacteria increases in darkness and is required to delay the clock. J. Biol. Rhythms. 21, 235-244
Terauchi, K., Katayama, M., Fujita, Y. & Kondo, T.: Circadian rhythm of the facultative cyanobacterium Plectonema boryanum. In: van der Est, A. & Bruce, D. Photosynthesis: Fundamental Aspects to Global Perspectives, vol. 2. Allen Press; 2005; 729-731
Tomita, J., Nakajima, M., Kondo, T. & Iwasaki, H. (2005) No transcription-translation feedback in circadian rhythm of KaiC phosphorylation. Science. 307(5707), 251-254
Vermaas, W. F., Williams, J. G., Rutherford, A. W., Mathis, P. & Arntzen, C. J. (1986) Genetically engineered mutant of the cyanobacterium Synechocystis 6803 lacks the photosystem II chlorophyll-binding protein CP-47. Proc. Natl. Acad. Sci. USA 83, 9474-9477
Vermaas, W. F. J., Rutherford, A. W. & Hansson, O. (1988) Site-directed mutagenesis in photosystem II of the cyanobacterium Synechocystis sp. PCC 6803: Donor D is a tyrosine residue in the D2 protein. Proc. Natl. Acad. Sci. USA 85, 8477-8481
Viviani, V. R., Bechara, E. J. H., & Ohomiya, Y. (1999). Cloning, sequence analysis, and expression of active Phrixothrix railroad-worms luciferases: relationship between bioluminescence spectra and primary structures. Biochemistry. 38, 8271-8279
Williams, J. G. K.: Construction of specific mutations in photosystem II photosynthetic reaction center by genetic engineering methods in Synechocystis 6803. In: Packer, L. & Glazer, A. vol. 167. Methods in enzymol, San Diego, USA: Academic Press; 1988; 766-778
Yamagishi, K., Enomoto, T., and Ohmiya, Y. (2006). Perfusion-culture-based secreted bioluminescence reporter assay in living cells. Anal. Biochem. 354, 15-21
Zang, X., Dong, G., & Golden, S. S. (2006) The pseudo-receiver domain of CikA regulates the cyanobacterial circadian input pathway. Mol. Microbiol.60, 658-668
In: Handbook on Cyanobacteria ISBN: 978-1-60741-092-8 Editors: P. M. Gault and H. J. Marler © 2009 Nova Science Publishers, Inc.
Chapter 12
ASSESSING THE HEALTH RISK OF FLOTATION-NANOFILTRATION SEQUENCE FOR CYANOBACTERIA AND CYANOTOXIN REMOVAL IN DRINKING WATER
Margarida Ribau Teixeira*
Faculty of Sciences and Technology, University of Algarve, Campus de Gambelas, Faro, Portugal
ABSTRACT
The human heath risk potential associated with the presence of cyanobacteria and cyanotoxins in water for human consumption has been evaluated. This risk is related to the potential production of taste and odour compounds and toxins by cyanobacteria, which may cause severe liver damage, neuromuscular blocking and are tumour promoters. Therefore, its presence in water, used for drinking water production and/or recreational activities, even at low concentrations, has particular interest to the water managers due to the acute toxicity and sublethal toxicity of these toxins, and may result in necessity of upgrading the water treatment sequences.
The need for risk management strategies to minimize these problems has been recognised in different countries. One of these strategies could pass through the implementation of a safe treatment sequence that guarantees a good drinking water quality, removing both cyanobacteria and cyanotoxins, despite prevention principle should be the first applied.
This work is a contribution for the development of one of these sequences, based on the removal of intact cyanobacteria and cyanotoxins from drinking water, minimising (or even eliminating) their potential heath risk. The sequence proposed is dissolved air flotation (DAF) and nanofiltration: DAF should profit the flotation ability of cyanobacteria and remove them without cell lysis, i.e. without releasing the cyanotoxins into the water; nanofiltration should remove the cyanotoxins present in water (by natural and/or induced release) down to a safe level for human supply.
Results indicated that DAF – nanofiltration sequence guaranteed a full removal of the cyanobacterial biomass (100% removal of chlorophyll a) and the associated microcystins. Microcystin concentrations in the treated water were always under the
* Tel.: +351-289-800900, ext 7235; Fax: +351-289-800069; e-mail: [email protected]
Margarida Ribau Teixeira 350
quantification limit, i.e. far below the World Health Organization (WHO) guideline value of 1 μg/L for microcystin-LR in drinking water. Therefore, this sequence is a safe barrier against M. aeruginosa and the associated microcystins variants in drinking water, even when high concentrations are present in raw water, and nanofiltration water recovery rates as high as 84% could be used. In addition, it ensures an excellent control of particles (turbidity), and disinfection by-products formation (very low values of DOC, UV254nm and SUVA were achieved), as well as other micropollutants (above ca. 200 g/mol, e.g. anatoxin-a) that might be present in the water.
1. INTRODUCTION The presence of toxic cyanobacteria and cyanotoxins in a water body represents a
potential risk for human health because cyanotoxins are responsible for hepatic and neuromuscular lesions and tumours. Cyanobacteria release to the water, not only cyanotoxins but also other compounds that may cause odour and taste decreasing the water’s organoleptic and chemical quality. Hence, the growth of cyanobacteria in a water body used for human supply is a problem faced by water managements and Water Treatment Plants engineering, which may result in the need to upgrade the water treatment system.
Therefore, the management and control of water bodies used for human water supply with episodes of cyanobacteria and cyanotoxins must be tackled at different levels in the hierarchy of the total water supply system (Hrudey et al. (1999)). The first level is the assessment of the water body regarding the potential impact of blooms and cyanotoxins on water quality and public health. In this level the preference for control is the prevention of eutrophication. The second level of the hierarchy is related with engineering techniques at the water body or reservoirs to change its hydrophysical conditions and reduce the cyanobacterial growth. These techniques include the positioning of offtakes, the selection of intake depth and the use of barriers to restrict scum movements. Another intervention is the chemical treatment with algicides. This last technique has created controversy in the scientific community because of the environmental impacts, which include the release of cyanotoxins in the water body. The last level for controlling cyanobacteria and cyanotoxins in water supplies is related with the treatment system. At this level, the priority should be the use of water treatment technologies that remove intact cells and then remove the toxins present in the water (present in the raw water or released during the treatment) (Hrudey et al. (1999)).
This work concentrates on the last level. It focuses on the study of new methods for water treatment to face this growing problem, endowing the Water Treatment Plant engineering with alternative technical options. These methods could lead to an actualisation of the water treatment system, if the prevention management options did not succeed. The methods studied include flotation and nanofiltration technologies.
In recent years, surveys have been carried out in a number of countries in Europe, Africa, Asia, Australia and South America in water reservoirs used for drinking water abstraction. The conclusions from these surveys are that toxic cyanobacteria are worldwide, and that as further surveys are carried out more toxic cyanobacterial blooms and new toxic species will be discovered (Sivonnen and Jones (1999)). In Portugal, the situation is similar and cyanotoxins (microcystins) have already been found from north (Vasconcelos et al. (1996)) to south (Rosa et al. (2004)).
Assessing the Health Risk of Flotation-Nanofiltration Sequence… 351
Many conventional water treatment technologies (coagulation (C)/ flocculation (F)/ sedimentation (S), filtration) have been reported to be ineffective for removing them (Hoffmann (1976), Hrudey et al. (1999)). Cyanotoxins have been found to degrade in the presence of strongly oxidizing conditions, such as high levels of chlorine or ozone (Keijola et al. (1988), Rositano et al. (1998)). However, the effectiveness of these technologies depend upon the water quality, particularly the natural organic matter (NOM) content, pH and alkalinity (Rositano et al. (2001), Tsuji et al. (1997)), and on the health implications of potential hazards associated with the by-products formed (Lawton and Robertson (1999)). Adsorption systems using granular or powdered activated carbon have been successfully employed to remove microcystins in both bench and full scale experiments (Falconer et al. (1989), Cook and Newcombe (2002)). Nevertheless, their performance is also dependent on the NOM competitive adsorption (Lambert et al. (1996), Donati et al. (1994)).
Membrane processes are increasingly used in drinking water treatment to meet more stringent water quality regulations. Nanofiltration (NF) is one of the membrane water treatment processes that removes multivalent ions, small hazardous microcontaminants (e.g., pesticides, toxins, endocrine disruptors) and NOM from surface water (Hong and Elimelech (1997), Schäfer et al. (1998)). The removal of NOM from drinking water is of great importance due to its potential to form disinfection by-products when waters are disinfected with chlorine (Pomes et al. (1999), Siddiqui et al. (2000)) and to promote biofilm growth in water distribution networks. NOM is also considered one of the major cause of NF fouling during the membrane filtration of surface waters (Hong and Elimelech (1997), Schäfer et al. (1998), Nyström et al. (1995), Cho et al. (1999)).
NOM is a heterogeneous organic mixture with slightly water-soluble compounds. It is one of the main constituents of natural surface waters and may be divided into hydrophobic and hydrophilic compounds, being humic substances part of the hydrophobic compounds. Humic substances are refractory anionic polyelectrolytes (due to the dissociation of the carboxylic (and phenolic) functional groups) of low to moderate molecular weight (Stumm (1992)). At high ionic strength or low pH, humic substances have a small hydrodynamic radius in solution (more spherocolloidal) and at low ionic strength or high pH, humic substances have a large hydrodynamic radius (more linear) due to the intermolecular charge repulsion (Stumm (1992)).
Cyanobacteria and cyanotoxins represent a risk to the human health. Therefore, the identification of the main routes of human contact to cyanobacterial toxins are essential when assessing the health risks. Chorus et al. (2000) consider three routes of exposure, namely direct contact of exposed parts of the body (eyes, ears, mouth and throat); accidental ingestion of water containing cells; and aspiration (inhalation) of water containing cells. More recently, another work (Dietrich and Hoeger (2005)) analyse microcystin-LR risk assessment and guideline values for four exposure scenarios: accumulation of cyanobacterial toxins in the food chain; dermal, nasal or oral (accidental ingestion) contact during recreational use of water; drinking water and intoxication during hemodialysis; and involuntary exposure via contaminated blue-green algal food supplements. In this work, the main route of human contact to cyanobacteria and cyanotoxins are drinking water ingestion, although the contact during recreational use of water could also be considered.
According with Thoeye et al. (2003), two main approaches can be taken to health risk assessment:
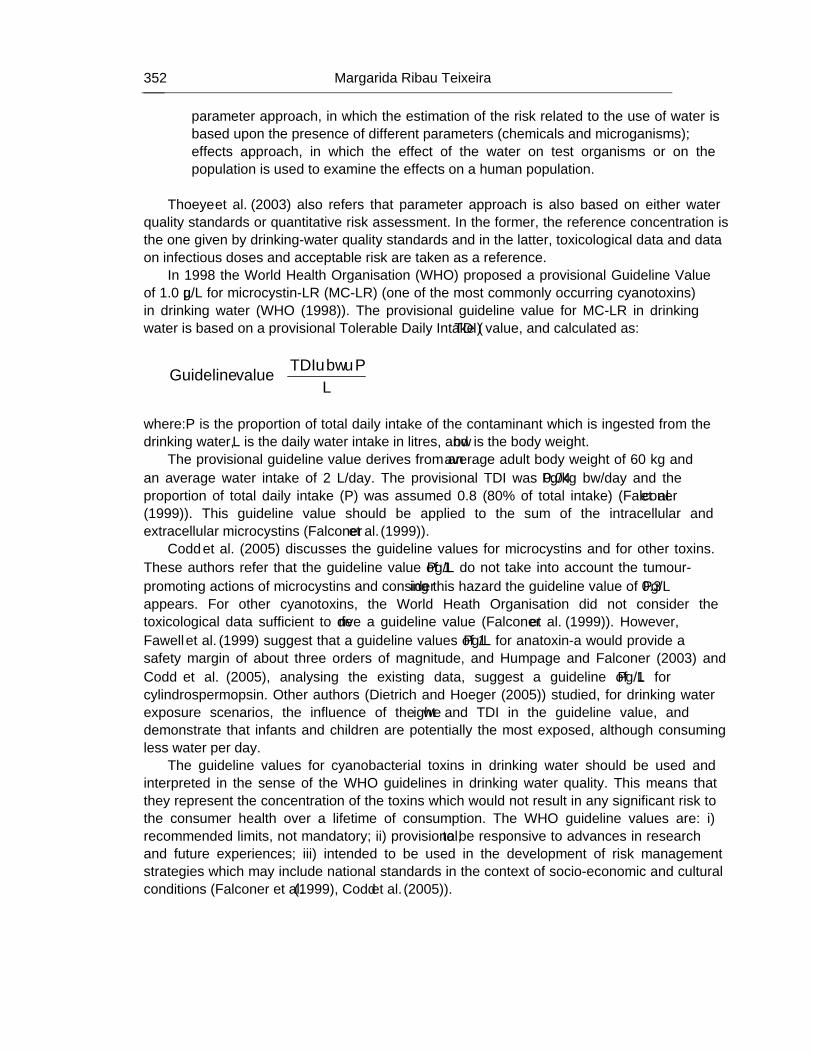
Margarida Ribau Teixeira 352
• parameter approach, in which the estimation of the risk related to the use of water is based upon the presence of different parameters (chemicals and microganisms);
• effects approach, in which the effect of the water on test organisms or on the population is used to examine the effects on a human population.
Thoeye et al. (2003) also refers that parameter approach is also based on either water
quality standards or quantitative risk assessment. In the former, the reference concentration is the one given by drinking-water quality standards and in the latter, toxicological data and data on infectious doses and acceptable risk are taken as a reference.
In 1998 the World Health Organisation (WHO) proposed a provisional Guideline Value of 1.0 µg/L for microcystin-LR (MC-LR) (one of the most commonly occurring cyanotoxins) in drinking water (WHO (1998)). The provisional guideline value for MC-LR in drinking water is based on a provisional Tolerable Daily Intake (TDI) value, and calculated as:
LPbwTDIvalueGuideline ××
=
where: P is the proportion of total daily intake of the contaminant which is ingested from the drinking water, L is the daily water intake in litres, and bw is the body weight.
The provisional guideline value derives from an average adult body weight of 60 kg and an average water intake of 2 L/day. The provisional TDI was 0.04 μg/kg bw/day and the proportion of total daily intake (P) was assumed 0.8 (80% of total intake) (Falconer et al. (1999)). This guideline value should be applied to the sum of the intracellular and extracellular microcystins (Falconer et al. (1999)).
Codd et al. (2005) discusses the guideline values for microcystins and for other toxins. These authors refer that the guideline value of 1 μg/L do not take into account the tumour-promoting actions of microcystins and considering this hazard the guideline value of 0.3 μg/L appears. For other cyanotoxins, the World Heath Organisation did not consider the toxicological data sufficient to derive a guideline value (Falconer et al. (1999)). However, Fawell et al. (1999) suggest that a guideline values of 1 μg/L for anatoxin-a would provide a safety margin of about three orders of magnitude, and Humpage and Falconer (2003) and Codd et al. (2005), analysing the existing data, suggest a guideline of 1 μg/L for cylindrospermopsin. Other authors (Dietrich and Hoeger (2005)) studied, for drinking water exposure scenarios, the influence of the weight and TDI in the guideline value, and demonstrate that infants and children are potentially the most exposed, although consuming less water per day.
The guideline values for cyanobacterial toxins in drinking water should be used and interpreted in the sense of the WHO guidelines in drinking water quality. This means that they represent the concentration of the toxins which would not result in any significant risk to the consumer health over a lifetime of consumption. The WHO guideline values are: i) recommended limits, not mandatory; ii) provisional, to be responsive to advances in research and future experiences; iii) intended to be used in the development of risk management strategies which may include national standards in the context of socio-economic and cultural conditions (Falconer et al. (1999), Codd et al. (2005)).
Assessing the Health Risk of Flotation-Nanofiltration Sequence… 353
In the European Union, these toxins are not clearly regulated. However, the European Water Framework Directive (2000/60/EC, European Union (2000)) characterises them as high priority water pollutants, and toxin producing cyanobacteria have been specifically highlighted as potential key hazardous pollutants. Besides this, some European Countries, like Czech Republic, France, Poland, Portugal and Spain, have already created specific national legislation (Chorus (2005), Ministry of Environment (2007)). Other guideline values for cyanobacterial toxins exist in several countries worldwide (Australia, Brazil, Canada, New Zealand, respectively NHMRZ/ARMCANZ (2001), Carmichael et al. (2001), Heath Canada (2002), Ministry of Health (2002)), most of these countries having a history of problems with cyanobacteria in drinking water reservoirs.
Besides these guideline values, the WHO through the work of Bartram et al. (1999) established Alert Levels with the objective of providing the water treatment plant operators and managers with a graduated response to the onset and progress of cyanobacterial bloom. The Alert Levels Framework developed for the assessment of a potentially toxic cyanobacterial bloom provides appropriate actions and responses through three stages of progressing cyanobacterial numbers: Vigilance Level (initial detection), Alert Level 1 (moderate to high cyanobacterial number and possible detection of toxins above guideline values) and Alert Level 2 (very high cyanobacterial biomass level with potential health risks).
The indicative value for Vigilance Level is the detection of one colony or five filaments of a cyanobacterium in a 1 mL water sample, i.e. 200 cells per mL or 0.1 μg/L chlorophyll a. Taste and odours may become detectable but their absence does not indicate absence of toxic cyanobacteria. This level constitutes an early warning for potential bloom formation (Bartram et al. (1999)).
The Alert Level 1 derives both from the WHO guideline value for MC-LR in drinking water and from the highest recorded microcystin content for cyanobacterial cells. It is 2,000 cells per mL of cyanobacterial biomass or 0.2 mm3/L biovolume or 1 μg/L chlorophyll a. This level requires consultation with health authorities for ongoing assessment of the status of the bloom and of the suitability of treated water for human supply (Bartram et al. (1999)).
The Alert Level 2, cyanobacterial biomass 100,000 cells per mL or 10 mm3/L biovolume or 50 μg/L chlorophyll a, describes an established and toxic bloom with high biomass and possibly also localised scum (although scums may also form under Alert Level 1 conditions). Conditions in this level are indicative of increase in the risk of human health effects. The need for effective water treatment systems and on-going assessment of the performance of the system thus becomes of heightened importance (Bartram et al. (1999)).
From the explanation made, it is of great importance to investigate safe barriers against cyanotoxins in a wide range of natural waters, so that the public health risk may be reduced. Therefore, the objective of this work is to study a sequence that could remove both cyanobacteria and cyanotoxins from drinking water and evaluate the associated risk of this sequence. This work includes a synthesis and an actualisation of the work already published in Ribau Teixeira (2005), Ribau Teixeira and Rosa (2005), Ribau Teixeira and Rosa (2006a), Ribau Teixeira and Rosa (2006c), Ribau Teixeira and Rosa (2006d), and Ribau Teixeira and Rosa (2007), as well as a risk approach.
Margarida Ribau Teixeira 354
2. CYANOBACTERIA AND CYANOTOXINS In this chapter, a brief description of cyanobacteria and cyanotoxins is made. The
objective is to describe some of the general characteristics of the cyanobacteria and cyanotoxins used in the present work done. It is not intended to describe exhaustively cyanobacteria and cyanotoxins, much more could be written about this group of organisms and its toxins.
2.1. Cyanobacteria Cyanobacteria, also known as blue-green algae, are a group of organisms that occur both
in freshwater and marine environments. They are uni- and multicellular prokaryotes that possess chlorophyll a and use photosynthesis as their principal mode of energy metabolism. Therefore, their life processes require only water, carbon dioxide, inorganic substances and light.
The basic morphology comprises unicellular, colonial and multicellular filamentous forms. Unicellular forms have spherical, ovoid or cylindrical cells. The cells may aggregate into irregular colonies, being held together by the slimy matrix secreted during the growth of the colony (Microcystis sp). The multicellular structure consisting of a chain of cells is called trichome, which may be straight or coiled. Cell size and shape show great variability among the filamentous cyanobacteria. Some species (order Oscillatoriales) are composed of essentially identical cells, unseriated and unbranched trichomes. Other filamentous species (orders Nostocales and Stigonematales) are characterised with trichomes having a heterogeneous cellular composition, with or without branches (Mur et al. (1999)).
Cyanobacteria have several important adaptations that help them to survive in environments where no other microalgae can exist, like the ability to store essential nutrients and metabolites within their cytoplasm and to fix nitrogen in the heterocyst cells. Some of them possess gas vesicles as another adaptation. These gas vesicles enable the buoyancy regulation, allow them to regulate their position in the water column and give them a distinct ecologic advantage over other planktonic species. A gas vesicle has a density of about one tenth that of water and thus gas vesicles can give cyanobacterial cells a lower density than water. Gas vesicles become more abundant when light is reduced and its growth rate slows down. Increases in the turgor pressure of cells, as a result of the accumulation of photosynthate, cause a decrease in existing gas vesicles and therefore a reduction in buoyancy. Cyanobacteria can, by such buoyancy regulation, poise themselves within vertical gradients of physical and chemical factors (Walsby et al. (1992)).
Cyanobacterial cells are microscopic, typically less than 10 μm in length or diameter, but the presence of very small cells of cyanobacteria (in the size range from 0.2 – 2 μm) has been recognised as a potentially significant source of primary production in various freshwater and marine environments (Mur et al. (1999)). Cyanobacteria can form blooms with millions of colonies in nutrient-rich water bodies. Factors such as nitrogen, phosphorus, temperature, light, micronutrients and buoyancy, have all been referred as factors affecting bloom formation. These blooms are usually found in lakes and reservoirs, but more recently very slow flowing rivers and sediments have also been affected (Lawton and Robertson (1999),
Assessing the Health Risk of Flotation-Nanofiltration Sequence… 355
Mohamed et al. (2007)), as well as marine environments (Zimba et al. (2006), Takahashi et al. (2007)).
2.2. Cyanotoxin Cyanobacteria produce a variety of metabolites either toxic (cyanotoxins) or non-toxic,
which natural function is unclear. Cyantoxins are produced and retained within healthy and actively growing cyanobacterial cells (i.e. these cyanotoxins are intracellular or in the particulate form) when the growing conditions are favourable. The amount of cyanotoxin increases in a culture during the logarithmic growth phase, being highest in the late logarithmic phase. They are only released into the surrounding water when cells senesce, die and lise (extracellular or dissolved toxins). Normally in healthy logarithmic phase cultures less than 10-20% of the total toxin is extracellular. As cells enter stationary phase the increased rate of cell death may lead to an increase in the extracellular dissolved fraction (Sivonnen and Jones (1999)). The range of measured concentration for dissolved cyanotoxins is 0.1 – 10 μg/L, except if a major bloom is breaking down (Jones and Orr (1994), Lahti et al. (1997)).
The effects of several environmental factors on growth and toxin production by cyanobacteria have been studied. Culture age, temperature, light, nutrients, salinity, pH and micronutrients concentration are the most frequently examined parameters. Environmental factors affect toxin content of cyanobacteria, but within a range of less than an order of magnitude (Sivonnen and Jones (1999)).
Cyanotoxins are a diverse group, both from the toxicological and the chemical points of view. They are classified toxicologically into hepatotoxic, neurotoxic and dermatotoxic. Classified by their chemical structure, they are included into three groups: cyclic peptides, alkaloids and lipopolysaccharides.
2.2.1. Cyclic Peptide Hepatotoxins: Microcystins
Hepatotoxic cyclic peptides of the microcystin (MC) family are the most frequently found cyanobacterial toxins in blooms from fresh and brackish waters. Microcystins have been described from the genera Microcystis, Anabaena, Planktothrix, Nostoc and Anabeanopsis (Carmichael (1997)). At least 76 different microcystins found in natural blooms and laboratory cultures of cyanobacteria are reported in scientific literature (Sivonnen and Jones (1999), Spoof (2004)).
The cyclic peptides are rather small molecules with molecular weight ranging from 800 – 1100 g/mol. Microcystins contain seven amino acids, with the two terminal amino acids of the linear peptide being condensed (joined) to form a cyclic compound. The general structure of microcystins is cyclo(-D-Ala1-L-X2-D-erythro-β-methylisoAsp3-L-Z4-Adda5-D-Glu6-N-methyledydroAla7), where Adda is (2S,3S,8S,9S)-3-amino-9-methoxy-2,6,8-trimethyl-10-phenyldeca-4,6-dienoic acid (Figure 0.1). The main structural variation in microcystins is in the L-amino acids residues 2 (designated as X) and 4 (Z). For the commonly occurring microcystin-LR (MC-LR), leusine is in position X and arginine is in position Z (Meriluoto (1997)).
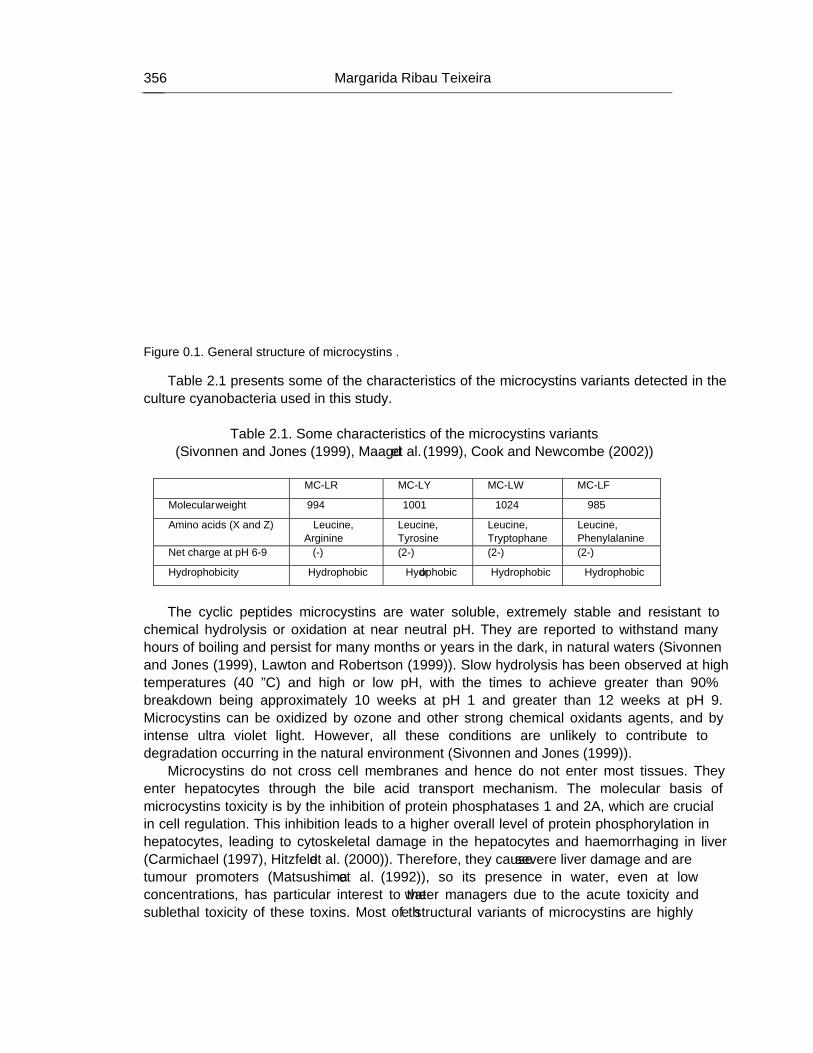
Margarida Ribau Teixeira 356
Figure 0.1. General structure of microcystins .
Table 2.1 presents some of the characteristics of the microcystins variants detected in the culture cyanobacteria used in this study.
Table 2.1. Some characteristics of the microcystins variants
(Sivonnen and Jones (1999), Maagd et al. (1999), Cook and Newcombe (2002)) MC-LR MC-LY MC-LW MC-LF
Molecular weight 994 1001 1024 985
Amino acids (X and Z) Leucine, Arginine
Leucine, Tyrosine
Leucine, Tryptophane
Leucine, Phenylalanine
Net charge at pH 6-9 (-) (2-) (2-) (2-)
Hydrophobicity Hydrophobic Hydrophobic Hydrophobic Hydrophobic
The cyclic peptides microcystins are water soluble, extremely stable and resistant to
chemical hydrolysis or oxidation at near neutral pH. They are reported to withstand many hours of boiling and persist for many months or years in the dark, in natural waters (Sivonnen and Jones (1999), Lawton and Robertson (1999)). Slow hydrolysis has been observed at high temperatures (40 ºC) and high or low pH, with the times to achieve greater than 90% breakdown being approximately 10 weeks at pH 1 and greater than 12 weeks at pH 9. Microcystins can be oxidized by ozone and other strong chemical oxidants agents, and by intense ultra violet light. However, all these conditions are unlikely to contribute to degradation occurring in the natural environment (Sivonnen and Jones (1999)).
Microcystins do not cross cell membranes and hence do not enter most tissues. They enter hepatocytes through the bile acid transport mechanism. The molecular basis of microcystins toxicity is by the inhibition of protein phosphatases 1 and 2A, which are crucial in cell regulation. This inhibition leads to a higher overall level of protein phosphorylation in hepatocytes, leading to cytoskeletal damage in the hepatocytes and haemorrhaging in liver (Carmichael (1997), Hitzfeld et al. (2000)). Therefore, they cause severe liver damage and are tumour promoters (Matsushima et al. (1992)), so its presence in water, even at low concentrations, has particular interest to the water managers due to the acute toxicity and sublethal toxicity of these toxins. Most of the structural variants of microcystins are highly
Assessing the Health Risk of Flotation-Nanofiltration Sequence… 357
toxic within a comparatively narrow range. The LD50 (lethal dose resulting in 50% deaths) by the intra-peritoneal is in the range 25-150 μg/kg body weight in mice (a value of 50 or 60 μg/kg body weight is commonly accepted) (Kuiper-Godman et al. (1999)).
2.2.2. Alkaloid Toxins: Anatoxin-a
The alkaloid toxins are diverse, both in their chemical structures and in their mammalian toxicities. Alkaloids, in general, are a broad group of heterocyclic nitrogenous compounds (i.e. they contain ring structures with, at least, one carbon-nitrogen bond) usually of low to moderate molecular weight (< 1000 g/mol). Alkaloids have varying chemical stabilities, often undergoing spontaneous transformations to by-products which may have higher or, lower potencies than the parent toxin (Sivonnen and Jones (1999)).
Anatoxin-a (ATX-a) is one of the three families of neurotoxic alkaloids toxins known and has been found in Anabeana, Oscillatoria Planktothrix spp, Aphanizomenon and Cylindrospermum. Anatoxin-a is a postsynaptic neuromuscular blocking agent, i.e. nicotinic agonists because it mimics the effect of acetylcholine. It can induce muscle twitching and cramping, followed by fatigue and paralysis and death by respiratory arrest (Carmichael (1994)). The LD50 for this toxin is 200 μg/kg body weight (intra-peritoneal mouse) (Spoof (2004)).
Anatoxin-a is a low molecular weight alkaloid, 166 g/mol, a secondary amine, 2-acetyl-9-azabicyclo(4-2-1)non-2-ene (Figure 0.2). It is a hydrophilic, positive toxin. Anatoxin-a is relatively stable in dark, but in pure solution and in the absence of pigments it undergoes rapid photochemical degradation in sunlight. Breakdown is further accelerated by alkaline conditions (Sivonnen and Jones (1999)).
Figure 0.2. The chemical structure of anatoxin-a.
3. DISSOLVED AIR FLOTATION
3.1. Introduction
3.1.1. General
Dissolved air flotation (DAF) is a unit operation used to separate solid particles from a liquid phase. Separation is brought about by introducing fine gas (usually air) bubbles into the liquid phase. Bubbles are generated by the release of pressurised water which has first been air saturated at higher pressure than the atmospheric pressure. The bubbles attach to the
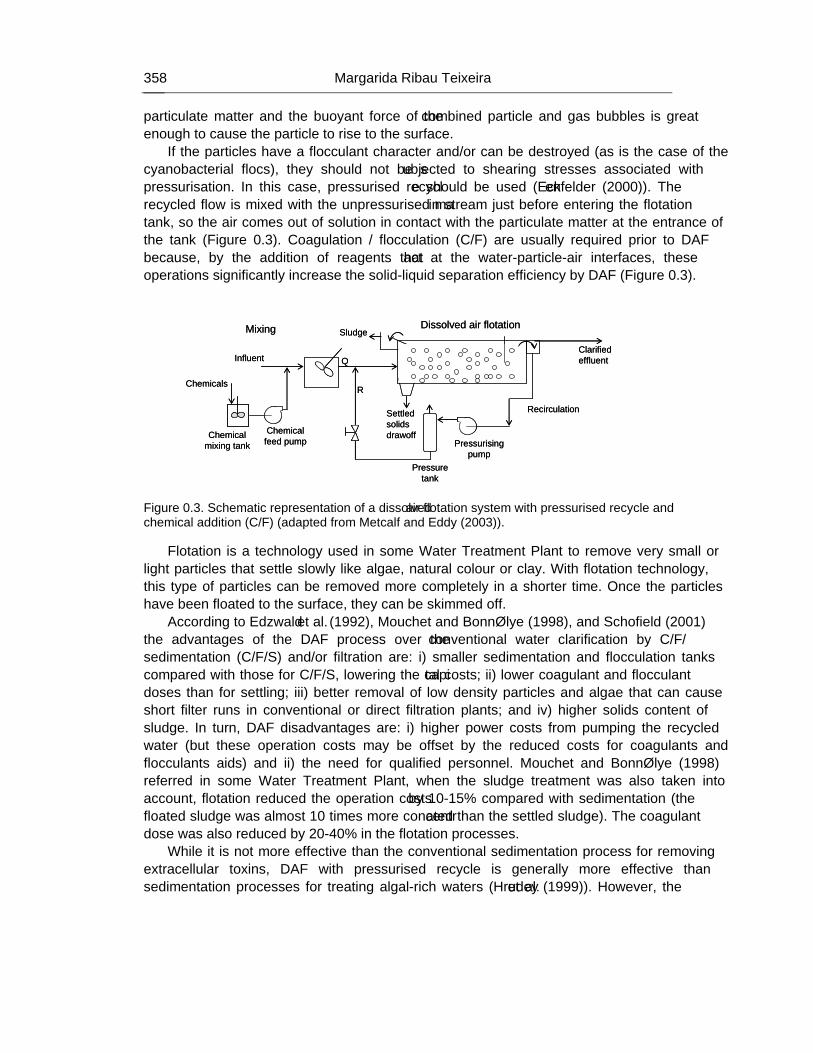
Margarida Ribau Teixeira 358
particulate matter and the buoyant force of the combined particle and gas bubbles is great enough to cause the particle to rise to the surface.
If the particles have a flocculant character and/or can be destroyed (as is the case of the cyanobacterial flocs), they should not be subjected to shearing stresses associated with pressurisation. In this case, pressurised recycle should be used (Eckenfelder (2000)). The recycled flow is mixed with the unpressurised main stream just before entering the flotation tank, so the air comes out of solution in contact with the particulate matter at the entrance of the tank (Figure 0.3). Coagulation / flocculation (C/F) are usually required prior to DAF because, by the addition of reagents that act at the water-particle-air interfaces, these operations significantly increase the solid-liquid separation efficiency by DAF (Figure 0.3).
Mixing
Influent
Chemicals
Sludge
Recirculation
Pressure tank
Settled solids drawoff
Clarified effluent
Dissolved air flotation
Pressurising pump
Chemical mixing tank
Chemical feed pump
Q
R
Mixing
Influent
Chemicals
Sludge
Recirculation
Pressure tank
Settled solids drawoff
Clarified effluent
Dissolved air flotation
Pressurising pump
Chemical mixing tank
Chemical feed pump
Q
R
Figure 0.3. Schematic representation of a dissolved air flotation system with pressurised recycle and chemical addition (C/F) (adapted from Metcalf and Eddy (2003)).
Flotation is a technology used in some Water Treatment Plant to remove very small or light particles that settle slowly like algae, natural colour or clay. With flotation technology, this type of particles can be removed more completely in a shorter time. Once the particles have been floated to the surface, they can be skimmed off.
According to Edzwald et al. (1992), Mouchet and Bonnélye (1998), and Schofield (2001) the advantages of the DAF process over the conventional water clarification by C/F/ sedimentation (C/F/S) and/or filtration are: i) smaller sedimentation and flocculation tanks compared with those for C/F/S, lowering the capital costs; ii) lower coagulant and flocculant doses than for settling; iii) better removal of low density particles and algae that can cause short filter runs in conventional or direct filtration plants; and iv) higher solids content of sludge. In turn, DAF disadvantages are: i) higher power costs from pumping the recycled water (but these operation costs may be offset by the reduced costs for coagulants and flocculants aids) and ii) the need for qualified personnel. Mouchet and Bonnélye (1998) referred in some Water Treatment Plant, when the sludge treatment was also taken into account, flotation reduced the operation costs by 10-15% compared with sedimentation (the floated sludge was almost 10 times more concentrated than the settled sludge). The coagulant dose was also reduced by 20-40% in the flotation processes.
While it is not more effective than the conventional sedimentation process for removing extracellular toxins, DAF with pressurised recycle is generally more effective than sedimentation processes for treating algal-rich waters (Hrudey et al. (1999)). However, the
Assessing the Health Risk of Flotation-Nanofiltration Sequence… 359
type and dose of coagulant, as well as the C/F/DAF operating conditions are key parameters for removing intact cyanobacterial cells. 3.1.2. Optimisation of the Operating Conditions
There are many DAF studies on the laboratorial optimisation of the operating conditions of the process and comparison with the conventional sedimentation, as well as studies with flotation systems already working in a Water Treatment Plant. Generally, these studies are consonant about the importance of the C/F pre-treatment to the DAF process efficiency. This is attributed to the DAF dependency of the particle and bubble charges, effective flotation requiring destabilised particles of low or no charge and hydrophobic particles (Edzwald et al. (1992)), Fukushi et al. (1995), Han et al. (2001)).
In the C/F pre-treatment, the key operating conditions are the flocculation time, the size of the flocs, the velocity gradients (G) for coagulation and flocculation, and the coagulant type and dose. The parameter usually considered to optimise the DAF operating conditions is the bubble concentration, affected by the recycle ratio and the air saturation pressure. Other aspects like nozzle type have also been referred (Dupre et al. (1998), Schofield (2001), Ta et al. (2001)).
For instance, Edzwald et al. (1992) studied the effect of the flocculation time, the floc size and the air requirements on the DAF performance for treating three types of waters using both bench-scale and pilot plant data. They concluded that long flocculation times are not necessary for efficient DAF (5 – 8 minutes vs. the normal 20 min for flocculation prior to sedimentation), the floc size should be between 10 – 100 μm (ideally between 10 – 30 μm) and a bubble concentration of 1000 – 10,000 mg/L guarantees good collision opportunities between the particles and the air bubbles. To produce these microbubbles, a saturation pressure of 400 – 600 kPa is recommended. They found good removal efficiencies with 4600 mg/L of bubbles (8% recycle ratio) in waters with 2 – 15 mg/L of dissolved organic carbon (DOC), 20 – 100 mg/L of clay and 2x10⁴ – 5x10⁵ of algae cells /mL.
In what concerns the reduction of the flocculation time, there has been some consensus among the authors: from 20 – 30 minutes in flocculation of the conventional sequence (C/F/S) to 5 – 10 minutes in the DAF sequence (C/F/DAF) (Malley and Edzwald (1991), Fukushi et al. (1995), Valade et al. (1996), Vlaski et al. (1996), Han et al. (2001)). However, the opinions diverge about the floc size. Valade et al. (1996), Jameson (1999) and Bache and Rasool (2001) referred that larger flocs are not necessary after flocculation, while Fukushi et al. (1995) demonstrated that larger flocs have higher collision efficiency.
For the velocity gradient, values between 30 and 80 s-1 have been proposed for flocculation. Valade et al. (1996) studied G values of 30 s-1 and 70 s-1. The best results of turbidity and particle counts were obtained for the highest G and 5 minutes of flocculation. However, the G variation had a higher effect when Fe2(SO4)3 was used as coagulant instead of alum (Al2(SO4)3). Based on bench-scale experiments with G values of 10 s-1, 23 s-1 and 70 s-1, Vlaski et al. (1996) found that the algae removal efficiency was similar or better for G of 10 s-1 than 70 s-1 and they concluded that G values of 10 s-1 produced floc volume distributions which lead to a highest DAF removal efficiency, although the flocs were of a weaker structure. In another study, in pilot plant experiments, these authors obtained better turbidity removals with G values of 50 s-1, because the increase of the flocculation energy input created better contact opportunities for the colloidal and particulate matter (Vlaski et al. (1997)). Zabel (1985), Hedberg et al. (1998) and Scriven et al. (1999) also presented G values between 70 – 80 s-1 associated with high algae and turbidity removals.
Margarida Ribau Teixeira 360
The recycle system effectiveness has been referred as crucial to the success and economy of the DAF process (Crossley et al. (2001)). In this line, Edzwald et al. (1992) studied different recycle ratios from 2 to 10% and verified that 8% was a good value for the recycle ratio in terms of clay, fulvic acids and algae removal efficiencies. They concluded that there is a minimum recycle or bubble volume concentration needed for effective DAF treatment which increases with increasing raw water concentration or flocculated water turbidity. Kempeneers et al. (2001) made experiments with 6% recycle ratio and Vlaski et al. (1996) with 8%. Schofield (2001) recommended values between 6 and 10%. Higher recycle ratios and saturation pressures resulted in an increase of the mean bubble values to sizes that lead to an insignificant increase of DAF efficiency (Vlaski et al. (1997)).
It is consensus that algal cells are negatively charged and must be completely destabilised by charge neutralisation to allow maximum treatment efficiency (Malley and Edzwald (1991), Edzwald et al. (1992), Mouchet and Bonnélye (1998)). Therefore, the optimisation of the coagulants type and concentration was also been addressed. Coagulants such as aluminium sulphate, ferric sulphate, ferric chloride and polymerised coagulants as polyaluminium chloride (PACI) have been successfully used for treating algal-rich waters. Pre-polymerised coagulants have some advantages over metal salt coagulants: better overall treatment efficiency, better floc separation, wider working pH range, lower sensitivity to low temperatures and lower residual metal-ion concentration (Jiang et al. (1993), Schofield (2001)).
As far as the conventional water treatment process is concerned, some authors reported that the sequence coagulation/ flocculation/ sedimentation (C/F/S), filtration, chlorination may cause cell lysis and release of intracellular toxins into the water (Hoffmann (1976), Lam et al. (1995)), while others observed no release of these compounds to the water (Chow et al. (1998), Drikas et al. (2001), Hrudey et al. (1999)). However, all of them agree on the ineffectiveness of the conventional treatment to remove toxins (Keijola et al. (1988), Himberg et al. (1989), Chow et al. (1998), Hrudey et al. (1999), Ando et al. (1992)). Since algae are low-density particles and some may float, dissolved air flotation (DAF) has proven to be more effective for treating algal-rich water than the conventional clarification by settling. Bauer et al. (1998) demonstrated the DAF efficiency for treating algal rich waters from the Thames river in a full-scale plant. Dissolved air flotation showed better results in reducing the algal load onto subsequent filtration than the precipitator clarifiers. Results from Vlaski et al. (1997), Chung et al. (2000), Kempeneers et al. (2001) and Kwon et al. (2004) demonstrated that DAF process could reach higher efficiencies for improving river water quality with high content of chlorophyll a when compared with conventional treatments. However, in the mentioned studies the influence of the naturally occurring organic matter (NOM) onto cyanobacterial cells removal by DAF is not fully addressed. In fact, coagulation /flocculation is likely the most critical step for algae removal (Vlaski et al. (1997)) and NOM has a very strong influence on coagulation performance, since NOM adsorbs onto natural particles and acts as a particle-stabilising agent in surface waters.
However, it is still not clear how do the different naturally occurring cyanobacterial morphologies behave during C/F/DAF treatment. Actually, while some authors found no significant differences between the removal of Microcystis cells or colonies and Anabaena filaments in a DAF unit (Yan, Jameson (2004)), others reported removal efficiencies of 40 − 80 % for Microcystis, 90 – 100 % for Anabaena and only 30 % for Planktothrix in a Belgian DAF plant (Hrudey et al. (1999)). With respect to cell integrity of filamentous cyanobacteria,
Assessing the Health Risk of Flotation-Nanofiltration Sequence… 361
Velzeboer et al. (1995) found that aluminium sulphate seemed not to cause cell lysis of cultured Anabaena circinalis, at the concentrations and conditions that normally occur in a water treatment plant. Chow et al. (1998) reported that A. circinalis was susceptible to chemicals, but no increase of microcystin in water after C/F/S with ferric chloride was found. For the cyanobacterium Planktothrix sp, there are few water treatment studies. Most of the studies with Planktothrix are related with their distribution and seasonal dynamics, growth rate and factors that affect the growth, like light or nutrients. However, some authors reported that Planktothrix sp produce high concentrations of microcystins and anatoxin-a, bringing problems to the water treatment. For this filamentous cyanobacterium, several authors agree on the removal efficiencies achieved by the conventional water treatment processes (Lahti et al. (2001), Schmidt et al. (2002), Hoeger et al. (2005)), but some report damage of cells and release of toxins to the water (Lahti et al. (2001), Schmidt et al. (2002)).
3.1.3. Treatment / Disposal of Floated Sludge
Treatment of sludge skimmed off from DAF is similar to sludge treatment from sedimentation, but DAF sludges are more concentrated. Their treatment depends on the composition of the raw water. If cyanobacteria are present in raw water, they will be concentrated in the sludge, therefore the potential release of toxins by cell lysis during treatment should be minimised by (Hall et al. (2005)):
• Avoiding recycling, if possible, when cyanobacteria concentrations are highest; • Operating sludge thickeners to ensure good quality supernatants; • Minimising sludge agitation to reduce the potential for cell lysis; • Minimising sludge storage times prior to thickening and dewatering; • Minimising sludge retention time in thickening, without compromising performance. Sludge dewatering by centrifuge or filter press could result in significant cell lysis, and
recycling of liquors from these processes should be avoided at times of highest cyantoxin risk.
Extended storage of sludge for several days prior to disposal (but following sludge treatment) during periods of cyanotoxins risk would be beneficial, since significant toxin biodegradation can occur (Hall et al. (2005)).
Disposal of sludge containing cyanotoxins must follow the procedures establish in legislation. In Portugal, it is the responsibility of the waste producer to identify and quantify any hazardous wastes. The producer is also responsible for the adequate elimination of these wastes. Sludge containing cyanobacteria or/and cyanotoxins must be disposed or incinerated as hazardous waste.
3.2. Material and Methods
3.2.1. Cyanobacterial Cultures These studies were performed with single cells and cell aggregates (colonies) of M.
aeruginosa. Microcystis aeruginosa supplied by Pasteur Culture Collection (PCC 7820) was grown in
laboratory (10 L medium) according to enclosed instructions, i.e. BG11 medium at 23 − 24 ºC
Margarida Ribau Teixeira 362
under a light regimen of 12 hours light, 12 hours dark (~5 μM photon m-2 s-1). Cultures were harvest at the late exponential phase of growth.
Single cells are a more significant nuisance from the water treatment practice point of view, since the single cell form (3 − 10 μm, spherical cells) regularly penetrates treatment processes and is encountered in the treatment plant effluent (Vlaski et al. (1996)). Actually, M. aeruginosa single cells are recognised as surrogate for addressing overall particle removal, even for pathogenic microorganisms of similar size characteristics, like Cryptosporidium parvum and Giardia lambia. Cell aggregates (colonies) of M. aeruginosa were produced by growth media manipulation (Ribau Teixeira (2005)), since no natural bloom occurred during the experiments. After 2-2.5 months, M. aeruginosa cell aggregates could be seen by visual and microscopic inspection. M. aeruginosa is found in nature mostly in colonial form, which is very difficult to produce in laboratory cultures. The cultured material differs physically from naturally occurring field populations of M. aeruginosa for it is made up of small, regular colonies, and many single cells and pairs of cells contain much less mucilage (mucopolysaccharied acid) than natural material. The field populations may contain very large (macroscopic) colonies, and greater amounts of mucilage surrounding them (Sivonnen, Jones (1999), Drikas et al. (2001)). The naturally occurring colonial form should be easier to remove. The toxins variants present in these cultures were MC-LR, MC-LY and MC-LF.
Treatment experiments were performed using tap water, ozonated water and raw water spiked with M. aeruginosa cells or colonies until a specific concentration of chlorophyll a (chl_a) was achieved, namely the Alert Level 2 from Bartram et al. (1999). The Alert Level 2 (cyanobacterial biomass of 100,000 cells per ml or 50 μg/l chl_a) describes an established toxic bloom with high biomass. Conditions in this level indicate an increase in the risk of human health effects, and the need for effective water treatment systems (Bartram et al. (1999)). These suspensions stayed overnight at room temperature before use. As found by other authors (Vlaski et al. (1996)) spiking similar concentrations of cells, and particularly colonies and filaments, from the original culture suspensions was a difficult task, so it was difficult to provide cyanobacteria suspensions with similar chlorophyll a content to all experiments.
3.2.2. Water Samples
Raw water (RW) and ozonated water (OW) (after preozonation) samples were collected in Alcantarilha Water Treatment Plant, Algarve, Portugal, and were then spiked in the laboratory with cultured cyanobacterial cells or colonies prior to the experiments. Since 2000, Alcantarilha Water Treatment Plant supplies water to ca. half million people in southern Portugal (Algarve), and was designed to treat up to 3 m3/s (ca. 1 million people by the year 2020) of surface water from Funcho Dam reservoir (ca. 2 km2 and 43.4 hm3) by a conventional treatment of pre-ozonation, C/F/S, rapid sand filtration and chlorination.
The ozone dose used in Alcantarilha plant was 2.8 mg O3/L. This ozone dose can not be accurately related with raw water DOC since there is a water recirculation of the sludge treatment to ozonation. However, the ozone dose should be less than 1 mg O3/mg DOC.
Tap water and natural water (raw and ozonated waters) were chosen since they represent different types of NOM and NOM contents. However, according to Edzwald and Van Benschoten (1990) classification all waters were largely composed by non-humic substances; the organic matter is relatively hydrophilic, less aromatic and of lower molecular weight
Assessing the Health Risk of Flotation-Nanofiltration Sequence… 363
compared to waters with higher SUVA values, as expected due to drinking water treatment. Tap water has less DOC and UV254nm (resulting in lower SUVA values) than natural water, as well as less turbidity and ozonated water was chosen since ozonation decreases NOM molecular weight and hydrophobicity, as shown by UV254nm and SUVA values (Table 3.1). In addition, preozonation can assist in particulate matter removal by altering the surface characteristics of the solids and enhancing bubble attachment (Schofield (2001)) and, with the ozone dose normally used with natural waters, some cells may pass the ozonation process (Daldorph (1998)).
Table 3.1 also shows the contribution of the cyanobacterial spiking to the water NOM – it was responsible for an input of low molecular weight organics (Ribau Teixeira and Rosa (2006a)) which increased the DOC content, but decreased the water SUVA values (data not shown, obtained in preliminary experiments of cyanobacterial spiking). Conductivity presented the highest value in the water samples spiked with M. aeruginosa since the colonies’ growth medium has much more salts (CaCl2) than the medium of the cell morphology (Table 3.1).
3.2.3. Analytical Methods Samples were analysed for chl_a, turbidity, DOC, pH, conductivity and extracellular
MC-LR, all using standard methods of analysis, whenever available. For chl_a analysis, samples were filtered through GF/F filter paper and the chlorophylls
were extracted using 10 mL acetone (90%). The optical densities of the extracts were measured at 665 and 750 nm using a Spectronic Unicam UV300 UV/VIS spectrophotometer and chl_a concentration was computed from Lorenzen equations (Lorenzen (1967)).
Turbidity was measured in a HACH 2100N turbidity meter of high resolution (0.001 NTU).
DOC (after 0.45 μm sample filtration with acrodisk filters, Aquatron. CA, 30 mm) were measured as non-purgeable organic carbon using a Shimadzu TOC 5000A analyser (50 ppb – 4000 ppm).
pH values were measured at 25 ºC using a Whatman WTW pH340 meter, and conductivity at 20 ºC in a Crison GLP32 conductimeter.
Extracellular MC-LR was first isolated from the intracellular and cell-bound fraction by sample filtration through a Whatman GF/F glass microfiber filter. Microcystins were then extracted from the filtered water samples using an isolute C18 solid phase extraction column, 1 g in a 6 mL reservoir, following the standard operation procedure developed by Meriluoto and Spoof (2005b). The cartridges were first conditioned with 10 mL methanol (75%), followed by 10 mL milli-Q water at a flowrate not exceeding 10 mL/min, without letting it dry during conditioning. The samples were then applied to the cartridge and the microcystin was eluted with 5 mL methanol (90%) containing 0.1% trifluoroacetic acid. The methanolic eluate was evaporated at 50 ºC in a rotavapor, the residue was resuspended in 500 μL methanol (75%), centrifuged for 10 min at 10,000 xg, and 150 μL of supernadant were transferred to HPLC vials for analysis.
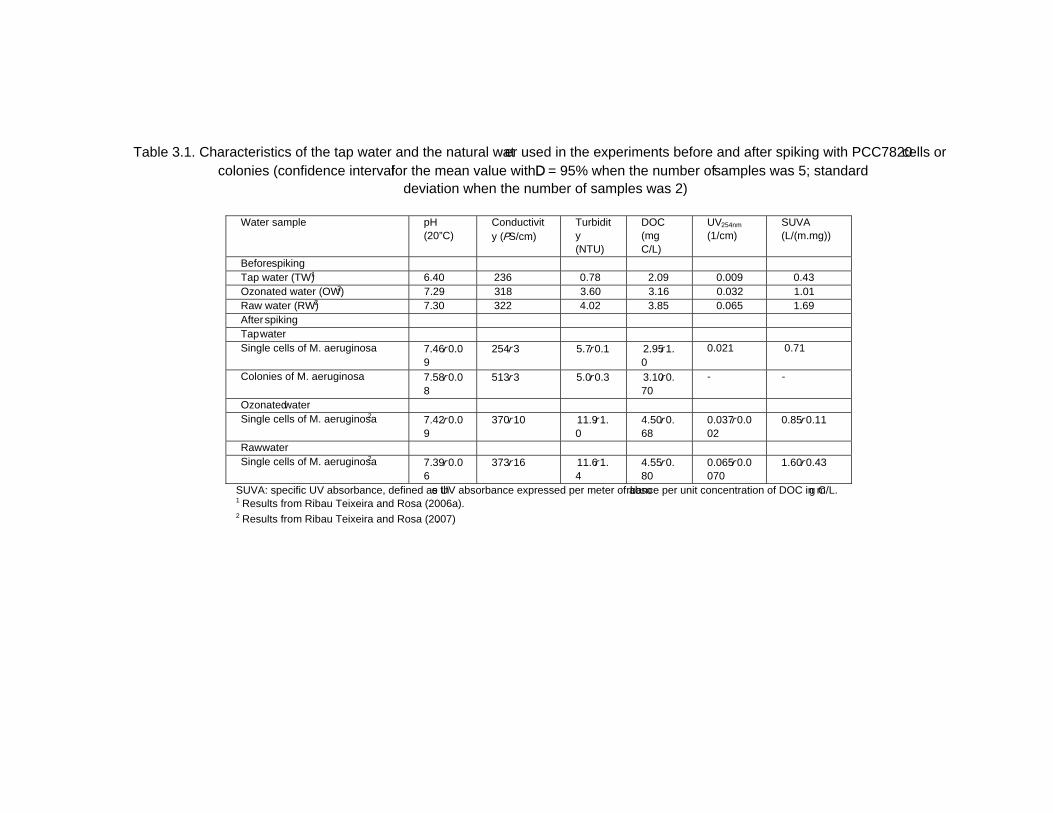
Table 3.1. Characteristics of the tap water and the natural water used in the experiments before and after spiking with PCC7820 cells or colonies (confidence interval for the mean value with α = 95% when the number of samples was 5; standard
deviation when the number of samples was 2)
Water sample pH (20ºC)
Conductivity (μS/cm)
Turbidity (NTU)
DOC (mg C/L)
UV254nm (1/cm)
SUVA (L/(m.mg))
Before spiking Tap water (TW) 1 6.40 236 0.78 2.09 0.009 0.43 Ozonated water (OW) 2 7.29 318 3.60 3.16 0.032 1.01 Raw water (RW) 2 7.30 322 4.02 3.85 0.065 1.69 After spiking Tap water Single cells of M. aeruginosa 7.46±0.0
9 254±3 5.7±0.1 2.95±1.
0 0.021 0.71
Colonies of M. aeruginosa 7.58±0.08
513±3 5.0±0.3 3.10±0.70
- -
Ozonated water Single cells of M. aeruginosa 2 7.42±0.0
9 370±10 11.9±1.
0 4.50±0.68
0.037±0.002
0.85±0.11
Raw water Single cells of M. aeruginosa 2 7.39±0.0
6 373±16 11.6±1.
4 4.55±0.80
0.065±0.0070
1.60±0.43
SUVA: specific UV absorbance, defined as the UV absorbance expressed per meter of absorbance per unit concentration of DOC in mg C/L. 1 Results from Ribau Teixeira and Rosa (2006a). 2 Results from Ribau Teixeira and Rosa (2007).
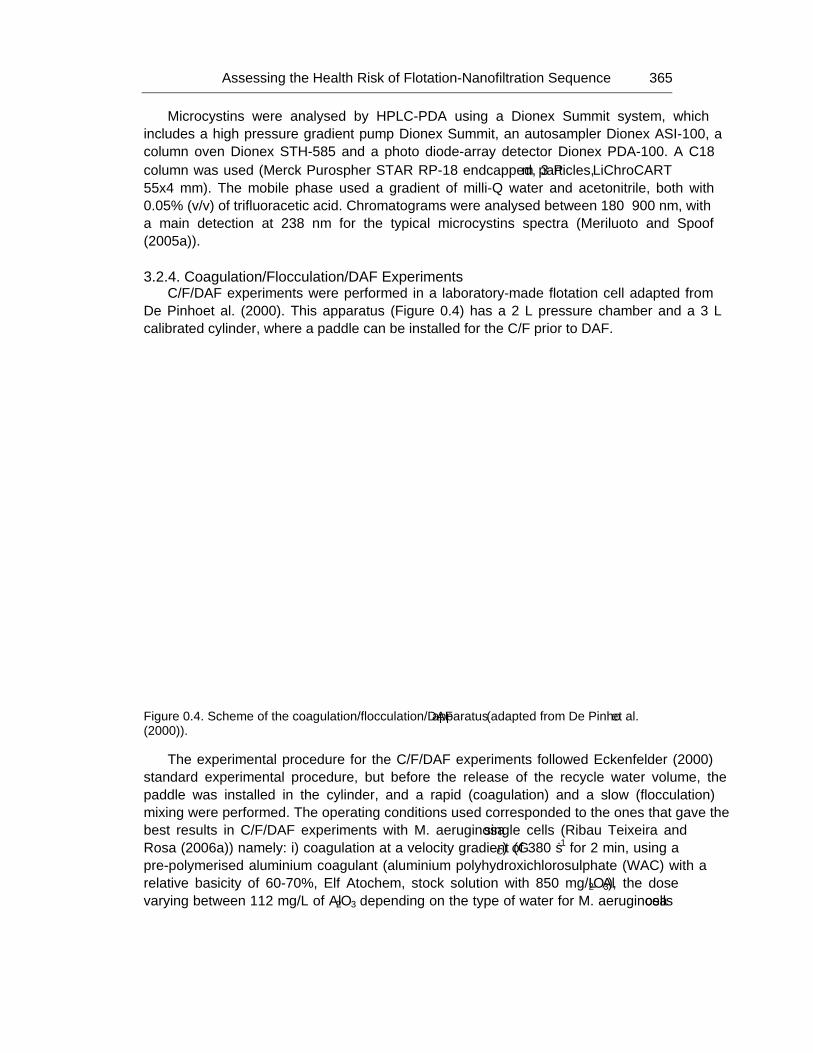
Assessing the Health Risk of Flotation-Nanofiltration Sequence… 365
Microcystins were analysed by HPLC-PDA using a Dionex Summit system, which includes a high pressure gradient pump Dionex Summit, an autosampler Dionex ASI-100, a column oven Dionex STH-585 and a photo diode-array detector Dionex PDA-100. A C18 column was used (Merck Purospher STAR RP-18 endcapped, 3 μm particles, LiChroCART 55x4 mm). The mobile phase used a gradient of milli-Q water and acetonitrile, both with 0.05% (v/v) of trifluoracetic acid. Chromatograms were analysed between 180 – 900 nm, with a main detection at 238 nm for the typical microcystins spectra (Meriluoto and Spoof (2005a)).
3.2.4. Coagulation/Flocculation/DAF Experiments
C/F/DAF experiments were performed in a laboratory-made flotation cell adapted from De Pinho et al. (2000). This apparatus (Figure 0.4) has a 2 L pressure chamber and a 3 L calibrated cylinder, where a paddle can be installed for the C/F prior to DAF.
Figure 0.4. Scheme of the coagulation/flocculation/DAF apparatus (adapted from De Pinho et al. (2000)).
The experimental procedure for the C/F/DAF experiments followed Eckenfelder (2000) standard experimental procedure, but before the release of the recycle water volume, the paddle was installed in the cylinder, and a rapid (coagulation) and a slow (flocculation) mixing were performed. The operating conditions used corresponded to the ones that gave the best results in C/F/DAF experiments with M. aeruginosa single cells (Ribau Teixeira and Rosa (2006a)) namely: i) coagulation at a velocity gradient (GC) of 380 s-1 for 2 min, using a pre-polymerised aluminium coagulant (aluminium polyhydroxichlorosulphate (WAC) with a relative basicity of 60-70%, Elf Atochem, stock solution with 850 mg/L Al2O3), the dose varying between 1–12 mg/L of Al2O3 depending on the type of water for M. aeruginosa cells
Margarida Ribau Teixeira 366
and colonies; ii) flocculation at GF of 70 s-1 for 8 min; iii) DAF during 8 min, using 5 bar of relative pressure and 8% (i.e. 0.08) of pressurised recycle ratio (R/Q). All experiments were made at room temperature (20±2 ºC). A correction factor for dilution (1+R/Q), where R/Q is expressed in 0-1 range, was used in computing the removal efficiency (R) of chl_a, and extracellular microcystins in the clarified water, i.e. R (%) = (1 - Cf (1 + R/Q) / Ci) x 100, where Ci and Cf are the initial and the final concentrations, respectively. Experiments were made in duplicate (Ribau Teixeira and Rosa (2006a), Ribau Teixeira and Rosa (2007)).
3.3. Results and Discussion Figure 0.5 shows the C/F/DAF performance (in terms of chl_a, MC-LR, turbidity, DOC
and UV254nm) on the removal of NOM content (tap water vs. ozonated water and raw water) and type (ozonated water vs. raw water) for single cells, and on the removal of different cyanobacterial morphologies (single cells vs. colonies) in tap water.
Results show an increase in removal efficiencies with the coagulant dose added to the water for all the parameters studied, except for MC-LR (Figure 0.5). Coagulant addition does not improve extracellular MC-LR removal but, most important, there is no release of MC-LR into water in the studied range of coagulant added to water (Figure 0.5b, Ribau Teixeira and Rosa (2006a)).
For single cells and colonies, removal efficiencies are higher for tap water than ozonated and raw water, and there are no differences between raw water and ozonated water in terms of removal efficiencies and residuals of chl_a, turbidity and DOC, and these differences are not significant for MC-LR (Figure 0.5, Ribau Teixeira and Rosa (2007)).
In addition, high chl_a removal efficiencies (above 84%) and low chl_a concentration in clarified water (below 5 μg/L) are achieved with low coagulant dose for all water samples, regardless of the NOM content (tap water vs. raw water and ozonated water) and type (raw water vs. ozonated water) (Figure 0.5a). Kempeneers et al. (2001) showed results of effluent C/F/DAF quality below 5 μg/L of chl_a when the influent had low chl_a concentration and not exceeding 10 μg/L for higher influent chl_a concentrations, in a full-scale plant using alum/alum and activated silica/powered activated carbon, during ten years of operation. Similar results were obtained by Chung et al. (2000) in a pilot and full-scale plant using polyaluminium chloride as coagulant, and by Zabel (1985) and Vlaski et al. (1996) but using alum and FeCl3 in waters containing M. aeruginosa. Hargesheimerand Watson (1996) also reported good particle removal efficiencies by DAF, chl_a removal efficiencies of 73% and 13% for TOC.
No significant differences were obtained in chl_a and DOC removals efficiencies between cells and colonies in TW, but turbidity removals were higher for colonies with lower coagulant dose added to the water (Figure 0.5c), because of the aggregation and the analytical method used for quantify turbidity.
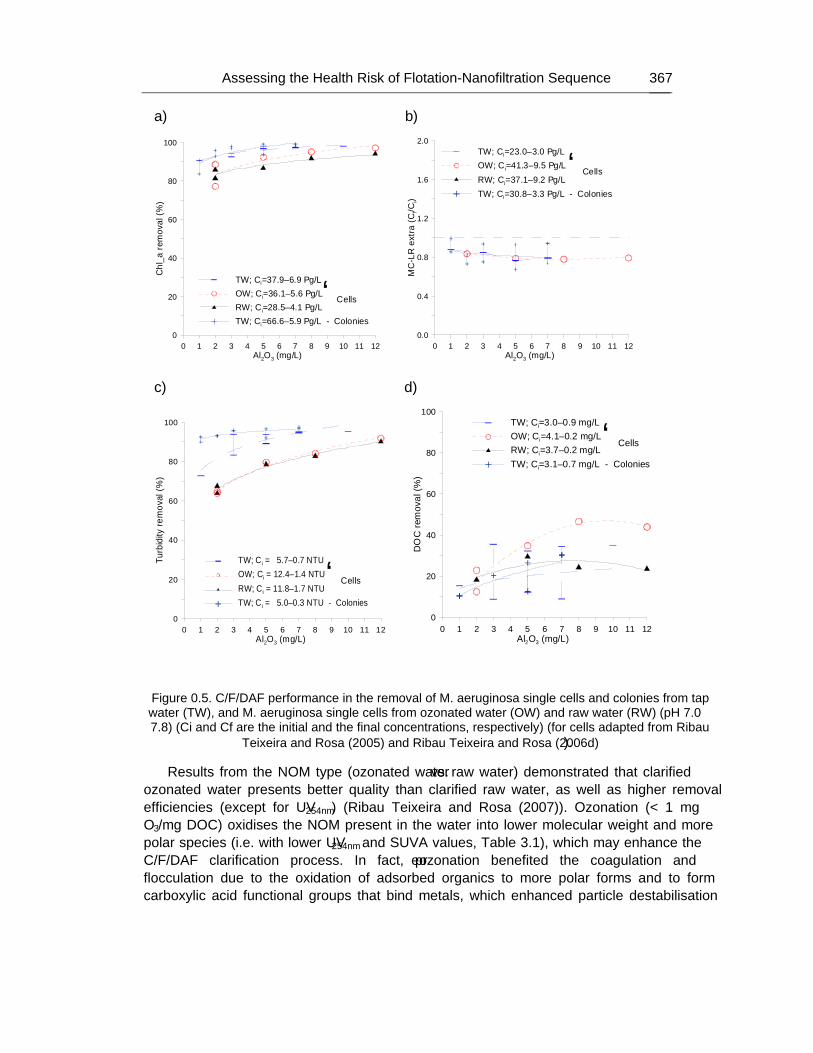
Assessing the Health Risk of Flotation-Nanofiltration Sequence… 367
a) b)
0 1 2 3 4 5 6 7 8 9 10 11 12Al2O3 (mg/L)
0
20
40
60
80
100
Chl
_a r
emov
al (
%)
TW; Ci=37.9±6.9 μg/LOW; Ci=36.1±5.6 μg/LRW; Ci=28.5±4.1 μg/LTW; Ci=66.6±5.9 μg/L - Colonies
}Cells
0 1 2 3 4 5 6 7 8 9 10 11 12
Al2O3 (mg/L)
0.0
0.4
0.8
1.2
1.6
2.0
MC
-LR
ext
ra (C
f/Ci)
TW; Ci=23.0±3.0 μg/LOW; Ci=41.3±9.5 μg/LRW; Ci=37.1±9.2 μg/LTW; Ci=30.8±3.3 μg/L - Colonies
}Cells
c) d)
0 1 2 3 4 5 6 7 8 9 10 11 12Al2O3 (mg/L)
0
20
40
60
80
100
Turb
idity
rem
oval
(%)
TW; Ci = 5.7±0.7 NTUOW; Ci = 12.4±1.4 NTURW; Ci = 11.8±1.7 NTUTW; Ci = 5.0±0.3 NTU - Colonies
}Cells
0 1 2 3 4 5 6 7 8 9 10 11 12
Al2O3 (mg/L)
0
20
40
60
80
100D
OC
rem
oval
(%
)TW; Ci=3.0±0.9 mg/LOW; Ci=4.1±0.2 mg/LRW; Ci=3.7±0.2 mg/LTW; Ci=3.1±0.7 mg/L - Colonies
}Cells
Figure 0.5. C/F/DAF performance in the removal of M. aeruginosa single cells and colonies from tap water (TW), and M. aeruginosa single cells from ozonated water (OW) and raw water (RW) (pH 7.0 – 7.8) (Ci and Cf are the initial and the final concentrations, respectively) (for cells adapted from Ribau
Teixeira and Rosa (2005) and Ribau Teixeira and Rosa (2006d)).
Results from the NOM type (ozonated water vs. raw water) demonstrated that clarified ozonated water presents better quality than clarified raw water, as well as higher removal efficiencies (except for UV254nm) (Ribau Teixeira and Rosa (2007)). Ozonation (< 1 mg O3/mg DOC) oxidises the NOM present in the water into lower molecular weight and more polar species (i.e. with lower UV254nm and SUVA values, Table 3.1), which may enhance the C/F/DAF clarification process. In fact, preozonation benefited the coagulation and flocculation due to the oxidation of adsorbed organics to more polar forms and to form carboxylic acid functional groups that bind metals, which enhanced particle destabilisation
Margarida Ribau Teixeira 368
and organics precipitation (AWWA (2000)). Most particles in raw drinking water are negatively charged due to the NOM adsorption on the particle surface, and NOM in bulk solution exerts an appreciable coagulant demand. Amy et al. (1992) referred that coagulation removed humic and high molecular weight organic matter more efficiently than it removed non-humic and low molecular weight organic matter. Owen et al. (1995), Widrig et al. (1996) also reported that preozonation for organics removal is variable and appears to be site specific, since it selectively modifies fractions of the NOM matrix. The benefits of preozonation on DOC removal, showing an increase between 5 to 15% of DOC removal with preozonation beyond the highest removals for coagulation alone were demonstrated by Widrig et al. (1996). The same behaviour is observed in Figure 0.5d. In addition, according with Ribau Teixeira and Rosa (2007), the UV254nm fraction is not preferentially removed, and this behaviour is more pronounced for waters with lower influent SUVA values – SUVA values of the raw water remain constant with coagulant addition, whereas in ozonated water they increase. The higher UV254nm removals found for raw water compared to ozonated water are related to higher influent values, because UV254nm measures the aromatic/hydrophobic compounds (Ribau Teixeira and Rosa (2007)).
4. NANOFILTRATION
4.1. Introduction
4.1.1. General Nanofiltration (NF) is a pressure driven membrane process since it uses the pressure
difference between the feed and the permeate sides as the driving force for solvent transport through the membrane. NF separation lies between ultrafiltration (UF) and reverse osmosis (RO) and is used when low molecular weight solutes are to be removed. Compared with UF, NF membranes have a smaller pore size (usually below 2 nm), hence organic compounds of lower molecular weight are retained (usually above 200 g/mol). Compared with RO, the retention of monovalents ions is lower, therefore NF requires lower operating pressures since the osmotic pressure gradients are minimised (Mulder (1997)).
Common NF applications are drinking water production, as well as wastewater treatment and industrial processes (e.g. biotechnological, pharmacological, chemical and textile).
Membranes should combine high permeability and high selectivity with sufficient mechanical resistance stability. To accomplish that, asymmetric membranes were developed, i.e. consisting of a thin active layer (0.1 to 1 μm) responsible for the separation efficiency supported by one or more thicker layers with larger pores of the same or different polymeric materials – composite membranes. The supporting layers do not contribute to the resistance against mass transfer, so the permeability of the membrane is only determined by the thin active layer. These asymmetric membranes constituted a milestone for industrial applications of membrane processes since they combine high flux with sufficient mechanical strength. Most membranes commercially available nowadays are thin film composite membranes. The materials commonly used in NF membranes are aromatic polyamide, polysulfone/polyethersulfone/sulfonated polysulfone, cellulose acetate, or poly(piperazine amide).
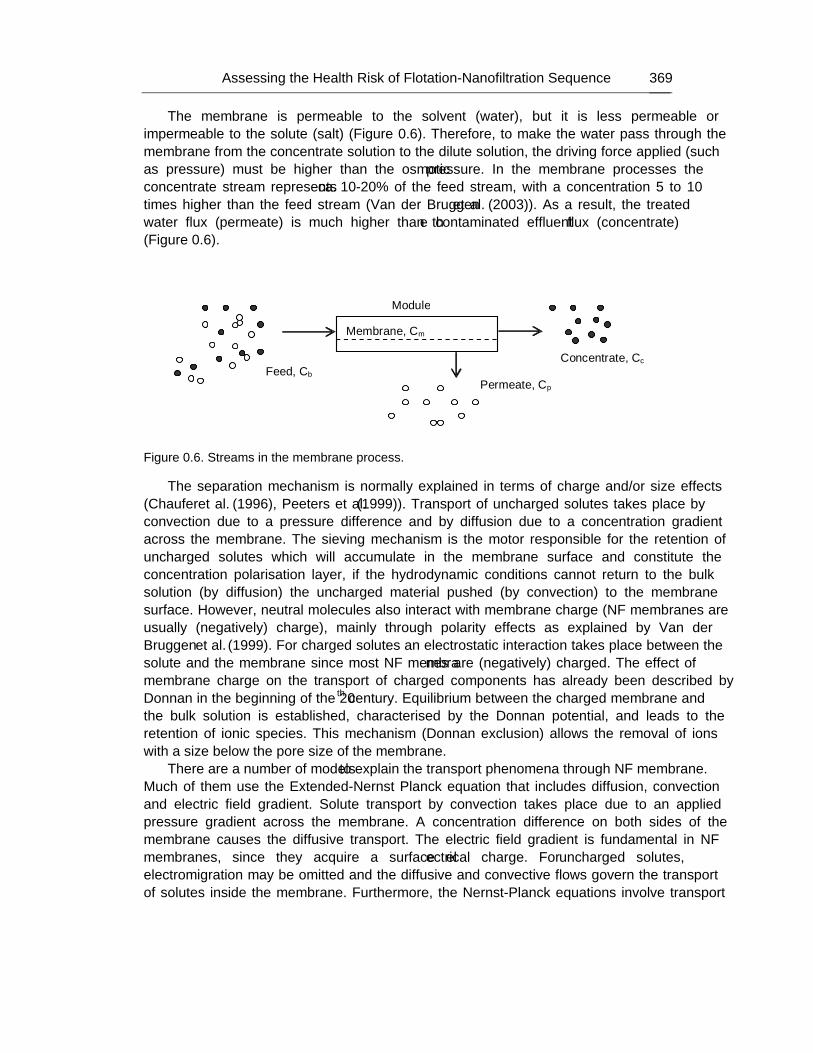
Assessing the Health Risk of Flotation-Nanofiltration Sequence… 369
The membrane is permeable to the solvent (water), but it is less permeable or impermeable to the solute (salt) (Figure 0.6). Therefore, to make the water pass through the membrane from the concentrate solution to the dilute solution, the driving force applied (such as pressure) must be higher than the osmotic pressure. In the membrane processes the concentrate stream represents ca. 10-20% of the feed stream, with a concentration 5 to 10 times higher than the feed stream (Van der Bruggen et al. (2003)). As a result, the treated water flux (permeate) is much higher than the contaminated effluent flux (concentrate) (Figure 0.6).
Membrane, Cm
Feed, Cb
Module
Permeate, Cp
Concentrate, Cc
Figure 0.6. Streams in the membrane process.
The separation mechanism is normally explained in terms of charge and/or size effects (Chaufer et al. (1996), Peeters et al. (1999)). Transport of uncharged solutes takes place by convection due to a pressure difference and by diffusion due to a concentration gradient across the membrane. The sieving mechanism is the motor responsible for the retention of uncharged solutes which will accumulate in the membrane surface and constitute the concentration polarisation layer, if the hydrodynamic conditions cannot return to the bulk solution (by diffusion) the uncharged material pushed (by convection) to the membrane surface. However, neutral molecules also interact with membrane charge (NF membranes are usually (negatively) charge), mainly through polarity effects as explained by Van der Bruggen et al. (1999). For charged solutes an electrostatic interaction takes place between the solute and the membrane since most NF membranes are (negatively) charged. The effect of membrane charge on the transport of charged components has already been described by Donnan in the beginning of the 20th century. Equilibrium between the charged membrane and the bulk solution is established, characterised by the Donnan potential, and leads to the retention of ionic species. This mechanism (Donnan exclusion) allows the removal of ions with a size below the pore size of the membrane.
There are a number of models to explain the transport phenomena through NF membrane. Much of them use the Extended-Nernst Planck equation that includes diffusion, convection and electric field gradient. Solute transport by convection takes place due to an applied pressure gradient across the membrane. A concentration difference on both sides of the membrane causes the diffusive transport. The electric field gradient is fundamental in NF membranes, since they acquire a surface electrical charge. For uncharged solutes, electromigration may be omitted and the diffusive and convective flows govern the transport of solutes inside the membrane. Furthermore, the Nernst-Planck equations involve transport
Margarida Ribau Teixeira 370
coefficients and parameters characteristic of the membrane-solute-solvent system of easy physical interpretation and capable of being related to the operating conditions.
The Nernst-Planck based model has proven to be successful for modelling the solute transport in simple electrolyte solutions, although its applicability in the presence of organics is questionable (Schäfer (2001)). Wang et al. (1997) developed a model to account for the transport phenomena of organic electrolytes, thus combining electrostatic and steric hindrance effects. Other models like the Steric Hindrance Pore Model has been used for the calculation of an effective pore radius and the ratio of membrane porosity to membrane thickness (Wang et al. (1995)). In fact, the majority of models are used more often to determine the effective pore size, because NF pores are too small to be measured directly (Schäfer (2001)).
4.1.2. Rejection and Fouling
NF membrane separation efficiency is usually related to membrane effective pore radius (average pore size and size distribution) or molecular cut-off defined as the molecular weight of the solutes that are more than 90% rejected by the membrane. The molecular cut-off of the NF membranes is between 100 and 1000 g/mol and the pore size is less than 2 nm (Mulder (1997)). Therefore, the rejection of organics should be high, while the salt rejection depends on the charge and the valence of the ions, and the membrane charge.
There are many studies regarding the determination of membrane charge and its relation with the salt rejection: the highest the charge, the highest the rejection (Berg et al. (1997), Peeters et al. (1999), Childress and Elimelech (2000)), being the membrane charge very dependent of the solution pH (Elimelech et al. (1994), Nyström et al. (1995), Childress and Elimelech (1996), Schaep and Vandecasteele (2001)). Both co- and counter-ions can absorb to charged membranes surface due to electrostatic and non-electrostatic interactions. As anions in the vicinity of non-polar surfaces are less hydrated than cations, the former can adsorb more closely to the surface, often resulting in an excess of negative charges in the layer nearest to the surface (Elimelech et al. (1994)). If a charged membrane is put in contact with an ionic solution, ions with the same charge sign of the membrane (the co-ions) are excluded and cannot pass the membrane, whereas the ions with opposite charge sign of the membrane (counter-ions) are able to pass the membrane (Mulder (1997)). For negatively charged membranes, the anions are therefore responsible for the rejections, while for positively charged membranes rejection is determined by the cations. For neutral membranes, the steric hindrance effects prevail. Due to the membrane charge, a concentration difference of the ions between the solution and the membrane is built-up, resulting in an osmotic pressure difference between the membrane and the solution. An additional potential across the membrane, the Donnan potential, will compensate this osmotic pressure, since equilibrium is assumed (Peeters et al. (1999)).
Some studies observed negative rejections due to the ion, usually H+, increase in the permeate and its high permeation rate compared to the others ions (Childress and Elimelech (2000), Dey et al. (2000), Tanninen and Nyström (2002), Ribau Teixeira et al. (2005)).
Macromolecular or dissolved organic compounds have also been studied by some authors. Results showed that these compounds are responsible for the membrane fouling by accumulating on the membrane surface or inside the pores. As a result, the performance and the life of the membranes decrease. The dissolved organic substances have been referred as the main responsible for the membrane fouling in the filtration of natural waters (Hong and
Assessing the Health Risk of Flotation-Nanofiltration Sequence… 371
Elimelech (1997)). These substances include the humic and fulvic substances that represent the higher fraction of the natural organic matter (NOM), with low molecular weight.
Generally, factors influencing the membranes NOM fouling are often classified as: i) physical-chemical characteristics of NOM and membranes, ii) hydrodynamic conditions, and iii) chemical composition of the feed water (Hong and Elimelech (1997), Lee et al. (2004)).
Several studies demonstrated that the extent of NOM fouling is greatly influenced by the hydrophobicity of the membrane and NOM. Jucker and Clark (1994) concluded that humic substances adsorbed more favourably onto hydrophobic membranes. Nilson and DiGiano (1996) showed that hydrophobic fraction of NOM was mostly responsible for permeate flux decline, whereas the hydrophilic fraction caused much less fouling. They also showed that only the large molecular weight fraction of NOM contributed to the formation of a fouling layer.
Concerning the hydrodynamic conditions role on NOM fouling, Braghetta (1995) amongst others demonstrated that the permeate flux increases at higher crossflow velocities, due to the disruption of the NOM fouling layer. Chellam and Taylor (2001) evidenced that operating conditions such as feed water recovery had a significant negative impact on the rejection (rejection decrease as the recovery increase) of total hardness and total triahlomethanes by NF membranes. A decrease in rejection with the increase in recovery was also obtained by Reiss et al. (1999) for NOM and total dissolved solids.
The chemical composition of the feed water, pH, ionic strength and the presence of multivalent cations have a great influence on NOM adsorption. Elimelech and co-workers (Childress, Elimelech (1996), Hong, Elimelech (1997), Faibish et al. (1998)) and Kilduff et al. (2004) observed a flux decline at low pH and a rejection increase at high pH. This behaviour was attributed to charge reduction of the membrane and the humic macromolecules at low pH. As the ionic strength increased, flux and rejection decreased due to the increase of the hydraulic resistance of the fouling layer (Hong, Elimelech (1997), Schäfer et al. (1998), Kilduff et al. (2004)). Hong, Elimelech (1997), Yoon et al. (1998), Her et al. (2000) and Ribau Teixeira and Rosa (2006b) showed a water flux decrease with increasing calcium concentration. This was related with the reduction of the NOM charge due to effective charge screening and complex formation.
NF membranes are able to effectively remove NOM through a combination of size exclusion and physical-chemical interactions as electrostatic repulsion and adsorption (Cho et al. (1999), Amy and Cho (1999)). The NOM fouling, that causes flux decline, may be reduced by controlling various physical and chemical parameters such as pH, ionic strength and calcium concentration as well as permeation rate and hydrodynamic conditions (crossflow velocity and channel configuration), which allow working under the critical flux (Nilson and DiGiano (1996), Cho et al. (1999), Jucker and Clark (1994), Nyström et al. (1995), Kilduff et al. (2004), Seidel and Elimelech (2002)). At high ionic strength and low pH or in the presence of calcium, a severe flux decline occurs due to the dense thick fouling layer that develops on the membrane surface. At low ionic strength, high pH and absence of divalent ions, a loose thin fouling layer develops on the membrane surface and a lower flux decline is obtained. Rejection of charged solutes increases due to the thick double layer nearly overlapping with the membrane pores (Jucker and Clark (1994), Braghetta et al. (1997)).
Membrane characteristics (membrane charge, pore size and water permeability) and NOM characteristics (molecular weight and hydrophobicity) also play an important role in the fouling process. Elimelech and co-workers (Hong and Elimelech (1997), Elimelech et al.
Margarida Ribau Teixeira 372
(1994), Childress and Elimelech (1996)) concluded that humic substances affect the membrane charge through adsorption onto the membrane surface. The negatively charged functional groups of humic substances dominate the membrane surface charge. It is common to associate the increase in negative charge and the increase of hydrophilicity with the decrease of adsorptive fouling by NOM (Hong and Elimelech (1997), Nilson and DiGiano (1996), Jucker and Clark (1994), Kimura et al. (2003)).
While extensive research has been done using different sources and types of humic acids, many authors (Hong and Elimelech (1997), Schäfer et al. (1998), Amy and Cho (1999), Seidel and Elimelech (2002)) studied concentrations higher than those normally used in NF technology or even present in clear surface water (2 − 5 mg C/L) (EPA (1999)). In fact, NF membranes always follow a pre-treatment so the NOM content is already reduced when the water is nanofiltered (Her et al. (2000), Peltier et al. (2002)).
4.1.3. Treatment of Concentrate Streams
The treatment of the concentrate stream (that corresponds to a volume of 10-20% of the feed stream, Figure 0.6) largely depends on the composition of the feed. The treatment of this stream is a cost that should be considered in the overall costs of this technology.
In the drinking water industry, the components to be removed are usually non-toxic (hardness, suspended solids) or toxic but in low concentrations (micropollutants, e.g. herbicides, pesticides or cyanotoxins). Methods for disposal of concentrate, when no toxic compounds are present, include discharge into saline water, irrigation in arid areas, and deep well injection when a favourable injection zone is present. The latter technique is expensive and has a significant influence on the cost of the produced water (Van der Bruggen et al. (2003)).
If the concentrate stream contains an organic fraction, a biological treatment can be used in the case of biodegradable compounds or ozonation in case of recalcitrants. Another technique that has been studied is electro-oxidation, where recalcitrant organic compounds can be efficiently removed by anodic oxidation (Van Hege et al. (2004)). If the concentrate stream contains a large organic fraction and/or high toxic compounds (as cyanotoxins), the treatment can be by evaporation and deposition in a landfill, and incineration with energy recovery. As already referred and according to Portuguese waste legislation, it is the responsibility of the waste producer to identify and quantify any hazardous potential of wastes, and to guarantee an adequate elimination of these wastes.
4.1.4. Application to Cyanobacteria and Cyanotoxins Removal
As membrane acts as a physical barrier, allowing water to pass while retaining the suspended solids and even dissolved materials, depending on the type of the membrane, membrane pressure-driven filtration is an alternative to effectively remove cyanobacteria and cyanotoxins. In this particular application, microfiltration (MF) and UF will be adequate for removing the cyanobacterial cells but not cyanotoxins, due to the large pore size and high molecular weight cut-off of these membranes. Since the molecular weight of microcystins is around 1000 Da (Sivonnen and Jones (1999)), it is assumed that both NF and RO membranes will successfully retain microcystins. As with other hazardous microcontaminates like pesticides, water organic and inorganic background matrixes affect the NF performance (Zhang et al. (2004)). Nevertheless, if a proper membrane and optimal operating conditions are used, NF should be a safe physical barrier against microcystins without the problem of
Assessing the Health Risk of Flotation-Nanofiltration Sequence… 373
potential health hazardous by-products formation. In addition, it will also remove multivalent ions, other small hazardous organic compounds (e.g. pesticides, endocrine disruptors) and NOM, major precursor of the disinfection by-products (DBPs), as well as viruses and microorganisms resistant to chemical oxidation (Cryptosporidium, Giardia) that might have escaped intact from previous water treatments. However, a membrane process produces a toxin enriched stream, which has to be safely disposed since the toxins are not destroyed by this treatment. This concentrate stream represents only 10-20% of the original feed stream (Van der Bruggen et al. (2003)) and further treatment by oxidation processes (e.g. ozonation, wet air oxidation) should be feasible.
Few studies were found on membrane technology for removing cyanobacteria and/or cyanotoxins, and only one on the anatoxin-a removal by NF.
Concerning the cyanobacteria removal, a laboratory study with MF and UF in both dead-end and cross-flow modes showed high removal efficiency (> 98%) of Microcystis aeruginosa cells (Chow et al. (1997)). This study also examined the cell damage by measuring the leakage of chlorophyll a and microcystin-LR into the permeate. There were some cells damaged after filtration but no significant toxin increase in the permeate. In the UF experiments, the amount of microcystin was significantly lower on the permeate than in the feed, which suggested that this UF membrane might have rejection properties or adsorption ability for microcystins, since the membrane molecular cut-off (100 kDa) was much higher than the microcystins molecular weight (ca. 1000 Da). A pilot plant study using ceramic MF membranes was performed using raw water from lake Brugneto (Italy) to evaluate the membrane ability to remove particles, microorganisms, algae (including the cyanobacterium Oscillatoria rubescens) and disinfection by-products (Bottino et al. (2001)). Results indicated that despite its high content in raw water (4.6x10⁵ cells/L), Oscillatoria rubescens was completely retained.
Hart and Stott (1993) evaluated the removal of microcystin by NF membranes, using a natural water spiked with 5 30 μg/L MC-LR. Results showed concentrations below 1 μg/L in the permeate. Muntisov and Trimboli (1996) also showed that NF membranes removed microcystin-LR and nodularin from a river water spiked with 8 μg/L of these toxins. Neumann and Weckesser (1998) tested three types of RO membranes at 25 – 35 bar to evaluate the removal of microcystin-LR and microcystin-RR (initial concentrations of 70 – 130 μg/L) from tap water and tap water containing 3000 mg/L NaCl (salt water). The average rejection, with a detection limit of 0.2 μg/L, varied between 96.7 % and 99.9 % in tap water, and 98.5 – 99.6 % in salt water, so there was no statistical difference in rejection of the microcystins between the two waters. Vuori et al. (1997) evaluated the removal of nodularin from brackish water by RO. As the salt and toxin concentration increased in the raw water, traces of nodularin were detected in treated water although it remained below the limit of quantification.
Gijsbertsen-Abrahamse et al. (2006) studied the removal of cell-bound and dissolved cyanotoxins (microcystins and anatoxin-a) by UF and NF. In NF experiments, toxins appeared to absorb on the membrane surface and the rejections were 99% and 96%, respectively for microcystin-RR and anatoxin-a.
NF will successfully retain microcystins but anatoxin-a removal will depend on the membrane charge and cut-off, as well as on the operating conditions. Besides the process hydrodynamics, both the organic and inorganic water background matrixes impact the NF
Margarida Ribau Teixeira 374
membrane performance (Zhang et al. (2004), Ribau Teixeira and Rosa (2005), Ribau Teixeira and Rosa (2006d)). Consequently, a proper membrane and optimal operating conditions should be used to guarantee that both low and high molar mass cyanotoxins (anatoxin-a and microcystins) are removed.
During cyanobacterial blooms occurrence an increase in both NOM content and pH value is usually expected, in addition to the obvious turbidity and chlorophyll a increase. Besides its potential to form disinfection by-products when water is disinfected with chlorine (Blau et al. (1992), Pomes et al. (1999)) and its ability to support biofilm growth in the water distribution networks, NOM is a heterogeneous organic mixture of hydrophobic and hydrophilic compounds, considered one of the major cause of NF fouling during the filtration of surface waters (Nyström et al. (1995), Cho et al. (1999)).
4.2. Material and Methods
4.2.1. Cyanotoxins Microcystins were extracted from a culture of Microcystis aeruginosa supplied by
Pasteur Culture Collection (PCC7820) and maintained in laboratory. After one and an half months of growth (corresponding approximately to the maximum
of Microcystis growth obtained in the laboratory), the PCC7820 culture was centrifuged (6,000 xg, 10 min). The resultant pellet was resuspended, washed and centrifuged again. The supernatant was discarded between washes. This procedure was performed twice. The last centrifugation was at 10,000 xg during 10 min, the supernatant was discarded and the cells (pellets) were kept in the freezer (- 20 ºC, in the dark) until use.
To prepare the microcystins stock solution, the cells were defrosted and resuspended in a small volume of methanol 75% (v/v). Microcystins were extracted from the cells at 4 ºC in the dark, during 18 h. After this period, this methanolic extract was centrifuged twice (10,000 xg, 10 min) and the pellet was discarded. The solution was concentrated by evaporation in a rotavapor (50-54 °C), dissolved in a small amount of methanol 75 % (v/v) and analysed on HPLC-PDA to determine microcystin concentration. The necessary volume to produce the final solution for the NF experiments was then measured and evaporated again with N2 at 50-54 ºC. The dry extract was then dissolved in the water to be used in the NF experiments.
After the NF experiments, microcystins were extracted from the aqueous sample as already explained in section 0.
Anatoxin-a used in this study is a pure reagent kindly supplied by G.A. Codd and J. Metcalf (University of Dundee, UK) within the TOXIC European Project, “Barriers against cyanotoxins in drinking water”.
ATX-a was first extracted from the aqueous samples using an isolute C18 solid phase extraction column, 1 g in a 6 mL reservoir, following the standard operating procedure developed for ATX-a by Metcalf and Codd (2005b). The cartridges were first conditioned with 10 mL methanol 100% followed by 10 mL of milli-Q water, without letting it dry during conditioning. The samples were then applied to the cartridge and the ATX-a was eluted with 5 mL methanol 100% containing 0.1% of trifluoroacetic acid. The methanolic elute was evaporated at 50-54 ºC in a rotavapor, resuspended in 500 μL milli-Q water, centrifuged at 10,000 xg during 10 min, and transferred to HPLC vials for analysis (Metcalf and Codd (2005b)).
Assessing the Health Risk of Flotation-Nanofiltration Sequence… 375
4.2.2. Cyanobacterial Cultures DAF + NF studies were performed with single cells and cell aggregates (colonies) of M.
aeruginosa, and Plankthotrix rubescens filaments. Culture of M. aeruginosa cells and cell aggregates (colonies) were supplied and
maintained in laboratory as already explained in section 0. P. rubescens filaments were supplied by DVGW-Technologiezentrum Wasser Karlsruhe
(TZW), within TOXIC European Project “Barriers against cyanotoxins in drinking water”, and maintained in the laboratory according to TZW instructions. The growth media basically contains stock solution (KNO3, K2HPO4, MgSO4
.7H2O), soil extract, micronutrient solution and vitamins.
4.2.3. Chemicals and NOM Model Substances
Salicylic acid (SA) and Aldrich humic acid (AHA) were the NOM model substances used to spike decanted water (Table 4.1). The salicylic acid is a certified analytical grade from Merck (> 99.0% purity) with a low molecular weight (138.12 g/mol) and was used without any purification. AHA was purified through the repeated precipitation with HCl proposed by Hong and Elimelech (1997) and already described in Ribau Teixeira and Rosa (2006b). The molecular weight of purified AHA should be higher than 50 kDa since it was purified by a dialysis membrane with a molecular cut-off of 50 kDa.
Deionised water (DI) was used for the preparation of all stock solutions and for membrane performance experiments.
4.2.4. Natural Water Samples
Ozonated water (OW) (after ozonation) and decanted water (DW) (after ozonation/ C/F/S) from Alcantarilha and Tavira Water Treatment Plant, Algarve, Portugal, were the natural waters used in these experiments. As depicted in Table 4.1, the waters used in the experiments are a moderately hard water with moderate organic matter content (EPA (1999)). According to Edzwald and Van Benschoten (1990) classification based on SUVA values, the organic matter is hydrophilic, has low molecular weight, and DOC is largely composed by non-humic substances. The lack of high molecular weight, hydrophobic NOM, in the selected natural waters (very low SUVA values in both ozonated and decanted waters) was overcome by spiking decanted water with humic acids.
4.2.5. Membranes
The investigated NFT50 membrane is a thin film composite NF/RO membrane of polypiperazine amide on a polysulfone microporous support and a polyester support, from Alfa Laval, with an hydraulic permeability of 5.9 kg/(h.m2.bar) at 25 ºC, a molecular cut-off of 150 Da and a pore radius of 0.43 nm (Ribau Teixeira et al. (2005)).
From previously published data on zeta potential measurements (Ribau Teixeira et al. (2005)), the membrane surface is slightly positive at pH 4 (1 mV), passes through an isoelectric point at pH 4.2 ± 0.2 and is negatively charged above this pH (until 8.3). The surface charge is about -10.3 mV at pH 6.9 with a background electrolyte of 1 mM KCl. In the presence of calcium divalent hardness cations (1 mM CaCl2), the isoelectric point shifts from 4.2 to 5-6 and the membrane is less negatively charged over the entire pH range (-2.6 mV at pH 7.3).
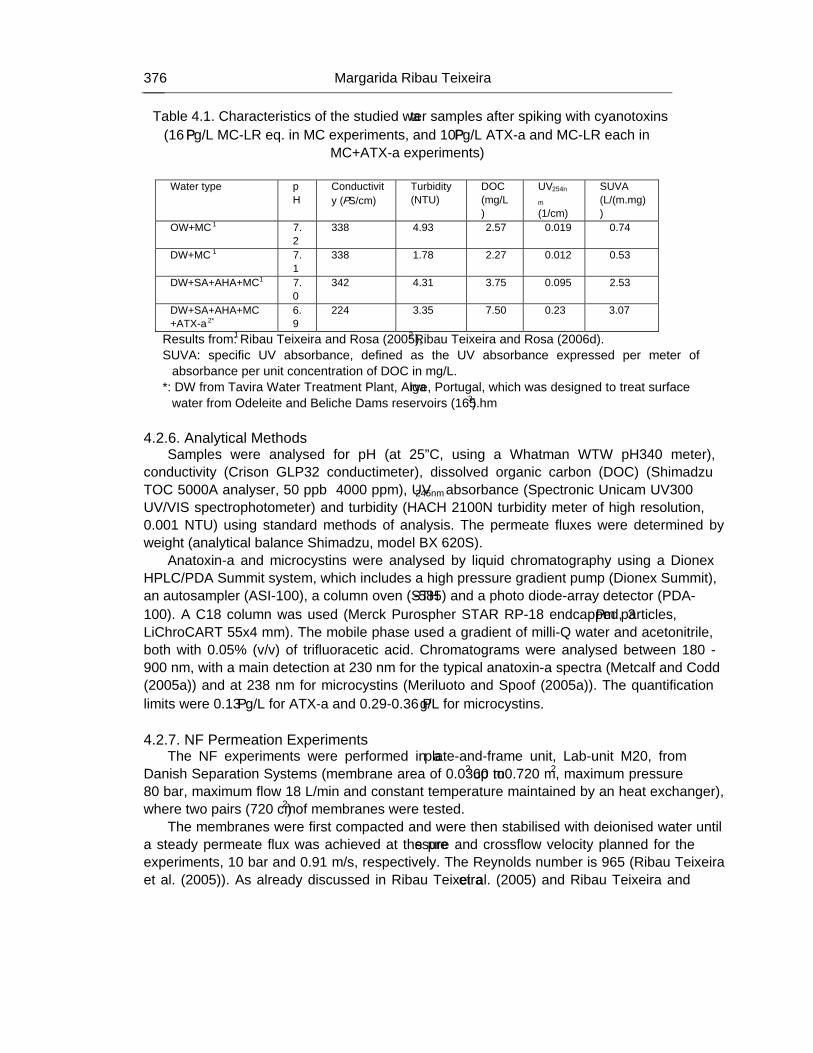
Margarida Ribau Teixeira 376
Table 4.1. Characteristics of the studied water samples after spiking with cyanotoxins (16 μg/L MC-LR eq. in MC experiments, and 10 μg/L ATX-a and MC-LR each in
MC+ATX-a experiments) Water type p
H Conductivity (μS/cm)
Turbidity (NTU)
DOC (mg/L)
UV254n
m (1/cm)
SUVA (L/(m.mg))
OW+MC 1 7.2
338 4.93 2.57 0.019 0.74
DW+MC 1 7.1
338 1.78 2.27 0.012 0.53
DW+SA+AHA+MC 1 7.0
342 4.31 3.75 0.095 2.53
DW+SA+AHA+MC+ATX-a 2*
6.9
224 3.35 7.50 0.23 3.07
Results from: 1 Ribau Teixeira and Rosa (2005), 2 Ribau Teixeira and Rosa (2006d). SUVA: specific UV absorbance, defined as the UV absorbance expressed per meter of
absorbance per unit concentration of DOC in mg/L. *: DW from Tavira Water Treatment Plant, Algarve, Portugal, which was designed to treat surface
water from Odeleite and Beliche Dams reservoirs (165 hm3).
4.2.6. Analytical Methods Samples were analysed for pH (at 25ºC, using a Whatman WTW pH340 meter),
conductivity (Crison GLP32 conductimeter), dissolved organic carbon (DOC) (Shimadzu TOC 5000A analyser, 50 ppb – 4000 ppm), UV245nm absorbance (Spectronic Unicam UV300 UV/VIS spectrophotometer) and turbidity (HACH 2100N turbidity meter of high resolution, 0.001 NTU) using standard methods of analysis. The permeate fluxes were determined by weight (analytical balance Shimadzu, model BX 620S).
Anatoxin-a and microcystins were analysed by liquid chromatography using a Dionex HPLC/PDA Summit system, which includes a high pressure gradient pump (Dionex Summit), an autosampler (ASI-100), a column oven (STH-585) and a photo diode-array detector (PDA-100). A C18 column was used (Merck Purospher STAR RP-18 endcapped, 3 μm particles, LiChroCART 55x4 mm). The mobile phase used a gradient of milli-Q water and acetonitrile, both with 0.05% (v/v) of trifluoracetic acid. Chromatograms were analysed between 180 - 900 nm, with a main detection at 230 nm for the typical anatoxin-a spectra (Metcalf and Codd (2005a)) and at 238 nm for microcystins (Meriluoto and Spoof (2005a)). The quantification limits were 0.13 μg/L for ATX-a and 0.29-0.36 μg/L for microcystins.
4.2.7. NF Permeation Experiments
The NF experiments were performed in a plate-and-frame unit, Lab-unit M20, from Danish Separation Systems (membrane area of 0.0360 m2 up to 0.720 m2, maximum pressure 80 bar, maximum flow 18 L/min and constant temperature maintained by an heat exchanger), where two pairs (720 cm2) of membranes were tested.
The membranes were first compacted and were then stabilised with deionised water until a steady permeate flux was achieved at the pressure and crossflow velocity planned for the experiments, 10 bar and 0.91 m/s, respectively. The Reynolds number is 965 (Ribau Teixeira et al. (2005)). As already discussed in Ribau Teixeira et al. (2005) and Ribau Teixeira and
Assessing the Health Risk of Flotation-Nanofiltration Sequence… 377
Rosa (2006b), these operating conditions correspond to favourable hydrodynamics in terms of concentration-polarisation control and critical flux.
Two sets of trials were performed to evaluate the NF efficiency for microcystins and anatoxin-a removal from surface water.
The first set of trials was performed to evaluate the microcystins efficiency removal from waters containing different types of NOM and water recovery rates. These experiments consisted of concentration runs, where it was intended to simulate the industrial NF operation at different water recovery rates, defined as the ratio between the permeate and the initial feed volumes. In the beginning of the concentration runs, the solutions were given a time to equilibrate after which a flux measurement and samples from the feed and the permeate were taken to serve as baseline for flux and rejection at 0 % water recovery rate. The permeate was then not recycled to the feed reservoir until a stipulated permeate volume was obtained. At this time, permeate was recycled to the feed reservoir during the stabilisation period, after which the flux was measured and feed and permeate samples were again collected and the run followed to the next recovery rate. All samples from the feed and permeate solutions, taken at different recovery rates, were analysed for microcystins, NOM (DOC and UV254nm), turbidity and salt rejection (by conductivity measurements). Flux was continuously measured during the experiments. These experiments were performed with the waters listed in Table 4.1 spiked with 10 μg/L MC-LR and 6 μg/L MC-LY. The spiked solutions stayed overnight at room temperature before use. The pH value was used the typical pH range of the ozonated and decanted waters from Alcantarilha Water Treatment Plant (pH ≅ 7).
The second set of trials was designed to evaluate the anatoxin-a removal efficiency from water samples containing NOM and microcystins, at different water recovery rates, and to study the competitive effects between NOM and cyanotoxins. Decanted water amended with SA (ca. 2.5 mg C/L), AHA (ca. 2.5 mg C/L) and ATX-a (10 μg/L) was used in the first experiment. The second and last experiment was performed with DW+SA+AHA spiked with both ATX-a and MC-LR (10 μg/L each). The spiked solutions stayed overnight at room temperature before use. All these experiments consisted of concentration runs. All samples from the feed and permeate solutions, taken at the different recovery rates, were analysed for ATX-a, MC-LR, NOM (DOC and UV254nm), turbidity and conductivity. Removal efficiencies were calculated based on the feed and permeate concentrations. Flux was continuously measured during the experiments.
For both sets of trials, between each NF run, membranes were washed until the pure water flux reached the initial value measured after compaction (±2%), and the bulk conductivity was similar to that of DI. The temperature was maintained at 25 ºC during the experiments.
4.2.8. DAF+NF Experiments
These experiments were designed to evaluate the removal efficiency of the integrated sequence dissolved air flotation and nanofiltration in removal of cyanobacteria and cyanotoxins (MC), as illustrated in Figure 0.7.
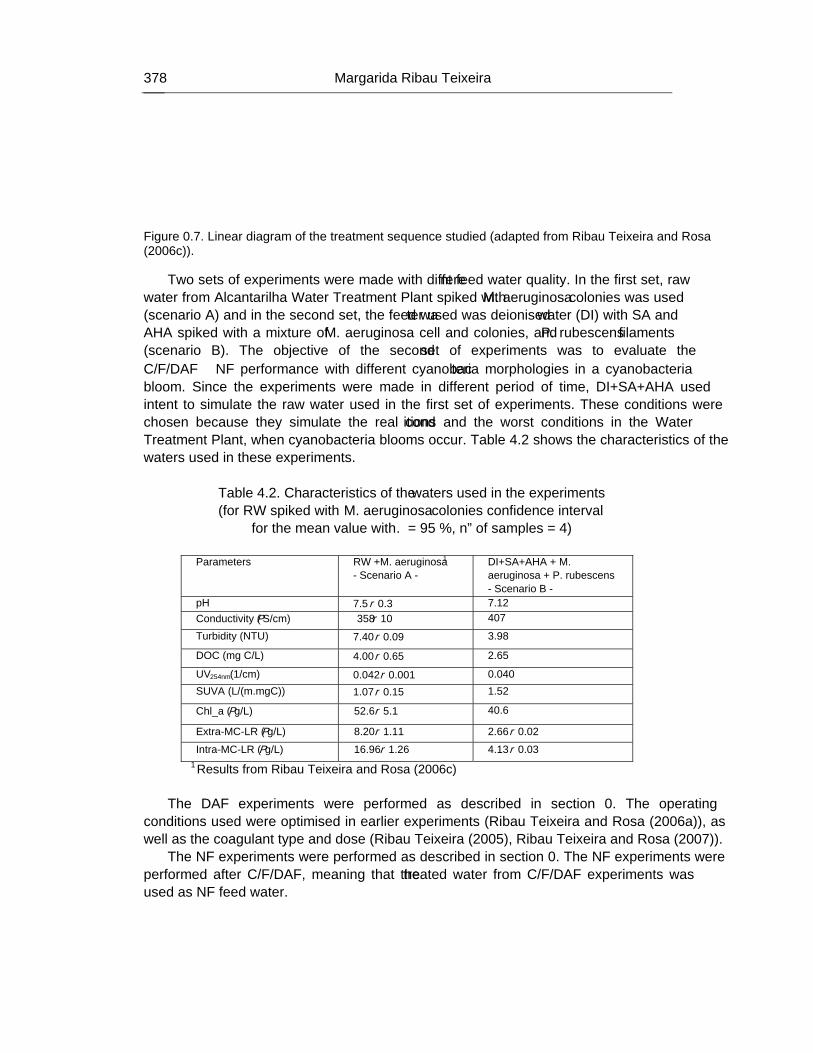
Margarida Ribau Teixeira 378
Figure 0.7. Linear diagram of the treatment sequence studied (adapted from Ribau Teixeira and Rosa (2006c)).
Two sets of experiments were made with different feed water quality. In the first set, raw water from Alcantarilha Water Treatment Plant spiked with M. aeruginosa colonies was used (scenario A) and in the second set, the feed water used was deionised water (DI) with SA and AHA spiked with a mixture of M. aeruginosa cell and colonies, and P. rubescens filaments (scenario B). The objective of the second set of experiments was to evaluate the C/F/DAF − NF performance with different cyanobacteria morphologies in a cyanobacteria bloom. Since the experiments were made in different period of time, DI+SA+AHA used intent to simulate the raw water used in the first set of experiments. These conditions were chosen because they simulate the real conditions and the worst conditions in the Water Treatment Plant, when cyanobacteria blooms occur. Table 4.2 shows the characteristics of the waters used in these experiments.
Table 4.2. Characteristics of the waters used in the experiments (for RW spiked with M. aeruginosa colonies confidence interval
for the mean value with α = 95 %, nº of samples = 4)
Parameters RW +M. aeruginosa 1
- Scenario A - DI+SA+AHA + M. aeruginosa + P. rubescens - Scenario B -
pH 7.5 ± 0.3 7.12 Conductivity (μS/cm) 358 ± 10 407
Turbidity (NTU) 7.40 ± 0.09 3.98
DOC (mg C/L) 4.00 ± 0.65 2.65
UV254nm (1/cm) 0.042 ± 0.001 0.040 SUVA (L/(m.mgC)) 1.07 ± 0.15 1.52
Chl_a (μg/L) 52.6 ± 5.1 40.6
Extra-MC-LR (μg/L) 8.20 ± 1.11 2.66 ± 0.02
Intra-MC-LR (μg/L) 16.96 ± 1.26 4.13 ± 0.03 1 Results from Ribau Teixeira and Rosa (2006c)
The DAF experiments were performed as described in section 0. The operating
conditions used were optimised in earlier experiments (Ribau Teixeira and Rosa (2006a)), as well as the coagulant type and dose (Ribau Teixeira (2005), Ribau Teixeira and Rosa (2007)).
The NF experiments were performed as described in section 0. The NF experiments were performed after C/F/DAF, meaning that the treated water from C/F/DAF experiments was used as NF feed water.
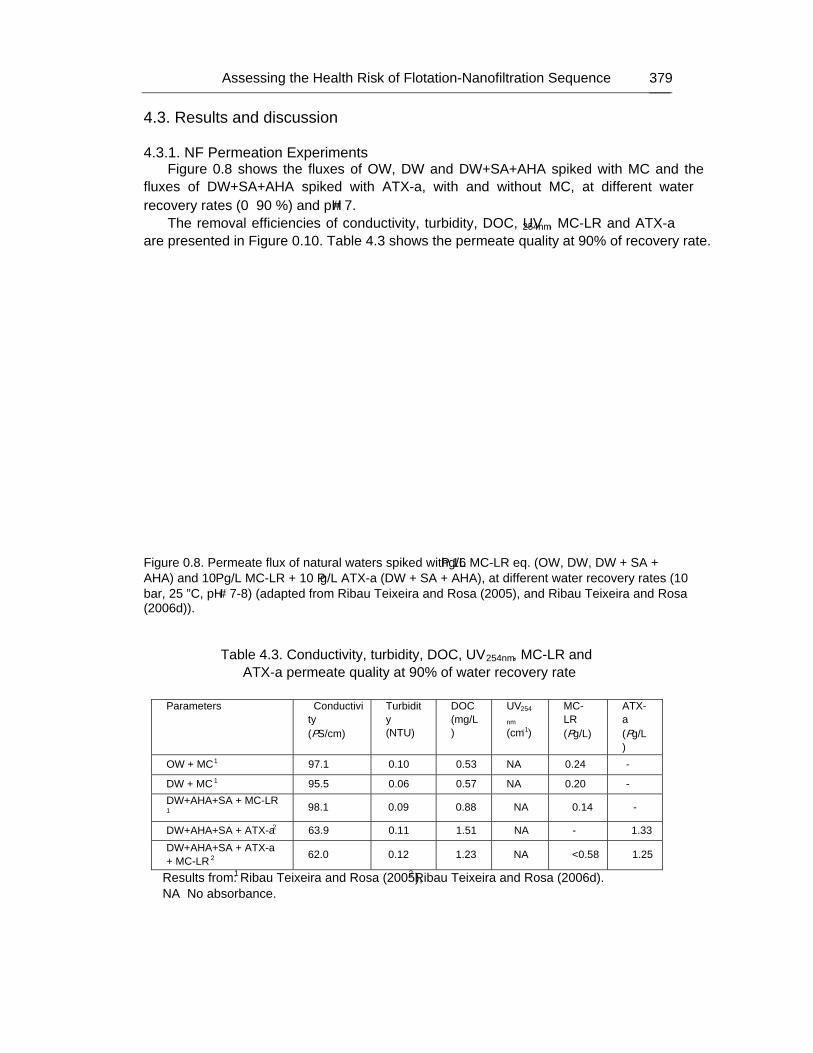
Assessing the Health Risk of Flotation-Nanofiltration Sequence… 379
4.3. Results and discussion
4.3.1. NF Permeation Experiments Figure 0.8 shows the fluxes of OW, DW and DW+SA+AHA spiked with MC and the
fluxes of DW+SA+AHA spiked with ATX-a, with and without MC, at different water recovery rates (0 – 90 %) and pH ≅ 7.
The removal efficiencies of conductivity, turbidity, DOC, UV254nm, MC-LR and ATX-a are presented in Figure 0.10. Table 4.3 shows the permeate quality at 90% of recovery rate.
Figure 0.8. Permeate flux of natural waters spiked with 16 μg/L MC-LR eq. (OW, DW, DW + SA + AHA) and 10 μg/L MC-LR + 10 μg/L ATX-a (DW + SA + AHA), at different water recovery rates (10 bar, 25 ºC, pH ≅ 7-8) (adapted from Ribau Teixeira and Rosa (2005), and Ribau Teixeira and Rosa (2006d)).
Table 4.3. Conductivity, turbidity, DOC, UV254nm, MC-LR and
ATX-a permeate quality at 90% of water recovery rate Parameters Conductivi
ty (μS/cm)
Turbidity (NTU)
DOC (mg/L)
UV254
nm
(cm-1)
MC-LR (μg/L)
ATX-a (μg/L)
OW + MC 1 97.1 0.10 0.53 NA 0.24 -
DW + MC 1 95.5 0.06 0.57 NA 0.20 - DW+AHA+SA + MC-LR 1 98.1 0.09 0.88 NA 0.14 -
DW+AHA+SA + ATX-a 2 63.9 0.11 1.51 NA - 1.33 DW+AHA+SA + ATX-a + MC-LR 2 62.0 0.12 1.23 NA <0.58 1.25
Results from: 1 Ribau Teixeira and Rosa (2005), 2 Ribau Teixeira and Rosa (2006d). NA – No absorbance.

Margarida Ribau Teixeira 380
Figure 0.9. Conductivity, turbidity, DOC, MC-LR and ATX-a removal efficiency (%) for the natural water samples, at different water recovery rates (10 bar, 25 ºC, pH ≅ 7-8) (adapted from Ribau Teixeira and Rosa (2005) and Ribau Teixeira and Rosa (2006d)).
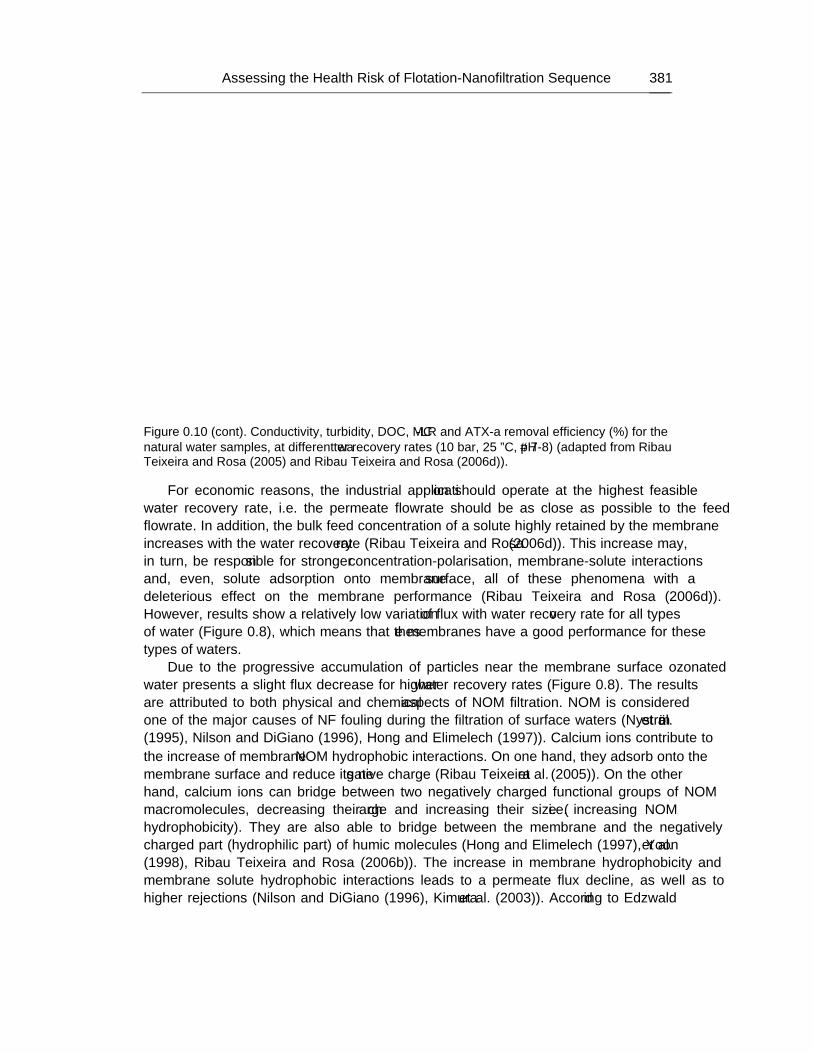
Assessing the Health Risk of Flotation-Nanofiltration Sequence… 381
Figure 0.10 (cont). Conductivity, turbidity, DOC, MC-LR and ATX-a removal efficiency (%) for the natural water samples, at different water recovery rates (10 bar, 25 ºC, pH ≅ 7-8) (adapted from Ribau Teixeira and Rosa (2005) and Ribau Teixeira and Rosa (2006d)).
For economic reasons, the industrial application should operate at the highest feasible water recovery rate, i.e. the permeate flowrate should be as close as possible to the feed flowrate. In addition, the bulk feed concentration of a solute highly retained by the membrane increases with the water recovery rate (Ribau Teixeira and Rosa (2006d)). This increase may, in turn, be responsible for stronger concentration-polarisation, membrane-solute interactions and, even, solute adsorption onto membrane surface, all of these phenomena with a deleterious effect on the membrane performance (Ribau Teixeira and Rosa (2006d)). However, results show a relatively low variation of flux with water recovery rate for all types of water (Figure 0.8), which means that these membranes have a good performance for these types of waters.
Due to the progressive accumulation of particles near the membrane surface ozonated water presents a slight flux decrease for higher water recovery rates (Figure 0.8). The results are attributed to both physical and chemical aspects of NOM filtration. NOM is considered one of the major causes of NF fouling during the filtration of surface waters (Nyström et al. (1995), Nilson and DiGiano (1996), Hong and Elimelech (1997)). Calcium ions contribute to the increase of membrane−NOM hydrophobic interactions. On one hand, they adsorb onto the membrane surface and reduce its negative charge (Ribau Teixeira et al. (2005)). On the other hand, calcium ions can bridge between two negatively charged functional groups of NOM macromolecules, decreasing their charge and increasing their size (i.e. increasing NOM hydrophobicity). They are also able to bridge between the membrane and the negatively charged part (hydrophilic part) of humic molecules (Hong and Elimelech (1997), Yoon et al. (1998), Ribau Teixeira and Rosa (2006b)). The increase in membrane hydrophobicity and membrane solute hydrophobic interactions leads to a permeate flux decline, as well as to higher rejections (Nilson and DiGiano (1996), Kimura et al. (2003)). According to Edzwald
Margarida Ribau Teixeira 382
and Van Benschoten (1990) classification based on SUVA values, the organic matter of the water samples studied is hydrophilic, has low molecular weight, and DOC is largely composed of non-humic substances. NOM hydrophilicity decreases from DW to OW and finally to DW+SA+AHA (Table 4.1), as well as the flux (Figure 0.8). DW+SA+AHA+MC+ATX-a (3.07 L/m/mgC of SUVA), Table 4.1) is between hydrophilic with low molar mass (DOC composed by non-humic substances), and hydrophobic with high molecular high (DOC composed by humic substances). Therefore, the flux variation of decanted water of moderate NOM content and hardness spiked with ATX-a and MC-LR is influenced by the calcium hardness and NOM characteristics (Ribau Teixeira and Rosa (2006d)). As referred in previous studies (Ribau Teixeira and Rosa (2005), Ribau Teixeira and Rosa (2006d)), the flux further decreases in the presence of MC-LR, due to the progressive accumulation of this highly rejected and hydrophobic cyclic peptide near the membrane surface.
For conductivity rejections (Figure 0.10a), there is no significant variation with recovery rate and type of water. The same behaviour was observed in similar experiments with NOM model solutions without MC (Ribau Teixeira and Rosa (2006b)) and with MC model solutions without NOM (Ribau Teixeira and Rosa (2005)). As already mentioned (Ribau Teixeira et al. (2005)), at these pH values (above 5 – 6), the membrane has a slight negative and constant charge, the anions are rejected and with them the cations. For DW+AHA+SA water when ATX-a are present removal are relatively smaller compared with the others type of waters since these waters have lower influent conductivity (Ribau Teixeira and Rosa (2006d)).
Turbidity removal efficiencies were related with the influent turbidity of the water samples (ozonated water as the highest turbidity and decanted water the lowest, Table 4.1) and with the initial adsorption of the ozonated water turbidity particles onto the membrane surface. Therefore, rejections decreased from DW+SA+AHA to OW and DW (Figure 0.10b). The influent OW turbidity was 4.93 NTU (no particle removal takes place in ozonation) but after the NF stabilisation time, at 0 % recovery rate (at pH ≅ 7), was 2.6 NTU. For DW+SA+AHA it was 4.31 NTU (this turbidity coming largely from the AHA amendment) and 3.6 NTU, respectively. This means that turbidity particles present in OW adsorb faster onto the membrane surface than those from DW+SA+AHA. There is also a slight decrease of turbidity rejection with recovery rate attributed to the turbidity adsorption since the OW feed turbidity decreases with recovery rate (Ribau Teixeira and Rosa (2005)). Nevertheless, permeate turbidity is always below 0.13 NTU (Table 4.3), much lower than the Portuguese standard of 1 NTU for drinking water.
The removal efficiencies of NOM parameters, DOC and UV254nm absorbance, do not significantly vary with type of water, due to the similar DOC content of the waters (Table 4.1) and the high rejections of UV254nm (not shown as they are always very high, ~100 %). DOC rejections increase with recovery rate as the feed DOC concentrations increase (Ribau Teixeira and Rosa (2006b)). In addition, DOC rejections are lower than UV254nm rejections since the UV absorbance at 254 nm is mainly due to the adsorption by aromatic/hydrophobic compounds, whereas DOC measures the dissolved concentration of carbon containing molecules (Schäfer et al. (2000)). There are no national standards for DOC and UV254nm in drinking water. However, these are very important parameters due to their relation to the trihalomethane (and other disinfection by-products) formation potential (THMFP) in the finished water. The permeate shows very low values of DOC (not exceeding 1.5 mg C/L) and
Assessing the Health Risk of Flotation-Nanofiltration Sequence… 383
no UV254nm absorbance, from which one may expect minimal THMFP (EPA (1999)), and also for the fact that hydrophilic DOC has lower potential to form THM than hydrophobic DOC (Galapate et al. (2001), Ribau Teixeira and Rosa (2006d)).
The removals of cyanotoxins MC-LR and ATX-a are highly rejected (above 97% and 94%, respectively), and these rejections do not vary with the water recovery rate (Figure 0.10d and 4.4e). The high rejections of MC-LR are mainly related with its size compared to the membrane pore size (MC size ca. 1000 Da and the membrane cut-off 150 Da) and the MC overall net charge (negative but weakly charged). However, other parameters apart from molecular size may affect rejection. Van der Bruggen et al. (1999) reported that polarity decreases rejection, which may be explained by electrostatic interactions directing the dipole towards the membrane. Bellona et al. (2004) referred, among other parameters that hydrophobic-hydrophobic interactions between the solute and the membrane are an important factor for the rejection of hydrophobic compounds (as the microcystins) and that steric hindrance may also contribute to rejection. The strong hydrophobic behaviour of MC, responsible for the microcystins adsorption onto the membrane surface, may also contribute to the lower rejections obtained in few cases (Ribau Teixeira and Rosa (2005)).
Another important observation from these results is that the type and the NOM concentrations studied do not influence the rejection of MC (Figure 0.10 and Table 4.3). In turn, the presence of MC does not change the rejection of NOM (Ribau Teixeira and Rosa (2005)). For ATX-a the presence of NOM and MC-LR, with opposite charge, may reduce the overall net charge of the ATX-a, therefore decreasing the membrane−ATX-a attraction and increasing ATX-a rejection (Ribau Teixeira and Rosa (2006d)). Moreover, as found for pesticides (Zhang et al. (2004)), ATX-a can associate with the NOM functional groups and form macromolecular complexes, which increase the steric hindrances and enhance rejection.
These results demonstrate that these NF membranes are a safe barrier against both cyanotoxins: microcystins and also anatoxin-a, even for high water recovery rates. At 90% water recovery rate and at natural pH (typical of natural waters), ATX-a is 95% rejected and MC-LR is 98% rejected. Moreover, no negative effects were found between ATX-a, MC-LR and NOM.
MC-LR concentrations obtained in the NF permeate (Table 4.3) are always far below the WHO drinking water guideline value of 1 μg/L for MC-LR. In fact, in most cases they are below the quantification limit. For ATX-a there is no national standard nor guideline value and the highest residual obtained is 1.3 μg/L at 90% water recovery rate, much lower than the New Zealand’s drinking water guideline value of 3 μg/L.
4.3.2. DAF+NF Experiments
The overall performance of the DAF – NF integrated sequence was investigated, as a safe barrier against cyanobacteria and cyanotoxins in drinking water. The importance of studying these two technologies together (in sequence) lies in the two mechanisms of cyanotoxin release that impair the drinking water quality: the natural active toxin release that occurs in water reservoirs through cell lysis, and the induced toxin release that may occur during the water treatment process, as a result of mechanical and/or chemical stress factors, that influence the cyanobacterial cell stability (Schmidt et al. (2002), Ribau Teixeira and Rosa (2006c)).
Margarida Ribau Teixeira 384
The proposed sequence (DAF – NF) intends to minimise the induced cyanotoxins release, while safely removing the dissolved toxins existing in raw freshwaters. DAF is used to profit from the natural flotation ability of cyanobacteria for their removal without cell lysis. The NF objective is to remove the cyanotoxins present in water (by natural and/or induced cell release) to a safe level for human consumption.
Results presented in Figure 0.11 show no significant differences in terms of removal efficiencies between the two studied scenarios. This means that the presence of different cyanobacterial morphologies (cells, colonies and filaments) did not influence the removal efficiency of NF pre-treatment (figure 4.5a) neither of the all sequence (figure 4.5b), for the conditions tested (hydrophilic waters with low NOM content). Yan and Jameson (2004) observed no significant differences in the flocculation behaviour of the two types of cyanobacteria: M. aeruginosa (individual spherical cells or colonies) and A. circinalis (filamentous).
As expected, C/F/DAF removes the cyanobacteria presented in both scneraios (high removal efficiencies of chl_a and intra-MC, above 85%), and high removals of turbidity (higher than 75%), being relatively low for DOC and UV254nm (Figure 0.11a). The same low removal efficiencies for DOC and UV254nm were obtained in earlier studies (Ribau Teixeira (2005), Ribau Teixeira and Rosa (2007)) and by Hargesheimer and Watson (1996). Actually, the coagulant type and dose was previously optimised for removing cyanobacterial cells without damaging them (i.e. without cell lysis) using minimal coagulant dose (Ribau Teixeira and Rosa (2006a)). In scenario B, DOC, UV254nm and turbidity removals were relatively lower than the ones from scenario A, because of the lower influent concentration in the former scenario (Table 4.3), although the waters from both scenarios were hydrophilic and with low NOM content. Extracellular microcystin results (Figure 0.11a) indicate no toxin release into the clarified water. The removal efficiency of extra MC-LR by DAF is very low (4.7-8.0%) for both types of water, as already obtained in previous works (Ribau Teixeira and Rosa (2006a), Ribau Teixeira and Rosa (2007)).
NF is able to completely remove cyanobacteria (~100% removal efficiency of chl_a and intracellular MC-LR, Figure 0.11b) and the associated microcystins (Table 4.4), regardless of the water recovery rate (up to 84%) and the type of cyanobacteria present (cells, colonies or filaments). Those results showed that neither the type and NOM concentrations studied influenced the MC rejection, nor the presence of different MC morphologies affected the rejection of NOM. They also indicated that the high MC rejections obtained are mainly related to size exclusion effects, based on the high MC size (994 to 1001 g/mol depending on the variant) and on the MC overall net charge (negative, but weakly charged) (Ribau Teixeira and Rosa (2006d)).
Assessing the Health Risk of Flotation-Nanofiltration Sequence… 385
Figure 0.11. C/F/DAF and C/F/DAF − NF removal efficiencies for the two studied scenarios.
For turbidity removals are very high ~100% and the treated water quality is far below the national standard of 1 NTU for both scenarios. UV254nm, DOC and SUVA values in the treated water are very low (Table 4.4). Therefore, minimal THMFP may be expected (EPA (1999)) – besides the very low DOC concentration, the hydrophilic DOC (very low SUVA values) has a lower potential to form THM than hydrophobic DOC (Galapate et al. (2001)). In addition to this control of disinfection by-products formation, these processes integrating NF ensure an excellent control of particles, as well as of other micropollutants (above ca. 200 g/mol, e.g. anatoxin-a (Ribau Teixeira and Rosa (2006d)) that may be present in raw water or be released during treatment.
The extra- and intra-MC of the treated water is under the limit of quantification (< 0.052 μg/L, Table 4.4), i.e. far below the WHO guideline value for drinking water, 1 μg/L for MC-LR. According to the Alert Levels (Bartram et al. (1999)), the studied scenarios correspond to a toxic bloom with high biomass, so it represents one of worst scenarios that a water treatment plant might have to face. Therefore, the C/F/DAF − NF sequence is a safe barrier against M. aeruginosa and the associated microcystin variants in drinking water, even when high concentrations of biomass, toxins and different cyanobacteria morphologies are present in the raw water (Table 4.4).
The same protection against microcystins could not be provided by conventional treatment as already mention by several authors (Ribau Teixeira (2005), Ribau Teixeira and Rosa (2006a), Mouchet and Bonnélye (1998) Hrudey et al. (1999), Chow et al. (1999), Ribau Teixeira and Rosa (2007)).
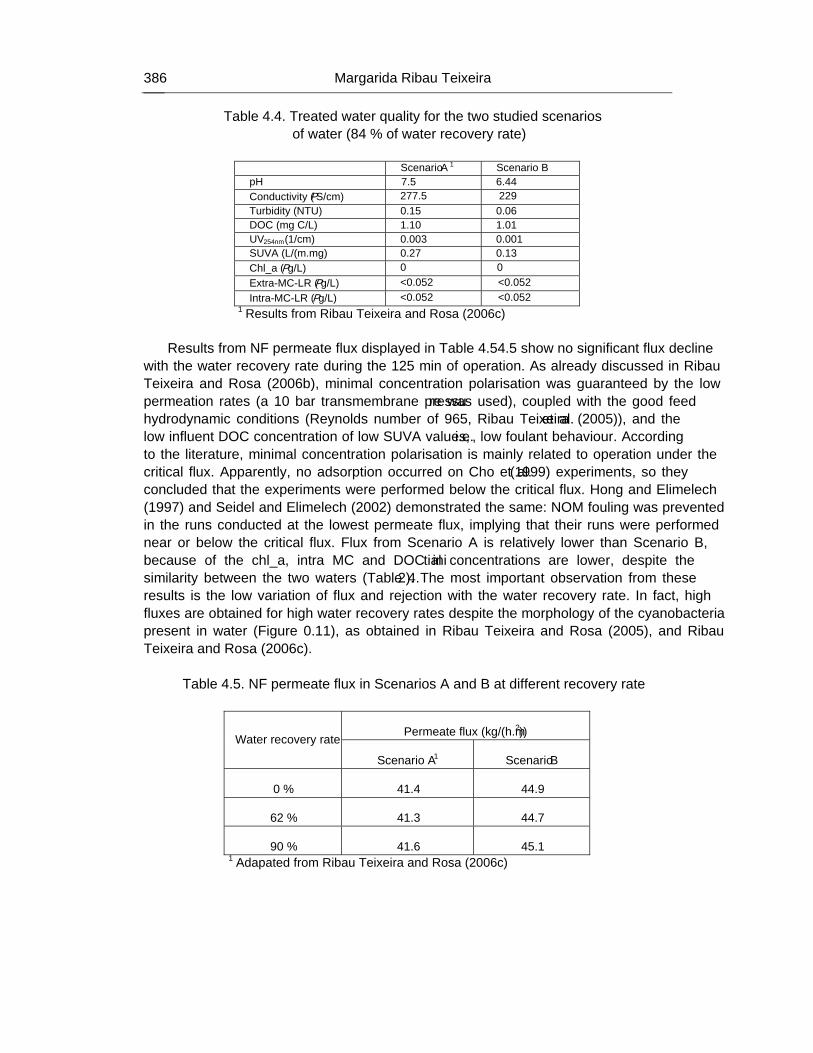
Margarida Ribau Teixeira 386
Table 4.4. Treated water quality for the two studied scenarios of water (84 % of water recovery rate)
Scenario A 1 Scenario B pH 7.5 6.44 Conductivity (μS/cm) 277.5 229 Turbidity (NTU) 0.15 0.06 DOC (mg C/L) 1.10 1.01 UV254nm (1/cm) 0.003 0.001 SUVA (L/(m.mg) 0.27 0.13 Chl_a (μg/L) 0 0 Extra-MC-LR (μg/L) <0.052 <0.052 Intra-MC-LR (μg/L) <0.052 <0.052
1 Results from Ribau Teixeira and Rosa (2006c) Results from NF permeate flux displayed in Table 4.54.5 show no significant flux decline
with the water recovery rate during the 125 min of operation. As already discussed in Ribau Teixeira and Rosa (2006b), minimal concentration polarisation was guaranteed by the low permeation rates (a 10 bar transmembrane pressure was used), coupled with the good feed hydrodynamic conditions (Reynolds number of 965, Ribau Teixeira et al. (2005)), and the low influent DOC concentration of low SUVA values, i.e., low foulant behaviour. According to the literature, minimal concentration polarisation is mainly related to operation under the critical flux. Apparently, no adsorption occurred on Cho et al. (1999) experiments, so they concluded that the experiments were performed below the critical flux. Hong and Elimelech (1997) and Seidel and Elimelech (2002) demonstrated the same: NOM fouling was prevented in the runs conducted at the lowest permeate flux, implying that their runs were performed near or below the critical flux. Flux from Scenario A is relatively lower than Scenario B, because of the chl_a, intra MC and DOC initial concentrations are lower, despite the similarity between the two waters (Table 4.2). The most important observation from these results is the low variation of flux and rejection with the water recovery rate. In fact, high fluxes are obtained for high water recovery rates despite the morphology of the cyanobacteria present in water (Figure 0.11), as obtained in Ribau Teixeira and Rosa (2005), and Ribau Teixeira and Rosa (2006c).
Table 4.5. NF permeate flux in Scenarios A and B at different recovery rate
Permeate flux (kg/(h.m2)) Water recovery rate
Scenario A 1 Scenario B
0 % 41.4 44.9
62 % 41.3 44.7
90 % 41.6 45.1 1 Adapated from Ribau Teixeira and Rosa (2006c)
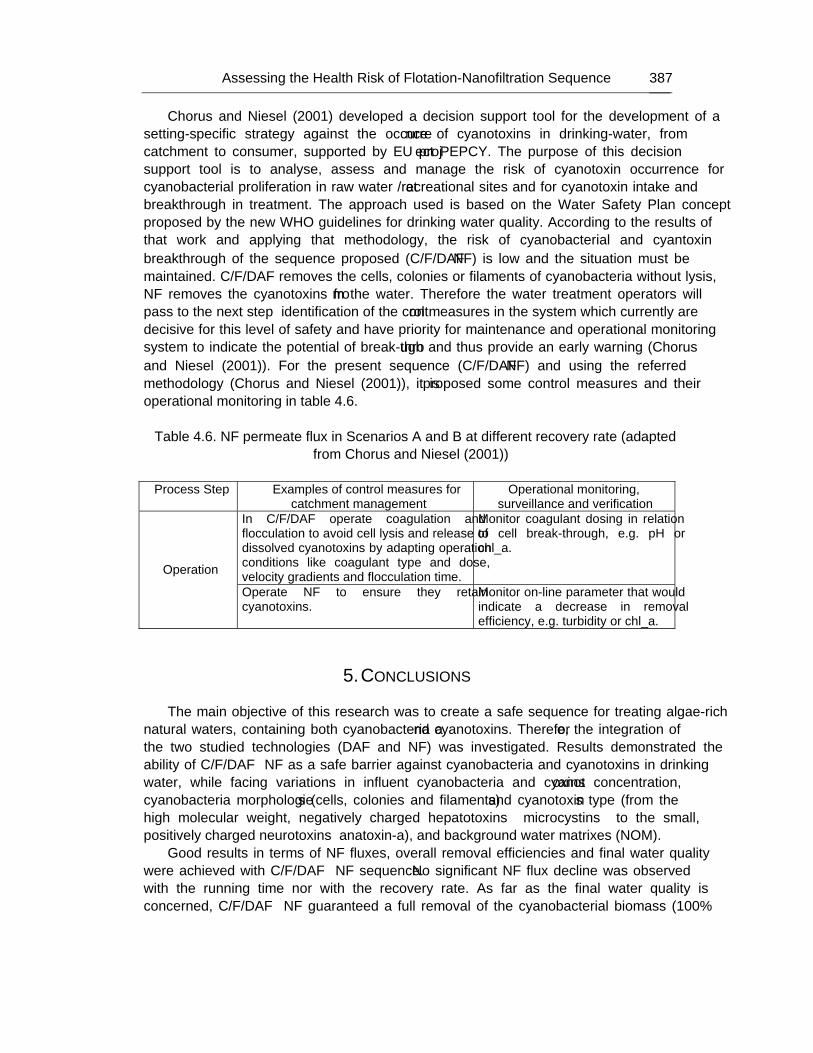
Assessing the Health Risk of Flotation-Nanofiltration Sequence… 387
Chorus and Niesel (2001) developed a decision support tool for the development of a setting-specific strategy against the occurrence of cyanotoxins in drinking-water, from catchment to consumer, supported by EU project “PEPCY”. The purpose of this decision support tool is to analyse, assess and manage the risk of cyanotoxin occurrence for cyanobacterial proliferation in raw water / at recreational sites and for cyanotoxin intake and breakthrough in treatment. The approach used is based on the Water Safety Plan concept proposed by the new WHO guidelines for drinking water quality. According to the results of that work and applying that methodology, the risk of cyanobacterial and cyantoxin breakthrough of the sequence proposed (C/F/DAF − NF) is low and the situation must be maintained. C/F/DAF removes the cells, colonies or filaments of cyanobacteria without lysis, NF removes the cyanotoxins from the water. Therefore the water treatment operators will pass to the next step – identification of the control measures in the system which currently are decisive for this level of safety and have priority for maintenance and operational monitoring system to indicate the potential of break-through and thus provide an early warning (Chorus and Niesel (2001)). For the present sequence (C/F/DAF − NF) and using the referred methodology (Chorus and Niesel (2001)), it is proposed some control measures and their operational monitoring in table 4.6.
Table 4.6. NF permeate flux in Scenarios A and B at different recovery rate (adapted
from Chorus and Niesel (2001))
Process Step Examples of control measures for catchment management
Operational monitoring, surveillance and verification
In C/F/DAF operate coagulation and flocculation to avoid cell lysis and release of dissolved cyanotoxins by adapting operation conditions like coagulant type and dose, velocity gradients and flocculation time.
Monitor coagulant dosing in relation to cell break-through, e.g. pH or chl_a.
Operation
Operate NF to ensure they retain cyanotoxins.
Monitor on-line parameter that would indicate a decrease in removal efficiency, e.g. turbidity or chl_a.
5. CONCLUSIONS The main objective of this research was to create a safe sequence for treating algae-rich
natural waters, containing both cyanobacteria and cyanotoxins. Therefore, the integration of the two studied technologies (DAF and NF) was investigated. Results demonstrated the ability of C/F/DAF – NF as a safe barrier against cyanobacteria and cyanotoxins in drinking water, while facing variations in influent cyanobacteria and cyanotoxins concentration, cyanobacteria morphologies (cells, colonies and filaments) and cyanotoxins type (from the high molecular weight, negatively charged hepatotoxins – microcystins – to the small, positively charged neurotoxins – anatoxin-a), and background water matrixes (NOM).
Good results in terms of NF fluxes, overall removal efficiencies and final water quality were achieved with C/F/DAF – NF sequence. No significant NF flux decline was observed with the running time nor with the recovery rate. As far as the final water quality is concerned, C/F/DAF – NF guaranteed a full removal of the cyanobacterial biomass (100%
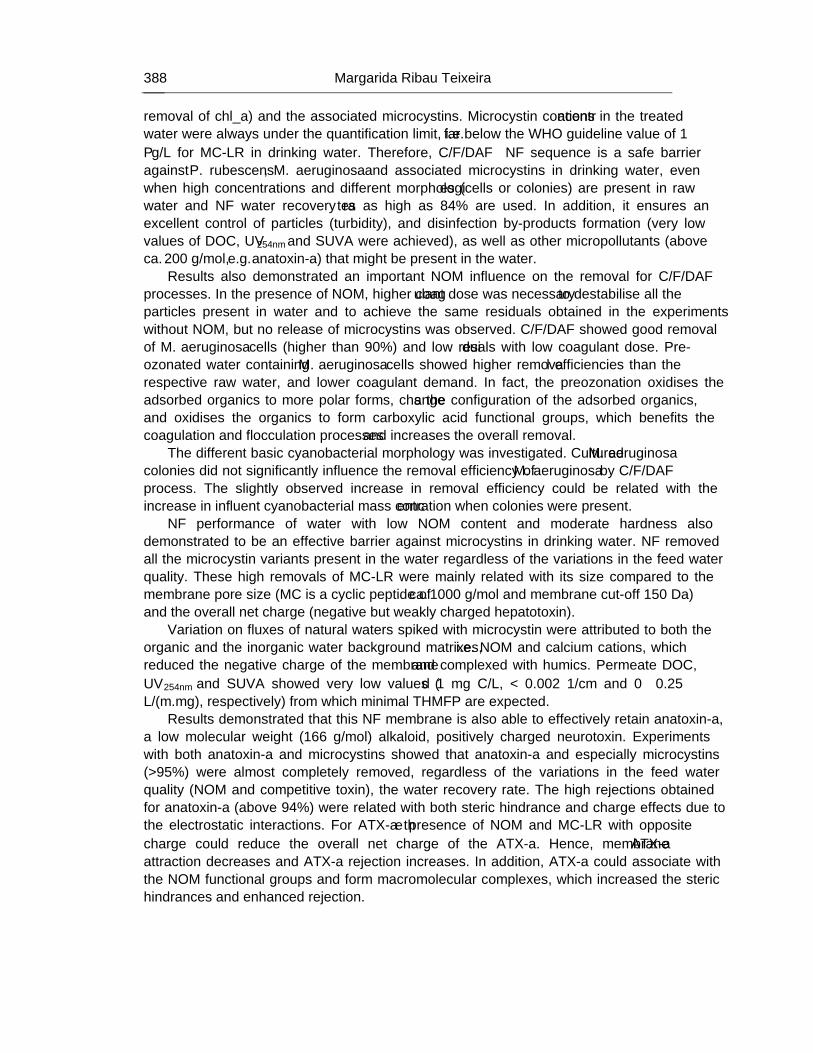
Margarida Ribau Teixeira 388
removal of chl_a) and the associated microcystins. Microcystin concentrations in the treated water were always under the quantification limit, i.e. far below the WHO guideline value of 1 μg/L for MC-LR in drinking water. Therefore, C/F/DAF – NF sequence is a safe barrier against P. rubescens, M. aeruginosa and associated microcystins in drinking water, even when high concentrations and different morphologies (cells or colonies) are present in raw water and NF water recovery rates as high as 84% are used. In addition, it ensures an excellent control of particles (turbidity), and disinfection by-products formation (very low values of DOC, UV254nm and SUVA were achieved), as well as other micropollutants (above ca. 200 g/mol, e.g. anatoxin-a) that might be present in the water.
Results also demonstrated an important NOM influence on the removal for C/F/DAF processes. In the presence of NOM, higher coagulant dose was necessary to destabilise all the particles present in water and to achieve the same residuals obtained in the experiments without NOM, but no release of microcystins was observed. C/F/DAF showed good removal of M. aeruginosa cells (higher than 90%) and low residuals with low coagulant dose. Pre-ozonated water containing M. aeruginosa cells showed higher removal efficiencies than the respective raw water, and lower coagulant demand. In fact, the preozonation oxidises the adsorbed organics to more polar forms, changes the configuration of the adsorbed organics, and oxidises the organics to form carboxylic acid functional groups, which benefits the coagulation and flocculation processes and increases the overall removal.
The different basic cyanobacterial morphology was investigated. Cultured M. aeruginosa colonies did not significantly influence the removal efficiency of M. aeruginosa by C/F/DAF process. The slightly observed increase in removal efficiency could be related with the increase in influent cyanobacterial mass concentration when colonies were present.
NF performance of water with low NOM content and moderate hardness also demonstrated to be an effective barrier against microcystins in drinking water. NF removed all the microcystin variants present in the water regardless of the variations in the feed water quality. These high removals of MC-LR were mainly related with its size compared to the membrane pore size (MC is a cyclic peptide of ca. 1000 g/mol and membrane cut-off 150 Da) and the overall net charge (negative but weakly charged hepatotoxin).
Variation on fluxes of natural waters spiked with microcystin were attributed to both the organic and the inorganic water background matrixes, i.e. NOM and calcium cations, which reduced the negative charge of the membrane and complexed with humics. Permeate DOC, UV254nm and SUVA showed very low values (≤ 1 mg C/L, < 0.002 1/cm and 0 – 0.25 L/(m.mg), respectively) from which minimal THMFP are expected.
Results demonstrated that this NF membrane is also able to effectively retain anatoxin-a, a low molecular weight (166 g/mol) alkaloid, positively charged neurotoxin. Experiments with both anatoxin-a and microcystins showed that anatoxin-a and especially microcystins (>95%) were almost completely removed, regardless of the variations in the feed water quality (NOM and competitive toxin), the water recovery rate. The high rejections obtained for anatoxin-a (above 94%) were related with both steric hindrance and charge effects due to the electrostatic interactions. For ATX-a the presence of NOM and MC-LR with opposite charge could reduce the overall net charge of the ATX-a. Hence, membrane−ATX-a attraction decreases and ATX-a rejection increases. In addition, ATX-a could associate with the NOM functional groups and form macromolecular complexes, which increased the steric hindrances and enhanced rejection.
Assessing the Health Risk of Flotation-Nanofiltration Sequence… 389
No negative effects (competition) were found between ATX-a, MC-LR and NOM, and NF is able to reach low residuals for all parameters: ≤ 0.17 NTU for turbidity, ≤ 1.5 mg C/L for DOC, and no UV254nm absorbance from which minimal THMFP are expected. Anatoxin-a concentrations in the NF permeate are always below 1.3 μg/L, far below the New Zealand’s guideline value of 3 μg/L, and microcystins are usually under the quantification limit and always far below the WHO guideline value of 1 μg/L MC-LR for drinking water.
As far as assessing the health risk, it was proved that the risk of cyanobacterial and cyantoxin breakthrough of the sequence proposed (DAF – NF) is low, in the tested conditions. This sequence removed intact cells, colonies or filaments of cyanobacteria and then removes the toxins present in the water (present in the raw water or released during the treatment). Therefore, this sequence is an alternative technical option for the actualisation of the water treatment system when the prevention management options did not succeed.
6. ACKNOWLEDGEMENTS The author would like to thank Dr. Maria João Rosa for her orientation; PRODEP
Program (nº 2/5.3/PRODEP/2001) for providing a PhD scholarship to Margarida Ribau Teixeira; European Project “Toxic - Barriers against cyanotoxins in drinking water” EVK1-CT-2002-00107 (01/09/2002 – 31/08/2005) and Águas do Algarve, SA (Portugal) for funding this research; Teresa Cecílio for her help with PCC7820 cultures, and DOC and microcystins analysis; and Vânia Sousa for her help in DAF – NF experiments in scenario B.
7. REFERENCES
Amy G., Cho J. (1999). Interactions between natural organic matter (NOM) and membranes: rejection and fouling. Water Science and Technology, 40(9), 131-139.
Amy G.L., Sierka R.A., Bedessem J., Price D., Tan L. (1992). Molecular size distribution of dissolved organic matter. Journal of American Water Works Association, 84(6), 67-75.
Ando A., Miwa M., Kajino M., Tatsumi S. (1992). Removal of musty-odorous compounds in water and retained in algal cells through water purification processes. Water Science and Technology, 25(2), 299-306.
AWWA (2000). Water Quality and Treatment. A Handbook of Community Water Supplies. 5th edition. American Water Works Association editors. USA. McGraw-Hill.
Bache D.H., Rasool E. (2001). Characteristics of alumino-humic floc on relation to DAF performance. Water Science and Technology, 43(8), 203-208.
Bartram J., Burch M., Falconer I., Jones G., Kuiper-Godman T. (1999). Situation assessment, planning and management. In Toxic Cyanobacteria in Water. A Guide to Their Public Heath Consequences, Monitoring and Management. Edited by I. Chorus and J. Bartram, World Health Organization. (London: E & FN SPON) pp 179-209.
Bauer M.J., Bayley R., Chipps M.J.E.A., Scriven R.J., Rachwal A.J. (1998). Enhanced rapid gravity filtration and dissolved air flotation for pre-treatment of river Thames reservoir water. Water Science and Technology, 37(2), 35-42.
Margarida Ribau Teixeira 390
Bellona C., Drewes J.E., Amy G. (2004). Factors affecting the rejection of organic solutes during NF/RO treatment - a literature review. Water Research, 38, 2795-2809.
Berg P., Hagmeyer G., Gimbel R. (1997). Removal of pesticides and other micropollutants by nanofiltration. Desalination, 113, 205-208.
Blau T.J., Taylor J.S., Morris K.E., Mulford L.A. (1992). DBP control by nanofiltration: cost and performance. Journal American Water Works Association, 84, 104-116.
Bottino A., Capannelli C., Del Borghi A., Colombino M., Conio O. (2001). Water treatment for drinking purpose: ceramic microfiltration application. Desalination, 141, 75-79.
Braghetta A. (1995). The influence of solution chemistry operating conditions on nanofiltration of charged and uncharged organic macromolecules. PhD Thesis. University of North Carolin, Chapel Hill.
Braghetta A., DiGiano F.A., Ball W.P. (1997). Nanofiltration of natural organic matter: pH and ionic strength effects. Journal of Environmental Engineering, 123(7), 628-641.
Carmichael W.W. (1994). The toxins of cyanobacteria. Scientific American, 270(1), 78-86. Carmichael W.W. (1997). The cyanotoxins. Advances in Botanical Research, 27, 211-256. Carmichael W.W., Azevedo S.M.F.O., An J.S., Molica R.J.R., Jochimsen E.M., Lau S.,
Rinehart K.L., Shaw G.R., Eaglesham G.K. (2001). Human fatalities from cyanobacteria: chemical and biological evidence for cyanotoxins. Environmental Health Perspectives, 109(7), 663-668.
Chaufer B., Baudry-Rabiller M., Guihard L., Daufin G. (1996). Retention of ions in nanofiltration at various ionic strength. Desalination, 104, 37-46.
Chellam S., Taylor J.S. (2001). Simplified analysis of contaminant rejection during ground and surface water nanofiltration under the information collection rule. Water Research, 35(10), 2460-2474.
Childress A.E., Elimelech M. (1996). Effect of solution chemistry on the surface charge of polymeric reverse osmosis and nanofiltration membranes. Journal of Membrane Science, 119, 253-268.
Childress A.E., Elimelech M. (2000). Relating nanofiltration membrane performance to membrane charge (electrokinetic) characteristics. Environmental Science and Technology, 34, 3710-3716.
Cho J., Amy G., Pellegrino J. (1999). Membrane filtration of natural organic matter: initial comparison of rejection and flux decline characteristics with ultrafiltration and nanofiltration membranes. Water Research, 33(11), 2517-2526.
Chorus I. (2005). Current Approaches to Cyanotoxin Risk Assessment, Risk Management and Regulations in Different Countries. Berlin: Federal Environmental Agency.
Chorus I., Falconer I.R., Salas H.J., Bartram J. (2000). Health risks caused by freshwater cyanobacteria in recreational waters. Journal of Toxicology and Environmental Health, Part B, 3, 323-347.
Chorus I., Niesel V. (2001). Decision support tool for the development of a setting-specific strategy against the occurrence of cyanotoxins in drinking-water, from catchment to consumer. EU Project “PEPCY” (Toxic and bioactive PEPtides in CYanobacteria, grant no. QLRT-2001-02634). Available from: URL: http://www.pepcy.de/PEPCY-DST/0%20START.htm, acceded in 29th of September 2008.
Chow C.W.K., Drikas M., House J., Burch M.D., Velzeboer R.M.A. (1999). The impact of conventional water treatment processes on cells of the cyanobacterium Microcystis aeruginosa. Water Research, 33(15), 3253-3262.
Assessing the Health Risk of Flotation-Nanofiltration Sequence… 391
Chow C.W.K., House J., Velzeboer R.M.A., Drikas M., Burch M.D., Steffensen D.A. (1998). The effect of ferric chloride flocculation on cyanobacterial cells. Water Research, 32(3), 808-814.
Chow C.W.K., Planglisch S., House J., Drikas M., Burch M.D., Gimbel R. (1997). A study of membrane filtration for the removal of cyanobacterial cells. Journal of Water Supply: Research and Technology - AQUA, 46(6), 324-334.
Chung Y., Choi Y.C., Choi Y.H.,Kang H.S. (2000). A demonstration scaling-up of the dissolved air flotation. Water Research, 34(3), 817-824.
Codd G.A., Morrison L.F., Metcalf J.S. (2005). Cyanobacterial toxins: risk management for health protection. Toxicology and Applied Pharmacology, 203, 264-272.
Cook D., Newcombe G. (2002). Removal of microcystin variants with powdered activated carbon. 3rd World Water Congress. Melbourne, Australia.
Crossley I.A., Valade M.T., Shawcross J. (2001). Using lessons learned and advanced methods to design a 1,500 Ml/day DAF water treatment plant. Water Science and Technology, 43(8), 35-41.
Daldorph P.W.G. (1998). Management and treatment of algae in Lowland reservoirs in Eastern England. Water Science and Technology, 37(2), 57-63.
De Pinho M.N., Minhalma M., Rosa M.J., Taborda F. (2000). Integration of flotation/ultrafiltration for treatment of bleached pulp effluent. Pulp & Paper Canada, 101(4), 50-54.
Dey T.K., Tamachandhran V., Misra B.M. (2000). Selectivity of anionic species in binary mixed electrolyte systems for nanofiltration membranes. Desalination, 127, 165-175.
Dietrich D., Hoeger S. (2005). Guidance values for microcystins in water and cyanobacterial supplement products (blue-green algal supplements): a reasonable or misguided approach? Toxicology and Applied Pharmacology, 203, 273-289.
Donati C., Drikas M., Hayes K.R., Newcombe G. (1994). Microcystin-LR adsorption by powdered activated carbon. Water Research, 28(8), 1735-1742.
Drikas M., Chow C.W.K., House J., Burch M.D. (2001). Using coagulation, flocculation and settling to remove toxic cyanobacteria. Journal of American Water Works Association, 2, 100-111.
Dupre V., Ponasse M., Aurelle Y., Secq A. (1998). Bubble formation by water release in nozzles I. Mechanisms. Water Research, 32 (8), 2491-2497.
Eckenfelder W.W. (2000). Industrial Water Pollution Control. 3rd edition. New York. McGraw-Hill Book Company.
Edzwald J.K., Van Benschoten J.B. (1990). Aluminium coagulation of natural organic matter. In Chemical Water and Wastewater Treatment. H.H. Hahn and R. Klute (Eds.) edition. Berlin. Springer-Verlag. pp. 341-359.
Edzwald J.K., Walsh J.P., Kaminski G.S., Dunn H.J. (1992). Flocculation and air requirements for dissolved air flotation. Journal of American Water Works Association, 84(3), 92-100.
Elimelech M., Chen W.H., Waypa J.J. (1994). Measuring the zeta (electrokinetic) potential of reverse osmosis membranes by a streaming potential analyzer. Desalination, 95, 269-286.
EPA (1999). Enhanced Coagulation and Enhanced Precipitate Softening Guidance Manual. EPA 814-R-99-012, Office of Water (4607). United States of America, Environmental Protection Agency.
Margarida Ribau Teixeira 392
European Union (2000). Directive 2000/60/EC of the European Parliament and of the Council of 23 October 2000, establishing a framework for Community action in the field of water policy.
Faibish R.S., Elimelech M., Cohen Y. (1998). Effect of interparticle double layer interactions on permeate flux decline in crossflow membrane filtration of colloidal suspensions: an experimental investigation. Journal of Colloid and Interface Science, 204, 77-86.
Falconer I., Bartram J., Chorus I., Kuiper-Goodman T., Utkilen H., Burch M., Codd G.A. (1999). Safe levels and safe practices. In Toxic Cyanobacteria in Water. A Guide to Their Public Heath Consequences, Monitoring and Management. Edited by I. Chorus and J. Bartram, World Health Organization. (London: E & FN SPON) pp 155-178.
Falconer I.R., Runnegar M.T.C., Buckley T., Huyn V.L., Bradshaw P. (1989). Using activated carbon to remove toxicity from drinking water containing cyanobacterial blooms. Journal of American Water Works Association, 2, 102-105.
Fawell J.K., Mitchell R.E., Hill R.E., Everett D.J. (1999). The toxicity of cyanovacterial toxins in the mouse: II. Anatoxin-a. Hum. Exp. Toxicology, 18, 168-173.
Fukushi K., Tambo N., Matsui Y. (1995). A kinetic model for dissolved air flotation in water and wastewater treatment. Water Science and Technology, 31(3-4), 37-47.
Galapate R.P., Aloysius U.B., Okada M. (2001). Transformation of dissolved organic carbon matter during ozonation: effects on trihalomethane formation potential. Water Research, 35(9), 2201-2206.
Gijsbertsen-Abrahamse A.J., Schmidt W., Chorus I., Heijmen S.G.J. (2006). Removal of cyanotoxins by ultratfiltration and nanofiltration. Journal of Membrane Science, 276, 252-259.
Hall T., Schmidt W., Codd G.A., Von Guten U., Kasas H., Acero J., Heijman B., Meriluoto J., Rosa M.J., Manckiewicz J. et al. (2005). Best Practice Guidance for Management of Algal Toxins in Water Supplies, developed within TOXIC European project “Barriers against cyanotoxins in drinking water” (EVK1-CT00107-2002, European Commission).
Han M., Kim W., Dockko S. (2001). Collision efficiency factor of bubble and particle (�bp) in DAF: theory and experimental verification. Water Science and Technology, 43(8), 139-144.
Hargesheimer E.E., Watson S.B. (1996). Drinking water treatment options for taste and odour control. Water Research, 30(6), 1423-1430.
Hart J and Stott P (1993). Microcystin-LR removal from water, FR0367 (Marlow, UK: Foundation for Water Research).
Heath Canada (2002). Guidelines for Canadian drinking water quality. Cianobacterial Toxins - Microcystin-LR.
Hedberg T., Dahlquist J., karlsson D., Sorman L.-O. (1998). Development of air removal system for dissolved air flotation. Water Science and Technology, 37(9), 81-88.
Her N., Amy G., Jarusutthirak C. (2000). Seasonal variations of nanofiltration (NF) foulants: identification and control. Desalination, 132, 143-160.
Himberg K., Keijola A.-M., Hiisvirta L., Pyysalo H., Sivonen K. (1989). The effect of water treatment processes on the removal of hepatotoxins from Microcystis and Oscillatoria cyanobacteria: a laboratory study. Water Research, 23(8), 979-984.
Hitzfeld B.C., Hoger S.J., Dietrich D.R. (2000). Cyanobacterial toxins: removal during drinking water treatment, and human risk assessment. Environmental Health Perspectives, 108(1), 113-122.
Assessing the Health Risk of Flotation-Nanofiltration Sequence… 393
Hoeger S.J., Hitzfeld B.C., Dietrich D.R. (2005). Occurence and elimination of cyanobacterial toxins in drinking water treatment plants. Toxicology and Applied Pharmacology, 203, 231-242.
Hoffmann J.R.H. (1976). Removal of Microcystis toxins in water purification processes. Water SA, 2, 58-60.
Hong S., Elimelech M. (1997). Chemical and physical aspects of natural organic matter (NOM) fouling of nanofiltration membranes. Journal of Membrane Science, 132, 159-181.
Hrudey S.E., Burch M., Drikas M., Gregory R. (1999). Remedial Measures. In Toxic Cyanobacteria in Water. A Guide to Their Public Heath Consequences, Monitoring and Management. Edited by I. Chorus and J. Bartram, World Health Organization. (London: E & FN SPON) pp 275-306.
Humpage A.R., Falconer. I.R. (2003). Oral toxicity of the cyanobacterial toxin cylindrospermopsin in male Swiss albino mice: determination of no observed adverse effect level for deriving a drinking water guideline value. Environmental Toxicology, 18, 94-103.
Jameson G.J. (1999). Hydrophobicity and floc density in induced-air flotation for water treatment. Colloids and Surfaces A, 151, 269-281.
Jiang J.Q., Graham J.D. (1996). Enhanced coagulation using Al/Fe(III) coagulants: effect of coagulant chemistry on the removal of colour-causing NOM. Environmental Technology, 17, 937-950.
Jiang J.-Q., Graham N.J.D., Harward C. (1993). Comparison of polyferric sulphate with other coagulants for the removal of algae and algae-derived organic matter. Water Science and Technology, 27(11), 221-230.
Jones G., Orr P.T. (1994). Release and degradation of microcystin following algicide treatment of a Microcystis aeruginosa bloom in a recreational lake, as determined by HPLC and protein phosphatase inhibition assay. Water Research, 28 4), 871-876.
Jucker C., Clark M.M. (1994). Adsorption of aquatic humic substances on hydrophobic ultrafiltration membranes. Journal of Membrane Science, 97, 37-52.
Keijola A.M., Himberg K., Sivonen K., Hiisvirta L. (1988). Removal of cyanobacterial toxins in water treatment processes: laboratory and pilot-scale experiments. Toxicity Assessment, 3, 643-656.
Kempeneers S., Van Manxel F., Gille L. (2001). A decade of large scale experience in dissolved air flotation. Water Science and Technology, 43 (8), 27-34.
Kilduff J.E., Mattaraj S., Belfort G. (2004). Flux decline during nanofiltration of naturally-occurring dissolved organic matter: effects of osmotic pressure, membrane permeability, and cake formation. Journal of Membrane Science, 239, 39-53.
Kimura K., Amy G., Drewes J., Watanabe Y. (2003). Adsorption of hydrophobic compounds onto NF/RO membranes: an artifact leading to overestimation of rejection. Journal of Membrane Science, 221, 89-101.
Kuiper-Godman T., Falconer I., Fitzgerald J. (1999). Human health aspects. In Toxic Cyanobacteria in Water. A Guide to Their Public Heath Consequences, Monitoring and Management. Edited by I. Chorus and J. Bartram, World Health Organization. (London: E & FN SPON) pp 113-153.
Margarida Ribau Teixeira 394
Kwon S.B., Ahn H.W., Ahn C.J., Wang C.K. (2004). A case study of dissolved air flotation for seasonal high turbidity water in Korea. Water Science and Technology, 50(12), 245-253.
Lahti K., Rapala J., Fardig M., Niemela M., Sivonen K. (1997). Persistence of cyanobacterial hepatotoxin, microcystin-LR in particulate material and dissolved in lake water. Water Research, 31(5), 1005-1012.
Lahti K., Rapala J., Kivimaki A.-L., Kukkonen J., Niemela M., Sivonen K. (2001). Occurrence of microcystins in raw water sources and treated drinking water of Finnish waterworks. Water Science and Technology, 43(12), 225-229.
Lam A.K.Y., Prepas E.E., Spink D., Hrudey S.E. (1995). Chemical control of hepatotoxic phytoplankton blooms: implications for human health. Water Research, 29(8), 1845-1854.
Lambert T.W., Holmes C.F.B., Hrudey S.E. (1996). Adsorption of microcystin-LR by activated carbon and removal in full scale water treatment. Water Research, 30(6), 1411-1422.
Lawton L.A., Robertson P.K.J. (1999). Physico-chemical treatment methods for the removal of microcystins (cyanobacterial hepatotoxins) from potable waters. Chemical Society Review, 28, 217-224.
Lee S., Amy G., Cho J. (2004). Applicability of Sherwood correlations for natural organic matter (NOM) transport in nanofiltration (NF) membranes. Journal of Membrane Science, 240, 49-65.
Lorenzen C.J. (1967). Determination of chlorophyll and pheo-pigments: spectrophotometric equations. Limnology and Oceanography, 12(2), 343-346.
Ma J., Liu W. (2002). Effectiveness and mechanism of potassium ferrate (VI) preoxidation for algae removal by coagulation. Water Research, 26, 871-878.
Maagd P.G.J., Hendriks A.A.J., Seinen W., Sijm D.T.H. (1999). pH-dependent hydrophobicity of the cyanobacteria toxin microcystin-LR. Water Research, 33 (3), 677-680.
Malley J.P., Edzwald J.K. (1991). Concepts for dissolved-air flotation treatment of drinking waters. Journal of Water Supply: Research and Technology AQUA, 40 (1), 7-17.
Matsushima N.R., Ohta T., Nishiwaki S., Suganuma M., Kohyama K., Ishikawa T., Carmichael W.W., Fujiki H. (1992). Liver tumor promotion by the cyanobacterial peptide toxin microcystin-LR. Journal of Cancer Res. Clin. Incol., 118, 420-424.
Meriluoto J. (1997). Chromatography of microcystins. Analytica Chimica Acta, 352, 277-298. Meriluoto, J., Spoof L. (2005a). SOP: Analysis of microcystins by high-performance liquid
chromatography with photodiode-array detection. SOP_TOXIC_AAU_06F. In TOXIC Cyanobacterial Monitoring and Cyanotxin Analysis. J. Meriluoto and G.A. Codd edition. Finland. Abo Akademi University Press.
Meriluoto, J., Spoof L. (2005b). SOP: Solid phase extraction of microcystins in water samples. SOP_TOXIC_AAU_05F. In TOXIC Cyanobacterial Monitoring and Cyanotxin Analysis. J. Meriluoto and G.A. Codd edition. Finland. Abo Akademi University Press.
Metcalf, Eddy (2003). Wastewater Engineering. Treatment, Disposal, Reuse. 4th edition. New York. McGraw-Hill International Editions. pp. 1334.
Metcalf J.S., Codd G.A. (2005a). SOP: Analysis of anatoxin-a by high-performance liquid chromatography with photodiode-array detection. SOP_TOXIC_UDU_08F. In TOXIC
Assessing the Health Risk of Flotation-Nanofiltration Sequence… 395
Cyanobacterial Monitoring and Cyanotxin Analysis. J. Meriluoto and G.A. Codd edition. Finland. Abo Akademi University Press.
Metcalf J.S., Codd G.A. (2005b). SOP: Solid phase extraction of anatoxin-a in filtered water samples. SOP_TOXIC_UDU_04F. In TOXIC Cyanobacterial Monitoring and Cyanotxin Analysis. J. Meriluoto and G.A. Codd edition. Finland. Abo Akademi University Press.
Ministry of Health (2002). Provisional Maximum Acceptable Values for Cyanotoxins (A3.1.3). New Zeeland.
Ministry of Environment (2007). Portuguese drinking water guidelines (DL nº 306/2007, 27 of August). Lisbon.
Mohamed Z.A., El-Sharouny H., Ali W.S. (2007). Microcystin concentrations in the Nile river sediments and removal of microcystin-LR by sediments during batch experiments. Archives in Environmental, Contamination and Toxicology, 52, 489-495.
Mouchet P., Bonnélye V. (1998). Solving algae problems: French expertise and world-wide applications. Journal of Water Supply: Research and Technology - AQUA, 47(3), 125-141.
Mulder, M. (1997). Basic Principles of Membrane Technology. 2nd edition. Netherlands. Kluwer Academic Publishers.
Muntisov M., Trimboli P. (1996). Removal of algal toxins using membrane technology. Water, 23(3), 34.
Mur L.R., Skulberg O.M., Utkilen H. (1999). Cyanobacteria in the environment. In Toxic Cyanobacteria in Water. A Guide to Their Public Heath Consequences, Monitoring and Management. Edited by I. Chorus and J. Bartram, World Health Organization. (London: E & FN SPON) pp 15-34.
Neumann U., Weckesser J. (1998). Elimination of microcystin peptide toxins from water by reverse osmosis. Environmental Toxicology and Water Quality, 13, 143-148.
NHMRZ/ARMCANZ (2001). Australian drinking water guidelines, micro-organism 3: Toxic algae, fact sheets No. 17a-17d. (Canberra: National Health and Medical Research Council, Agriculture and Resource Management Council of Australia and New Zealand).
Nilson J., DiGiano F.A. (1996). Influence of NOM composition on nanofiltration. Journal American Water Works Association, 88(5), 53-66.
Nyström M., Kaipia L., Luque S. (1995). Fouling and retention of nanofiltration membranes. Journal of Membrane Science, 98, 249-262.
Owen D.M., Amy G.L., Chowdhury Z.K., Paode R., McCoy G., Viscosil K. (1995). NOM characterization and treatability. Journal of American Water Works Association, 87(1), 46-63.
Peeters J.M.M., Mulder M.H.V., Strathmann H. (1999). Streaming potential measurements as a characterization method for nanofiltration membranes. Colloids and Surface. A: Physicochemical and Engineering Aspects, 150, 247-259.
Peltier S., Cotte M., Gatel D., Herremans L., Carvard J. (2002). Nanofiltration: Improvements of water quality in a large distribution system. 3rd World Water Congress of the International Water Association (IWA). Melbourne, Australia.
Pomes M.L., Green W.R., Thurman E.M., Orem W.H., Lerch H.E. (1999). DBP formation potential of aquatic humic substances. Journal American Water Works Association, 91(3), 103-115.
Reiss C.R., Taylor J.S., Robert C. (1999). Surface water treatment using nanofiltration - pilot testing results and design considerations. Desalination, 125, 97-112.
Margarida Ribau Teixeira 396
Ribau Teixeira M. (2005). Development of flotation and nanofiltration technologies to remove cyanobacteria and cyanotoxins in drinking water treatment. PhD Thesis. University of Algarve, Faculty of Marine and Environmental Sciences, Faro, Portugal.
Ribau Teixeira M., Rosa M.J. (2005). Microcystins removal by nanofiltration membrane. Separation and Purification Technology, 46, 192-201.
Ribau Teixeira M., Rosa M.J. (2006a). Comparing dissolved air flotation and conventional sedimentation to remove cyanobaterial cells of Microcystis aeruginosa. Part I: The key operating conditions. Separation and Purification Technology, 52, 84-94.
Ribau Teixeira M., Rosa M.J. (2006b). The impact of the water background matrix on the natural organic matter removal by nanofiltration. Journal of Membrane Science, 279, 513-520.
Ribau Teixeira M., Rosa M.J. (2006c). Integration of the dissolved gas flotation and nanofiltration treatment processes for M. aeruginosa and microcystins removal. Water Research, 40, 3612-3620.
Ribau Teixeira M., Rosa M.J. (2006d). Neurotoxic and hepatotoxic cyanotoxins removal by nanofiltration. Water Research, 40, 2837-2846.
Ribau Teixeira M., Rosa M.J. (2007). Comparing dissolved air flotation and conventional sedimentation to remove cyanobacterial cells of Microcystis aeruginose. Part II: The effect of water background organics. Separation and Purification Technology, 53, 126-134.
Ribau Teixeira M., Rosa M.J., Nyström M. (2005). The role of membrane charge on nanofiltration performance. Journal of Membrane Science, 265, 160-166.
Rosa M.J., Cecílio T., Costa H., Baptista R., Lourenço D. (2004). Monitoring of Microcystins at Funcho Dam Reservoir, Portugal. 4th World Water Congress. Marrakech, Morrocos.
Rositano J., Newcombe G., Nicholson B., Sztajnbok P. (2001). Ozonation of NOM and algal toxins in four treated waters. Water Research, 35(1), 23-32.
Rositano J., Nicholson B.C., Pieronne P. (1998). Destruction of cyanobacterial toxins by ozone. Ozone Science & Engineering, 20, 223-238.
Schaep J., Vandecasteele C. (2001). Evaluating the charge of nanofiltration membranes. Journal of Membrane Science, 188, 129-136.
Schäfer A.I., (2001). Natural Organics Removal Using Membranes. Principles, Performance and Cost. Pennsylvania, USA: Technomic Publishing Company, Inc.
Schäfer A.I., Fane A.G., Waite T.D. (2000). Fouling effects on rejection in the membrane filtration of natural waters. Desalination, 131, 215-224.
Schmidt W., Willmitzer H., Bornmann K., Pietsch J. (2002). Production of drinking water from raw water containing cyanobacteria - pilot plant studies for assessing the risk of microcystin breakthrough. Environmental Toxicology, 17(4), 375-385.
Schofield T. (2001). Dissolved air flotation in drinking water production. Water Science and Technology, 43(8), 9-18.
Schäfer A.I., Fane A.G., Waite T.D. (1998). Nanofiltration of natural organic matter: Removal, fouling and the influence of multivalent ions. Desalination, 118 (1-3), 109-122.
Scriven R.J., Ouki S.K., Doggart A.S., Bauer M.J. (1999). The impact of physico-chemical water treatment on a novel flotation/filtration process. Water Science and Technology, 39(10-11), 211-215.
Assessing the Health Risk of Flotation-Nanofiltration Sequence… 397
Seidel A., Elimelech M. (2002). Coupling between chemical and physical interactions in natural organic matter (NOM) fouling of nanofiltration membranes: implications for fouling control. Journal of Membrane Science, 203, 245-255.
Siddiqui M., Amy G., Ryan J., Odem W. (2000). Membranes for the control of natural organic matter from surface waters. Water Research, 34(13), 3355-3370.
Sivonnen K., Jones G. (1999). Cyanobacterial toxins. In Toxic Cyanobacteria in Water. A Guide to Their Public Heath Consequences, Monitoring and Management. Edited by I. Chorus and J. Bartram, World Health Organization. (London: E & FN SPON) pp 41-91.
Spoof L. (2004). High-performance liquid chromatography of microcystins and nodularions cyanobacterial peptide toxins. PhD Thesis. Department of Biochemistry and Pharmacy. Abo Akademi University, Turku, Finland.
Stum (1992). Chemistry of the Solid-Water Interface. New York: Wiley Interscience. Ta C.T., Beckley J., Eades A. (2001). A multiphase CFD model of DAF process. Water
Science and Technology, 43(8), 153-157. Takahashi E., Yu Q., Eaglesham G., Connell D.W., McBroom J., Costanzo S., Shaw G.R.
(2007). Occurence and seasonal variantos of algal toxins in water, phytoplankton and shellfish from North Stradbroke Island, Queensalnd, Australia. Marine Environmental Research, 64, 429-442.
Tanninen J., Nyström M. (2002). Separation of ions in acidic conditions using NF. Desalination, 147, 295-299.
Thoeye C., Eyck V., Bixio D., Weemaes M., De Gueldre G. (2003). Methods Used for Heatlh Risk Assessment State of the Art Report Healh Risks in Aquifer Recharge Using Reclaimed Water, SDE/WSH/03.08 R. Aertgeerts and A. Angelakis (Geneva: World Health Organization).
Tsuji K., Watanuki T., Kondo F., Watanabe M.F., Nakazawa H., Suzuki M., Uchida H., Harada K.-I. (1997). Stability of microcystins from cyanobacteria - IV. Effect of chlorination on decomposition. Toxicon, 35(7), 1033-1041.
Valade M.T., Edzwald J.K., Tobiason J.E., Dahlquist J., Helberg T., Amato T. (1996). Particle removal by flotation and filtration: pretreatment effects. Journal of American Water Works Association, 88(12), 35-47.
Van der Bruggen B., Schaep J., Wilms D., Vandecasteele C. (1999). Influence of molecular size, polarity and charge on the retention of organic molecules by nanofiltration. Journal of Membrane Science, 156, 29-41.
Van der Bruggen B., Vandecasteele C., Van Gestel T., Doyen W., Leysen R. (2003). A review of pressure-driven membrane processes in wastewater treatment and drinking water production. Environmental Progress, 22(1), 46-56.
Van Hege K., Verhaege M., Verstraete W. (2004). Electro-oxidative abatement of low-salinity reverse osmosis membrane concentrates. Water Research, 38(6), 1550-1558.
Vasconcelos V.M., Sivonen K., Evans W.R., Carmichael W.W., Namikoshi M. (1996). Microcystin (heptapeptide hepatotoxins) diversity in cyanobacterial blooms collected in Portuguese fresh waters. Water Research, 30, 2377-2384.
Velzeboer R., Drikas M., Donati C., Burch M., Steffensen D. (1995). Release of geosmin by Anabaena circinalis following treatment with aluminium sulphate. Water Science and Technology, 31 (11), 187-194.
Margarida Ribau Teixeira 398
Vlaski A., van Breemen A.N., Alaerts G.J. (1996). Optimisation of coagulation conditions for the removal of cyanobacteria by dissolved air flotation or sedimentation. Journal of Water Supply: Research and Technology AQUA, 45(5), 253-261.
Vlaski A., van Breemen A.N., Alaerts G.J. (1997). The role of particle size and density in dissolved air flotation and sedimentation. Water Science and Technology, 36(4), 177-189.
Vuori E., Pelander A., Himberg K., Waris M., Niinivaara K. (1997). Removal of nodularin from brackish water with reverse osmosis or vacuum distillation. Water Research, 31(11), 2922-2924.
Walsby A.E., Kinsman R., George K.I. (1992). The measurements of gas vesicle volume and buoyant density in planktonic bacteria. Journal of Microbiology Methods, 15, 293-309.
Wang X.-L., Tsuru T., Nakao S., Kimura S. (1997). The electrostatic and steric-hindrance model for the transport of charged solutes through nanofiltration membranes. Journal of Membrane Science, 135, 19-32.
Wang X.-L., Tsuru T., Togoh M., Nakao S., Kimura S. (1995). Evaluation of pore structure and electrical properties of nanofiltration membranes. Journal of Chemical Engineering of Japan, 28(2), 186-192.
WHO (1998). Cyanobacterial Toxins: Microcystin-LR Guidelines for Drinking-Water Quality, Addendum to volume 2 (Geneva: World Heath Organization).
Widrig D.L., Gray K.A., Mcauliffe K.S. (1996). Removal of algal-derived organic material by preozonation and coagulation: monitoring changes in organic quality by pyrolysis-GC-MS. Water Research, 30(11), 2621-2632.
Yan Y., Jameson G.J. (2004). Application of the Jameson Cell technology for algae and phosphorus removal from maturation ponds. International Journal of Mineral Processing, 73(1), 23-28.
Yoon S.-H., Lee C.-H., Kim K.-J., Fane A.G. (1998). Effect of calcium ion on the fouling of nanofilter by humic acid in drinking water production. Water Research, 32(7), 2180-2186.
Zabel T. (1985). The advantages of dissolved-air flotation for water treatment. Journal of American Water Works Association, 5, 42-46.
Zhang Y., Van der Bruggen B., Chen G.X., Braeken L., Vandecasteele C. (2004). Removal of pesticides by nanofiltration: effect of the water matrix. Separation and Purification Technology, 38, 163-172.
Zimba P.V., Camus A., Allen E.H., Burkholder J.M. (2006). Co-occurrence of white shrimp, Litopenaeus vannamei, mortalities and microcystin toxin in southeatern USA shrimp facility. Aquaculture, 261, 1048-1055.
In: Handbook on Cyanobacteria ISBN: 978-1-60741-092-8 Editors: P. M. Gault and H. J. Marler © 2009 Nova Science Publishers, Inc.
Chapter 13
CAROTENOIDS, THEIR DIVERSITY AND CAROTENOGENESIS IN CYANOBACTERIA
Shinichi Takaichi1,* and Mari Mochimaru2 1 Department of Biology, Nippon Medical School,
Nakahara, Kawasaki 211-0063 (Japan), 2 Department of Natural Sciences, Komazawa University,
Setagaya, Tokyo 154-8525 (Japan)
ABSTRACT
Cyanobacteria grow by photosynthesis, and essentially contain chlorophyll and various carotenoids whose main functions are light-harvesting and photoprotection. In this chapter, we have summarized carotenoids, characteristics of carotenogenesis enzymes and genes, and carotenogenesis pathways in some cyanobacteria, whose carotenoids and genome DNA sequences have both been determined. Cyanobacteria contain various carotenoids: β-carotene, its hydroxyl or keto derivatives, and carotenoid glycosides. Both ketocarotenoids, such as echinenone and 4-ketomyxol, and the carotenoid glycosides, such as myxol glycosides and oscillol diglycoside, are unique carotenoids in phototrophic organisms. Some cyanobacteria contain both unique carotenoids, while others do not contain such carotenoids. From these findings, certain carotenogenesis pathways can be proposed. The different compositions of carotenoids might be due to the presence or absence of certain gene(s), or to different enzyme characteristics. For instance, two distinct β-carotene hydroxylases, CrtR and CrtG, are bifunctional enzymes whose substrates are both β-carotene and deoxymyxol, and substrate specificities of CrtR vary across species. Two distinct β-carotene ketolases, CrtO and CrtW, are found only in the first group and properly used in two pathways, β-carotene and myxol, depending on the species. At present, the number of functionally confirmed genes is limited, and only a few species are examined. Therefore, further studies of carotenoids, characteristics of carotenogenesis enzymes and genes, and carotenogenesis pathways are needed.
Shinichi Takaichi and Mari Mochimaru 400
INTRODUCTION Cyanobacteria grow by photosynthesis, and necessarily contain chlorophyll and
carotenoids, whose main functions are light-harvesting and photoprotection. The major carotenoids in cyanobacteria are β-carotene; its hydroxyl derivatives, zeaxanthin and nostoxanthin; its keto derivatives, echinenone and canthaxanthin; and the carotenoid glyco-sides, myxol 2'-methylpentosides and oscillol 2,2'-di-methylpentosides. Ketocarotenoids and carotenoid glycosides are quite unique in nature, especially among the phototrophic organisms (Britton et al., 2004; Takaichi & Mochimaru, 2007). In contrast, among the anoxy-genic phototrophic bacteria, purple bacteria contain only acyclic carotenoids, such as spirilloxanthin and spheroidene; both green sulfur bacteria and green filamentous bacteria contain derivatives of β-carotene and γ-carotene, such as isorenieratene, chlorobactene and hydroxychlorobactene glucoside ester; and heliobacteria contain C30 carotenoids, such as diaponeurosporene (Takaichi, 1999; Takaichi, 2009). The major carotenoids in land plants are β-carotene, lutein, violaxanthin and 9'-cis neoxanthin, which are derivatives of β-carotene and α-carotene; minors are zeaxanthin, antheraxanthin and α-carotene (Takaichi & Mimuro, 1998).
The three-dimensional structure of photosystem I from the thermophilic cyanobacterium Thermosynechococcus elongatus BP-1 has been determined, and it contains 12 membrane-spanning subunits and 127 cofactors, including 90 chlorophyll a and 22 carotenoids (Jordan et al., 2001). The structures of photosystem II from T. elongatus BP-1 (Ferreira et al., 2004; Kern et al., 2005) and Thermosynechococcus vulcanus RNK (Kamiya & Shen, 2003) have been determined, and the components are 16–17 membrane-spanning subunits and more than 70 cofactors, including 30–36 chlorophylls and 7–9 carotenoids. The only carotenoid in these complexes is β-carotene. Myxol glycosides are located in the cytoplasmic and the outer membranes without chlorophyll a, and they seem to have some important roles to photoprotection (Omata & Murata, 1984; Steiger et al., 1999; Takaichi et al., 2001). Further, the functions of carotenoids in cyanobacteria have been well summarized in the book The Photochemistry of Carotenoids (Frank et al., 1999).
Some studies of carotenoids in cyanobacteria were published in 1960s and 1970s (Stransky & Hager, 1970; Hertzberg et al., 1971). In 1980, Goodwin compiled the first list of the carotenoids from about 40 species of cyanobacteria (Goodwin, 1980), with several species added thereafter (Hirschberg & Chamovitz, 1994). In these early studies, several carotenoids were doubtful or were listed with insufficient data. Further, some novel genera and species have been recognized in cyanobacteria, and some species have been reclassified and/or renamed using new classification techniques (Castenholz, 2001). Recently, we summarized carotenoids and carotenogenesis in some cyanobacteria (Takaichi & Mochimaru, 2007).
Most carotenoids have trivial names; moreover, all carotenoids have been named semisystematically based on IUPAC-IUB nomenclature (IUPAC Commission on Nomenclature of Organic Chemistry and the IUPAC-IUB Commission on Biochemical Nomenclature, 1975). A list of both names and the structures of all known naturally-occurring carotenoids, and references giving data for each compound, are presented in Carotenoids Handbook (Britton et al., 2004), and in the Web of Bioactive Lipid Database (Carotenoids) (http://lipidbank.jp/).
* FAX: +81 44 722 1231, e-mail: [email protected]
Carotenoids, Their Diversity and Carotenogenesis in Cyanobacteria 401
In higher plants, pathways of carotenogenesis are well characterized (Cunningham, 2002). By comparison, there have been relatively few carotenogenesis enzymes or genes functionally identified in cyanobacteria (Armstrong, 1997; Hirschberg & Chamovitz, 1994; Sandmann, 1994; Sandmann, 2001; Sandmann, 2002; Takaichi & Mochimaru, 2007). For example, several carotenogenesis genes are still unknown, since they appear to be randomly distributed in the cyanobacterial genomes. It is possible that the elucidation of the complete genome sequences allows us to identify the genes homologous with the functionally confirmed genes.
The complete genome sequencing data for around 40 species and/or strains of the most popular cyanobacteria are now available, while identifications of carotenoids including glycoside moieties and stereochemistry of some species and strains are insufficient. In this chapter, we summarize carotenoids, carotenogenesis genes and enzymes, and carotenogenesis pathways in cyanobacteria, mainly those whose carotenoids and genome DNA sequences have been determined.
CAROTENOIDS IN CYANOBACTERIA We have summarized the carotenoid compositions of some cyanobacteria whose genome
DNA sequences are known, along with their related strains in table 1. The major carotenoids are β-carotene; its hydroxyl derivatives, zeaxanthin and nostoxanthin; its keto derivatives, echinenone and canthaxanthin; and the carotenoid glycosides, myxol 2'-glycosides and oscillol 2,2'-diglycoside (see figures 1 and 2). Cyanobacteria can be classified into two groups based on their carotenoid compositions.
Figure 1. Major carotenoids, carotenogenesis enzymes and pathways in cyanobacteria mentioned in this review. Some carotenogenesis enzymes and genes are colored for distinction through figures and tables.
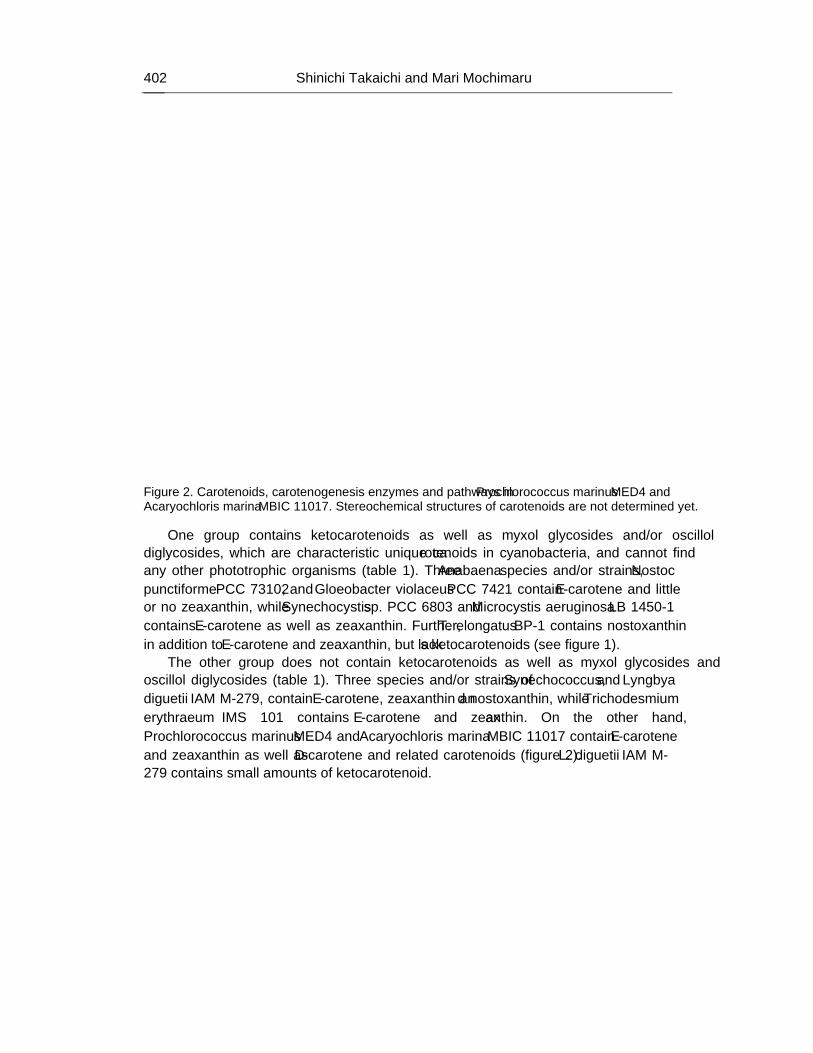
Shinichi Takaichi and Mari Mochimaru 402
Figure 2. Carotenoids, carotenogenesis enzymes and pathways in Prochlorococcus marinus MED4 and Acaryochloris marina MBIC 11017. Stereochemical structures of carotenoids are not determined yet.
One group contains ketocarotenoids as well as myxol glycosides and/or oscillol diglycosides, which are characteristic unique carotenoids in cyanobacteria, and cannot find any other phototrophic organisms (table 1). Three Anabaena species and/or strains, Nostoc punctiforme PCC 73102, and Gloeobacter violaceus PCC 7421 contain β-carotene and little or no zeaxanthin, while Synechocystis sp. PCC 6803 and Microcystis aeruginosa LB 1450-1 contains β-carotene as well as zeaxanthin. Further, T. elongatus BP-1 contains nostoxanthin in addition to β-carotene and zeaxanthin, but lacks ketocarotenoids (see figure 1).
The other group does not contain ketocarotenoids as well as myxol glycosides and oscillol diglycosides (table 1). Three species and/or strains of Synechococcus, and Lyngbya diguetii IAM M-279, contain β-carotene, zeaxanthin and nostoxanthin, while Trichodesmium erythraeum IMS 101 contains β-carotene and zeaxanthin. On the other hand, Prochlorococcus marinus MED4 and Acaryochloris marina MBIC 11017 contain β-carotene and zeaxanthin as well as α-carotene and related carotenoids (figure 2). L. diguetii IAM M-279 contains small amounts of ketocarotenoid.
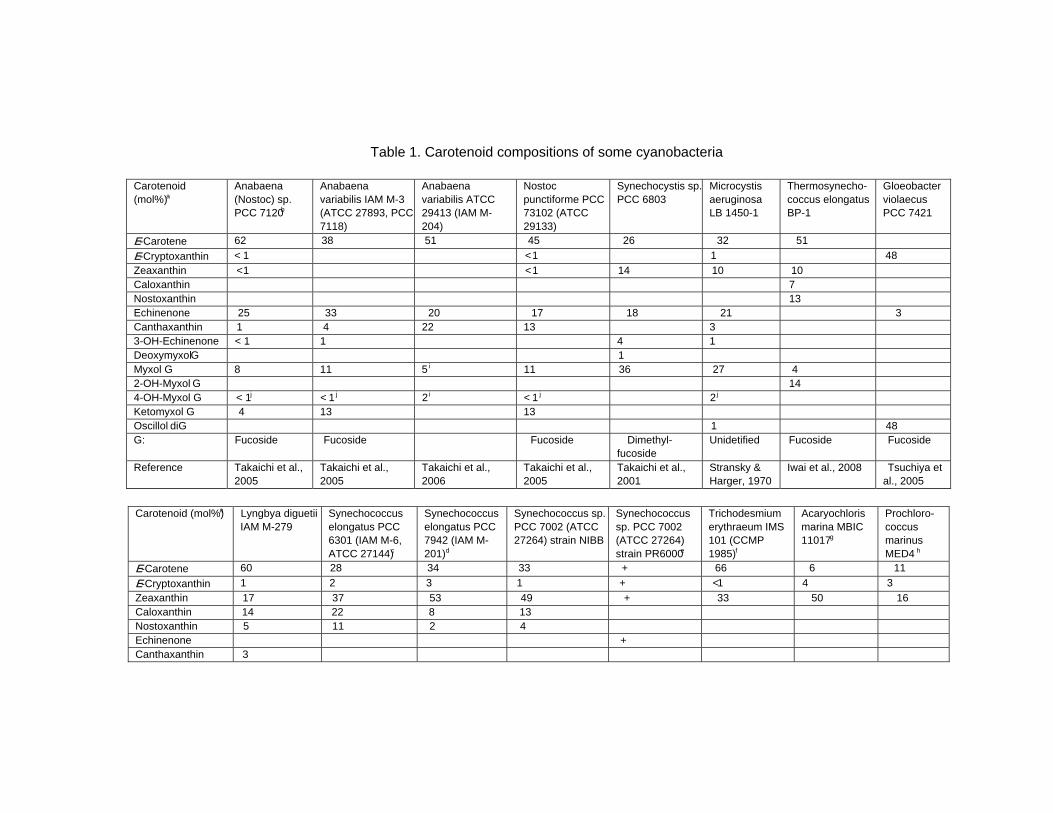
Table 1. Carotenoid compositions of some cyanobacteria
Carotenoid (mol%)a
Anabaena (Nostoc) sp. PCC 7120 b
Anabaena variabilis IAM M-3 (ATCC 27893, PCC 7118)
Anabaena variabilis ATCC 29413 (IAM M-204)
Nostoc punctiforme PCC 73102 (ATCC 29133)
Synechocystis sp. PCC 6803
Microcystis aeruginosa LB 1450-1
Thermosynecho-coccus elongatus BP-1
Gloeobacter violaecus PCC 7421
β-Carotene 62 38 51 45 26 32 51 β-Cryptoxanthin < 1 < 1 1 48 Zeaxanthin < 1 < 1 14 10 10 Caloxanthin 7 Nostoxanthin 13 Echinenone 25 33 20 17 18 21 3 Canthaxanthin 1 4 22 13 3 3’-OH-Echinenone < 1 1 4 1 Deoxymyxol G 1 Myxol G 8 11 5 i 11 36 27 4 2-OH-Myxol G 14 4-OH-Myxol G < 1 j < 1 j 2 i < 1 j 2 j Ketomyxol G 4 13 13 Oscillol diG 1 48 G: Fucoside Fucoside Fucoside Dimethyl-
fucoside Unidetified Fucoside Fucoside
Reference Takaichi et al., 2005
Takaichi et al., 2005
Takaichi et al., 2006
Takaichi et al., 2005
Takaichi et al., 2001
Stransky & Harger, 1970
Iwai et al., 2008 Tsuchiya et al., 2005
Carotenoid (mol%)a Lyngbya diguetii
IAM M-279 Synechococcus elongatus PCC 6301 (IAM M-6, ATCC 27144) c
Synechococcus elongatus PCC 7942 (IAM M-201) d
Synechococcus sp. PCC 7002 (ATCC 27264) strain NIBB
Synechococcus sp. PCC 7002 (ATCC 27264) strain PR6000 e
Trichodesmium erythraeum IMS 101 (CCMP 1985) f
Acaryochloris marina MBIC 11017 g
Prochloro-coccus marinus MED4 h
β-Carotene 60 28 34 33 + 66 6 11 β-Cryptoxanthin 1 2 3 1 + < 1 4 3 Zeaxanthin 17 37 53 49 + 33 50 16 Caloxanthin 14 22 8 13 Nostoxanthin 5 11 2 4 Echinenone + Canthaxanthin 3
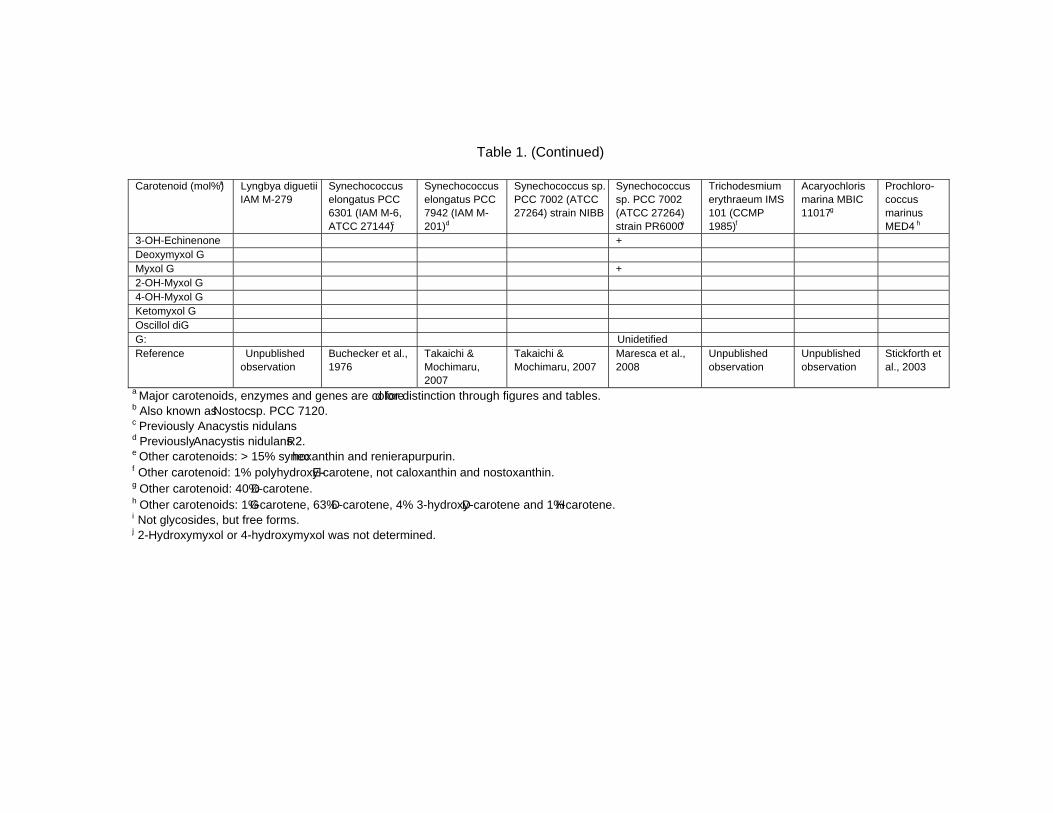
Table 1. (Continued)
Carotenoid (mol%)a Lyngbya diguetii IAM M-279
Synechococcus elongatus PCC 6301 (IAM M-6, ATCC 27144) c
Synechococcus elongatus PCC 7942 (IAM M-201) d
Synechococcus sp. PCC 7002 (ATCC 27264) strain NIBB
Synechococcus sp. PCC 7002 (ATCC 27264) strain PR6000 e
Trichodesmium erythraeum IMS 101 (CCMP 1985) f
Acaryochloris marina MBIC 11017 g
Prochloro-coccus marinus MED4 h
3’-OH-Echinenone + Deoxymyxol G Myxol G + 2-OH-Myxol G 4-OH-Myxol G Ketomyxol G Oscillol diG G: Unidetified Reference Unpublished
observation Buchecker et al., 1976
Takaichi & Mochimaru, 2007
Takaichi & Mochimaru, 2007
Maresca et al., 2008
Unpublished observation
Unpublished observation
Stickforth et al., 2003
a Major carotenoids, enzymes and genes are colored for distinction through figures and tables. b Also known as Nostoc sp. PCC 7120. c Previously Anacystis nidulans. d Previously Anacystis nidulans R2. e Other carotenoids: > 15% synechoxanthin and renierapurpurin. f Other carotenoid: 1% polyhydroxyl-β-carotene, not caloxanthin and nostoxanthin. g Other carotenoid: 40% α-carotene. h Other carotenoids: 1% δ-carotene, 63% α-carotene, 4% 3-hydroxy-α-carotene and 1% ε-carotene. i Not glycosides, but free forms. j 2-Hydroxymyxol or 4-hydroxymyxol was not determined.
Carotenoids, Their Diversity and Carotenogenesis in Cyanobacteria 405
This variation in carotenoid composition might be due to the presence or absence of specific carotenogenesis pathways and genes, as well as to the different characteristics of the specific enzyme(s), which will be described below (see figures 1 and 2). However, it is well known that the carotenoid compositions depend on the growth conditions, such as the growth stage, light intensity, nitrogen source, and concentration of nitrogen in the cultures, as well as on the strain type within a given species (Olaizola & Duerr, 1990; Hirschberg & Chamovitz, 1994; Graham & Bryant, 2008).
MYXOL GLYCOSIDES IN CYANOBACTERIA Myxoxanthophyll is a common name of monocyclic-carotenoid glycoside, widely
distributed in cyanobacteria; some species also contain oscillaxanthin, acyclic-carotenoid diglycosides (figure 3) (Goodwin, 1980; Hirschberg & Chamovitz, 1994; Takaichi & Mochimaru, 2007). Myxoxanthophyll was first isolated in 1936 from Oscillatoria rubescens, and its structure was proposed to be a polyhydroxyl-carotenoid. The structures of myxoxanthophyll and oscillaxanthin from Arthrospira sp. were ultimately determined as myxol 2'-rhamnoside and oscillol 2,2'-di(L-rhamnoside) (Hertzberg & Liaaen-Jensen, 1969a,b), respectively, although the glycoside moiety of rhamnoside was reidentified as chinovoside (Foss et al., 1986).
The carotenoid moieties of these carotenoids are myxol, 4-ketomyxol, 4-hydroxymyxol, newly found 2-hydroxymyxol (Iwai et al., 2008) and oscillol (figure 3). The glycoside moieties are mostly α-L-methylpentoses; rhamnose, chinovose and fucose (figure 4). These carotenoids have a very unique glycoside linkage: a hydroxyl group at C-2' of the ψ end group of the carotenoids is bonded to glycoside in a (2'S)-configuration. This structure is only found in these carotenoids; its presence is limited to cyanobacteria, with no reports of it in any other bacteria, including in the phototrophic bacteria or eukaryotic algae (Goodwin, 1980; Niggli & Pfander, 1999; Britton et al., 2004). Some carotenoid glycosides and carotenoid glycosyl esters are found in bacteria, mostly glucoside (Niggli & Pfander, 1999; Dembitsky, 2005).
The determination of the sugar moieties of these carotenoids has been made only for a few species of cyanobacteria. To our knowledge, the following structures are the only ones reported to date, even with insufficient determination of the sugar moieties (figure 4): myxol 2'-O-methyl-methylpentoside, 4-ketomyxol 2'-O-methyl-methylpentoside and oscillol 2,2'-di(O-methyl-methylpentoside) from Oscillatoria limosa (Francis et al., 1970), myxol 2'-α-L-chinovoside and oscillol 2,2'-di(α-L-chinovoside) from Oscillatoria agardhii, and myxol 2'-(3-O-methyl-α-L-fucoside) and oscillol 2,2'-di(3-O-methyl-α-L-fucoside) from Oscillatoria bornetii (Foss et al., 1986), and myxol 2'-α-L-chinovoside and myxol 2'-α-L-fucoside from Oscillatoria limnotica, and oscillol 2,2'-di(α-L-chinovoside) and oscillol 2,2'-di(α-L-fucoside) from Spirulina platensis (Aakermann et al., 1992). The stereochemical structure of the hydroxyl groups is determined to be (3R,2'S)-myxol 2'-rhamnoside from Phormidium luridum, and (3S,2'S)-4-ketomyxol 2'-methylpentoside and (3R,2'S)-myxol 2'-O-methyl-methylpentoside from Oscillatoria limosa (Rønneberg et al., 1985). Recently, we have identified (3R,2'S)-myxol 2'-(2,4-di-O-methyl-α-L-fucoside) from Synechocystis sp. PCC 6803 (Takaichi et al., 2001), (3R,2'S)-myxol 2'-α-L-fucoside and (3S,2'S)-4-ketomyxol 2'-α-

Shinichi Takaichi and Mari Mochimaru 406
L-fucoside from Anabaena sp. PCC 7120 (also known as Nostoc sp. PCC 7120), Anabaena variabilis IAM M-3 and N. punctiforme PCC 73102 (Takaichi et al., 2005), (2S,2'S)-oscillol 2,2'-di(α-L-fucoside) from G. violaceus PCC 7421 (Tsuchiya et al., 2005), and (3R,2'S)-myxol 2'-α-L-fucoside and (2R,3R,2'S)-2-hydroxymyxol 2'-α-L-fucoside from T. elongatus BP-1 (Iwai et al., 2008).
Figure 3. Structures of myxol glycosides and oscillol diglycosides in cyanobacteria. Structures of glycoside moieties (G) are shown in figure 4.
Carotenoids, Their Diversity and Carotenogenesis in Cyanobacteria 407
Figure 4. Structure of glycoside moieties in myxol glycosides and oscillol diglycosides. Structures of carotenoid moieties are shown in figure 3.
The polar carotenoids from cyanobacteria have been provisionally named myxoxanthophyll and oscillaxanthin, and their sugar moieties are thought to be myxol 2'-rhamnoside and oscillol 2,2'-dirhamnoside (Goodwin, 1980, Hirschberg & Chamovitz, 1994, Niggli & Pfander, 1999), even though the various sugar moieties described above have been found.
We have proposed the following nomenclature for the trivial names of myxoxanthophyll, oscillaxanthin and related compounds (Takaichi et al., 2001): the carotenoid moieties (aglycone) of myxoxanthophyll and oscillaxanthin are myxol and oscillol, respectively; that of aphanizophyll is 4-hydroxymyxol (Hertzberg & Liaaen-Jensen, 1971), although 4-ketomyxol (Francis et al., 1970) and 2-hydroxymyxol (Iwai et al, 2008) are also found (figure 3). When the sugar moieties have not been determined, they should be named myxol glycoside, myxol methylpentoside, and oscillol di-methylpentosides. If the sugar moieties have been identified, the names should be, for example, myxol 2'-chinovoside, myxol 2'-α-L-
Shinichi Takaichi and Mari Mochimaru 408
rhamnoside, (3S,2'S)-4-ketomyxol 2'-α-L-fucoside, (2R,3R,2'S)-2-hydroxymyxol 2'-α-L-fucoside, and (3R,2'S)-myxol 2'-(2,4-di-O-methyl-α-L-fucoside) (figures 3, 4). Since the names such as myxoxanthophyll, aphanizophyll and oscillaxanthin cannot specify the sugar moieties, the use of such indefinite terms should be avoided.
SYNTHESIS OF PHYTOENE We have summarized the functionally confirmed genes and enzymes for carotenogenesis
in cyanobacteria in table 2, at present. Further in table 3, we have summarized the homologous genes, whose query sequences are chosen only from these functional genes listed in table 2.
Isopentenyl pyrophosphate (IPP), a C5-compound, is the source of isoprenoids, terpens, quinones, sterols, phytol of (bacterio)chlorophylls, and carotenoids. There are two known independent pathways of IPP synthesis: the classical mevalonate (MVA) pathway and the alternative, non-mevalonate, 1-deoxy-D-xylulose-5-phosphate (DOXP) pathway (Lichtenthaler, 1999; Rohmer, 1999; Eisenreich et al., 2004). Only the DOXP pathway has been observed in cyanobacteria. Further, IPP is synthesized by the DOXP pathway in the plastids of higher plants, where carotenoids are synthesized, whereas the MVA pathway is used in the cytoplasm. Among phototrophic bacteria, the MVA pathway is found in green filamentous bacteria, while the DOPX pathway is found in purple bacteria, green sulfur bacteria and heliobacteria (Lichtenthaler, 1999; Rohmer, 1999; Cunningham, 2002; Maresca et al., 2008). These two pathways may frequently be transferred laterally among bacteria (Boucher & Doolittle, 2000).
Most carotenoids are tetraterpenoids consisting of eight IPP units. Farnesyl pyrophosphate (C15) is synthesized from three IPPs. Then, one IPP is added to farnesyl pyrophosphate by CrtE (geranylgeranyl pyrophosphate synthase) to yield geranylgeranyl pyrophosphate (C20) (figure 5). In a head-to-head condensation of the two C20-compounds, the first carotene of phytoene (C40) is formed by CrtB (phytoene synthase) using ATP (Armstrong, 1997; Sandmann, 1994). This pathway has been confirmed by cloning genes from two species of Rhodobacter (purple bacteria) and two species of Pantoea (previously Erwinia) (Armstrong, 1997; Sandmann, 1994). The functions of CrtE of T. elongatus BP-1 (Ohto et al., 1999), and CrtB of Synechocystis sp. PCC 6803 (Martínez-Férez et al., 1994), G. violaceus PCC 7421 (Steiger et al., 2005) and S. elongatus PCC 7942 (Chamovitz et al., 1992) have also been confirmed among cyanobacteria (table 2). The crtE and crtB genes have high sequence similarity from bacteria to plants, respectively.
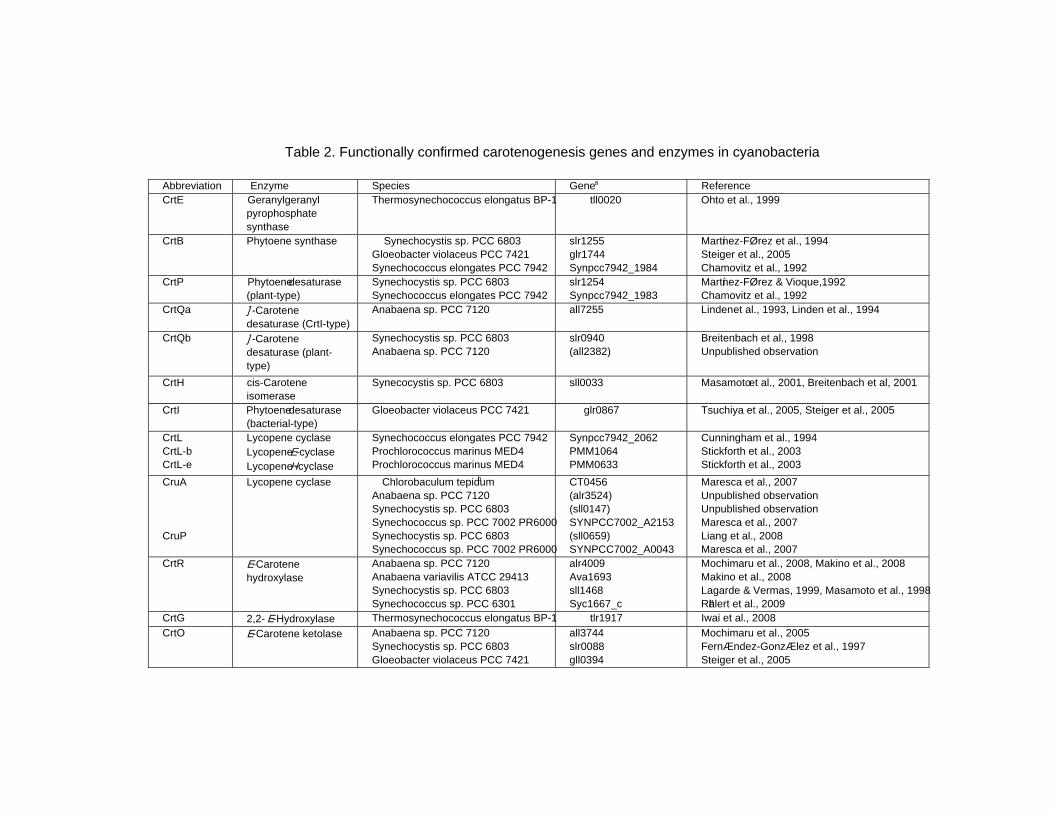
Table 2. Functionally confirmed carotenogenesis genes and enzymes in cyanobacteria
Abbreviation Enzyme Species Gene a Reference CrtE Geranylgeranyl
pyrophosphate synthase
Thermosynechococcus elongatus BP-1 tll0020 Ohto et al., 1999
CrtB Phytoene synthase Synechocystis sp. PCC 6803 Gloeobacter violaceus PCC 7421 Synechococcus elongates PCC 7942
slr1255 glr1744 Synpcc7942_1984
Martínez-Férez et al., 1994 Steiger et al., 2005 Chamovitz et al., 1992
CrtP Phytoene desaturase (plant-type)
Synechocystis sp. PCC 6803 Synechococcus elongates PCC 7942
slr1254 Synpcc7942_1983
Martínez-Férez & Vioque,1992 Chamovitz et al., 1992
CrtQa ζ-Carotene desaturase (CrtI-type)
Anabaena sp. PCC 7120 all7255 Linden et al., 1993, Linden et al., 1994
CrtQb ζ-Carotene desaturase (plant-type)
Synechocystis sp. PCC 6803 Anabaena sp. PCC 7120
slr0940 (all2382)
Breitenbach et al., 1998 Unpublished observation
CrtH cis-Carotene isomerase
Synecocystis sp. PCC 6803 sll0033 Masamoto et al., 2001, Breitenbach et al, 2001
CrtI Phytoene desaturase (bacterial-type)
Gloeobacter violaceus PCC 7421 glr0867 Tsuchiya et al., 2005, Steiger et al., 2005
CrtL CrtL-b CrtL-e
Lycopene cyclase Lycopene β-cyclase Lycopene ε-cyclase
Synechococcus elongates PCC 7942 Prochlorococcus marinus MED4 Prochlorococcus marinus MED4
Synpcc7942_2062 PMM1064 PMM0633
Cunningham et al., 1994 Stickforth et al., 2003 Stickforth et al., 2003
CruA CruP
Lycopene cyclase Chlorobaculum tepidum b Anabaena sp. PCC 7120 Synechocystis sp. PCC 6803 Synechococcus sp. PCC 7002 PR6000 Synechocystis sp. PCC 6803 Synechococcus sp. PCC 7002 PR6000
CT0456 (alr3524) (sll0147) SYNPCC7002_A2153 (sll0659) SYNPCC7002_A0043
Maresca et al., 2007 Unpublished observation Unpublished observation Maresca et al., 2007 Liang et al., 2008 Maresca et al., 2007
CrtR β-Carotene hydroxylase
Anabaena sp. PCC 7120 Anabaena variavilis ATCC 29413 Synechocystis sp. PCC 6803 Synechococcus sp. PCC 6301
alr4009 Ava1693 sll1468 Syc1667_c
Mochimaru et al., 2008, Makino et al., 2008 Makino et al., 2008 Lagarde & Vermas, 1999, Masamoto et al., 1998 Rählert et al., 2009
CrtG 2,2’-β-Hydroxylase Thermosynechococcus elongatus BP-1 tlr1917 Iwai et al., 2008 CrtO β-Carotene ketolase Anabaena sp. PCC 7120
Synechocystis sp. PCC 6803 Gloeobacter violaceus PCC 7421
all3744 slr0088 gll0394
Mochimaru et al., 2005 Fernández-González et al., 1997 Steiger et al., 2005
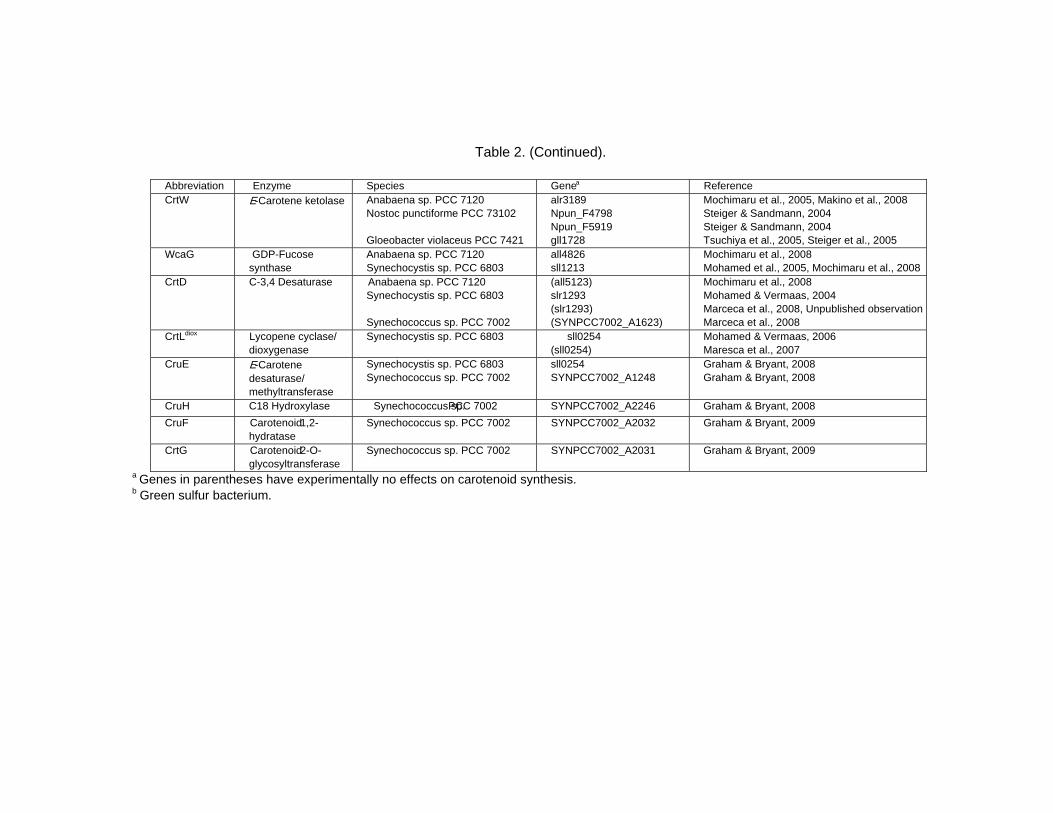
Table 2. (Continued).
Abbreviation Enzyme Species Gene a Reference CrtW β-Carotene ketolase Anabaena sp. PCC 7120
Nostoc punctiforme PCC 73102 Gloeobacter violaceus PCC 7421
alr3189 Npun_F4798 Npun_F5919 gll1728
Mochimaru et al., 2005, Makino et al., 2008 Steiger & Sandmann, 2004 Steiger & Sandmann, 2004 Tsuchiya et al., 2005, Steiger et al., 2005
WcaG GDP-Fucose synthase
Anabaena sp. PCC 7120 Synechocystis sp. PCC 6803
all4826 sll1213
Mochimaru et al., 2008 Mohamed et al., 2005, Mochimaru et al., 2008
CrtD C-3’,4’ Desaturase Anabaena sp. PCC 7120 Synechocystis sp. PCC 6803 Synechococcus sp. PCC 7002
(all5123) slr1293 (slr1293) (SYNPCC7002_A1623)
Mochimaru et al., 2008 Mohamed & Vermaas, 2004 Marceca et al., 2008, Unpublished observation Marceca et al., 2008
CrtLdiox Lycopene cyclase/ dioxygenase
Synechocystis sp. PCC 6803 sll0254 (sll0254)
Mohamed & Vermaas, 2006 Maresca et al., 2007
CruE
β-Carotene desaturase/ methyltransferase
Synechocystis sp. PCC 6803 Synechococcus sp. PCC 7002
sll0254 SYNPCC7002_A1248
Graham & Bryant, 2008 Graham & Bryant, 2008
CruH C18 Hydroxylase Synechococcus sp. PCC 7002 SYNPCC7002_A2246 Graham & Bryant, 2008 CruF Carotenoid 1,2-
hydratase Synechococcus sp. PCC 7002 SYNPCC7002_A2032 Graham & Bryant, 2009
CrtG Carotenoid 2-O-glycosyltransferase
Synechococcus sp. PCC 7002 SYNPCC7002_A2031 Graham & Bryant, 2009
a Genes in parentheses have experimentally no effects on carotenoid synthesis. b Green sulfur bacterium.
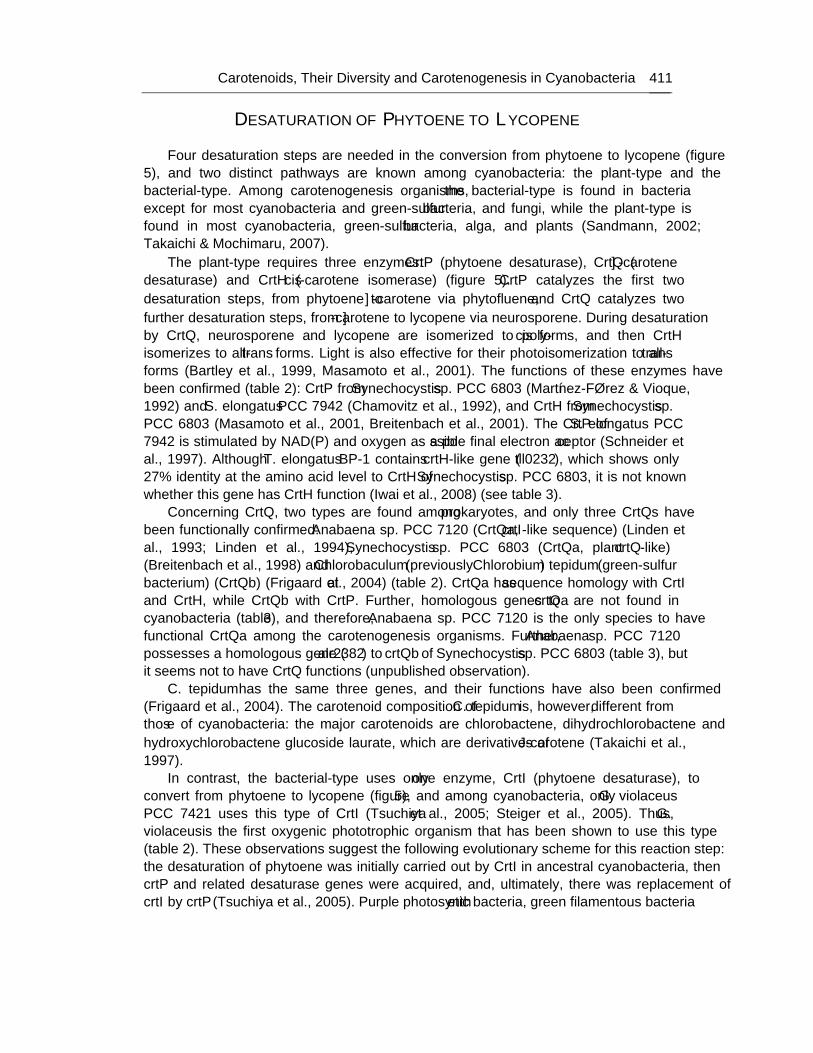
Carotenoids, Their Diversity and Carotenogenesis in Cyanobacteria 411
DESATURATION OF PHYTOENE TO LYCOPENE Four desaturation steps are needed in the conversion from phytoene to lycopene (figure
5), and two distinct pathways are known among cyanobacteria: the plant-type and the bacterial-type. Among carotenogenesis organisms, the bacterial-type is found in bacteria except for most cyanobacteria and green-sulfur bacteria, and fungi, while the plant-type is found in most cyanobacteria, green-sulfur bacteria, alga, and plants (Sandmann, 2002; Takaichi & Mochimaru, 2007).
The plant-type requires three enzymes: CrtP (phytoene desaturase), CrtQ (ζ-carotene desaturase) and CrtH (cis-carotene isomerase) (figure 5). CrtP catalyzes the first two desaturation steps, from phytoene to ζ-carotene via phytofluene, and CrtQ catalyzes two further desaturation steps, from ζ-carotene to lycopene via neurosporene. During desaturation by CrtQ, neurosporene and lycopene are isomerized to poly-cis forms, and then CrtH isomerizes to all-trans forms. Light is also effective for their photoisomerization to all-trans forms (Bartley et al., 1999, Masamoto et al., 2001). The functions of these enzymes have been confirmed (table 2): CrtP from Synechocystis sp. PCC 6803 (Martínez-Férez & Vioque, 1992) and S. elongatus PCC 7942 (Chamovitz et al., 1992), and CrtH from Synechocystis sp. PCC 6803 (Masamoto et al., 2001, Breitenbach et al., 2001). The CrtP of S. elongatus PCC 7942 is stimulated by NAD(P) and oxygen as a possible final electron acceptor (Schneider et al., 1997). Although T. elongatus BP-1 contains crtH-like gene (tll0232), which shows only 27% identity at the amino acid level to CrtH of Synechocystis sp. PCC 6803, it is not known whether this gene has CrtH function (Iwai et al., 2008) (see table 3).
Concerning CrtQ, two types are found among prokaryotes, and only three CrtQs have been functionally confirmed: Anabaena sp. PCC 7120 (CrtQa, crtI-like sequence) (Linden et al., 1993; Linden et al., 1994), Synechocystis sp. PCC 6803 (CrtQa, plant crtQ-like) (Breitenbach et al., 1998) and Chlorobaculum (previously Chlorobium) tepidum (green-sulfur bacterium) (CrtQb) (Frigaard et al., 2004) (table 2). CrtQa has sequence homology with CrtI and CrtH, while CrtQb with CrtP. Further, homologous genes to crtQa are not found in cyanobacteria (table 3), and therefore, Anabaena sp. PCC 7120 is the only species to have functional CrtQa among the carotenogenesis organisms. Further, Anabaena sp. PCC 7120 possesses a homologous gene (alr2382) to crtQb of Synechocystis sp. PCC 6803 (table 3), but it seems not to have CrtQ functions (unpublished observation).
C. tepidum has the same three genes, and their functions have also been confirmed (Frigaard et al., 2004). The carotenoid composition of C. tepidum is, however, different from those of cyanobacteria: the major carotenoids are chlorobactene, dihydrochlorobactene and hydroxychlorobactene glucoside laurate, which are derivatives of γ-carotene (Takaichi et al., 1997).
In contrast, the bacterial-type uses only one enzyme, CrtI (phytoene desaturase), to convert from phytoene to lycopene (figure 5), and among cyanobacteria, only G. violaceus PCC 7421 uses this type of CrtI (Tsuchiya et al., 2005; Steiger et al., 2005). Thus, G. violaceus is the first oxygenic phototrophic organism that has been shown to use this type (table 2). These observations suggest the following evolutionary scheme for this reaction step: the desaturation of phytoene was initially carried out by CrtI in ancestral cyanobacteria, then crtP and related desaturase genes were acquired, and, ultimately, there was replacement of crtI by crtP (Tsuchiya et al., 2005). Purple photosynthetic bacteria, green filamentous bacteria

Shinichi Takaichi and Mari Mochimaru 412
and heliobacteria contain CrtI (Takaichi, 1999; Takaichi, 2009), as do the other carotenoid-producing bacteria (except for cyanobacteria and green-sulfur bacteria) and fungi.
Lyngbya sp. PCC 8106 has homologous genes of both the bacterial-type (crtI), and the plant-type (all of crtP, crtQ and crtH) (table 3). It is interesting that which pathway or both pathways is used for lycopene synthesis.
Figure 5. Synthesis of carotenes. Cyanobacteria require three enzymes, CrtP, CrtQ and CrtH, from phytoene to lycopene, while exceptionally Gloeobacter violaceus PCC 7421 uses only CrtI. Two families of lycopene cyclases are known, CrtL and CruA/CruP. IPP, isopentenyl pyrophosphate; FPP, farnesyl pyrophosphate; GGPP, geranylgeranyl pyrophosphate.
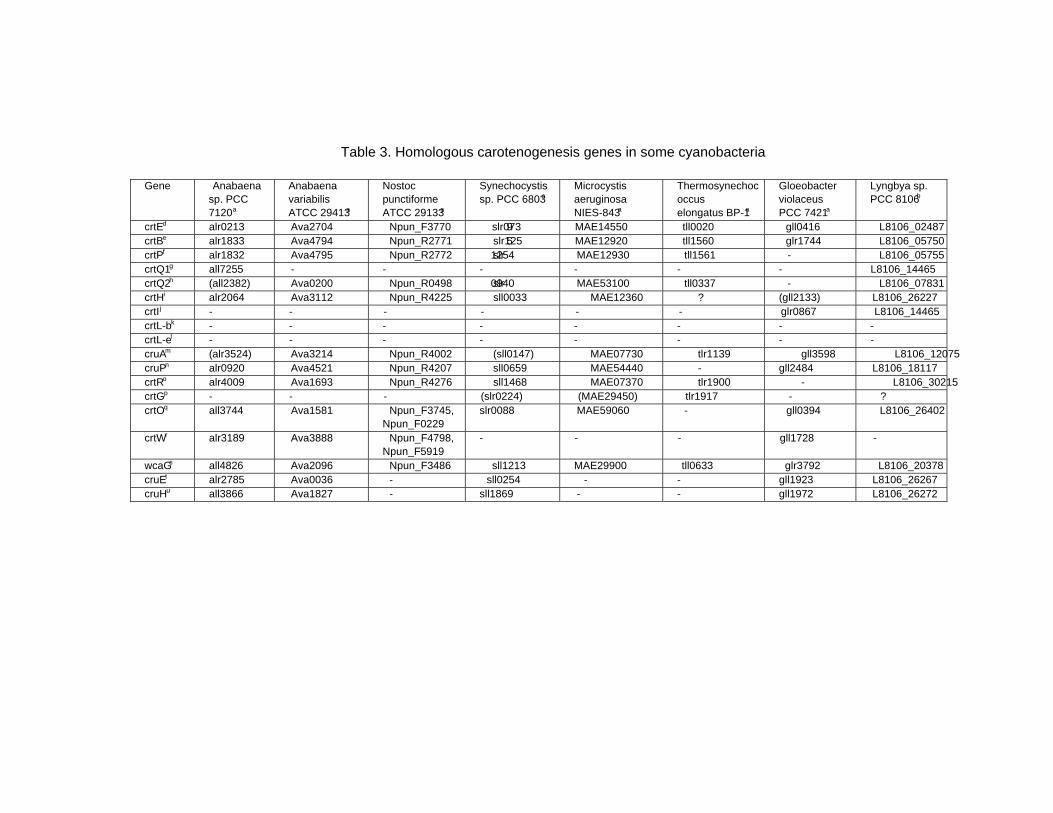
Table 3. Homologous carotenogenesis genes in some cyanobacteria
Gene Anabaena sp. PCC 7120 a
Anabaena variabilis ATCC 29413 a
Nostoc punctiforme ATCC 29133 a
Synechocystis sp. PCC 6803 a
Microcystis aeruginosa NIES-843 a
Thermosynechococcus elongatus BP-1 a
Gloeobacter violaceus PCC 7421 a
Lyngbya sp. PCC 8106 b
crtEd alr0213 Ava2704 Npun_F3770 slr0739 MAE14550 tll0020 gll0416 L8106_02487 crtBe alr1833 Ava4794 Npun_R2771 slr1255 MAE12920 tll1560 glr1744 L8106_05750 crtPf alr1832 Ava4795 Npun_R2772 slr1254 MAE12930 tll1561 - L8106_05755 crtQ1g all7255 - - - - - - L8106_14465 crtQ2h (all2382) Ava0200 Npun_R0498 slr0940 MAE53100 tll0337 - L8106_07831 crtHi alr2064 Ava3112 Npun_R4225 sll0033 MAE12360 ? (gll2133) L8106_26227 crtIj - - - - - - glr0867 L8106_14465 crtL-bk - - - - - - - - crtL-el - - - - - - - - cruAm (alr3524) Ava3214 Npun_R4002 (sll0147) MAE07730 tlr1139 gll3598 L8106_12075 cruPn alr0920 Ava4521 Npun_R4207 sll0659 MAE54440 - gll2484 L8106_18117 crtRo alr4009 Ava1693 Npun_R4276 sll1468 MAE07370 tlr1900 - L8106_30215 crtGp - - - (slr0224) (MAE29450) tlr1917 - ? crtOq all3744 Ava1581 Npun_F3745,
Npun_F0229 slr0088 MAE59060 - gll0394 L8106_26402
crtWr alr3189 Ava3888 Npun_F4798, Npun_F5919
- - - gll1728 -
wcaGs all4826 Ava2096 Npun_F3486 sll1213 MAE29900 tll0633 glr3792 L8106_20378 cruEt alr2785 Ava0036 - sll0254 - - gll1923 L8106_26267 cruHu all3866 Ava1827 - sll1869 - - gll1972 L8106_26272
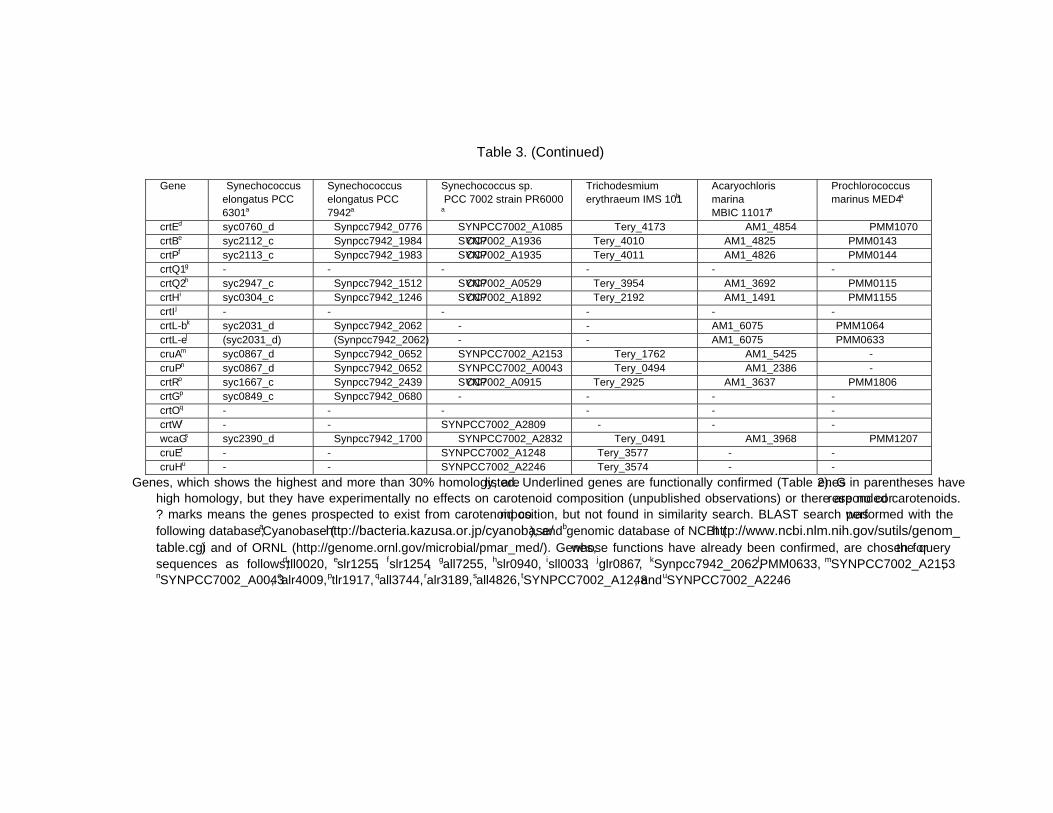
Table 3. (Continued) Gene Synechococcus
elongatus PCC 6301 a
Synechococcus elongatus PCC 7942 a
Synechococcus sp. PCC 7002 strain PR6000
a
Trichodesmium erythraeum IMS 101 b
Acaryochloris marina MBIC 11017 a
Prochlorococcus marinus MED4 a
crtEd syc0760_d Synpcc7942_0776 SYNPCC7002_A1085 Tery_4173 AM1_4854 PMM1070 crtBe syc2112_c Synpcc7942_1984 SYNPCC7002_A1936 Tery_4010 AM1_4825 PMM0143 crtPf syc2113_c Synpcc7942_1983 SYNPCC7002_A1935 Tery_4011 AM1_4826 PMM0144 crtQ1g - - - - - - crtQ2h syc2947_c Synpcc7942_1512 SYNPCC7002_A0529 Tery_3954 AM1_3692 PMM0115 crtHi syc0304_c Synpcc7942_1246 SYNPCC7002_A1892 Tery_2192 AM1_1491 PMM1155 crtIj - - - - - - crtL-bk syc2031_d Synpcc7942_2062 - - AM1_6075 PMM1064 crtL-el (syc2031_d) (Synpcc7942_2062) - - AM1_6075 PMM0633 cruAm syc0867_d Synpcc7942_0652 SYNPCC7002_A2153 Tery_1762 AM1_5425 - cruPn syc0867_d Synpcc7942_0652 SYNPCC7002_A0043 Tery_0494 AM1_2386 - crtRo syc1667_c Synpcc7942_2439 SYNPCC7002_A0915 Tery_2925 AM1_3637 PMM1806 crtGp syc0849_c Synpcc7942_0680 - - - - crtOq - - - - - - crtWr - - SYNPCC7002_A2809 - - - wcaGs syc2390_d Synpcc7942_1700 SYNPCC7002_A2832 Tery_0491 AM1_3968 PMM1207 cruEt - - SYNPCC7002_A1248 Tery_3577 - - cruHu - - SYNPCC7002_A2246 Tery_3574 - -
Genes, which shows the highest and more than 30% homology, are listed. Underlined genes are functionally confirmed (Table 2). Genes in parentheses have high homology, but they have experimentally no effects on carotenoid composition (unpublished observations) or there are no corresponded carotenoids. ‘?’ marks means the genes prospected to exist from carotenoid composition, but not found in similarity search. BLAST search was performed with the following database; aCyanobase (http://bacteria.kazusa.or.jp/cyanobase/), and bgenomic database of NCBI (http://www.ncbi.nlm.nih.gov/sutils/genom_table.cgi) and of ORNL (http://genome.ornl.gov/microbial/pmar_med/). Genes, whose functions have already been confirmed, are chosen for the query sequences as follows; dtll0020, eslr1255, fslr1254, gall7255, hslr0940, isll0033, jglr0867, kSynpcc7942_2062, lPMM0633, mSYNPCC7002_A2153, nSYNPCC7002_A0043, oalr4009, ptlr1917, qall3744, ralr3189, sall4826, tSYNPCC7002_A1248, and uSYNPCC7002_A2246.
Carotenoids, Their Diversity and Carotenogenesis in Cyanobacteria 415
LYCOPENE CYCLIZATION BY LYCOPENE CYCLASES Lycopene is cyclized to β-carotene via γ-carotene (figures 1 and 5) or to α-carotene via γ-
carotene or δ-carotene (figure 2). Three distinct families of lycopene cyclases have previously been identified in carotenogenesis organisms (Krubasik & Sandmann, 2000; Maresca et al., 2007; Takaichi & Mochimaru, 2007). One large family contains CrtY from some bacteria except for some cyanobacteria and CrtL from some cyanobacteria and plants, which includes β-cyclases, ε-cyclases and β-monocyclases. Their amino acid sequences exhibit a significant five conserved regions (Krubasik & Sandmann, 2000; Sandmann, 2002; Ramos et al., 2008), and have an NAD(P)/FAD-binding motif (Harker & Hirschberg, 1998). Note that Maresca et al. (2007) divide this family into two CrtY and CrtL families.
Some cyanobacteria also contain these enzymes (table 2). S. elongatus PCC 7942 contains a functional CrtL (Cunningham et al., 1994). P. marinus MED4 contains two lycopene cyclases (table 2), which have sequence homology to CrtL. CrtL-b exhibits lycopene β-cyclase activity, while CrtL-e is a bifunctional enzyme having both lycopene ε-cyclase and lycopene β-cyclase activities (figure 2) (Stickforth et al., 2003). The combination of these two cyclases allows the production of β-carotene, α-carotene and ε-carotene. Both enzymes might have originated from duplication of a single gene. The characteristics of this CrtL-e are somewhat different from those in plants (Cunningham & Gantt, 2001). Further, the β end groups of β-carotene and α-carotene (left half) might be hydroxylated by CrtR to zeaxanthin via β-cryptoxanthin and 3-hydroxy-α-carotene, respectively (table 1). A. marina MBIC 11017 contains only one crtL-like gene (table 3), which may similarly have a bifunctional enzyme having both lycopene β-cyclase and lycopene ε-cyclase activities. Further due to substrate specificity, CrtR may be produce only zeaxanthin from β-carotene, not 3-hydroxy-α-carotene from α-carotene (table 1, figure 2).
The second family of lycopene cyclases is heterodimer (crtYc and crtYd) or monomer (crtYc-Yd), and has been found in some bacteria, archaea and fungi (Krubasik & Sandmann, 2000; Hemmi et al., 2003).
Recently, a new family of functional lycopene cyclase, CruA (CT0456), has been found from C. tepidum (green sulfur bacterium), and the main product is γ-carotene in E. coli with a lycopene background (Maresca et al., 2005). Homologous genes, cruA and cruP, have been found in the genome of Synechococcus sp. PCC 7002, and the main products are β-carotene and γ-carotene, respectively, in E. coli with a lycopene background (Maresca et al., 2007). Further, its homologous genes are widely distributed in cyanobacteria, such as Synechocystis sp. PCC 6803 and Anabaena sp. PCC 7120 (see table 3). However, the functions of lycopene cyclase activities could not be detected in these cruA-like genes from both Synechocystis sp. PCC 6803 and Anabaena sp. PCC 7120 (unpublished observation). S. elongatus PCC 6301 and PCC 7942, and A. marina MBIC 11017 contain both crtL- and cruA-like genes (table 3). Consequently, distributions of functional lycopene cyclases (CrtL- and CruA-like) in cyanobacteria are unknown.
Since Synechocystis sp. PCC 6803 and Anabaena sp. PCC 7120 lack crtL-like genes and contain unfunctional cruA-like genes, there is a possibility to present a fourth new family of lycopene cyclase in these cyanobacteria. Further studies of distributions of functional lycopene cyclases (CrtL- and CruA-like, or other) in cyanobacteria are needed.
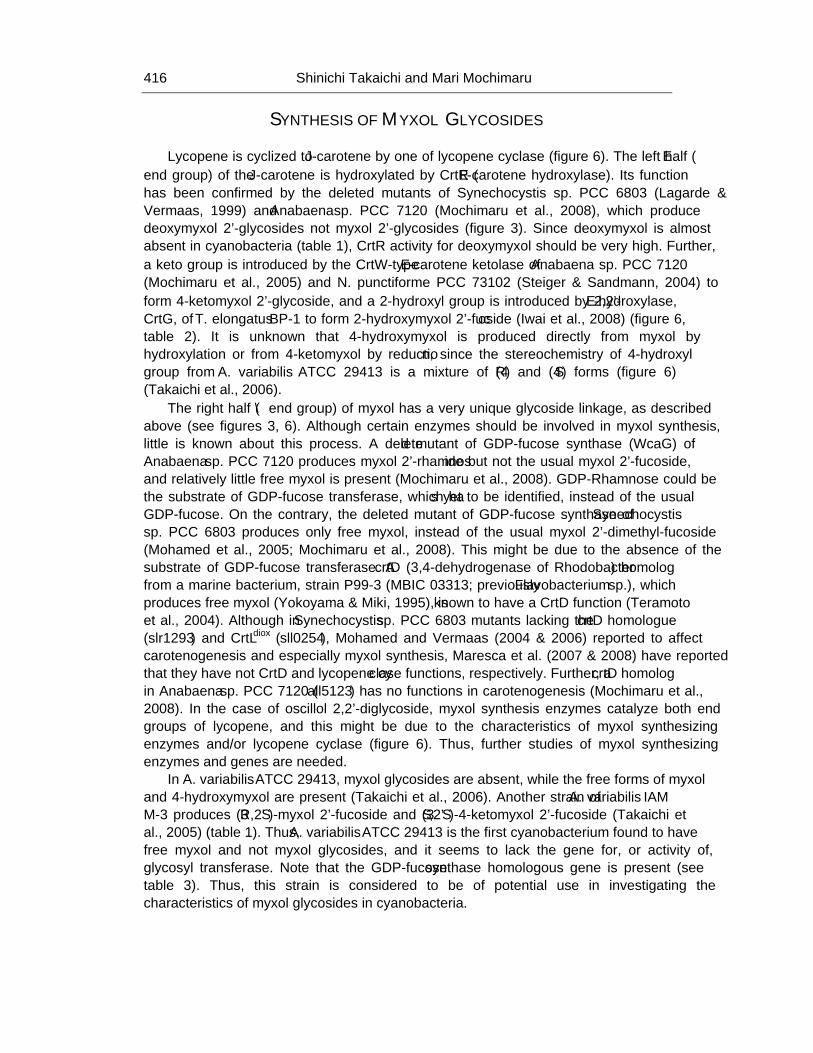
Shinichi Takaichi and Mari Mochimaru 416
SYNTHESIS OF MYXOL GLYCOSIDES Lycopene is cyclized to γ-carotene by one of lycopene cyclase (figure 6). The left half (β
end group) of the γ-carotene is hydroxylated by CrtR (β-carotene hydroxylase). Its function has been confirmed by the deleted mutants of Synechocystis sp. PCC 6803 (Lagarde & Vermaas, 1999) and Anabaena sp. PCC 7120 (Mochimaru et al., 2008), which produce deoxymyxol 2'-glycosides not myxol 2'-glycosides (figure 3). Since deoxymyxol is almost absent in cyanobacteria (table 1), CrtR activity for deoxymyxol should be very high. Further, a keto group is introduced by the CrtW-type β-carotene ketolase of Anabaena sp. PCC 7120 (Mochimaru et al., 2005) and N. punctiforme PCC 73102 (Steiger & Sandmann, 2004) to form 4-ketomyxol 2'-glycoside, and a 2-hydroxyl group is introduced by 2,2'-β-hydroxylase, CrtG, of T. elongatus BP-1 to form 2-hydroxymyxol 2'-fucoside (Iwai et al., 2008) (figure 6, table 2). It is unknown that 4-hydroxymyxol is produced directly from myxol by hydroxylation or from 4-ketomyxol by reduction, since the stereochemistry of 4-hydroxyl group from A. variabilis ATCC 29413 is a mixture of (4R) and (4S) forms (figure 6) (Takaichi et al., 2006).
The right half (ψ end group) of myxol has a very unique glycoside linkage, as described above (see figures 3, 6). Although certain enzymes should be involved in myxol synthesis, little is known about this process. A deleted mutant of GDP-fucose synthase (WcaG) of Anabaena sp. PCC 7120 produces myxol 2'-rhamnoside but not the usual myxol 2'-fucoside, and relatively little free myxol is present (Mochimaru et al., 2008). GDP-Rhamnose could be the substrate of GDP-fucose transferase, which has yet to be identified, instead of the usual GDP-fucose. On the contrary, the deleted mutant of GDP-fucose synthase of Synechocystis sp. PCC 6803 produces only free myxol, instead of the usual myxol 2'-dimethyl-fucoside (Mohamed et al., 2005; Mochimaru et al., 2008). This might be due to the absence of the substrate of GDP-fucose transferase. A crtD (3,4-dehydrogenase of Rhodobacter) homolog from a marine bacterium, strain P99-3 (MBIC 03313; previously Flavobacterium sp.), which produces free myxol (Yokoyama & Miki, 1995), is known to have a CrtD function (Teramoto et al., 2004). Although in Synechocystis sp. PCC 6803 mutants lacking the crtD homologue (slr1293) and CrtLdiox (sll0254), Mohamed and Vermaas (2004 & 2006) reported to affect carotenogenesis and especially myxol synthesis, Maresca et al. (2007 & 2008) have reported that they have not CrtD and lycopene cyclase functions, respectively. Further, a crtD homolog in Anabaena sp. PCC 7120 (all5123) has no functions in carotenogenesis (Mochimaru et al., 2008). In the case of oscillol 2,2'-diglycoside, myxol synthesis enzymes catalyze both end groups of lycopene, and this might be due to the characteristics of myxol synthesizing enzymes and/or lycopene cyclase (figure 6). Thus, further studies of myxol synthesizing enzymes and genes are needed.
In A. variabilis ATCC 29413, myxol glycosides are absent, while the free forms of myxol and 4-hydroxymyxol are present (Takaichi et al., 2006). Another strain of A. variabilis IAM M-3 produces (3R,2'S)-myxol 2'-fucoside and (3S,2'S)-4-ketomyxol 2'-fucoside (Takaichi et al., 2005) (table 1). Thus, A. variabilis ATCC 29413 is the first cyanobacterium found to have free myxol and not myxol glycosides, and it seems to lack the gene for, or activity of, glycosyl transferase. Note that the GDP-fucose synthase homologous gene is present (see table 3). Thus, this strain is considered to be of potential use in investigating the characteristics of myxol glycosides in cyanobacteria.
Carotenoids, Their Diversity and Carotenogenesis in Cyanobacteria 417
Figure 6. Synthesis of myxol glycosides and oscillol diglycosides from lycopene. G, glycoside (figure 4).
Free myxol with the same stereochemistry to myxol of cyanobacteria has been found in only two marine bacteria, strain P99-3 (MBIC 03313) (Yokoyama & Miki, 1995) and strain YM6-073 (MBIC 06409, Flavobacteriaceae) (Shindo et al., 2007). Recently, (2S)-spirilloxanthin-2-ol has been found from Thiocapsa sp. strain BH-1 (purple bacterium) (Herbert et al., 2008). Its hydroxyl group has the same stereochemistry to myxol, and the possible evolutionary significance is required further study.
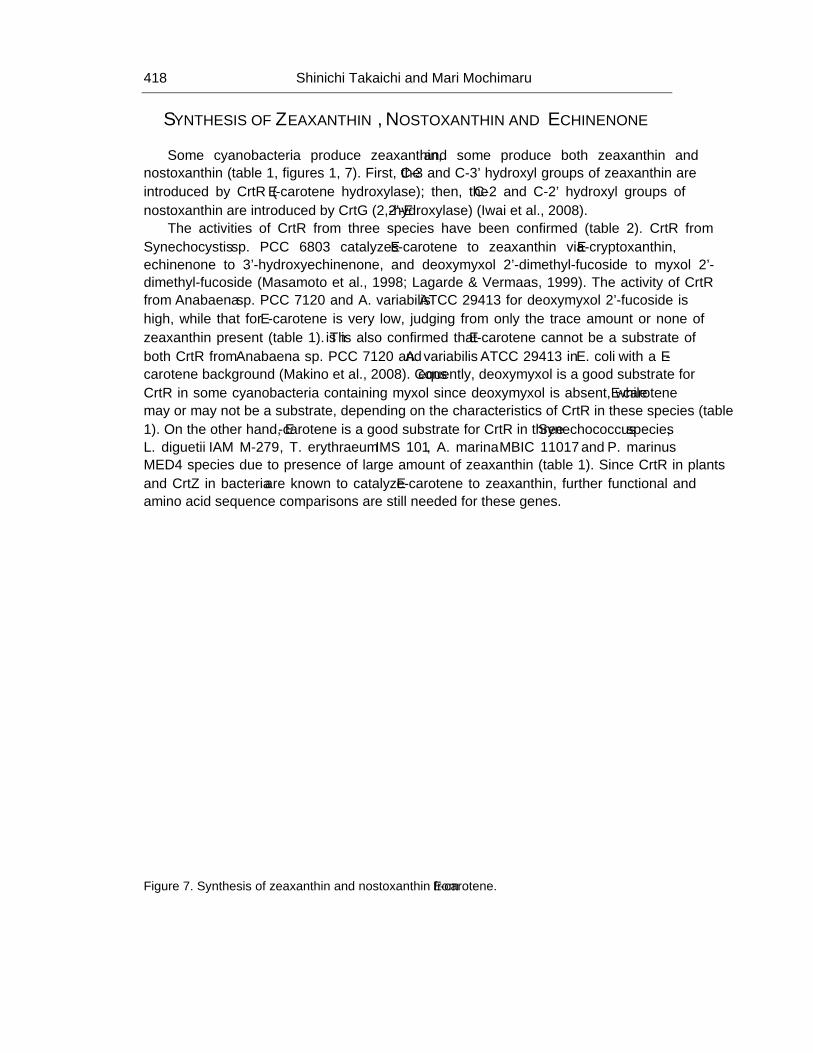
Shinichi Takaichi and Mari Mochimaru 418
SYNTHESIS OF ZEAXANTHIN, NOSTOXANTHIN AND ECHINENONE Some cyanobacteria produce zeaxanthin, and some produce both zeaxanthin and
nostoxanthin (table 1, figures 1, 7). First, the C-3 and C-3' hydroxyl groups of zeaxanthin are introduced by CrtR (β-carotene hydroxylase); then, the C-2 and C-2' hydroxyl groups of nostoxanthin are introduced by CrtG (2,2'-β-hydroxylase) (Iwai et al., 2008).
The activities of CrtR from three species have been confirmed (table 2). CrtR from Synechocystis sp. PCC 6803 catalyzes β-carotene to zeaxanthin via β-cryptoxanthin, echinenone to 3'-hydroxyechinenone, and deoxymyxol 2'-dimethyl-fucoside to myxol 2'-dimethyl-fucoside (Masamoto et al., 1998; Lagarde & Vermaas, 1999). The activity of CrtR from Anabaena sp. PCC 7120 and A. variabilis ATCC 29413 for deoxymyxol 2'-fucoside is high, while that for β-carotene is very low, judging from only the trace amount or none of zeaxanthin present (table 1). This is also confirmed that β-carotene cannot be a substrate of both CrtR from Anabaena sp. PCC 7120 and A. variabilis ATCC 29413 in E. coli with a β-carotene background (Makino et al., 2008). Consequently, deoxymyxol is a good substrate for CrtR in some cyanobacteria containing myxol since deoxymyxol is absent, while β-carotene may or may not be a substrate, depending on the characteristics of CrtR in these species (table 1). On the other hand, β-carotene is a good substrate for CrtR in three Synechococcus species, L. diguetii IAM M-279, T. erythraeum IMS 101, A. marina MBIC 11017 and P. marinus MED4 species due to presence of large amount of zeaxanthin (table 1). Since CrtR in plants and CrtZ in bacteria are known to catalyze β-carotene to zeaxanthin, further functional and amino acid sequence comparisons are still needed for these genes.
Figure 7. Synthesis of zeaxanthin and nostoxanthin from β-carotene.
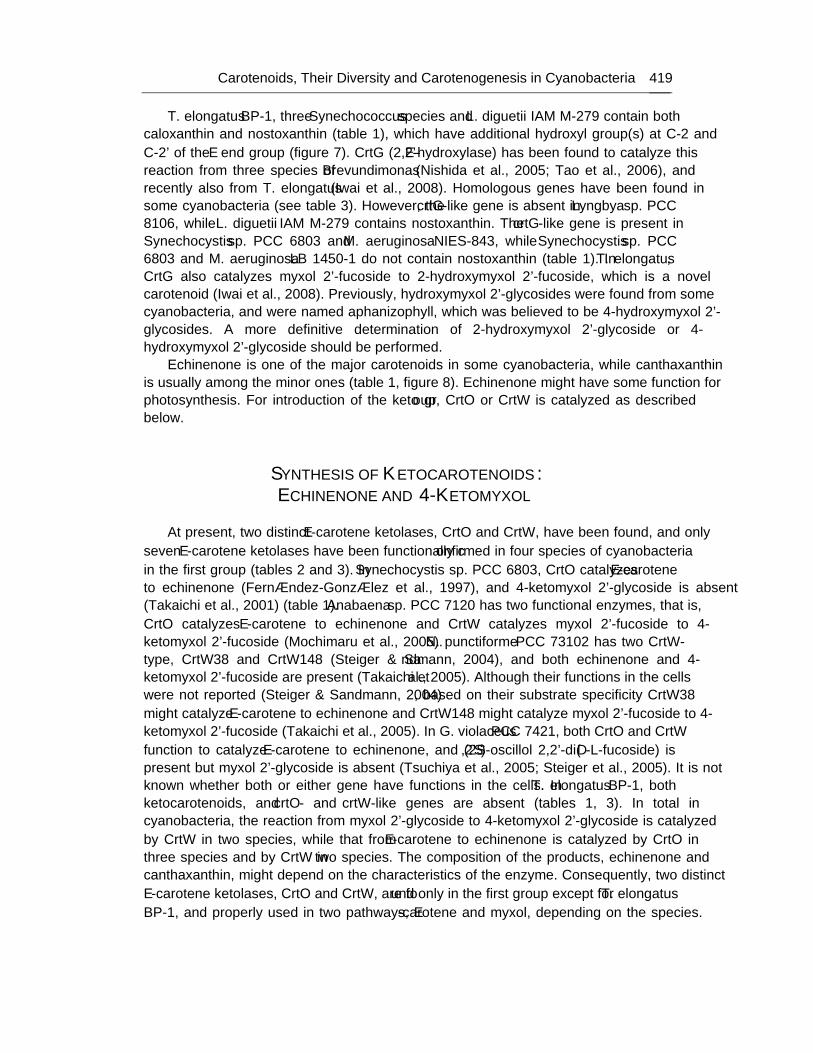
Carotenoids, Their Diversity and Carotenogenesis in Cyanobacteria 419
T. elongatus BP-1, three Synechococcus species and L. diguetii IAM M-279 contain both caloxanthin and nostoxanthin (table 1), which have additional hydroxyl group(s) at C-2 and C-2' of the β end group (figure 7). CrtG (2,2'-β-hydroxylase) has been found to catalyze this reaction from three species of Brevundimonas (Nishida et al., 2005; Tao et al., 2006), and recently also from T. elongatus (Iwai et al., 2008). Homologous genes have been found in some cyanobacteria (see table 3). However, the crtG-like gene is absent in Lyngbya sp. PCC 8106, while L. diguetii IAM M-279 contains nostoxanthin. The crtG-like gene is present in Synechocystis sp. PCC 6803 and M. aeruginosa NIES-843, while Synechocystis sp. PCC 6803 and M. aeruginosa LB 1450-1 do not contain nostoxanthin (table 1). In T. elongatus, CrtG also catalyzes myxol 2'-fucoside to 2-hydroxymyxol 2'-fucoside, which is a novel carotenoid (Iwai et al., 2008). Previously, hydroxymyxol 2'-glycosides were found from some cyanobacteria, and were named aphanizophyll, which was believed to be 4-hydroxymyxol 2'-glycosides. A more definitive determination of 2-hydroxymyxol 2'-glycoside or 4-hydroxymyxol 2'-glycoside should be performed.
Echinenone is one of the major carotenoids in some cyanobacteria, while canthaxanthin is usually among the minor ones (table 1, figure 8). Echinenone might have some function for photosynthesis. For introduction of the keto group, CrtO or CrtW is catalyzed as described below.
SYNTHESIS OF KETOCAROTENOIDS: ECHINENONE AND 4-KETOMYXOL
At present, two distinct β-carotene ketolases, CrtO and CrtW, have been found, and only
seven β-carotene ketolases have been functionally confirmed in four species of cyanobacteria in the first group (tables 2 and 3). In Synechocystis sp. PCC 6803, CrtO catalyzes β-carotene to echinenone (Fernández-González et al., 1997), and 4-ketomyxol 2'-glycoside is absent (Takaichi et al., 2001) (table 1). Anabaena sp. PCC 7120 has two functional enzymes, that is, CrtO catalyzes β-carotene to echinenone and CrtW catalyzes myxol 2'-fucoside to 4-ketomyxol 2'-fucoside (Mochimaru et al., 2005). N. punctiforme PCC 73102 has two CrtW-type, CrtW38 and CrtW148 (Steiger & Sandmann, 2004), and both echinenone and 4-ketomyxol 2'-fucoside are present (Takaichi et al., 2005). Although their functions in the cells were not reported (Steiger & Sandmann, 2004), based on their substrate specificity CrtW38 might catalyze β-carotene to echinenone and CrtW148 might catalyze myxol 2'-fucoside to 4-ketomyxol 2'-fucoside (Takaichi et al., 2005). In G. violaceus PCC 7421, both CrtO and CrtW function to catalyze β-carotene to echinenone, and (2S,2'S)-oscillol 2,2'-di(α-L-fucoside) is present but myxol 2'-glycoside is absent (Tsuchiya et al., 2005; Steiger et al., 2005). It is not known whether both or either gene have functions in the cells. In T. elongatus BP-1, both ketocarotenoids, and crtO- and crtW-like genes are absent (tables 1, 3). In total in cyanobacteria, the reaction from myxol 2'-glycoside to 4-ketomyxol 2'-glycoside is catalyzed by CrtW in two species, while that from β-carotene to echinenone is catalyzed by CrtO in three species and by CrtW in two species. The composition of the products, echinenone and canthaxanthin, might depend on the characteristics of the enzyme. Consequently, two distinct β-carotene ketolases, CrtO and CrtW, are found only in the first group except for T. elongatus BP-1, and properly used in two pathways, β-carotene and myxol, depending on the species.
Shinichi Takaichi and Mari Mochimaru 420
The second group except for Synechococcus sp. PCC 7002 strain PR6000 contains neither crtO- and crtW-like genes nor ketocarotenoids (tables 1, 3). It would be interesting to determine just how the cyanobacteria obtain both or either β-carotene ketolase, and how they make proper use of them.
Two distinct β-carotene ketolases are widely distributed in bacteria and green algae, as well as in cyanobacteria. CrtO and CrtW, whose functions have been confirmed, have been found in two bacterial species, and in five bacterial and two algal species, respectively (Tao & Cheng, 2004; Nishida et al., 2005; Huang et al., 2006; Takaichi & Mochimaru, 2007). Even though the reactions of both CrtO and CrtW involve the same β-carotene ketolation, the characteristics of the enzymes are different. The CrtO enzymes are almost twice the size of the CrtW enzymes, and do not share significant amino acid sequence homology with CrtW. The substrate specificities of CrtO are only the β-end group (β-carotene and γ-carotene), and its main function is monoketolase. The substrate specificities of CrtW are the β-end group (β-carotene) and 3-hydroxy-β-end group (zeaxanthin and myxol), and its main function is diketolase. CrtO has six conserved regions including the FAD-binding motif (Tao & Cheng, 2004), while CrtW has iron binding motifs (Steiger & Sandmann, 2004). Two β-carotene ketolases might have evolved convergently from different ancestors to acquire the same functions, although further studies are needed to confirm this (Mochimaru et al., 2005).
CAROTENOIDS IN SYNECHOCOCCUS SP. PCC 7002 We have analyzed that Synechococcus sp. PCC 7002 strain NIBB, which has been
maintained at National Institute of Basic Biology in Japan, contains β-carotene, zeaxanthin and nostoxanthin as other Synechococcus species. On the other hand, strain PR6000, which has been maintained at The Pennsylvania State University in USA and whose genome DNA sequences has been determined, contains β-carotene, zeaxanthin, echinenone, as well as a novel carotenoid of synechoxanthin and precursor of renierapurpurin (table 1, figure 9) (Graham et al., 2008). Although fatty acid compositions of two strains are somewhat different (Sakamoto et al., 1997), at present the reason of the different carotenoid composition is unknown. Graham et al. (2008) recently report β-carotene is converted to an aromatic carotenoid, renierapurpurin, by β-carotene desaturase/methyltransferase, CruE, and then C-18 and C-18' methyl groups of renierapurpurin is hydroxylated by CruH. The hydroxyl group is finally converted to carboxyl group by unknown enzyme (figure 9). Further synechoxanthin is found from some cyanobacteria, such as Anabaena sp. PCC 7120 and Synechocystis sp. PCC 6803 (Maresca et al., 2008; Graham & Bryant, 2008), but we cannot detect it. Further studies of the presence of synechoxanthin, its synthesis, and the reason of the different carotenoid composition of two strains are needed.
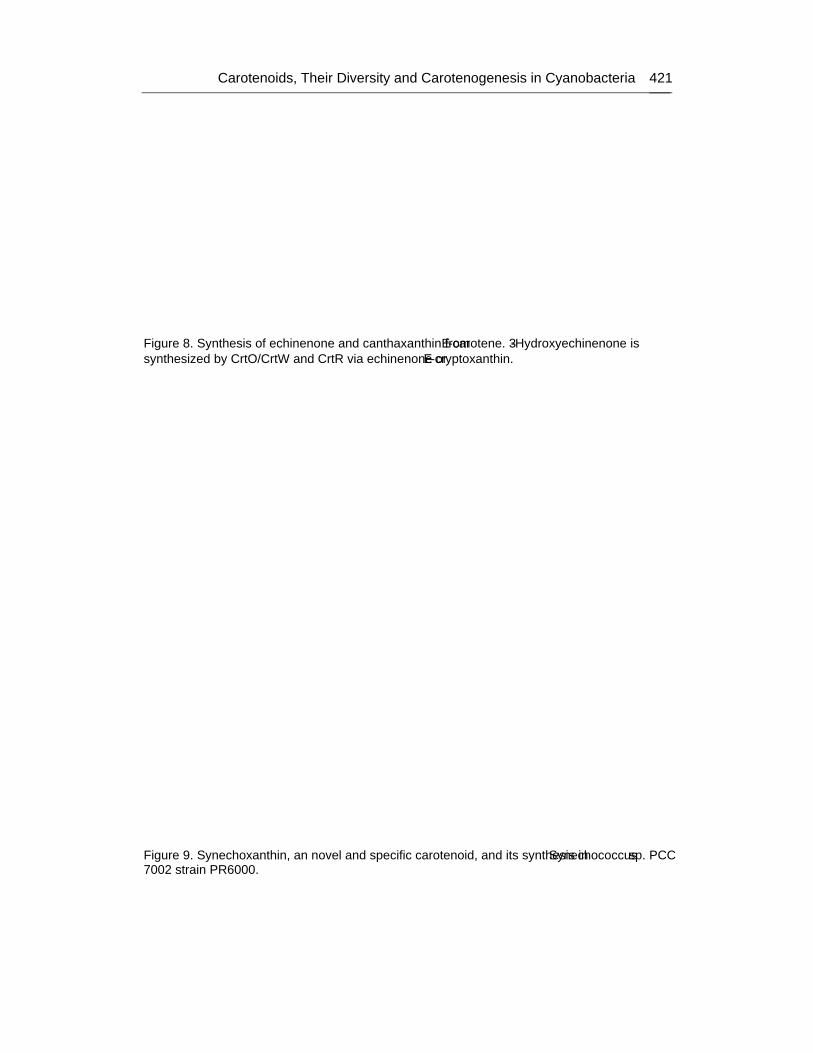
Carotenoids, Their Diversity and Carotenogenesis in Cyanobacteria 421
Figure 8. Synthesis of echinenone and canthaxanthin from β-carotene. 3′-Hydroxyechinenone is synthesized by CrtO/CrtW and CrtR via echinenone or β-cryptoxanthin.
Figure 9. Synechoxanthin, an novel and specific carotenoid, and its synthesis in Synechococcus sp. PCC 7002 strain PR6000.
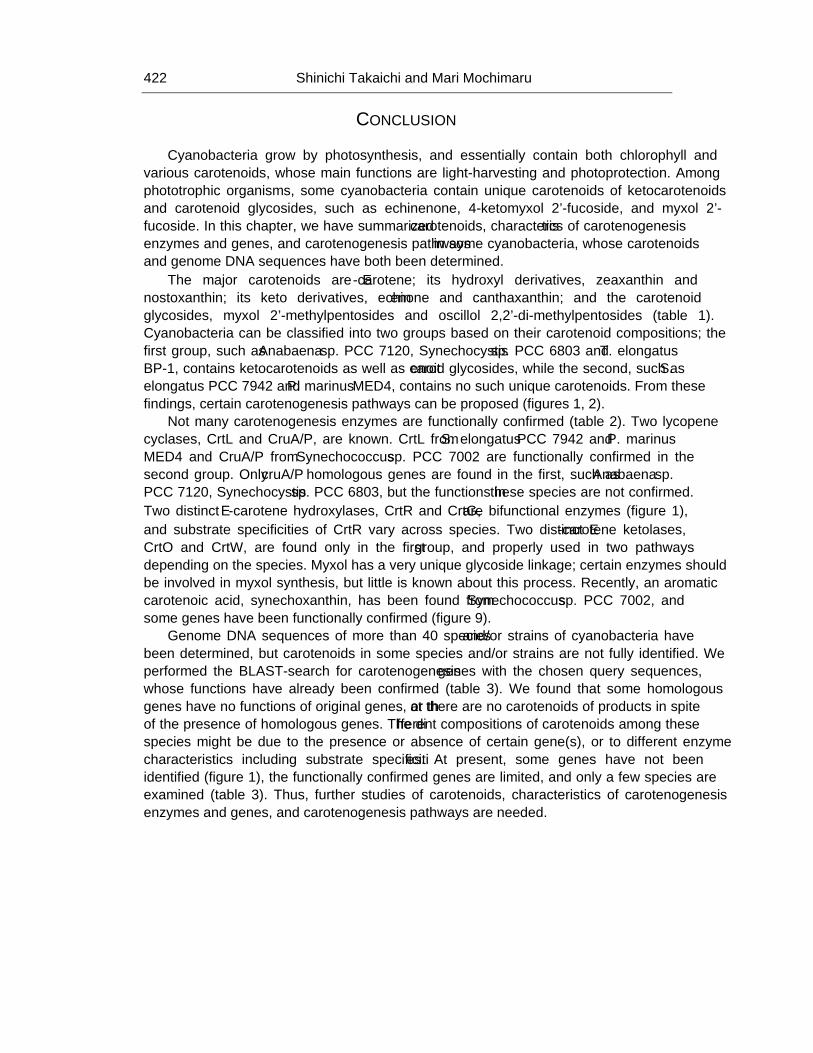
Shinichi Takaichi and Mari Mochimaru 422
CONCLUSION Cyanobacteria grow by photosynthesis, and essentially contain both chlorophyll and
various carotenoids, whose main functions are light-harvesting and photoprotection. Among phototrophic organisms, some cyanobacteria contain unique carotenoids of ketocarotenoids and carotenoid glycosides, such as echinenone, 4-ketomyxol 2'-fucoside, and myxol 2'-fucoside. In this chapter, we have summarized carotenoids, characteristics of carotenogenesis enzymes and genes, and carotenogenesis pathways in some cyanobacteria, whose carotenoids and genome DNA sequences have both been determined.
The major carotenoids are β-carotene; its hydroxyl derivatives, zeaxanthin and nostoxanthin; its keto derivatives, echinenone and canthaxanthin; and the carotenoid glycosides, myxol 2'-methylpentosides and oscillol 2,2'-di-methylpentosides (table 1). Cyanobacteria can be classified into two groups based on their carotenoid compositions; the first group, such as Anabaena sp. PCC 7120, Synechocystis sp. PCC 6803 and T. elongatus BP-1, contains ketocarotenoids as well as carotenoid glycosides, while the second, such as S. elongatus PCC 7942 and P. marinus MED4, contains no such unique carotenoids. From these findings, certain carotenogenesis pathways can be proposed (figures 1, 2).
Not many carotenogenesis enzymes are functionally confirmed (table 2). Two lycopene cyclases, CrtL and CruA/P, are known. CrtL from S. elongatus PCC 7942 and P. marinus MED4 and CruA/P from Synechococcus sp. PCC 7002 are functionally confirmed in the second group. Only cruA/P homologous genes are found in the first, such as Anabaena sp. PCC 7120, Synechocystis sp. PCC 6803, but the functions in these species are not confirmed. Two distinct β-carotene hydroxylases, CrtR and CrtG, are bifunctional enzymes (figure 1), and substrate specificities of CrtR vary across species. Two distinct β-carotene ketolases, CrtO and CrtW, are found only in the first group, and properly used in two pathways depending on the species. Myxol has a very unique glycoside linkage; certain enzymes should be involved in myxol synthesis, but little is known about this process. Recently, an aromatic carotenoic acid, synechoxanthin, has been found from Synechococcus sp. PCC 7002, and some genes have been functionally confirmed (figure 9).
Genome DNA sequences of more than 40 species and/or strains of cyanobacteria have been determined, but carotenoids in some species and/or strains are not fully identified. We performed the BLAST-search for carotenogenesis genes with the chosen query sequences, whose functions have already been confirmed (table 3). We found that some homologous genes have no functions of original genes, or that there are no carotenoids of products in spite of the presence of homologous genes. The different compositions of carotenoids among these species might be due to the presence or absence of certain gene(s), or to different enzyme characteristics including substrate specificities. At present, some genes have not been identified (figure 1), the functionally confirmed genes are limited, and only a few species are examined (table 3). Thus, further studies of carotenoids, characteristics of carotenogenesis enzymes and genes, and carotenogenesis pathways are needed.
Carotenoids, Their Diversity and Carotenogenesis in Cyanobacteria 423
ACKNOWLEDGMENTS The author wishes to thank Drs. K. Ohki, H. Miyashita, and M. Katayama for cultivation
of samples analyzed specially for this review.
REFERENCES
Aakermann, T., Skulberg, O. M., & Liaaen-Jensen, S. (1992) A comparison of the carotenoids of strains of Oscillatoria and Spirulina (cyanobacteria). Biochem. System. Ecol. 20: 761-769
Armstrong, G. A. (1997) Genetics of eubacterial carotenoid biosynthesis: a colorful tale. Annu. Rev. Microbiol. 51: 629-659
Bartley, G. E., Scolnik, P. A., & Beyer, P. (1999) Two Arabidopsis thaliana carotene desaturases, phytoene desaturase and ζ-carotene desaturase, expressed in Escherichia coli, catalyze a poly-cis pathway to yield pro-lycopene. Eur. J. Biochem. 259: 396-403
Boucher, Y., & Doolitttle W. F. (2000) The role of lateral gene transfer in the evolution of isoprenoid biosynthesis pathways. Mol. Microbiol. 37: 703-716
Breitenbach, J., Fernández-González, B., Vioque, A., & Sandmann G. (1998) A higher-plant type ζ-carotene desaturase in the cyanobacterium Synechocystis PCC6803. Plant Mol. Biol. 36: 725-732
Breitenbach, J., Vioque, A., & Sandmann, G. (2001) Gene sll0033 from Synechocystis 6803 encodes a carotenoid isomerase involved in the biosynthesis of all-E lycopene. Z. Naturforsch. 56 c: 915-917
Britton, G., Liaaen-Jensen, S., & Pfander, H. (2004) Carotenoids, Handbook. Birkhäuser Verlag, Basel
Buchecker, R., Liaaen-Jensen, S., Borch, G., & Siegelman, H. W. (1976) Carotenoids of Anacystis nidulans, structures of caloxanthin and nostoxanthin. Phytochemistry. 15: 1015-1018
Castenholz, R.W. (2001) Phylum BX. Cyanobacteria. In: Bergey's Manual of Systematic Bacteriology, Second Edition, vol. One, pp. 473-599, Boone, D. R., & Castenholz, R. W. (eds.), Springer, New York
Chamovitz, D., Misawa, N., Sandmann, G., & Hirschberg, J. (1992) Molecular cloning and expression in Escherichia coli of a cyanobacterial gene coding for phytoene synthase, a carotenoid biosynthesis enzyme. FEBS Lett. 296: 305-310
Cunningham Jr., F. X. (2002) Regulation of carotenoid synthesis and accumulation in plants. Pure Appl. Chem. 74: 1409-1417
Cunningham Jr., F. X., Sun, Z., Chamovitz, D., Hirschberg, J., & Gantt, E. (1994) Molecular structure and enzymatic function of lycopene cyclase from the cyanobacterium Synechococcus sp strain PCC7942. Plant Cell. 6: 1107-1121
Cunningham Jr., F. X., & Gantt, E. (2001) One ring or two? Determination of ring number in carotenoids by lycopene β-cyclases. Proc. Natl. Acad. Sci. USA. 98: 2905-2910
Dembitsky, V. M. (2005) Astonishing diversity of natural surfactants: 3. Carotenoid glycosides and isoprenoid glycolipids. Lipids. 40: 535-557
Shinichi Takaichi and Mari Mochimaru 424
Eisenreich, W., Bacher, A., Arigoni, D., & Rohdich, F. (2004) Biosynthesis of isoprenoids via the non-mevalonate pathway. Cell. Mol. Life Sci. 61: 1401-1426
Fernández-González, B., Sandmann, G., & Vioque, A. (1997) A new type of asymmetrically acting β-carotene ketolase is required for the synthesis of echinenone in the cyanobacterium Synechocystis sp. PCC 6803. J. Biol. Chem. 272: 9728-9733
Ferreira, K. N., Iverson, T. M., Maghlaoui, K., Barber, J., & Iwata, S. (2004) Architecture of the photosynthetic oxygen-evolving center. Science. 303: 1831-1838
Foss, P., Skulberg, O. M., Kilaas, L., & Liaaen-Jensen, S. (1986) The carbohydrate moieties bound to the carotenoids myxol and oscillol and their chemosystematic applications. Phytochemistry. 25: 1127-1132
Francis, G. W., Hertzberg, S., Andersen, K., & Liaaen-Jensen, S. (1970) New carotenoid glycosides from Oscillatoria limosa. Phytochemistry. 9: 629-635
Frank, H. A., Young, A. J., Britton, G., & Cogdell, R. J. (1999) The Photochemistry of Carotenoids, Kluwer Academic Publishers, Dordrecht
Frigaard, N.-U., Maresca, J. A., Yunker, C. E., Jones, A. D., & Bryant, D. A. (2004) Genetic manipulation of carotenoid biosynthesis in the green sulfur bacterium Chlorobium. tepidum. J. Bacteriol. 186: 5210-5220
Goodwin T.W. (1980) The Biochemistry of the Carotenoids, vol. 1. Plants, 2nd ed., Chapman and Hall, London
Graham, J. E., & Bryant, D. A. (2008) The biosynthetic pathway for synechoxanthin, an aromatic carotenoid synthesized by the euryhaline, unicellular cyanobacterium Synechococcus sp. strain PCC 7002. J. Bacteriol. 190: 7966-7974
Graham, J. E., & Bryant, D. A. (2009) The biosynthetic pathway for myxol-2' fucoside (myxoxanthophyll) in the cyanobacterium Synechococcus sp. strain PCC 7002. J. Bacteriol. 191: 3292-3300
Graham, J. E., Lecomte, J. T. J., & Bryant, D. A. (2008) Synechoxanthin, an aromatic C40 xanthophyll that is a major carotenoid in the cyanobacterium Synechococcus sp. PCC 7002. J. Nat. Prod. 71: 1647-1650
Harker, M., & Hirschberg, J. (1998) Molecular biology of carotenoid biosynthesis in photosynthetic organisms. Methods Enzymol. 297: 244-263
Hemmi, H., Ikejiri, S., Nakayama, T., & Nishino, T. (2003) Fusion-type lycopene β-cyclase from a thermoacidophilic archaeon Sulfolobus solfataricus. Biochem. Biophys. Res. Commun. 305: 586-591
Herbert, R. A., Gall, A., Maoka, T., Cogdell, R. J., Robert, B., Takaichi, S., & Schwabe, S. (2008) Phototrophic purple sulfur bacteria as heat engines in the South Andros Black Hole. Photosynth. Res. 95: 261-268
Hertzberg, S., & Liaaen-Jensen, S. (1969a) The structure of myxoxanthophyll. Phytochemistry. 8: 1259-1280
Hertzberg, S,. & Liaaen-Jensen, S. (1969b) The structure of oscillaxanthin. Phytochemistry. 8: 1281-1292
Hertzberg, S., & Liaaen-Jensen, S. (1971) The constitution of aphnizophyll. Phytochemistry. 10: 3251-3252
Hertzberg, S., Liaaen-Jensen, S., & Siegelman, H. W. (1971) The carotenoids of blue-green algae. Phytochemistry. 10: 3121-3127
Carotenoids, Their Diversity and Carotenogenesis in Cyanobacteria 425
Hirschberg, J., & Chamovitz, D. (1994) Carotenoids in cyanobacteria. In: The Molecular Biology of Cyanobacteria, pp. 559-579, Bryant, D. A. (ed.), Kluwer Academic Publishers, Dordrecht
Huang, J.-C., Wang, Y., Sandmann, G., & Chen, F. (2006) Isolation and characterization of a carotenoid oxygenase gene from Chlorella zofingiensis (Chlorophyta). Appl. Microbiol. Biotechnol. 71: 473-479
IUPAC Commission on Nomenclature of Organic Chemistry and the IUPAC-IUB Commission on Biochemical Nomenclature (1975) Nomenclature of carotenoids. Pure Appl. Chem. 41: 407-431
Iwai, M., Maoka, T., Ikeuchi, M., & Takaichi, S. (2008) 2,2'-β-Hydroxylase (CrtG) is involved in carotenogenesis of both nostoxanthin and 2-hydroxymyxol 2'-fucoside in Thermosynechococcus elongatus strain BP-1. Plant Cell Physiol. 49: 1678-1687
Jordan, P., Fromme, P., Witt, H. T., Klukas, O., Saenge, W., & Krauß, N. (2001) Three-dimensional structure of cyanobacterial photosystem I at 2.5 Å resolution. Nature. 411: 909-917
Kamiya, N., & Shen, J.-R. (2003) Crystal structure of oxygen-evolving photosystem II from Thermosynechococcus vulcanus at 3.7-Å resolution. Proc. Natl. Acad. Sci. USA. 100: 98-103
Kern, J., Loll, B., Lüneberg, C., DiFiore, D., Biesiadka, J., Irrgang K.-D., & Zouni, A. (2005) Purification, characterisation and crystallisation of photosystem II from Thermosynechococcus elongatus cultivated in a new type of photobioreactor. Biochim. Biophys. Acta. 1706: 147-157
Krubasik, P., & Sandmann, G. (2000) Molecular evolution of lycopene cyclases involved in the formation of carotenoids with ionone end groups. Biochem. Soc. Trans. 28: 806-810
Lagarde, D., & Vermaas, W. (1999) The zeaxanthin biosynthesis enzyme β-carotene hydroxylase is involved in myxoxanthophyll synthesis in Synechocystis sp. PCC 6803. FEBS Lett. 454: 247-251
Liang, C.-W., Zhang, X.-W., Tian, L., & Qin, S. (2008) functional characterization of sll0659 from Synechocustis sp. PCC 6803. Ind. J. Biochem. Biophys. 45: 275-277
Lichtenthaler, H. K. (1999) The 1-deoxy-D-xylulose-5-phosphate pathway of isoprenoid biosynthesis in plants. Annu. Rev. Plant Physiol. Plant Mol. Biol. 50: 47-65
Linden, H., Vioque, A., & Sandmann, G. (1993) Isolation of a carotenoid biosynthesis gene coding for ζ-carotene desaturase from Anabaena PCC 7120 by heterologous complementation. FEMS Microbiol. Lett. 106: 99-104
Linden, H., Misawa, N., Saito, T., & Sandmann, G. (1994) A novel carotenoid biosynthesis gene coding for ζ-carotene desaturase: functional expression, sequence and phylogenetic origin. Plant Mol. Biol. 24: 369-379
Makino, T., Harada, H., Ikenaga, H., Matsuda, S., Takaichi, S., Shindo, K., Sandmann, G., Ogata, T., & Misawa, N. (2008) Characterization of cyanobacterial carotenoid ketolase CrtW and hydroxylase CrtR by complementation analysis in Escherichia coli. Plant Cell Physiol. 50: 1867-1878
Maresca, J. A., Frigaard, N.-U., & Bryant, D. A. (2005) Identification of a novel class of lycopene cyclases in photosynthetic bacteria. In: Photosynthesis: Fundamental Aspects to Global Perspectives, pp. 884-886, van der Est, A. & Bruce, D. (eds.), Allen Press, Canada
Shinichi Takaichi and Mari Mochimaru 426
Maresca, J. A., Graham, J. E., Wu, M., Eisen, J. A., & Bryant, D. A. (2007) Identification of a forth family of lycopene cyclases in photosynthetic bacteria. Proc. Natl. Acad. Sci. USA. 104: 11784-11789
Maresca, J. A., Graham, J. E., & Bryant, D. A. (2008) The biochemical basis for structural diversity in the carotenoids of chlorophototrophic bacteria. Photosynth. Res. 97: 121-140
Martínez-Férez, I. M., & Vioque, A. (1992) Nucleotide sequence of the phytoene desaturase gene from Synechocystis sp. PCC 6803 and characterization of a new mutation which confers resistance to the herbicide norflurazon. Plant Mol. Biol. 18: 981-983
Martínez-Férez, I., Fernández-González, B., Sandmann, G., & Vioque, A. (1994) Cloning and expression in Escherichia coli of the gene coding for phytoene synthase from the cyanobacterium Synechocystis sp. PCC6803. Biochim. Biophys. Acta. 1218: 145-152
Masamoto, K., Misawa, N., Kaneko, T., Kikuno, R., & Toh, H. (1998) β-Carotene hydroxylase gene from the cyanobacterium Synechocystis sp. PCC6803. Plant Cell Physiol. 39: 560-564
Masamoto, K., Wada, H., Kaneko, T., & Takaichi, S. (2001) Identification of a gene required for cis-to-trans carotene isomerization in carotenogenesis of the cyanobacterium Synechocystis sp. PCC 6803. Plant Cell Physiol. 42: 1398-1402
Mochimaru, M., Masukawa, H., & Takaichi, S. (2005) The cyanobacterium Anabaena sp. PCC 7120 has two distinct β-carotene ketolases: CrtO for echinenone and CrtW for ketomyxol synthesis. FEBS Lett. 579: 6111-6114
Mochimaru, M., Masukawa, H., Maoka, T., Mohamed, H. E., Vermaas, W. F. J., & Takaichi, S. (2008) Substrate specificities and availability of fucosyltransferase and β-carotene hydroxylase for myxol 2'-fucoside synthesis in Anabaena sp. strain PCC 7120 compared with Synechocystis sp. strain PCC 6803. J. Bacteriol. 190: 6726-6733
Mohamed, H. E., & Vermaas, W. (2004) Slr1293 in Synechocystis sp. strain PCC 6803 is the C-3',4' desaturase (CrtD) involved in myxoxanthophyll biosynthesis. J. Bacteriol. 186: 5621-5628
Mohamed, H. E., & Vermaas, W. F. J. (2006) Sll0254 (CrtLdiox) is a bifunctional lycopene cyclase/dioxygenase in cyanobacteria producing myxoxanthophyll. J. Bacteriol. 188: 3337-3344
Mohamed, H. E., van de Meene, A. M. L., Roberson, R. W., & Vermaas, W. F. J. (2005) Myxoxanthophyll is required for normal cell wall structure and thylakoid organization in the cyanobacterium Synechocystis sp. strain PCC 6803. J. Bacteriol. 187: 6883-6892
Niggli, U. A., & Pfander, H. (1999) Carotenoid glycosides and glycosyl esters. In: Naturally Occurring Glycosides, pp. 125-145, Ikan R. (ed.), John Wiley & Sons, Chichester
Nishida, Y., Adachi, K., Kasai, H., Shizuri, Y., Shindo, K., Sawabe, A., Komemushi, S., Miki, W., & Misawa, N. (2005) Elucidation of a carotenoid biosynthesis gene cluster encoding a novel enzyme, 2,2'-β-hydroxylase, from Brevundimonas sp. strain SD212 and combinatorial biosynthesis of new or rare xanthophylls. Appl. Environ. Microbiol. 71: 4286-4296
Ohto, C., Ishida, C., Nakane, H., Muramatsu, M., Nishino, T., & Obata, S. (1999) A thermophilic cyanobacterium Synechococcus elongatus has three different Class I prenyltransferase genes. Plant Mol. Boil. 40: 307-321
Olaizola, M., & Duerr, E. O. (1990) Effects of light intensity and quality on the growth rate and photosynthetic pigment content of Spirulina platensis. J. Appl. Phycol. 2: 97-104
Carotenoids, Their Diversity and Carotenogenesis in Cyanobacteria 427
Omata, T., & Murata, N. (1984) Isolation and characterisation of three types of membranes from the cyanobacterium (blue-green alga) Synechocystis PCC 6714. Arch. Microbiol. 139: 113-116
Rählert, N., Fraser, P. D., & Sandmann, G. (2009) A crtA-related gene from Flavobacterium P99-3 encodes a novel carotenoid 2-hydroxylase involved in myxol biosynthesis. FEBS Lett. 583: 1605-1610
Ramos, A., Coesel, S., Marques, A., Rodrigues, M., Baumgartner, A., Noronha, J., Rauter, A., Brenig, B., & Varela, J. (2008) Isolation and characterization of a stress-inducible Dunaliella salina Lcy-β gene encoding a functional lycopene β-cyclase. Appl. Microbiol. Biotechnol. 79: 819-828
Rohmer, M. (1999) The discovery of a mevalonate-independent pathway for isoprenoid biosynthesis in bacteria, algae and higher plants. Nat. Prod. Rep. 16: 565-574
Rønneberg, H., Andrewes A. G., Borch, G., Berger, R., & Liaaen-Jensen, S. (1985) CD correlation of C-2' substituted monocyclic carotenoids. Phytochemistry. 24: 309-319
Sakamoto, T., Higashi, S., Wada, H., Murata, N., & Bryant, D. A. (1997) Low-temperature-induced desaturation of fatty acids and expression of desaturase genes in the cyanobacterium Synechococcus sp. PCC 700. FEMS Microbiol. Lett. 152: 313-320
Sandmann, G. (1994) Carotenoid biosynthesis in microorganisms and plants. Eur. J. Biochem. 223: 7-24
Sandmann, G. (2001) Carotenoid biosynthesis and biotechnological application. Arch. Biochem. Biophys. 385: 4-12
Sandmann, G. (2002) Molecular evolution of carotenoid biosynthesis from bacteria to plants. Physiol. Plant. 116: 431-440
Schneider, C., Böger, P., & Sandmann, G. (1997) Phytoene desaturase: heterologous expression in an active state, purification, and biochemical properties. Protein Expr. Purif. 10: 175-179
Shindo, K., Kikuta, K., Suzuki, A., Katsuta, A., Kasai, H., Yasumoto-Hirose, M., Matuo, Y., Misawa, N., & Takaichi, S. (2007) Rare carotenoids, (3R)-saproxanthin and (3R,2'S)-myxol, isolated from novel marine bacteria (Flavobacteriaceae) and their antioxidative activities. Appl. Microbiol. Biotechnol. 74: 1350-1357
Steiger, S., & Sandmann, G. (2004) Cloning of two carotenoid ketolase genes from Nostoc punctiforme for the heterogous production of canthaxanthin and astaxanthin. Biotechnol. Lett. 26: 813-817
Steiger, S., Schäfer, L., & Sandmann G. (1999) High-light-dependent upregulation of carotenoids and their antioxidative properties in the cyanobacteirum Synechocystis PCC 6803. J. Photochem. Photobiol. B: Biol. 52: 14-18
Steiger, S., Jackisch, Y., & Sandmann, G. (2005) Carotenoid biosynthesis in Gloeobacter violaceus PCC4721 involves a single crtI-type phytoene desaturase instead of typical cyanobacterial enzymes. Arch. Microbiol. 184: 207-214
Stickforth, P., Steiger, S., Hess, W. R., & Sandmann G. (2003) A novel type of lycopene ε-cyclase in the marine cyanobacterium Prochlorococcus marinus MED4. Arch. Microbiol. 179: 409-415
Stransky, H., & Hager, A. (1970) The carotenoid pattern and the occurrence of the light induced xanthophyll cycle in various classes of algae. IV. Caynophyceae and rhodophyceae. Arch. Mikrobiol. 72: 84-96
Shinichi Takaichi and Mari Mochimaru 428
Takaichi, S. (1999) Carotenoids and carotenogenesis in anoxygenic photosynthetic bacteria. In: The Photochemistry of Carotenoids, pp. 39-69, Frank, H. A., Young, A. J., Britton, G., & Cogdell, R. J. (eds.), Kluwer Academic Publishers, Dordrecht
Takaichi, S. (2009) Distribution and biosynthesis of carotenoids. In: The Purple Phototrophic Bacteria, pp. 97-117, Hunter, C. N., Daldal, F., Thurnauer, M. C., & Beatty, J. T. (eds.), Springer, Dordrecht
Takaichi, S. & Mimuro, M. (1998) Distribution and geometric isomerism of neoxanthin in oxygenic phototrophs: 9'-cis, a sole molecular form. Plant Cell Physiol. 39: 968-977
Takaichi, S., & Mochimaru, M. (2007) Carotenoids and carotenogenesis in cyanobacteria: unique ketocarotenoids and carotenoid glycosides. Cell. Mol. Life Sci. 64: 2607-2619
Takaichi, S., Wang, Z.-Y., Umetsu, M., Nozawa, T., Shimada, K., & Madigan, M. T. (1997) New carotenoids from the thermophilic green sulfur bacterium Chlorobium tepidum: 1',2'-dihydro-γ-carotene, 1',2'-dihydrochlorobactene, and OH-chlorobactene glucoside ester, and the carotenoid composition of different strains. Arch. Microbiol. 168: 270-276
Takaichi, S., Maoka, T., & Masamoto K. (2001) Myxoxanthophyll in Synechocystis sp. PCC 6803 is myxol 2'-dimethyl-fucoside, (3R,2'S)-myxol 2'-(2,4-di-O-methyl-α-L-fucoside), not rhamnoside. Plant Cell Physiol. 42: 756-762
Takaichi, S., Mochimaru, M., Maoka, T., & Katoh, H. (2005) Myxol and 4-ketomyxol 2'-fucosides, not rhamnosides, from Anabaena sp. PCC 7120 and Nostoc punctiforme PCC 73102, and proposal for the biosynthetic pathway of carotenoids. Plant Cell Physiol. 46: 497-504
Takaichi, S., Mochimaru, M., & Maoka, T. (2006) Presence of free myxol and 4-hydroxymyxol and absence of myxol glycosides in Anabaena variabilis ATCC 29413, and proposal of a biosynthetic pathway of carotenoids. Plant Cell Physiol. 47: 211-216
Tao, L., & Cheng, Q. (2004) Novel β-carotene ketolases from non-photosynthetic bacteria for canthaxanthin synthesis. Mol. Gen. Genomics. 272, 530-537
Tao, L., Rouvière, P. E., & Cheng, Q. (2006) A carotenoid synthesis gene cluster from a non-marine Brevundimonas that synthesizes hydroxylated astaxanthin. Gene 379: 101-108
Teramoto, M., Rählert, N., Misawa, N., & Sandmann, G. (2004) 1-Hydroxy monocyclic carotenoid 3,4-dehydrogenase from a marine bacterium that produces myxol. FEBS Lett. 570: 184-188
Tsuchiya, T., Takaichi, S., Misawa, N., Maoka, T., Miyashita, H., & Mimuro, M. (2005) The cyanobacterium Gloeobacter violaceus PCC 7421 uses bacterial-type phytoene desaturase in carotenoid biosynthesis. FEBS Lett. 579: 2125-2129
Yokoyama, A., & Miki, W. (1995) Isolation of myxol from a marine bacterium Flavobacterium sp. associated with a marine sponge. Fish. Sci. 61: 684-686
In: Handbook on Cyanobacteria ISBN: 978-1-60741-092-8 Editors: P. M. Gault and H. J. Marler © 2009 Nova Science Publishers, Inc.
Chapter 14
HAPALINDOLE FAMILY OF CYANOBACTERIAL NATURAL PRODUCTS: STRUCTURE,
BIOSYNTHESIS, AND FUNCTION
M.C. Moffitt1 and B.P. Burns*2,3 1 School of Biomedical and Health Sciences, University of Western Sydney, Australia
1 School of Biotechnology and Biomolecular Sciences 2The University of New South Wales, Sydney 2052, Australia 3Australian Centre for Astrobiology, Sydney, 2052, Australia.
ABSTRACT
Cyanobacteria are renowned for the biosynthesis of a range of natural products. In comparison to the bioactives produced by non-ribosomal peptide synthetase and polyketide synthase systems, the hapalindole family of hybrid isoprenoid-indole alkaloids has received considerably less attention. It has been proposed that these natural products, the indole alkaloids, are constructed by a pathway of monofunctional enzymes. This chapter will specifically discuss the hapalindole family of alkaloids isolated exclusively from the Group 5 cyanobacteria. Structural diversity within this family correlates with a wide range of bioactivities. However, despite the wide variety of structures related to the hapalindoles, their biosynthesis is proposed to occur via a common pathway. Structural diversification of the natural products is proposed to have occurred as a result of evolution of biosynthetic enzymes in Nature and thus will provide insights into how these and related enzymes may be engineered in the laboratory. In this chapter we will focus on aspects of hapalindole structural diversity, proposed biosynthetic pathways, known bioactivities, and the potential for bioengineering of this unique natural product class.
* Corresponding author: Brendan P. Burns, School of Biotechnology and Biomolecular Sciences, University of
New South Wales, Sydney, 2052, Australia. Phone: 612 93853659. Fax: 612 93851591. Email: [email protected]
M.C. Moffitt and B.P. Burns 430
INTRODUCTION Cyanobacteria are renowned for the biosynthesis of nonribosomal peptide and polyketide
natural products, in particular those of the hybrid type. A number of cyanobacterial genera are especially rich sources of bioactive compounds. These include bloom-forming freshwater cyanobacteria associated with toxic-blooms, such as Microcystis and Anabaena, in addition to tropical marine cyanobacteria such as various species of Lyngbya or Symploca [33, 36]. Of significant medical importance, cyanobacteria have also been shown to produce compounds of potential pharmaceutical interest. A number of active molecules with antibacterial, antiviral, fungicide, immunosuppressive, enzyme inhibiting, and cytotoxic activity have been isolated from cyanobacterial biomass. For example, Nostoc sp. GSV 224 synthesizes potent inhibitors of microtubule assembly, which show anticancer activity against a broad spectrum of tumors [37, 42], and a variety of other antimitotic and cytotoxic metabolites are produced by Lyngbya majuscula and Symploca sp. such as the dolastatins and symplostatin [23, 30, 32].
For many cyanobacterial bioactive compounds, cyclic or branched-cyclic structures and a composition of unusual and modified amino acids in small peptides indicate non-ribosomal biosynthesis. The mechanism of non-ribosomal biosynthesis of peptides, by a family of large multifunctional enzymes known as non-ribosomal peptide synthetases (NRPS), has been elucidated by studying the formation of drugs such as penicillin, vancomycin, and cyclosporin [27]. NRPS have a modular structure, with each module being responsible for the activation, thiolation, modification, and condensation of one specific amino acid substrate [31]. Several cyanobacterial bioactive compounds also possess fatty acid or polyketide side chains. Like peptides, polyketides are assembled by modular multifunctional megasynthases, polyketide synthases (PKS), which are organized into repeated functional units [12]. Each PKS unit in the modular-type PKS catalyzes all discrete steps of enzyme reactions for polyketide chain elongation.
However in contrast, some cyanobacteria produce natural products, particularly indole alkaloids, which are proposed to be constructed by a pathway of monofunctional enzymes. This chapter will specifically discuss the hapalindole family of hybrid isoprenoid-indole alkaloids isolated exclusively from the Group 5 cyanobacteria. In comparison to the bioactives produced by NRPS and PKS systems, the hapalindole family has received less attention. Structural diversity within this family correlates with a wide range of bioactivities [19]. However, despite the wide variety of structures related to the hapalindoles, their biosynthesis is proposed to occur via a common pathway [47]. Structural diversification of the natural products is likely to have occurred as a result of evolution of biosynthetic enzymes in Nature and thus will provide insights into how these and related enzymes may be engineered in the laboratory.
STRUCTURE OF HAPALINDOLES AND RELATED MOLECULES In the mid 1980’s, Moore and co-workers from the University of Hawaii isolated and
elucidated the structure of the indole alkaloid natural product, hapalindole, from an isolate of the Group 5 cyanobacterium Hapalosiphon fontinalis [34]. Since that time, a variety of hapalindole analogues have been isolated from cyanobacteria (figure 1, table 1). For the
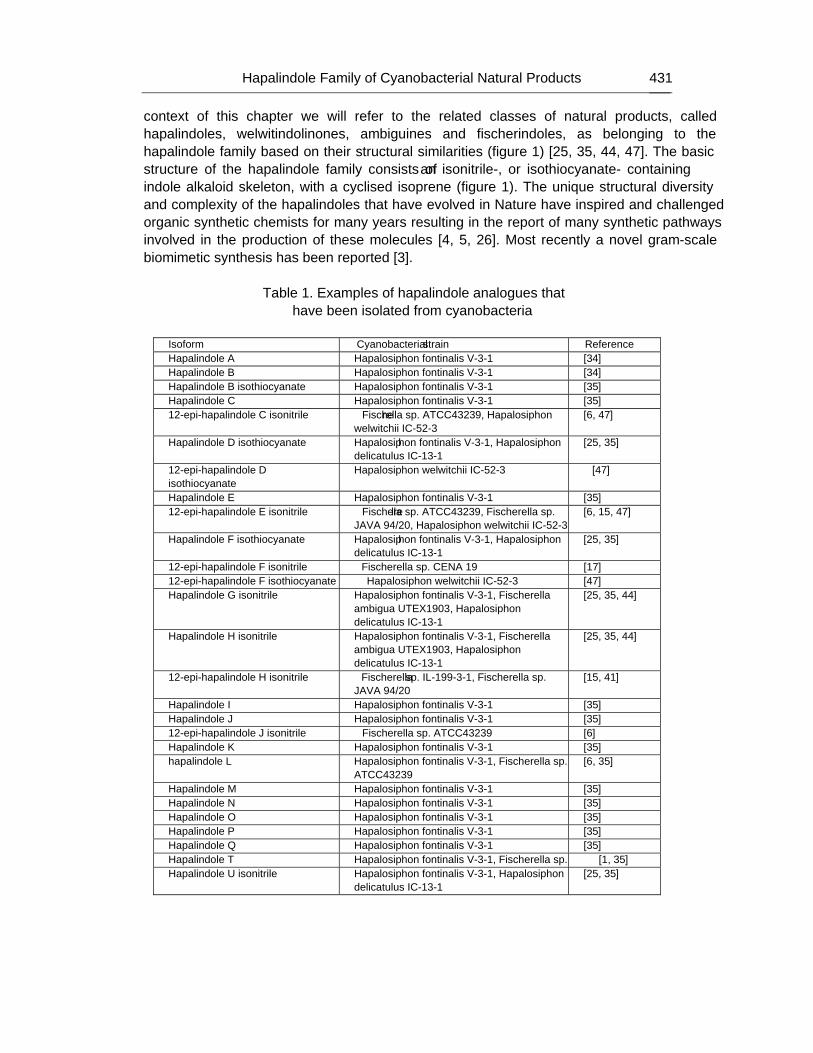
Hapalindole Family of Cyanobacterial Natural Products … 431
context of this chapter we will refer to the related classes of natural products, called hapalindoles, welwitindolinones, ambiguines and fischerindoles, as belonging to the hapalindole family based on their structural similarities (figure 1) [25, 35, 44, 47]. The basic structure of the hapalindole family consists of an isonitrile-, or isothiocyanate- containing indole alkaloid skeleton, with a cyclised isoprene (figure 1). The unique structural diversity and complexity of the hapalindoles that have evolved in Nature have inspired and challenged organic synthetic chemists for many years resulting in the report of many synthetic pathways involved in the production of these molecules [4, 5, 26]. Most recently a novel gram-scale biomimetic synthesis has been reported [3].
Table 1. Examples of hapalindole analogues that
have been isolated from cyanobacteria Isoform Cyanobacterial strain Reference Hapalindole A Hapalosiphon fontinalis V-3-1 [34] Hapalindole B Hapalosiphon fontinalis V-3-1 [34] Hapalindole B isothiocyanate Hapalosiphon fontinalis V-3-1 [35] Hapalindole C Hapalosiphon fontinalis V-3-1 [35] 12-epi-hapalindole C isonitrile Fischerella sp. ATCC43239, Hapalosiphon
welwitchii IC-52-3 [6, 47]
Hapalindole D isothiocyanate Hapalosiphon fontinalis V-3-1, Hapalosiphon delicatulus IC-13-1
[25, 35]
12-epi-hapalindole D isothiocyanate
Hapalosiphon welwitchii IC-52-3 [47]
Hapalindole E Hapalosiphon fontinalis V-3-1 [35] 12-epi-hapalindole E isonitrile Fischerella sp. ATCC43239, Fischerella sp.
JAVA 94/20, Hapalosiphon welwitchii IC-52-3 [6, 15, 47]
Hapalindole F isothiocyanate Hapalosiphon fontinalis V-3-1, Hapalosiphon delicatulus IC-13-1
[25, 35]
12-epi-hapalindole F isonitrile Fischerella sp. CENA 19 [17] 12-epi-hapalindole F isothiocyanate Hapalosiphon welwitchii IC-52-3 [47] Hapalindole G isonitrile Hapalosiphon fontinalis V-3-1, Fischerella
ambigua UTEX1903, Hapalosiphon delicatulus IC-13-1
[25, 35, 44]
Hapalindole H isonitrile Hapalosiphon fontinalis V-3-1, Fischerella ambigua UTEX1903, Hapalosiphon delicatulus IC-13-1
[25, 35, 44]
12-epi-hapalindole H isonitrile Fischerella sp. IL-199-3-1, Fischerella sp. JAVA 94/20
[15, 41]
Hapalindole I Hapalosiphon fontinalis V-3-1 [35] Hapalindole J Hapalosiphon fontinalis V-3-1 [35] 12-epi-hapalindole J isonitrile Fischerella sp. ATCC43239 [6] Hapalindole K Hapalosiphon fontinalis V-3-1 [35] hapalindole L Hapalosiphon fontinalis V-3-1, Fischerella sp.
ATCC43239 [6, 35]
Hapalindole M Hapalosiphon fontinalis V-3-1 [35] Hapalindole N Hapalosiphon fontinalis V-3-1 [35] Hapalindole O Hapalosiphon fontinalis V-3-1 [35] Hapalindole P Hapalosiphon fontinalis V-3-1 [35] Hapalindole Q Hapalosiphon fontinalis V-3-1 [35] Hapalindole T Hapalosiphon fontinalis V-3-1, Fischerella sp. [1, 35] Hapalindole U isonitrile Hapalosiphon fontinalis V-3-1, Hapalosiphon
delicatulus IC-13-1 [25, 35]
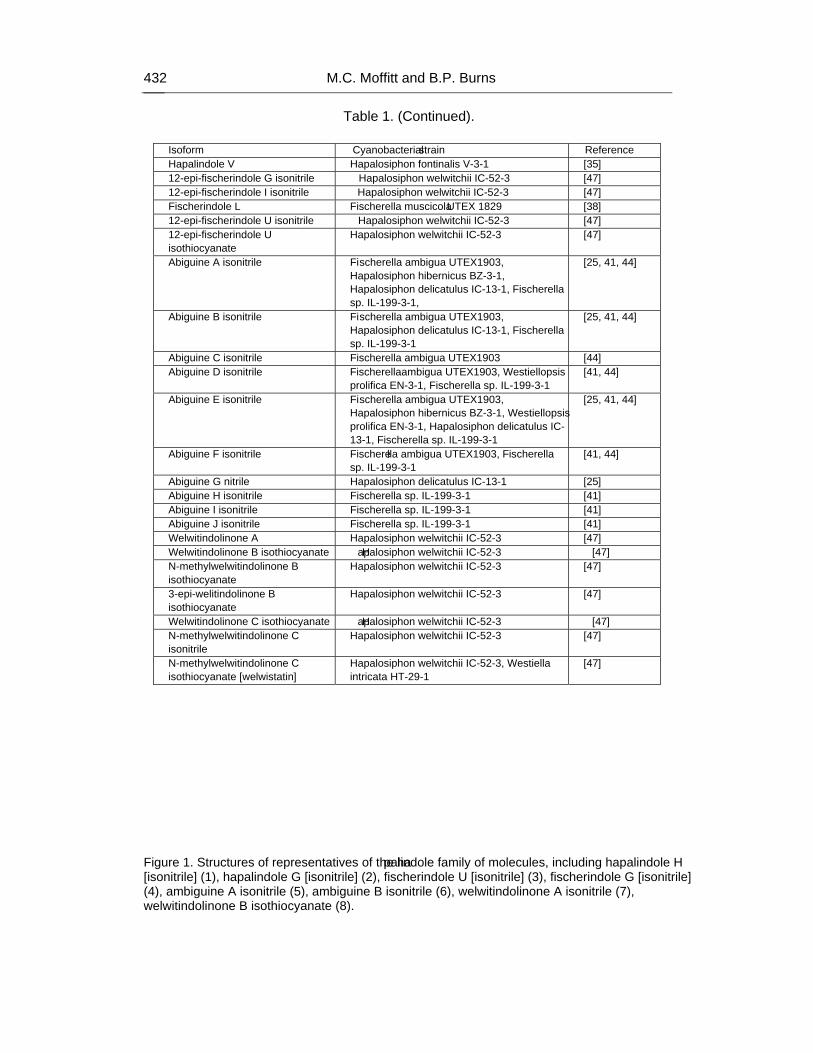
M.C. Moffitt and B.P. Burns 432
Table 1. (Continued). Isoform Cyanobacterial strain Reference Hapalindole V Hapalosiphon fontinalis V-3-1 [35] 12-epi-fischerindole G isonitrile Hapalosiphon welwitchii IC-52-3 [47] 12-epi-fischerindole I isonitrile Hapalosiphon welwitchii IC-52-3 [47] Fischerindole L Fischerella muscicola UTEX 1829 [38] 12-epi-fischerindole U isonitrile Hapalosiphon welwitchii IC-52-3 [47] 12-epi-fischerindole U isothiocyanate
Hapalosiphon welwitchii IC-52-3 [47]
Abiguine A isonitrile Fischerella ambigua UTEX1903, Hapalosiphon hibernicus BZ-3-1, Hapalosiphon delicatulus IC-13-1, Fischerella sp. IL-199-3-1,
[25, 41, 44]
Abiguine B isonitrile Fischerella ambigua UTEX1903, Hapalosiphon delicatulus IC-13-1, Fischerella sp. IL-199-3-1
[25, 41, 44]
Abiguine C isonitrile Fischerella ambigua UTEX1903 [44] Abiguine D isonitrile Fischerella ambigua UTEX1903, Westiellopsis
prolifica EN-3-1, Fischerella sp. IL-199-3-1 [41, 44]
Abiguine E isonitrile Fischerella ambigua UTEX1903, Hapalosiphon hibernicus BZ-3-1, Westiellopsis prolifica EN-3-1, Hapalosiphon delicatulus IC-13-1, Fischerella sp. IL-199-3-1
[25, 41, 44]
Abiguine F isonitrile Fischerella ambigua UTEX1903, Fischerella sp. IL-199-3-1
[41, 44]
Abiguine G nitrile Hapalosiphon delicatulus IC-13-1 [25] Abiguine H isonitrile Fischerella sp. IL-199-3-1 [41] Abiguine I isonitrile Fischerella sp. IL-199-3-1 [41] Abiguine J isonitrile Fischerella sp. IL-199-3-1 [41] Welwitindolinone A Hapalosiphon welwitchii IC-52-3 [47] Welwitindolinone B isothiocyanate Hapalosiphon welwitchii IC-52-3 [47] N-methylwelwitindolinone B isothiocyanate
Hapalosiphon welwitchii IC-52-3 [47]
3-epi-welitindolinone B isothiocyanate
Hapalosiphon welwitchii IC-52-3 [47]
Welwitindolinone C isothiocyanate Hapalosiphon welwitchii IC-52-3 [47] N-methylwelwitindolinone C isonitrile
Hapalosiphon welwitchii IC-52-3 [47]
N-methylwelwitindolinone C isothiocyanate [welwistatin]
Hapalosiphon welwitchii IC-52-3, Westiella intricata HT-29-1
[47]
Figure 1. Structures of representatives of the hapalindole family of molecules, including hapalindole H [isonitrile] (1), hapalindole G [isonitrile] (2), fischerindole U [isonitrile] (3), fischerindole G [isonitrile] (4), ambiguine A isonitrile (5), ambiguine B isonitrile (6), welwitindolinone A isonitrile (7), welwitindolinone B isothiocyanate (8).
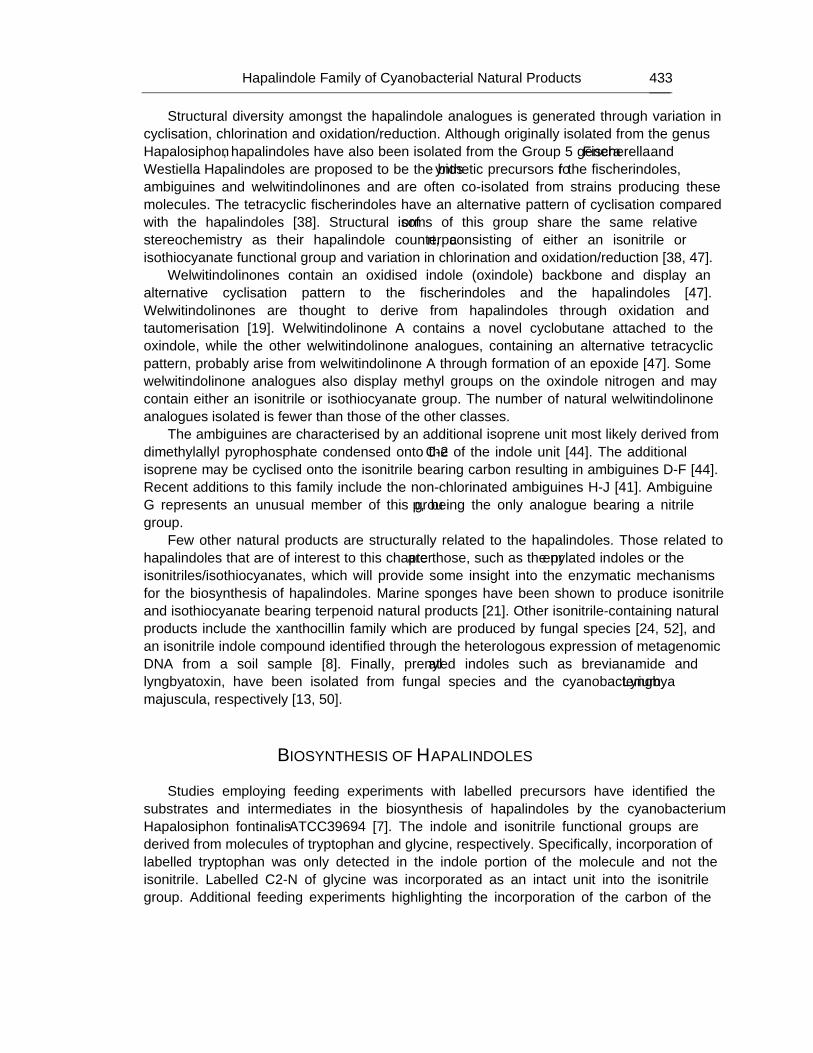
Hapalindole Family of Cyanobacterial Natural Products … 433
Structural diversity amongst the hapalindole analogues is generated through variation in cyclisation, chlorination and oxidation/reduction. Although originally isolated from the genus Hapalosiphon, hapalindoles have also been isolated from the Group 5 genera Fischerella and Westiella. Hapalindoles are proposed to be the biosynthetic precursors for the fischerindoles, ambiguines and welwitindolinones and are often co-isolated from strains producing these molecules. The tetracyclic fischerindoles have an alternative pattern of cyclisation compared with the hapalindoles [38]. Structural isoforms of this group share the same relative stereochemistry as their hapalindole counterpart, consisting of either an isonitrile or isothiocyanate functional group and variation in chlorination and oxidation/reduction [38, 47].
Welwitindolinones contain an oxidised indole (oxindole) backbone and display an alternative cyclisation pattern to the fischerindoles and the hapalindoles [47]. Welwitindolinones are thought to derive from hapalindoles through oxidation and tautomerisation [19]. Welwitindolinone A contains a novel cyclobutane attached to the oxindole, while the other welwitindolinone analogues, containing an alternative tetracyclic pattern, probably arise from welwitindolinone A through formation of an epoxide [47]. Some welwitindolinone analogues also display methyl groups on the oxindole nitrogen and may contain either an isonitrile or isothiocyanate group. The number of natural welwitindolinone analogues isolated is fewer than those of the other classes.
The ambiguines are characterised by an additional isoprene unit most likely derived from dimethylallyl pyrophosphate condensed onto the C-2 of the indole unit [44]. The additional isoprene may be cyclised onto the isonitrile bearing carbon resulting in ambiguines D-F [44]. Recent additions to this family include the non-chlorinated ambiguines H-J [41]. Ambiguine G represents an unusual member of this group, being the only analogue bearing a nitrile group.
Few other natural products are structurally related to the hapalindoles. Those related to hapalindoles that are of interest to this chapter are those, such as the prenylated indoles or the isonitriles/isothiocyanates, which will provide some insight into the enzymatic mechanisms for the biosynthesis of hapalindoles. Marine sponges have been shown to produce isonitrile and isothiocyanate bearing terpenoid natural products [21]. Other isonitrile-containing natural products include the xanthocillin family which are produced by fungal species [24, 52], and an isonitrile indole compound identified through the heterologous expression of metagenomic DNA from a soil sample [8]. Finally, prenylated indoles such as brevianamide and lyngbyatoxin, have been isolated from fungal species and the cyanobacterium Lyngbya majuscula, respectively [13, 50].
BIOSYNTHESIS OF HAPALINDOLES Studies employing feeding experiments with labelled precursors have identified the
substrates and intermediates in the biosynthesis of hapalindoles by the cyanobacterium Hapalosiphon fontinalis ATCC39694 [7]. The indole and isonitrile functional groups are derived from molecules of tryptophan and glycine, respectively. Specifically, incorporation of labelled tryptophan was only detected in the indole portion of the molecule and not the isonitrile. Labelled C2-N of glycine was incorporated as an intact unit into the isonitrile group. Additional feeding experiments highlighting the incorporation of the carbon of the
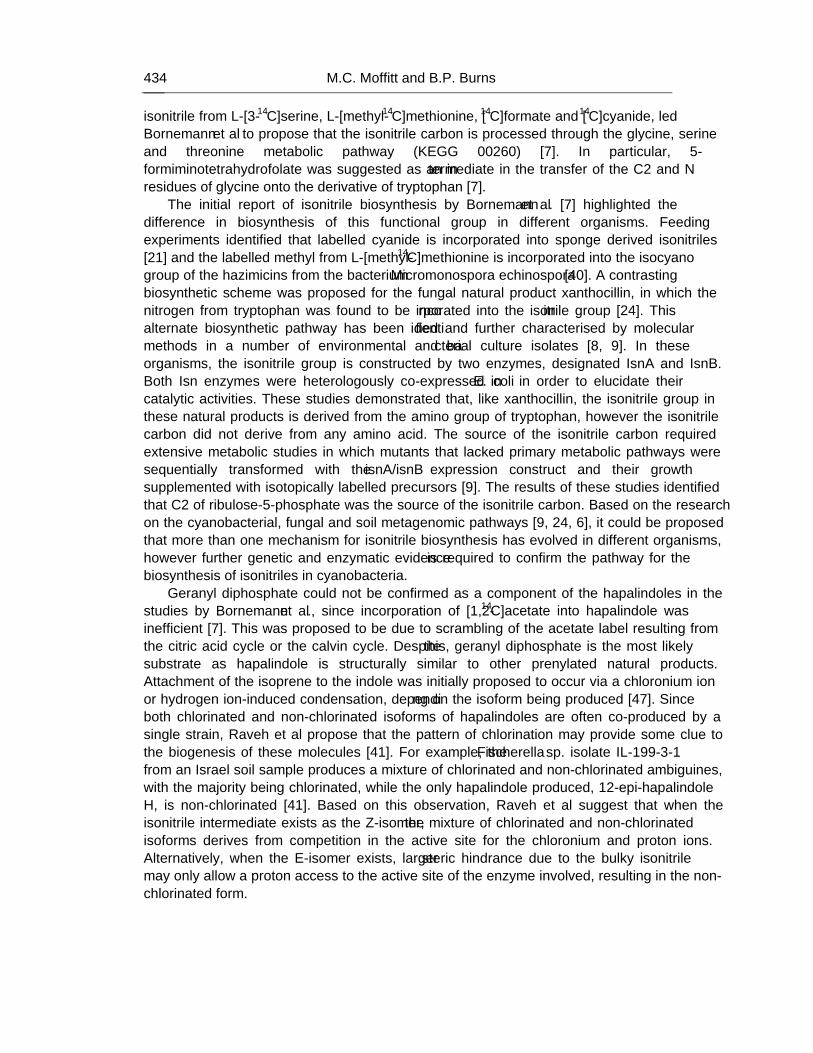
M.C. Moffitt and B.P. Burns 434
isonitrile from L-[3-14C]serine, L-[methyl-14C]methionine, [14C]formate and [14C]cyanide, led Bornemann et al to propose that the isonitrile carbon is processed through the glycine, serine and threonine metabolic pathway (KEGG 00260) [7]. In particular, 5-formiminotetrahydrofolate was suggested as an intermediate in the transfer of the C2 and N residues of glycine onto the derivative of tryptophan [7].
The initial report of isonitrile biosynthesis by Bornemann et al. [7] highlighted the difference in biosynthesis of this functional group in different organisms. Feeding experiments identified that labelled cyanide is incorporated into sponge derived isonitriles [21] and the labelled methyl from L-[methyl-14C]methionine is incorporated into the isocyano group of the hazimicins from the bacterium Micromonospora echinospora [40]. A contrasting biosynthetic scheme was proposed for the fungal natural product xanthocillin, in which the nitrogen from tryptophan was found to be incorporated into the isonitrile group [24]. This alternate biosynthetic pathway has been identified and further characterised by molecular methods in a number of environmental and bacterial culture isolates [8, 9]. In these organisms, the isonitrile group is constructed by two enzymes, designated IsnA and IsnB. Both Isn enzymes were heterologously co-expressed in E. coli in order to elucidate their catalytic activities. These studies demonstrated that, like xanthocillin, the isonitrile group in these natural products is derived from the amino group of tryptophan, however the isonitrile carbon did not derive from any amino acid. The source of the isonitrile carbon required extensive metabolic studies in which mutants that lacked primary metabolic pathways were sequentially transformed with the isnA/isnB expression construct and their growth supplemented with isotopically labelled precursors [9]. The results of these studies identified that C2 of ribulose-5-phosphate was the source of the isonitrile carbon. Based on the research on the cyanobacterial, fungal and soil metagenomic pathways [9, 24, 6], it could be proposed that more than one mechanism for isonitrile biosynthesis has evolved in different organisms, however further genetic and enzymatic evidence is required to confirm the pathway for the biosynthesis of isonitriles in cyanobacteria.
Geranyl diphosphate could not be confirmed as a component of the hapalindoles in the studies by Bornemann et al., since incorporation of [1,2-14C]acetate into hapalindole was inefficient [7]. This was proposed to be due to scrambling of the acetate label resulting from the citric acid cycle or the calvin cycle. Despite this, geranyl diphosphate is the most likely substrate as hapalindole is structurally similar to other prenylated natural products. Attachment of the isoprene to the indole was initially proposed to occur via a chloronium ion or hydrogen ion-induced condensation, depending on the isoform being produced [47]. Since both chlorinated and non-chlorinated isoforms of hapalindoles are often co-produced by a single strain, Raveh et al propose that the pattern of chlorination may provide some clue to the biogenesis of these molecules [41]. For example, the Fischerella sp. isolate IL-199-3-1 from an Israel soil sample produces a mixture of chlorinated and non-chlorinated ambiguines, with the majority being chlorinated, while the only hapalindole produced, 12-epi-hapalindole H, is non-chlorinated [41]. Based on this observation, Raveh et al suggest that when the isonitrile intermediate exists as the Z-isomer, the mixture of chlorinated and non-chlorinated isoforms derives from competition in the active site for the chloronium and proton ions. Alternatively, when the E-isomer exists, larger steric hindrance due to the bulky isonitrile may only allow a proton access to the active site of the enzyme involved, resulting in the non-chlorinated form.
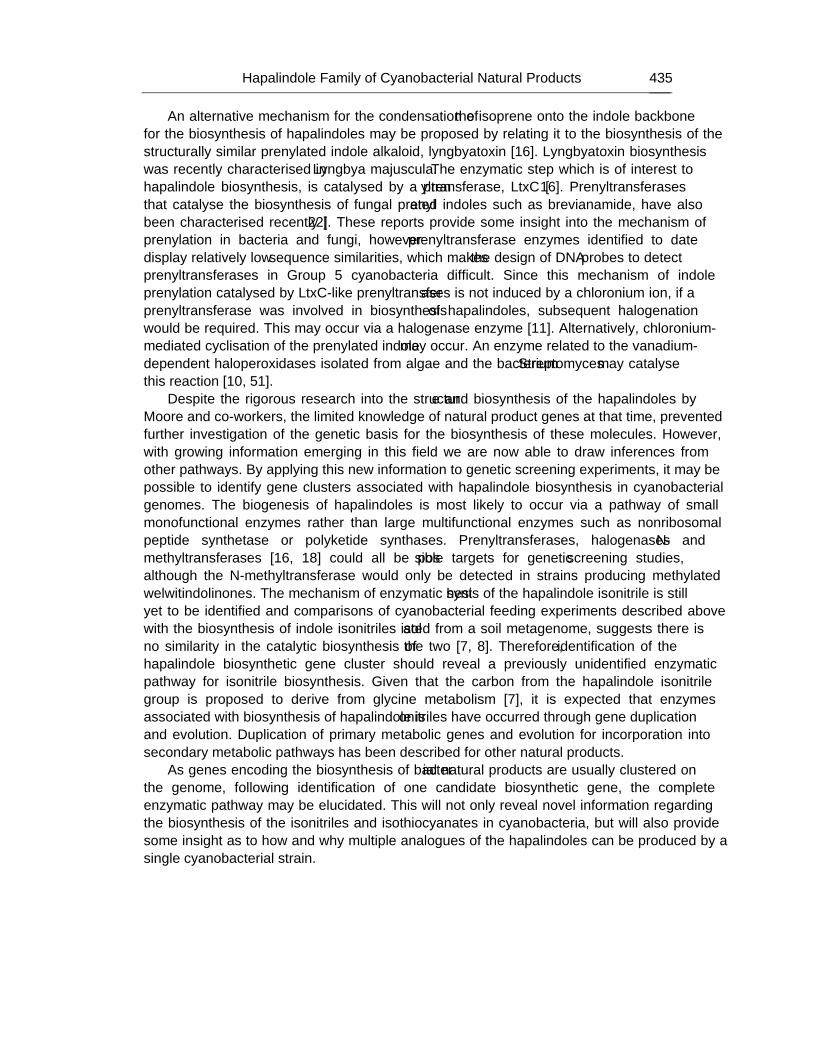
Hapalindole Family of Cyanobacterial Natural Products … 435
An alternative mechanism for the condensation of the isoprene onto the indole backbone for the biosynthesis of hapalindoles may be proposed by relating it to the biosynthesis of the structurally similar prenylated indole alkaloid, lyngbyatoxin [16]. Lyngbyatoxin biosynthesis was recently characterised in Lyngbya majuscula. The enzymatic step which is of interest to hapalindole biosynthesis, is catalysed by a prenyltransferase, LtxC [16]. Prenyltransferases that catalyse the biosynthesis of fungal prenylated indoles such as brevianamide, have also been characterised recently [22]. These reports provide some insight into the mechanism of prenylation in bacteria and fungi, however prenyltransferase enzymes identified to date display relatively low sequence similarities, which makes the design of DNA probes to detect prenyltransferases in Group 5 cyanobacteria difficult. Since this mechanism of indole prenylation catalysed by LtxC-like prenyltransferases is not induced by a chloronium ion, if a prenyltransferase was involved in biosynthesis of hapalindoles, subsequent halogenation would be required. This may occur via a halogenase enzyme [11]. Alternatively, chloronium-mediated cyclisation of the prenylated indole may occur. An enzyme related to the vanadium-dependent haloperoxidases isolated from algae and the bacterium Streptomyces may catalyse this reaction [10, 51].
Despite the rigorous research into the structure and biosynthesis of the hapalindoles by Moore and co-workers, the limited knowledge of natural product genes at that time, prevented further investigation of the genetic basis for the biosynthesis of these molecules. However, with growing information emerging in this field we are now able to draw inferences from other pathways. By applying this new information to genetic screening experiments, it may be possible to identify gene clusters associated with hapalindole biosynthesis in cyanobacterial genomes. The biogenesis of hapalindoles is most likely to occur via a pathway of small monofunctional enzymes rather than large multifunctional enzymes such as nonribosomal peptide synthetase or polyketide synthases. Prenyltransferases, halogenases and N-methyltransferases [16, 18] could all be possible targets for genetic screening studies, although the N-methyltransferase would only be detected in strains producing methylated welwitindolinones. The mechanism of enzymatic synthesis of the hapalindole isonitrile is still yet to be identified and comparisons of cyanobacterial feeding experiments described above with the biosynthesis of indole isonitriles isolated from a soil metagenome, suggests there is no similarity in the catalytic biosynthesis of the two [7, 8]. Therefore, identification of the hapalindole biosynthetic gene cluster should reveal a previously unidentified enzymatic pathway for isonitrile biosynthesis. Given that the carbon from the hapalindole isonitrile group is proposed to derive from glycine metabolism [7], it is expected that enzymes associated with biosynthesis of hapalindole isonitriles have occurred through gene duplication and evolution. Duplication of primary metabolic genes and evolution for incorporation into secondary metabolic pathways has been described for other natural products.
As genes encoding the biosynthesis of bacterial natural products are usually clustered on the genome, following identification of one candidate biosynthetic gene, the complete enzymatic pathway may be elucidated. This will not only reveal novel information regarding the biosynthesis of the isonitriles and isothiocyanates in cyanobacteria, but will also provide some insight as to how and why multiple analogues of the hapalindoles can be produced by a single cyanobacterial strain.
M.C. Moffitt and B.P. Burns 436
BIOACTIVITY OF HAPALINDOLES Initial interest in the isolation and structural elucidation of the hapalindole molecules
grew from the identification of their antialgal bioactivity [34]. Extracts from Hapalosiphon strains containing hapalindole A and hapalindole B were shown to inhibit the growth of the cyanobacterium Anabaena. Both compounds also demonstrated antifungal activity [34]. Several hapalindole analogues have also been reported to possess antialgal or antifungal activity. Many of the ambiguine and fischerindole analogues also have reported antibacterial and antifungal activity [41, 44]. A hapalindole-producing Fischerella strain, isolated from a freshwater lake in Florida, was shown to inhibit the growth of several cyanobacteria and the green alga Chlamydomonas [20], although the inhibition of cyanobacterial and algal growth reported by this strain has not been attributed directly to the hapalindoles [20]. Other bioactivities reported for the hapalindoles include antibacterial activity. In fact, 12-Epi-Hapalindole E isonitrile has been shown to specifically inhibit bacterial RNA synthesis and consequently protein synthesis. Unfortunately due to the low levels of production of many analogues by the cyanobacteria, many have not been tested for their bioactivity. The hapalindole family would represent a great opportunity to perform structure activity relationship studies which could be a possibility for future research.
The bioactivity of the welwitindolinones sparked the greatest interest amongst the natural product community. While welwitindolinone A displays antifungal activity, N-methylwelwitindolinone C isothiocyanate was shown to reverse P-glycoprotein-mediated multiple drug resistance in tumour cells [43, 46]. The biological activity of the welwitindolinones, which have been shown to reverse multiple drug resistance in cancerous tumours, can be dramatically enhanced through small modifications to the structures of these molecules [43, 53]. Comparative analysis of the bioactivity of three naturally occurring welwitindolinone analogues identified that the isothiocyanate functional group is required for activity, while the isonitrile analogue has no activity in vitro. The desmethyl isothiocyanate isoform (known as welwistatin) is also able to disrupt microtubule structure in cultured cancer cell lines further increasing its efficacy as an anticancer agent [53].
The ecological function of these metabolites in the environment is not well understood, however, due to the diversity of their activity, there is a strong interest in the allelopathic nature of these molecules [6, 20]. In general, natural products may act as chemical defences, mediating predator-prey and competitive interactions [39]. Alternatively, they may enhance favourable symbiotic relationships. The structural diversity of natural products isolated from nature may be a reflection of the constant evolutionary pressure in a competitive environment to create new chemical defences. The insecticidal activity reported for the hapalindoles [6] may suggest these molecules exist as a feeding deterrent, while the antifungal, antialgal and antibacterial effects may inhibit the growth of other microorganisms. However, in all cases, it is unknown if the concentration of these molecules in the environment is potent enough to generate the allelopathic effects detected in culture. What is curious about the hapalindole family of molecules is the frequency in which they are identified from new isolates of Group 5 cyanobacteria suggesting an evolutionary advantage.
Hapalindole Family of Cyanobacterial Natural Products … 437
POTENTIAL FOR BIOENGINEERING OF HAPALINDOLES Despite the plethora of bioactive compounds isolated from cyanobacteria, few gene
clusters associated with cyanobacterial pathways have been manipulated through the use of genetic technologies to modify the structure of cyanobacterial natural products and analyse changes in bioactivities. A number of studies in actinomycetes have already revealed ways in which bioengineering can be utilised to further enhance the structural diversity of bioactive small molecules [2, 14, 48, 49]. This can be achieved by using in vitro approaches that utilise enzymes as biocatalysts in chemical synthesis, as well as in vivo approaches, such as combinatorial biosynthesis.
There is significant interest in the manipulation of a hapalindole biosynthetic cluster for a number of reasons. Firstly, to date, all cyanobacteria found to produce hapalindoles produce an array of analogues which can be difficult to isolate from the culture in significant quantities for bioactivity testing. Of those that have been tested, many have differing bioactivities, depending on the structure, as described above. Secondly, the hapalindole biosynthetic gene cluster is proposed to encode biosynthetic enzymes which are small (in comparison with the large multifunctional enzyme family), and thus easy to manipulate by PCR, and do not require unusual substrates or posttranslational modification. Therefore, the hapalindole biosynthetic pathway, consisting of monofunctional enzymes can be co-expressed in a heterologous host strain to generate the hapalindoles from endogenous substrates. Through the addition or removal of genes on the heterologous expression plasmid, biosynthesis can be directed to a particular isoform. For example, by including a welwitindolinone N-methyltransferase into the expression host, a methylated isoform could be generated. Alternatively they may be heterologously expressed and purified individually, and then used in concert for in vitro chemoenzymatic synthesis. The advantage of using purified enzymes for chemoenzymatic syntheses is that in addition to native substrates, non-native substrates may also be added to the enzymatic assay to determine the substrate specificity of the enzyme. As an example, prenyltransferases appear to have relaxed substrate specificity. Studies with the Streptomyces aromatic polyketide prenyltransferases and fungal indole prenyltransferases have demonstrated the versatility of substrates that these enzymes are able to prenylate [28, 29, 45]. The degree of relaxed substrate specificity for a variety of enzymes within the hapalindole pathway could be tested, resulting in the biosynthesis of yet undiscovered hapalindole analogues.
CONCLUSION This chapter has reviewed the current state-of-play in the growing field of hapalindole
research. It is evident that this class of natural products, exclusive to the Group 5 cyanobacteria, have significant novelty both in their structure and biosynthesis. Furthermore, although additional work is needed to attribute bioactivities to some hapalindoles, several novel activities have been identified, in addition to speculation of potential ecological roles. Finally, the significant potential of hapalindole bioengineering may result in the production of novel products of even greater activity and specificity.
M.C. Moffitt and B.P. Burns 438
REFERENCES
[1] Asthana, R. K., A. Srivastava, A. P. Singh, Deepali, S. P. Singh, G. Nath, R. Srivastava, and Srivastava, B.S. (2006). Identification of an antimicrobial entity from the cyanobacterium Fischerella sp. isolated from bark of Azadirachta indica (Neem) tree. J. Appl. Phycol. 18, 33-39.
[2] Baltz, R. H. (2006). Molecular engineering approaches to peptide, polyketide and other antibiotics. Nat. Biotechnol. 24, 1533-40.
[3] Baran, P. S., T. J. Maimone, and Richter, J.M. (2007). Total synthesis of marine natural products without using protecting groups. Nature. 446, 404-8.
[4] Baran, P. S., & Richter, J.M. (2004). Direct coupling of indoles with carbonyl compounds: short, enantioselective, gram-scale synthetic entry into the hapalindole and fischerindole alkaloid families. J. Am. Chem. Soc. 126:7450-1.
[5] Baudoux, J., A. J. Blake, and N. S. Simpkins, N.S. (2005). Rapid access to the welwitindolinone alkaloid skeleton by cyclization of indolecarboxaldehyde substituted cyclohexanones. Org. Lett. 7, 4087-9.
[6] Becher, P. G., S. Keller, G. Jung, R. D. Suessmuth, and Juettner, F. (2007). Insecticidal activity of 12-epi-hapalindole J isonitrile. Phytochemistry (Elsevier) 68, 2493-2497.
[7] Bornemann, V., G. M. Patterson, and Moore, R.E. (1988). Isonitrile biosynthesis in the cyanophyte Hapalosiphon fontinalis. J. Am. Chem. Soc. 110, 2339-40.
[8] Brady, S. F., & Clardy, J. (2005). Cloning and heterologous expression of isocyanide biosynthetic genes from environmental DNA. Angew. Chem. Int. Ed. Engl. 44, 7063-5.
[9] Brady, S. F., & Clardy, J. (2005). Systematic investigation of the Escherichia coli metabolome for the biosynthetic origin of an isocyanide carbon atom. Angew .Chem. Int. Ed. Engl. 44, 7045-8.
[10] Butler, A., and Carter-Franklin, J.N. (2004). The role of vanadium bromoperoxidase in the biosynthesis of halogenated marine natural products. Nat. Prod. Rep. 21, 180-8.
[11] Cadel-Six, S., C. Dauga, A. M. Castets, R. Rippka, C. Bouchier, N. Tandeau de Marsac, and Welker, M. 2008. Halogenase genes in nonribosomal peptide synthetase gene clusters of Microcystis (cyanobacteria): sporadic distribution and evolution. Mol. Biol. Evol. 25, 2031-41.
[12] Cane, D. E., & Walsh, C.T. (1999). The parallel and convergent universes of polyketide synthases and nonribosomal peptide synthetases. Chem. Biol. 6, R319-25.
[13] Cardellina, J. H., 2nd, F. J. Marner, and Moore, R.E. (1979). Seaweed dermatitis: structure of lyngbyatoxin A. Science. 204, 193-5.
[14] Clardy, J., & Walsh, C. (2004). Lessons from natural molecules. Nature. 432, 829-37. [15] Doan, N. T., R. W. Rickards, J. M. Rothschild, and Smith, G.D. (2000). Allelopathic
actions of the alkaloid 12-epi-hapalindole E isonitrile and calothrixin A from cyanobacteria of the genera Fischerella and Calothrix. J. Appl. Phycol. 12, 409-416.
[16] Edwards, D. J., & Gerwick, W.H. (2004). Lyngbyatoxin biosynthesis: sequence of biosynthetic gene cluster and identification of a novel aromatic prenyltransferase. J. Am. Chem. Soc. 126, 11432-3.
[17] Etchegaray, A., E. Rabello, R. Dieckmann, D. H. Moon, M. F. Fiore, H. von Doehren, S. M. Tsai, and Neilan, B.A. (2004). Algicide production by the filamentous cyanobacterium Fischerella sp. CENA 19. J. Appl. Phycol. 16, 237-243.
Hapalindole Family of Cyanobacterial Natural Products … 439
[18] Fujimori, D. G., S. Hrvatin, C. S. Neumann, M. Strieker, M. A. Marahiel, and Walsh, C.T. 2007. Cloning and characterization of the biosynthetic gene cluster for kutznerides. Proc. Natl. Acad. Sci. U. S. A. 104, 16498-503.
[19] Gademann, K., & Portmann, C. (2008). Secondary metabolites from cyanobacteria: complex structures and powerful bioactivities. Current Organic Chem. 12, 326-341.
[20] Gantar, M., J. P. Berry, S. Thomas, M. Wang, R. Perez, and Rein, K.S. (2008). Allelopathic activity among cyanobacteria and microalgae isolated from Florida freshwater habitats. FEMS Microbiol. Ecol. 64, 55-64.
[21] Garson, M. J. (1986). Biosynthesis of the novel diterpene isonitrile diisocyanoadociane by a marine sponge of the Amphimedon genus: incorporation studies with sodium cyanide-14C and sodium acetate-2-14C. Journal of the Chemical Society, Chemical Communications, 35-6.
[22] Grundmann, A., & Li, S.M. (2005). Overproduction, purification and characterization of FtmPT1, a brevianamide F prenyltransferase from Aspergillus fumigatus. Microbiology. 151, 2199-207.
[23] Harrigan, G. G., H. Luesch, W. Y. Yoshida, R. E. Moore, D. G. Nagle, V. J. Paul, S. L. Mooberry, T. H. Corbett, and Valeriote, F.A. (1998). Symplostatin 1: A dolastatin 10 analogue from the marine cyanobacterium Symploca hydnoides. J. Nat. Prod. 61, 1075-7.
[24] Herbert, R. B., and Mann, J. (1984). The incorporation of C1 units in the biosynthesis of tuberin and xanthocillin. Journal of the Chemical Society, Chemical Communications. 1474-5.
[25] Huber, U., R. E. Moore, and Patterson, G.M. (1998). Isolation of a nitrile-containing indole alkaloid from the terrestrial blue-green alga Hapalosiphon delicatulus. J. Nat. Prod. 61, 1304-6.
[26] Kinsman, A. C., and Kerr, M.A. 2001. Total synthesis of (+/-)-hapalindole Q. Org. Lett. 3, 3189-91.
[27] Kleinkauf, H., & Von Dohren, H. (1996). A nonribosomal system of peptide biosynthesis. Eur. J. Biochem. 236, 335-51.
[28] Kumano, T., B. Richard Stephane, P. Noel Joseph, M. Nishiyama, and Kuzuyama, T. (2008). Chemoenzymatic syntheses of prenylated aromatic small molecules using Streptomyces prenyltransferases with relaxed substrate specificities. Bioorganic Med. Chem. 16, 8117-26.
[29] Kuzuyama, T., J. P. Noel, and Richard, S.B. (2005). Structural basis for the promiscuous biosynthetic prenylation of aromatic natural products. Nature. 435, 983-7.
[30] Luesch, H., W. Y. Yoshida, R. E. Moore, and Paul, V.J. (1999). Lyngbyastatin 2 and norlyngbyastatin 2, analogues of dolastatin G and nordolastatin G from the marine cyanobacterium Lyngbya majuscula. J. Nat. Prod. 62, 1702-1706.
[31] Marahiel, M. A., T. Stachelhaus, and Mootz, H.D. (1997). Modular Peptide Synthetases Involved in Nonribosomal Peptide Synthesis. Chemical Reviews. (Washington, D. C.) 97:2651-2673.
[32] Mitchell, S. S., D. J. Faulkner, K. Rubins, and Bushman, F.D. (2000). Dolastatin 3 and two novel cyclic peptides from a palauan collection of Lyngbya majuscula. J. Nat. Prod. 63, 279-82.
[33] Moore, R. E. (1996). Cyclic peptides and depsipeptides from cyanobacteria: a review. J. Ind. Microbiol. 16, 134-43.
M.C. Moffitt and B.P. Burns 440
[34] Moore, R. E., C. Cheuk, and Patterson, G.M.L. (1984). Hapalindoles: new alkaloids from the blue-green alga Hapalosiphon fontinalis. J. Am. Chem. Soc. 106, 6456-7.
[35] Moore, R. E., C. Cheuk, X. Q. G. Yang, G. M. Patterson, R. Bonjouklian, T. A. Smitka, J. S. Mynderse, R. S. Foster, N. D. Jones, J. K. Swartzendruber, and Deeter, J.B. (1987). Hapalindoles, antibacterial and antimycotic alkaloids from the cyanophyte Hapalosiphon fontinalis. J. Org. Chem. 52, 1036-43.
[36] Namikoshi, M., &, Rinehart, K.L. (1996). Bioactive compounds produced by cyanobacteria. J. Indust. Microbiol. Biotech. 17, 373-384.
[37] Panda, D., K. DeLuca, D. Williams, M. A. Jordan, and Wilson, L. (1998). Antiproliferative mechanism of action of cryptophycin-52: kinetic stabilization of microtubule dynamics by high-affinity binding to microtubule ends. Proc. Natl. Acad. Sci. U. S. A. 95, 9313-8.
[38] Park, A., R. E. Moore, and Patterson, G.M.L. (1992). Fischerindole L, a new isonitrile from the terrestrial blue-green alga Fischerella muscicola. Tetrahedron Lett. 33, 3257-60.
[39] Paul, V. J., & Puglisi, M.P. (2004). Chemical mediation of interactions among marine organisms. Nat. Prod. Rep. 21, 189-209.
[40] Puar, M. S., H. Munayyer, V. Hedge, B. K. Lee, and Waitz, J.A. (1985). The biosynthesis of hazimicins: possible origin of isonitrile carbon. J Antibio 38, 530-2.
[41] Raveh, A., & Carmeli, S. (2007). Antimicrobial ambiguines from the cyanobacterium Fischerella sp. collected in Israel. J. Nat. Prod. 70, 196-201.
[42] Smith, C. D., X. Zhang, S. L. Mooberry, G. M. Patterson, and Moore, R.E. (1994). Cryptophycin: a new antimicrotubule agent active against drug-resistant cells. Cancer Res. 54, 3779-84.
[43] Smith, C. D., J. T. Zilfou, K. Stratmann, G. M. Patterson, and Moore, R.E. (1995). Welwitindolinone analogues that reverse P-glycoprotein-mediated multiple drug resistance. Mol. Pharmacol. 47, 241-7.
[44] Smitka, T. A., R. Bonjouklian, L. Doolin, N. D. Jones, J. B. Deeter, W. Y. Yoshida, M. R. Prinsep, R. E. Moore, and Patterson, G.M. (1992). Ambiguine isonitriles, fungicidal hapalindole-type alkaloids from three genera of blue-green algae belonging to the Stigonemataceae. J. Org. Chem. 57, 857-61.
[45] Steffan, N., I. A. Unsoeld, and Li, S-M. (2007). Chemoenzymatic synthesis of prenylated indole derivatives by using a 4-dimethylallyltryptophan synthase from Aspergillus fumigatus. Chem. Bio. Chem. 8, 1298-1307.
[46] Stratmann, K., D. L. Burgoyne, R. E. Moore, G. M. Patterson, and Smith, C.D. (1994). Hapalosin, a cyanobacterial cyclic depsipeptide with multidrug-resistance reversing activity. J. Org. Chem. 59, 7219-7226.
[47] Stratmann, K., R. E. Moore, R. Bonjouklian, J. B. Deeter, G. M. Patterson, S. Shaffer, C. D. Smith, and Smitka, T.A. (1994). Welwitindolinones, unusual alkaloids from the blue-green algae Hapalosiphon welwitschii and Westiella intricata. Relationship to fischerindoles and hapalindoles. J. Am. Chem. Soc. 116,9935-42.
[48] Walsh, C. T. (2006). Chemical biology: a sweet exchange. Nature. 443, 285-6. [49] Walsh, C. T. (2002). Combinatorial biosynthesis of antibiotics: challenges and
opportunities. Chembiochem. 3, 125-34.
Hapalindole Family of Cyanobacterial Natural Products … 441
[50] Wilson, B. J., D. T. Yang, and Harris, T.M. (1973). Production, isolation, and preliminary toxicity studies of brevianamide A from cultures of Penicillium viridicatum. Appl. Microbiol. 26, 633-5.
[51] Winter, J. M., M. C. Moffitt, E. Zazopoulos, J. B. McAlpine, P. C. Dorrestein, and Moore, B.S. 2007. Molecular basis for chloronium-mediated meroterpene cyclization: cloning, sequencing, and heterologous expression of the napyradiomycin biosynthetic gene cluster. J. Biol. Chem. 282, 16362-8.
[52] Zapf, S., M. Hossfeld, H. Anke, R. Velten, and Steglich, W. (1995). Darlucins A and B, new isocyanide antibiotics from Sphaerellopsis filum (Darluca filum). J. Antibio. 48, 36-41.
[53] Zhang, X., & Smith, C.D. (1996). Microtubule effects of welwistatin, a cyanobacterial indolinone that circumvents multiple drug resistance. Mol. Pharmacol. 49, 288-94.
Reviewed by Francesco Pomati (Swiss Federal Institute of Aquatic Science and
Technology)

In: Handbook on Cyanobacteria ISBN: 978-1-60741-092-8 Editors: P. M. Gault and H. J. Marler © 2009 Nova Science Publishers, Inc.
Chapter 15
A PRELIMINARY SURVEY OF THE ECONOMICAL VIABILITY OF LARGE-SCALE PHOTOBIOLOGICAL
HYDROGEN PRODUCTION UTILIZING MARICULTURE-RAISED CYANOBACTERIA*
Hidehiro Sakurai*1,3, Hajime Masukawa1,2 and Kazuhito Inoue1,2
1 Research Institute for Photobiological Hydrogen Production 2 Department of Biological Sciences, Kanagawa University,
2946 Tsuchiya, Hiratsuka, Kanagawa, 259-1293, Japan 3 School of Education, Waseda University, Nishiwaseda 1,
Shinjuku, Tokyo 169-8050, Japan
ABSTRACT
This paper briefly examines the future prospects for the economical viability of large-scale renewable energy production using maricultured cyanobacteria. In order to reduce CO2 emissions from burning fossil fuels in appreciable amounts, the replacement energy source will by necessity be substantial in scale. Solar energy is the most likely candidate because the amount of solar energy received on the Earth's surface is vast and exceeds the anthropogenic primary energy use by more than 6,000 times. Although solar energy is abundant, its economical utilization is not straightforward because the intensity received on the surface of the earth is relatively low. Current research and development efforts are focused on the production of biofuels as renewable, economical feasible energy sources from the land biomass. We propose, however, for reasons of scale and to minimize further environmental harm, that the utilization of the sea surface is a more viable alternative to land biomass exploitation. The sea surface area available for energy production far exceeds available cropland and use of the sea will not take valuable
* Cross Publication (Version 2, partly revised in June, 2009): The paper was excerpted from New Research on
Energy Economics (eds. P. G. Caldwell and E. V. Taylor), Nova Science Publisher (2008). The original paper was accepted for publication in November, 2007..
** Correspondence to: Hidehiro Sakurai; E-mail: [email protected]; Tel: +81-463-59-4111; Fax: +81-463-58-9684; Mailing address: Research Institute for Photobiological Hydrogen Production, Kanagawa University, Tsuchiya 2946; Hiratsuka, Kanagawa 259-1293, Japan
Hidehiro Sakurai, Hajime Masukawa and Kazuhito Inoue 444
cropland out of food production. Our current R & D strategy utilizes photosynthesis and the nitrogenase enzyme of cyanobacteria. The biological basis of relevant energy metabolism in cyanobacteria is briefly described. A model for future H2 production systems is presented, and a very rough trial calculation of the cost of photobiological H2 production is made in the hope that it may help the readers recognize the possibilities of large-scale H2 production and understand the need for the research and development.
Keywords: cyanobacteria economical viability hydrogen production mariculture nitrogenase solar energy conversion.
1. INTRODUCTION
1.1. Our Need for Developing Large-Scale Renewable Energy Sources
1.1.1. Climate Change At the onset of the first oil crisis in the fall of 1973, many renewable biological energy
sources were considered as alternatives to fossil fuels (Gibbs et al., 1973; Lien & San Pietro, 1975). The crisis was short-lived, as the supply of oil by OPEC was largely uninterrupted, and investors as well as the oil-consuming public lost interest in exploring renewable energy sources during the subsequent two to three decades. More recently, there has been a renewed recognition of the need for the development of solar energy as a result of concerns about the looming shortage of oil supplies and more importantly the global climate change caused by burning fossil fuels.
Recognizing the environmental risks brought about by ever-increasing concentrations of atmospheric greenhouse gasses (GHGs), most notably CO2, the United Nations adopted the Framework Convention on Climate Change (UNFCCC) in 1992, and the Convention entered into force in March 1994. In the Convention, the signatory nations stated their commitment to protect the climate for the benefit of present and future generations (UNFCCC, 2007). In spite of this and other efforts of the international community to cut CO2 emissions, including adoption of the Kyoto Protocol, UNFCCC, there is still no established world-wide framework for stabilizing the atmospheric concentration of greenhouse gasses at the levels required for preventing further dangerous anthropogenic interference with the global climate system.
In April 2007, R.K. Pachauri, the chairman of the IPCC (Intergovernmental Panel on Climate Change) spoke at the Sessions of the Subsidiary Bodies, UNFCCC, where he stated that, “Most of the observed increase in globally averaged temperatures since the mid-20th century is very likely due to the observed increase in anthropogenic greenhouse gas concentrations” (IPCC, 2007a). Likewise, the 4th IPCC Assessment Report (IPCC, 2007b) states: “The primary source of the increased atmospheric concentration of carbon dioxide since the pre-industrial period results from fossil fuel use, with land-use change providing another significant but smaller contribution. Annual fossil carbon dioxide emissions increased from an average of 6.4 GtC (23.5 GtCO2) per year in the 1990s to 7.2 GtC (26.4 GtCO2) per year in 2000–2005. Carbon dioxide emissions associated with land-use change are estimated to be 1.6 GtC (5.9 GtCO2) per year over the 1990s. The global atmospheric concentration of carbon dioxide has increased from a pre-industrial value of about 280 ppm to 379 ppm in 2005. The annual carbon dioxide concentration growth rate was larger during the last 10 years
A Preliminary Survey of the Economical Viability of Large-Scale … 445
(1995–2005 average: 1.9 ppm per year), than it has been since the beginning of continuous direct atmospheric measurements (1960–2005 average: 1.4 ppm per year)”
1.1.2. Essential CO2 Emission Reductions
The ICPP Report (IPCC, 2007c) predicts that in order to stabilize the atmospheric CO2 concentration at 535-590 (about 560) ppm, a level about twice that of the pre-industrial value, we must begin reducing CO2 emissions by 2010–2030. Although there is considerable uncertainty in the estimates, one scenario predicts that we must limit the CO2 emission from at least 50% of the 2000 level by the end of the century (2100). Less optimistic estimates require limiting CO2 emissions to 0% of the 2000 level or even more drastically, require removal of CO2 from the atmosphere (negative emissions) using technologies such as carbon capture and storage in the future. Even if we succeed in stabilizing the CO2 concentration at about 560 ppm, the global mean temperature will increase above the pre-industrial mean temperature by about 2.3–4.8 °C, at equilibrium.
The International Energy Agency (IEA, 2007b) predicts in a Reference Scenario of World Energy Outlook 2007, that global primary energy demand will increase by 55% between 2005 and 2030, at an average annual rate of 1.8% per year, in the absence of new government measures to alter underlying energy trends.
Although there has been a steadily growing consensus in the world community that CO2 emissions must be reduced, there has yet to be commitment to a global strategy for attaining CO2 emission reductions at any level.
1.2. Estimate of Potential of Renewable Energy Production from Land Biomass
Biomass products such as wood, grass, and foodstuffs are considered to be sources of
renewable energy, because of their capacity to capture CO2 by photosynthesis as they grow, even though they ultimately emit CO2 when they are used for energy production. According to the IEA BIOENERGY Report (IEA, 2007a), current global energy supplies are dominated by fossil fuels (388 EJ (EJ: 1018 J) per year), with biomass providing about 45 ± 10 EJ. On average, biomass contributes less than 10% to the total energy supply in industrialized countries, but the proportion is as high as 20–30% in developing countries. If the world community achieves a large-scale deployment of bioenergy technologies by the year 2050, the average energy production potential for biomass is estimated to be from 40 to 1100 EJ. In this case, the lowest estimate is based on the most pessimistic scenario of no additional farmland being available for energy production and with the biomass coming solely from traditional crop residues. Under the most optimistic scenario, higher levels of energy production from biomass could be achieved under well-managed, intensive agriculture concentrated on the best quality soils. Necessary management practices would include energy farming on current agricultural land, biomass production on marginal lands, and energy capture from other agricultural sources including forest residues, manure, and organic waste. Overall, the estimated range of the plausible potential for biomass energy production is 200 – 400 EJ.
Even with state-of-the-art biomass energy conversion technologies, the potential of bioenergy seems to be limited by the availability of fertile land and water. Furthermore, the
Hidehiro Sakurai, Hajime Masukawa and Kazuhito Inoue 446
destruction of forests to attain more arable land will result in the emission of even more CO2 as the photosynthetic, CO2-capturing and storing capacity of the forest is lost and ultimately organic substances stored in the forest soils decompose.
Under realistic scenarios, we cannot expect great amounts of additional energy to be produced from crops grown on land, as the world’s primary energy consumption is vast and amounts to about 20 times of the digestive energy available from food (see, Sakurai & Masukawa, 2007). If the entire amount of cropland in the U. S. (about 400 million hectares) were used to produce corn solely for ethanol, there would still not be enough fuel to fulfill the 1990 level of U.S. gasoline consumption (estimated to be less than 90% of gasoline by Kheshgi et al. (2000)). According to the forecast of an energy analyst (T. Ueda, Toyota Motors Co.), the percentage of energy available in bioethanol as a motor fuel (currently about 1.8%) will make it a challenging energy source to use to achieve the goal of meeting 10% of the world gasoline consumption by 2020 (presentation at the 2006 Annual Meeting of the Japan Institute of Energy, 2006 August). Considering that motor fuels comprise roughly a quarter of fossil fuel energy consumption, using motor fuel blends of gasoline with ethanol of 10% in energy (about 16% in volume) would result in only about a 2–3% reduction of the current level of world fossil fuel consumption.
2. OUR PROPOSALS FOR LARGE-SCALE PHOTOBIOLOGICAL H2 PRODUCTION
2.1. Outlines of Our Proposal
We will first describe an outline of our proposal in this section, followed by more
detailed descriptions in the following sections. We present here information needed to evaluate the prospects of photobiological H2 production capitalizing on the nitrogenase enzyme of mariculture-raised cyanobacteria. In proposing this system, we do not intend to criticize other systems including the hydrogenase-based system.
We have proposed nitrogenase-based photobiological production of H2 using maricultured cyanobacteria (also called blue-green algae or cyanophytes), because we believe such systems have the potential to produce renewable energy of a scale large enough to meet much of the world-wide energy demand (Sakurai & Masukawa, 2007). We have chosen H2 as the product of solar energy conversion processes, because H2 is considered to be an ideal fuel for the following reasons: 1) when used as a fuel, in contrast with oils and coals that emit SOx, CO2, and sometimes soot during combustion, H2 does not pollute the environment as the by-product of its production is water, 2) in contrast with electricity generated by photovoltanics, H2 is easily stored and transported, 3) H2 is expected to be directly used as an energy source of fuel cells (Levin et al., 2004; Mertens & Liese, 2004) in the near future.
2.2. The Prospects of Economically-Feasible Large-Scale H2 Production Our proposal for promoting the R & D of mariculture-based economical large-scale solar
energy conversion is based on the following premises (table 1).
A Preliminary Survey of the Economical Viability of Large-Scale … 447
Table 1. Prospects of photobiological H2 production
A. The amount of solar energy received on the Earth's surface is huge: exceeds the anthropogenic primary energy use by more than 6,000 times
B. Expected whole sale: around $1.5-30 (interim target) m-2 yr-1 (The total cost of production of bio-solar energy should meet these economical constraints)
Assumptions 1) Solar energy received on the surface of the earth: about 1,500 kWh m-2 yr-1 for the middle
latitude regions 2) The amount of renewable energy produced per unit area: about 15-30 kWh m-2 yr-1 (with
bio-solar energy conversion efficiency of at 1% (our interim target) -2% (future target)) 3) The sale price of the renewables at 10-100 cents kWh-1
C. Grounds for future economical production at 10-100 cents kWh-1: 1) The solar energy conversion efficiencies of 0.25-0.3% into the final commodities (corn
grains) in U.S.A. (our interim target: 1% efficiency) 2) The price of corn (Chicago) has been in the range of 8-21 cents kg-1 or about 1.8-5.1 cents
kWh-1 in the past ten years (1997-2006) (lower than our target price)
2.3. Scale of Production In identifying photobiological H2 production R & D strategies, we must first calculate the
final production scale required for meaningful reduction of CO2 emissions. According to the report of the International Energy Agency (IEA, 2007a), the total
current (2004) commercial energy use amounts to some 467 EJ per year, of which fossil fuels account for 388 EJ per year. The total solar radiation received on the earth’s surface is about 2.7 x 10⁶ EJ per year (see Sakurai & Masukawa, 2007) (the value of 3.9 x 10⁶ EJ per year theoretical potential as described in the above report, possibly including energy absorbed by the atmosphere). In order to replace 10% of the 2004 level of commercial energy use (38.8 EJ) by H2-based energy production systems, according to our proposal, the sea surface area required for the production is roughly calculated to be 1.1 x 10⁶ km2 (about the same size as the country of Bolivia, or about twice that of France, for example).
Assumptions used for the sea surface area calculation: 1. Total solar radiation: 2.7 x 10⁶ EJ per year, which leads to 5.3 x 10⁹ J m-2 year-1
(1,680 kWh m-2 year-1 or 14.5 MJ m-2 day-1) on average. 2. Cyanobacteria photobiologically produce H2 at 1% efficiency (our interim target) vs.
total solar radiation (5.3 x 10⁷ J m-2 year-1). 3. Finally available H2 energy: two thirds of biologically produced H2 energy,
consuming one third needed for harvesting, purification, storage, and transportation to land (2.65 x 10⁷ J m-2 year-1, in the final product).
4. Area required: 38.8 x 10¹⁸/(2.65 x 107) = 1.46 x 10¹² (m2) (= 1.46 x 10⁶ km2) The required sea surface is extremely vast. Considering that a crop farmer in the U.S.A.
needs several hundred ha (several km2) of farmland for living even with a subsidy by the government, the area used by any company or organization for photobiological H2 production
Hidehiro Sakurai, Hajime Masukawa and Kazuhito Inoue 448
should be much larger than several km2. If the size of the bioreactor is 25 m in width and 200 m in length (0.5 ha), for example, 200 bioreactors are required for 1 km2, and 2.2 x 10⁸ bioreactors in order to replace 10% of the 2004 level of commercial energy use.
2.4. Outline of a Plausible General Scheme for Photobiological H2 Production and Utilization
Most of the technologies required for large-scale photobiological H2 production by
cyanobacteria and subsequent utilization of H2 are still in the beginning stages of development. Acknowledging that there are a lot of uncertainties, we will briefly present a plausible general scheme for future production so that the readers may understand the research and development strategies needed to develop H2-based energy production systems (figure 1).
Figure 1. General scheme for photobiological H2 production and utilization. The substrate (raw materials) of H2 is water. CO2 is required for growth and maintenance of the cyanobacteria cells and once the culture is established, its re-addition is unnecessary because it is recycled in the bioreactor.
Process A: Photobiological H2 Production by Cyanobacteria
Some of cyanobacteria produce H2 by photosynthetic activities with sunlight as the sole source of energy (see below). The substrate is water and products are H2 and O2. The cyanobacterial culture medium (fresh water or sea water) is simple in composition and contains mineral nutrients, and the gas phase in the bioreactor is Ar plus low concentrations of CO2 and N2. After the initial stage of cell growth, further supply of CO2 is not necessary, because it is recycled in the bioreactor (figure 2A).
The remaining biological waste (cells) can be recycled as fish feed (Murray & Mitsui, 1982).
Some areas of calm sea (such as inland seas) and ocean (the calm belts, e.g. the doldrums near the equator and the horse latitudes of about 30° north or south as exemplified by the “Mysterious Bermuda triangle”) seem to be especially suited for such large-scale mariculture in inexpensive plastic bags. From simulations of sea movement, observations of floating marine debris accumulation, and by taking into account the surface currents consisting of
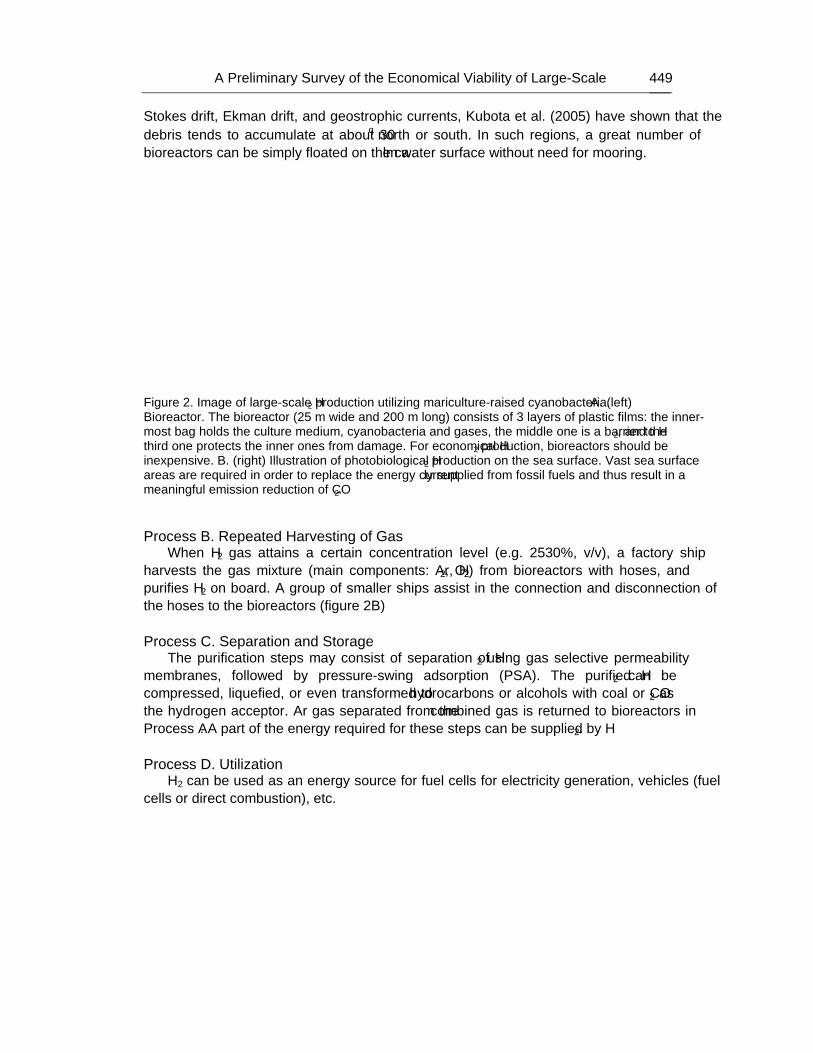
A Preliminary Survey of the Economical Viability of Large-Scale … 449
Stokes drift, Ekman drift, and geostrophic currents, Kubota et al. (2005) have shown that the debris tends to accumulate at about 30° north or south. In such regions, a great number of bioreactors can be simply floated on the calm water surface without need for mooring.
Figure 2. Image of large-scale H2 production utilizing mariculture-raised cyanobacteria. A. (left) Bioreactor. The bioreactor (25 m wide and 200 m long) consists of 3 layers of plastic films: the inner-most bag holds the culture medium, cyanobacteria and gases, the middle one is a barrier to H2, and the third one protects the inner ones from damage. For economical H2 production, bioreactors should be inexpensive. B. (right) Illustration of photobiological H2 production on the sea surface. Vast sea surface areas are required in order to replace the energy currently supplied from fossil fuels and thus result in a meaningful emission reduction of CO2.
Process B. Repeated Harvesting of Gas
When H2 gas attains a certain concentration level (e.g. 25–30%, v/v), a factory ship harvests the gas mixture (main components: Ar, H2, O2) from bioreactors with hoses, and purifies H2 on board. A group of smaller ships assist in the connection and disconnection of the hoses to the bioreactors (figure 2B)
Process C. Separation and Storage
The purification steps may consist of separation of H2 using gas selective permeability membranes, followed by pressure-swing adsorption (PSA). The purified H2 can be compressed, liquefied, or even transformed to hydrocarbons or alcohols with coal or CO2 as the hydrogen acceptor. Ar gas separated from the combined gas is returned to bioreactors in Process A. A part of the energy required for these steps can be supplied by H2.
Process D. Utilization
H2 can be used as an energy source for fuel cells for electricity generation, vehicles (fuel cells or direct combustion), etc.
Hidehiro Sakurai, Hajime Masukawa and Kazuhito Inoue 450
3. BASIS OF BIOLOGICAL PROCESS
3.1. Choice of O2 Evolving Photosynthetic Organisms Many photosynthetic bacteria (e.g. purple bacteria, green sulfur bacteria) can convert
solar energy into H2. They cannot use H2O as the electron donor and require organic compounds or sulfur compounds as the source of electrons for H2 evolution (Rao and Cammack, 2001, Das and Veziroglu 2001), and the amount of the resource (electron donors) is limited. For large-scale photobiological H2 production, the candidate microorganisms must use H2O as the electron donor, thus narrowing the possibilities to cyanobacteria and eukaryotic microalgae (Rao & Cammack 2001; Prince & Kheshgi, 2005; Kruse et al., 2005; Sakurai & Masukawa, 2007).
3.2. Research Efforts Involving Photobiological H2 Production by Using Naturally Selected Oxygen-Evolving Organisms
At the beginning of the oil crisis in the 1970s, tapping into alternative bio-solar energy
production systems, including H2 production was widely considered (Gibbs et al., 1973, Lien & San Pietro, 1975), but the enthusiasm of scientific community lasted for a relatively short period around 1975. During the two to three decades that followed the oil crisis, while our society paid little attention to the development of bio-solar energy conversion, some researchers still eagerly pursued the possibility of photobiological H2 production. For example, Hallenbeck et al. (1978) found that some outdoor cultures of cyanobacteria were able to produce H2 for more than 25 days under a constant stream of Ar-1% N2-0.3% CO2. Mitsui et al. (1983) collected a large number of photosynthetic microorganisms from natural environments (mostly from the Caribbean Sea), and found that some cyanobacteria (e.g. Oscillatoria sp. strain Miami BG7) were able to produce H2 under continuous illumination. The advances in research up to the middle 1990s in cyanobacteria as solar energy convertors were summarized (Hall et al. 1995). In order to improve H2 productivity, a coiled tubular bioreactor was constructed (Tsygankov et al. 2002). When cyanobacteria use H2O as the terminal electron donor for H2 production, O2 is concomitantly produced and may inhibit H2 accumulation by reoxidizing H2 through the activities of hydrogenase and the respiratory chain terminal oxidase. In order to prevent reoxidation of H2 by O2, a continuous flow of inert gas (lift gas) was employed in many of the above experiments. Some cyanobacterial strains obtained from natural habitats (Mitsui et al., 1983; Kumazawa & Mitsui, 1994; Kumazawa & Asakawa, 1995) and some generated by random chemical mutagenesis (Mikheeva et al., 1995) seem to be largely deficient in H2 uptake activity, and were found to be suitable for photobiological H2 production catalyzed by nitrogenase. These findings were important for demonstrating the potential for photobiological H2 production using oxygen-evolving photosynthetic microorganisms along with some technological refinements.
A Preliminary Survey of the Economical Viability of Large-Scale … 451
3.3. The Enzymes of H2 Evolution The enzymes that can be used for H2 production are either hydrogenase or nitrogenase
(Review: Rao and Cammack, 2001; for cyanobacteia: Tamagnini et al. 2002). Hydrogenases that catalyze virtually unidirectional H2 uptake are called uptake hydrogenases (Hup), and are not suitable for H2 production. Hydrogenases that catalyze both production and uptake of H2 are called reversible or bidirectional hydrogenases and can be used for H2 production. Some species of eukaryotic microalgae and cyanobacteria have reversible hydrogenases and the reaction partners of these hydrogenases are ferredoxin, flavodoxin, and/or NAD(P)+/NAD(P)H:
2 H+ + 2 e- (reduced ferredoxin, reduced flavodoxin, or NAD(P)H) ↔ H2 (+ oxidized
donors).
This type of hydrogenase in cyanobacteria is usually referred to as a bidirectional hydrogenase (Hox).
Nitrogenase is an enzyme of nitrogen fixation (Rees & Howard 2000, Igarashi & Seefeldt 2003) that typically catalyzes the following reaction with reduced ferredoxin/flavodoxin as electron donors:
N2 + 8e- + 8 H+ + 16 ATP → H2 + 2 NH3 + 16 (ADP + Pi) (1) Nitrogenase occurs in prokaryotes only, and among oxygen-evolving photosynthetic
organisms only some cyanobacteria (including prochlorophytes) have it.
3.4. Various Strategies for the Exploitation of Photobiological H2 Production
3.4.1. Hydrogenase-Based System Melis et al. (2000) found that the green alga Chlamydomonas cells evolved H2 for a few
days when photosystem II (PSII) that normally splits H2O and evolves O2, was apparently inactivated by culturing cells under sulfur-limited conditions. The observation was later explained as: 1) accumulation of organic substances by ordinary O2-evolving photosynthesis, 2) sulfur deprivation leads to lowered PSII activity, 3) under microoxic conditions, e- supplied by H2O and stored organic substances are used for H2 production via hydrogenase, while O2 produced at low rates by decreased PSII activity is removed through respiration by consuming previously stored organic substances (Ghirardi et al. 2000, 2005, Happe et al. 2002, Melis 2002, Melis & Happe 2004).
3.4.2. Two-Stage Photo-H2 Production
Benemann’s group (Benemann 2000, Hallenbeck & Benemann 2002) proposes indirect processes (photofermentation) that consist of 1) production in open ponds of a biomass high in storage carbohydrates by ordinary photosynthesis, 2) concentration of the biomass, 3) anaerobic dark fermentation converting stored carbohydrate to H2 and acetates, followed by 4a) photofermentation converting the by-product acetates to H2 in closed photobioreactors, or 4b) high yields of H2 via dark fermentation with carbohydrates generated through limited
Hidehiro Sakurai, Hajime Masukawa and Kazuhito Inoue 452
respiration. The latter process eliminates the need for anaerobic photobioreactors covering large areas.
3.4.3. Nitrogenase-Based System
The advantage of this reaction [Equation (1)] is that it irreversibly produces H2 as an inevitable by-product even in the presence of O2, if hydrogenase activity is absent. Thus, cyanobactria are able to continuously produce and accumulate H2 by the collaboration between photosynthesis and nitrogenase, with H2O as the ultimate electron donor accompanied by production of O2. Its downside is that the reaction consumes a lot of the high-energy compound ATP, thus the theoretical maximum energy conversion is lower than the hydrogenase-based system. Under conditions ideal for nitrogen fixation (Equation (1)), 75% of electrons are allocated to nitrogen fixation and only 25% are allocated to H2 production. However, the allocation coefficient can be modified in favor of H2 production, and in the absence of N2, all the electrons are allocated to H2 production (see, Sakurai & Masukawa, 2007).
3.5. Development of Research for Nitrogenase-Based H2 Production
3.5.1. More Detailed Description of Nitrogenase Nitrogenases typically possess MoFeS clusters (Mo-type) as the catalytic centers (Einsle
et al. 2002), but some bind V (V-type) or Fe (Fe-only type) instead of Mo (Eady 1996, 2003). The latter two types of nitrogenases are assumed to be less efficient in N2 fixation as they allocate a higher ratio of electrons to H+ reduction. In other words, they are assumed to be more suitable for further development in H2 production systems. Some cyanobacteria have the V-type (Thiel, 1993) in addition to Mo-type, but the occurrence of the Fe-only type in cyanobacteria has yet to be proved. In the absence of N2 (e.g. under Ar), all the electrons are allocated to H2 production irrespective of the types of nitrogenase.
2 e- + 2 H+ + 4 ATP → H2 + 4 (ADP + Pi) (2) Because nitrogenase is extremely O2 sensitive, photolysis of H2O and the direct coupling
of the N2ase reaction to reduced ferredoxin/flavodoxin are incompatible reactions. Cyanobacteria have evolved various strategies to spatially and/or temporally separate N2ase from O2 evolution activities, and these strategies have been used to classify the cyanobacteria into several groups (Gallon 2001, Tamagnini et al. 2002, Berman-Frank et al. 2003, Madamwar et al. 2000). Group A: filamentous heterocystous (e.g. Nostoc, Anabaena), B: filamentous non-heterocystous (Oscillatoria, Trichodesmium), and C: unicellular (Cyanothece, Gloeothece). Because the above antinomic situation is physiologically resolved by the cyanobacteria, frequent gas changes to sustain H2 production are not necessarily needed, unlike the H2ase-based production systems.
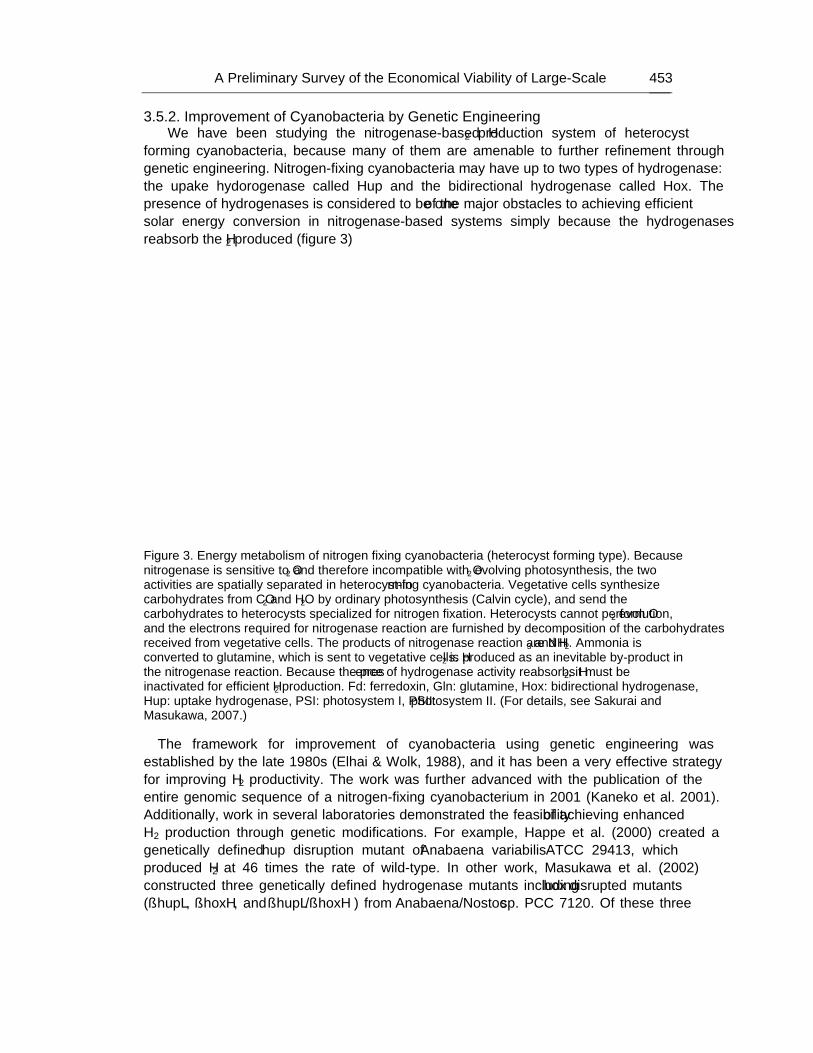
A Preliminary Survey of the Economical Viability of Large-Scale … 453
3.5.2. Improvement of Cyanobacteria by Genetic Engineering We have been studying the nitrogenase-based H2 production system of heterocyst
forming cyanobacteria, because many of them are amenable to further refinement through genetic engineering. Nitrogen-fixing cyanobacteria may have up to two types of hydrogenase: the upake hydorogenase called Hup and the bidirectional hydrogenase called Hox. The presence of hydrogenases is considered to be one of the major obstacles to achieving efficient solar energy conversion in nitrogenase-based systems simply because the hydrogenases reabsorb the H2 produced (figure 3)
Figure 3. Energy metabolism of nitrogen fixing cyanobacteria (heterocyst forming type). Because nitrogenase is sensitive to O2 and therefore incompatible with O2 evolving photosynthesis, the two activities are spatially separated in heterocyst-forming cyanobacteria. Vegetative cells synthesize carbohydrates from CO2 and H2O by ordinary photosynthesis (Calvin cycle), and send the carbohydrates to heterocysts specialized for nitrogen fixation. Heterocysts cannot perform O2 evolution, and the electrons required for nitrogenase reaction are furnished by decomposition of the carbohydrates received from vegetative cells. The products of nitrogenase reaction are NH3 and H2. Ammonia is converted to glutamine, which is sent to vegetative cells. H2 is produced as an inevitable by-product in the nitrogenase reaction. Because the presence of hydrogenase activity reabsorbs H2, it must be inactivated for efficient H2 production. Fd: ferredoxin, Gln: glutamine, Hox: bidirectional hydrogenase, Hup: uptake hydrogenase, PSI: photosystem I, PSII: photosystem II. (For details, see Sakurai and Masukawa, 2007.)
The framework for improvement of cyanobacteria using genetic engineering was established by the late 1980s (Elhai & Wolk, 1988), and it has been a very effective strategy for improving H2 productivity. The work was further advanced with the publication of the entire genomic sequence of a nitrogen-fixing cyanobacterium in 2001 (Kaneko et al. 2001). Additionally, work in several laboratories demonstrated the feasibility of achieving enhanced H2 production through genetic modifications. For example, Happe et al. (2000) created a genetically defined hup disruption mutant of Anabaena variabilis ATCC 29413, which produced H2 at 4–6 times the rate of wild-type. In other work, Masukawa et al. (2002) constructed three genetically defined hydrogenase mutants including hox disrupted mutants (ΔhupL, ΔhoxH, and ΔhupL/ΔhoxH ) from Anabaena/Nostoc sp. PCC 7120. Of these three
Hidehiro Sakurai, Hajime Masukawa and Kazuhito Inoue 454
mutants, two mutants, ΔhupL and ΔhupL/ΔhoxH produced H2 at a rate 4–7 times that of wild-type under optimal conditions, while the effects of Hox inactivation were not evident. In similar work of Lindberg et al. 2002, disruption of the hup in a Nostoc punctiforme ATCC 29133 strain that lacks Hox, was shown to be effective in enhancing H2 production.
3.5.3. Recent Advancements in Our Laboratory
In order to establish strains with high levels of H2 production, we have identified the promising wild-type strain Nostoc sp. PCC 7422 with high nitrogenase activity from among 13 nitrogen-fixing Nostoc and Anabaena strains. We subsequently improved H2 producing activity of the cells by inactivating the uptake hydrogenase gene (hupL) via genetic engineering to create a ΔhupL mutant (Yoshino et al. 2007). The ΔhupL mutant cells were able to accumulate H2 to about 22–29% even in the presence of evolved O2.
More recently, we have found in a preliminary investigation that by improving the culture conditions we are able to harvest about 15% H2 at least three times at an interval of 4 days each. We believe that there is the potential for continuous H2 harvesting in such a system as the culture showed no appreciable signs of lowering its production activity by the conclusion of our experiment (unpublished observation).
3.5.4. Needs for Further Improvement
The theoretically maximum energy conversion efficiency of H2 production with H2O as the electron donor is calculated to be 13.9–16.3% versus absorbed visible light energy (Sakurai & Masukawa, 2007). On the other hand, the efficiency of ordinary photosynthesis is similarly calculated to be 27.6% for C3 plants such as rice and wheat, and 20.7–24.5% for C4 plants such as sugar cane and maize.
As visible light accounts for about 45% of total solar energy received on the Earth’s surface, the above efficiency of H2 production corresponds to 6.3–7.3% vs. total solar energy (Sakurai & Masukawa, 2007).
Under laboratory conditions, cyanobacteria sometimes produced H2 with a light energy conversion efficiency of higher than 2.5% (versus visible light energy) (Kumazawa & Mitsui, 1994; Yoshino et al., 2007). However, these high efficiencies are only attained in a relatively short period (several hours) under low light intensities of about one twenty-fifth of full sunlight received on the equator. Under outdoor conditions, the reported best value of the efficiency in a relatively long period (days) is about 0.1% (Tsygankov et al., 2002). More research is needed to improve the outdoor light energy conversion efficiency (for a review, see Sakurai & Masukawa, 2007)
We believe that the potential exists for improving the outdoor efficiency of H2 production for the following reasons:
1. In shorter-term (illumination period, 3 or 4 hours) experiments, several green algae
produced H2 (by hydrogenase) at an energy conversion efficiency (ΔG) of 6–24 % (about 7–28% in ΔH) vs. visible light. (Greenbaum, 1988).
2. The green alga Chlorococcum lottorale grew photosynthetically (C3 type) in a vertical flat-plate photobioreactor outdoors at a light energy conversion efficiency of about 5.9–6.3% (vs. visible light) in a series of single-day experiments that took into account night respiration loss (bubbling with air containing 5% CO2, irradiation
A Preliminary Survey of the Economical Viability of Large-Scale … 455
(visible light): 8.3–11.2 MJ m-2 day-2 or 2.3-3.1 kWh m-2 day-2 in Winter, Spring, and Summer, in Japan) (Zhang et al. 2001).
3. From the ratio between photobiological H2 production and C3 type photosynthesis of the theoretical maximum efficiency (13.9–16.3% vs. 27.6%), the efficiency of 5.9–6.3% (average 6.2%) for the latter corresponds to 3.1–3.7% versus visible light or 1.4–1.7% versus total solar radiation for the former (H2 production).
3.5.5. Our Tentative Energy Conversion Efficiency Target for H2 Production Systems
In order to demonstrate the potential of large-scale photobiological H2 production using cyanobacteria, we set our tentative (in 5 to 10 years) target of solar energy conversion efficiency at 0.5% versus total solar irradiance outdoors, and from the above considerations, we think that this is an attainable goal. Achieving efficiencies of 1% and higher (2%) will be the next goal. In order to further improve efficiencies, one of the most important considerations is the inherent low-light saturation property of most cyanobacteria strains that leads to low energy conversion efficiency outdoors. The strategy of selecting wild-type strains with high nitrogenase activity under full sunlight, followed by genetic engineering, should also be attempted as a means to overcome this limitation (Sakurai & Masukawa, 2007).
4. TRIAL COST ANALYSIS OF H2 PRODUCTION In the following calculations the cost of photobiological H2 production is estimated based
on somewhat subjective assumptions as a guide to readers in considering the feasibility of large-scale H2 production, at present or in the future. We believe that in the future as new H2 production, purification and separation technologies are developed, further refinement of the calculations is possible by adding new cost items and changing some of the assumed values.
4.1. Cost of Biological Production Stage
Cost of the Culture Medium Many of the cyanobacteria strains can grow in liquid media that is relatively simple in
composition. Cyanobacteria are cultured in liquid medium 20 cm in depth (200 l m-2 or 0.2 ton (metric ton) m-2) utilizing either natural fresh water or seawater depending on the strain used. Potentially growth-limiting nutritional elements are added to the medium as ‘fertilizers’ akin to agricultural practices. An example of the composition of the synthetic medium BG11 (Rippka et al. 1979) frequently used in cyanobacteria culture is shown in table 2. In our proposed system, NaNO3 can be omitted because we use nitrogen-fixing cyanobacteria. If 0.18 mM K2HPO4 and 0.03 mM FeCl3 (instead of ferric ammonium citrate) are added to the natural water, the cost of chemicals is about 5–20 cents (in U.S.A. currency) per 0.2 kl or the sunny side surface area of 1 m2 of the bioreactor. If the medium is renewed twice a year, the cost is 10–40 cents per 1 m2 of the bioreactor per year [Cost 1A]. The cost will be reduced by using eutrophic water. Once grown, cyanobacteria continuously produce H2 allowing repeated harvesting, further additions of nutrients and CO2 are not necessary.
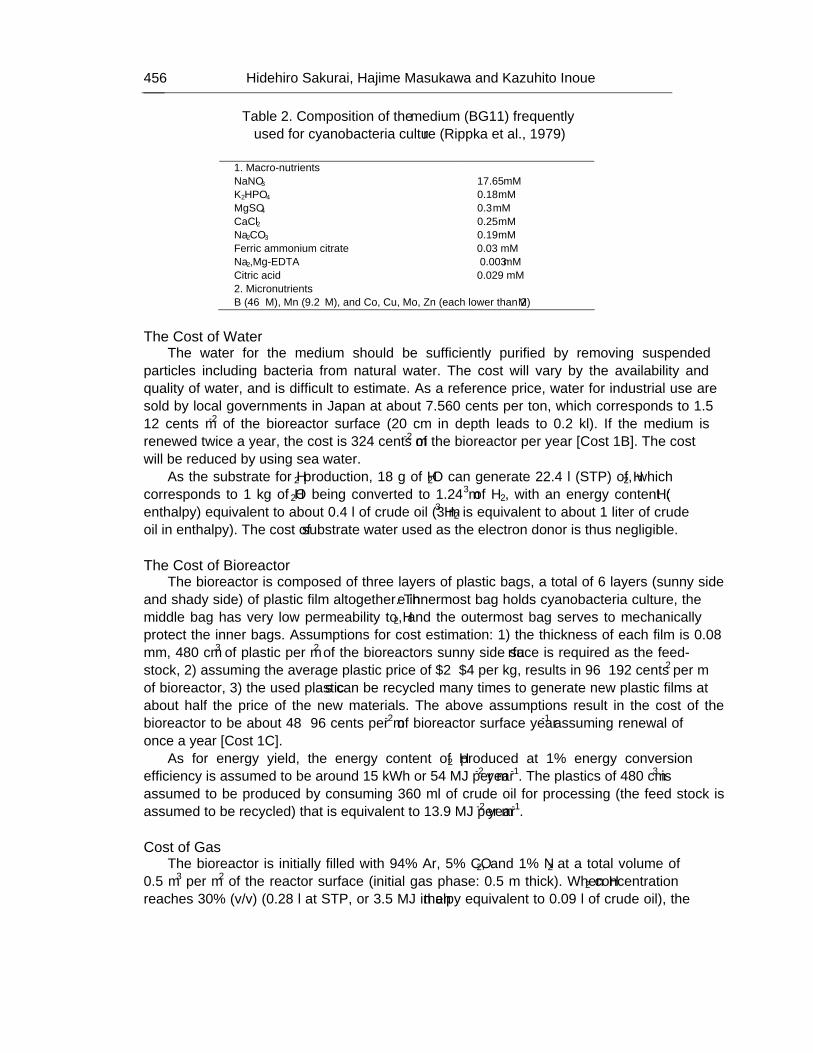
Hidehiro Sakurai, Hajime Masukawa and Kazuhito Inoue 456
Table 2. Composition of the medium (BG11) frequently used for cyanobacteria culture (Rippka et al., 1979)
1. Macro-nutrients NaNO3 17.65 mM K2HPO4 0.18 mM MgSO4 0.3 mM CaCl2 0.25 mM Na2CO3 0.19 mM Ferric ammonium citrate 0.03 mM Na2,Mg-EDTA 0.003 mM Citric acid 0.029 mM 2. Micronutrients B (46 μM), Mn (9.2 μM), and Co, Cu, Mo, Zn (each lower than 2 μM)
The Cost of Water
The water for the medium should be sufficiently purified by removing suspended particles including bacteria from natural water. The cost will vary by the availability and quality of water, and is difficult to estimate. As a reference price, water for industrial use are sold by local governments in Japan at about 7.5–60 cents per ton, which corresponds to 1.5–12 cents m-2 of the bioreactor surface (20 cm in depth leads to 0.2 kl). If the medium is renewed twice a year, the cost is 3–24 cents m-2 of the bioreactor per year [Cost 1B]. The cost will be reduced by using sea water.
As the substrate for H2 production, 18 g of H2O can generate 22.4 l (STP) of H2, which corresponds to 1 kg of H2O being converted to 1.24 m3 of H2, with an energy content (H: enthalpy) equivalent to about 0.4 l of crude oil (3 m3 H2 is equivalent to about 1 liter of crude oil in enthalpy). The cost of substrate water used as the electron donor is thus negligible.
The Cost of Bioreactor
The bioreactor is composed of three layers of plastic bags, a total of 6 layers (sunny side and shady side) of plastic film altogether. The innermost bag holds cyanobacteria culture, the middle bag has very low permeability to H2, and the outermost bag serves to mechanically protect the inner bags. Assumptions for cost estimation: 1) the thickness of each film is 0.08 mm, 480 cm3 of plastic per m2 of the bioreactor’s sunny side surface is required as the feed-stock, 2) assuming the average plastic price of $2 – $4 per kg, results in 96 – 192 cents per m2 of bioreactor, 3) the used plastics can be recycled many times to generate new plastic films at about half the price of the new materials. The above assumptions result in the cost of the bioreactor to be about 48 – 96 cents per m-2 of bioreactor surface year-1 assuming renewal of once a year [Cost 1C].
As for energy yield, the energy content of H2 produced at 1% energy conversion efficiency is assumed to be around 15 kWh or 54 MJ per m-2 year-1. The plastics of 480 cm3 is assumed to be produced by consuming 360 ml of crude oil for processing (the feed stock is assumed to be recycled) that is equivalent to 13.9 MJ per m-2 year-1.
Cost of Gas
The bioreactor is initially filled with 94% Ar, 5% CO2, and 1% N2 at a total volume of 0.5 m3 per m2 of the reactor surface (initial gas phase: 0.5 m thick). When H2 concentration reaches 30% (v/v) (0.28 l at STP, or 3.5 MJ in enthalpy equivalent to 0.09 l of crude oil), the
A Preliminary Survey of the Economical Viability of Large-Scale … 457
total gas (about 30% H2, 15% O2 and 55% Ar) is harvested for H2 separation. The frequency of the harvesting is once in about 25 days (3.5/(14.5 x 10-2) = 24). The price (FOB, bulk rate) of Ar is assumed to be $100–500 per ton (9 cents – 45 cents per m2 of bioreactor). If the Ar obtained during separation of H2 is recycled at one third the price of the original gas, the cost will be reduced 3 – 15 cents per m2 [Cost 1D]). The quality of Ar gas needs not be high, because contaminating O2 is consumed by respiration, and contaminating N2 is consumed by nitrogen fixation. The price of CO2 is assumed to be $4 – 15 per ton, therefore the total cost is negligible.
Other Cost of Biological Production Stage
In addition to the Costs A-D, the following costs will be incurred in the biological H2 production stage: the cost of growing cyanobacteria, the labor cost, the cost of ships, the interest on capital goods, and the cost of marine transportation of production materials [Cost 1E].
The energy required for the biological H2 production stage is assumed to be covered by the H2 produced (energy recovery ratio, see below).
4.2. Cost of Gas Harvesting, H2 Separation, Storage, and Marine Transportation to Final Destination
As many of the relevant technologies are under development, here we simply assume that
the total cost is composed of energy cost [Cost 2A] and other costs [Cost 2B]. The latter is composed of the labor costs, the cost of capital goods, the interest on them, and transportation costs. The energy required for these processes is assumed to be covered by the H2 produced as above, and the consumed energy is reflected in the above economical costs. With the development of technology in relevant fields, it seems to be possible that the H2 energy produced exceeds the energy required for its production.
4.3. Total Cost 1) Gross proceeds of H2 At 1% light conversion efficiency (our tentative target), H2 energy of 15 kWh (or 54 MJ)
m-2 year-1 is produced. The energy consumption ratio p is (energy consumed in the whole processes/energy of H2 produced in bioreactors) and the energy recovery ratio q is (purified H2 energy at unloading port/ energy of H2 in bioreactors), with p + q = 1.0. If we assume p = 1/3, 1/2 and 2/3, the amounts of energy in the final product H2 are 10 ([Case A]), 7.5 ( [Case B]) and 5 ([Case C]) kWh m-2 year-1, respectively. If the purified H2 is sold at 10 – 100 cents kWh-1, the gross proceeds are $1,000,000 – 10,000,000, 750,000 – 7,500,000 and 500,000 – 5,000,000 per km2 of bioreactors . year-1 [Amount V].
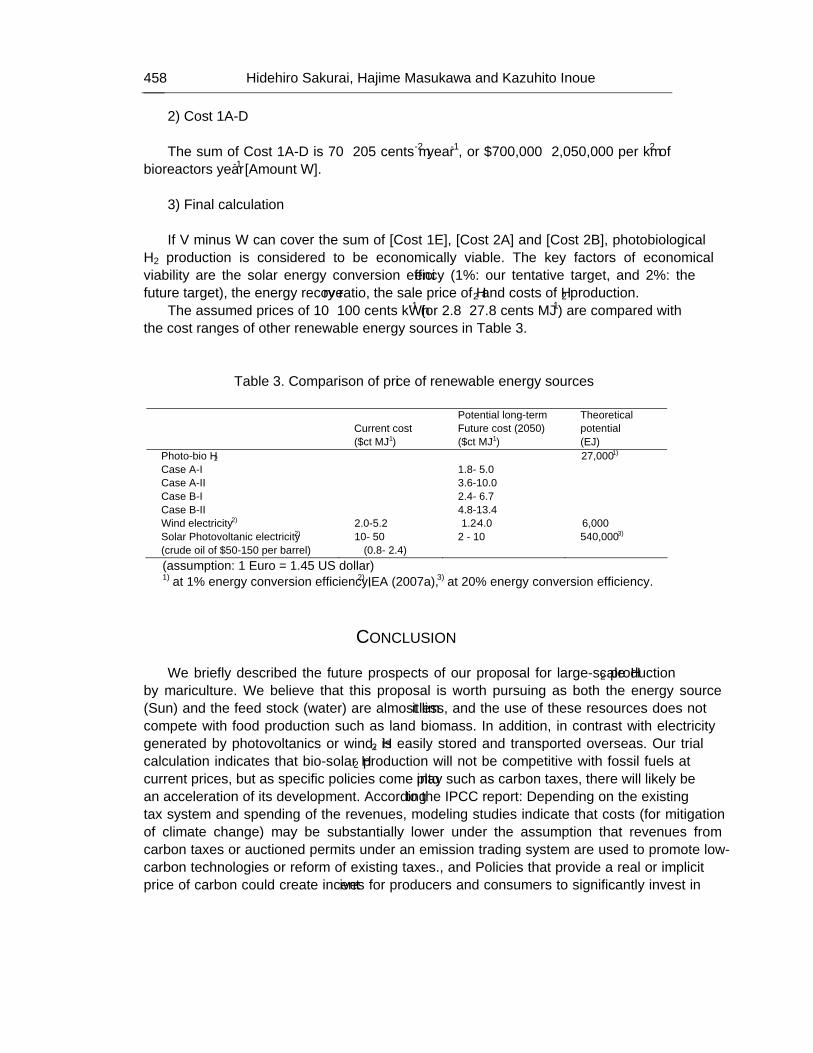
Hidehiro Sakurai, Hajime Masukawa and Kazuhito Inoue 458
2) Cost 1A-D The sum of Cost 1A-D is 70 – 205 cents m-2 year-1, or $700,000 – 2,050,000 per km2 of
bioreactors year-1 [Amount W]. 3) Final calculation If V minus W can cover the sum of [Cost 1E], [Cost 2A] and [Cost 2B], photobiological
H2 production is considered to be economically viable. The key factors of economical viability are the solar energy conversion efficiency (1%: our tentative target, and 2%: the future target), the energy recovery ratio, the sale price of H2 and costs of H2 production.
The assumed prices of 10 – 100 cents kWh-1 (or 2.8 – 27.8 cents MJ-1) are compared with the cost ranges of other renewable energy sources in Table 3.
Table 3. Comparison of price of renewable energy sources
Current cost ($ct MJ-1)
Potential long-term Future cost (2050) ($ct MJ-1)
Theoretical potential (EJ)
Photo-bio H2 27,000 1) Case A-I 1.8- 5.0 Case A-II 3.6-10.0 Case B-I 2.4- 6.7 Case B-II 4.8-13.4 Wind electricity 2) 2.0-5.2 1.2- 4.0 6,000 Solar Photovoltanic electricity 2) 10- 50 2 - 10 540,000 3) (crude oil of $50-150 per barrel) (0.8- 2.4) (assumption: 1 Euro = 1.45 US dollar) 1) at 1% energy conversion efficiency, 2) IEA (2007a), 3) at 20% energy conversion efficiency.
CONCLUSION We briefly described the future prospects of our proposal for large-scale H2 production
by mariculture. We believe that this proposal is worth pursuing as both the energy source (Sun) and the feed stock (water) are almost limitless, and the use of these resources does not compete with food production such as land biomass. In addition, in contrast with electricity generated by photovoltanics or wind, H2 is easily stored and transported overseas. Our trial calculation indicates that bio-solar H2 production will not be competitive with fossil fuels at current prices, but as specific policies come into play such as carbon taxes, there will likely be an acceleration of its development. According to the IPCC report: “Depending on the existing tax system and spending of the revenues, modeling studies indicate that costs (for mitigation of climate change) may be substantially lower under the assumption that revenues from carbon taxes or auctioned permits under an emission trading system are used to promote low-carbon technologies or reform of existing taxes.”, and “Policies that provide a real or implicit price of carbon could create incentives for producers and consumers to significantly invest in
A Preliminary Survey of the Economical Viability of Large-Scale … 459
low-GHG products, technologies and processes. Such policies could include economic instruments, government funding and regulation”. (IPCC, 2007c)
In spite of the technical as well as economical difficulties, we propose that large-scale H2 production by mariculture is the most promising strategy to be pursued for “stabilization of greenhouse gas concentrations in the atmosphere at a level that would prevent dangerous anthropogenic interference with the climate system” (the ultimate objective of UNFCCC).
ACKNOWLEDGEMENT We thank Dr. Susan Carlson for carefully reading the manuscript. This work was
supported in part by MEXT Grant-in-Aid for Venture (2001-2005) and Grant-in-Aid for Scientific Research (21380200) to HS, Grants for Special Research Projects, Waseda University (2004A-085, 2005B-083) to HS, Grants-in-Aid for Scientific Research from JSPS to HM (16-9494) and MEXT Grant-in-aid for the High-Tech Research Center Project (2007) to KI.
REFERENCES
Berman-Frank, I., Lundgren, P. & Falkowski, P. (2003) Nitrogen fixation and photosynthetic
oxygen evolution in cyanobacteria. Res. Microbiol. 154, 157-164. Benemann, J.R. (2000) Hydrogen production by microalgae. J. Appl. Phycol. 12, 291-300. Das, D. & Veziroglu, T.N. (2001) Hydrogen production by biological processes: a survey of
literature. Int. J. Hydrogen Energy. 26, 13-28. Eady, R.R. (1996) Structure-function relationships of alternative nitrogenases. Chem. Rev. 96,
3013-3030. Eady, R.R. (2003) Current status of structure function relationships of vanadium nitrogenase.
Coordination Chem. Rev. 237, 23-30. Einsle, O., Tezcan, F.A., Andrade, S.L.A., Schmid, B., Yoshida, M., Howard, J.B. & Rees,
D.C. (2002) Nitrogenase MoFe-protein at 1.16 angstrom resolution: A central ligand in the FeMo-cofactor. Science. 297, 1696-1700.
Elhai, J. & Wolk, C.P. (1988) Conjugal transfer of DNA to cyanobacteria. Methods Enzymol. 167, 747-754.
Gallon, J.R. (2001) N2 fixation in phototrophs: adaptation to a specialized way of life. Plant Soil. 230, 39-48.
Ghirardi, M.L., Zhang, J.P., Lee, J.W., Flynn, T., Seibert, M., Greenbaum, E. & Melis, A. (2000) Microalgae: a green source of renewable H2. Trends Biotechnol. 18, 506-511.
Ghirardi, M.L., King, P.W., Posewitz, M.C., Maness, P.C., Fedorov, A., Kim, K., Cohen, J., Schulten, K. & Seibert, M. (2005) Approaches to developing biological H2-photoproducing organisms and processes. Biochem. Soc. Transactions. 33, 70-72.
Gibbs, M., Hollaender, A., Kok, B., Krampitz, L.O. & San Pietro, A., Proceedings of the Workshop on Bio-Solar Energy Conversion (1973, September) NSF Report (RANN Grant GI 40253), NSF, Bethesda Md., 1973.
Greenbaum, E. (1988) Energetic efficiency of hydrogen photoevolution by algal water splitting. Biophys. J. 54, 365-368.
Hidehiro Sakurai, Hajime Masukawa and Kazuhito Inoue 460
Hall, D.O., Markov, S.A., Watanabe, Y. & Rao, K. (1995) The potential applications of cyanobacterial photosynthesis for clean technologies. Photosyn. Res. 46, 159-167.
Hallenbeck, P.C. & Benemann, J.R. (2002) Biological hydrogen production; fundamentals and limiting processes. Int. J. Hydrogen Energy. 27, 1185-1193.
Hallenbeck, P.C., Kochian, L.V,. Weissman, J.C. & Benemann, J.R. (1978) Solar energy conversion with hydrogen-producing cultures of the blue-green alga, Anabaena cylindrica. Biotechnol. Bioengineer. Symp. No 8, 283-297.
Happe, T., Hemschemeier, A., Winkler, M. & Kaminski, A. (2002) Hydrogenases in green algae: do they save the algae's life and solve our energy problems? Trends Plant Sci. 7, 246-250.
Happe, T., Schütz, K. & Böhme, H. (2000) Transcriptional and mutational analysis of the uptake hydrogenase of the filamentous cyanobacterium Anabaena variabilis ATCC 29413. J. Bacteriol. 182, 1624-1631.
IEA, (2007a) Bioenergy, Potential Contribution of Bioenergy to the World's Future Energy Demand [cited 2007, Nov. 20th]. Availabl from: URL: http://www.ieabioenergy.com/
IEA, (2007b) World Energy Outlook 2007 [cited 2007, Nov. 20th]. Availabl from: URL: http://www.worldenergyoutlook.org/
Igarashi, R.Y. & Seefeldt, L.C. (2003) Nitrogen fixation: The mechanism of the Mo-dependent nitrogenase. Crit. Rev. Biochem. Mol. Biol. 38, 351-384.
IPCC, (2007a) Press Release, Summary of Speech by Dr. R K Pachauri, Chairman, at the Opening of The Ninth Session of IPCC Working Group III at Bangkok, April 29, 2007. [cited 2007, Nov. 20th]. Availabl from: URL: http://www.ipcc.ch/pdf/press-ar4/wg3/speech-29april2007-rajendra-pachauri.pdf
IPCC, (2007b) The 4th Assessment Report, Working Group I. Summary for Policy Makers. (2007) [cited 2007, Nov. 20th]. Availabl from: URL: http://www.ipcc.ch/pdf/assessment-report/ar4/wg1/ar4-wg1-smp.pdf
IPCC, (2007c) The 4th Assessment Report, Working Group III. Summary for Policy Makers. (2007) [cited 2007, Nov. 20th]. Availabl from: URL:http://www.ipcc.ch/pdf/assessment-report/ar4/wg3/ar4-wg3-smp.pdf
Kaneko, T., Nakamura, Y., Wolk, C.P., Kuritz, T., Sasamoto, S., Watanabe, A., Iriguchi, M., Ishikawa, A., Kawashima, K., Kimura, T., Kishida, Y., Kohara, M., Matsumoto, M., Matsuno, A., Muraki, A., Nakazaki, N., Shimpo, S., Sugimoto, M., Takazawa, M., Yamada, M., Yasuda, M., Tabata, S. (2001) Coplete genomic sequence of the filamentous nitrogen-fixing cyanobacterium Anabaena sp. Strain PCC 7120. DNA Res. 8, 227-253
Kheshgi, H.S., Prince, R.C. & Marland, G. (2000) The potential of biomass fuels in the context of global climate change: Focus on transportation fuels. Ann. Rev. Energy Environ. 25, 199-244.
Kruse, O., Rupprecht, J., Mussgnug, J.R., Dismukes, G.C. & Hankamer, B. (2005) Photosynthesis: a blueprint for solar energy capture and biohydrogen production technologies. Photochem. Photobiol. Sci. 4, 957-970.
Kubota, M., Takayama, K. & Namimoto, D. (2005) Pleading for the use of biodegradable polymers in favor of marine environments and to avoid an asbestos-like problem for the future. Appl. Microbiol. Biotechnol. 67, 469-476.
A Preliminary Survey of the Economical Viability of Large-Scale … 461
Kumazawa, S. & Mitsui, A. (1994) Efficient hydrogen photoproduction by synchronously grown cells of a marine cyanobacterium, Synechococcus sp. Miami BG-043511, under high cell-density conditions. Biotechnol. Bioengineer. 44, 854-858.
Kumazawa, S. & Asakawa, H. (1995) Simultaneous production of H2 and O2 in closed vessels by marine cyanobacterium Anabaena sp. TU37-1 under high-cell-density conditions. Biotechnol. Bioengineer. 46, 396-398.
Levin, D.B., Pitt, L. & Love, M. (2004) Biohydrogen production: prospects and limitations to practical application. Int. J. Hydrogen Energy. 29, 173-185.
Lien, S. & San Pietro, A., An Inquiry into Biophotolysis of Water to Produce Hydrogen, NSF Report (RANN Grant GI 40253), NSF, Bethesda Md., (publication date, not described. Deemed to be around ) 1975.
Lindberg, P., Schütz, K., Happe, T. & Lindblad, P. (2002) A hydrogen-producing, hydrogenase-free mutant strain of Nostoc punctiforme ATCC 29133. Int. J. Hydrogen Energy. 27, 1291-1296.
Madamwar, D., Garg, N. & Shah, V. (2000) Cyanobacterial hydrogen production. World J. Microbiol. Biotechnol. 16, 757-767.
Masukawa, H., Mochimaru, M. & Sakurai, H. (2002) Disruption of the uptake hydrogenase gene, but not of the bidirectional hydrogenase gene, leads to enhanced photobiological hydrogen production by nitrogen-fixing cyanobacterium Anabaena sp. PCC 7120. Appl. Microbiol. Biotechnol. 58, 618-624.
Melis, A. (2002) Green alga hydrogen production: progress, challenges and prospects. Int. J. Hydrogen Energy. 27, 1217-1228.
Melis, A. & Happe, T. (2004) Trails of green alga hydrogen research - from Hans Gaffron to new frontiers. Photosyn. Res. 80, 401-409.
Melis, A., Zhang, L.P., Forestier, M., Ghirardi, M.L. & Seibert, M. (2000) Sustained photobiological hydrogen gas production upon reversible inactivation of oxygen evolution in the green alga Chlamydomonas reinhardtii. Plant Physiol. 122, 127-135.
Mertens, R. & Liese, A. (2004) Biotechnological applications of hydrogenases. Curr. Opinion Biotechnol. 15, 343-348.
Mikheeva, L.E., Schmitz, O., Shestakov, S.V. & Bothe, H. (1995) Mutants of the cyanobacterium Anabaena variabilis altered in hydrogenase activities. Z. Naturforsch. 50c, 505-510.
Mitsui, A., Phlips, E.J., Kumazawa, S., Reddy, K.I., Ramachandran, S., Matsunaga, T., Haynes, L. & Ikemoto, H. (1983) Progress in research toward outdoor biological hydrogen-production using solar-energy, sea-water, and marine photosynthetic microorganisms. Ann. N. Y. Acad. Sci. 413, 514-530.
Murray, R.L. & Mitsui, A. (1982) Growth of hybrid tilapia frey fed nitrogen fixing marine blue-green algae in seawater. J. World Maricul. Soc. 13, 198-209.
Prince, R.C. & Kheshgi. H.S. (2005) The photobiological production of hydrogen: Potential efficiency and effectiveness as a renewable fuel. Crit. Rev. Microbiol. 31, 19-31.
Rao, K.K., & Cammack, R. (2001) Producing hydrogen as a fuel. In R. Cammack, M. Frey, & R. Robson (Eds.), Hydrogen as a Fuel – Learning from Nature (pp. 201-230). London and New York, Taylor & Francis.
Rees D.C. & Howard, J.B. (2000) Nitrogenase: standing at the crossroads. Curr. Opinion Chem. Biol. 4, 559-566.
Hidehiro Sakurai, Hajime Masukawa and Kazuhito Inoue 462
Rippka, R. (1979) Genetic assignments, strain histories and properties of pure cultures of cyanobacteria. J. Gen. Microbiol. 111, 1-61.
Sakurai, H. & Masukawa, H. (2007) Promoting R & D in photobiological hydrogen Production utilizing mariculture-raised cyanobacteria. Mar. Biotechnol. 9, 128-145.
Tamagnini, P., Axelsson, R., Lindberg, P., Oxelfelt, F., Wünschiers, R. & Lindblad, P. (2002) Hydrogenases and hydrogen metabolism of cyanobacteria. Microbiol. Mol. Biol. Rev. 66, 1-20.
Tsygankov, A.A., Fedorov, A.S., Kosourov, S.N. & Rao, K.K. (2002) Hydrogen production by cyanobacteria in an automated outdoor photobioreactor under aerobic conditions. Biotechnol. Bioengineer. 80, 777-783.
Thiel, T. (1993) Characterization of genes for an alternative nitrogenase in the cyanobacterium Anabaena variabilis. J. Bacteriol. 175, 6276-6286.
UNFCCC (2007) home page, [cited 2007, Nov. 20th]. Availabl from: URL:http://unfccc.int/2860.php
Yoshino, F., Ikeda, H., Masukawa, H. & Sakurai. H. (2007) High photobiological hydrogen production activity of a Nostoc sp. PCC 7422 uptake hydrogenase-deficient mutant with high nitrogenase activity. Mar. Biotechnol. 9, 101-112.
Zhang, K., Miyachi, S. & Kurano, N. (2001) Photosynthetic performance of a cyanobacterium in a vertical flat-plate phtobioreactor for outdoor microalgal production and fixation of CO2. Biotechnol. Lett. 23, 21-26.
In: Handbook on Cyanobacteria ISBN: 978-1-60741-092-8 Editors: P. M. Gault and H. J. Marler © 2009 Nova Science Publishers, Inc.
Chapter 16
ADVANCES IN MARINE SYMBIOTIC CYANOBACTERIA
Zhiyong Li* Marine Biotechnology Laboratory and Key Laboratory of Microbial Metabolism,
Ministry of Education, School of Life Sciences and Biotechnology, Shanghai Jiao Tong University, 800 Dongchuan Road, Shanghai 200240, P.R.China
ABSTRACT
Marine microbial symbionts represent a hotspot in the field of marine microbiology. Marine plants and animals, such as sponge, sea squirt, worm, and algae host symbiotic cyanobacteria with great diversity. Most of the symbiotic cyanobacteria are host-specific and can be transmitted directly from parent to offspring. Symbiotic cyanobacteria play an important role in nitrogen fixation, nutrition and energy transfer and are possible true producers of bioactive marine natural products. Though diverse cyanobacteria have been revealed by culture-independent methods, the isolation and culture of symbiotic cyanobacteria is a challenge. In this chapter, the advances in diversity, transmission, symbiotic relationship with the host, isolation and natural products of marine symbiotic cyanobacteria are reviewed.
1. INTRODUCTION The term symbiosis was first used in 1879 by the German mycologist, Heinrich Anton de
Bary, who defined it as “the living together of unlike organisms”. Symbiosis commonly describes close and often long-term interactions between different biological species. The symbiotic relationship may be categorized as being mutualistic, parasitic, or commensal in nature, including those associations in which one organism lives on another (ectosymbiosis), or where one partner lives inside another (endosymbiosis). Endosymbiosis plays an important role in the evolution of eukaryotes and is now firmly recognized as a key feature of the origin
* E-mail: [email protected]; Tel.: (+86)21-34204036
Zhiyong Li 464
of all eukaryotic life (Lallier, 2006). Symbiotic relationships may be either obligate, i.e., necessary to the survival of at least one of the organisms involved, or facultative, where the relationship is beneficial but not essential to the survival of the organisms (http://en.wikipedia.org/wiki/Symbiosis). For example, tubeworms thrive some 3–5 km deep in the sea. The animals lack a digestive system and their nutritional needs are met by their bacterial chemoautotrophic symbionts contained in a morphologically complex symbiont-housing organ called the trophosome (Maheshwari, 2007). These bacteria can turn hydrogen sulfide, methane, and carbon dioxide into organic molecules that feed the worm. The worm reciprocates by supplying chemical nutrients for the bacteria (Phillips, 2006).
Cyanobacteria, also known as blue-green algae, blue-green bacteria or Cyanophyta, are a phylum of bacteria that obtain their energy through photosynthesis. They are a significant component of the marine nitrogen cycle and an important primary producer in many areas of the ocean. Cyanobacteria are able to form symbioses with a broad range of hosts, serving as “chloroplasts” in symbioses with a variety of non-photosynthetic partners, including marine invertebrates (sponges, ascidians, and echiuroid worms) and fungi. They are also found in symbiosis with photosynthetic hosts, including diatoms, mosses, liverworts, ferns and cycads, where they fix atmospheric nitrogen (N2) (Usher, 2008). Symbioses between cyanobacteria and marine organisms are abundant and widespread among marine plants and animals (Foster et al., 2006). This chapter mainly focuses on the advances in diversity, transmission, symbiotic relationship with the host, isolation and natural products of the marine symbiotic cyanobacteria.
2. THE DIVERSITY OF MARINE CYANOBACTERIAL SYMBIONTS In the marine environment, symbioses are known to occur between cyanobacteria and
sponges, ascidians (sea squirts) and echiuroid worms in the benthos and diatoms, dinoflagellates and a protozoan among the plankton (Carpenter, 2002). Because there is little success in attempts to cultivate the marine organism-associated microorganisms, to date, most insights into microbial diversity come from non-culture-based methods, including cell separations, 16S rRNA gene library, denaturing gradient gel electrophoresis (DGGE)/temperature gradient gel electrophoresis (TGGE) ( Li et al., 2006a; 2006b), restriction fragment length polymorphism (RFLP), random amplification of polymorphic DNA (RAPD), fluorescence in situ hybridization (FISH), and mass spectrometric imaging (MSI) (Gerwick et al., 2008).
In green algae Oedogonium oogonia and Codium bursa, different species of filamentous cyanobacteria have been reported (Thajuddin et al., 2005). The heterocystous cyanobacterium Richelia intracellularis has been found in three diatom genera, Rhizosolenia, Guinardia and Hemiaulus (Villareal, 1992).
Cyanobacteria have been found in cells of the subepidermal connective tissue of two marine echiuroid worms, Ikedosoma gogoshimense and Bonellia fuliginosa (Thajuddin et al., 2005). In the Didemnidae family of sea squirts, five genera form associations with either of two cyanobacterial genera, Synechocystis and Prochloron. Trididemnum miniatum, a colonial ascidian, is found to harbor the photosymbiotic prokaryote Prochloron sp. (Hirose et al.,
Advances in Marine Symbiotic Cyanobacteria 465
2006). Metagenomic analysis reveals 7% cyanobacteria of the microbial community associated with the coral Porites astreoides (Wegley et al., 2007).
Cyanobacteria are common members of sponge-associated bacterial communities. Symbiotic cyanobacteria, situated both intercellularly and intracellularly, have been reported in a large variety of marine sponges (Thajuddin et al., 2005; Usher, 2008). In the so-called “cyanobacteriosponge” Terpios hoshinota, half or more of the sponge tissue is taken up by cyanobacteria of the Aphanocapsa raspaigellae type (König et al., 2006). According to the study of Usher et al. (2001) on the cyanobacterial symbionts of the marine sponge Chondrilla australiensis (Demospongiae) using fluorescent microscopy and transmission electron microscopy, unicellular cyanobacteria with ultrastructure resembling Aphanocapsa feldmannii occur in the cortex and bacterial symbionts are located throughout the mesohyl. Cyanobacteria within the genera Aphanocapsa, Synechocystis, Oscillatoria and Phormidium are present in sponges, and most species occur extracellularly. For example, the cortical layer of sponge Tethya orphei was found to be permeated by filamentous cyanobacteria, Oscillatoria spongeliae. Phylogenetic analyses of 16S rRNA sequences of sponge-associated cyanobacteria show them to be polyphyletic. For example, most of the symbiont sequences are affiliated to a group of Synechococcus and Prochlorococcus species (Steindler et al., 2005). The unicellular cyanobacterium Synechococcus spongiarum is the most prevalent photosynthetic symbiont in marine sponges and inhabits taxonomically diverse hosts from tropical and temperate reefs worldwide (Erwin et al., 2008). Cyanobacteria fill the cortical region of the sponge and penetrate inward into the upper choanosomal region, where they sometimes overlap the siliceous spicule bundles (Gaino et al., 2006).
It is known that marine sponges can host a variety of cyanobacterial and bacterial symbionts, but it is often unclear whether these symbionts are generalists that occur in many host species or specialists that occur only in certain species or populations of sponges. For Dysidea n. sp. aff. herbacea 1A and 1B and Dysidea n. sp. aff. granulose, Thacker et al. (2003) found each of these three sponge species hosts a distinct cyanobacterial clade, suggesting a high degree of host specificity and potential coevolution between symbiotic cyanobacteria and their host sponges. Hill et al. (2006) also found sponge-specific bacterial symbionts in the Caribbean sponge, Chondrilla nucula (Demospongiae, Chondrosida). According to the investigation by Thacker (2005), the marine sponge Lamellodysidea chlorea contains large populations of the host-specific, filamentous cyanobacterium Oscillatoria spongeliae, and other marine sponges, including Xestospongia exigua, contain the generalist, unicellular cyanobacterium Synechococcus spongiarum. Recent research has revealed new cyanobacterial symbionts that may be host specific and two major clades, Candidatus Synechococcus spongiarum and Oscillatoria spongeliae, that occur in widely separated geographic locations in unrelated sponge hosts (Usher, 2008).
3. THE TRANSMISSION OF CYANOBACTERIAL SYMBIONTS Symbionts may be acquired vertically (symbiont transmitted directly from parent to
offspring) or horizontally (offspring acquire symbiont from the environment) (Usher, 2008). The former is an important strategy for the formation of host specific symbiosis. In C. australiensis, the presence of cyanobacterial symbionts inside developing eggs and nurse cells
Zhiyong Li 466
in 25% of female Chondrilla australiensis has been established using transmission electron microscopy, suggesting that these symbionts are sometimes passed on to the next generation of sponges via the eggs (Usher et al., 2001). Cyanobacterial symbionts in the sponge Diacarnus erythraenus from the Red Sea have been identified in both adult sponges and their larvae by 16S rRNA sequencing together with the morphological analysis by electron and fluorescence microscopy, as a result, evidence is provided for vertical transmission of the symbionts in the sponge Diacarnus erythraenus (Oren et al., 2005). A budding specimen of T. orphei shows that cyanobacteria are present in the single bud protruding from the sponge surface, demonstrating that asexual reproduction can vertically transmit these symbionts from sponge to sponge. The occurrence of filaments in all the specimens studied is consistent with the assumption that filamentous cyanobacteria are not mere intruders but mutualistic symbionts with T. orphei (Gaino et al., 2006).
4. THE RELATIONSHIP BETWEEN CYANOBACTERIAL SYMBIONTS AND THE HOST
The symbiotic association is very important for chemical defense, carbon or nitrogen
fixing, compound and energy transfer in the marine environment. There is close metabolic relationship between symbionts and the host. For example, on the coral reefs of Papua New Guinea, transmission electron microscopy and pigment analyses show that episymbiont biomass is dominated by large (20–30 mm) cyanobacterial cells. The isopods consume these photosymbionts and ‘cultivate’ them by inhabiting exposed sunlit substrates, a behavior made possible by symbionts production of a chemical defense that is repulsive to fishes (Lindquist et al., 2005). The impact of cyanobacterial photosynthesis on host sponges has been investigated by shading these sponge-cyanobacteria associations. It is suggested that Oscillatoria symbionts benefit their host sponge L. chlorea in a mutualistic association. Synechococcus symbionts may be commensals that exploit the resources provided by their sponge hosts without significantly affecting sponge mass. This supports the hypothesis that more specialized symbionts provide a greater benefit to their hosts (Thacker, 2005).
The interaction of Prochloron spp. bacteria with host ascidian animals in tropical oceans provides an excellent example of exchange of nutrients between animals and bacteria—a symbiosis based on small molecules. The sharing of photosynthate fixed by Prochloron with the host animal is suggested, and in some cases nearly all required carbon by the host comes from the bacteria. In return, the host provides waste nitrogen and other metabolic byproducts that allow Prochloron to be highly productive in a relatively nitrogen-poor environment. Prochloron also recycles this nitrogen, providing back to host usable nitrogen from waste sources. Prochloron-containing ascidians often contain extremely diverse natural products, such as the patellamides and relatives, produced by Prochloron (Schmidt, 2008). Cyanosymbionts are of advantage for their host since some of the potently active natural products that they produce, which may protect the sponge from environmental threats such as overgrowth, UV irradiation or attack by feeders. Cyanobacteria may, however, also damage their host sponge, if their growth is supported by favorable conditions (König et al., 2006).
By forming symbioses, host dinoflagellates and diatoms may obtain fixed carbon or fixed nitrogen (or both), whereas cyanobacteria may receive buoyancy. The fixation of N2 or the
Advances in Marine Symbiotic Cyanobacteria 467
release of dissolved organic carbon (DOC) will benefit the host organism. For example, ascidians, it is presumed that the hosts benefit from the release of DOC. Cyanobacteria may also benefit sponges through fixation of atmospheric nitrogen. Gordon et al. (1994) proposed that heterotrophic dinoflagellate hosts may provide the cyanobacterial symbionts with the anaerobic microenvironment necessary for efficient N fixation. In the study of Lesser et al. (2004), colonies of the Caribbean coral Montastraea cavernosa exhibit a solarstimulated orange-red fluorescence. The source of this fluorescence is phycoerythrin in unicellular, nonheterocystis, symbiotic cyanobacteria within the host cells of the coral. The cyanobacteria coexist with the symbiotic dinoflagellates (zooxanthellae) of the coral and express the nitrogen-fixing enzyme nitrogenase. The presence of this prokaryotic symbiont in a nitrogen-limited zooxanthellate coral suggests that nitrogen fixation may be an important source of this limiting element for the symbiotic association.
Metabolic relationships between symbiotic cyanobacteria and sponge have been investigated in the marine species ChondrilIa nucula and Petrosia ficiformis. Results show that in the absence of light (i.e., in the absence of cyanobacteria) C. nucula undergo metabolic collapse and thiol depletion. In contrast, P. ficiformis activates heterotrophic metabolism and mechanisms which balance the loss of cell reducing power. This suggests that cyanobacteria effectively participate in controlling the redox potential of the host cells by the transfer of reducing equivalents. Cyanobacterial symbionts release fixed carbon in the form of glycerol and other small organic phosphate (Arillo et al., 1993).
5. THE ISOLATION OF MARINE CYANOBACTERIAL SYMBIONTS It is known that the vast majority of microbes in natural environment still remain
uncultured in laboratory, cyanobacteria is not exceptional. The characteristics of cyanobacteria make it more difficult to culture, for instance, Lyngbya, Phormidium and Oscillatoria are characterized by multicellular filaments, and thus difficult to separate single filaments for isolation purposes. Cyanobacteria are easily contaminated with diatoms and heterotrophic bacteria. In addition, the problem associated with the culture of cyanobacteria is their slow growth rate. In order to study the chemical diversity of cyanobacterial symbionts, it is important to develop effective culture methodologies. Although some methods for cyanobacterial isolation and cultivation have been successfully used (Waterbury, 2006), at present, only a small percentage of cyanobacteria have been successfully cultured. Traditional microbiological methods are often unsuccessful because the factors of cyanobacterial growth environment are still poorly understood. In the case of cyanobacterial symbionts, they are inherently difficult to culture because of the complex unknown microenvironmental conditions in host.
Some novel strategies have been adopted to isolate cyanobacterial symbionts. For example, flow-cytometric separation of the cyanobacterial symbiont from the sponge cells has been attempted by Unson et al. (1993). The tropical marine sponge Dysidea herbacea is always found associated with the filamentous cyanobacterium Oscillatoria spongeliae, which occurs abundantly throughout the sponge mesohyl. O. spongeliae has been successfully isolated from sponge Dysidea herbacea by chopping the sponge tissue with a razor blade and squeezing the trichomes into a seawater-based medium containing polyvinylpyrrolidone,
Zhiyong Li 468
bovine serum albumin, dithiothreitol, glycerol, KCl and Na2CO3 (Hinde et al., 1994). Though some advances have been made, until now the isolation of cyanobacteria in a mutualistic association with host remains a big challenge.
6. CYANOBACTERIAL SYMBIONT: THE POSSIBLE TRUE PRODUCER OF MARINE NATURAL PRODUCTS
Marine cyanobacteria are one of the richest sources of known and novel bioactive
compounds including toxins with unusual structures and wide pharmaceutical applications (Burja et al., 2001; Gerwick et al., 2008; Tan, 2007). The presence of symbiotic cyanobacteria raises questions as to the exact origin of the biologically important metabolites which have been isolated from the hosts. Is the compound produced by the host, the symbiotic cyanobacteria, or through a combined effort of both organisms? It is now realized that cyanobacteria are the true biosynthetic origin of many bioactive molecules isolated from marine invertebrates or at least involved in the biosynthesis of some metabolites.
Some supports come from the structural similarity of natural products from cyanobacteria and invertebrates. Sponge Dysidea (Lamellodysidea) herbacea, which hosts the cyanobacterium Oscillatoria spongeliae, varies in their production of polychlorinated peptides, which are often halogenated and include dysidin, dysidinin, and a series of chlorinated diketopiperazines (Flatt et al., 2005). These kinds of peptide natural products previously isolated from marine cyanobacterium Lyngbya majuscule. According to Sings et al. (1996), tunicates of the family Didemnidae host two genera of symbiotic cyanobacteria Synechocystis and Prochloron. The occurrence of ascidian metabolites in symbiotic cyanobacteria cells suggests that some of these metabolites may at least in part be synthesized by the cyanobacterial symbiont. A further example of structurally similar peptides in sponges and cyanobacteria is the nonribosomal cyclic peptide leucamide A from the sponge Leucetta microraphis (König et al., 2006).
Unson et al. (1993) firstly demonstrated that a unique group of polychlorinated compounds isolated from the whole sponge tissue is limited to the cyanobacterial filaments. Unson et al. (1994) provided another proof on the origin of marine natural product. Polybrominated biphenyl ethers such as 2-(2', 4’-dibromophenyl)-4, 6-dibromophenol are characteristic secondary metabolites of some specimens of sponge Dysidea herbacea. The dominant prokaryotic endosymbiont in the mesohyl of the sponge is a filamentous cyanobacterium Oscillatoria spongeliae. By cell-sorting experiments based on the fluorescence properties of cyanobacteria, it was revealed that the major brominated compound isolated from the intact symbiotic association is found in the cyanobacteria and not in the sponge cells or heterotrophic bacteria. This suggests that the production of the compound is due to the cyanobacterium, and not to the sponge or symbiotic heterotrophic bacteria. Several bioactive compounds isolated from S. longicauda have been ultimately tracked to cyanobacteria such as majusculamide (Burja et al., 2001). By the dietary dissemination of cyanobacteria, dolastatins of cyanobacteria origin are found to be accumulated in the Indian Ocean sea hare, Dolabella auricularia (Harrigan et al., 2002).
Advances in Marine Symbiotic Cyanobacteria 469
In another recent example, Ridley et al. (2005) made an effort to localize natural products to specific cell types using formalin or glutaraldehyde fixed sponge-cyanobacterial tissues from the tropical sponge Dysidea herbacea. After the sponge tissues being disrupted, individual cells are separated by using a fluorescence-activated cell sorter (FACS). Chemical analysis of the sorted cell types shows sesquiterpenoid compounds to be physically associated with the sponge cells, whereas chlorinated peptides are found to be localized to the associated cyanobacterium, Oscillatoria spongeliae.
Recently, evidence at the molecular genetic level has been found to support the hypothesis of natural products of symbionts origin. For instance, in the study of Flatt et al. (2005), a barB1 homolog (dysB1) from D. herbacea was successfully amplified by polymerase chain reaction (PCR). Catalyzed reporter deposition fluorescence in situ hybridization (CARD-FISH) analysis showed that dysB1 oligonucleotide probes hybridized to sequences in the filamentous cyanobacterial symbiont O. spongeliae. This finding revealed the cellular site of polychlorinated peptide biosynthesis in the marine sponge Dysidea (Lamellodysidea) herbacea and symbiotic cyanobacterium Oscillatoria spongeliae. A genome sequence of the cyanobacterium Prochloron sp., a symbiont in the tunicate Lissoclinum patella, identified the cyanobacterium as the biosynthetic source of the ribosomally encoded peptides patellamides A and C (Milne et al., 2006; Schmidt et al., 2005). Generally, it is thought that cyclic peptides that are associated with the tunicate Lissoclinum patella are produced in tunicate’s own tissues. However, subsequent studies involving gene cloning, expression and genomic sequencing indicate that symbiotic cyanobacteria actually produce these peptides (Gerwick et al., 2008).
Marine invertebrates often contain dominant taxa-specific populations of cyanobacteria, which are considered to be the true biogenic source of a number of pharmacologically active polyketides (PKS) and nonribosomally synthesized peptides (NRPS) produced within the host. Cyanobacteria are proven to be rich in modular biosynthetic pathways that integrate features from both the PKS and NRPS families. The biosynthetic gene cluster of cyanobacteria from algae for curacin A, hectochlorin and lyngbyatoxin biosynthesis have been investigated (Gerwick et al., 2008).
7. CONCLUSION AND PERSPECTIVE Abundant and diverse marine symbiotic cyanobacteria have been revealed in sponges, sea
squirts, worms and algae. Based on culture-independent molecular methods, it has been proven that marine organisms host a distinct cyanobacterial clade, suggesting a high degree of host specificity and potential coevolution between symbiotic cyanobacteria and their hosts. Symbiotic cyanobacteria can be transmitted directly from parent to offspring. Diverse cyanobacteria have been revealed by culture-independent methods, but the isolation and culture of symbiotic cyanobacteria is a challenge. Although metabolic relationships between symbiotic cyanobacteria and hosts have been investigated recently, it is still not clear as well as the related symbiotic mechanisms.
Symbiotic cyanobacteria play an important role in chemical defense, nitrogen and carbon fixation, nutrition and energy transfer and are the possible true producers of some natural products isolated from the host. Metagenomic screening to identify key polyketide synthase
Zhiyong Li 470
(PKS) and nonribosomal peptide synthetase (NRPS) genes, and new cloning and biosynthetic expression strategies may provide a sustainable method to obtain new pharmaceuticals derived from the uncultured cyanobacterial symbionts.
Today, marine microbial symbionts represent a hotspot in the field of marine microbiology. The following areas are recommended to be strengthened in future: the development of a novel isolation strategy imitating natural environment conditions, a metagenomic approach for the revelation of cyanobacterial diversity and gene cluster involved in the biosynthesis of second metabolites, the site and origin identification of natural products, the symbiotic mechanisms and the relationship between symbionts and hosts.
REFERENCES
Arillo, A., Bavestrello, G., Burlando, B., & Sarfi, M.(1993) Metabolic integration between symbiotic cyanobacteria and sponges:a possible mechanism. Marine Biology, 117, 159-162
Burja, A.M., Banaigs, B., Abou-Mansour, E., Burgess, J.G., & Wright, P.C. (2001) Marine cyanobacteria—a prolific source of natural products. Tetrahedron, 57, 9347-9377
Carpenter, E.J.(2002) Marine cyanobacterial symbioses. Biology and Environment,102B, 15–18
Erwin, P.M., & Thack, R.W.(2008) Cryptic diversity of the symbiotic cyanobacterium Synechococcus spongiarum among sponge hosts. Molecular Ecology, 17,2937-2947
Flatt, P. M., Gautschi, J.T., Thacker, R.W., Musafija-Girt, M., Crews ,P., & Gerwick, W.H.(2005) Identification of the cellular site of polychlorinated peptide biosynthesis in the marine sponge Dysidea (Lamellodysidea) herbacea and symbiotic cyanobacterium Oscillatoria spongeliae by CARD-FISH analysis. Marine Biology, 147, 761–774
Foster, R. A., Carpenter, E.J., & Bergman, B.(2006) Unicellular cyanobionts in open ocean dinoflagellates, radiolarians,and tintinnids:ultrastructural characterization and immune-localization of phycoerythrin and nitrogenase. J. Phycol., 42, 453–463
Gaino, E., Sciscioli, M., Lepore, E., Rebora, M., & Corriero G.(2006) Association of the sponge Tethya orphei (Porifera, Demospongiae) with filamentous cyanobacteria. Invertebrate Biology, 125, 281–287
Gerwick, W.H., Coates, R. C., Engene, N., Gerwick, L., Grindberg, R.V., Jones, A.C., & Sorrels, C.M. (2008) Giant marine cyanobacteria produce exciting potential pharmaceuticals. Microbe, 3,277-284
Gordon, N., Angel, D.L., Neori, A., Kress, N., & Kimor, B. (1994) Heterotrophic dinoflagellates with symbiotic cyanobacteria and nitrogen limitation in the Gulf of Aqaba. Marine Ecology Progress Series,107,83-88
Harrigan, G.G., & Goetz, G. (2002) Symbiotic and dietary marine microalgae as a source of bioactive molecules–experience from natural products research. Journal of Applied Phycology, 14,103–108
Hill, M., Hill, A., Lopez, N., & Harriott, O. (2006) Sponge-specific bacterial symbionts in the Caribbean sponge, Chondrilla nucula (Demospongiae, Chondrosida). Marine Biology, 148, 1221–1230
Advances in Marine Symbiotic Cyanobacteria 471
Hinde, R., Pironet, F., & Borowitzka, M.A. (1994) Isolation of Oscillatoria spongeliae, the filamentous cyanobacterial symbiont of the marine sponge Dysidea herbacea. Marine Biology,119,99-104
Hirose, E., Hirose, M., & Neilan, B.A. (2006) Localization of symbiotic cyanobacteria in the colonial ascidian Trididemnum miniatum (Didemnidae, Ascidiacea). Zoological Science,23,435–442
König, G.M., Kehraus, S., Seibert, S.F., Abdel-Lateff, A., Müller, D. (2006) Natural products from marine organisms and their associated microbes. Chem. Bio. Chem.,7,229 – 238
Lallier, F. H. (2006)Thioautotrophic symbiosis: towards a new step in eukaryote evolution? Cah. Biol. Mar., 47 ,391-396
Li, Z.Y., He, L.M., Wu, J., & Jiang, Q. (2006a) Bacterial community diversity associated with four marine sponges from the South China Sea based on 16S rDNA-DGGE fingerprinting. Journal of Experimental Marine Biology and Ecology, 329,75-85
Li, Z.Y., & Liu, Y. (2006b) Marine sponge Craniella austrialiensis-associated bacterial diversity revelation based on 16S rDNA library and biologically active actinomycetes screening, phylogenetic analysis. Letters in Applied Microbiology, 43,410-416
Lindquist, N., Barber, P.H., & Weisz, J.B. (2005) Episymbiotic microbes as food and defence for marine isopods: unique symbioses in a hostile environment. Proc. R. Soc. B, 272, 1209–1216
Lesser, M.P., Charles, H., Mazel, C.H., Gorbunov, M.Y., & Falkowski, P.J. (2004) Discovery of symbiotic nitrogen-fixing cyanobacteria in Corals. Science, 305,997-1000
Maheshwari, R. (2007) Associations, mergers and acquisitions in the biological world. Current Science, 92,900-905
Milne, B.F., Long, P.F., Starcevic, A., Hranueli, D., & Jaspers, M. (2006) Spontaneity in the patellamide biosynthetic pathway. Org. Biomol. Chem., 4:631–638.
Oren, M., Steindler, L., & Ilan, M. (2005) Transmission, plasticity and the molecular identification of cyanobacterial symbionts in the Red Sea sponge Diacarnus erythraenus. Marine Biology, 148, 35–41
Phillips, M.L. (2006) Interdomain interactions: dissecting animal–bacterial symbioses. BioScience, 56,376-381
Ridley, C.P., Bergquist, P.R., Harper, M.K., Faulkner, D.J., Hooper, J.N., & Haygood, M.G.(2005) Speciation and biosynthetic variation in four Dictyoceratid sponges and their cyanobacterial symbiont, Oscillatoria spongeliae. Chem. Biol., 12:397–406.
Schmidt, E.W.(2008) Trading molecules and tracking targets in symbiotic interactions. Nature Chemical Biology. 4,466-473
Schmidt, E.W., Nelson, J.T., Rasko, D.A., Sudek, S., Eisen, J.A., Haygood, M.G., & Ravel, J. (2005) Patellamide A and C biosynthesis by a microcin-like pathway in Prochloron didemni, the cyanobacterial symbiont of Lissoclinum patella. Proc. Natl. Acad. Sci. USA, 102:7315–7320.
Sings, H.L., & Rinehart, K.L.(1996) Compounds produced from potential tunicate-blue-green algal symbiosis: a review. Journal of Industrial Microbiology, 17,385-396
Steindler, L., Huchon, D., Avni, A., & Ilan, M. (2005) 16S rRNA phylogeny of sponge-associated cyanobacteria. Applied and Environmental Microbiology, 71, 4127–4131
Tan, L.T. (2007) Bioactive natural products from marine cyanobacteria for drug discovery. Phytochemistry, 68,954–979
Zhiyong Li 472
Thacker, R.W. (2005) Impacts of shading on sponge-cyanobacteria symbioses: a comparison between host-specific and generalist associations. Integr. Comp. Biol., 45,369–376
Thacker, R.W., & Starnes, S. (2003) Host specificity of the symbiotic cyanobacterium Oscillatoria spongeliae in marine sponges, Dysidea spp. Marine Biology, 142, 643–648
Thajuddin, N., & Subramanian, G.(2005) Cyanobacterial biodiversity and potential applications in biotechnology. Current Science, 89,47-57
Unson, M. D., & Faulkner, D. J. (1993) Cyanobacterial symbiont biosynthesis of chlorinated metabolites from Dysidea herbacea(Porifera). Experientia, 49,349-353
Unson, M. D., Holland, N. D., & Faulkner, D. J.(1994) A brominated secondary metabolite synthesized by the cyanobacterial symbiont of a marine sponge and accumulation of the crystalline metabolite in the sponge tissue. Marine Biology, 119,1-11
Usher, K.M. (2008) The ecology and phylogeny of cyanobacterial symbionts in sponges. Marine Ecology, 29,178–192
Usher, K.M., Kuo, J., Fromont, J., & Sutton, D.C. (2001) Vertical transmission of cyanobacterial symbionts in the marine sponge Chondrilla australiensis (Demospongiae). Hydrobiologia, 461, 15–23
Villareal, T.A. (1992) Marine nitrogen-fixing diatom–cyanobacteria symbioses. In: Carpenter, E.J., Capone, D.G., & Rueter, J.G. (Eds), Marine pelagic cyanobacteria: trichodesmium and other diazotrophs, Dordrecht, Kluwer, p163–74
Waterbury, J.B. (2006) The Cyanobacteria—isolation, purification and identification. Prokaryotes, 4,1053–1073
Wegley, L., Edwards, R., Rodriguez-Brito, B., Liu, H., & Rohwer, F. (2007) Metagenomic analysis of the microbial community associated with the coral Porites astreoides. Environmental Microbiology, 9,2707–2719
In: Handbook on Cyanobacteria ISBN: 978-1-60741-092-8 Editors: P. M. Gault and H. J. Marler © 2009 Nova Science Publishers, Inc.
Chapter 17
ANTIOXIDANT ENZYME ACTIVITIES IN THE CYANOBACTERIA PLANKTOTHRIX AGARDHII,
PLANKTOTHRIX PERORNATA, RAPHIDIOPSIS BROOKII, AND THE GREEN ALGA
SELENASTRUM CAPRICORNUTUM
Kevin K. Schrader* and Franck E. Dayan United States Department of Agriculture, Agricultural Research Service, Natural
Products Utilization Research Unit, National Center for Natural Products Research, Post Office Box 8048, University, Mississippi 38677-8048, United States of America
ABSTRACT
Previous research has discovered that pesticides which generate reactive oxygen species (ROS), such as the bipyridilium herbicides diquat and paraquat, and certain natural compounds (e.g., quinones) are selectively toxic towards undesirable species of cyanobacteria (blue-green algae) (division Cyanophyta) compared to preferred green algae (division Chlorophyta) commonly found in channel catfish (Ictalurus punctatus) aquaculture ponds. In this study, the antioxidant enzyme activities of the green alga Selenastrum capricornutum and the cyanobacteria Planktothrix agardhii, Planktothrix perornata, and Raphidiopsis brookii, previously isolated from catfish aquaculture ponds in west Mississippi, were measured to help determine the cause for the selective toxicity of ROS-generating compounds. Enzyme assays were performed using cells from separate continuous culture systems to quantify and correlate the specific enzyme activities of superoxide dismutase, catalase, ascorbate peroxidase, and glutathione peroxidase relative to the protein content of the cells. The cyanobacteria used in this study have significantly lower specific activities of superoxide dismutase, catalase, and ascorbate peroxidase when compared to S. capricornutum. Glutathione peroxidase activity was not detected in these cyanobacteria or S. capricornutum. The deficiency of measured antioxidant enzyme activities in the test cyanobacteria is at least one reason for the selective toxicity of ROS-generating compounds towards these cyanobacteria compared to S. capricornutum.
* Corresponding author. Tel.: 662-915-1144; fax 662-915-1035; E-mail address: [email protected]
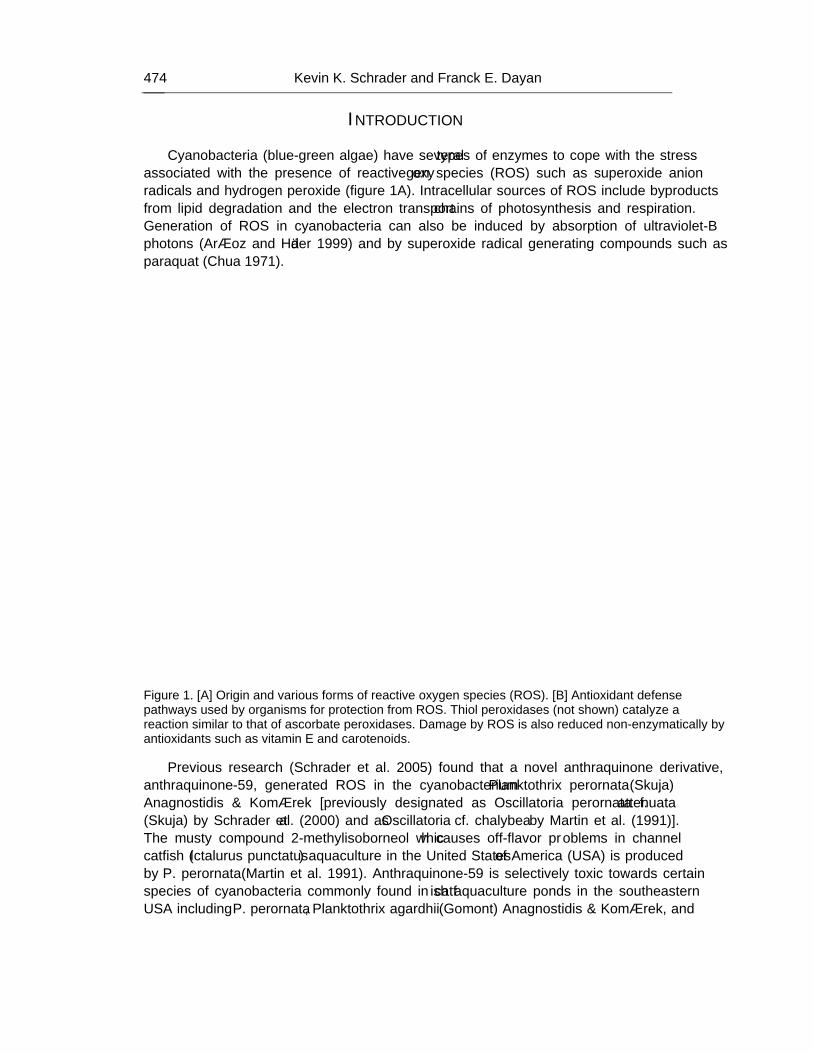
Kevin K. Schrader and Franck E. Dayan 474
INTRODUCTION Cyanobacteria (blue-green algae) have several types of enzymes to cope with the stress
associated with the presence of reactive oxygen species (ROS) such as superoxide anion radicals and hydrogen peroxide (figure 1A). Intracellular sources of ROS include byproducts from lipid degradation and the electron transport chains of photosynthesis and respiration. Generation of ROS in cyanobacteria can also be induced by absorption of ultraviolet-B photons (Aráoz and Häder 1999) and by superoxide radical generating compounds such as paraquat (Chua 1971).
Figure 1. [A] Origin and various forms of reactive oxygen species (ROS). [B] Antioxidant defense pathways used by organisms for protection from ROS. Thiol peroxidases (not shown) catalyze a reaction similar to that of ascorbate peroxidases. Damage by ROS is also reduced non-enzymatically by antioxidants such as vitamin E and carotenoids.
Previous research (Schrader et al. 2005) found that a novel anthraquinone derivative, anthraquinone-59, generated ROS in the cyanobacterium Planktothrix perornata (Skuja) Anagnostidis & Komárek [previously designated as Oscillatoria perornata f. attenuata (Skuja) by Schrader et al. (2000) and as Oscillatoria cf. chalybea by Martin et al. (1991)]. The musty compound 2-methylisoborneol which causes “off-flavor” problems in channel catfish (Ictalurus punctatus) aquaculture in the United States of America (USA) is produced by P. perornata (Martin et al. 1991). Anthraquinone-59 is selectively toxic towards certain species of cyanobacteria commonly found in catfish aquaculture ponds in the southeastern USA including P. perornata, Planktothrix agardhii (Gomont) Anagnostidis & Komárek, and
Antioxidant Enzyme Activities in the Cyanobacteria Planktothrix Agardhii… 475
Raphidiopsis brookii (Hill), but less toxic towards certain species of green algae such as Selenastrum capricornutum [synonym for Pseudokirchneriella subcapitata (Korshikov) F. Hindák] and diatoms (Schrader et al. 2003). The toxic mode of action of anthraquinone-59 towards P. perornata involves the generation of ROS (Schrader et al. 2005). One possible reason for the effectiveness of this compound is the reduced ability of these cyanobacteria to “detoxify” ROS. The antioxidant enzyme activities of P. perornata, P. agardhii, and R. brookii have not been reported. Therefore, the goals of this study were to determine if the activities of superoxide dismutase (SOD), catalase, ascorbate peroxidase (APX), and glutathione peroxidase (GPX) are deficient in P. perornata, P. agardhii, and R. brookii compared to S. capricornutum, and to evaluate if such a deficiency might be the cause for the selective toxicity of anthraquinone-59 and other ROS-generating compounds towards these cyanobacteria.
MATERIALS AND METHODS
Cultures and Continuous Culture Systems Cultures of Planktothrix perornata, Planktothrix agardhii, and Raphidiopsis brookii were
isolated from water samples obtained from catfish production ponds located in west Mississippi, USA. A culture of Selenastrum capricornutum was obtained from the United States Environmental Protection Agency, Corvallis, Oregon. In order to provide a source of cells growing at a fairly constant rate, these unialgal cultures were grown in continuous, steady-state culture systems. The methods by Schrader et al. (1997) were used to maintain the continuous culture systems in which each culture was grown separately at 29oC under continuous light (fluorescent, daylight 32W and 40W circular bulbs) with a photon flux density of 12-29 µmol/m2/sec and air-flow rate of 16-33L/h. Cultures were considered to be in steady-state after a minimum of five generation times or 5(ln2/µ), where µ is the growth rate.
Superoxide Dismutase Activity Assay Cells from cyanobacteria continuous cultures were harvested and soluble cell fractions
prepared using methods described previously (Tel-Or et al. 1986). Cells from the S. capricornutum continuous culture system were harvested and cell fractions prepared according to previous studies (Sauser et al. 1997). A French Pressure cell press (Spectronic Instruments, Rochester, New York, USA) was used to rupture cells. Cyanobacteria cells were passed twice through the French pressure cell at 15,000 psi while cells of S. capricornutum were passed through twice at 18,000 psi. The centrifugation conditions (speed and time) used for obtaining soluble cell fractions containing SOD (i.e., supernatant from final centrifugation step) from cyanobacterial cells and green algae cells were the same as in the respective methods of Tel-Or et al. (1986) and Sauser et al. (1997).
In order to assay for activities of membrane-associated SOD (MnSOD), cell pellets were resuspended in buffer after removal of supernatant (soluble cell fractions of SOD), vortexed,
Kevin K. Schrader and Franck E. Dayan 476
and assayed. The buffer used to wash the cyanobacterial cell pellets after centrifugation (prior to fractionation) and the final cyanobacterial cell fractions and pellets for the assay consisted of 0.1 M phosphate buffer (pH 7.5) with 5.0 mM EDTA. For S. capricornutum, cell pellets were washed twice in a buffer consisting of 40.0 mM Tris-acetate (pH 8.3) with 1.0 mM EDTA prior to fractionation while final soluble cell fractions and pellet preparations used for the assay were suspended in a buffer containing 40.0 mM Tris-acetate (pH 8.3) with 1.0 mM EDTA, 330.0 mM sorbitol, and 5.0 µM ascorbate. Results from the measurement of activities of soluble SOD and MnSOD were combined to yield total SOD.
A SOD assay kit (WST; Dojindo Molecular Technologies, Inc., Gaithersburg, Maryland, USA) was used to determine SOD activity in cell fractions. This assay kit utilizes a water-soluble tetrazolium salt (WST-1) that produces a water-soluble formazan dye upon reduction with a superoxide anion. A 96-well microplate was used to conduct the assay, and a Packard model SpectraCount microplate photometer (Packard Instrument Company, Meriden, Connecticut, USA) was used to measure the absorbance (440 nm) of the wells. The same procedures outlined in the assay manual were used except the microplate was incubated at 29oC instead of 37oC. The SOD activity is measured as an inhibition activity of the reduction of the formazan dye and subsequently a decrease in color development at 440 nm.
Determination of Catalase Activity Catalase activity was measured using the assay method of Tel-Or et al. (1986), except
that the reaction mixture contained 25.0 mM phosphate buffer, pH 7.4, and 12.5 mM H2O2. The reaction was initiated with the addition of reaction mixture (0.5 mL) to intact continuous culture cells (1.5 mL) contained in the oxygen electrode chamber. Oxygen evolution was initiated under saturating light conditions (10 mmol/m2/sec photosynthetically active radiation) using a fiber optic light source and was measured polarographically using a computer-controlled Hansatech DW1 oxygen probe (Hansatech Instruments Ltd., Norfolk, United Kingdom).
Determination of Ascorbate Peroxidase Activity Cells were harvested and soluble cell fractions prepared in the same manner used for
determining SOD activity, except for the following: 1) the buffer used to resuspend the cell pellets before rupture via French press consisted of 50.0 mM potassium phosphate (pH 7.0), 0.1 mM EDTA, and 1.0 mM ascorbate; and 2) ruptured cyanobacteria cells and cells of S. capricornutum were microcentrifuged at 17,000g using a Hettich model EBA 12R microcentrifuge (Hettich Zentifugen, Tuttlingen, Germany). A microcentrifuge was used for the final centrifugation step since the volume of phosphate buffer used to resuspend the cell pellets was reduced by 50% (to 10 mL) compared to the method used for determining SOD activity. The phosphate buffer volume was reduced to help concentrate APX in order to provide measurable activity.
The APX activity method of Nakano and Asada (1981) was used. The reference wavelength of a scanning spectrophotometer (model UV-3101PC; Shimadzu, Kyoto, Japan) was set at 310 nm. The activity of APX was calculated by measuring the decrease in
Antioxidant Enzyme Activities in the Cyanobacteria Planktothrix Agardhii… 477
absorbance at 290 nm (an absorbance coefficient of 2.8 mM-1 cm-1) as ascorbate was oxidized after the addition of 10 µL of 10.0 mM H2O2 to 990 µL of the reaction mixture [supernatant containing enzyme from cell preparation and phosphate buffer] in a quartz cuvette. The absorbance decrease was recorded 10-30 sec after the addition of 10.0 mM H2O2. Controls containing only phosphate buffer were included to correct for the non-enzymatic oxidation of ascorbate by hydrogen peroxide.
Thiol-Dependent Peroxidase Activity Cells were harvested and soluble cell fractions prepared in the same manner used for
determining APX activity. The methods described by Tichy and Vermaas (1999) were used, with 1.0 mM dithiothreitol substituted for thioredoxin as an electron donor for thiol peroxidase (TPX). Butyl peroxide was used as a substrate instead of hydrogen peroxide (H2O2) to help determine TPX activity since H2O2 can be used by catalase and make such measurement difficult.
Glutathione Peroxidase Activity Assay Cells were harvested and soluble cell fractions prepared in the same manner used for
determining SOD activity, except for the following: 1) 0.1 M phosphate buffer (pH 8.3) with 1.0 mM EDTA was used to suspend final cell preparations of S. capricornutum to be used in the assay; 2) ruptured cells were microcentrifuged at 17,000g using a Hettich model EBA 12R microcentrifuge (Hettich Zentifugen, Tuttlingen, Germany); and 3) cell pellets were resuspended in a reduced volume of phosphate buffer (75% less) to obtain a final volume of 5 mL to help concentrate any GPX in order to provide measurable activity. A GPX assay kit (Cat.# 0805002; ZeptoMetrix Corp., Buffalo, New York) was used to determine GPX activity, and the same procedures outlined in the assay manual were used. To help determine the presence or absence of GPX activity, cell preparations were divided and one portion was heated at 90oC for 15 min while the other was maintained at room temperature (25oC) before conducting the assay. The quality control material (from human plasma) provided in the assay kit was used to validate the assay, and the reaction mixture included with the kit contained NADPH as an electron donor for cyanobacterial GPXs.
Measurement of Protein Content The protein content of soluble cell fractions was determined by the protein measurement
method of Bradford (1976). Cells were harvested and soluble cell fractions prepared in the same manner used for determining SOD activity, except that ruptured cell suspensions were centrifuged at 17,000g for 30 min at 4oC using a Hettich model EBA 12R microcentrifuge (Hettich Zentifugen, Tuttlingen, Germany). After centrifugation, the supernatant was removed and placed on ice. One milliliter of the supernatant (diluted with sterile deionized H2O to contain approximately 1-20 µg protein/mL based upon bovine serum albumin standard curve) was pipetted into a 13 x 100 mm glass test tube and 250 µL of Bio-Rad
Kevin K. Schrader and Franck E. Dayan 478
protein dye reagent (Bio-Rad Laboratories, Inc., Hercules, California, USA) was added to each test tube and mixed. This procedure was done in triplicate, and the supernatant and dye mixtures were transferred to 1.5 ml polystyrene cuvettes. Absorbance was measured at 595 nm using a Shimadzu model UV-3101PC scanning spectrophotometer (Shimadzu, Kyoto, Japan).
Bovine serum albumin (BSA) standards were prepared using the method of Bradford (1976). Solutions of BSA were prepared at concentrations of 2.5, 5.0, 10.0, and 15.0 µg/mL. The same procedures used for determining protein content of soluble cell fractions were used, and a standard curve (protein concentrations versus absorbance readings) was developed to help determine the actual protein content in the cell fraction samples.
Statistical Analysis Mean and standard errors were calculated for the enzyme activities of each of the
organisms tested. Statistical differences in enzyme activity were established using ANOVA followed by Tukey HSD for equal sample sizes. Statistical analyses were performed using Statistical Analysis Systems (SAS) version 9.1 (SAS Institute Inc., Cary, North Carolina, USA).
RESULTS AND DISCUSSION Cyanobacteria possess two main enzymatic systems that scavenge ROS and protect these
microorganisms against oxidative stress. One group consists of superoxide dismutases (SOD) (figure 1B). At least two types of SOD, a cytosolic Fe-SOD and a thylakoid-bound Mn-SOD, have been found in cyanobacteria (Obinger et al. 1998). Superoxide anion radicals are used by SOD to form O2 and H2O2, and this step constitutes the primary defense of cells against potential oxidative damage from superoxide anions. Previous studies have identified the presence of SOD activity in several types of cyanobacteria including Anabaena cylindrica (Henry et al. 1978), Anacystis nidulans (Abeliovich et al. 1974), Gloeocapsa sp. (Hammouda 1999), Microcystis aeruginosa (Tytler et al. 1984), Nostoc muscorum (Bhunia et al. 1993), Plectonema boryanum (Asada et al. 1975), and Spirulina platensis (Singh et al. 1995). Studies have also verified the presence of Fe-SOD, Mn-SOD, and/or Cu-Zn-SOD in eukaryotic algae, more specifically green algae such as Chara fragilis and Spirogyra sp. (Henry and Hall 1977; Asada 1988; Kanematsu and Asada 1989).
The other enzyme system consists of the hydroperoxidases that are categorized into catalases and peroxidases (figure 1B). These enzymes convert H2O2 formed by SOD to H2O and O2. Catalase activity has been confirmed in the crude extracts and purified enzyme preparations from many species of cyanobacteria, though not in all species (Obinger et al. 1998). Peroxidase activity has also been detected, but less frequently than catalase activity, among cited examples (Obinger et al. 1998). In cyanobacteria and eukaryotic algae, ascorbate and glutathione can provide electrons for peroxidases (Asada et al. 1993; Obinger et al. 1998). Certain species of cyanobacteria possess APX activity and/or GPX activity (Obinger et al. 1998). In addition, the presence of TPXs or thioredoxin peroxidases that may functionally
Antioxidant Enzyme Activities in the Cyanobacteria Planktothrix Agardhii… 479
take the place of APXs have been discovered in cyanobacteria (e.g., Synechocystis sp.) (Hosoya-Matsuda et al. 2005).
In our study, total SOD activity was at least 3X higher in S. capricornutum compared to the three species of cyanobacteria studied (figure 2A). Among the three cyanobacteria species tested, total SOD activity was highest in R. brookii and lowest in P. agardhii. Although MnSOD activity was higher in P. perornata (75.0±1.7 U/min/mg protein) and R. brookii (58.7±1.2 U/min/mg protein) compared to S. capricornutum (37.7±7.2 U/min/mg protein) and P. agardhii (36.7±1.2 U/min/mg protein), total SOD activity was significantly higher in S. capricornutum than in the other three cyanobacteria species. Previous studies (Sauser et al. 1997) reported high levels of SOD activity for S. capricornutum, but our study is the first to confirm SOD activity in P. agardhii, P. perornata, and R. brookii and demonstrates that the total SOD activities in these representative cyanobacteria are quantitatively lower than in a representative eukaryotic alga.
Catalase activity was lowest in P. perornata compared to the other cyanobacteria tested, and S. capricornutum had higher catalase activity than any of the cyanobacteria tested (figure 2B). Because catalase activity has been reported in many other species of cyanobacteria (Obinger et al. 1998), it is not surprising that catalase activity was present in P. agardhii, P. perornata, and R. brookii. Previous research (Chua 1971) found that the cyanobacterium Anabaena flos-aquae is deficient in catalase activity and other cyanobacteria (Anabaena spiroides, Phormidium luridum var. olivacea, Plectonema calothricoides, and P. boryanum) possess low catalase activity while the green alga Chlamydomonas reinhardtii has high catalase activity. The catalase specific activity of S. capricornutum in our study (913.3 nmol O2/min/mg protein) was much higher than in previous studies (Sauser et al. 1997). This difference may be due in part to the culture conditions used in each study. The current study utilized stationary continuous culture systems bubbled with sterile air to maintain the unialgal culture in steady-state growth whereas previous experiments (Sauser et al. 1997) used shaken cultures bubbled with air enriched with 1% CO2 (non continuous-type systems). A difference in the intensity of culture illumination may also be a factor for the variation in results, though previous studies (Sauser et al. 1997) did not state the photon flux rate used. Converse to the conclusions of previous research (Sauser et al. 1997), our results indicate that catalase does play a role in H2O2 removal in S. capricornutum.
Ascorbate peroxidase activity was also higher (approximately 10X) in S. capricornutum compared to the cyanobacteria tested, and P. agardhii had slightly higher APX activity compared to P. perornata and R. brookii (figure 2C). Optimal APX activity in S. capricornutum occurs at pH 8.0 (Sauser et al. 1997). Although the medium pH of the continuous culture system of S. capricornutum was maintained at 7.6-8.0 in our study, the APX specific activity (10.85 µmol/min/mg protein) was less than previously reported values of approximately 60-250 µmol/min/mg protein (Sauser et al. 1997). Again, the difference in the culture conditions used for each study may be the reason for the different APX specific activities found in S. capricornutum. Although APX activity was detected in P. agardhii and P. perornata, there is no clear correlation between the taxonomic classification of cyanobacteria and the presence or absence of APX (Obinger et al. 1998).
TPX activity could not be detected in P. perornata, even after increasing concentrations of dithiothreitol to 10 mM and concentrating harvested cells 10X. Therefore, comparison of TPX activity could not be made and TPX contribution, if any, is believed to be minimal in converting H2O2 to H2O and O2 for P. perornata.
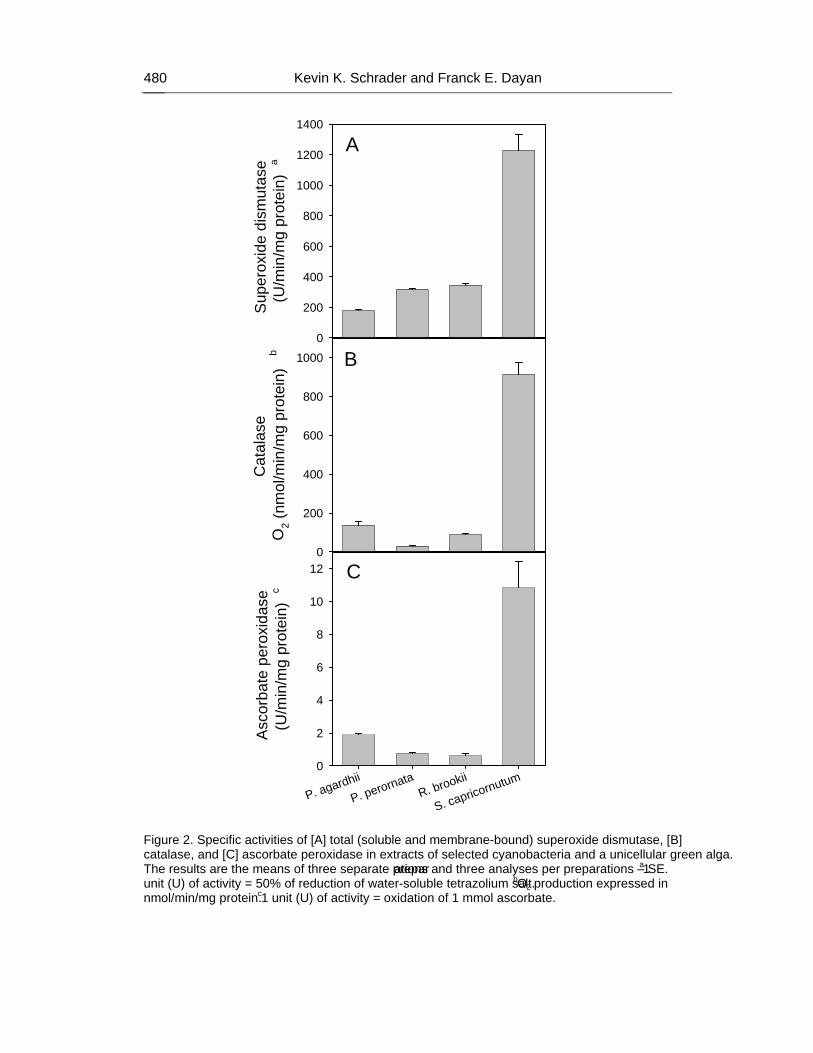
Kevin K. Schrader and Franck E. Dayan 480
P. agardhii
P. perornataR. brookii
S. capricornutum
Asc
orba
te p
erox
idas
e(U
/min
/mg
prot
ein)
c
0
2
4
6
8
10
12 C
Cat
alas
eO
2 (nm
ol/m
in/m
g pr
otei
n)b
0
200
400
600
800
1000 B
Supe
roxi
de d
ism
utas
e(U
/min
/mg
prot
ein)
a
0
200
400
600
800
1000
1200
1400
A
Figure 2. Specific activities of [A] total (soluble and membrane-bound) superoxide dismutase, [B] catalase, and [C] ascorbate peroxidase in extracts of selected cyanobacteria and a unicellular green alga. The results are the means of three separate preparations and three analyses per preparations ± SE. a1 unit (U) of activity = 50% of reduction of water-soluble tetrazolium salt. bO2 production expressed in nmol/min/mg protein. c1 unit (U) of activity = oxidation of 1 mmol ascorbate.
Antioxidant Enzyme Activities in the Cyanobacteria Planktothrix Agardhii… 481
Glutathione peroxidase activity was not detected in any of the test organisms used in our study. Previous studies (Sauser et al. 1997) also did not detect GPX activity in S. capricornutum. The presence of GPX activity in cyanobacteria appears to be quite variable. Although GPX activity is present in the filamentous cyanobacterium Anabaena variabilis (Bagchi et al. 1991), GPX does not appear to be prevalent in cyanophytes based upon the summary of various studies performed to detect such activity (Obinger et al. 1998).
Previous studies have reported on the selective toxicity of herbicides such as diquat [6,7-dihydrodipyrido(1,2-α:2’,1’-c)pyrazinediium] and paraquat [1,1’-dimethyl-4,4’-bipyridinium] towards P. perornata compared to S. capricornutum (Schrader et al. 1998). These bipyridilium herbicides generate ROS intracellularly as a mechanism of toxic action towards photosynthetic organisms such as plants and algae. The ROS-generating anthraquinone-59 was found to be more toxic towards P. perornata compared to S. capricornutum and also selectively toxic amongst several species of cyanobacteria (Schrader et al. 2003). In efficacy studies (Schrader et al. 2003), R. brookii appeared slightly more affected by anthraquinone-59 than P. perornata, while P. perornata was more inhibited than P. agardhii. Anthraquinone-59 is not lipophilic, and, therefore, this compound does not directly nucleate peroxidation reactions in the membranes of cyanobacteria in the same manner as exogenous polyunsaturated fatty acids (Sakamato et al. 1998).
CONCLUSION The lower antioxidant enzyme activities in the cyanobacteria used in this study compared
to S. capricornutum may be a deficiency when dealing with ROS-generating compounds. If so, this physiological characteristic is an area of “weakness” to focus on for the discovery of novel, selective algicides for use in catfish aquaculture and in other aquatic ecosystems where the management of noxious species of cyanobacteria is desired. Other potential causes for the selective toxicity of ROS-generating compounds such as the potential difference in compound transport into the cells of cyanobacteria compared to green algae could also be involved.
ACKNOWLEDGEMENTS
The technical assistance of Dewayne Harries, J’Lynn Howell, Ramona Pace, and Phaedra
Page is greatly appreciated.
REFERENCES
Abeliovich, A.; Kellenberg, C.; Shilo, M. Effect of photooxidative conditions on levels of superoxide dismutase in Anacystis nidulans. Photochem. Photobiol. 1974, 19, 379-382.
Aráoz, R.; Häder, D.-P. Enzymatic antioxidant activity in two cyanobacteria species exposed to solar radiation. Recent Res. Devel. Photochem. Photobiol. 1999, 3, 123-132.
Asada, K. Superoxide dismutase. In: Otsuka, S.; Yamanaka, T., editors. Metalloproteins-Chemical Properties and Biological Effects. Amsterdam: Elsevier; 1988; pp. 331-341.
Kevin K. Schrader and Franck E. Dayan 482
Asada, K.; Miyake, C.; Sano, S.; Amako, K. Scavenging of hydrogen peroxide in photosynthetic organisms – from catalase to ascorbate peroxidase. In: Welinder, K.G.; Rasmussen, S.K.; Greppin, H., editors. Plant Peroxidases: Biochemistry and Physiology. Geneva: University of Geneva Press; 1993; pp. 242-250.
Asada, K.; Yoshikawa, K.; Takahashi, M.-A.; Maeda, Y.; Enmanji, K. Superoxide dismutases from a blue-green alga, Plectonema boryanum. J. Biol. Chem. 1975, 250, 2801-2807.
Bagchi, S. N.; Ernst, A.; Böger, P. The effect of activated oxygen species on nitrogenase of Anabaena variabilis. Z. Naturforsch. 1991, 46c, 407-415.
Bhunia, A. K.; Roy, D.; Banerjee, S. K. Carbaryl-induced effects on glutathione content, glutathione reductase and superoxide dismutase activity of the cyanobacterium Nostoc muscorum. Lett. Appl. Microbiol. 1993, 18, 10-13.
Bradford, M. M. A rapid and sensitive method for the quantitation of microgram quantities of protein utilizing the principle of protein-dye binding. Anal. Biochem. 1976, 72, 248-254.
Chua, N.-H. The methyl viologen-catalyzed Mehler reaction and catalase activity in blue-green algae and Chlamydomonas reinhardi. Biochem. Biophys. Acta 1971, 245, 277-287.
Hammouda, O. Purification and identification of the type of superoxide dismutase from Gloeocapsa sp. Folia Microbiol. 1999, 44, 32-36.
Henry, L. E. A.; Hall, D. O. Superoxide dismutases in green algae: an evolutionary survey. Plant Cell Physiol. 1977, Special issue 3 (Photosynthetic Organelles), 377-382.
Henry, L. E. A.; Gogotov, I. N.; Hall, D. O. Superoxide dismutase and catalase in the protection of the proton-donating systems of nitrogen fixation in the blue-green alga Anabaena cylindrica. Biochem. J. 1978, 174, 373-377.
Hosoya-Matsuda, N.; Motohashi, K.; Yoshimura, H.; Nozaki, A.; Inoue, K.; Ohmori, M.; Hisabori, T. Anti-oxidative stress system in cyanobacteria. J. Biol. Chem. 2005, 280, 840-846.
Kanematsu, S.; Asada, K. CuZn-SOD from the fern Equisetum arvense and the green alga Spirogyra sp.: occurrence of chloroplast and cytosol types of enzyme. Plant Cell Physiol. 1989, 30, 717-727.
Martin, J. F.; Izaguirre, G.; Waterstrat, P. A planktonic Oscillatoria species from Mississippi catfish ponds that produces the off-flavor compound 2-methylisoborneol. Water Res. 1991, 25, 1447-1451.
Nakano, Y.; Asada, K. Hydrogen peroxide is scavenged by ascorbate-specific peroxidase in spinach chloroplasts. Plant Cell Physiol. 1981, 22, 867-880.
Obinger, C.; Regelsberger, G.; Pircher, A.; Strasser, G.; Peschek, G. A. Scavenging of superoxide and hydrogen peroxide in blue-green algae (cyanobacteria). Physiol. Plant 1998, 104, 693-698.
Sakamoto, T.; Delgaizo, V. B.; Bryant, D. A. Growth on urea can trigger death and peroxidation of the cyanobacterium Synechococcus sp. strain PCC 7002. Appl. Environ. Microbiol. 1998, 64, 2361-2366.
Sauser, K. R.; Liu, J. K.; Wong, T.-Y. Identification of a copper-sensitive ascorbate peroxidase in the unicellular green alga Selenastrum capricornutum. BioMetals 1997, 10, 163-168.
Schrader, K. K.; de Regt, M. Q.; Tucker, C. S.; Duke, S. O. A rapid bioassay for selective algicides. Weed Technol. 1997, 11, 767-774.
Antioxidant Enzyme Activities in the Cyanobacteria Planktothrix Agardhii… 483
Schrader, K. K.; de Regt, M. Q.; Tidwell, P. D.; Tucker, C. S.; Duke, S. O. Compounds with selective toxicity towards the off-flavor metabolite-producing cyanobacterium Oscillatoria cf. chalybea. Aquaculture 1998, 163, 85-99.
Schrader, K. K.; Dayan, F. E.; Allen, S. N.; de Regt, M. Q.; Tucker, C. S.; Paul, R. N., Jr. 9,10-Anthraquinone reduces the photosynthetic efficiency of Oscillatoria perornata and modifies cellular inclusions. Int. J. Plant Sci. 2000, 161, 265-270.
Schrader, K. K.; Nanayakkara, N. P. D.; Tucker, C. S.; Rimando, A. M.; Ganzera, M.; Schaneberg, B. T. Novel derivatives of 9,10-anthraquinone are selective algicides against the musty-odor cyanobacterium Oscillatoria perornata. Appl. Environ. Microbiol. 2003, 69, 5319-5327.
Schrader, K. K.; Dayan, F. E.; Nanayakkara, N. P. D. Generation of reactive oxygen species by a novel anthraquinone derivative in the cyanobacterium Planktothrix perornata (Skuja). Pest. Biochem. Physiol. 2005, 81, 198-207.
Singh, D. P.; Singh, N.; Verma, K. Photooxidative damage to the cyanobacterium Spirulina platensis mediated by singlet oxygen. Curr. Microbiol. 1995, 31, 44-48.
Tel-Or, E.; Huflejt, M. E.; Packer, L. Hydroperoxide metabolism in cyanobacteria. Arch. Biochem. Biophys. 1986, 246, 396-402.
Tichy, M.; Vermaas, W. In vivo role of catalase-peroxidase in Synechocystis sp. strain PCC 6803. J. Bacteriol. 1999, 181, 1875-1882.
Tytler, E. M.; Wong, T.; Codd, G. A. Photoinactivation in vivo of superoxide dismutase and catalase in the cyanobacterium Microcystis aeruginosa. FEMS Microbiol. Lett. 1984, 23, 239-242. Reviewed by Drs. Kevin C. Vaughn and Robert E. Hoagland, USDA, ARS, Southern
Weed Science Research Unit, Stoneville, Mississippi, USA.

In: Handbook on Cyanobacteria ISBN: 978-1-60741-092-8 Editors: P. M. Gault and H. J. Marler © 2009 Nova Science Publishers, Inc.
Chapter 18
CORRINOID COMPOUNDS IN CYANOBACTERIA
Yukinori Yabuta and Fumio Watanabe* School of Agricultural, Biological and Environmental Sciences,
Faculty of Agriculture, Tottori University, Tottori 680-8553, Japan
ABSTRACT
Cyanobacteria produce numerous bioactive compounds including vitamin B12. Corrinoid compound found in various edible cyanobacteria (Spirulina sp., Nostoc sp., Aphanizomenon sp., and so on) were identified as pseudovitamin B12 (7-adeninyl cobamide), which is inactive for humans. Edible cyanobacteria are not suitable for use as a vitamin B12 source, especially in vegetarians.
Analysis of genomic information suggests that most cyanobacteria can synthesize the corrin ring, but not the 5,6-dimethylbenzimidazolyl nucleotide moiety in vitamin B12 molecule. Therefore, the bacterial cells would construct a corrinoid compound as pseudovitamin B12 by using a cellular metabolite, adenine nucleotide. Pseudovitamin B12 appears to function as coenzymes of cobalamin-dependent methionine synthase or ribonucleotide reductase (or both).
Keywords: Aphanizomenon, biosynthesis, methionine synthase, Nostoc, pseudovitamin B12, ribonucleotide reductase, Spirulina, vitamin B12,
I. INTRODUCTION Cyanobacteria produce numerous bioactive compounds. Some of these are strong
hepatotoxins or neurotoxins that cause serious problems for public health when cyanobacterial blooms occur in lakes, rivers, or drinking-water reservoirs [1]. Other secondary metabolites have therapeutic properties [2]. In the biotechnological aspects, the most important cyanobacteria are Spirulina (Arthrospira) platensis, Nostoc commune and Aphanizomenon flos-aquae. Substantial amounts of these bacterial cells, Spirulina (3000
* To whom requests for reprints should be addressed. E-mail; [email protected]
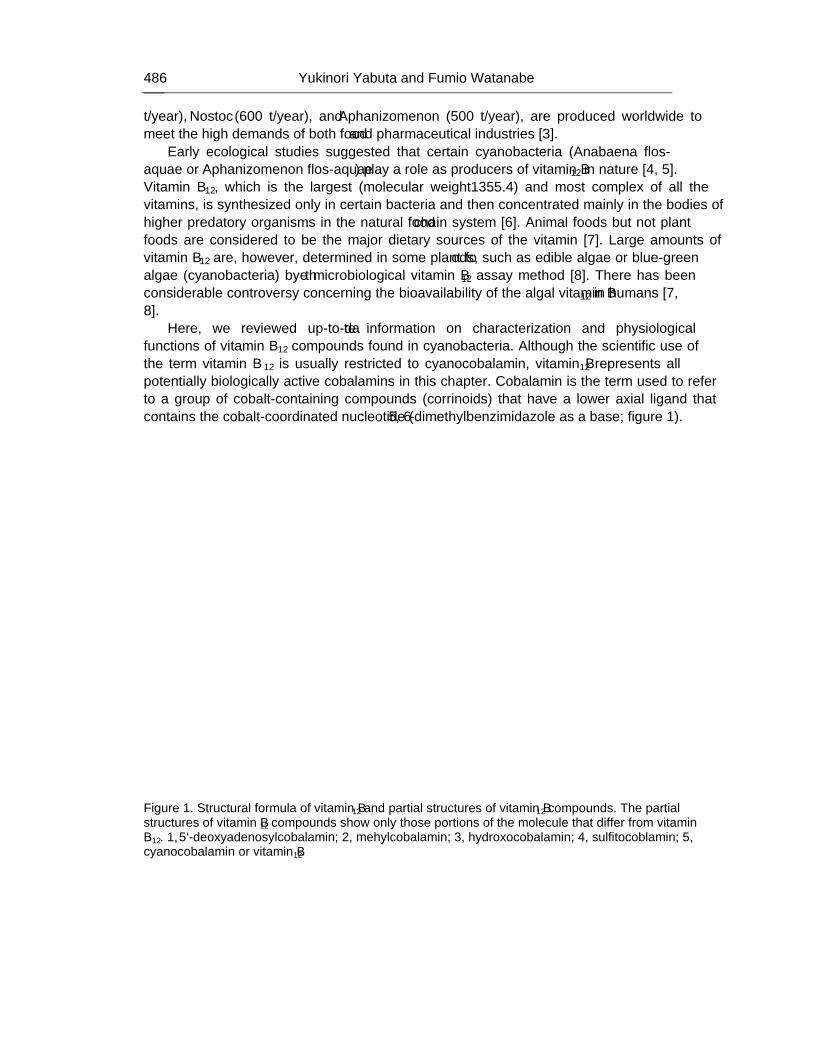
Yukinori Yabuta and Fumio Watanabe 486
t/year), Nostoc (600 t/year), and Aphanizomenon (500 t/year), are produced worldwide to meet the high demands of both food and pharmaceutical industries [3].
Early ecological studies suggested that certain cyanobacteria (Anabaena flos-aquae or Aphanizomenon flos-aquae) play a role as producers of vitamin B12 in nature [4, 5]. Vitamin B12, which is the largest (molecular weight1355.4) and most complex of all the vitamins, is synthesized only in certain bacteria and then concentrated mainly in the bodies of higher predatory organisms in the natural food chain system [6]. Animal foods but not plant foods are considered to be the major dietary sources of the vitamin [7]. Large amounts of vitamin B12 are, however, determined in some plant foods, such as edible algae or blue-green algae (cyanobacteria) by the microbiological vitamin B12 assay method [8]. There has been considerable controversy concerning the bioavailability of the algal vitamin B12 in humans [7, 8].
Here, we reviewed up-to-date information on characterization and physiological functions of “vitamin B12” compounds found in cyanobacteria. Although the scientific use of the term ‘‘vitamin B12’’ is usually restricted to cyanocobalamin, vitamin B12 represents all potentially biologically active cobalamins in this chapter. Cobalamin is the term used to refer to a group of cobalt-containing compounds (corrinoids) that have a lower axial ligand that contains the cobalt-coordinated nucleotide (5, 6-dimethylbenzimidazole as a base; figure 1).
Figure 1. Structural formula of vitamin B12 and partial structures of vitamin B12 compounds. The partial structures of vitamin B12 compounds show only those portions of the molecule that differ from vitamin B12. 1, 5`-deoxyadenosylcobalamin; 2, mehylcobalamin; 3, hydroxocobalamin; 4, sulfitocoblamin; 5, cyanocobalamin or vitamin B12.
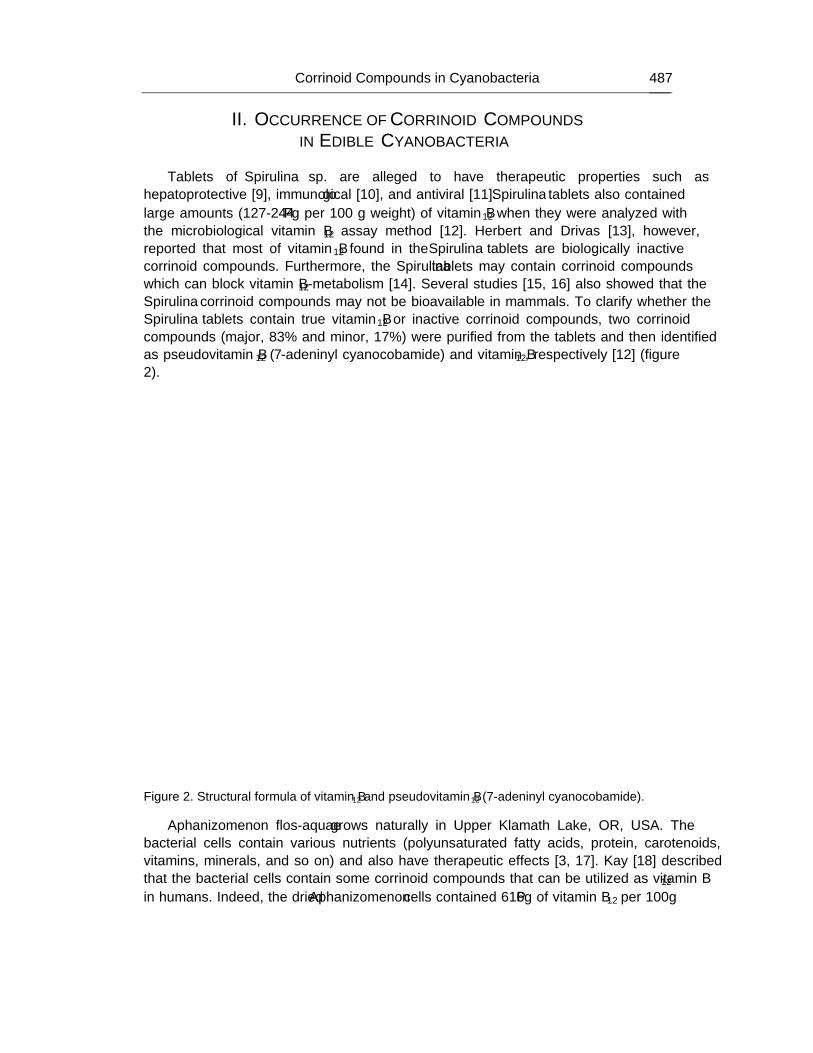
Corrinoid Compounds in Cyanobacteria 487
II. OCCURRENCE OF CORRINOID COMPOUNDS IN EDIBLE CYANOBACTERIA
Tablets of Spirulina sp. are alleged to have therapeutic properties such as
hepatoprotective [9], immunological [10], and antiviral [11]. Spirulina tablets also contained large amounts (127-244 μg per 100 g weight) of vitamin B12 when they were analyzed with the microbiological vitamin B12 assay method [12]. Herbert and Drivas [13], however, reported that most of vitamin B12 found in the Spirulina tablets are biologically inactive corrinoid compounds. Furthermore, the Spirulina tablets may contain corrinoid compounds which can block vitamin B12-metabolism [14]. Several studies [15, 16] also showed that the Spirulina corrinoid compounds may not be bioavailable in mammals. To clarify whether the Spirulina tablets contain true vitamin B12 or inactive corrinoid compounds, two corrinoid compounds (major, 83% and minor, 17%) were purified from the tablets and then identified as pseudovitamin B12 (7-adeninyl cyanocobamide) and vitamin B12, respectively [12] (figure 2).
Figure 2. Structural formula of vitamin B12 and pseudovitamin B12 (7-adeninyl cyanocobamide).
Aphanizomenon flos-aquae grows naturally in Upper Klamath Lake, OR, USA. The bacterial cells contain various nutrients (polyunsaturated fatty acids, protein, carotenoids, vitamins, minerals, and so on) and also have therapeutic effects [3, 17]. Kay [18] described that the bacterial cells contain some corrinoid compounds that can be utilized as vitamin B12 in humans. Indeed, the dried Aphanizomenon cells contained 616 μg of vitamin B12 per 100g
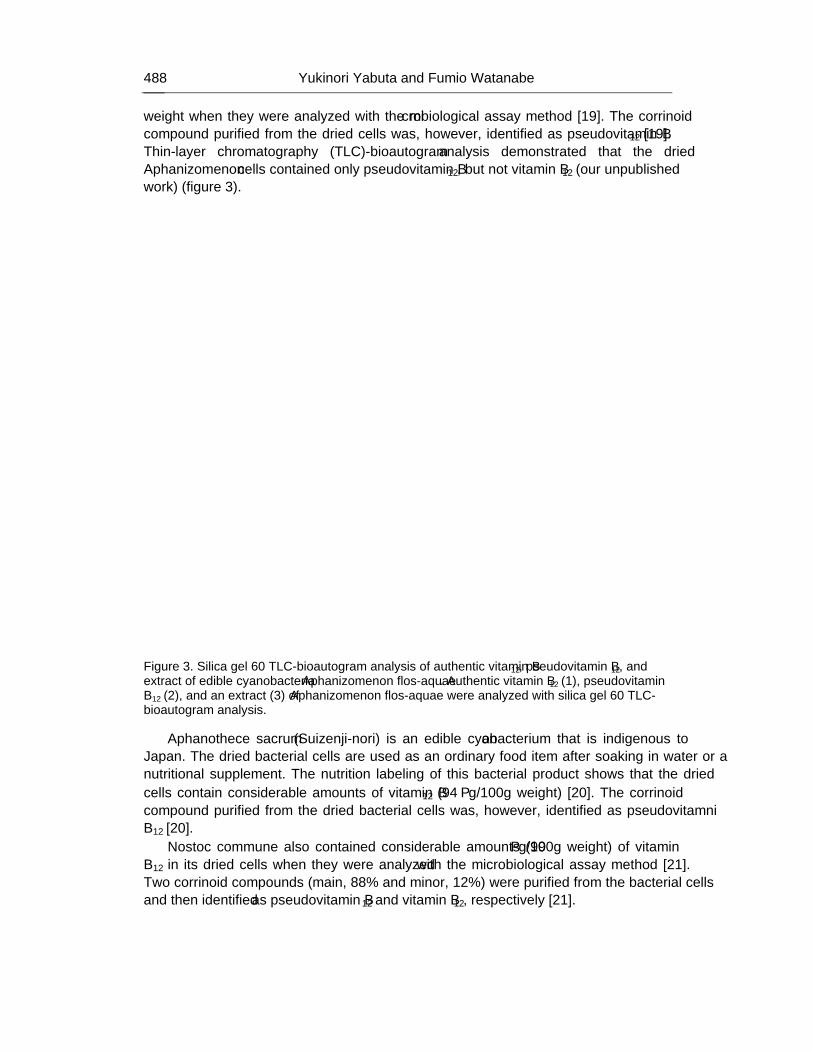
Yukinori Yabuta and Fumio Watanabe 488
weight when they were analyzed with the microbiological assay method [19]. The corrinoid compound purified from the dried cells was, however, identified as pseudovitamin B12 [19]. Thin-layer chromatography (TLC)-bioautogram analysis demonstrated that the dried Aphanizomenon cells contained only pseudovitamin B12, but not vitamin B12 (our unpublished work) (figure 3).
Figure 3. Silica gel 60 TLC-bioautogram analysis of authentic vitamin B12, pseudovitamin B12, and extract of edible cyanobacteria Aphanizomenon flos-aquae. Authentic vitamin B12 (1), pseudovitamin B12 (2), and an extract (3) of Aphanizomenon flos-aquae were analyzed with silica gel 60 TLC-bioautogram analysis.
Aphanothece sacrum (Suizenji-nori) is an edible cyanobacterium that is indigenous to Japan. The dried bacterial cells are used as an ordinary food item after soaking in water or a nutritional supplement. The nutrition labeling of this bacterial product shows that the dried cells contain considerable amounts of vitamin B12 (94 μg/100g weight) [20]. The corrinoid compound purified from the dried bacterial cells was, however, identified as pseudovitamni B12 [20].
Nostoc commune also contained considerable amounts (99 μg/100g weight) of vitamin B12 in its dried cells when they were analyzed with the microbiological assay method [21]. Two corrinoid compounds (main, 88% and minor, 12%) were purified from the bacterial cells and then identified as pseudovitamin B12 and vitamin B12, respectively [21].
Corrinoid Compounds in Cyanobacteria 489
Nostoc flagelliforme grows naturally on Chinese inland semi-desert ground and is available on cooking ingredient of Chinese food. The dried bacterial cells contained 113 μg of vitamin B12 per 100 g weight when they were analyzed with the microbiological method [22]. However, TLC-bioautogram analysis indicated that the dried bacterial cells contained only 51.2 μg of vitamin B12 per 100 g weight; the remaining (61.8 μg) is pseudovitamin B12 [22].
Intrinsic factor (IF) involved in the mammalian intestinal absorption of vitamin B12 strictly recognizes the structure of vitamin B12 molecule [23]. Several groups of investigators indicated that pseudovitamin B12 is hardly absorbed in mammalian intestine with a low affinity to IF [24, 25]. 24 h after oral administration of radio-labeled pseudovitamin B12 to rabbits, intestinal absorption and ileal contents of pseudovitamin B12 were shown to be 13-21% of those of authentic vitamin B12 [26]. An intravenous injection of transcobalamin II-pseudovitamin B12 complex showed that plasma clearance and tissue distribution of pseudovitamin B12 are very similar to those of authentic vitamin B12 but that urinary corrinoid excretion is slightly greater in the pseudovitamin B12-injected rabbits than in the authentic vitamin B12-injected rabbits [26]. Although the coenzyme form of pseudovitamin B12 had a 1000-fold higher Km for adenosylcobalamin-dependent mammalian methylmalonyl-CoA mutase than did authentic adenosylcobalamin [27], pseudovitamin B12 was fully active in human cobalamin-dependent apomethionine synthase under the experimental conditions used by Kolhouse et al. [28]. Continuous infusion of pseudovitamin B12 to rats showed that administration of pseudovitamin B12 could not inhibit both enzyme activities of hepatic methylmalonyl-CoA mutase and methionine synthase [29]
These observations suggest that pseudovitamin B12 does not have the ability to act as a vitamin B12 antagonist in mammals. To clarify whether pseudovitamin B12 can block vitamin B12-metabolism in humans, further biochemical studies are needed.
These results strongly suggest that these edible cyanobacteria are not suitable for use as a vitamin B12 source, especially in vegetarians.
III. BIOSYNTHESIS OF CORRINOID COMPOUNDS IN CYANOBACTERIA Spirulina platensis NIES-39 was grown in the presence or absence of cobalt to confirm
whether cobalt stimulate or are essential for both cell growth and synthesis of corrinoid compounds [30]. The Spirulina corrinoid compound (pseudovitamin B12) was increased significantly by the addition of cobalt, indicating that Spirulina cells have the ability to synthesize pseudovitamin B12 de novo.
Synechocystis PCC 6803 also required cobalt for the synthesis of pseudovitamin B12 (our unpublished data). A transition metal-transporting, ATPase, designated CoaT exports cobalt that is surplus to this requirement [31]. Mutants with disrupted coaT reduced tolerance to cobalt but normal resistance to other metals, and coaT transcripts solely accumulated in response to cobalt supplementation [32]. Expression of coaT was also controlled in a metal-dependent manner by the product of a divergently transcribed gene, coaR [32]. CoaR is a cobalt-responsive activator of an abnormally spaced operator-promoter analogous to MerR (the regulator of Gram-negative mercury resistance) [33]. CoaR had a domain showing similarity to precorrin isomerase (CobH), an enzyme of vitamin B12 biosynthesis [32, 33]. This enzyme is known to bind to an intermediate hydrogenobyrinic acid in the pathway for
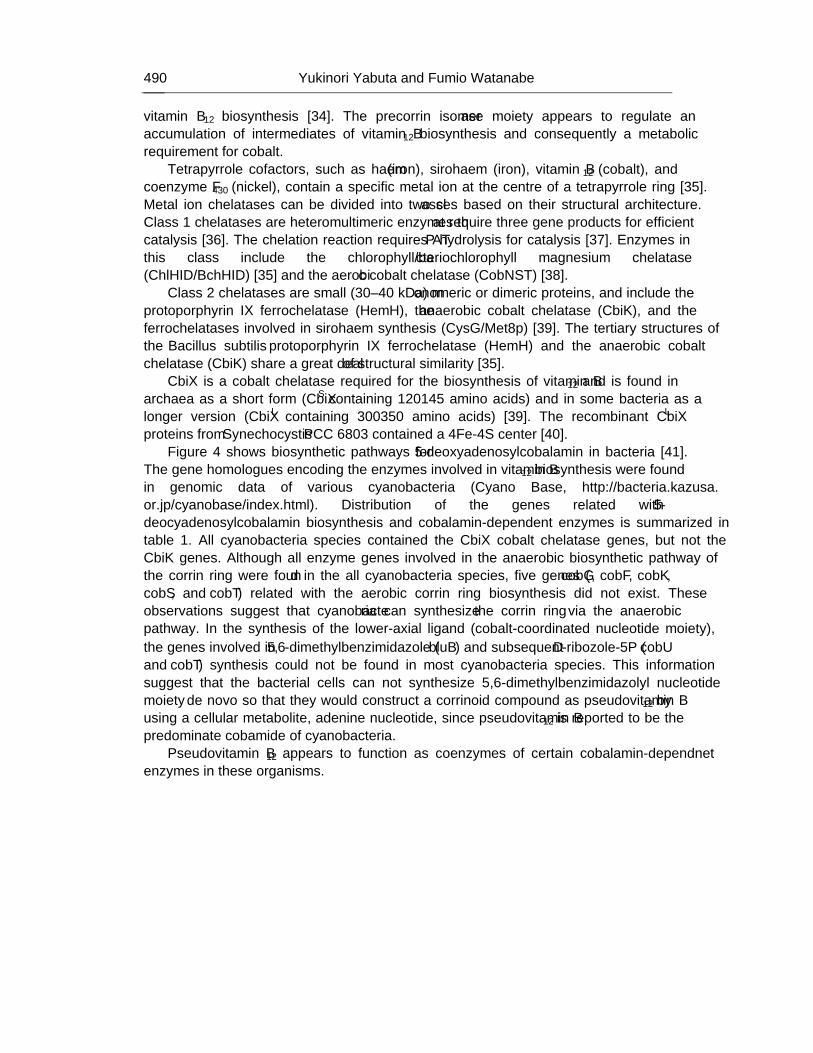
Yukinori Yabuta and Fumio Watanabe 490
vitamin B12 biosynthesis [34]. The precorrin isomerase moiety appears to regulate an accumulation of intermediates of vitamin B12 biosynthesis and consequently a metabolic requirement for cobalt.
Tetrapyrrole cofactors, such as haem (iron), sirohaem (iron), vitamin B12 (cobalt), and coenzyme F430 (nickel), contain a specific metal ion at the centre of a tetrapyrrole ring [35]. Metal ion chelatases can be divided into two classes based on their structural architecture. Class 1 chelatases are heteromultimeric enzymes that require three gene products for efficient catalysis [36]. The chelation reaction requires ATP hydrolysis for catalysis [37]. Enzymes in this class include the chlorophyll/bacteriochlorophyll magnesium chelatase (ChlHID/BchHID) [35] and the aerobic cobalt chelatase (CobNST) [38].
Class 2 chelatases are small (30±40 kDa) monomeric or dimeric proteins, and include the protoporphyrin IX ferrochelatase (HemH), the anaerobic cobalt chelatase (CbiK), and the ferrochelatases involved in sirohaem synthesis (CysG/Met8p) [39]. The tertiary structures of the Bacillus subtilis protoporphyrin IX ferrochelatase (HemH) and the anaerobic cobalt chelatase (CbiK) share a great deal of structural similarity [35].
CbiX is a cobalt chelatase required for the biosynthesis of vitamin B12 and is found in archaea as a short form (CbiXS containing 120–145 amino acids) and in some bacteria as a longer version (CbiXL containing 300–350 amino acids) [39]. The recombinant CbiXL proteins from Synechocystis PCC 6803 contained a 4Fe-4S center [40].
Figure 4 shows biosynthetic pathways for 5’-deoxyadenosylcobalamin in bacteria [41]. The gene homologues encoding the enzymes involved in vitamin B12 biosynthesis were found in genomic data of various cyanobacteria (Cyano Base, http://bacteria.kazusa. or.jp/cyanobase/index.html). Distribution of the genes related with 5’-deocyadenosylcobalamin biosynthesis and cobalamin-dependent enzymes is summarized in table 1. All cyanobacteria species contained the CbiX cobalt chelatase genes, but not the CbiK genes. Although all enzyme genes involved in the anaerobic biosynthetic pathway of the corrin ring were found in the all cyanobacteria species, five genes (cobG, cobF, cobK, cobS, and cobT) related with the aerobic corrin ring biosynthesis did not exist. These observations suggest that cyanobacteria can synthesize the corrin ring via the anaerobic pathway. In the synthesis of the lower-axial ligand (cobalt-coordinated nucleotide moiety), the genes involved in 5,6-dimethylbenzimidazole (bluB) and subsequent α-ribozole-5P (cobU and cobT) synthesis could not be found in most cyanobacteria species. This information suggest that the bacterial cells can not synthesize 5,6-dimethylbenzimidazolyl nucleotide moiety de novo so that they would construct a corrinoid compound as pseudovitamin B12 by using a cellular metabolite, adenine nucleotide, since pseudovitamin B12 is reported to be the predominate cobamide of cyanobacteria.
Pseudovitamin B12 appears to function as coenzymes of certain cobalamin-dependnet enzymes in these organisms.
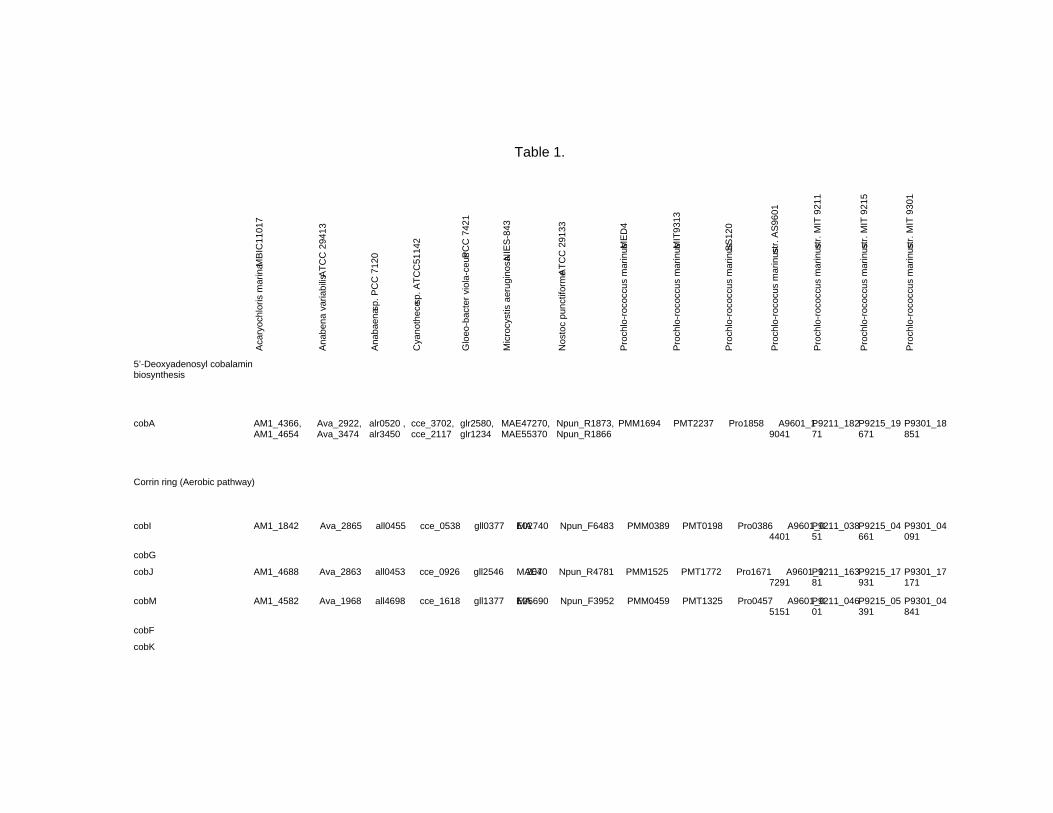
Table 1.
Acar
yoch
lori
s mar
ina
MB
IC11
017
Anab
ena
vari
abili
s ATC
C 2
9413
Anab
aena
sp. P
CC
712
0
Cya
noth
ece
sp. A
TCC
5114
2
Glo
eo-b
acte
r vio
la-c
eus P
CC
742
1
Mic
rocy
stis
aer
ugin
osa
NIE
S-84
3
Nos
toc
punc
tifor
me
ATC
C 2
9133
Proc
hlo-
roco
ccus
mar
inus
MED
4
Proc
hlo-
roco
ccus
mar
inus
MIT
9313
Proc
hlo-
roco
ccus
mar
inus
SS12
0
Proc
hlo-
roco
cus m
arin
us st
r. A
S960
1
Proc
hlo-
roco
ccus
mar
inus
str.
MIT
921
1
Proc
hlo-
roco
ccus
mar
inus
str.
MIT
921
5
Proc
hlo-
roco
ccus
mar
inus
str.
MIT
930
1
5'-Deoxyadenosyl cobalamin biosynthesis
cobA AM1_4366, AM1_4654
Ava_2922, Ava_3474
alr0520 , alr3450
cce_3702, cce_2117
glr2580, glr1234
MAE47270, MAE55370
Npun_R1873, Npun_R1866
PMM1694 PMT2237 Pro1858 A9601_19041
P9211_18271
P9215_19671
P9301_18851
Corrin ring (Aerobic pathway)
cobI AM1_1842 Ava_2865 all0455 cce_0538 gll0377 MAE02740 Npun_F6483 PMM0389 PMT0198 Pro0386 A9601_04401
P9211_03851
P9215_04661
P9301_04091
cobG
cobJ AM1_4688 Ava_2863 all0453 cce_0926 gll2546 MAE42070 Npun_R4781 PMM1525 PMT1772 Pro1671 A9601_17291
P9211_16381
P9215_17931
P9301_17171
cobM AM1_4582 Ava_1968 all4698 cce_1618 gll1377 MAE25690 Npun_F3952 PMM0459 PMT1325 Pro0457 A9601_05151
P9211_04601
P9215_05391
P9301_04841
cobF
cobK
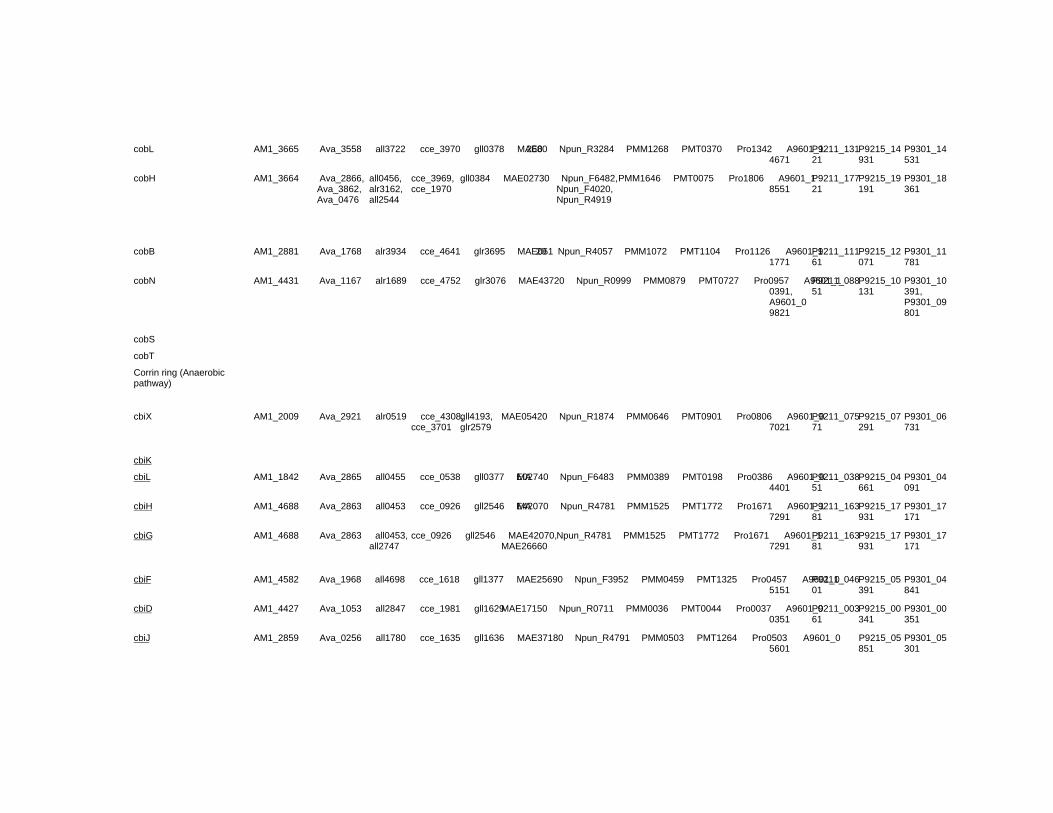
cobL AM1_3665 Ava_3558 all3722 cce_3970 gll0378 MAE02680 Npun_R3284 PMM1268 PMT0370 Pro1342 A9601_14671
P9211_13121
P9215_14931
P9301_14531
cobH AM1_3664 Ava_2866, Ava_3862, Ava_0476
all0456, alr3162, all2544
cce_3969, cce_1970
gll0384 MAE02730 Npun_F6482, Npun_F4020, Npun_R4919
PMM1646 PMT0075 Pro1806 A9601_18551
P9211_17721
P9215_19191
P9301_18361
cobB AM1_2881 Ava_1768 alr3934 cce_4641 glr3695 MAE06120 Npun_R4057 PMM1072 PMT1104 Pro1126 A9601_11771
P9211_11161
P9215_12071
P9301_11781
cobN AM1_4431 Ava_1167 alr1689 cce_4752 glr3076 MAE43720 Npun_R0999 PMM0879 PMT0727 Pro0957 A9601_10391, A9601_09821
P9211_08851
P9215_10131
P9301_10391, P9301_09801
cobS
cobT
Corrin ring (Anaerobic pathway)
cbiX AM1_2009 Ava_2921 alr0519 cce_4308, cce_3701
gll4193, glr2579
MAE05420 Npun_R1874 PMM0646 PMT0901 Pro0806 A9601_07021
P9211_07571
P9215_07291
P9301_06731
cbiK
cbiL AM1_1842 Ava_2865 all0455 cce_0538 gll0377 MAE02740 Npun_F6483 PMM0389 PMT0198 Pro0386 A9601_04401
P9211_03851
P9215_04661
P9301_04091
cbiH AM1_4688 Ava_2863 all0453 cce_0926 gll2546 MAE42070 Npun_R4781 PMM1525 PMT1772 Pro1671 A9601_17291
P9211_16381
P9215_17931
P9301_17171
cbiG AM1_4688 Ava_2863 all0453, all2747
cce_0926 gll2546 MAE42070, MAE26660
Npun_R4781 PMM1525 PMT1772 Pro1671 A9601_17291
P9211_16381
P9215_17931
P9301_17171
cbiF AM1_4582 Ava_1968 all4698 cce_1618 gll1377 MAE25690 Npun_F3952 PMM0459 PMT1325 Pro0457 A9601_05151
P9211_04601
P9215_05391
P9301_04841
cbiD AM1_4427 Ava_1053 all2847 cce_1981 gll1629 MAE17150 Npun_R0711 PMM0036 PMT0044 Pro0037 A9601_00351
P9211_00361
P9215_00341
P9301_00351
cbiJ AM1_2859 Ava_0256 all1780 cce_1635 gll1636 MAE37180 Npun_R4791 PMM0503 PMT1264 Pro0503 A9601_05601
P9215_05851
P9301_05301
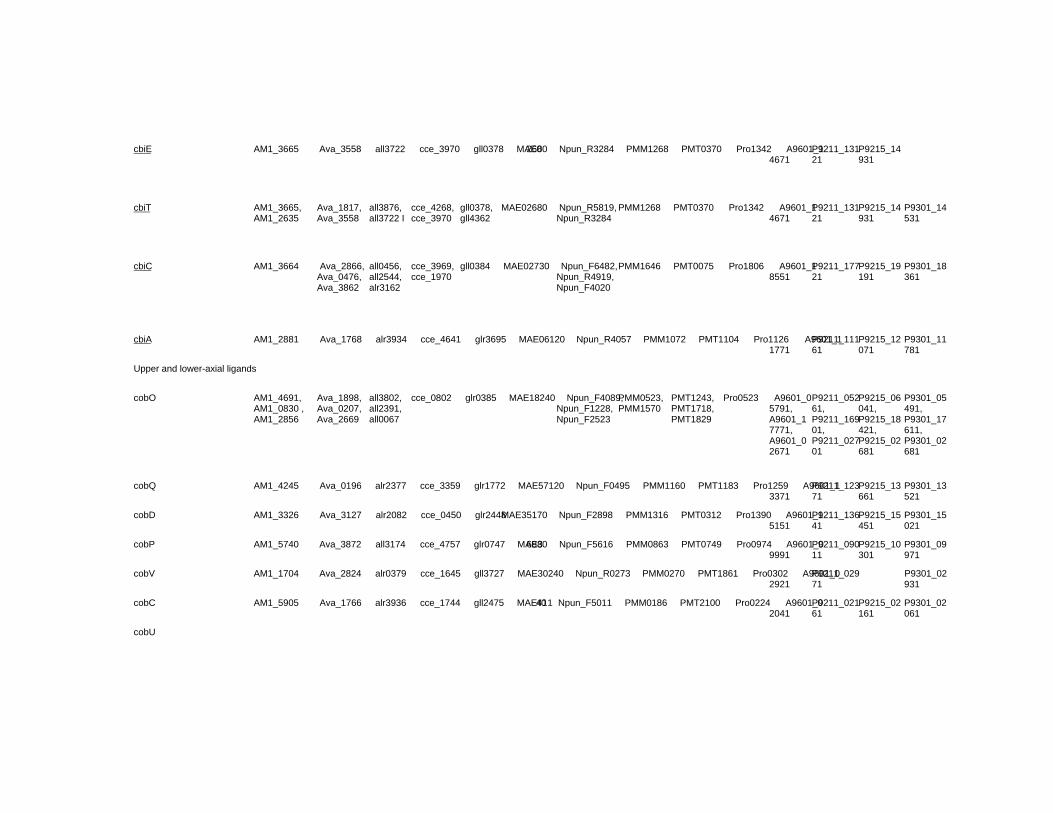
cbiE AM1_3665 Ava_3558 all3722 cce_3970 gll0378 MAE02680 Npun_R3284 PMM1268 PMT0370 Pro1342 A9601_14671
P9211_13121
P9215_14931
cbiT AM1_3665, AM1_2635
Ava_1817, Ava_3558
all3876, all3722 I
cce_4268, cce_3970
gll0378, gll4362
MAE02680 Npun_R5819, Npun_R3284
PMM1268 PMT0370 Pro1342 A9601_14671
P9211_13121
P9215_14931
P9301_14531
cbiC AM1_3664 Ava_2866, Ava_0476, Ava_3862
all0456, all2544, alr3162
cce_3969, cce_1970
gll0384 MAE02730 Npun_F6482, Npun_R4919, Npun_F4020
PMM1646 PMT0075 Pro1806 A9601_18551
P9211_17721
P9215_19191
P9301_18361
cbiA AM1_2881 Ava_1768 alr3934 cce_4641 glr3695 MAE06120 Npun_R4057 PMM1072 PMT1104 Pro1126 A9601_11771
P9211_11161
P9215_12071
P9301_11781
Upper and lower-axial ligands
cobO AM1_4691, AM1_0830 , AM1_2856
Ava_1898, Ava_0207, Ava_2669
all3802, all2391, all0067
cce_0802 glr0385 MAE18240 Npun_F4089, Npun_F1228, Npun_F2523
PMM0523, PMM1570
PMT1243, PMT1718, PMT1829
Pro0523 A9601_05791, A9601_17771, A9601_02671
P9211_05261, P9211_16901, P9211_02701
P9215_06041, P9215_18421, P9215_02681
P9301_05491, P9301_17611, P9301_02681
cobQ AM1_4245 Ava_0196 alr2377 cce_3359 glr1772 MAE57120 Npun_F0495 PMM1160 PMT1183 Pro1259 A9601_13371
P9211_12371
P9215_13661
P9301_13521
cobD AM1_3326 Ava_3127 alr2082 cce_0450 glr2448 MAE35170 Npun_F2898 PMM1316 PMT0312 Pro1390 A9601_15151
P9211_13641
P9215_15451
P9301_15021
cobP AM1_5740 Ava_3872 all3174 cce_4757 glr0747 MAE36880 Npun_F5616 PMM0863 PMT0749 Pro0974 A9601_09991
P9211_09011
P9215_10301
P9301_09971
cobV AM1_1704 Ava_2824 alr0379 cce_1645 gll3727 MAE30240 Npun_R0273 PMM0270 PMT1861 Pro0302 A9601_02921
P9211_02971
P9301_02931
cobC AM1_5905 Ava_1766 alr3936 cce_1744 gll2475 MAE41140 Npun_F5011 PMM0186 PMT2100 Pro0224 A9601_02041
P9211_02161
P9215_02161
P9301_02061
cobU
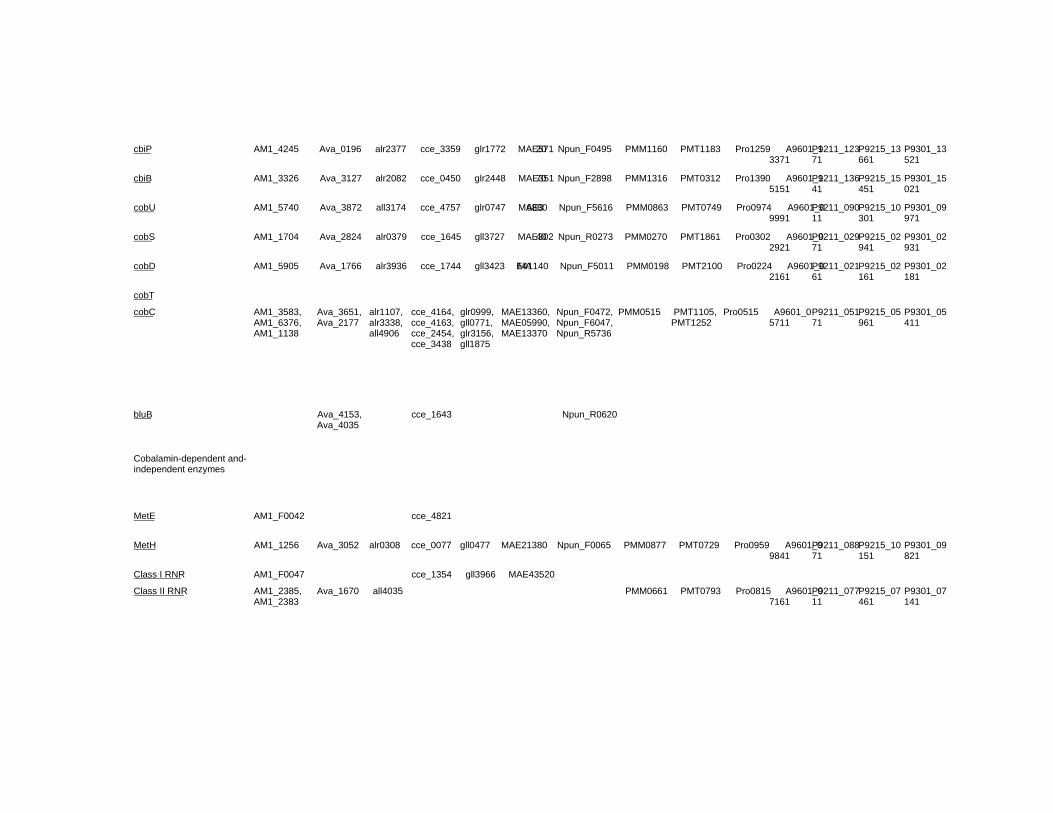
cbiP AM1_4245 Ava_0196 alr2377 cce_3359 glr1772 MAE57120 Npun_F0495 PMM1160 PMT1183 Pro1259 A9601_13371
P9211_12371
P9215_13661
P9301_13521
cbiB AM1_3326 Ava_3127 alr2082 cce_0450 glr2448 MAE35170 Npun_F2898 PMM1316 PMT0312 Pro1390 A9601_15151
P9211_13641
P9215_15451
P9301_15021
cobU AM1_5740 Ava_3872 all3174 cce_4757 glr0747 MAE36880 Npun_F5616 PMM0863 PMT0749 Pro0974 A9601_09991
P9211_09011
P9215_10301
P9301_09971
cobS AM1_1704 Ava_2824 alr0379 cce_1645 gll3727 MAE30240 Npun_R0273 PMM0270 PMT1861 Pro0302 A9601_02921
P9211_02971
P9215_02941
P9301_02931
cobD AM1_5905 Ava_1766 alr3936 cce_1744 gll3423 MAE41140 Npun_F5011 PMM0198 PMT2100 Pro0224 A9601_02161
P9211_02161
P9215_02161
P9301_02181
cobT
cobC AM1_3583, AM1_6376, AM1_1138
Ava_3651, Ava_2177
alr1107, alr3338, all4906
cce_4164, cce_4163, cce_2454, cce_3438
glr0999, gll0771, glr3156, gll1875
MAE13360, MAE05990, MAE13370
Npun_F0472, Npun_F6047, Npun_R5736
PMM0515 PMT1105, PMT1252
Pro0515 A9601_05711
P9211_05171
P9215_05961
P9301_05411
bluB Ava_4153, Ava_4035
cce_1643 Npun_R0620
Cobalamin-dependent and-independent enzymes
MetE AM1_F0042 cce_4821
MetH AM1_1256 Ava_3052 alr0308 cce_0077 gll0477 MAE21380 Npun_F0065 PMM0877 PMT0729 Pro0959 A9601_09841
P9211_08871
P9215_10151
P9301_09821
Class I RNR AM1_F0047 cce_1354 gll3966 MAE43520
Class II RNR AM1_2385, AM1_2383
Ava_1670 all4035 PMM0661 PMT0793 Pro0815 A9601_07161
P9211_07711
P9215_07461
P9301_07141
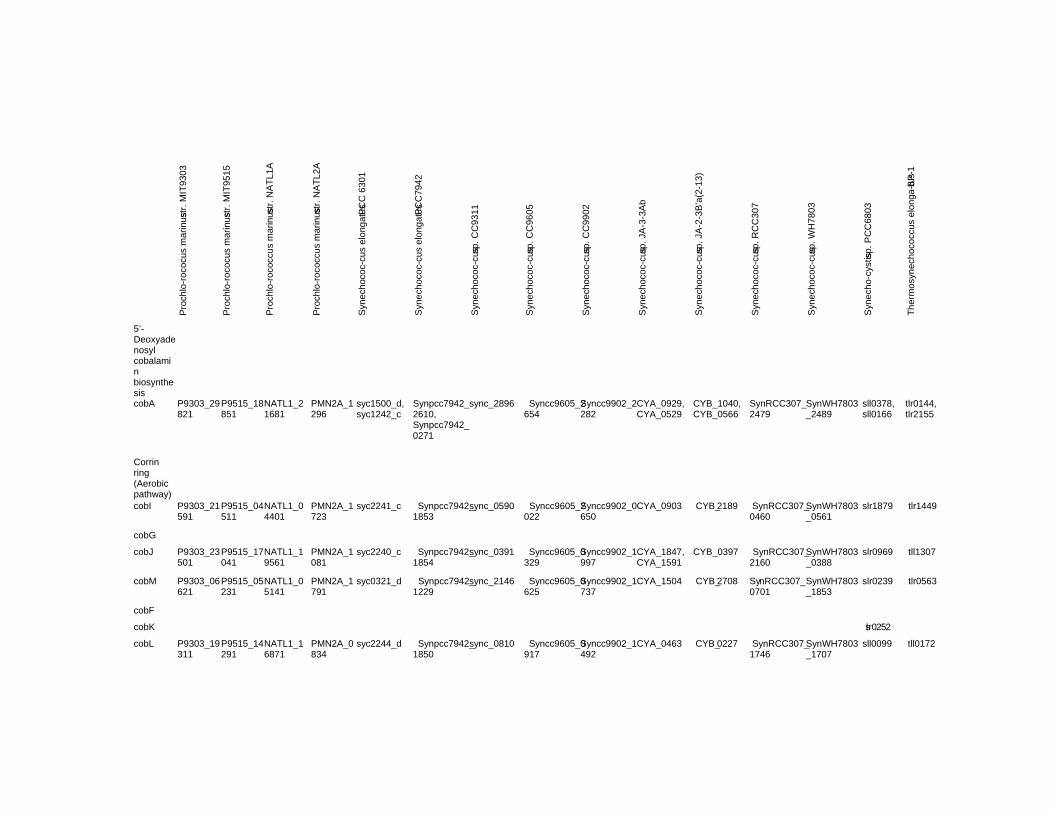
Proc
hlo-
roco
cus m
arin
us st
r. M
IT93
03
Proc
hlo-
roco
cus m
arin
us st
r. M
IT95
15
Proc
hlo-
roco
ccus
mar
inus
str.
NA
TL1A
Proc
hlo-
roco
ccus
mar
inus
str.
NA
TL2A
Syne
choc
oc-c
us e
long
atus
PC
C 6
301
Syne
choc
oc-c
us e
long
atus
PC
C79
42
Syne
choc
oc-c
us sp
. CC
9311
Syne
choc
oc-c
us sp
. CC
9605
Syne
choc
oc-c
us sp
. CC
9902
Syne
choc
oc-c
us sp
. JA
-3-3
Ab
Syne
choc
oc-c
us sp
. JA
-2-3
B'a(
2-13
)
Syne
choc
oc-c
us sp
. RC
C30
7
Syne
choc
oc-c
us sp
. WH
7803
Syne
cho-
cyst
is sp
. PC
C68
03
Ther
mos
ynec
hoco
ccus
elo
nga-
tus B
P-1
5'-Deoxyadenosyl cobalamin biosynthesis
cobA P9303_29821
P9515_18851
NATL1_21681
PMN2A_1296
syc1500_d, syc1242_c
Synpcc7942_2610, Synpcc7942_0271
sync_2896 Syncc9605_2654
Syncc9902_2282
CYA_0929, CYA_0529
CYB_1040, CYB_0566
SynRCC307_2479
SynWH7803_2489
sll0378, sll0166
tlr0144, tlr2155
Corrin ring (Aerobic pathway)
cobI P9303_21591
P9515_04511
NATL1_04401
PMN2A_1723
syc2241_c Synpcc7942_1853
sync_0590 Syncc9605_2022
Syncc9902_0650
CYA_0903 CYB_2189 SynRCC307_0460
SynWH7803_0561
slr1879 tlr1449
cobG
cobJ P9303_23501
P9515_17041
NATL1_19561
PMN2A_1081
syc2240_c Synpcc7942_1854
sync_0391 Syncc9605_0329
Syncc9902_1997
CYA_1847, CYA_1591
CYB_0397 SynRCC307_2160
SynWH7803_0388
slr0969 tll1307
cobM P9303_06621
P9515_05231
NATL1_05141
PMN2A_1791
syc0321_d Synpcc7942_1229
sync_2146 Syncc9605_0625
Syncc9902_1737
CYA_1504 CYB_2708 SynRCC307_0701
SynWH7803_1853
slr0239 tlr0563
cobF
cobK slr0252
cobL P9303_19311
P9515_14291
NATL1_16871
PMN2A_0834
syc2244_d Synpcc7942_1850
sync_0810 Syncc9605_0917
Syncc9902_1492
CYA_0463 CYB_0227 SynRCC307_1746
SynWH7803_1707
sll0099 tll0172
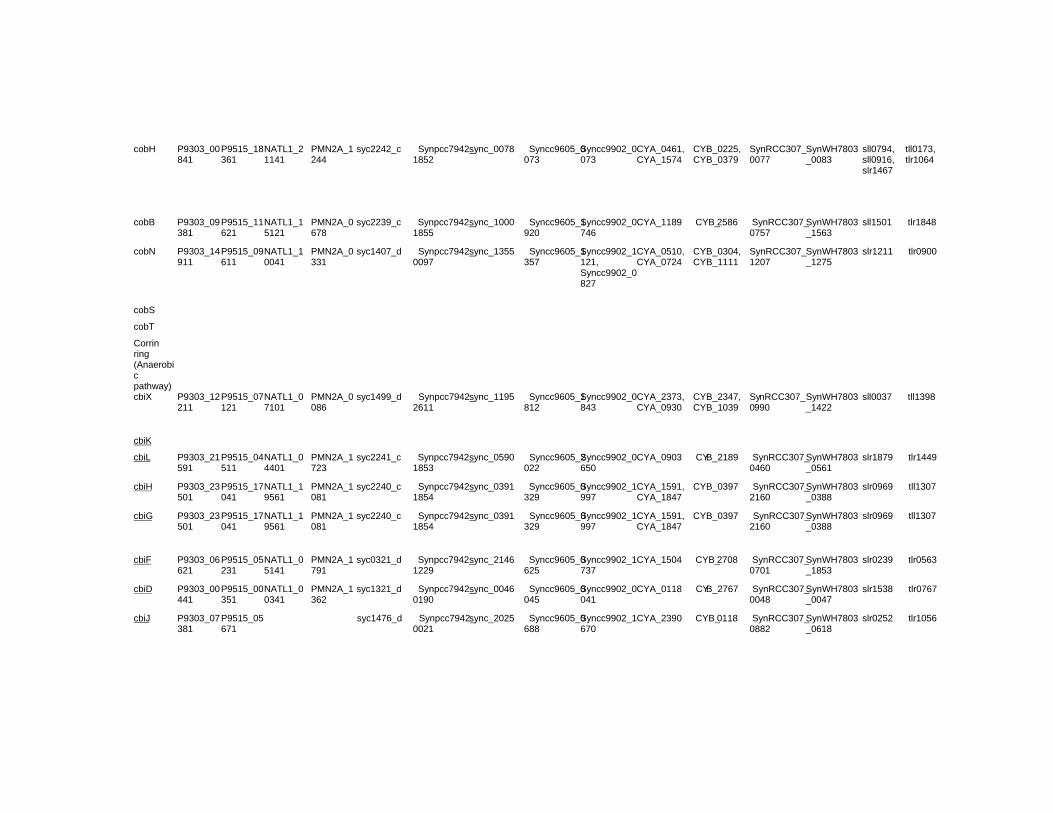
cobH P9303_00841
P9515_18361
NATL1_21141
PMN2A_1244
syc2242_c Synpcc7942_1852
sync_0078 Syncc9605_0073
Syncc9902_0073
CYA_0461, CYA_1574
CYB_0225, CYB_0379
SynRCC307_0077
SynWH7803_0083
sll0794, sll0916, slr1467
tll0173, tlr1064
cobB P9303_09381
P9515_11621
NATL1_15121
PMN2A_0678
syc2239_c Synpcc7942_1855
sync_1000 Syncc9605_1920
Syncc9902_0746
CYA_1189 CYB_2586 SynRCC307_0757
SynWH7803_1563
sll1501 tlr1848
cobN P9303_14911
P9515_09611
NATL1_10041
PMN2A_0331
syc1407_d Synpcc7942_0097
sync_1355 Syncc9605_1357
Syncc9902_1121, Syncc9902_0827
CYA_0510, CYA_0724
CYB_0304, CYB_1111
SynRCC307_1207
SynWH7803_1275
slr1211 tlr0900
cobS
cobT
Corrin ring (Anaerobic pathway)
cbiX P9303_12211
P9515_07121
NATL1_07101
PMN2A_0086
syc1499_d Synpcc7942_2611
sync_1195 Syncc9605_1812
Syncc9902_0843
CYA_2373, CYA_0930
CYB_2347, CYB_1039
SynRCC307_0990
SynWH7803_1422
sll0037 tll1398
cbiK
cbiL P9303_21591
P9515_04511
NATL1_04401
PMN2A_1723
syc2241_c Synpcc7942_1853
sync_0590 Syncc9605_2022
Syncc9902_0650
CYA_0903 CYB_2189 SynRCC307_0460
SynWH7803_0561
slr1879 tlr1449
cbiH P9303_23501
P9515_17041
NATL1_19561
PMN2A_1081
syc2240_c Synpcc7942_1854
sync_0391 Syncc9605_0329
Syncc9902_1997
CYA_1591, CYA_1847
CYB_0397 SynRCC307_2160
SynWH7803_0388
slr0969 tll1307
cbiG P9303_23501
P9515_17041
NATL1_19561
PMN2A_1081
syc2240_c Synpcc7942_1854
sync_0391 Syncc9605_0329
Syncc9902_1997
CYA_1591, CYA_1847
CYB_0397 SynRCC307_2160
SynWH7803_0388
slr0969 tll1307
cbiF P9303_06621
P9515_05231
NATL1_05141
PMN2A_1791
syc0321_d Synpcc7942_1229
sync_2146 Syncc9605_0625
Syncc9902_1737
CYA_1504 CYB_2708 SynRCC307_0701
SynWH7803_1853
slr0239 tlr0563
cbiD P9303_00441
P9515_00351
NATL1_00341
PMN2A_1362
syc1321_d Synpcc7942_0190
sync_0046 Syncc9605_0045
Syncc9902_0041
CYA_0118 CYB_2767 SynRCC307_0048
SynWH7803_0047
slr1538 tlr0767
cbiJ P9303_07381
P9515_05671
syc1476_d Synpcc7942_0021
sync_2025 Syncc9605_0688
Syncc9902_1670
CYA_2390 CYB_0118 SynRCC307_0882
SynWH7803_0618
slr0252 tlr1056
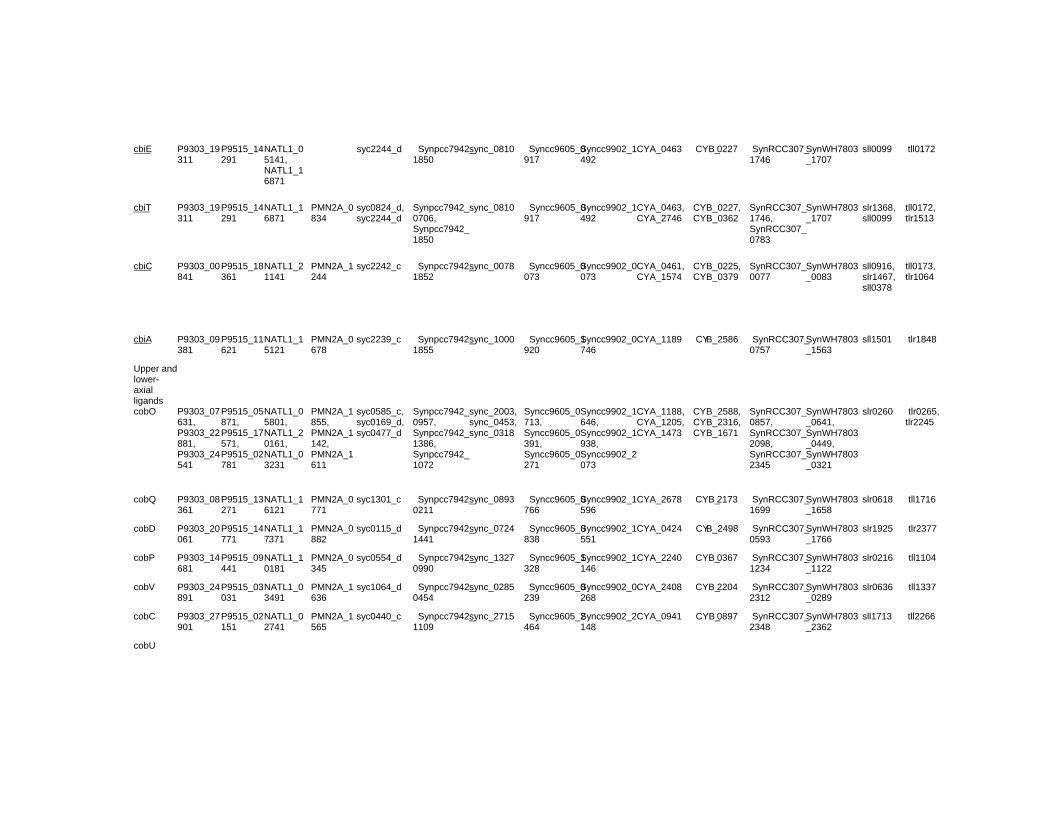
cbiE P9303_19311
P9515_14291
NATL1_05141, NATL1_16871
syc2244_d Synpcc7942_1850
sync_0810 Syncc9605_0917
Syncc9902_1492
CYA_0463 CYB_0227 SynRCC307_1746
SynWH7803_1707
sll0099 tll0172
cbiT P9303_19311
P9515_14291
NATL1_16871
PMN2A_0834
syc0824_d, syc2244_d
Synpcc7942_0706, Synpcc7942_1850
sync_0810 Syncc9605_0917
Syncc9902_1492
CYA_0463, CYA_2746
CYB_0227, CYB_0362
SynRCC307_1746, SynRCC307_0783
SynWH7803_1707
slr1368, sll0099
tll0172, tlr1513
cbiC P9303_00841
P9515_18361
NATL1_21141
PMN2A_1244
syc2242_c Synpcc7942_1852
sync_0078 Syncc9605_0073
Syncc9902_0073
CYA_0461, CYA_1574
CYB_0225, CYB_0379
SynRCC307_0077
SynWH7803_0083
sll0916, slr1467, sll0378
tll0173, tlr1064
cbiA P9303_09381
P9515_11621
NATL1_15121
PMN2A_0678
syc2239_c Synpcc7942_1855
sync_1000 Syncc9605_1920
Syncc9902_0746
CYA_1189 CYB_2586 SynRCC307_0757
SynWH7803_1563
sll1501 tlr1848
Upper and lower-axial ligands
cobO P9303_07631, P9303_22881, P9303_24541
P9515_05871, P9515_17571, P9515_02781
NATL1_05801, NATL1_20161, NATL1_03231
PMN2A_1855, PMN2A_1142, PMN2A_1611
syc0585_c, syc0169_d, syc0477_d
Synpcc7942_0957, Synpcc7942_1386, Synpcc7942_1072
sync_2003, sync_0453, sync_0318
Syncc9605_0713, Syncc9605_0391, Syncc9605_0271
Syncc9902_1646, Syncc9902_1938, Syncc9902_2073
CYA_1188, CYA_1205, CYA_1473
CYB_2588, CYB_2316, CYB_1671
SynRCC307_0857, SynRCC307_2098, SynRCC307_2345
SynWH7803_0641, SynWH7803_0449, SynWH7803_0321
slr0260 tlr0265, tlr2245
cobQ P9303_08361
P9515_13271
NATL1_16121
PMN2A_0771
syc1301_c Synpcc7942_0211
sync_0893 Syncc9605_0766
Syncc9902_1596
CYA_2678 CYB_2173 SynRCC307_1699
SynWH7803_1658
slr0618 tll1716
cobD P9303_20061
P9515_14771
NATL1_17371
PMN2A_0882
syc0115_d Synpcc7942_1441
sync_0724 Syncc9605_0838
Syncc9902_1551
CYA_0424 CYB_2498 SynRCC307_0593
SynWH7803_1766
slr1925 tlr2377
cobP P9303_14681
P9515_09441
NATL1_10181
PMN2A_0345
syc0554_d Synpcc7942_0990
sync_1327 Syncc9605_1328
Syncc9902_1146
CYA_2240 CYB_0367 SynRCC307_1234
SynWH7803_1122
slr0216 tll1104
cobV P9303_24891
P9515_03031
NATL1_03491
PMN2A_1636
syc1064_d Synpcc7942_0454
sync_0285 Syncc9605_0239
Syncc9902_0268
CYA_2408 CYB_2204 SynRCC307_2312
SynWH7803_0289
slr0636 tll1337
cobC P9303_27901
P9515_02151
NATL1_02741
PMN2A_1565
syc0440_c Synpcc7942_1109
sync_2715 Syncc9605_2464
Syncc9902_2148
CYA_0941 CYB_0897 SynRCC307_2348
SynWH7803_2362
sll1713 tll2266
cobU
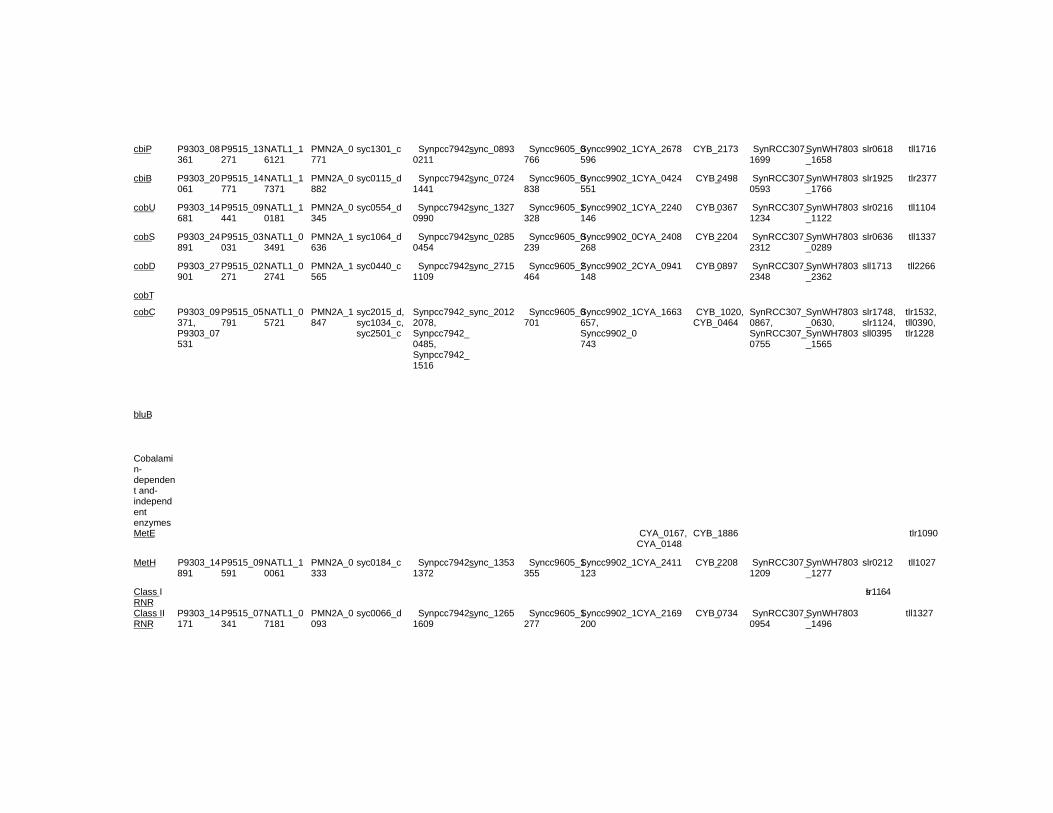
cbiP P9303_08361
P9515_13271
NATL1_16121
PMN2A_0771
syc1301_c Synpcc7942_0211
sync_0893 Syncc9605_0766
Syncc9902_1596
CYA_2678 CYB_2173 SynRCC307_1699
SynWH7803_1658
slr0618 tll1716
cbiB P9303_20061
P9515_14771
NATL1_17371
PMN2A_0882
syc0115_d Synpcc7942_1441
sync_0724 Syncc9605_0838
Syncc9902_1551
CYA_0424 CYB_2498 SynRCC307_0593
SynWH7803_1766
slr1925 tlr2377
cobU P9303_14681
P9515_09441
NATL1_10181
PMN2A_0345
syc0554_d Synpcc7942_0990
sync_1327 Syncc9605_1328
Syncc9902_1146
CYA_2240 CYB_0367 SynRCC307_1234
SynWH7803_1122
slr0216 tll1104
cobS P9303_24891
P9515_03031
NATL1_03491
PMN2A_1636
syc1064_d Synpcc7942_0454
sync_0285 Syncc9605_0239
Syncc9902_0268
CYA_2408 CYB_2204 SynRCC307_2312
SynWH7803_0289
slr0636 tll1337
cobD P9303_27901
P9515_02271
NATL1_02741
PMN2A_1565
syc0440_c Synpcc7942_1109
sync_2715 Syncc9605_2464
Syncc9902_2148
CYA_0941 CYB_0897 SynRCC307_2348
SynWH7803_2362
sll1713 tll2266
cobT
cobC P9303_09371, P9303_07531
P9515_05791
NATL1_05721
PMN2A_1847
syc2015_d, syc1034_c, syc2501_c
Synpcc7942_2078, Synpcc7942_0485, Synpcc7942_1516
sync_2012 Syncc9605_0701
Syncc9902_1657, Syncc9902_0743
CYA_1663 CYB_1020, CYB_0464
SynRCC307_0867, SynRCC307_0755
SynWH7803_0630, SynWH7803_1565
slr1748, slr1124, sll0395
tlr1532, tll0390, tlr1228
bluB
Cobalamin-dependent and-independent enzymes
MetE CYA_0167, CYA_0148
CYB_1886 tlr1090
MetH P9303_14891
P9515_09591
NATL1_10061
PMN2A_0333
syc0184_c Synpcc7942_1372
sync_1353 Syncc9605_1355
Syncc9902_1123
CYA_2411 CYB_2208 SynRCC307_1209
SynWH7803_1277
slr0212 tll1027
Class I RNR
slr1164
Class II RNR
P9303_14171
P9515_07341
NATL1_07181
PMN2A_0093
syc0066_d Synpcc7942_1609
sync_1265 Syncc9605_1277
Syncc9902_1200
CYA_2169 CYB_0734 SynRCC307_0954
SynWH7803_1496
tll1327
Corrinoid Compounds in Cyanobacteria 499
Figure 4. Biosynthetic pathways for 5’-deoxyadenosylcobalamin in bacteria. The corresponding 5’-deoxyadenosylcobalamin biosynthetic genes from Salmonella typhimurium and Pseudomonas denitrificans have different traditional names, mainly using prefixes cbi and cob, respectively. S. typhimurium gene names are underlined. The anaerobic and aerobic adenosylcobalamin biosynthetic pathways are characterized by the early and late cobalt insertions, respectively. In bacteria with the anaerobic pathway, cobalt is inserted into the macrocycle using either the CbiK (as in S. typhimurium) or CbiX chelatases. (as in Bacillus megaterium). In aerobic pathway, the cobalt insertion is performed by the ATP-dependent aerobic cobalt chelatase of P. denitrificans, which consists of CobN, CobS, and CobT subunits. Sinorhizobium meliloti gene, bluB, is necessary for 5,6-dimethylbenzimidazole (DMB) biosynthesis in the lower ligand of vitamin B12. *Genes undetectable in all cyanobacteria species. **Genes undetectable in most cyanobacteria species.
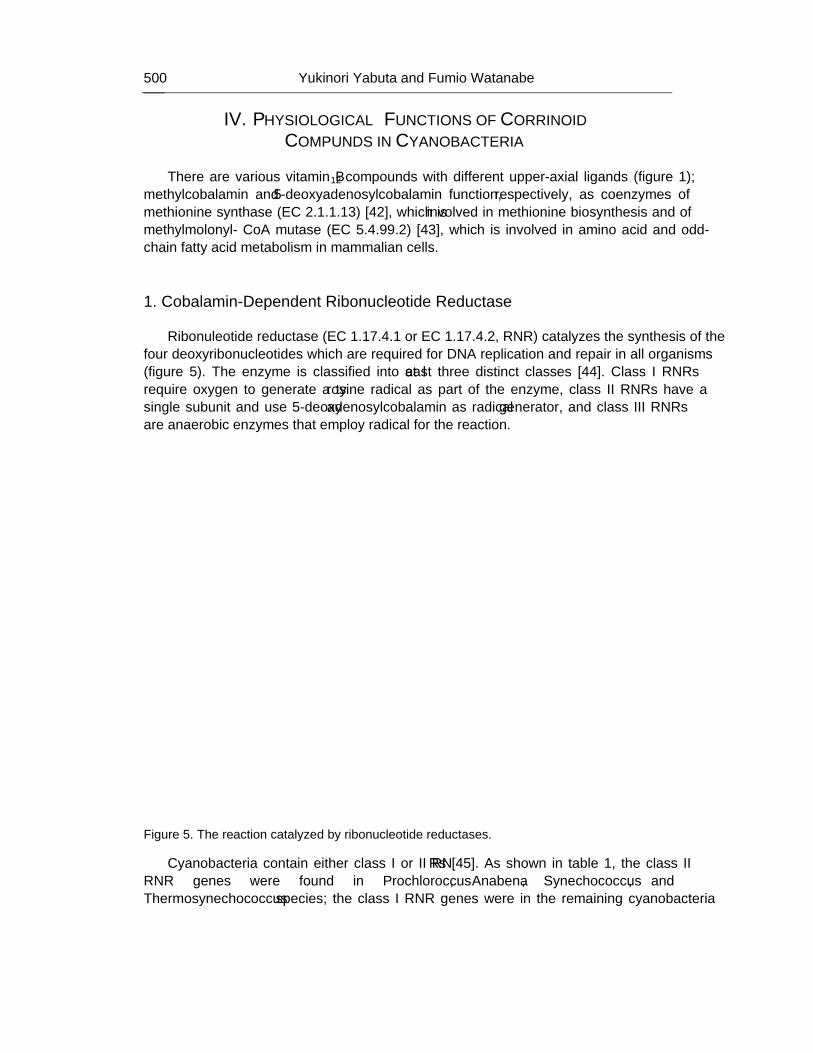
Yukinori Yabuta and Fumio Watanabe 500
IV. PHYSIOLOGICAL FUNCTIONS OF CORRINOID COMPUNDS IN CYANOBACTERIA
There are various vitamin B12 compounds with different upper-axial ligands (figure 1);
methylcobalamin and 5’-deoxyadenosylcobalamin function, respectively, as coenzymes of methionine synthase (EC 2.1.1.13) [42], which is involved in methionine biosynthesis and of methylmolonyl- CoA mutase (EC 5.4.99.2) [43], which is involved in amino acid and odd-chain fatty acid metabolism in mammalian cells.
1. Cobalamin-Dependent Ribonucleotide Reductase Ribonuleotide reductase (EC 1.17.4.1 or EC 1.17.4.2, RNR) catalyzes the synthesis of the
four deoxyribonucleotides which are required for DNA replication and repair in all organisms (figure 5). The enzyme is classified into at least three distinct classes [44]. Class I RNRs require oxygen to generate a tyrosine radical as part of the enzyme, class II RNRs have a single subunit and use 5’-deoxyadenosylcobalamin as radical generator, and class III RNRs are anaerobic enzymes that employ radical for the reaction.
Figure 5. The reaction catalyzed by ribonucleotide reductases.
Cyanobacteria contain either class I or II RNRs [45]. As shown in table 1, the class II RNR genes were found in Prochloroccus, Anabena, Synechococcus, and Thermosynechococcus species; the class I RNR genes were in the remaining cyanobacteria
Corrinoid Compounds in Cyanobacteria 501
species except Acaryochloris marina MBIC11017, which appears to contain both class I and II RNR genes.
The RNR gene from Anabana sp. strain PCC7120 was identified and expressed in E. coli [46]. Anabena enzyme was a monomer with a molecular mass of approximately 88 kDa. The enzyme reduced ribonucleotides at triphosphate level and required a divalent cation and a deoxyribonucleotide triphospahte effector. The enzyme was absolutely dependent on the addition of 5’-deoxyadonosylcobalamin. These properties were characteristic of the class II enzymes. The Anabeba enzyme had limited sequence homology to other class II RNRs; the greatest similarity (38%) was to the enzyme from Lactobacillus leichmannii. In contrast, the Anabena enzyme showed over 90% sequence similarity to putative reductase found in genome sequences of other cyanobacteria, such as Synechococcus sp. strain WH8102 and Prochlorococcus marinus MED4. The Anabaena strain PCC 7120 enzyme was very similar to the enzyme previously isolated from Anabaena strain PCC 7119 [47].
The class I RNRs have not been characterized in cyanobacteria.
2. Cobalamin-Dependent Methionine Synthase Methionine synthase catalyzes the conversion of homocysteine to methionine, using a
methyl group donated by N5-metyltetrahydrofolate in the de novo biosynthesis of methionine (figure 6). Two types (cobalamin-dependent or -independent) of methionine synthases are found in organisms and catalyzed the same overall reaction [48]. The cobalamin-dependent methionine syhthase (EC 2.1.1.13, MetH) is found in organisms (e.g. bacteria and animals) that synthesize or obtain vitamin B12 from outside sources. MetH is a large modular and monomeric protein composed of four regions with N-terminal part comprising modules for binding and activation of L-homocystein and N5-metyltetrahydrofolate and the C-terminal half containing the cobalamin and S-adenosylmethionine binding domains [49].
The cobalamin-independent methionine synthase (EC 2.1.1.14, MetE) shores no sequence similarity with MetH [50] and catalyzes methyl transfer to L-homocyteine directly from N5-metyltetrahydrofolate (polyglutamate forms; n>3). Both MetE and MetH are found in bacteria, whereas fungi and plants possess only the MetE [51, 52].
Although most cyanobacteria species contained only MetH gene, both MetH and MetE genes were found in Acaryochloris marina MBIC 11017, Cyanothece sp. ATCC 51142, Synechococcus sp. JA-3-3Ab, Synechococcus sp. JA-2-3B’a(2-13), and Thermosynechococcus eleongatus BP-1 (table 1). Neither MetH or MetE have been characterized in cyanobacteria.
3. Other Enzymes The gene homologues encoding 5’-deoxyadenocylcobalamin-dependent methylmalonyl-
CoA mutase (EC 5.4.99.2) involved in the catabolism of odd-chain fatty acids and branched-chain amino acids could not be found in any cyanobacteria (table 1).
Yukinori Yabuta and Fumio Watanabe 502
Figure 6. The reaction catalyzed by methionine synthases.
V. CONCLUSION
Most cyanobacteria species would not synthesize vitamin B12 de novo, but pseudovitamin
B12, which appears to function as coenzymes of MetH or RNR (or both). Edible cyanobacteria such as Spirulina, Aphanizomenon, and Nostoc species are not suitable for use as a vitamin B12 source, especially in vegetarians, because pseudovitamin B12 is inactive for humans.
REFERENCES
[1] Sivonen, K; Jones, G. (1999) Cyanobacterial toxins. In: Chorus, I. & Bertram, J. Eds Toxic cyanobacteria in water: a guide to public health significance, monitoring and management. Spon, London, pp 41-111
[2] Skulberg, OM. (2000) Microalgae as a source of bioactive molecules-experience from cyanophyte research. J. Appl. Phycol., 12, 341-348.
[3] Pulz, O; Gross, W. (2004) Valuable products from biotechnology of microalgae. Appl. Microbiol. Biotechnol., 65, 635-648.
[4] Grieco, E; Desrochers, R. (1978) Production de vitamine B12 par une algue bleue. Can. J. Microbiol., 24, 1562-1566.
[5] Gillespie, P A; Morita, RY. (1972) Vitamin B12 production and depletion in a naturally occurring eutrophic lake. Appl. Microbiol., 23, 341-348.
[6] Scheider, Z; Stroiñski, A. (1987) Biosynthesis of vitamin B12. In: Schneider, Z; Stroiñski, A. Eds. Comprehensive B12. Berlin: Walter de Gruyter, pp 93-110.
Corrinoid Compounds in Cyanobacteria 503
[7] Watanabe, F. (2007) Vitamin B12 sources and bioavailability. Exp. Biol. Med., 232, 1266-1274.
[8] Watanabe, F; Takenaka, S; Kittaka-Katsura, H; Ebara, S; Miyamoto, E. (2002) Characterization and bioavailability of vitamin B12-compounds from edible algae. J. Nutr. Sci. Vitaminol., 48:325-331.
[9] Vadiraja, BB; Gaikwad, NW; Madyastha, KM. (1998) Hepatoprotective effect of C-phycocyanin: protection for carbon tetrachloride and R-(+)-pulegone-mediated hepatotoxicity in rats. Biochem. Biophys. Res. Commun., 249, 428-431.
[10] Yang, HN.; Lee, EH; Kim, HM. (1997) Spirulina platensis inhibits anaphylactic reaction. Life Sci., 61, 1237-1244.
[11] Hayashi, K; Hayashi, T; Kojima, I. (1996) A natural sulfated polysaccharide, calcium spirulan, isolated from Spirulina plantesis: in vitro and ex vivo evaluation of anti-herpes simplex virus and anti-human immunodeficiency virus activities. AIDS Res. Hum. Retroviruse, 12, 1463-1471.
[12] Watanabe, F; Katsura, H; Takenaka, S; Fujita, T; Abe, K; Tamura, Y; Nakatsuka, T; Nakano, Y. (1999) Pseudovitamin B12 is the predominate cobamide of an algal health food, spirulina tablets. J. Agric. Food Chem., 47, 4736-4741.
[13] Herbert, V; Drivas, G. (1982) Spirulina and vitamin B12. J. Am. Med. Assoc., 248, 3096-3097.
[14] Herbert, V. (1988) Vitamin B12: plant sources, requirements, and assay. Am. J. Clin. Nutr., 48, 852-858.
[15] van den Berg, H; Dagnelie, PC; van Staveren, WA. (1988) Vitamin B12 and seaweed. Lancet, 1, 242-243.
[16] Dagnelie, PC; van Staveren, WA; van den Berg, H. (1991) Vitamin B12 from algae appears not to be bioavailable. Am. J. Clin. Nutr., 53, 695-697.
[17] Kushak, RI; Drapeau, C; van Cott, EM; Winter, HH. (2000) Favorable effect of blue-green algae Aphanizomenon flos-aquae on rat plasma lipids. J. Am. Nutr. Assoc., 2, 59-65.
[18] Kay, RA. (1991) Microalgae as food and supplement. Crit. ReV. Food Sci. Nutr., 30, 555-573.
[19] Miyamoto, E; Tanioka, Y; Nakao, T; Barla, F; Inui, H; Fujita, T; Watanabe, F; Nakano, Y. (2006) Purification and characterization of a corrinoid-compound in an edible cyanobacterium Aphanizomenon flos-aquae as a nutritional supplementary food. J. Agric. Food Chem., 54, 9604-9607.
[20] Watanabe, F; Miyamoto, E; Fujita, T; Tanioka, Y; Nakano, Y. (2006) Characterization of a corrinod compound in the edible (blue-green) algae, suizenji-nori. Biosci Biotechnol Biochem., 70, 3066-3068.
[21] Watanabe, F; Tanioka, Y; Miyamoto, E; Fujita, T; Takenaka, H; Nakano, Y. (2007) Purification and characterization of corrinoid-compounds from the dried powder of an edible cyanobacterium, Nostoc commune (Ishikurage). J. Nutr. Sci. Vitaminol., 53, 183-186.
[22] Tanioka, Y; Yabuta, Y; Miyamoto, E; Inui, H; Watanabe, F. (2008) Analysis of vitamin B12 in food by silica gel 60 TLC and bioautography with vitamin B12-dependent Escherichia coli 215. J. Liq. Chrom. Rel. Technol., 31, 1977-1985.
[23] Russell-Jones, GJ; Aplers, DH. (1999) Vitamin B12 transporters. Pharm. Biotechnol., 12, 493-520.
Yukinori Yabuta and Fumio Watanabe 504
[24] Stüpperich, E; Nexø, E. (1991) Effect of the cobalt-N coordination on the cobamide recognition by the human vitamin B12 binding proteins intrinsic factor, transcobalamin, and haptocorrin. Eur. J. Biochem., 199, 299-303.
[25] Brandt, LJ; Goldberg, L; Bernstein, LH; Greenberg, G. (1979) The effect of bacterially produced vitamin B12 analogues (cobamides) on the in vitro absorption of cyanocobalamin. Am. J. Clin. Nutr., 32, 1832-1836.
[26] Kolhouse, JF; Allen, RH. (1977) Absorption, plasma transport, and cellular retention of cobalamin analogues in the rabbit. J. Clin. Invest., 60, 1381-1392.
[27] Lengyel, P; Masumder, R; Ochoa, S. (1960) Mammalian methylmalonyl isomerase and vitamin B12 coenzymes. Proc. Natl.Acad. Sci. U.S.A., 46, 1312-1318.
[28] Kolhouse, JF; Utley, C; Stabler, SP; Allen, RH. (1991) Mechanism of conversion of human apo- to homomethionine synthase by various forms of cobalamin. J. Biol. Chem., 266, 23010-23015.
[29] Stabler, SP; Brass, EP; Marcell, PD; Allen, RH. (1991) Inhibition of cobalamin-dependent enzymes by cobalamin analogues in rats. J. Clin. Invest., 87, 1422-1430.
[30] Watanabe, F; Miyamoto, E; Nakano, Y. (2001) Inactive corrinoid-compound significantly decreases in Spirulina plantensis grown in a cobalt-deficient medium. J. Agric. Food Chem., 49, 5685-5688.
[31] Cavet, JS; Borrelly, GPM; Robinson, NJ. (2003) Zn, Cu and Co in cyanobacteria: selective control of metal availability. FEMS Microbiol. Rev., 27, 165-181.
[32] Rutherford, JC; Cavet, JS; Robinson, NJ. (1999) Cobalt-dependent transcriptional switching by a dual-effector MerR-like protein regulates a cobalt-exporting variant CPx-type ATPase. J. Biol. Chem., 274, 25827-25832.
[33] Brown, NL; Stoyanov, JV; Kidd, SP; Hobman, JL. (2003) The MerR family of transcriptional regulators. FEMS Microbiol. Rev., 27, 145-163.
[34] Thibaut, D; Couder, M; Famechon, A; Debussche, L; Cameron, B; Crouzet, J; Blanche, F. (1992) The final step in the biosynthesis of hydrogenobyrinic acid is catalyzed by the cobH gene product with precorrin-8x as the substrate. J. Bacteriol., 174, 1043-1049.
[35] Schubert, HL; Raux, E; Matthews, MAA; Phillips, JD; Wilson, KS; Hill, CP; Warren, MJ. (2002) Structural diversity in metal ion chelation and the structure of uroporphyrinogen III synthase. Biochem. Soc. Trans., 30, 595-600.
[36] Walker, CJ; Willows, RD. (1997) Mechanism and regulation of Mg-chelatase. Biochem. J., 327, 321-333.
[37] Jensen, PE; Gibson, LCD; Hunter, CN. (1999) ATPase activity associated with the magnesium-protoporphyrin IX chelatase enzyme of Synechocystis PCC6803: evidence for ATP hydrolysis during Mg2+ insertion, and the MgATP-dependent interaction of the CHlI and ChlD subunits. Biochem. J., 339, 127-134.
[38] Debussche, L; Couder, M; Thibaut, D; Cameron, B; Crouzet, J; Blanche, F. (1992) Assay, purification, and characterization of cobaltchelatase, a unique complex enzyme catalyzing cobalt insertion in hydrogenobyrinic acid a,c-diamide during coenzyme B12 biosynthesis in Pseudomonas denitrificans. J. Bacteriol., 174, 7445-7451.
[39] Brindley, AA; Raux, E; Leech, HK; Schubert, HL; Warren, MJ. (2003) A story of chelatase evolution. J. Biol. Chem., 278, 22388-22395.
[40] Leech, HK; Raux, E; McLean, KJ; Munro, AW; Robinson, NJ; Borrelly, GPM; Malten, M; Jahn, D; Rigby, SEJ; Heathcote, P; Warren, MJ. (2003) Characterization of the cobaltochelatase CbiXL. J. Biol. Chem., 278, 41900-41907.
Corrinoid Compounds in Cyanobacteria 505
[41] Rodionov, DA; Vitreschak, AG; Mironov, AA; Gelfand MS. (2003) Comparative genomics of the vitamin B12 metabolism and regulation in prokaryotes. J. Biol. Chem., 278, 41148-41159.
[42] Chen, Z; Crippen, K; Gulati, S; Banerjee, R. (1994) Purification and kinetic mechanism of a mammalian methionine synthase from pig liver. J. Biol. Chem., 269: 27193-27197.
[43] Fenton, WA; Hack, AM; Willard, HF; Gertler, A; Rosenberg, LE. (1982) Purification and properties of methylmalonyl coenzyme A mutase from human liver. Arch. Biochem., 228, 323-329.
[44] Reichard, P. (1997) The evolution of ribonucleotide reduction. Trend in Biochem. Sci., 22, 81-85.
[45] Gleason, FK; Wood, JM. (1976) Ribonucleotide reductase in blue-green algae: dependence on adenosylcobalamin. Science, 192, 1343-1344.
[46] Gleason, FK; Olszewski, NE. (2002) Isolation of the gene for the B12-dependent ribonucleotide reductase from Anabaena sp. strain PCC 7120 and expression in Escherichia coli. J. Bacteriol., 184, 6544-6550.
[47] Gleason, FK; Frick, TD. (1980) Adenosylcobalamin-dependent ribonucleotide reductase from the blue-green alga, Anabaena sp. J. Biol. Chem., 255, 7728-7733.
[48] González, JC; Banerjee, RV; Huang, S; Sumner, HS; Matthews, RG. (1992) Comparison of cobalamin-independent and cobalamin dependent methionine synthases from Escherichia coli: two solutions to the same chemical problem. Biochemistry, 31, 6045-6056.
[49] Matthews, RG. (2001) Cobalamin-dependent methyltransferases. Acc. Chem. Res., 34, 681-689.
[50] Ravanel, S; Block, MA; Rippert, P; Jabrin, S; Curien, G; Bébeillé, F; Douce, R. (2004) Methionine metabolism in plants. Chloroplasts are autonomous for de novo methionine synthesis and can import S-adenosylmethyonine from the cytosol. J. Biol. Chem., 279, 22548-22557.
[51] Kacprzak, MM; Lewandowska, I; Matthews, RG; Paszewski, A. (2003) Transcriptional regulation of methionine synthase by homocysteine and choline in Aspergillus nidulans. Biochem. J., 376, 517-524.
[52] Sumiman, HS; Sawyer, GM; Appling, DR; Robertus, JD. (2005) Purification and properties of cobalamin-independent methionine synthase from Candida albicans and Saccharomyces cerevisiae. Arch. Biochem. Biophys., 441, 56-63.

INDEX
A
Aβ, 13 abatement, 202, 203, 397 ABC, 64, 65, 68, 78, 79, 95, 228, 234 abiotic, 313, 324 absorption, viii, ix, 2, 3, 5, 8, 19, 21, 27, 36, 38,
42, 45, 46, 47, 50, 106, 112, 116, 117, 120, 121, 123, 124, 125, 126, 127, 128, 129, 130, 134, 135, 140, 143, 144, 164, 166, 183, 192, 284, 474, 489, 504
absorption spectra, 112, 116, 124, 125, 130, 164, 166
absorption spectroscopy, 19, 42, 50, 284 acceptor, 2, 7, 12, 15, 43, 44, 45, 47, 49, 155,
156, 157, 411, 449 acceptors, 8, 12, 117, 125, 126, 250 accidental, 351 accidents, 306 accounting, 20, 215 accuracy, 14, 267, 293 acetate, 315, 368, 434, 439, 476 acetic acid, 55, 95 acetone, 363 acetonitrile, 195, 196, 197, 365, 376 acetylcholine, 263, 265, 266, 267, 357 acetylcholinesterase, 263 acetylcholinesterase inhibitor, 263 achievement, 341 acidic, 138, 164, 166, 397 acquisitions, 471 actinomycetes, 437, 471 activated carbon, 351, 366, 391, 392, 394 activation, 7, 12, 24, 46, 55, 98, 159, 430, 501 activation energy, 46 active site, 88, 262, 434
acute, xii, xiii, 261, 263, 283, 285, 290, 291, 293, 294, 300, 303, 349, 356
adaptability, 266 adaptation, ix, 33, 58, 59, 61, 103, 106, 125, 126,
139, 142, 145, 148, 149, 154, 158, 182, 183, 354, 459
adenine, xvi, 87, 485, 490 adenosine, 331 adenosine triphosphate, 331 adhesion, 159 adjustment, 12, 17, 58, 219 administration, xiii, 270, 271, 329, 489 ADP, 106, 109, 451, 452 adsorption, 56, 223, 351, 368, 371, 372, 373, 381,
382, 383, 386, 391, 449 adult, 200, 352, 466 adults, 205 aerobic, vii, 213, 231, 254, 309, 321, 324, 325,
462, 490, 499 Africa, 52, 217, 350 Ag, 286, 290, 291 agar, 334, 335, 337, 339, 342 AGC, 314 age, 205, 260, 355 agent, 56, 81, 248, 315, 357, 360, 436, 440 agents, 52, 95, 273, 275, 301, 356 aggregates, 130, 131, 150, 361, 362, 375 aggregation, xi, 117, 120, 124, 126, 129, 130,
233, 236, 246, 248, 250, 251, 256, 366 aging, 100 agricultural, xii, 219, 283, 284, 445, 455 agriculture, 445 aid, 9, 11, 109, 133, 274, 459 aiding, 265 AIDS, 96, 503
Index 508
air, xiii, 211, 213, 215, 219, 272, 279, 312, 349, 357, 358, 359, 360, 373, 377, 389, 391, 392, 393, 394, 396, 398, 454, 475, 479
alanine, 70, 76, 80, 241, 263, 277, 279 alcohol, 314 alcohols, 449 algal, 76, 102, 182, 184, 185, 208, 223, 392 algorithm, 247 alkaline, 218, 357 alkalinity, 57, 351 alkaloids, xiv, 262, 355, 357, 429, 430, 440 alkane, 312, 324 alkanes, 219, 312, 321 alpha, 95 alternative, xv, 33, 57, 59, 72, 97, 142, 146, 212,
216, 274, 285, 344, 350, 372, 389, 408, 433, 435, 443, 450, 459, 462
alternative hypothesis, 146 alternatives, 444 alters, 42, 234, 250 aluminium, 360, 361, 365, 397 Alzheimer disease, 100 amide, 242, 243, 244, 368, 375 amine, 357 amines, 303 amino acid, ix, xi, 62, 75, 83, 84, 88, 89, 96, 100,
106, 117, 121, 128, 132, 133, 134, 143, 155, 168, 170, 176, 177, 182, 184, 187, 216, 217, 233, 235, 236, 240, 241, 246, 247, 250, 252, 261, 263, 277, 279, 281, 338, 345, 355, 411, 415, 418, 420, 430, 434, 490, 500, 501
amino acid side chains, 241 amino acids, ix, xi, 88, 89, 106, 143, 168, 170,
176, 184, 187, 217, 233, 355, 430, 490, 501 aminopeptidase, 70 ammonia, 176 ammonium, 213, 455, 456 amorphous, 220 amplitude, 15, 19, 20, 30, 31, 39, 342, 343 AMR, 138 Amsterdam, 229, 481 amyotrophic lateral sclerosis, 280 anaerobic, 98, 213, 309, 451, 467, 490, 499, 500 anaerobic bacteria, 309 analytical techniques, 193, 207 anaphylactic reaction, 503 anatomy, 181, 255 aneuploidy, 278 angiosperm, 219 animal health, 269 animal waste, 217, 231 animals, xii, xv, 52, 56, 171, 177, 217, 219, 260,
262, 265, 269, 272, 305, 463, 464, 466, 501
annealing, 314 annual rate, 445 anomalous, 274 ANOVA, 478 antagonism, xii, 284, 285, 289, 294, 295, 296,
297, 298, 299, 300, 301, 302 antagonist, 489 antagonistic, 285, 296, 297, 300 Antarctic, 172, 219, 222 antenna, vii, 1, 2, 3, 4, 5, 6, 8, 10, 11, 15, 16, 17,
18, 20, 21, 22, 23, 24, 25, 26, 27, 28, 29, 30, 31, 32, 33, 34, 35, 36, 37, 38, 39, 40, 41, 43, 44, 46, 47, 48, 50, 76, 77, 147, 151, 157, 166, 167, 181, 182, 183, 186, 214, 215, 216
antenna systems, 36, 147, 186 anthropogenic, xv, 443, 444, 447, 459 antibacterial, 235, 430, 436, 440 antibacterial properties, 235 antibiotic, 219, 235, 254, 339 antibiotic resistance, 235 antibiotics, 229, 235, 438, 440, 441 antibodies, 266 antibody, xi, 81, 87, 195, 200, 211, 216, 267 anticancer, 216, 217, 430, 436 anti-cancer, 52, 53, 54, 274 anticancer activity, 430 antigen, 159, 160 anti-HIV, 56 antioxidant, viii, xv, 51, 52, 53, 54, 100, 101,
216, 230, 473, 475, 481 anti-terrorism, 264, 272 antiviral, 430, 487 API, 195 apoptosis, 56, 100, 101, 230 application, ix, 47, 94, 106, 145, 219, 221, 264,
266, 268, 273, 279, 285, 288, 300, 342, 372, 390, 427, 461
applied research, 229 aquaculture, xv, 57, 199, 205, 208, 473, 474, 481 aqueous solution, 227 aqueous solutions, 227 aquifer, 397 Arabia, 306, 320 Arabian Gulf, 219, 321, 324, 327 Arabidopsis thaliana, 9, 17, 45, 46, 60, 97, 186,
423 arachidonic acid, 55 archaea, 326, 415, 490 arginine, 78, 81, 98, 102, 103, 148, 216, 229, 355 argon, 195 arid, 219, 372 aromatic compounds, 306
Index 509
aromatic hydrocarbons, 219, 223, 306, 308, 313, 321
ARS, 483 arsenic, 302 arsenite, 69 arthritis, 55 Arthrobacter nicotianae, 321 asbestos, 460 Ascidians, v, 161, 168, 182, 185 ascorbic, 54 ascorbic acid, 54 asexual, 466 ash, 29, 34, 123 ASI, 327, 365, 376 Asia, 102, 350 Asian countries, 102 aspartate, 232 asphaltenes, 312, 313 aspiration, 351 assessment, 55, 209, 254, 262, 265, 271, 279,
281, 285, 293, 300, 301, 350, 353, 389, 460 assignment, 21, 49, 172, 261, 346 assimilation, 64, 69, 224, 332, 347 assumptions, 10, 32, 455, 456 asymmetry, 19, 155 ATC, 314 Atlantic, 187 Atlantis, 197 atmosphere, 211, 260, 309, 445, 447, 459 atmospheric pressure, 357 atoms, 220, 244 ATP, 68, 103, 106, 109, 164, 213, 331, 408, 451,
452, 490, 499, 504 ATPase, 66, 67, 69, 70, 71, 111, 489, 504 attachment, 130, 154, 155, 363 attractiveness, 212 atypical pneumonia, 270 Aurora, 253, 254 Australia, 161, 173, 174, 181, 184, 225, 269, 270,
272, 273, 278, 280, 350, 353, 391, 395, 397, 429
Austria, 195 autofluorescence, 144, 162, 333 autotrophic, 321 availability, 77, 80, 206, 211, 221, 274, 426, 445,
456, 504 awareness, 273
B
B cell, 159 Bacillus, 96, 98, 220, 223, 226, 227, 230, 231,
235, 254, 320, 321, 327, 490, 499
Bacillus subtilis, 96, 490 Bacillus thuringiensis, 220, 223, 226, 227, 231 bacteria, vii, xii, 8, 57, 70, 93, 171, 173, 176,
178, 180, 188, 211, 214, 219, 225, 226, 230, 235, 236, 252, 260, 263, 284, 291, 302, 303, 305, 306, 307, 309, 310, 316, 318, 320, 321, 322, 323, 324, 326, 327, 330, 331, 332, 398, 400, 405, 408, 411, 414, 415, 417, 418, 420, 424, 425, 426, 427, 428, 435, 450, 456, 464, 466, 467, 468, 486, 490, 499, 501
bacterial, vii, xii, xvi, 2, 94, 99, 172, 177, 235, 255, 283, 292, 301, 303, 314, 315, 316, 317, 318, 320, 321, 325, 326, 327, 331, 334, 344, 345, 348, 409, 411, 412, 420, 428, 434, 435, 436, 464, 465, 470, 471, 485, 487, 488, 489, 490
bacterial cells, xvi, 485, 487, 488, 489, 490 bacterial strains, 177 bacterium, xii, 171, 174, 216, 234, 256, 283, 284,
286, 301, 304, 317, 325, 410, 411, 415, 416, 417, 424, 428, 434, 435
baking, 202 bandwidth, 34 Bangladesh, 208 barley, 44 barrier, xiv, 7, 12, 59, 193, 350, 372, 383, 385,
387, 388, 449 barriers, 350, 353 base pair, 339 basicity, 365 baths, 264 battery, 296, 301 beams, 145 behavior, 466 beneficial effect, 54 benefits, 52, 56, 57, 94, 183, 368, 388 Best Practice, 392 bicarbonate, 78 bile, 202, 356 bilge, 306 binding, vii, 1, 2, 4, 7, 18, 21, 22, 27, 37, 46, 61,
62, 68, 70, 75, 89, 97, 98, 100, 102, 108, 133, 139, 167, 181, 182, 186, 195, 215, 224, 235, 247, 254, 256, 266, 275, 276, 278, 279, 296, 344, 348, 415, 420, 440, 482, 501, 504
bioaccumulation, 208, 209, 210, 220, 225, 226 bioactive compounds, ix, xvi, 161, 163, 218, 270,
430, 437, 468, 485 bioassay, xii, 193, 262, 265, 283, 285, 292, 295,
300, 303, 482 bioassays, 265, 266, 285, 293, 294, 296, 299, 303 bioavailability, 284, 303, 486, 503 biocatalysts, 437
Index 510
biochemistry, 52, 102, 166, 170, 178, 223 bioconversion, 213 biodegradable, 215, 372, 460 biodegradation, xii, 225, 305, 306, 312, 318, 321,
322, 324, 325, 327, 361 biodiversity, 174, 320, 472 bioengineering, xv, 429, 437 bioethanol, 446 biofilms, 219, 226, 231, 315, 316, 325 biofuel, 57 biofuels, xv, 443 biogenesis, 78, 103, 434, 435 biological activity, 284, 436 biological clocks, 345, 346 biological processes, 459 biological systems, xii, 44, 283, 284, 285 bioluminescence, xii, xiii, 283, 284, 287, 288,
289, 291, 293, 297, 298, 299, 300, 303, 304, 329, 330, 331, 333, 334, 335, 336, 337, 338, 339, 340, 341, 342, 343, 344, 345, 346, 347, 348
biomass, xiv, xv, 57, 217, 226, 227, 263, 264, 273, 307, 349, 353, 362, 385, 387, 430, 443, 445, 451, 458, 460, 466
biomimetic, 431 biomolecules, 53 biopolymers, 255 bioreactor, 214, 231, 308, 448, 449, 450, 455,
456 Bioreactor, 307, 449, 456 bioreactors, 448, 449, 457, 458 bioremediation, 220, 324, 326 biosensors, 302, 303, 304 biosorption, 220 biosphere, 325 biosynthesis, viii, xi, xiv, 51, 58, 61, 72, 80, 95,
97, 130, 176, 178, 186, 187, 188, 209, 211, 216, 217, 218, 221, 222, 223, 224, 227, 229, 232, 423, 424, 425, 426, 427, 428, 429, 430, 433, 434, 435, 437, 438, 439, 440, 468, 469, 470, 471, 472, 485, 489, 490, 499, 500, 501, 504
biosynthetic pathways, xv, 429, 469, 490, 499 biotechnological, 212, 215, 221, 368, 427, 485 biotechnology, 52, 76, 100, 216, 221, 224, 472,
502 bioterrorism, xi, 259, 263, 264, 265, 266, 267,
268, 270, 271, 273, 274, 275 Biotransformation, 226 birds, xi, 205, 259, 263, 269 bivalve, 262, 277 bleaching, 19, 94, 143 blends, 446
blindness, 270 blocks, 42, 215 blood, 53, 56, 193, 202, 261 blood glucose, 53 blood-brain barrier, 193 blot, 59, 73, 74, 75, 84, 87, 215 body weight, 193, 200, 352, 357 boiling, 264, 356 Bolivia, 447 Boltzmann constant, 12 Boltzmann distribution, 25, 29, 32 Boltzmann factor, 36 bonding, 243, 255 bonds, 244, 248, 250, 251, 256 bottleneck, 9, 20 bottlenecks, 22, 30 boundary conditions, 18 bovine, 326, 468, 477 brain, 208 Brazil, xi, 209, 210, 259, 270, 272, 273, 278, 280,
353 breakdown, 263, 356 breeding, 231 broad spectrum, 430 bubble, 231, 359, 360, 363, 392 bubbles, 357, 359 Bubbles, 357 budding, 466 buffer, 116, 130, 248, 249, 314, 315, 318, 475,
476, 477 bulbs, 307, 308, 475 burning, xv, 6, 48, 50, 443, 444 burns, 429 bursa, 464 by-products, xiv, 350, 351, 357, 373, 374, 382,
385, 388
C
Ca2+, 72 cadmium, 296, 302, 304 Caenorhabditis elegans, 101 caffeine, 196 calcium, 56, 96, 371, 375, 381, 388, 398, 503 calibration, 196, 197, 201, 287, 293 Canada, 273, 353, 391, 392, 425 cancer, 53, 55, 101, 102, 176, 436 Candida, 505 candidates, 144, 220, 335 capillary, 196, 197, 312 capital cost, 358 capital goods, 457 carbohydrate, 424, 451
Index 511
carbohydrates, 106, 109, 451, 453 carbon, vii, xii, 53, 78, 79, 80, 94, 97, 99, 102,
106, 170, 176, 181, 183, 214, 215, 219, 221, 227, 244, 264, 305, 307, 309, 316, 317, 318, 319, 320, 321, 323, 341, 351, 354, 357, 359, 363, 366, 376, 382, 391, 392, 394, 433, 434, 435, 438, 440, 444, 445, 458, 464, 466, 467, 469, 503
carbon dioxide, 78, 79, 80, 94, 97, 227, 354, 444, 464
carbon fixation, 469 carbon tetrachloride, 53, 102, 503 carboxyl, 84, 89, 97, 144, 183, 420 carboxylic, 351, 367, 388 carcinogen, 262 carcinogenesis, 54 carcinogenic, 192 carcinogens, 262 cardiovascular disease, 94 Caribbean, 450, 465, 467, 470 Caribbean Sea, 450 carotene, vii, xiv, 1, 2, 42, 52, 53, 54, 57, 101,
166, 399, 400, 401, 402, 404, 408, 411, 415, 416, 418, 419, 420, 421, 422, 423, 424, 425, 426, 428
carotenoids, xiv, 43, 107, 166, 189, 260, 399, 400, 401, 402, 404, 405, 407, 408, 411, 414, 419, 422, 423, 424, 425, 426, 427, 428, 474, 487
carrier, 67, 94, 103, 109, 130, 312 case study, 97, 225, 394 cast, 315 CAT, 314 catabolic, 176 catabolism, 501 catalase, xv, 473, 475, 476, 477, 478, 479, 480,
482, 483 catalysis, 100, 490 catalytic activity, viii, 11, 52, 55, 97 catfish, xv, 210, 473, 474, 475, 481, 482 cation, 6, 296, 501 cattle, xi, 259 cavities, 140, 170 CD8+, 159 cell culture, xiii, 81, 87, 329 cell cycle, 70 cell death, 53, 355 cell differentiation, 221 cell division, 292, 336, 338 cell growth, 76, 103, 302, 448, 489 cell line, 54, 56, 101, 176, 177, 230, 436 cell lines, 56, 176, 177, 436 cell membranes, 356
cell separations, 464 cell surface, 216, 220, 348 cellulose, 368 cellulosic, 169 cephalochordates, 180 ceramic, 373, 390 cesium, 196 CFD, 397 Chad, 217 channels, 72, 266 chaperones, 65, 68, 93 charge coupled device, 337 chemical composition, 371 chemical content, 93 chemical interaction, 289, 371 chemical oxidation, 373 chemical structures, 179, 357 chemicals, 52, 93, 177, 285, 292, 300, 302, 352,
361, 455 chemiluminescence, 344, 345, 346, 348 chemotaxis, 72 chemotherapy, 176 children, 352 Chile, 228 China, 105, 210, 217, 262, 280, 281, 463, 471 Chl, 2, 3, 4, 5, 6, 9, 12, 15, 16, 19, 20, 22, 26, 27,
28, 31, 35, 40, 147, 167, 378, 386 chloramphenicol resistance, 341 chloride, 220, 226, 312, 314, 360, 361, 366, 391 chlorination, 360, 362, 397, 433, 434 chlorine, 280, 351, 374 chloroform, 314 chlorophyll, vii, ix, xiv, 2, 3, 5, 7, 9, 11, 15, 17,
19, 20, 22, 28, 31, 36, 41, 43, 46, 48, 49, 72, 76, 102, 106, 107, 108, 109, 117, 129, 147, 161, 162, 164, 165, 166, 167, 168, 172, 173, 181, 182, 183, 184, 185, 186, 187, 188, 189, 211, 260, 330, 334, 348, 349, 353, 354, 360, 362, 373, 374, 394, 399, 400, 422, 490
chlorophyll-a, 42 chloroplast, 2, 59, 101, 111, 185, 348, 482 chloroplasts, viii, x, 43, 44, 46, 48, 105, 106, 107,
111, 147, 162, 172, 173, 186, 188, 211, 224, 260, 464, 482
cholesterol, 52, 53 cholinergic, 276 chopping, 467 chordata, 168, 185 chromatograms, 196 chromatography, 101, 196, 197, 204, 208, 230,
248, 312, 488 chromophore, 153 chromosome, xii, 239, 283, 286
Index 512
chromosomes, 234 CIL, 290, 291 Cincinnati, 304 circadian, xi, xiii, 101, 233, 236, 237, 254, 329,
332, 333, 335, 338, 339, 340, 341, 342, 343, 344, 345, 346, 347, 348
circadian clock, xiii, 254, 329, 335, 338, 341, 345, 346, 347, 348
circadian oscillator, 347 circadian rhythm, xi, xiii, 233, 236, 237, 329,
332, 335, 338, 339, 342, 343, 344, 346, 347, 348
circadian rhythms, xi, xiii, 233, 236, 237, 329, 338, 339, 342, 344, 346, 347
circular dichroism, 151, 250, 256 circulation, 55, 206, 307 cis, 75, 101, 245, 252, 330, 347, 400, 409, 411,
423, 426, 428 cisplatin, 302 classes, 178, 264, 266, 427, 431, 433, 490, 500 classical, 64, 285, 289, 300, 408 classification, 362, 375, 382, 400, 479 clay, 325, 358, 359, 360 cleaning, 230, 306, 327 cleavage, 74, 143, 254 climate change, 458 clone, 179, 313, 314, 317, 318, 319, 320, 322,
339 cloning, 84, 177, 185, 228, 251, 318, 319, 408,
423, 441, 469, 470 clustering, 131 clusters, 2, 3, 7, 16, 18, 42, 43, 81, 88, 89, 91,
107, 218, 435, 437, 438, 452 Co, vi, 184, 187, 210, 279, 283, 286, 290, 291,
296, 398, 446, 456, 504 CO2, xii, xv, 78, 106, 109, 149, 176, 212, 214,
222, 231, 305, 309, 323, 331, 443, 444, 445, 446, 447, 448, 449, 450, 453, 454, 455, 456, 462, 479
coagulation, 351, 359, 360, 365, 367, 387, 388, 391, 393, 394, 398
coal, 449 coastal areas, xii, 305, 306 cobalamin, xvi, 485, 489, 490, 501, 504, 505 cobalt, 486, 489, 490, 499, 504 cocaine, 263 coccus, 403, 404 coding, 88, 166, 228, 339, 343, 346, 423, 425,
426 codon, 62, 234, 239, 343 coefficient of variation, 287, 291 coenzyme, 230, 489, 490, 504, 505
cofactors, vii, 1, 2, 3, 8, 11, 14, 15, 81, 84, 87, 88, 108, 176, 400, 490
coil, xi, 79, 80, 131, 233, 235, 240, 241, 242, 246, 248, 250, 251, 256
colitis, 55, 95 collaboration, 452 colonizers, 219 colors, 117 combined effect, 300, 302, 306 combustion, 446, 449 commensals, 466 commercialization, 57, 229 commodity, 229 communities, xii, 219, 305, 306, 323, 326, 327,
465 community, 7, 8, 183, 274, 306, 313, 315, 318,
324, 325, 350, 436, 444, 445, 450, 465, 471, 472
compaction, 146, 377 compatibility, viii, 51 compensation, 335, 339, 342 competition, 24, 75, 265, 266, 296, 389, 434 complement, xii, 83, 172, 283, 284, 285 complexity, 8, 15, 36, 255, 284, 431 compliance, 272 components, xii, 19, 20, 21, 23, 25, 29, 31, 37,
38, 40, 69, 76, 77, 98, 109, 117, 128, 131, 134, 135, 136, 137, 138, 140, 141, 142, 144, 150, 155, 156, 158, 171, 206, 216, 222, 299, 305, 306, 307, 309, 369, 372, 400, 449
composition, vii, ix, 1, 3, 13, 18, 33, 58, 61, 94, 95, 103, 106, 124, 142, 149, 152, 157, 162, 172, 189, 214, 217, 223, 231, 312, 313, 315, 318, 321, 325, 354, 361, 371, 372, 395, 405, 411, 414, 419, 420, 428, 430, 448, 455
compounds, ix, x, xi, xii, xiii, xv, xvi, 161, 163, 176, 177, 178, 192, 193, 195, 207, 215, 217, 218, 224, 229, 254, 259, 261, 263, 264, 265, 270, 271, 272, 273, 274, 277, 283, 290, 291, 299, 306, 308, 312, 320, 321, 322, 324, 325, 349, 350, 351, 357, 360, 368, 370, 372, 374, 382, 383, 389, 393, 407, 408, 430, 436, 437, 438, 440, 450, 468, 469, 473, 474, 475, 481, 485, 486, 487, 488, 489, 500, 503
computing, 21, 366 concentrates, 350, 397 concentration, x, xii, 25, 26, 40, 53, 56, 78, 97,
106, 109, 128, 130, 144, 168, 171, 177, 192, 198, 200, 203, 204, 205, 206, 210, 263, 264, 272, 280, 283, 286, 287, 288, 291, 293, 302, 304, 309, 314, 315, 318, 352, 355, 359, 360, 362, 363, 364, 366, 369, 370, 371, 373, 374,
Index 513
376, 377, 381, 382, 384, 385, 386, 387, 388, 405, 436, 444, 445, 449, 451, 456
condensation, 218, 408, 430, 434, 435 conditioning, 363, 374 conductive, 214 conductivity, 363, 376, 377, 379, 382 confidence, 287, 293, 294, 295, 297, 364, 378 confidence interval, 287, 294, 295, 297, 364, 378 confidence intervals, 287, 294, 295, 297 configuration, 23, 112, 117, 130, 132, 145, 204,
243, 371, 388, 405 conflict, 41 conformity, 288, 295 Congress, 391, 395, 396 conjugation, 145, 160, 209, 212, 216, 266, 279 Connecticut, 476 connective tissue, 464 consensus, xi, 7, 61, 62, 233, 359, 360, 445 conservation, 4, 157, 174 constant rate, 307, 475 constraints, 57, 447 construction, 57, 89, 93, 116, 127, 128, 131, 132,
133, 134, 135, 136, 137, 138, 140, 167, 284 consumer protection, 193 consumers, ix, x, 191, 192, 193, 219, 270, 458 consumption, xiii, 193, 206, 213, 214, 222, 262,
270, 273, 324, 349, 352, 384, 446, 457 contaminant, 20, 352, 390 contaminants, xii, 264, 284, 285, 290, 303, 321 contamination, ix, x, 57, 191, 192, 193, 203, 204,
207, 209, 231, 274, 284, 287, 326, 327 contingency, 274 control, xi, xii, xiv, 8, 53, 54, 57, 70, 98, 100,
147, 178, 193, 204, 211, 212, 213, 215, 220, 221, 225, 229, 230, 231, 237, 268, 272, 283, 285, 287, 291, 293, 296, 307, 312, 313, 322, 334, 342, 348, 350, 377, 385, 387, 388, 390, 392, 394, 397, 504
control group, 53, 54 convection, 369 convective, 369 conversion, viii, 2, 6, 41, 78, 80, 106, 182, 214,
221, 225, 411, 444, 445, 446, 447, 450, 452, 453, 454, 455, 456, 457, 458, 460, 501, 504
cooking, x, 192, 202, 203, 489 cooling, 103, 336 copolymer, 216 copolymers, 229 copper, 109, 220, 227, 270, 287, 296, 300, 302,
303, 304, 482 coral, 163, 168, 185, 187, 231, 465, 466, 467, 472 coral reefs, 185, 466 corn, 446, 447
correlation, 174, 206, 289, 330, 427, 479 correlation coefficient, 289 correlations, 394 cortex, 465 cosmetics, 53, 216 cost-effective, viii, 51, 57, 92, 93 costs, 358, 372, 457, 458 cotton, 348 couples, 16, 31, 34, 39 coupling, 10, 12, 13, 22, 24, 25, 28, 30, 32, 33,
36, 39, 42, 47, 129, 155, 166, 438, 452 covalent, 209, 235 covering, 303, 319, 452 COX-2, 55 CPB, 290, 293, 294, 295 crab, 209 CRC, 100, 184, 256, 277 crop residues, 445 crops, 228, 446 crosslinking, 144 cross-linking, 145 crude oil, xii, 219, 305, 306, 307, 309, 310, 312,
313, 315, 316, 317, 318, 320, 321, 322, 323, 325, 326, 327, 456, 458
crustaceans, x, 191, 194, 205, 209 cryogenic, 42 crystal structure, 121, 125, 129, 131, 135, 140,
143, 152, 154, 155, 158, 235, 236, 238, 239, 243, 244, 245, 247, 248, 250, 253
crystal structures, 236, 238, 239, 243, 245, 248 crystalline, 239, 472 crystallisation, 425 crystallization, 153, 154, 155, 248, 256 crystals, 155, 238, 239, 241 C-terminal, 132, 168, 235, 244, 246, 250, 501 C-terminus, 89, 234, 246, 250, 251 cultivation, viii, 51, 52, 57, 75, 93, 176, 333, 335,
336, 423, 467 culture, ix, xiii, xv, 52, 57, 63, 74, 77, 78, 80, 94,
102, 161, 162, 164, 176, 180, 213, 214, 216, 220, 231, 263, 305, 307, 309, 318, 322, 329, 331, 332, 333, 342, 348, 355, 356, 362, 374, 434, 436, 437, 448, 449, 454, 455, 456, 463, 464, 467, 469, 473, 475, 476, 479
culture conditions, 77, 216, 454, 479 currency, 455 current prices, 458 cyanide, 271, 434, 439 cyanocobalamin, 486, 504 cyanophyta, xv, 103, 183, 185, 228, 464, 473 cycles, 108, 175, 314, 315, 318, 342 cycling, 176 cyclooxygenase, 55, 97, 100, 102
Index 514
cyclooxygenase-2, 100 cysteine, 80, 100, 102, 121, 124, 125, 126, 248,
250, 262 cysteine residues, 121, 124, 125, 126, 250 cytochrome, 83, 84, 85, 87, 88, 89, 90, 96, 97, 98,
99, 103, 107, 108, 109, 111, 147, 148, 164 cytokine, 97 cytokines, 55 cytometry, 145, 159, 160, 225 cytoplasm, 171, 215, 354, 408 cytoplasmic membrane, 99, 112 cytosine, 257 cytosol, 482, 505 cytosolic, 146, 478 cytotoxic, 170, 176, 177, 182, 189, 430 cytotoxins, 177, 217 Czech Republic, 272, 273, 279, 353
D
data analysis, 24, 289, 296 data collection, xiii, 252, 329 database, 64, 72, 216, 234, 236, 253, 315, 324,
347, 414 DBP, 390, 395 de novo, 72, 250, 252, 274, 489, 490, 501, 502,
505 death, 192, 206, 262, 265, 269, 270, 278, 357,
482 deaths, xi, 259, 269, 272, 357 decay, 9, 13, 14, 15, 18, 19, 20, 21, 24, 25, 26,
28, 29, 30, 31, 34, 38, 39, 40, 43, 192 decision support tool, 387 decomposition, 264, 323, 397, 453 defense, 178, 466, 469, 474, 478 defenses, 178, 184 deficiency, xvi, 101, 181, 182, 186, 347, 473,
475, 481 definition, 188, 242, 262, 272, 285, 300 deformation, 261 degradation, ix, x, xii, 74, 76, 77, 93, 94, 95, 100,
106, 143, 158, 164, 192, 202, 203, 218, 219, 305, 306, 321, 322, 323, 324, 325, 326, 327, 356, 357, 393, 474
degradation mechanism, 76 degradation process, 76 degrading, 228, 318, 321, 322, 324, 325, 327 dehydration, 57, 97, 219, 225 dehydrogenase, 76, 98, 99, 215, 416, 428 delivery, 213 delocalization, 117, 128 dementia, 280 denaturation, 314, 315, 318
denaturing gradient gel electrophoresis (DGGE), 174, 327, 464
density, 49, 53, 216, 246, 287, 354, 358, 360, 393, 398, 461, 475
deoxyribonucleotides, 500 deoxyribose, 54 Department of Agriculture, 473 Department of Energy, 42, 252 dephosphorylation, 143 deposition, 57, 372, 469 deprivation, 76, 80, 94, 100, 143, 451 derivatives, x, xiv, 192, 235, 254, 286, 344, 399,
400, 401, 411, 422, 440, 483 dermatitis, 438 desert, 219, 228, 325, 327, 489 desiccation, 219, 222 desorption, 64 destruction, 446 detection, 19, 30, 74, 75, 88, 99, 160, 193, 194,
195, 196, 202, 204, 207, 208, 209, 263, 265, 266, 267, 268, 275, 276, 279, 291, 302, 303, 353, 365, 373, 376, 394
detoxification, 177, 193 detritus, 205 developing countries, 445 deviation, 61, 91, 291, 293, 364 diabetes, 53, 94 diabetes mellitus, 53 dialysis, 375 diarrhoea, 270 diatoms, xii, 57, 305, 309, 464, 466, 467, 475 diazotrophs, 472 diesel, 327 diet, 53, 206, 262 dietary, 54, 55, 217, 223, 468, 470, 486 diets, 170, 171 differential equations, 13, 14, 18 differentiated cells, 236 differentiation, 211, 221, 267 diffraction, 135 diffusion, 8, 22, 35, 139, 157, 159, 239, 369 diffusion process, 35 digestion, 64, 151 digestive tract, 170 dihedral angles, 242, 243 dimer, 7, 15, 16, 20, 148, 167, 235, 251 dimeric, 108, 167, 490 dimerization, 256 dinoflagellates, 107, 171, 187, 262, 263, 266,
464, 466, 470 dipole, 10, 116, 129, 383 dipole moment, 10 directionality, 9, 17
Index 515
discs, 133 diseases, 52, 53, 55 disinfection, xiv, 350, 351, 373, 374, 382, 385,
388 disorder, 55, 247, 255 dissociation, 116, 144, 303, 351 dissolved oxygen, 309 distillation, 398 distilled water, 194 distribution, 23, 24, 25, 29, 32, 38, 139, 140, 141,
142, 159, 164, 170, 172, 177, 183, 208, 210, 235, 252, 274, 312, 319, 326, 351, 361, 370, 374, 389, 395, 438, 489
disulfide, 246, 248, 249, 250, 252, 256 disulfide bonds, 250, 256 divergence, 172, 174, 178 diversification, xiv, 180, 429, 430 diversity, xiii, xiv, xv, 48, 130, 146, 170, 172,
173, 174, 177, 178, 181, 187, 188, 218, 219, 225, 230, 275, 305, 306, 318, 319, 320, 324, 326, 327, 397, 423, 426, 429, 430, 431, 433, 436, 437, 463, 464, 467, 470, 471, 504
division, xv, 162, 185, 292, 317, 336, 338, 473 DNA, xiv, 53, 56, 58, 62, 64, 65, 67, 69, 72, 75,
77, 98, 99, 102, 173, 174, 178, 179, 184, 187, 188, 212, 215, 219, 235, 253, 254, 256, 262, 278, 313, 314, 315, 318, 324, 339, 342, 346, 399, 401, 420, 422, 433, 435, 438, 459, 460, 464, 500
DNA damage, 69, 72, 99, 235, 278 DNA polymerase, 65, 235, 254, 315, 318 DNA repair, 64, 65, 72 dogs, xi, 259, 263 domain structure, 152 donor, 2, 12, 15, 19, 45, 81, 83, 87, 90, 106, 108,
109, 123, 128, 147, 155, 345, 450, 452, 454, 456, 477
donors, 87, 88, 98, 121, 122, 125, 126, 250, 450, 451
doping, 145 dosing, 387 double bonds, 58, 117, 130 down-regulation, 60 draft, 212 drainage, xii, 283, 284 drinking, xi, xiii, xiv, 206, 225, 259, 262, 269,
270, 272, 273, 274, 280, 290, 349, 350, 351, 352, 353, 363, 368, 372, 374, 375, 382, 383, 385, 387, 388, 389, 390, 392, 393, 394, 395, 396, 397, 398, 485
drinking water, xi, xiii, xiv, 206, 225, 259, 262, 270, 272, 273, 274, 280, 290, 349, 350, 351, 352, 353, 363, 368, 372, 374, 375, 382, 383,
385, 387, 388, 389, 392, 393, 394, 395, 396, 397, 398
Drosophila, 267 drug discovery, 281, 471 drug interaction, xii, 284, 285, 300 drug resistance, 436, 440, 441 drug-resistant, 440 drugs, 302, 430 drying, 195, 219, 226 duplication, 178, 415, 435 duration, 103 dyes, 144, 145
E
E. coli, 63, 81, 83, 84, 85, 86, 87, 88, 89, 90, 91, 92, 96, 98, 177, 216, 219, 235, 254, 292, 330, 335, 339, 415, 418, 434, 501
early warning, 353, 387 ears, 351 earth, xv, 106, 443, 447 ecological, vii, x, 1, 154, 177, 187, 209, 211, 218,
220, 284, 297, 301, 306, 436, 437, 486 ecological systems, 218 ecology, 189, 326, 327, 472 ecosystems, xii, 283, 284, 320, 325, 481 edema, 55 education, 443 effluent, 195, 231, 307, 308, 309, 310, 311, 312,
313, 315, 316, 362, 366, 369, 391 effluents, xii, 283, 284, 286, 304 eicosapentaenoic acid, 215, 232 eigenvector, 14, 16 electric field, 369 electrical properties, 398 electricity, 446, 449, 458 electrodes, 214 electroluminescence, 145 electrolyte, 370, 375, 391 electrolytes, 370 electromigration, 369 electron, vii, viii, 1, 2, 3, 5, 6, 7, 8, 9, 10, 11, 12,
14, 15, 17, 18, 19, 20, 21, 26, 28, 31, 33, 35, 41, 42, 43, 44, 45, 46, 47, 48, 49, 50, 54, 83, 87, 88, 90, 97, 98, 105, 106, 107, 108, 111, 112, 115, 135, 147, 150, 151, 213, 214, 215, 312, 411, 450, 451, 452, 454, 456, 466, 474, 477
electron microscopy, 112, 151, 325, 465, 466 electron-phonon, 10 electron-phonon coupling, 10 electrons, 87, 106, 109, 117, 213, 214, 450, 452,
453, 478
Index 516
electrophoresis, 62, 63, 78, 130, 131, 174, 218, 314, 315, 326, 327, 464
electroporation, 212 electrostatic interactions, 370, 383, 388 ELISA, x, 191, 192, 193, 195, 198, 199, 200,
201, 202, 203, 206, 266, 269, 274, 280 ELISA method, 195, 198 elongation, 430 e-mail, 329, 349, 400 embryos, 169, 170 emission, 3, 5, 10, 15, 17, 19, 20, 28, 30, 32, 34,
36, 37, 39, 44, 46, 48, 49, 116, 117, 121, 123, 124, 125, 126, 127, 129, 130, 134, 135, 144, 145, 291, 331, 445, 446, 449, 458
emitters, ix, 10, 106, 129, 135 encoding, 59, 76, 94, 97, 98, 155, 156, 178, 179,
186, 212, 215, 218, 227, 234, 268, 342, 343, 426, 427, 435, 490, 501
endocrine, 351, 373 endoplasmic reticulum, 96 ENDOR, 48 end-to-end, xi, 233, 236 energy consumption, 446, 457 energy efficiency, 215 energy recovery, 372, 457, 458 energy transfer, vii, ix, xv, 1, 6, 8, 11, 12, 15, 17,
18, 20, 22, 23, 26, 28, 32, 35, 38, 40, 41, 42, 43, 44, 45, 46, 47, 48, 106, 116, 121, 122, 123, 124, 125, 126, 127, 128, 134, 135, 139, 144, 149, 151, 153, 154, 155, 157, 158, 159, 166, 463, 466, 469
engines, 424 England, 391 enterovirus, 56, 101 enthusiasm, 450 environment, vii, xii, 31, 120, 123, 125, 128, 135,
154, 170, 217, 219, 220, 245, 250, 260, 264, 265, 277, 283, 284, 306, 356, 395, 436, 446, 465, 466, 467, 470, 471
environmental change, 64, 148 environmental conditions, 77, 99, 158, 201, 212,
280 environmental factors, 80, 103, 182, 284, 355 environmental impact, 227, 306, 350 Environmental Protection Agency (EPA), 215,
285, 293, 303, 304, 372, 375, 383, 385, 391, 475
environmental stimuli, 3 environmental threats, 466 enzymatic, 80, 81, 88, 89, 330, 331, 423, 433,
434, 435, 437, 478 enzymatic activity, 81, 88, 89, 330 enzyme inhibitors, 302
enzyme-linked immunosorbent assay, 209 enzymes, viii, xiv, 52, 58, 68, 80, 81, 88, 89, 163,
166, 178, 179, 213, 218, 222, 226, 266, 268, 331, 399, 401, 402, 404, 408, 409, 411, 412, 415, 416, 419, 420, 422, 427, 429, 430, 434, 435, 437, 451, 474, 478, 490, 500, 501, 504
Epi, 436 epiphytes, 171 epithelium, 192, 271 EPR, 48 equilibrium, 3, 14, 16, 21, 23, 26, 27, 32, 40, 41,
139, 196, 197, 370, 445 erosion, 220 erythrocyte, 54 erythrocytes, 100 Escherichia coli, 62, 80, 93, 94, 95, 96, 97, 100,
102, 103, 214, 216, 222, 224, 226, 228, 235, 253, 256, 296, 314, 345, 423, 425, 426, 438, 503, 505
ESI, x, 192, 194, 196, 197, 204, 205, 207 ester, 235, 400, 428 esterase, 266, 267 esters, 405, 426 estimating, 304 estuarine, 303 ethanol, 446 ethers, 468 ethical concerns, 265 etiology, 53, 270 eukaryote, 106, 107, 121, 153, 216, 331, 471 eukaryotes, viii, 2, 6, 10, 105, 107, 146, 147, 234,
331, 335, 463 eukaryotic cell, ix, 105, 106, 107, 344 euphotic zone, 166 Euro, 458 Europe, 205, 207, 280, 350 European Commission, 263, 273, 277, 392 European Parliament, 392 European Union (EU), 263, 273, 277, 353, 387,
390, 392 eutrophication, 350 evaporation, 312, 372, 374 evening, viii, 51 evolution, vii, ix, x, xiv, 1, 2, 9, 13, 15, 17, 18,
21, 23, 25, 26, 27, 29, 30, 34, 35, 38, 39, 41, 43, 101, 106, 107, 121, 146, 147, 161, 164, 172, 174, 178, 180, 185, 187, 188, 211, 221, 223, 224, 280, 296, 325, 348, 423, 425, 427, 429, 430, 435, 438, 450, 452, 453, 459, 461, 463, 471, 476, 504, 505
evolutionary process, 180 EXAFS, 47
Index 517
excitation, ix, 5, 6, 8, 10, 14, 15, 17, 18, 20, 22, 25, 29, 30, 31, 34, 37, 38, 39, 40, 41, 42, 44, 45, 46, 47, 48, 49, 106, 121, 122, 124, 128, 129, 130, 139, 143, 145, 153, 162
exciton, 8, 10, 29, 30, 41, 45, 47, 128 exclusion, 22, 97, 248, 249, 250, 369, 371, 384 excretion, 323, 489 exercise, 277 exonuclease, 65 experimental condition, 14, 196, 489 experimental design, 287, 288, 301 expertise, 395 exploitation, xv, 270, 343, 443 exports, 489 exposure, 57, 58, 64, 72, 74, 75, 143, 184, 209,
270, 271, 272, 273, 274, 276, 278, 290, 291, 292, 293, 333, 351, 352
extinction, 144 extracellular matrix, 169 extraction, xiii, 193, 206, 207, 264, 279, 313,
314, 329, 363, 374, 394, 395 eyes, 351
F
FAD, 87, 90, 415, 420 failure, 278 family, vii, ix, xiv, 1, 4, 58, 66, 67, 71, 79, 80, 93,
111, 134, 155, 156, 159, 161, 163, 172, 176, 178, 192, 228, 234, 236, 253, 270, 346, 355, 415, 426, 429, 430, 431, 432, 433, 436, 437, 464, 468, 504
farming, 225, 445 farmland, 445, 447 fasting, 53 fatalities, 210, 262, 276, 390 fatigue, 357 fatty acid, viii, 51, 58, 61, 63, 81, 83, 84, 85, 86,
87, 88, 89, 90, 92, 94, 95, 97, 101, 103, 420, 427, 430, 500, 501
fatty acids, viii, 51, 83, 85, 87, 89, 92, 95, 101, 427, 501
fauna, ix, 191, 207 fax, 473 fear, 274, 275 feedback, 340, 348 feeding, 101, 205, 206, 209, 433, 435, 436 fermentation, 214, 451 fern, 263, 482 fertilization, 225 fertilizers, 455 FHA, 64, 95 fiber, 326, 476
fidelity, xiii, 329 Fiji, 178 filament, 103, 212 film, 312, 456 film thickness, 312 films, 223, 449, 456 filters, 194, 313, 314, 363 filtration, 64, 209, 351, 358, 360, 362, 363, 370,
372, 373, 374, 381, 389, 390, 391, 392, 396, 397
fine tuning, viii, 2 finfish, 270 fingerprinting, 72, 174, 471 fingerprints, 64 Finland, 394, 395, 397 fish, ix, x, xi, 56, 170, 191, 192, 193, 194, 195,
198, 200, 201, 202, 203, 204, 205, 206, 207, 208, 209, 210, 215, 219, 259, 269, 281, 448
FISH, 464, 469, 470 fish production, 193 fisheries, xi, 259 fitness, 178 fixation, 176, 211, 221, 231, 236, 452, 459, 460,
462, 466, 469 flame, 312 flame ionization detector, 312 flavor, 474, 482, 483 flexibility, 50, 139 flight, 197 float, 260, 360 floating, 174, 448 flocculation, 351, 358, 359, 360, 365, 367, 384,
387, 388, 391 flotation, xiii, 349, 350, 357, 358, 359, 360, 365,
377, 384, 389, 391, 392, 393, 394, 396, 397, 398
flow, 42, 57, 88, 144, 145, 150, 152, 159, 160, 169, 170, 196, 197, 213, 215, 225, 248, 266, 307, 333, 358, 373, 376, 450, 467, 475
flow cytometry analysis, 159 flow rate, 196, 197, 248, 307, 475 fluid, 307 fluorescence, 3, 5, 9, 10, 14, 15, 17, 19, 20, 21,
28, 29, 30, 34, 35, 36, 37, 38, 40, 41, 44, 45, 47, 48, 49, 64, 116, 117, 120, 121, 123, 124, 125, 126, 127, 129, 130, 134, 135, 144, 145, 155, 159, 165, 166, 167, 184, 216, 330, 464, 466, 467, 468, 469
fluorescence decay, 29, 37, 44 fluorescence in situ hybridization, 464, 469 fluorescent microscopy, 465 fluorophores, 155, 159 fluoroquinolones, 235
Index 518
folding, 72, 248, 256 food, viii, xv, 51, 52, 56, 93, 170, 193, 205, 217,
225, 227, 230, 231, 270, 273, 274, 351, 444, 446, 458, 471, 486, 488, 489, 503
food production, xv, 444, 458 food products, 270, 274 food safety, 193 foodstuffs, 270, 445 forests, 446 formaldehyde, 144, 309 formamide, 315 fossil, xv, 212, 280, 443, 444, 445, 446, 447, 449,
458 fossil fuel, xv, 212, 443, 444, 445, 446, 447, 449,
458 fossil fuels, xv, 443, 444, 445, 447, 449, 458 fouling, 351, 370, 371, 374, 381, 386, 389, 393,
396, 397, 398 Fourier, 344 fractionation, 278, 476 fragmentation, x, 56, 192, 196, 197, 203, 204,
207 France, 320, 326, 353, 441, 447 free energy, 12, 17, 40 free radical, 54, 55 free radicals, 55 freeze-dried, 206, 265 fresh water, vii, 218, 331, 341, 397, 448, 455 freshwater, vii, xii, 107, 125, 142, 165, 193, 209,
210, 217, 229, 263, 275, 276, 278, 279, 283, 284, 285, 301, 354, 390, 430, 436, 439
Friedmann, 222 frying, 202 fuel, 212, 228, 325, 444, 446, 449, 461 fuel cell, 212, 446, 449 fumarate, 103 functional analysis, vii, 1, 61 funding, 389, 459 fungal, 84, 85, 87, 97, 271, 433, 434, 435, 437 fungi, 178, 219, 260, 321, 323, 411, 412, 415,
435, 464, 501 fungicidal, 440 fungicide, 430 fur, 78, 80, 96 fusion, 69, 84, 85, 87, 97, 99, 214, 238, 239, 254,
302, 333, 335, 339, 341, 342
G
G4, 1 Gamma, 306, 320, 322 gamma-ray, 103
gas, 195, 214, 260, 312, 354, 357, 396, 398, 448, 449, 450, 452, 456, 461
gas chromatograph, 312 gas phase, 214, 448, 456 gases, 195, 449 gasoline, 327, 446 gastrointestinal, 55, 206, 263 gastrointestinal tract, 55, 206 Gaza, 306, 320 GC, 85, 92, 275, 312, 314, 315, 318, 365, 398 GDP, 410, 416 gel, 62, 63, 78, 130, 131, 174, 312, 314, 315, 316,
318, 319, 326, 327, 464, 488, 503 gels, 315, 316 GenBank, 87, 175, 236 gene expression, xiii, 60, 61, 64, 72, 74, 75, 94,
97, 99, 101, 102, 229, 230, 254, 329, 330, 331, 333, 339, 340, 344, 345, 346, 347
gene promoter, 61, 62, 75, 102 gene targeting, 341 gene transfer, 173, 212, 423 generation, viii, 51, 184, 286, 324, 449, 475 genetic control, 212, 221 genetic diversity, 173, 174 genetic screening, 435 genetics, vii, 1, 338, 341 Geneva, 208, 397, 398, 482 genome, viii, xi, xiii, xiv, 52, 64, 72, 93, 106,
146, 155, 163, 164, 166, 176, 187, 221, 231, 233, 234, 236, 239, 253, 330, 331, 333, 335, 339, 341, 343, 346, 347, 399, 401, 414, 415, 420, 422, 435, 469, 501
genome sequences, 401, 501 genome sequencing, 176, 221, 341, 401 genomes, 212, 234, 236, 401, 435 genomic, xvi, 99, 163, 174, 187, 211, 215, 335,
339, 341, 342, 453, 460, 469, 485, 490 genomic DNA library, 335, 339 genomic regions, 339, 342 genomics, 146, 164, 255, 280, 505 Germany, 194, 286, 476, 477 GGT, 314 GHG, 459 Gibbs, 12, 444, 450, 459 Gibbs free energy, 12 gill, 192, 193 glass, 307, 308, 309, 314, 315, 333, 363, 477 global climate change, 444, 460 glucose, 53, 61, 147, 341, 342 glucoside, 400, 405, 411, 428 glutamate, 66, 67, 68 glutamine, 453 glutaraldehyde, 266, 469
Index 519
glutathione, xv, 193, 473, 475, 478, 482 glutathione peroxidase, xv, 473, 475, 477 glycemia, 53, 100 glycerol, 79, 80, 100, 227, 239, 318, 319, 467,
468 glycine, 42, 81, 433, 435 glycogen, 142 glycolipids, 253, 423 glycoprotein, 223 glycoside, 401, 405, 406, 407, 416, 417, 419, 422 glycosides, xiv, 399, 400, 401, 402, 404, 405,
406, 407, 416, 417, 419, 422, 423, 424, 426, 428
glycosyl, 65, 66, 67, 405, 416, 426 goals, 475 gold, 18, 29, 34, 38, 214, 220, 223, 225, 226, 228 gold nanoparticles, 220, 223, 225, 226, 228 government, 274, 445, 447, 456, 459 grains, 260, 447 Gram-negative, x, 178, 211, 489 Gram-positive, 178 gram-positive bacteria, 320 grana, 147, 168 grants, 93, 301 granules, 165, 169, 216, 225, 229 grass, 163, 445 gravity, 389 green fluorescent protein, 344 greenhouse, 444, 459 greenhouse gas, 444, 459 greening, 278 GroEL, 62, 65, 68, 75 grouping, 162 groups, 9, 20, 40, 53, 55, 64, 76, 78, 88, 112, 117,
131, 133, 144, 153, 165, 169, 173, 175, 177, 207, 212, 214, 217, 238, 260, 291, 320, 322, 327, 351, 355, 367, 372, 381, 383, 388, 401, 405, 415, 416, 418, 422, 425, 433, 438, 452, 489
growth, viii, xii, 44, 51, 52, 54, 55, 56, 57, 58, 59, 64, 73, 75, 76, 78, 80, 95, 99, 103, 142, 211, 214, 218, 219, 225, 228, 231, 280, 287, 292, 302, 304, 305, 307, 309, 313, 318, 321, 322, 323, 333, 335, 336, 337, 338, 341, 342, 345, 350, 351, 354, 355, 361, 362, 363, 374, 375, 405, 426, 434, 436, 444, 448, 455, 466, 467, 475, 479, 489
growth factor, 55 growth factors, 55 growth rate, 56, 103, 142, 354, 361, 426, 444,
467, 475 growth temperature, viii, 52, 58, 64, 75 Guam, 277, 280
guidelines, 272, 273, 275, 352, 387, 395 Guinea, 178, 466 Gulf War, 306
H
H2, xv, 55, 212, 213, 214, 215, 222, 226, 228, 229, 231, 444, 446, 447, 448, 449, 450, 451, 452, 453, 454, 455, 456, 457, 458, 459, 461
habitat, 121, 127, 149, 153, 167, 170, 322 hairpins, 61 half-life, 74 halogenated, 438, 468 halogenation, 435 handling, 196, 264, 284 hands, 178 hanging, 239, 247 hardness, 371, 372, 375, 382, 388 harm, xv, 260, 273, 274, 443 harmful effects, 58 harvest, ix, 105, 109, 116, 125, 135, 260, 362,
454 harvesting, vii, ix, xiv, 1, 2, 8, 40, 43, 44, 45, 46,
48, 49, 53, 75, 76, 77, 95, 105, 108, 109, 111, 116, 121, 124, 125, 127, 129, 131, 135, 139, 146, 148, 149, 150, 151, 152, 154, 157, 158, 165, 166, 167, 181, 182, 184, 185, 188, 216, 399, 400, 422, 447, 454, 455, 457
Hawaii, 430 hazardous wastes, 361 hazards, 351 HDL, 53 health, viii, xii, 51, 52, 57, 94, 193, 207, 209,
210, 215, 217, 230, 262, 264, 269, 270, 272, 274, 275, 276, 277, 283, 284, 303, 350, 351, 352, 353, 362, 373, 389, 391, 393, 394, 503
health effects, 270, 272, 274, 353, 362 heart disease, 53 heat, 58, 70, 72, 74, 75, 94, 95, 98, 99, 264, 342,
345, 348, 376, 424 heat shock protein, 70, 94, 342, 345 heating, 249 heavy metal, xi, xii, 211, 219, 227, 283, 284, 285,
286, 288, 289, 290, 291, 294, 297, 299, 300, 302, 303
heavy metals, xii, 219, 283, 284, 285, 286, 289, 290, 291, 300, 303
height, 112, 337, 338 helix, xi, 135, 143, 148, 233, 235, 239, 242, 246,
247, 248, 250, 251, 254, 255 Helix, 254 hemodialysis, 278, 351 hemorrhage, 55
Index 520
hepatocytes, 202, 261, 356 hepatotoxicity, 278, 503 hepatotoxins, xi, 209, 217, 259, 260, 262, 275,
281, 387, 392, 394, 397, 485 heptapeptide, 217, 227, 397 herbicide, 223, 426 herbicides, xv, 303, 372, 473, 481 herpes, 503 herpes simplex, 503 heterocycles, 178 heterocyst, 214, 215, 234, 236, 253, 254, 354,
453 heterodimer, 2, 4, 415 heterogeneity, 31, 33, 34, 47, 134, 145, 150, 159,
188 heterogeneous, 4, 11, 31, 33, 34, 351, 354, 374 heterotrophic, xii, 106, 107, 217, 219, 283, 285,
305, 306, 307, 309, 321, 322, 323, 324, 341, 345, 467, 468
hexane, 312 Higgs, 99 high density lipoprotein, 53 high pressure, 365, 376 high resolution, xiii, 203, 204, 207, 329, 363, 376 high risk, 274 high temperature, 13, 58, 72, 74, 75, 202, 320,
336, 356 high-frequency, 48 high-performance liquid chromatography, 209,
394 hip, 206 histamine, 55, 56, 100 histidine, 64, 65, 67, 81, 87, 88, 89, 91, 96, 98, 99 histochemistry, 144 HIV, 56, 93, 159, 235 HIV-1, 56, 93, 159 HK, 101, 504 HLA, 159 Holland, 210, 472 holocomplex, 46 holoenzyme, 61 homeostasis, 78, 302 homocysteine, 65, 68, 501, 505 homogenized, 194 homogenous, 10, 39 homolog, 235, 416, 469 homologous genes, 94, 408, 411, 412, 415, 422 homologous proteins, 108 homology, 132, 278, 411, 414, 415, 420, 501 horizontal gene transfer, 173 hormone, 160 horse, 448
host, viii, ix, xiii, xv, 2, 7, 56, 81, 84, 85, 87, 88, 89, 92, 106, 107, 160, 161, 163, 164, 166, 168, 169, 170, 171, 172, 173, 174, 176, 177, 178, 179, 180, 183, 184, 185, 187, 198, 253, 260, 329, 330, 342, 437, 463, 464, 465, 466, 467, 468, 469, 472
host tissue, 164, 170 hostile environment, 471 hot spring, 218, 331 hot water, 207 housing, 464 HPC, 317 HPLC, 193, 194, 265, 267, 363, 365, 374, 376,
393 HSP, 72, 342 HSV-1, 56 hub, 247, 255 human, viii, xii, xiii, xiv, 51, 52, 53, 54, 56, 93,
96, 100, 101, 159, 193, 200, 209, 210, 215, 217, 219, 223, 225, 226, 230, 254, 262, 269, 270, 272, 274, 275, 276, 278, 283, 284, 302, 349, 350, 351, 352, 353, 362, 384, 392, 394, 477, 489, 503, 504, 505
human immunodeficiency virus, 96, 223, 254, 503
human leukocyte antigen, 159 humanitarian, 274 humans, viii, xvi, 51, 52, 53, 192, 217, 234, 265,
270, 485, 486, 487, 489, 502 humic acid, 372, 375, 398 humic substances, 315, 351, 362, 371, 372, 375,
382, 393, 395 hybrid, x, xiv, 67, 192, 197, 204, 225, 429, 430,
461 hybridization, 74, 173, 231 hydro, 116, 131, 219, 223, 306, 307, 309, 312,
313, 318, 320, 321, 324, 351, 357, 362, 371, 374, 375, 381, 383, 384, 385, 449
hydrocarbon, xii, 305, 306, 312, 313, 318, 321, 322, 324, 325, 326, 327
hydrocarbons, 306, 307, 309, 312, 318, 320, 321, 324, 449
hydrodynamic, 351, 369, 371, 386 hydrodynamics, 373, 377 hydrogen, x, 7, 80, 81, 211, 212, 213, 214, 215,
221, 225, 226, 227, 228, 229, 230, 231, 232, 240, 242, 243, 244, 250, 251, 255, 312, 434, 444, 449, 459, 460, 461, 462, 464, 474, 477, 482
hydrogen bonds, 240, 242, 244, 251 hydrogen gas, 461 hydrogen peroxide, 80, 474, 477, 482 hydrogen sulfide, 464
Index 521
hydrolysis, 356, 490, 504 hydrolyzed, 216, 235 hydrophilic, 116, 131, 351, 357, 362, 371, 374,
375, 381, 383, 384, 385 hydrophilicity, 372, 382 hydrophobic, 101, 116, 138, 230, 240, 241, 245,
256, 351, 356, 359, 368, 371, 374, 375, 381, 382, 383, 385, 393
hydrophobic interactions, 381, 383 hydrophobicity, 363, 371, 381, 394 hydroxyl, xiv, 54, 399, 400, 401, 405, 416, 417,
418, 419, 420, 422 hydroxyl groups, 405, 418 hydroxylation, 416 hypercholesterolemia, 52 hypertension, 217 hypothesis, 7, 34, 47, 78, 83, 84, 85, 87, 94, 146,
176, 466, 469
I
IBD, 55 ibuprofen, 54 ice, 254, 477 id, 313, 434 identification, x, 72, 74, 75, 88, 153, 159, 192,
203, 212, 219, 260, 266, 304, 351, 387, 392, 435, 436, 438, 470, 471, 472, 482
identity, 14, 133, 178, 411 IEA, 445, 447, 458, 460 IL-1, 431, 432, 434 illumination, 450, 454, 479 images, 310, 311, 316 imaging, xiii, 159, 329, 332, 348, 464 immersion, 193 immobilization, 213 immune response, 55 immunity, 253 immunoassays, 193, 266 immunological, 194, 206, 279, 487 immunomodulator, 53 immunosuppressive, 430 implementation, xiii, 349 IMS, 402, 403, 404, 414, 418 in situ hybridization, 464, 469 in vitro, ix, 53, 54, 56, 81, 84, 91, 94, 96, 161,
162, 164, 171, 177, 178, 180, 235, 436, 437, 503, 504
in vivo, 3, 5, 53, 54, 55, 81, 83, 84, 85, 87, 94, 97, 216, 302, 344, 346, 437, 483
inactivation, 76, 97, 213, 220, 454, 461 inactive, xvi, 485, 487, 502 incandescent, 307, 308
incandescent light, 307, 308 incentives, 458 incidence, 262 incineration, 372 inclusion, 117, 142 inclusion bodies, 142 incubation, 74, 333 India, 156, 217 Indian, 468 Indian Ocean, 468 indication, 206, 315 indicators, 303 indigenous, 52, 220, 269, 306, 488 individuality, 252 indole, xiv, 429, 430, 433, 434, 435, 437, 439,
440 indomethacin, 54 Indonesia, 306 induction, 55, 64, 78, 80, 98, 103, 347 industrial, viii, xii, 51, 75, 89, 92, 93, 217, 219,
223, 283, 284, 306, 368, 377, 381, 444, 445, 456
industrial application, 368, 381 industrial wastes, 306 industrialized countries, 445 industry, 306, 372 ineffectiveness, 360 inert, 284, 450 infants, 352 infection, 159, 174, 180 infectious, 352 inferences, 185, 435 inflammation, 54, 55, 102 inflammatory, 52, 53, 54, 55, 94, 95, 100, 216,
263 inflammatory bowel disease, 55 inflammatory disease, 55 inflammatory mediators, 55 inflammatory response, 55, 100 infrared, 35 ingestion, 192, 209, 269, 351 inhalation, 271, 276, 351 inherited, 111, 170 inhibition, xii, 36, 53, 54, 56, 102, 193, 195, 209,
262, 266, 268, 278, 279, 280, 281, 283, 284, 287, 288, 289, 293, 297, 298, 299, 300, 326, 356, 393, 436, 476
inhibitor, 55, 96, 100, 253, 268, 279, 304 inhibitors, 192, 235, 263, 265, 268, 302, 304, 430 inhibitory, viii, 36, 51, 56, 100, 208, 235, 315 inhibitory effect, viii, 51, 56, 100, 235, 315 initial state, 14 initiation, 15, 108
Index 522
injection, 195, 248, 271, 312, 372, 489 injections, 56 injury, iv inoculum, 311, 314, 316 inorganic, xii, 99, 106, 109, 305, 309, 354, 372,
373, 388 iNOS, 55 insecticides, 266, 268 insects, 205 insertion, 132, 215, 246, 247, 286, 335, 339, 342,
499, 504 insertion sequence, 132 insight, viii, 2, 45, 158, 433, 435 inspection, 17, 24, 26, 362 instruments, 284, 459 insulin, 94 insulin resistance, 94 integration, 25, 31, 41, 156, 173, 213, 387, 470 integrity, 314, 360 interaction, 43, 44, 47, 101, 116, 121, 128, 130,
132, 133, 135, 138, 147, 152, 158, 209, 220, 225, 230, 235, 256, 280, 285, 296, 304, 369, 466, 504
interaction effect, 304 interaction effects, 304 interactions, xii, 98, 116, 132, 151, 158, 187, 221,
240, 247, 255, 275, 276, 284, 285, 289, 294, 296, 297, 299, 300, 302, 303, 370, 371, 381, 383, 388, 392, 397, 436, 440, 463, 471
interface, 6, 8, 16, 131, 134, 143, 251 interference, 56, 134, 162, 207, 330, 444, 459 Intergovernmental Panel on Climate Change, 444 intermolecular, 145, 251, 351 International Energy Agency, 445, 447 interval, 5, 17, 291, 294, 295, 334, 454 intervention, 350 intestine, 489 intimacy, 173 intoxication, 280, 351 intraperitoneal, 271 intravenous, 489 intravenously, 270 intrinsic, 36, 40, 107, 167, 255, 504 intrinsically disordered proteins, 247 intrinsically disordered regions, 247 invasive, 186 inversion, 35 invertebrates, 168, 171, 181, 205, 219, 224, 265,
464, 468, 469 investigations, 106, 113, 149, 260 investors, 444 ionic, 7, 116, 351, 369, 370, 371, 390 ionization, 64, 203, 207, 278, 312
ions, x, 192, 196, 197, 207, 220, 227, 267, 301, 303, 351, 368, 369, 370, 371, 373, 381, 390, 396, 397, 434
IPCC, 444, 445, 458, 460 Ireland, 176, 181, 184, 189 iron, 2, 3, 7, 11, 16, 42, 43, 44, 45, 48, 49, 70, 78,
80, 94, 108, 167, 181, 186, 332, 347, 420, 490 iron deficiency, 181, 186, 347 iron transport, 70 irradiation, 454, 466 irrigation, xi, 259, 270, 276, 372 ischemic, 53 ischemic heart disease, 53 ISO, 28 isoelectric point, 375 isoforms, 59, 102, 217, 433, 434 isolation, xv, 151, 157, 182, 196, 207, 212, 216,
436, 441, 463, 464, 467, 468, 469, 470, 472 isoleucine, 88 isomerization, 426 isopods, 466, 471 isoprene, 178, 431, 433, 434, 435 isoprenoid, xiv, 423, 425, 427, 429, 430 Israel, 276, 434, 440 Italy, x, 1, 191, 192, 193, 194, 195, 196, 197,
205, 207, 209, 373
J
Japan, 52, 95, 161, 168, 173, 183, 186, 329, 398, 399, 420, 443, 446, 455, 456, 476, 478, 485, 488
Japanese, 54, 339 JAVA, 431 Jordan, 2, 3, 7, 11, 22, 42, 43, 44, 46, 147, 400,
425, 440 Jun, 206 Jung, 101, 216, 225, 438 juveniles, 205
K
K-12, 103 KH, 208 kidney, 56, 193, 208 kinase, 64, 65, 66, 67, 79, 94, 95, 99, 100, 234 kinases, 62, 64, 75, 94, 95, 96, 99 kinetic constants, 13, 25 kinetic model, viii, 2, 8, 9, 11, 13, 15, 28, 31, 36,
39, 40, 392 kinetics, viii, 2, 7, 8, 16, 17, 19, 21, 24, 28, 30,
36, 39, 41, 43, 45, 47, 49, 147, 155, 158, 167
Index 523
kinks, 252 Kobe, 161 Korea, 394 Kuwait, 320, 327 Kyoto Protocol, 444
L
labeling, 64, 145, 488 labor, 457 laboratory method, 208 Lactobacillus, 103, 501 lagoon, 320 lakes, vii, ix, x, 191, 192, 194, 205, 218, 219,
222, 263, 275, 354, 485 lamellae, 184 land, xv, 107, 167, 219, 306, 331, 400, 443, 444,
445, 446, 447, 458 landfill, 372 land-use, 444 Langerhans cells, 56 Langmuir, 225, 226 large-scale, xv, 344, 443, 445, 446, 448, 449,
450, 455, 458, 459 larvae, 170, 174, 183, 205, 215, 220, 231, 466 larval, 183, 186, 209, 222 laser, 64, 145, 197 lattice, 12, 22, 31, 40, 41, 45, 239 lattices, 45, 47 law, 288, 295, 296 LDL, 53 leaching, 313, 323 leakage, 373 legislation, 263, 264, 268, 272, 273, 274, 275,
353, 361, 372 lesions, 270, 350 lettuce, 270, 276 leucine, 43, 241 leukemia, 54, 101, 230 leukocyte, 159 leukotrienes, 55 LHC, vii, 1, 3, 4, 5, 9, 15, 17, 20, 22, 24, 27, 28,
30, 33, 39, 41, 167 lifetime, 9, 14, 15, 18, 19, 20, 21, 22, 23, 25, 26,
28, 30, 31, 34, 35, 37, 38, 39, 40, 41, 272, 352 ligand, 43, 247, 275, 276, 459, 486, 490, 499 ligands, 247, 301, 500 light conditions, 33, 59, 76, 77, 121, 124, 139,
147, 167, 171, 333, 476 light cycle, 237 light-induced, 97 likelihood, 272, 274, 275
limitation, ix, 9, 21, 22, 26, 35, 41, 61, 106, 143, 455, 470
limitations, 39, 193, 461 linear, viii, 12, 13, 14, 18, 26, 28, 31, 41, 53, 64,
78, 80, 103, 105, 106, 107, 108, 111, 117, 196, 197, 203, 204, 287, 289, 291, 294, 295, 303, 351, 355
linear regression, 197 linkage, 117, 134, 153, 157, 235, 261, 405, 416,
422 links, 109 linoleic acid, 58, 81, 83, 88 linolenic acid, viii, 51, 52, 58, 74, 81, 88, 89, 92 lipid, 53, 54, 55, 58, 60, 80, 83, 84, 87, 96, 97,
99, 102, 103, 400, 474 lipid peroxidation, 54 lipid peroxides, 54 lipids, 53, 59, 61, 63, 83, 95, 503 lipophilic, 481 lipopolysaccharide, 55, 94, 100, 263, 279 lipopolysaccharides, 217, 230, 355 lipoprotein, 53, 96 liquid chromatography, 62, 193, 204, 208, 209,
267, 280, 376, 394, 397 liquid phase, 357 liver, xiii, 53, 54, 102, 193, 208, 209, 210, 261,
262, 270, 280, 349, 356, 505 liver cancer, 262, 280 liver damage, xiii, 270, 349, 356 livestock, 269 local government, 456 localised, 2, 353 localization, 59, 99, 144, 234, 253, 302, 330, 344,
470 London, 94, 208, 224, 229, 231, 276, 277, 278,
280, 325, 389, 392, 393, 395, 397, 424, 461, 502
long distance, 179 long period, 454 long-distance, 129 losses, 22, 162 Louisiana, 205 low molecular weight, 260, 262, 357, 363, 368,
371, 375, 382, 388 low temperatures, 28, 44, 61, 72, 168, 360 low-density, 360 low-temperature, 95, 102 LPS, 55, 279 L-shaped, 240 luciferase, xiii, 254, 284, 285, 286, 304, 329, 330,
331, 332, 342, 343, 344, 345, 346, 347, 348 luciferin, 285, 331, 332 luminal, 236, 253
Index 524
luminescence, xii, xiii, 283, 286, 287, 289, 290, 291, 296, 329, 330, 331, 333, 334, 335, 338, 346
lutein, 400 lycopene, 411, 412, 415, 416, 417, 422, 423, 424,
425, 426, 427 lymphocyte, 54 lymphocytes, 159 lysine, 100 lysis, xiii, 100, 206, 314, 323, 349, 360, 361, 383,
384, 387
M
M1, 70 machinery, 187 machines, xiii, 330, 336 Mackintosh, 262 macroalgae, 107 macromolecules, 53, 371, 381, 390 macrophage, 97 macrophages, 55, 94, 95, 100 magnesium, 68, 490, 504 magnetic, 42, 145 magnetic properties, 42 maintenance, 57, 58, 59, 285, 301, 306, 387, 448 maize, 454 major histocompatibility complex, 159 malondialdehyde, 99 mammal, 261 mammalian, 504 mammalian cell, 176, 177, 500 mammalian cells, 500 mammals, 261, 265, 269, 279, 487, 489 management, xiii, 208, 272, 275, 276, 277, 349,
350, 352, 387, 389, 391, 445, 481, 502 management practices, 445 manganese, 100, 234, 253 manipulation, 14, 216, 220, 223, 335, 341, 342,
362, 424, 437 manufacturer, 195, 196, 315, 318, 319 manure, 445 mapping, 330 marine environment, vii, 107, 181, 260, 263, 270,
354, 460, 464, 466 market, 277 marketplace, 100 Markov, 460 Maryland, 476 mass spectrometry, x, 62, 64, 192, 193, 196, 207,
267, 277, 278, 281, 284 mass transfer, 368 mast cell, 55, 56
mast cells, 55, 56 maternal, 170 matrix, 12, 13, 14, 16, 17, 23, 26, 37, 64, 169,
183, 197, 207, 248, 354, 368, 396, 398 maturation, 398 Maya, 306 MCP, 72 measurement, xiii, 203, 206, 212, 289, 329, 330,
334, 339, 377, 476, 477 measures, 40, 89, 207, 272, 274, 277, 368, 382,
387, 445 meat, 263, 273 media, 57, 77, 271, 272, 302, 362, 375, 455 median, 37, 287, 288, 301 mediation, 55, 440 mediators, 55 medicine, xi, 211, 216, 224, 300 Mediterranean, 183, 187 melt, 249 melting, 318, 319 membrane permeability, 393 membranes, 35, 48, 49, 58, 59, 60, 85, 87, 96, 97,
99, 106, 107, 108, 109, 111, 112, 114, 132, 133, 135, 138, 150, 151, 156, 164, 167, 168, 182, 226, 271, 276, 368, 369, 370, 371, 372, 373, 376, 377, 381, 383, 389, 390, 391, 393, 394, 395, 396, 397, 398, 400, 427, 449, 481
memory, 1 mentor, 1 Merck, 284, 312, 365, 375, 376 mercury, 220, 489 mergers, 471 MES, 286, 289, 290 metabolic, 53, 59, 78, 93, 176, 187, 254, 284,
434, 435, 466, 467, 469, 490 metabolic pathways, 93, 177, 434, 435 metabolic rate, 78 metabolism, xv, 60, 78, 89, 98, 147, 176, 193,
212, 213, 215, 221, 225, 226, 229, 230, 335, 354, 435, 444, 453, 462, 467, 483, 487, 489, 500, 505
metabolite, ix, xvi, 161, 171, 185, 281, 331, 472, 483, 485, 490
metabolites, xi, 170, 177, 180, 181, 182, 187, 195, 217, 218, 231, 259, 274, 277, 301, 354, 355, 430, 436, 439, 468, 470, 472, 485
metabolome, 438 metal ions, 220, 303 metal nanoparticles, 224 metallothioneins, 303 metals, xii, 102, 177, 214, 220, 228, 283, 284,
285, 286, 287, 291, 294, 295, 296, 299, 302, 303, 304, 367, 489
Index 525
methane, 464 methanol, 197, 264, 312, 363, 374 methionine, xvi, 43, 88, 176, 434, 485, 489, 500,
501, 502, 505 methyl group, 217, 420, 433, 501 methyl groups, 217, 420, 433 methyl viologen, 482 methylation, 218 methylmalonyl-CoA, 489, 501 metric, 455 Mexico, 52, 205, 217 Mg2+, 504 MgSO4, 375, 456 MHC, 79, 159 Miami, 184, 450, 461 mice, 52, 54, 55, 95, 270, 276, 357, 393 micelles, 214, 228 microalgae, 57, 217, 223, 326, 354, 439, 450,
451, 459, 470, 502 microarray, 64, 236 microbes, 467, 471 microbial, xii, xv, 172, 181, 185, 188, 219, 224,
231, 273, 287, 296, 301, 303, 305, 306, 307, 309, 310, 311, 313, 314, 318, 320, 321, 322, 323, 324, 325, 326, 327, 414, 463, 464, 465, 470, 472
microbial cells, 296 microbial communities, xii, 219, 305, 306, 323 microbial community, 306, 465, 472 microcavity, 145 microenvironment, 117, 129, 130, 467 microenvironments, 117, 130, 323 microflora, 326 micrograms, 73, 274 Micronesia, 181 micronutrients, 354, 355 microorganism, 94, 220, 223, 304, 309 microorganisms, xii, xiii, 97, 171, 220, 222, 224,
228, 284, 305, 306, 309, 310, 320, 321, 322, 323, 324, 325, 330, 362, 373, 427, 436, 450, 461, 464, 478
microscope, 54, 165, 309, 311, 336 microscopy, 112, 151, 171, 174, 325, 465, 466 microsomes, 54 microtubule, 430, 436, 440 migration, viii, 2, 8, 23, 39, 49, 55 mimicking, 16, 23, 29, 37 mimicry, 235 minerals, viii, 51, 52, 93, 487 Ministry of Education, 463 Ministry of Environment, 353, 395 minors, 400 missions, 124
Mississippi, xv, 473, 475, 482, 483 mitochondria, 146 mitochondrial, 102 mixing, 57, 315, 333, 334, 365 MnSOD, 475, 479 mobility, 139, 157, 255 model system, 103, 344 modeling, 458 models, vii, 1, 2, 8, 13, 15, 22, 25, 28, 31, 36, 39,
45, 93, 100, 300, 369, 370 modulation, 76 modules, 501 moieties, vii, 1, 2, 24, 25, 401, 405, 406, 407, 424 molecular biology, xi, 77, 102, 149, 233 molecular mass, x, 59, 87, 89, 108, 117, 126, 128,
129, 132, 133, 134, 192, 301, 501 molecular mechanisms, xi, 61, 259 molecular oxygen, 106 molecular structure, x, xi, 49, 150, 192, 207, 233 molecular weight, 2, 131, 145, 157, 260, 261,
262, 267, 351, 355, 357, 362, 363, 367, 368, 370, 371, 372, 373, 375, 382, 387, 388, 486
molecules, vii, x, 1, 2, 3, 6, 15, 23, 26, 40, 44, 45, 46, 107, 108, 109, 130, 159, 170, 176, 187, 192, 217, 248, 260, 273, 276, 330, 355, 369, 381, 382, 397, 430, 431, 432, 433, 434, 435, 436, 437, 438, 439, 464, 466, 468, 470, 471, 502
mollusks, 205 monoclonal, 81, 84, 87, 159, 160, 193, 216, 266,
279 monoclonal antibodies, 84, 159, 160, 193, 266,
279 Monoclonal antibodies, 278 monoclonal antibody, 81, 87 monolayers, 225 monomer, 49, 108, 109, 112, 121, 123, 124, 125,
126, 128, 129, 144, 235, 246, 251, 415, 501 monomeric, vii, 1, 3, 6, 16, 36, 46, 490, 501 monomers, 3, 4, 22, 117, 121, 128, 132, 153 mononuclear cells, 56 morphological, ix, 2, 77, 78, 80, 96, 103, 106,
112, 161, 180, 466 morphology, ix, 77, 103, 105, 150, 164, 342, 354,
363, 386, 388 mortality, 208, 210, 270, 272 Moscow, 211, 213, 221, 224 mosquitoes, 221, 222 mouse, 193, 226, 262, 265, 357, 392 mouth, 270, 351 movement, 314, 448 mRNA, 59, 60, 61, 73, 74, 97, 99, 335, 339, 342 MSI, 464
Index 526
mucous membrane, 270 mucous membranes, 270 mucus, 271 multiplication, 54 muscle, x, 192, 193, 194, 198, 200, 201, 202,
205, 206, 207, 357 muscle tissue, 193, 207 mutagen, xiii, 329, 339 mutagenesis, 81, 83, 88, 91, 103, 212, 213, 218,
219, 223, 234, 335, 345, 348, 450 mutant, xiii, 89, 151, 213, 215, 218, 220, 224,
226, 227, 230, 231, 232, 268, 329, 330, 332, 334, 339, 340, 344, 346, 347, 348, 416, 453, 454, 461, 462
mutant cells, 218, 454 mutants, 7, 21, 42, 48, 50, 62, 63, 76, 89, 97, 98,
103, 151, 158, 212, 213, 214, 218, 221, 234, 267, 335, 339, 340, 343, 344, 346, 416, 434, 453
mutation, 43, 61, 81, 84, 88, 346, 426 mutations, 7, 18, 45, 88, 150, 178, 348 MVA, 408 mycobacterium, 95, 235, 239, 253 myeloid, 54, 101, 230 myeloperoxidase, 55
N
N-acety, 67 NaCl, 222, 249, 307, 373 NAD, 411, 415, 451 NADH, 99, 348 nanoparticles, xi, 211, 220, 221, 223, 224, 225,
226, 228 naphthalene, 223, 321 National Institutes of Health, 252 National Science Foundation, 42 NATO, 327 natural, ix, xi, xiv, xv, 53, 96, 120, 128, 176, 177,
191, 211, 217, 218, 220, 238, 264, 268, 274, 281, 297, 306, 321, 348, 349, 351, 353, 355, 356, 358, 360, 362, 364, 370, 373, 375, 379, 380, 381, 383, 384, 387, 388, 389, 390, 391, 393, 394, 396, 397, 423, 429, 430, 433, 434, 435, 436, 437, 438, 439, 450, 455, 456, 463, 464, 466, 467, 468, 469, 470, 471, 473, 486, 503
natural environment, 120, 128, 264, 297, 356, 450, 467, 470
natural food, 486 natural habitats, 450 negative relation, 206 neglect, 22
nematodes, 270 Netherlands, 81, 149, 275, 277, 280, 281, 327,
395 network, 10, 101, 240, 243, 244, 251 neural network, 255 neural networks, 255 neurodegenerative, 102, 277 neurodegenerative disease, 102, 277 neurodegenerative diseases, 102 neuroprotective, 101 neurotoxic, 263, 268, 277, 279, 355, 357 neurotoxins, xi, 217, 259, 260, 262, 266, 277,
387, 485 neutrophil, 159 New England, 84 New South Wales, 161, 225, 429 New York, , 47, 93, 95, 102, 149, 158, 181, 185,
256, 278, 301, 304, 324, 345, 346, 348, 391, 394, 397, 423, 461, 475, 477
New Zealand, 185, 353, 383, 389, 395 Newton, 224 next generation, 466 NF-κB, 55 Ni, 214, 253, 255, 256, 286, 290, 291 nickel, 213, 490 nicotinamide, 87 Niger, 217 Nile, 395 nitrate, 69, 79, 176, 208, 219, 224, 286, 303, 332,
347 nitrates, 135 nitric oxide (NO), 55, 95, 102 nitric oxide synthase, 55, 102 nitrogen, vii, ix, xv, 53, 64, 76, 77, 78, 94, 98,
100, 106, 143, 176, 195, 213, 215, 216, 219, 220, 221, 227, 228, 231, 234, 236, 244, 250, 253, 254, 260, 301, 309, 312, 322, 354, 357, 405, 433, 434, 451, 452, 453, 454, 455, 457, 460, 461, 463, 464, 466, 469, 470, 471, 472, 482
nitrogen compounds, 219, 260 nitrogen fixation, xv, 176, 219, 234, 236, 301,
322, 451, 452, 453, 457, 463, 467, 482 nitrogen fixing, 453, 461, 466 nitrogenase enzyme, xv, 444, 446 NMR, 153, 250, 255 noise, 204, 205, 330 non toxic, 206 non-enzymatic, 54, 474, 477 non-enzymatic antioxidants, 54 non-hazardous, 284 non-native, 437
Index 527
non-steroidal anti-inflammatory drugs (NSAIDS), 54
non-symbiotic, 172, 178 nontoxic, 216 Norfolk, 222, 226, 229, 476 normal, 53, 55, 152, 206, 235, 268, 339, 359,
426, 489 North Carolina, 478 Norway, 279 NOS, 55 novelty, 437 NRC, 276, 279 N-terminal, 84, 87, 97, 100, 132, 235, 239, 240,
241, 247, 250, 251, 343, 501 NTU, 363, 364, 376, 378, 379, 382, 385, 386,
389 nuclear, 55, 103, 146, 156, 255 nucleic acid, 247 nucleotide sequence, 61, 347 nucleotides, 314 nucleus, 85, 87, 107, 146, 348 numerical analysis, 27 nurse, 465 nutraceutical, 216 nutrient, xi, xii, 76, 77, 78, 80, 94, 95, 142, 170,
180, 215, 225, 229, 259, 305, 307, 354 nutrient transfer, 170 nutrients, 264, 323, 354, 355, 361, 448, 455, 456,
464, 466, 487 nutrition, xv, 217, 463, 469, 488
O
obligate, ix, 161, 162, 163, 164, 168, 170, 171, 180, 186, 346, 464
observations, 21, 37, 149, 170, 206, 310, 318, 411, 414, 448, 489, 490
occupational, 271 oceans, vii, 188, 466 octane, 312 odors, 219 offshore, 306 offshore oil, 306 Ohio, 304 oil, xii, 53, 57, 217, 219, 230, 305, 306, 307, 308,
309, 310, 312, 313, 315, 316, 317, 318, 320, 321, 322, 323, 324, 325, 326, 327, 333, 335, 444, 450, 456, 458
oil production, 306 oil spill, 306, 325, 326, 327 oils, 306, 313, 446 oligomer, 6 oligomerization, 96
oncology, 208 on-line, 387 OPEC, 444 operator, 489 operon, 78, 80, 103, 176, 334, 346, 347 opportunism, 146 optical, 19, 21, 35, 36, 64, 81, 220, 363 optical density, 64, 81 oral, 101, 192, 270, 351, 489 orchestration, 347 Oregon, 475 organ, 170, 262, 464 organelle, 103, 106 organelles, 107, 112 organic, xii, 57, 144, 145, 221, 225, 260, 279,
284, 305, 321, 323, 341, 351, 359, 360, 362, 363, 368, 370, 372, 373, 374, 375, 376, 382, 388, 389, 390, 391, 392, 393, 394, 396, 397, 398, 431, 445, 446, 450, 451, 464, 467
organic compounds, 368, 370, 372, 373, 450 organic matter, 57, 323, 351, 360, 362, 368, 371,
375, 382, 389, 390, 391, 393, 394, 396, 397 organic polymers, 145 organic solvent, 279 organic solvents, 279 organism, vii, 5, 17, 47, 58, 72, 106, 112, 129,
174, 217, 236, 262, 285, 291, 293, 296, 304, 322, 332, 395, 411, 463, 464, 467
organoleptic, 350 organophosphates, 266, 267 organophosphorous, 266 orientation, 241, 243, 244, 389 orthorhombic, 155 oscillation, 254 oscillations, 236, 342 osmosis, 368, 390, 391, 395, 397, 398 osmotic, 99, 139, 219, 368, 369, 370, 393 osmotic pressure, 368, 369, 370, 393 ovary, x, 192, 200, 201 overproduction, 55 oxidants, 53, 356 oxidation, 7, 8, 16, 44, 47, 108, 147, 212, 213,
214, 218, 223, 284, 309, 321, 324, 356, 367, 372, 373, 433, 477, 480
oxidative, 53, 78, 94, 102, 278, 397, 478, 482 oxidative damage, 478 oxidative stress, 53, 78, 94, 102, 478, 482 oxide, 55, 95, 99, 102 oxygen, viii, xii, 2, 7, 42, 53, 78, 80, 93, 99, 101,
105, 106, 107, 108, 147, 148, 164, 167, 168, 182, 185, 186, 187, 211, 213, 219, 224, 236, 243, 244, 305, 309, 322, 331, 345, 411, 424, 425, 450, 451, 459, 461, 476, 482, 483, 500
Index 528
oxygenation, 260 oyster, 319 ozonation, 362, 363, 372, 373, 375, 382, 392 ozone, 280, 351, 356, 362, 363, 396
P
Pacific, xi, 102, 184, 233, 252 pain, 273 Pakistan, 208 Palestine, 320 palladium, 221, 226 Papua New Guinea, 178, 466 paralysis, 357 parameter, 14, 15, 145, 159, 352, 359, 387 parasites, 103 Paris, 277 Parkinsonism, 280 particles, xiv, 17, 37, 44, 45, 47, 49, 50, 107, 151,
350, 357, 358, 359, 360, 365, 368, 373, 376, 381, 382, 385, 388, 456
particulate matter, 358, 359, 363 partnership, 178 patella, 169, 176, 181, 182, 184, 187, 189, 469,
471 patents, 216, 229 pathogenesis, 55 pathogenic, 94, 362 pathogens, xi, 259, 260, 273 pathophysiology, 99 pathways, xiv, xv, 44, 58, 64, 93, 153, 154, 177,
178, 179, 342, 343, 399, 401, 402, 405, 408, 411, 412, 419, 422, 423, 429, 431, 434, 435, 437, 469, 474, 490, 499
patients, xi, 53, 100, 209, 259, 270 Patriot Act, 273, 281 Pb, 286, 290, 291, 296, 303 PBC, 129 PBMC, 56 PCBs, 121, 123, 128, 129 PCR, 84, 174, 188, 212, 215, 223, 268, 269, 314,
315, 316, 318, 319, 326, 330, 437, 469 PCs, 121, 122, 125, 128, 130, 134 penicillin, 430 Pennsylvania, 396, 420 peptidase, 228 peptide, xiv, 7, 64, 72, 101, 133, 134, 135, 177,
179, 182, 184, 196, 197, 208, 209, 217, 223, 226, 227, 229, 235, 243, 244, 254, 261, 268, 278, 281, 343, 355, 382, 388, 394, 395, 397, 429, 430, 435, 438, 439, 468, 469, 470
peptides, 59, 131, 133, 134, 152, 153, 163, 176, 178, 179, 181, 182, 184, 187, 217, 224, 256, 260, 261, 268, 355, 356, 430, 439, 468, 469
perception, 63, 64, 99, 102 periodicity, 238 peripheral, 28 peripheral blood, 56 peripheral blood mononuclear cell, 56 periplasm, 213 peritoneal, 56, 357 permeability, 368, 371, 375, 393, 449, 456 permeation, 370, 371, 386 permit, 212, 221, 260, 264, 265, 275 peroxidation, 99, 481, 482 peroxide, 477, 482 perturbation, 246 perturbations, 130 pertussis, 255 pesticides, xv, 266, 268, 351, 372, 383, 390, 398,
473 petroleum, xii, 227, 305, 306, 318, 320, 321, 323,
324, 325, 326 P-glycoprotein, 436, 440 pH, 57, 116, 130, 133, 134, 144, 217, 220, 227,
239, 247, 249, 264, 284, 286, 287, 289, 290, 303, 307, 308, 314, 315, 330, 331, 332, 351, 355, 356, 360, 363, 364, 367, 370, 371, 374, 375, 376, 377, 378, 379, 380, 381, 382, 383, 386, 387, 390, 394, 476, 477, 479
pH values, 144, 289, 363, 382 phagocytosis, 159 pharmaceutical, viii, 51, 216, 430, 468, 486 pharmaceuticals, 470 pharmacological, 274, 276, 368 pharmacology, 99, 300 phase shifts, 342 PHB, 215 phenol, 314 phenolic, 224, 235, 351 phenolic compounds, 224 phenotype, 174, 341, 347 phenotypes, 335, 339 phenotypic, 342 phenylalanine, 356 Philippines, 217, 227 phonon, 13 phosphatases, 193, 262, 265, 266, 278, 279, 356 phosphate, 79, 87, 100, 106, 109, 116, 130, 219,
235, 408, 425, 434, 467, 476, 477 phosphatidylcholine, 83 phosphodiesterase, 72 phosphoenolpyruvate, 70 phospholipids, 95
Index 529
phosphorus, 76, 219, 303, 354, 398 phosphorylation, 42, 62, 75, 109, 143, 348, 356 photobioreactors, 57, 451 photobleaching, 144, 159 photochemical, vii, viii, 2, 5, 6, 8, 10, 11, 15, 16,
17, 18, 22, 25, 29, 34, 35, 38, 40, 44, 46, 105, 106, 107, 108, 357
photochemical degradation, 357 photoelectrical, 215 photoluminescence, 145 photolysis, 452 photon, 6, 19, 30, 35, 39, 49, 213, 330, 333, 335,
336, 362, 475, 479 photonics, 335 photons, 35, 41, 106, 130, 286, 287, 330, 336,
474 photooxidation, 44 photooxidative, 101, 483 photosynthesis, vii, ix, x, xiv, xv, 1, 42, 44, 47,
48, 57, 61, 64, 103, 106, 107, 108, 109, 143, 148, 164, 166, 168, 184, 186, 188, 211, 213, 214, 219, 221, 234, 236, 323, 338, 354, 399, 400, 419, 422, 444, 445, 451, 452, 453, 454, 455, 460, 464, 466, 474
photosynthetic, viii, ix, xi, 2, 5, 8, 10, 12, 14, 18, 22, 35, 41, 42, 44, 46, 47, 50, 57, 59, 72, 97, 105, 106, 107, 109, 139, 143, 146, 147, 148, 149, 151, 154, 160, 161, 162, 164, 165, 167, 168, 170, 174, 181, 182, 183, 187, 188, 211, 213, 217, 221, 224, 234, 259, 306, 309, 326, 341, 345, 348, 411, 424, 425, 426, 428, 446, 448, 450, 451, 459, 461, 464, 465, 481, 482, 483
photosynthetic systems, 147 photosystem, vii, 1, 2, 5, 8, 10, 11, 15, 16, 19, 20,
22, 37, 40, 41, 42, 43, 44, 45, 46, 47, 48, 49, 50, 147, 152, 157, 182, 214, 222
phototrophic, xiv, 44, 60, 183, 219, 224, 309, 326, 399, 400, 402, 405, 408, 411, 422
phycobilin, 126, 173 phycobilins, ix, 42, 117, 120, 122, 125, 126, 130,
161, 162, 172, 173, 188 phycocyanin, viii, ix, 4, 51, 52, 53, 54, 55, 56, 76,
94, 95, 100, 101, 105, 112, 120, 121, 122, 123, 124, 125, 140, 143, 144, 147, 150, 151, 152, 153, 154, 158, 160, 216, 222, 224, 229, 230, 503
phycoerythrin, ix, 105, 112, 122, 124, 125, 126, 149, 152, 153, 154, 155, 157, 159, 173, 183, 188, 467, 470
phylogenetic, 106, 146, 173, 174, 175, 188, 215, 260, 315, 318, 320, 322, 326, 425, 471
phylogenetic tree, 174, 175
phylogeny, 99, 162, 163, 172, 173, 185, 187, 189, 471, 472
phylum, vii, 168, 319, 320, 464 physical interaction, 397 physical properties, 160 physicochemical, xii, 267, 276, 305, 306 physicochemical methods, 267 physiological, ix, xiii, 6, 35, 46, 55, 139, 161,
164, 166, 167, 180, 193, 217, 265, 329, 335, 339, 481, 486
physiology, 52, 57, 99, 163, 166, 170, 306 phytoplankton, 146, 194, 285, 394, 397 pI, 65, 66, 67, 68, 69, 70, 71, 79, 133 pig, 505 pigments, vii, 2, 4, 5, 6, 8, 11, 12, 16, 20, 22, 27,
31, 32, 35, 36, 39, 40, 41, 53, 106, 107, 108, 109, 117, 124, 125, 126, 130, 149, 162, 164, 165, 166, 217, 221, 260, 357, 394
Pisum sativum, 348 planar, 262 plankton, 205, 464 planning, 389 plants, vii, viii, x, xii, xv, 1, 2, 3, 4, 5, 7, 9, 15,
17, 20, 22, 29, 34, 36, 39, 40, 41, 43, 45, 46, 48, 49, 51, 59, 93, 107, 109, 111, 148, 162, 164, 165, 166, 167, 168, 188, 205, 211, 219, 225, 229, 260, 262, 279, 305, 347, 358, 393, 400, 401, 408, 411, 415, 418, 423, 425, 427, 454, 463, 464, 481, 501, 505
plaque, 56 plasma, 2, 58, 59, 64, 65, 72, 477, 489, 503, 504 plasma membrane, 2, 58, 64, 65, 72 plasmid, 81, 106, 235, 253, 254, 302, 339, 341,
342, 437 plasmids, 84, 86, 88, 90, 235, 318, 319 Plasmids, 234 plastic, 335, 337, 448, 449, 456 plasticity, 147, 247, 471 plastics, 456 plastid, 106, 154 platelets, 220 play, xi, xv, 35, 41, 53, 55, 63, 64, 75, 80, 81, 88,
89, 116, 130, 133, 218, 233, 234, 236, 322, 323, 371, 437, 458, 463, 469, 479, 486
PLC, 267 point mutation, 61 poisoning, xi, 217, 259, 260, 262, 263, 269, 270,
278, 281 poisons, 279 Poland, 273, 353 polar bears, 278 polarity, 369, 383, 397 polarization, 48, 152
Index 530
pollutant, 285, 297 pollutants, xii, 221, 225, 283, 284, 285, 301, 305,
321, 353 pollution, 306, 327 polyacrylamide, 62, 130, 131, 315 polyamide, 368 polycarbonate, 313, 314 polyelectrolytes, 351 polyester, 215, 375 polyesters, 215 polyhydroxybutyrate, xi, 211, 215 polymer, 145, 216, 222, 360, 365 polymerase, 61, 67, 173, 176, 187, 343, 469 polymerase chain reaction, 176, 469 polymeric materials, 368 polymers, 145, 228, 460 polymorphism, 464 polypeptide, 95, 107, 112, 117, 121, 126, 130,
131, 135, 136, 137, 139, 151, 156, 157, 216, 229, 247, 251, 345
polypeptides, ix, 2, 17, 42, 72, 105, 109, 111, 112, 114, 115, 121, 129, 130, 131, 132, 133, 134, 135, 136, 137, 138, 139, 140, 141, 142, 147, 148, 151, 156, 157, 193, 208, 256, 341
polysaccharide, 56, 96, 503 polysaccharides, 52, 223, 260 polystyrene, 287, 478 polyunsaturated fat, viii, 51, 72, 74, 81, 92, 93,
99, 103, 215, 481, 487 polyunsaturated fatty acid, viii, 51, 72, 74, 81, 92,
93, 99, 103, 215, 481, 487 polyunsaturated fatty acids, viii, 51, 81, 92, 93,
99, 481, 487 polyvinylpyrrolidone, 467 pond, 57, 208, 281 pools, 5, 28, 36, 88 poor, 466 population, 13, 14, 15, 16, 17, 18, 20, 21, 23, 25,
26, 30, 34, 36, 37, 39, 40, 41, 130, 187, 262, 264, 274, 275, 318, 326, 352
pore, 195, 286, 338, 368, 369, 370, 371, 372, 375, 383, 388, 398
pores, 368, 370, 371 Porifera, 470, 472 porosity, 307, 370 porphyrins, 144 ports, 307, 308 Portugal, 349, 350, 353, 361, 362, 375, 376, 389,
396 positive relation, 206 postsynaptic, 357 post-translational, 74, 77 potassium, 301, 394, 476
potential energy, 108 pouches, 54 poultry, 101 powder, 264, 503 power, 147, 358, 467 PP2A, 192, 262 precipitation, 220, 286, 368, 375 preclinical, 226 prediction, 247, 254, 255, 256 pre-existing, 84 preference, 257, 350 pregnancy, 266 pregnancy test, 266 pressure, 196, 197, 309, 354, 357, 359, 365, 366,
368, 369, 370, 372, 376, 386, 393, 397, 436, 449, 475
prevention, xiii, 349, 350, 389 preventive, 53, 102 prices, 458 primates, 263 pristine, 306, 325 private, 57 private sector, 57 proactive, 207 probe, 62, 159, 195, 248, 249, 476 producers, xii, xv, 177, 182, 283, 458, 463, 469,
486 productivity, 57, 450, 453 profit, xiii, 349, 384 program, 247, 252, 289, 303, 312 pro-inflammatory, 55 prokaryotes, ix, x, xi, 2, 6, 10, 64, 161, 162, 172,
183, 187, 188, 211, 234, 254, 259, 346, 354, 411, 451, 505
prokaryotic, viii, 8, 17, 40, 105, 106, 107, 111, 162, 183, 186, 212, 335, 347, 467, 468
proliferation, 54, 103, 168, 272, 387 promoter, xiii, 59, 61, 62, 63, 75, 95, 96, 98, 102,
192, 229, 329, 330, 334, 335, 339, 341, 342, 343, 347, 348, 489
promoter region, 342, 347 property, iv, 8, 27, 36, 101, 176, 230, 242, 455 proposition, 34 prostaglandin, viii, 51, 55, 97 prostaglandins, viii, 51, 55 proteases, 179 protection, 35, 59, 184, 185, 193, 250, 251, 277,
385, 391, 474, 482, 503 protein binding, 61, 62 protein engineering, 144, 216 protein folding, 72, 256 protein function, 255, 256 protein kinases, 62, 75, 94
Index 531
protein secondary structure, 255 protein structure, 47, 146, 238, 239, 247, 248,
255 protein synthesis, 72, 262, 278, 279, 436 proteinase, 314 proteins, ix, xi, 4, 42, 46, 53, 58, 59, 61, 62, 63,
64, 65, 66, 67, 68, 69, 70, 72, 75, 77, 78, 79, 80, 81, 84, 85, 87, 88, 95, 96, 97, 105, 108, 109, 111, 117, 124, 126, 127, 129, 130, 132, 143, 144, 155, 158, 160, 166, 167, 181, 185, 186, 212, 220, 224, 226, 233, 234, 235, 236, 240, 242, 247, 248, 250, 252, 253, 254, 255, 256, 266, 330, 331, 344, 348, 490, 504
proteobacteria, 306, 317, 319, 322 proteolysis, ix, 106, 143 proteome, 60, 63 proteomes, 221 proteomics, viii, 52 protocol, 302, 315 protocols, 347 protons, 108, 109, 214 protozoa, 57 PRP, xi, 233, 234, 235, 236, 237, 238, 239, 240,
241, 243, 244, 245, 246, 248, 251, 252 PSA, 449 pseudo, 6, 31, 40, 348 Pseudomonas, 98, 292, 296, 301, 321, 499, 504 Pseudomonas aeruginosa, 98 PSI, viii, 9, 24, 25, 29, 31, 33, 43, 45, 46, 47, 78,
105, 106, 107, 108, 109, 111, 116, 139, 214, 215, 324, 453
PUB, 117, 125, 126 public awareness, 273 public health, 208, 278, 350, 353, 485, 502 public interest, 217 PUFA, 59, 72 PUFAs, 59 pulse, 158, 197, 341, 342 pulses, 197, 342 pumping, 307, 358 pure water, 377 purification, 33, 101, 216, 230, 264, 346, 375,
389, 393, 427, 439, 447, 449, 455, 472, 504 pyramidal, 112 pyrimidine, 78 pyrolysis, 398 pyrophosphate, 408, 409, 412, 433 pyrrole, 117 pyruvate, 66
Q
quadrupole, x, 191, 192, 195, 197, 203, 204, 206, 207
qualitative differences, 313 quality control, 477 quanta, 46 quantum, viii, 2, 35, 41, 144, 145, 158 quartz, 477 query, 408, 414, 422 quinine, 148 quinone, 7, 17 quinones, xv, 47, 408, 473
R
radiation, 35, 103, 170, 173, 184, 187, 188, 447, 455, 476, 481
radical pairs, 7, 16, 18, 19, 21, 31, 35, 39, 48 radio, 489 radiolabeled, 170 radius, 351, 370, 375 rail, 335 random, 11, 22, 32, 41, 77, 131, 335, 450, 464 random amplified polymorphic DNA, 77 random walk, 11, 22, 32, 41 range, x, xi, xii, xiii, xiv, 3, 6, 9, 20, 29, 31, 33,
38, 39, 40, 43, 54, 56, 117, 120, 126, 128, 130, 144, 180, 184, 192, 197, 203, 204, 205, 207, 217, 233, 236, 250, 259, 260, 261, 266, 271, 273, 274, 275, 283, 285, 286, 287, 289, 291, 293, 301, 303, 317, 329, 330, 331, 347, 353, 354, 355, 357, 360, 366, 375, 377, 429, 430, 445, 447, 464
RAPD, 77, 464 rat, 54, 55, 56, 96, 102, 503 rats, 52, 55, 95, 489, 503, 504 RAW, 94, 100 raw materials, 448 292 RDP, 315, 326 reactant, 12 reaction center, 45, 47, 48, 49, 108, 139, 147,
164, 165, 168, 348 reaction mechanism, 40 reaction rate, 54 reactive oxygen, xv, 35, 53, 55, 473, 474, 483 reactive oxygen species (ROS), xv, 35, 53, 55,
473, 474, 483 reactivity, 195, 200, 279 reading, 42, 342, 343, 459 reagent, 197, 374, 478
Index 532
reagents, xi, 144, 211, 216, 358 real time, x, 191 reasoning, 6, 35 receptors, 159, 265 recognition, 226, 255, 269, 274, 444, 504 recolonization, 174 recombination, 17, 45, 339, 340, 341, 342 reconcile, viii, 2, 40 recovery, xiv, 74, 144, 159, 264, 279, 350, 371,
377, 379, 380, 381, 382, 383, 384, 386, 387, 388
recreation, xi, 259 recreational, xiii, 271, 274, 349, 351, 387, 390,
393 recycling, 176, 361 red light, 125, 331 red shift, 5, 20 redistribution, 41, 139 redox, vii, 1, 2, 8, 11, 12, 14, 16, 42, 43, 44, 78,
108, 148, 256, 284, 467 redox-active, 11, 108, 148 redshift, 121 redundancy, 252 reef, 174, 183, 186, 231 reefs, 174, 185, 465, 466 reflection, 436 refractory, 351 regenerated cellulose, 195 regioselectivity, 88, 89, 96, 98, 101 regression, 197 regular, 12, 234, 239, 241, 243, 246, 252, 362 regulation, viii, x, 42, 51, 55, 58, 59, 60, 61, 62,
63, 72, 74, 75, 77, 78, 97, 98, 99, 102, 143, 148, 158, 211, 212, 213, 222, 229, 230, 234, 235, 268, 279, 336, 340, 345, 346, 347, 354, 356, 459, 504, 505
regulations, 276, 301, 351 regulators, 78, 98, 504 rejection, 370, 371, 373, 377, 382, 383, 384, 386,
388, 389, 390, 393, 396 relationship, xv, 89, 93, 162, 166, 167, 170, 172,
173, 188, 206, 212, 288, 297, 348, 436, 463, 464, 466, 470
relationships, 106, 153, 156, 181, 188, 209, 212, 279, 302, 436, 459, 464, 467, 469
relative toxicity, 303 relatives, x, 162, 174, 177, 178, 211, 466 relaxation, 10, 158 relevance, 72, 284, 301 reliability, 57 remediation, 219 renal, 159, 209
renewable energy, xv, 215, 443, 444, 445, 446, 447, 458
repair, 64, 72, 148, 500 repeatability, x, 192, 203, 207 replication, 56, 96, 253, 500 reporters, xiii, 302, 329, 331, 339, 344, 345, 347 repression, 80, 347 repressor, 62, 75, 78, 79, 98, 102, 335 reproduction, 183, 466 research and development, xv, 443, 448 reservoir, 262, 274, 278, 326, 362, 363, 374, 377,
389 reservoirs, 325, 350, 353, 354, 376, 383, 391, 485 residuals, 366, 388, 389 residues, xi, 62, 81, 83, 84, 87, 88, 89, 96, 97,
100, 121, 124, 125, 126, 128, 131, 132, 133, 143, 218, 233, 236, 240, 241, 242, 243, 244, 245, 246, 248, 250, 251, 253, 355, 434, 445
resin, 312 resistance, 79, 94, 221, 223, 235, 253, 254, 302,
341, 343, 348, 368, 371, 426, 436, 440, 441, 489
resistence, 253 resolution, vii, xiii, 1, 8, 19, 30, 36, 43, 46, 111,
129, 143, 147, 148, 152, 154, 155, 157, 196, 197, 203, 204, 207, 239, 329, 330, 363, 376, 425, 459
resources, xii, 212, 283, 284, 458, 466 respiration, 224, 451, 452, 454, 457, 474 respiratory, 213, 357, 450 respiratory arrest, 357 restriction fragment length polymorphis, 464 retardation, 35, 62 retention, 85, 107, 195, 207, 248, 264, 267, 361,
368, 369, 395, 397, 504 reticulum, 96 reverse transcriptase, 235, 254 Reynolds, 96, 376, 386 Reynolds number, 376, 386 RFLP, 464 Rhizobium, 292, 303 Rho, 112, 149, 150 Rhodococcus, 321 Rhodophyta, 216 rhythm, xiii, 330, 332, 335, 336, 338, 339, 342,
343, 344, 345, 346, 348 rhythmicity, 340 rhythms, xi, xiii, 233, 236, 237, 254, 329, 335,
336, 338, 339, 340, 342, 343, 344, 346, 347 ribonucleotide reductases, 500 ribosomal, xiv, 79, 185, 187, 217, 229, 429, 430 ribosomal RNA, 185, 187 rice, 220, 228, 454
Index 533
rice field, 220 Richland, 233 rings, 117, 307, 308, 314 risk, ix, x, xiii, 191, 192, 193, 207, 209, 225, 265,
269, 270, 272, 274, 275, 276, 277, 349, 350, 351, 352, 353, 361, 362, 387, 389, 391, 392, 396
risk assessment, 225, 265, 276, 277, 351, 352, 392
risk factors, ix, 191 risk management, xiii, 272, 275, 276, 277, 349,
352, 391 risks, xii, 271, 283, 284, 351, 353, 390, 444 rivers, 205, 354, 485 RNA, 56, 58, 61, 67, 72, 73, 74, 93, 94, 173, 187,
231, 330, 343, 436 rodents, 271 rods, ix, 105, 112, 114, 115, 116, 127, 133, 134,
139, 140, 141, 142, 158, 238, 239, 310 Rome, 191 room temperature, 5, 15, 30, 36, 41, 42, 46, 116,
123, 130, 196, 197, 287, 362, 366, 377, 477 ROS, xv, 53, 55, 473, 474, 478, 481 runoff, 306 Russian, 211, 221, 229 Rutherford, 348, 504
S
Saccharomyces cerevisiae, 80, 98, 100, 505 sacrum, 488 safety, 301, 352, 387 saline, 284, 307, 314, 372 salinity, 57, 77, 167, 303, 355, 397 salmon, 205, 209 Salmonella, 499 salt, 81, 116, 219, 228, 231, 360, 369, 370, 373,
377, 476, 480 salts, 363 sample, x, 14, 64, 73, 176, 192, 193, 194, 196,
197, 204, 206, 207, 208, 237, 250, 274, 287, 298, 299, 307, 309, 311, 312, 313, 315, 316, 333, 334, 335, 336, 337, 353, 363, 364, 374, 433, 434, 478
sampling, 175, 194, 198, 200, 307, 308 sand, 260, 362 SAS, 478 saturated hydrocarbons, 312 saturation, 88, 103, 333, 359, 360, 455 Saudi Arabia, 306, 320, 327 scaling, 31, 32, 41, 391 scanning electron microscopy, 325 scatter, 38
scavenger, 54, 94, 168 Schmid, 303, 459 scholarship, 389 scientific community, 7, 350, 450 scientific method, 269 SDS, 77, 117, 131, 293 sea squirts, 464, 469 seafood, 278 search, 179, 218, 315, 324, 414, 422 seasonality, 184 seawater, 174, 262, 263, 320, 321, 455, 461, 467 seaweed, 503 secretion, 64, 67, 69, 71 security, 273, 275, 279 sediment, 286, 307 sedimentation, 160, 351, 358, 359, 360, 361, 396,
398 sediments, 303, 306, 307, 320, 327, 354, 395 seed, 94 seedlings, 348 seeds, 205, 281 seeps, 306 selecting, 196, 455 selectivity, 15, 193, 204, 205, 264, 268, 368 self, 226, 230, 289, 327 self-cleaning, 230, 327 semiconductors, 214 sensing, 301 sensitivity, x, xii, 192, 193, 201, 203, 204, 207,
283, 287, 290, 291, 293, 303, 360 sensors, 219, 221, 345 SEPA, 293 separation, 6, 8, 15, 18, 19, 21, 24, 25, 26, 37, 40,
41, 45, 47, 49, 57, 106, 108, 173, 196, 207, 358, 360, 368, 369, 370, 449, 455, 457, 467
septic shock, 95 sequencing, viii, 52, 102, 176, 216, 221, 278,
313, 315, 318, 319, 341, 401, 441, 466, 469 serine, 62, 65, 95, 434 serum, 52, 193, 326, 468, 477, 478 serum albumin, 326, 468, 477, 478 services, iv, 315 sesquiterpenoid, 469 sewage, xii, 101, 283, 284 Shanghai, 463 shape, 10, 30, 46, 78, 80, 109, 124, 125, 129,
131, 139, 150, 235, 241, 242, 244, 248, 253, 288, 300, 354
sharing, 466 sheep, xi, 259, 269 shellfish, 262, 270, 273, 278, 279, 281, 397 shock, 58, 62, 70, 72, 74, 75, 94, 95, 96, 97, 98,
99, 262, 264, 342, 345, 348
Index 534
shores, 183, 186, 501 short period, 450, 454 shortage, 444 short-term, 182, 273, 304 shoulder, 5, 124, 126, 128, 130 shrimp, 210, 398 side effects, 330 sign, 13, 16, 17, 31, 370 signal peptide, 254, 256 signal transduction, 63, 64, 72, 344 signaling, 64, 97, 143 signaling pathways, 64 signals, x, 64, 102, 192, 196, 344 signal-to-noise ratio, 204, 205 signs, 454 silica, 312, 366, 488, 503 silver, 206, 208, 221, 225, 226 similarity, 27, 95, 166, 173, 174, 315, 317, 319,
320, 322, 386, 408, 414, 435, 468, 489, 490, 501
simulation, viii, 2, 17, 21, 23, 27, 30, 38, 39, 297, 301
simulations, 10, 17, 18, 19, 20, 23, 24, 25, 26, 30, 31, 32, 38, 40, 448
sites, xii, 10, 12, 18, 21, 26, 27, 28, 29, 32, 33, 37, 41, 61, 62, 99, 130, 143, 154, 163, 168, 231, 296, 305, 320, 387
skeleton, 431, 438 skin, 271 sludge, 358, 361, 362 small mammals, 265 snake venom, 271 SOD, 168, 475, 476, 477, 478, 479, 482 sodium, 81, 91, 196, 266, 312, 314, 315, 439 software, 64, 196, 197 soil, vii, 94, 125, 142, 218, 220, 227, 228, 230,
284, 303, 326, 327, 375, 433, 434, 435 soils, 228, 320, 325, 327, 445, 446 solar, xv, 103, 184, 443, 444, 446, 447, 450, 453,
454, 455, 458, 460, 461, 481 solar energy, xv, 443, 444, 446, 447, 450, 453,
454, 455, 458, 460 solid phase, 264, 279, 363, 374 Solomon Islands, 178 solvent, 197, 241, 264, 312, 324, 368, 369, 370 solvents, 264 soot, 446 sorbents, 220, 265 sorbitol, 476 sorption, 223 sorting, 144, 216, 468 South Africa, 277 South America, 350
Southern blot, 215 Spain, 171, 205, 273, 283, 305, 307, 309, 315,
325, 326, 327, 353 spatial, 139, 345 speciation, 169, 179 species richness, 168 specificity, 87, 88, 94, 103, 177, 179, 186, 188,
196, 203, 256, 266, 267, 268, 279, 415, 419, 437, 465, 469, 472
spectrophotometric, 394 spectroscopic methods, 7 spectroscopy, 9, 34, 36, 43, 44, 47, 48, 49, 108,
153, 155, 248, 250 spectrum, 5, 6, 23, 34, 35, 46, 47, 117, 121, 123,
124, 125, 126, 129, 144, 197, 217, 248, 249, 250, 264, 331, 430
speculation, 437 speech, 460 speed, 197, 475 spices, 202 spicule, 465 spills, 227, 306 spin, 48, 318, 319 spinach, 44, 47, 48, 49, 50, 148, 482 sponges, 172, 182, 185, 189, 219, 231, 433, 464,
465, 466, 467, 468, 469, 470, 471, 472 sporadic, 438 SPT, 144 St. Louis, xi, 233 stability, 59, 61, 74, 97, 117, 128, 144, 152, 153,
215, 216, 218, 248, 249, 250, 253, 256, 286, 331, 368, 383
stabilization, 58, 98, 116, 160, 440, 459 stabilize, 139, 147, 219, 235, 445 stages, 214, 353, 448 stainless steel, 196 standard deviation, 287, 291, 293, 294, 295 standard error, 290, 478 standards, 197, 268, 278, 352, 382, 478 Staphylococcus aureus, 302 starch, 146 starvation, 76, 77, 94, 100, 143, 158 statistical analysis, 265 steady state, 35, 36, 125 steady-state growth, 479 steel, 196 steric, 370, 383, 388, 398, 434 sterile, 194, 314, 477, 479 sterols, 408 STH, 365, 376 stochastic, 345 stock, 365, 374, 375, 456, 458 stoichiometry, 27, 32, 33, 37, 117
Index 535
Stokes shift, 144, 145 storage, 215, 274, 361, 445, 447, 451 strain, xii, 36, 58, 73, 77, 93, 94, 95, 96, 97, 98,
100, 101, 103, 156, 158, 181, 212, 213, 214, 215, 216, 218, 220, 221, 223, 224, 226, 227, 228, 229, 230, 231, 234, 239, 253, 254, 262, 263, 283, 285, 286, 289, 290, 291, 293, 296, 301, 302, 303, 321, 325, 332, 335, 337, 339, 341, 342, 343, 344, 345, 346, 347, 403, 404, 405, 414, 416, 417, 420, 421, 423, 424, 425, 426, 431, 432, 434, 435, 436, 437, 450, 454, 455, 461, 462, 482, 483, 501, 505
strains, x, xii, 5, 17, 36, 37, 122, 123, 124, 126, 127, 145, 154, 173, 174, 176, 177, 178, 187, 188, 206, 211, 212, 213, 214, 215, 218, 220, 225, 231, 268, 269, 270, 280, 281, 283, 320, 321, 343, 401, 402, 420, 422, 423, 428, 433, 435, 436, 450, 454, 455
strategies, xiii, 188, 226, 275, 349, 352, 447, 448, 452, 467, 470
streams, 205 strength, 116, 139, 300, 351, 368, 371, 390 Streptomyces, 435, 437, 439 stress, viii, ix, 52, 53, 58, 59, 60, 61, 63, 64, 72,
74, 75, 76, 77, 78, 80, 89, 94, 96, 97, 98, 99, 102, 106, 143, 167, 219, 222, 228, 230, 383, 427, 474, 478, 482
stress factors, 75, 383 stress-related, 64, 76 stroma, 109 stromal, ix, 42, 105, 107, 108, 109, 111 stromatolites, 181 structural changes, 100 structural characteristics, 109, 125 structural gene, 345 subgroups, 112 subjective, 455 subsidy, 447 substances, 164, 166, 170, 220, 222, 275, 284,
351, 354, 370, 372, 375, 382, 446, 451 substitution, 84, 88, 214 substrates, xiv, 81, 95, 265, 288, 331, 399, 433,
437, 466 sucrose, 116, 219, 226, 228, 314 sugar, 69, 405, 407, 454 sugar cane, 454 sulfate, 54, 56, 287, 321 sulfur, xii, 42, 43, 48, 49, 76, 80, 100, 108, 158,
225, 305, 306, 309, 317, 321, 400, 408, 410, 411, 412, 415, 424, 428, 450, 451
sulphate, 270, 286, 293, 309, 314, 360, 361, 393, 397
sulphur, 2, 3, 7, 11, 16, 42, 43, 44, 45, 306
sun, 103, 105, 147, 149, 152, 160, 186, 216, 230, 423, 458
sunlight, 57, 211, 357, 448, 454, 455 sunscreens, 171 superimpose, 240, 245 supernatant, 194, 374, 475, 477 superoxide, 168, 474, 476 superoxide dismutase, xv, 473, 475, 478, 480,
481, 482, 483 supplements, 95, 351, 391 suppliers, 330 supply, xi, xiv, 225, 259, 274, 278, 349, 350, 353,
444, 445, 448 supply chain, 274 suppression, 296 supramolecular, 111, 145 surface area, xv, 131, 443, 447, 449, 455 surface properties, 252 surface water, 221, 262, 351, 360, 362, 372, 374,
376, 377, 381, 390, 397 surfactants, 423 surplus, 489 surveillance, 387 survival, ix, 54, 58, 106, 143, 170, 219, 464 survival rate, 54 susceptibility, 130 suspensions, 5, 362, 392, 477 sustainability, 342 switching, 504 symbiont, 168, 171, 174, 177, 181, 186, 187, 319,
464, 465, 467, 468, 469, 471, 472 symbioses, 172, 176, 181, 184, 187, 218, 224,
464, 466, 470, 471, 472 symbiosis, ix, 161, 162, 163, 164, 168, 170, 172,
174, 179, 180, 183, 184, 185, 186, 187, 188, 189, 221, 224, 260, 463, 464, 465, 466, 471
symbiotic, xv, 106, 165, 168, 171, 172, 180, 181, 182, 184, 185, 187, 188, 213, 231, 263, 436, 463, 464, 465, 466, 467, 468, 469, 470, 471, 472
symmetry, 6, 42, 108, 121, 128 symptoms, 270 synergistic, 285, 296, 297, 300, 304 synergistic effect, 296, 304 synthesis, ix, xi, 56, 72, 80, 89, 93, 99, 103, 106,
109, 142, 143, 146, 161, 162, 166, 167, 173, 176, 177, 213, 215, 216, 217, 220, 226, 227, 229, 259, 262, 268, 274, 275, 278, 279, 280, 334, 345, 348, 353, 408, 410, 412, 416, 420, 421, 422, 423, 424, 425, 426, 428, 431, 435, 436, 437, 438, 439, 440, 489, 490, 500, 505
Index 536
T
T cells, 159 T lymphocytes, 159 tanks, 358 targets, 187, 266, 435, 471 taste, xiii, 349, 350, 392 tax system, 458 taxa, 277, 469 taxes, 458 taxonomic, 174, 212, 479 taxonomy, 146, 177, 255 TCC, 314 T-cell, 56 TDI, 193, 200, 352 technical assistance, 481 temperature, viii, 5, 7, 12, 13, 36, 43, 48, 52, 57,
58, 59, 60, 61, 62, 63, 64, 71, 72, 73, 74, 75, 76, 77, 78, 94, 95, 96, 100, 101, 102, 103, 116, 130, 154, 181, 196, 202, 203, 217, 227, 249, 312, 320, 327, 330, 335, 336, 339, 342, 347, 354, 355, 376, 377, 427, 445, 464
temperature dependence, 6, 7, 12, 43 temperature gradient, 464 temporal, 8, 19, 30, 38, 344 tension, xii, 305 terminals, 89 ternary complex, 81 terrorism, 264, 268, 272, 273 terrorist, 274, 275 tetanus, 272 textile, 368 TGA, 314 Thailand, 51, 57, 93, 102 thermal activation, 46 thermal equilibrium, 41 thermal stability, 153, 249, 286 thermodynamic, 10, 16, 26, 32, 41 thermophilic, 347 thermoplastic, 215 thin film, 368, 375 thioredoxin, 477, 478 threat, 170, 193, 210, 264, 265, 274 threatened, 275 threats, 466 three-dimensional, 149, 153, 234, 236, 400 threonine, 62, 65, 95, 100, 434 threshold, 334 throat, 351 thrombosis, 55 thromboxane, 55 thyroid, 160 thyroid stimulating hormone, 160
tides, 275 Tilapia, 193 time periods, 64 timing, xiii, 30, 254, 329, 342 tinnitus, 270 TiO2, 223 tissue, 164, 170, 193, 194, 200, 201, 202, 203,
204, 205, 206, 207, 208, 263, 265, 464, 465, 467, 468, 472, 489
TNF, 55 TOC, 363, 366, 376 Tokyo, 399, 443 tolerance, 95, 99, 100, 102, 181, 222, 225, 324,
489 tomato, 203 topology, 46, 174 total cholesterol, 53 total energy, 445 total product, 193 toxic, x, xi, xii, xv, 170, 178, 192, 194, 202, 208,
217, 259, 260, 261, 262, 263, 264, 265, 271, 273, 275, 280, 283, 289, 291, 296, 307, 318, 350, 353, 355, 357, 362, 372, 385, 391, 430, 473, 474, 481
toxic effect, 296 toxic products, 260 toxic substances, 275 toxicities, 271, 280, 299, 300, 303, 357 toxicity, xii, xiii, xv, 193, 208, 209, 220, 229,
262, 264, 265, 266, 271, 272, 273, 275, 276, 279, 283, 284, 285, 286, 287, 289, 290, 291, 292, 293, 294, 295, 296, 299, 300, 301, 302, 303, 304, 331, 349, 356, 392, 393, 441, 473, 475, 481, 483
toxicological, 206, 262, 270, 285, 300, 302, 352, 355
toxicology, 207, 208, 210, 271, 300, 304 toxin, 182, 202, 206, 208, 209, 210, 218, 231,
262, 264, 265, 268, 269, 272, 274, 275, 276, 278, 279, 280, 284, 353, 355, 357, 361, 373, 383, 384, 388, 393, 394, 398
toxins, x, xi, xiii, 192, 193, 207, 208, 210, 211, 217, 219, 220, 225, 226, 229, 259, 260, 262, 263, 265, 266, 267, 268, 270, 271, 274, 275, 276, 277, 278, 279, 280, 281, 349, 350, 351, 352, 353, 354, 355, 356, 357, 358, 360, 361, 362, 373, 384, 385, 389, 390, 391, 392, 393, 395, 396, 397, 468, 502
tracking, 144, 159, 187, 471 trading, 458 training, 270 traits, 252 transcript, 59, 76, 237
Index 537
transcriptase, 235, 254 transcription, 60, 61, 62, 74, 78, 93, 101, 102,
212, 215, 302, 340, 342, 343, 345, 348 transcription factor, 62, 102 transcriptional, 58, 59, 60, 61, 62, 63, 72, 74, 75,
77, 98, 102, 212, 234, 255, 302, 335, 339, 504 transcriptomics, 236 transcripts, 59, 74, 76, 77, 489 transduction, 64, 102, 234 transferrin, 266 transformation, viii, 19, 52, 77, 78, 80, 92, 93, 97,
145, 300, 342 transformations, 357 transgenic, 216, 220, 231, 343, 347 transgenic plants, 347 transglutaminase, 67, 68 transition, 10, 58, 98, 172, 196, 246, 247, 248,
249, 489 transition metal, 489 transitions, 50, 139, 148, 157, 196 translation, 61, 78, 265, 348 translational, 58, 59, 74, 77, 81, 212 translocation, 170, 180, 187 transmembrane, 2, 4, 40, 108, 148, 167, 213, 386 trans-membrane, 164 trans-membrane, 247 transmission, xv, 170, 172, 174, 179, 180, 183,
184, 196, 325, 463, 464, 465, 466, 472 transmission electron microscopy, 325, 465, 466 transparent, 170, 315, 338 transport, viii, 42, 70, 99, 105, 106, 107, 108,
154, 202, 213, 234, 356, 368, 369, 370, 394, 398, 474, 481, 504
transport phenomena, 369, 370 transportation, 272, 279, 447, 457, 460 transposases, 176 traps, 235 treatment methods, 274, 394 trial, xv, 33, 444, 458 Trichodesmium, 186, 348, 402, 403, 404, 414,
452 trifluoroacetic acid, 363, 374 trifolii, 292, 303 triggers, 78, 95 triglycerides, 53 trimer, vii, 1, 3, 46, 108, 117, 120, 121, 123, 128,
129, 130, 131, 135, 137, 138, 143, 144, 160, 167
trout, 205, 206, 209, 210 trypsin, 64 tryptophan, 7, 42, 176, 433, 434 tuberculosis, 95, 235, 238, 239, 253 tubular, xii, 213, 305, 307, 450
Tukey HSD, 478 tumor, 54, 209, 280, 394 tumor cells, 54 tumors, 226, 350, 430, 436 tumour, xiii, 192, 262, 263, 349, 352, 356, 436 turbulence, 57 turgor, 354 Turku, 397 turnover, 148 Tuscany, 191, 198, 205 two-dimensional, 63, 78, 218 TXA2, 55 type 2 diabetes mellitus, 53, 100 tyrosine, 62, 108, 148, 345, 348, 356, 500
U
ultrastructure, 149, 465 ultraviolet UV, 95, 103, 170, 183, 184, 185, 187,
193, 208, 220, 226, 256, 267, 315, 363, 364, 376, 382, 466, 474, 476, 478
uncertainty, 25, 245, 445 UNESCO, 277 UNFCCC, 444, 459, 462 unfolded, 247, 248, 255 uniform, 335, 336, 337 United Kingdom, 1, 273, 303, 476 United Nations, 444 United States, 252, 281, 391, 473, 474, 475 urea, 176, 315, 482 urease, 176 uric acid, 54 urinary, 489 USA Patriot Act, 273, 281 USDA, 483 USEPA, 286, 287, 293, 300 UV irradiation, 466 UV radiation, 103
V
vacuole, 165, 169 vacuum, 398 valence, 370 Valencia, 325 validation, 34, 176 validity, 7, 15, 285, 300 values, x, xiv, 12, 14, 16, 17, 19, 20, 23, 24, 25,
26, 27, 28, 29, 31, 32, 33, 34, 37, 39, 54, 61, 86, 90, 91, 144, 175, 192, 193, 200, 201, 202, 206, 243, 247, 274, 287, 289, 290, 292, 293, 295, 296, 297, 350, 351, 352, 353, 359, 360,
Index 538
363, 367, 375, 382, 385, 386, 388, 391, 455, 479
vanadium, 214, 435, 438, 459 vancomycin, 430 vapor, 239, 331, 333, 334, 335 variability, vii, 1, 4, 5, 36, 37, 261, 285, 354 variation, 38, 58, 64, 77, 135, 151, 179, 253, 287,
293, 344, 355, 359, 381, 382, 386, 405, 433, 471, 479
vector, 13, 16, 23, 37, 81, 216, 219, 224, 330, 339 vegetarians, xvi, 485, 489, 502 vegetation, 6, 34, 35, 205 vehicles, 266, 449 velocity, 57, 359, 365, 371, 376, 387 versatility, 437 vertebrates, 180 vesicle, 354, 398 vessels, 461 vibration, 13 virulence, 255 virus, viii, 51, 56, 96, 223, 254, 503 virus replication, 96 viruses, 53, 56, 264, 373 viscera, x, 192, 194, 200, 201, 205, 206 visible, 5, 35, 117, 124, 144, 260, 284, 454, 455 vision, 299 vitamin B1, xvi, 307, 485, 486, 487, 488, 489,
490, 499, 500, 501, 502, 503, 504, 505 vitamin B12, xvi, 307, 485, 486, 487, 488, 489,
490, 499, 500, 501, 502, 503, 504, 505 vitamin E, 474 vitamin K, 48, 49 vitamins, viii, 51, 52, 93, 217, 375, 486, 487 VLDL, 53 voles, 205 vulnerability, 168
W
war, 327 waste products, 176 wastes, 219 wastewater, 219, 227, 229, 368, 392, 397 wastewater treatment, 219, 229, 368, 392, 397 water permeability, 371 water policy, 392 water quality, xiii, 349, 350, 351, 352, 360, 378,
383, 385, 386, 387, 388, 392, 395
water quality standards, 352 water supplies, 270, 274, 350 water-holding capacity, 220 water-soluble, ix, 105, 111, 116, 117, 144, 166,
321, 351, 476, 480 wavelengths, 5, 8, 16, 19, 22, 28, 31, 41, 130 weakness, 481 weathering, 306, 327 web, 145 wells, 268, 286, 287, 336, 476 western blot, 75, 87 wheat, 102, 454 wild type, 76, 88, 89, 151, 220, 231 wind, 271, 458 wood, 445 workers, 31, 32, 371, 430, 435 World Health Organization (WHO), xiv, 193,
200, 208, 272, 273, 350, 352, 353, 383, 385, 387, 388, 389, 392, 393, 395, 397, 398
worm, xiii, xv, 329, 330, 331, 332, 346, 463, 464 worms, 205, 331, 348, 464, 469 writing, 212, 221
X
xanthophyll, 424, 427 xenobiotics, 219 X-ray absorption, 256 X-ray diffraction (XRD), xi, 2, 135, 233, 238,
240, 241, 252 X-ray diffraction data, 2
Y
yeast, 81, 83, 85, 87, 95, 98, 99, 103 yield, viii, 2, 8, 35, 39, 40, 83, 144, 158, 297,
408, 423, 456, 476 yolk, 56, 101
Z
Zea mays, 9, 17 zeta potential, 375 zinc, 220, 256, 302, 304 Z-isomer, 434