Embed Size (px)
Citation preview
EUR 24691 EN - 2011
Handbook of Tsunami Hazard and Damage Scenarios
SCHEMA (Scenarios for Hazard-induced Emergencies Management), Project n° 030963, Specific Targeted Research Project, Space Priority
S. Tinti, R. Tonini, L. Bressan, A. Armigliato, A. Gardi, R. Guillande, N. Valencia, S. Scheer
The mission of the JRC-IPSC is to provide research results and to support EU policy-makers in their effort towards global security and towards protection of European citizens from accidents, deliberate attacks, fraud and illegal actions against EU policies. European Commission Joint Research Centre Institute for the Protection and Security of the Citizen Contact information Address: Prof. Stefano Tinti, Dept. of Physics, Sector of Geophysics, Università di Bologna, Viale Berti Pichat 8 – 40127 Bologna (Italy) E-mail: [email protected] Tel.: +39 051 209 5025 Fax: +39 051 209 5058 http://ipsc.jrc.ec.europa.eu/ http://www.jrc.ec.europa.eu/ Legal Notice Neither the European Commission nor any person acting on behalf of the Commission is responsible for the use which might be made of this publication.
Europe Direct is a service to help you find answers to your questions about the European Union
Freephone number (*):
00 800 6 7 8 9 10 11
(*) Certain mobile telephone operators do not allow access to 00 800 numbers or these calls may be billed.
A great deal of additional information on the European Union is available on the Internet. It can be accessed through the Europa server http://europa.eu/ JRC 61463 EUR 24691 EN ISBN 978-92-79-19062-9 ISSN 1018-5593 doi:10.2788/21259 Luxembourg: Publications Office of the European Union © European Union, 2011 Reproduction is authorised provided the source is acknowledged Printed in Italy
3
Acknowledgements
The research leading to these results has received funding from the European Community's Sixth Framework Programme
under grant agreement n° SST5-CT-2006-030963.
The authors would like to warmly thank all those many participants from all project partner organizations who were
involved over the last three years in contributing in one way or the other to the finalization of the work which is
presented in this handbook.
Special thanks are addressed to the project’s principal reviewer, Mr François SCHINDELE who gave important comments
during the finalization process.
Particular thanks are also directed to the EC coordinating officer, Mr Mats LJUNGQVIST, for his patience and his attitude
to encourage us to produce good project results.
Huge parts of the work realized on test sites of Rabat (Morocco), Setubal (Portugal), Mandelieu (France), Balchik
(Bulgaria) and Catania (Italy) would not have been possible without the willingness and cooperation of the local
authorities. Our kind acknowledgements are aiming at their involvement and support providing us with local data and
bringing together various stakeholders in performing the case studies, as well for their kind welcome during local
meetings and workshops.
The use of bathymetric data by SHOM (© Copyright 2008 Service Hydrographique et Océanographique de la Marine -
France) for the work realized on the Mandelieu (France) test site has been authorised by the Contract n° S/1314 BP.
Authors’ affiliations
Stefano Tinti, Roberto Tonini, Lidia Bressan and Alberto Armigliato: University of Bologna, Italy
Annalisa Gardi, Richard Guillande and Nathalia Valencia: GEOSCIENCES CONSULTANTS sarl, Paris, France
Stefan Scheer, European Commission. Joint Research Centre, Ispra, Italy
Other contributors
Olivia Lesne, Antoine Mangin, Camille Renou and Frédéric Rouffi: ACRI-ST, Sophia-Antipolis, France
George Eftichidis, Vassiliki Varela: ALGOSYSTEMS, Athens, Greece.
Abderrahman Atillah, Driss El Hadani and Hicham Moudni: Centre Royal de Télédection Spatiale, Rabat, Morocco
Adélio Silva, João Ribeiro and Paulo Leitão: HIDROMOD, Lisbon, Portugal
Gerassimos Papadopoulos, Anna Fokaefs, Georgia Diakogianni, Tatiana Novikova: National Observatory of Athens,
Greece
Boyko Ranguelov and Garo Mardirossian: SSRI-BAS, Bulgaria
Erhan Alparslan: TUBITAK Marmara Research Center – Earth and Marine Sciences Institute, Gebze-Kocaeli, Turkey
4
Table of Content
Acknowledgements ........................................................................................................................................... 3
Table of Content ................................................................................................................................................ 4
Executive Summary ........................................................................................................................................... 5 1 Introduction............................................................................................................................................... 6
2 Tsunami scenarios: concepts and methodology ....................................................................................... 7
2.1 Concepts and definitions...................................................................................................................... 7
2.2 Outlines of SCHEMA methodology .................................................................................................. 8
3 Tsunami hazard scenarios ....................................................................................................................... 10
3.1 Selection of the sources................................................................................................................. 11
3.2 Numerical models .......................................................................................................................... 13
3.3 Bathymetry and topography databases......................................................................................... 14
3.3.1 Combining land and sea datasets .............................................................................................. 14
3.3.2 The problem of tides.................................................................................................................. 15 3.4 Handling different resolutions ....................................................................................................... 15
3.5 Coping with uncertainties .............................................................................................................. 16
3.6 Regional tsunami hazard scenarios................................................................................................ 17
3.7 Local tsunami hazard scenarios ..................................................................................................... 18
3.8 Aggregated scenarios..................................................................................................................... 19
4 Tsunami damage scenarios ..................................................................................................................... 20
4.1 Assessment of vulnerability ........................................................................................................... 20
4.2 Damage functions and damage matrix .......................................................................................... 22
4.3 Creating a building inventory for tsunami scenarios ..................................................................... 23
4.4 Inventories of other relevant objects ............................................................................................ 25 4.5 Tsunami damage maps .................................................................................................................. 26
4.6 Mapping other damage factors ..................................................................................................... 27
5 Conclusions and perspectives.................................................................................................................. 29
References....................................................................................................................................................... 31
Annex A – The project SCHEMA ...................................................................................................................... 33
Annex B - Partners of the SCHEMA consortium .............................................................................................. 35
Annex C – SCHEMA website ............................................................................................................................ 36
List of Figures................................................................................................................................................... 37
List of Tables .................................................................................................................................................... 38
5
Executive Summary
The handbook on tsunami scenarios is the result of an
intense work performed under the European FP6 co-
funded project SCHEMA in a 39 month period from
2007 to 2010 by a Consortium of 11 partners led by
Geosciences Consultants (Paris).
The handbook is one of the products of the project
and has been conceived to illustrate the basic
concepts and methods elaborated and applied in the
project to produce tsunami scenarios in view of
providing tools to assess tsunami hazard and potential
damage. One of the main objectives was the
elaboration of a general methodology that can be
used in all possible cases and that can be easily
adapted to the needs of the end users, i.e. chiefly the
public administrators responsible for planning of the
coastal zone development and protection strategies as
well as people and organisations involved in disasters
management and mitigation policies. For these
reasons, the SCHEMA methodology has been applied
to five test sites (Rabat, Morocco; Setúbal, Portugal;
Mandelieu, France; Catania, Italy; Balchik, Bulgaria)
differing very much from one another, and it has been
tested with the active involvement of the end users,
so ensuring that it will provide practical and useful
tools and it is flexible enough to cover local needs.
The handbook first defines what is meant by tsunami
hazard scenario and by tsunami damage scenario, as
well as the concept of the worst-case credible
scenario. This latter is a key-point in the handbook
because the choice of the SCHEMA consortium was to
adopt the approach of the worst-case credible
scenario rather than of scenarios deriving from
probabilistic analyses, since it is believed that there
are no sufficient knowledge and data at present to
assess return time probabilities of tsunamis and
consequently to build on it the corresponding
probabilistic scenarios.
The methodology, briefly outlined in chapter 3,
consists of three main phases, in turn embracing more
sub-phases or steps: namely 1) elaboration of a set of
tsunami hazard scenarios for each test site (also
referred to as target area), scenarios that are
combined together in a single aggregated scenario; 2)
vulnerability analysis of exposed elements based on
earth observation data (collected through field survey
and interpretation of satellite images); 3)
development of tsunami damage scenarios. Phase 1 is
described in detail in chapter 4, while phases 2 and 3
are illustrated in chapter 5.
This handbook has the purpose to highlight the
SCHEMA approach to the tsunami scenarios and is
deliberately short and synthetic. All the details on the
methods and on their application can be found in the
very many and lengthy documents (deliverables)
produced by the consortium during the lifetime of the
project. Here only the main concepts are given and are
illustrated by a number of examples taken from the
work performed by the partners of the consortium.
The final chapter of the handbook looks at the future,
mainly emphasising the future challenges and how the
methodology can be improved to tackle them. In this
context the main subject is the multi-hazard, or in
other words, how scenarios can be built to cover not
only tsunamis, but also other dangerous phenomena.
The challenge is open in the sense i) that there is
already a vast acknowledgment that this is a serious
and mature problem and ii) that at the same time no
general way has been yet established to handle it. We
expect that important developments will be made in
the next years. .
Handbook of tsunami hazard and damage scenarios Introduction
6
1 Introduction
This handbook is one of the products of the project
SCHEMA (see objectives and partners in annexes A
and B; see also Annex C). It describes the methodology
that was devised by the project partners to build
scenarios of tsunami hazard and of tsunami damage
and further helps define terms and concepts in a field
that lacks of standards and of agreed terminology. The
handbook is mainly addressed to the local
administrators, responsible for public safety and for
land management and planning, who need to assess
tsunami hazard and risk and to use tools such as
tsunami inundation and damage maps. It is believed
that they will take advantage from knowing the
methods and criteria on which the maps are built and
from a clear definition of the involved terms and
concepts, since this will allow them to fully exploit
products and tools concerning tsunami impact. The
handbook, though covering issues with a specific and
technical content, is written as much as possible in a
plane language, avoiding mathematical and numerical
details and sophistications that could make reading
difficult and hard. Such details are fully given in the
technical reports produced by the project. Indeed, the
handbook privileges the exposition of concepts and
ideas and is rich of examples that are taken from the
work and results that have been achieved by the
partners of SCHEMA.
The handbook structure contemplates a chapter
introducing the basic concepts of the tsunami hazard
and damage scenarios, where among others, it is
explained why the SCHEMA consortium has
substantially preferred the approach based on
deterministic credible worst-case scenarios on other
possible approaches based on probability theory
computations. In the following two chapters the
various steps involved in computing scenarios for
tsunami hazard and scenarios for tsunami damage are
described in detail, by making recourse to examples
taken from the studies performed by the partners of
the project. In this context, the assessment of tsunami
vulnerability is also dealt with as a necessary step
along the road to producing damage scenarios. A final
chapter is devoted to discussing the methodology, but
especially to highlight the perspectives 1) for the
application of our approach to areas different from
the very few and limited ones that was possible to
study within SCHEMA, 2) for possible improvements or
even alternatives depending on availability of suitable
sets of data, and 3) for addressing challenges as the
development of multi-hazard scenarios.
Handbook of tsunami hazard and damage scenarios Tsunami scenarios: concepts and methodology
7
2 Tsunami scenarios: concepts and methodology
2.1 Concepts and definitions
In the world of natural hazard studies, the “hazard” is
the description of the physical phenomenon that is of
an earthquake, a fire, a hurricane, a tsunami, etc. A
scenario refers more to the hypothesis of a hazard
occurrence in a given area and with a given level of
intensity. According to documents provided by the
Intergovernmental Coordination Group for the Indian
Ocean Tsunami Warning and Mitigation System
(ICG/IOTWS, 2007), a tsunami hazard scenario is built
up by specifying the various characteristics of a
tsunamigenic source. In other words, it essentially
consists of the set of elements characterising the
tsunamigenic earthquake or the submarine landslide
in the source zone. Observe that this definition does
not include the local effects on distant locations
affected by the tsunami waves, and that it is not
shared by many studies on tsunami hazard scenarios
where the main focus is viceversa on the tsunami
behaviour in the coastal zone. The hazard scenario
definition that has been adopted in SCHEMA is the
description of the tsunami that follows from a selected
source, ranging from the oceanic propagation down to
its local effects of inundation, run-up, drawdown,
extension of the flooded and receding areas at the
coast, including information on tsunami distribution in
space and time. This is for the natural phenomenon or
natural process. In addition to this, the tsunami
scenario in SCHEMA embraces also the description of
the tsunami impact on persons and goods in the
coastal zone, in accordance with the needs of the end
users. Therefore the notion of tsunami scenario can
take two dimensions:
- the tsunami hazard scenario describing the natural
phenomenon from its origin source and its oceanic
development down to the coast hit by the waves and
depicting the hazard level on the exposed area (the
target) for the specific event considered;
- the tsunami damage scenario describing the
possible damaging consequences of the tsunami on
exposed elements (persons, objects) specified by end
users.
Scenario maps should present the exposed elements
of the area affected by waves and the effects of the
sea inundation or recess, together with the respective
damage intensity or level, either qualitatively
estimated or quantitatively calculated.
The notion of a tsunami hazard scenario is generally
associated with the characteristics of a single tsunami
source and to the tsunami that this source may
generate. Indeed for several purposes it can be
advantageous to study the tsunami hazard resulting
from a number of sources, typically for all the
tsunamigenic sources that can affect a given target
area. In this case, it is reasonable to study each
individual tsunami scenario and its impact on the
coastal zone, and then to combine the effects of all
the sources in a suitable way in order to obtain the
whole tsunami hazard threatening the target coast.
What is obtained is named an aggregated tsunami
hazard scenario, since it results from the combination
or aggregation of the individual pictures. Often the
source that is taken into account to build a single
scenario is the most powerful source that is
reasonable to expect (i.e. credible) in a given region
according to the current knowledge of the natural
ongoing processes, and hence the corresponding
scenario is called the worst-case credible scenario.
Sometimes there are elements allowing one to
associate a given hazard scenario with the estimate of
the return time. If this can be done extensively for a
series of scenarios, a probabilistic approach can be
adopted and each computed scenario associated to an
estimated occurrence probability. Implementing a
probabilistic approach is, however, not always
possible or convenient. For instance, assessing
occurrence probabilities for earthquakes in a given
source region is feasible if a sufficient data set of
historical and instrumental events is available and a
good quantitative knowledge has been gained of the
local and regional tectonic processes (for example
knowledge of the convergence rate of lithospheric
plates in a subduction region), which often is the case
only for regions of high seismicity or for regions with a
very long records of earthquake events, favoured by a
long civilisation tradition. On the other hand, assessing
probabilities for tsunamigenic landslide occurrences is
a quite difficult or even prohibitive task in most of the
ocean slopes, due to the lack of data and uncertainties
in the destabilising processes starting slope failure.
Within SCHEMA the probabilistic approach was not
pursued, because bounding a return period to a given
scenario appeared to be quite risky and unfeasible for
the Mediterranean region, the Atlantic and the Black
sea, due to the very small number of major or
recorded events. It appeared more realistic to
consider the likely past or potential scenarios from
Handbook of tsunami hazard and damage scenarios Tsunami scenarios: concepts and methodology
8
various tsunamigenic sources, that is to consider a
number of worst-case credible scenarios, and to
compile them in an aggregated scenario to obtain the
areas of maximum hazard.
2.2 Outlines of SCHEMA
methodology
Building tsunami hazard and tsunami damage
scenarios is a process that requires a number of steps.
Within SCHEMA, a procedure or a methodology has
been devised by the partners that is illustrated in
Figure 1 and that has been applied as a common
approach to the five test areas dealt with in the
project (as already mentioned they are Setúbal, Rabat,
Mandelieu, Catania and Balchik). Since one criterion of
selection of the target areas was purposely that they
should have been quite different from each other
under several aspects (such as for instance in terms of
tsunami data, tsunami sources, coastal and urban
environment, social and cultural conditions), the
application of the same methodology to all of them
has constituted a good validation test for it.
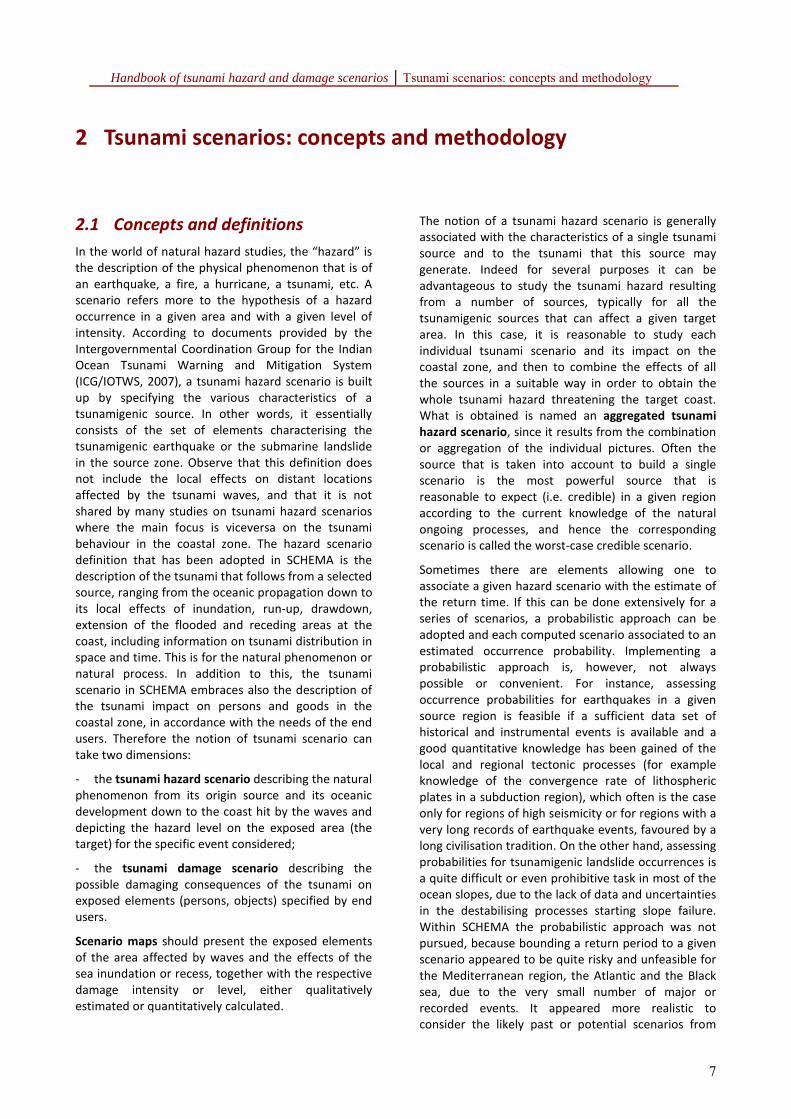
From the sketch in Figure 1 it is clear that actions
included in the blue box on the left refer to the
building of tsunami hazard scenarios including regional
as well as local level, while actions in the green box
refer to the vulnerability and damage analyses that are
carried out only at the local level in the target zones.
Both sets of actions are necessary to provide input
data for building tsunami damage scenarios at the
local level.
The process to build a worst-case credible hazard
scenario starts with the identification of the sources
that are capable of producing the most significant
tsunamis in the target area. For each of the selected
sources, one computes the tsunami generation and
the tsunami propagation up to the target area by
means of numerical models. In the approach adopted
in SCHEMA it has been seen as convenient to consider
a regional frame, more focussed on the tsunami
propagation aspects, and a local frame, more focussed
on the inundation aspects in the target area.
Correspondingly one can speak of regional scenarios
and of local scenarios.
Figure 1 provides a scheme of the methodology
embracing the production of regional and local
scenarios for the separated cases and the combined
scenario. The methodology goes beyond the hazard
scenario and covers also the aspects of the impact and
countermeasure, which mainly focuses on damage
analysis on building and structures and on the
identification of evacuation routes and the
consequent evacuation strategies.
Figure 1: Sketch illustrating the developed
methodology for producing tsunami hazard and
tsunami damage scenarios
This latter is the subject of a second handbook (Scheer
et al., 2011), specifically devoted to tsunami
evacuation planning and thus it will not be handled in
this work. As for the impact, one relevant aspect is the
evaluation of the damage produced by the tsunami to
buildings, which implies at least three steps:
knowledge of the characteristics of the buildings in the
coastal zone (and according classification); definition
of the relevant tsunami parameters affecting the
building and correlation between parameters’
magnitude and damage level (fragility curves, damage
matrices); evaluation of the damage produced by the
tsunami and consequent production of damage maps.
In this section we only stress that damage analyses
and maps can be produced for single scenarios and for
aggregated scenarios. For example, if damage on a
building is assumed to depend upon the thickness of
the water flow (as is the case in the SCHEMA project),
then the estimate of damage is actually performed by
taking into account the flow thickness, that is one of
the elements of the hazard scenarios and can be
provided, according to end users’ need for individual
scenarios or for the aggregated scenarios or for both.
In the aggregated case, in each point of the map the
maximum flow depth may expectedly be associated
with different tsunami cases.
This means that the overall damage picture estimated
over the map does not derive from a single tsunami,
but is the effect of a “virtual tsunami” that in each part
of the map represents the worst possible case. The
modification of the damage level due to other factors
(either pertaining to the building itself, such as
orientation with respect to the shoreline, number of
storeys, type of ground-floor, etc., or pertaining to the
surrounding environment, such as the presence of
defence walls, the proximity to areas where floating
objects can be raised and transported by the tsunami
Handbook of tsunami hazard and damage scenarios Tsunami scenarios: concepts and methodology
9
currents…) is quite difficult to estimate, and has been
taken into account only grossly and in a qualitative
way within the SCHEMA project.
Building a scenario means not only to specify steps
and methods, but also to specify the type of results or
products that are provided to the end users at the end
of the procedure. In the project SCHEMA each
scenario is described by means of a series of maps that
are listed and characterised in Table 2.
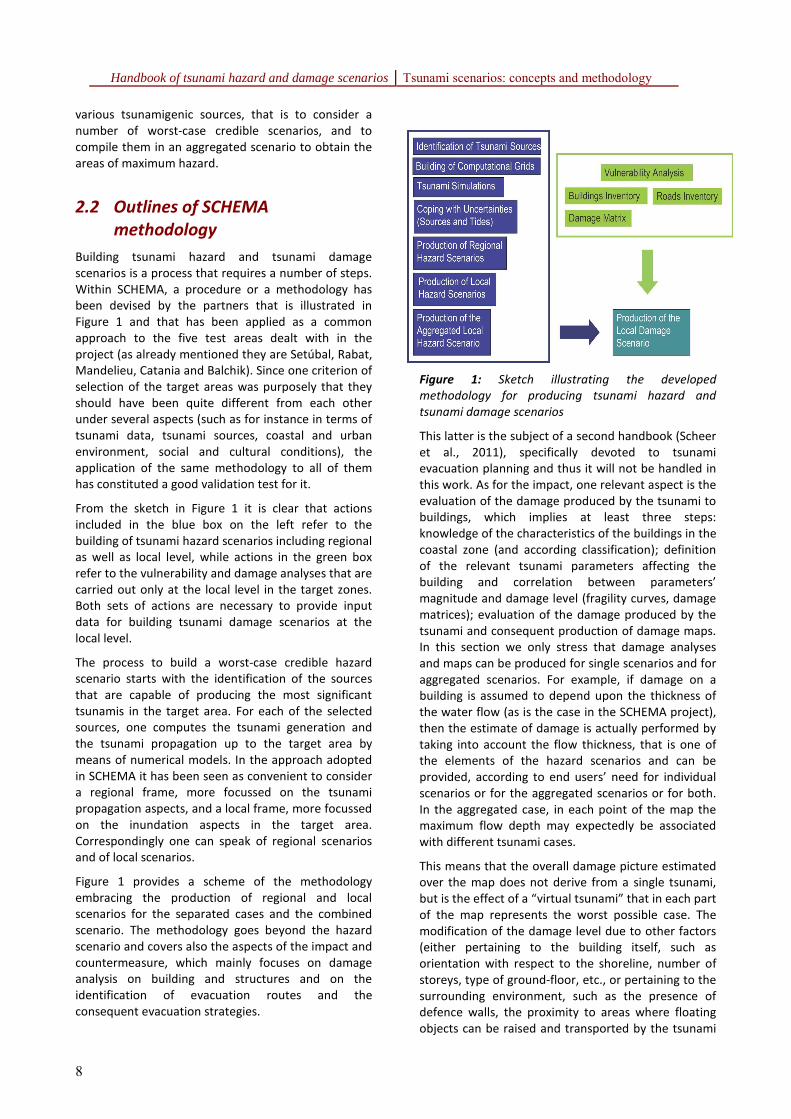
Table 1: List of the maps that characterise tsunami
scenarios in the project SCHEMA
Map name Description
Regional
tsunami hazard
scenarios
(see section 3.6)
They consist in a number of different-
type maps showing the large scale
tsunami propagation between the
source zone and the target. They include
tsunami sea-surface elevation fields
taken at various times since the source
initiation, as well as fields of tsunami
travel times.
Local tsunami
hazard scenarios
(see section 3.7)
Local maps focus on smaller scales in the
target area and depict fields of various
parameters including the maximum sea-
water elevation and speed, the line of
maximum sea water ingression and
regression. They are related to
individual scenarios.
Aggregated
scenarios (local
maps)
(see section 3.8)
Local maps for an aggregated scenario
represent the synthesis of all the results
calculated (or observed) for each
potential tsunami scenarios concerning
the same target location, with extraction
of extreme intensities of all scenarios for
various parameters (principally sea
water elevation, water particle speed,
flow depth, receding extension).
Tsunami
damage
scenarios
(see section 4)
Based either on an individual scenario or
on an aggregated scenario at the target
area, these maps provide quantitative
description of damage levels to buildings
by using fragility functions and other
major elements that increase damage
intensity (secondary vulnerability
criteria). Other elements useful to
rescue operation can be included such
as estimated submerged roads or likely
obstructed streets.
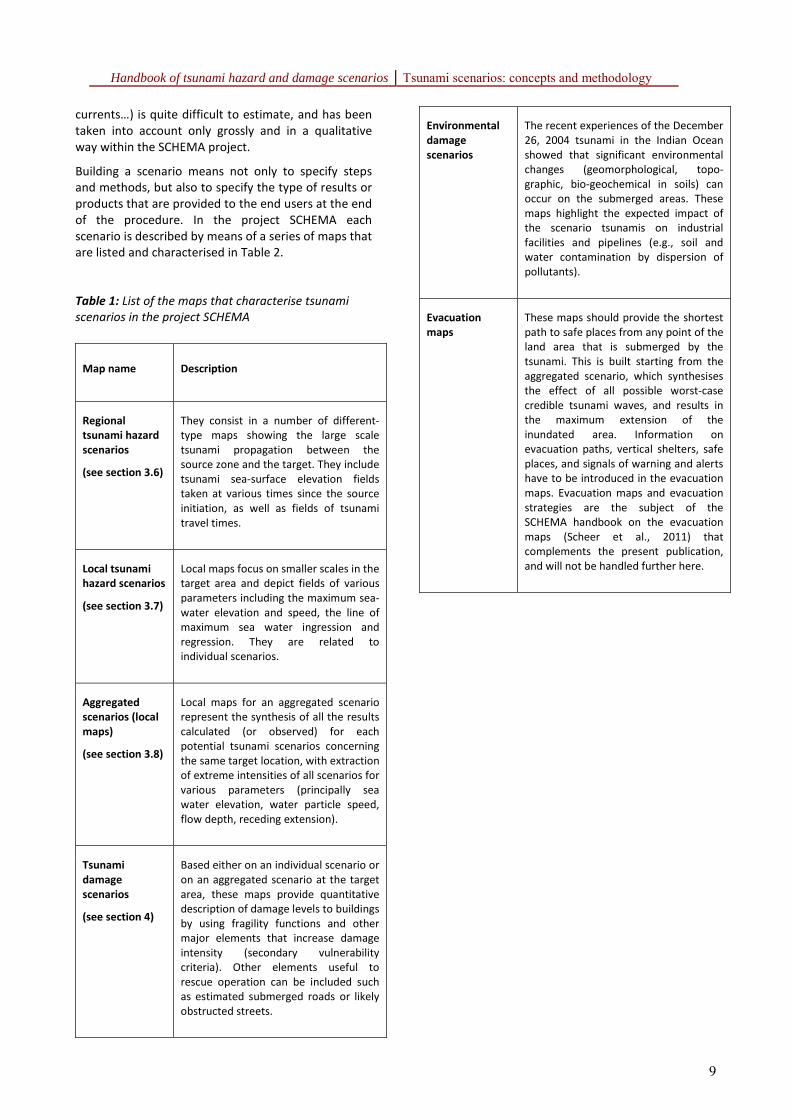
Environmental
damage
scenarios
The recent experiences of the December
26, 2004 tsunami in the Indian Ocean
showed that significant environmental
changes (geomorphological, topo-
graphic, bio-geochemical in soils) can
occur on the submerged areas. These
maps highlight the expected impact of
the scenario tsunamis on industrial
facilities and pipelines (e.g., soil and
water contamination by dispersion of
pollutants).
Evacuation
maps
These maps should provide the shortest
path to safe places from any point of the
land area that is submerged by the
tsunami. This is built starting from the
aggregated scenario, which synthesises
the effect of all possible worst-case
credible tsunami waves, and results in
the maximum extension of the
inundated area. Information on
evacuation paths, vertical shelters, safe
places, and signals of warning and alerts
have to be introduced in the evacuation
maps. Evacuation maps and evacuation
strategies are the subject of the
SCHEMA handbook on the evacuation
maps (Scheer et al., 2011) that
complements the present publication,
and will not be handled further here.
Handbook of tsunami hazard and damage scenarios Tsunami hazard scenarios
10
3 Tsunami hazard scenarios
As already stated in previous sections a tsunami
hazard scenario refers usually to the tsunami
produced by a single source (earthquake, landslide or
volcanic eruption) of given size or intensity. For a given
source there are a number of options that can be
considered to build a scenario. If one restricts his
attention to the hydrodynamic aspects of the tsunami
field, which is what is technically meant by tsunami
hazard scenario, the main elements that form the
scenario can be listed as follows:
1. Map of the maximum sea surface elevation due to
tsunami propagation
2. Maps with the instantaneous sea surface
elevation at a specified propagation time
3. Map of arrival times of first waves
4. Synthetic tide gauge records in a number of
selected nodes
5. Maximum inundation extent (floodable zone limit)
6. Maps of the maximum tsunami height and
inundation depth (or thickness) in the flooded
zone
7. Maximum receding level (minimum sea level off
the shores)
8. Map of the maximum current speed (offshore and
onshore).
The elements of the regional scenarios are the ones
numbered from 1-4 in the above list. The map of the
maximum sea surface elevation (point 1) shows the
propagation path of the tsunami, that generally is
characterised by a very strong anisotropy, as the
double effect of the source geometry (usually with
one dimension much longer than the other) and of the
irregular sea bathymetry. The maps better
representing the tsunami propagation are snapshots
of the sea surface elevation taken at different times
(point 2). From these one can see the tsunami front
radiation from the source and possible reflections on
the coasts. The tsunami travel time map (point 3)
depicts the tsunami isochrones corresponding to
different propagation times, each isochrones being
defined as the line connecting all the points where the
tsunami leading waves arrive at the same time.
Records of tide-gauges computed offshore (point 4)
give the time history of the tsunami in specified places
and can serve to estimate the wave sequence, the
typical tsunami period, the attenuation of the wave
train with time and its significant duration.
Local scenarios include all the products and maps that
are listed from 4 to 8 in the previous section. Observe
that computing tide-gauge records is a task that can
be included among the activities to build regional as
well as local tsunami scenarios depending on the
location of the virtual tide-gauge: if they are selected
offshore along the tsunami propagation path, the
computed records are elements of the regional
scenario, while if they are selected within the target
area (for example a tide-gauge in a local harbour or
onshore), they are consequently elements pertaining
to the local scenario. The maximum inundation extent
(point 5) gives the largest area that is inundated by the
tsunami, irrespective from the time of inundation: the
tsunami can inundate the target area with a single
wave or a series of waves arriving in different times
with different amplitudes. The maximum inundation
extent is the area that results from adding together all
the areas flooded by the various tsunami waves.
Accordingly, maps of the maximum tsunami elevation
and maximum flow depth (point 6) provide
information on the highest level reached by the sea
surface in any given point and the maximum height of
the water column. These two variables are obviously
linked together on land, since the second derives from
the first by simply subtracting the local altitude of the
ground. The maximum receding level (point 7) gives
the maximum area that remains dry offshore as the
result of the tsunami arrival in the target area. Each
tsunami trough causes the sea to withdraw from the
usual position of the shoreline, leaving some areas
uncovered by the sea water. The sum of the dry areas
corresponding to the various troughs form the
maximum receding level. The map of the maximum
current speed (point 8) provides the maximum
intensity of the horizontal water particle velocity
computed in the target area, offshore and onshore.
Though also the vertical velocity may have a role,
tsunami simulation models usually neglect the vertical
velocity. Indeed they use the average of the horizontal
velocity on the water column that is from the sea floor
up to the instantaneous sea surface level.
The only viable way to explore tsunami scenarios and
to produce the above listed maps is to make recourse
to numerical models and to perform numerical
simulations where grids (regular or irregular) cover the
domain of interest. Very important among the other
maps are the fields of the maximum (minimum) sea
water elevations in the target area: for any given case
these show the maximum (minimum) level computed
Handbook of tsunami hazard and damage scenarios Tsunami hazard scenarios
11
in any given node of the local grid and therefore are
also useful to compute the inundation line and the
run-down line. The first is the boundary line inland
between the area not reached by the sea and the area
which is flooded at least once by the series of tsunami
waves. The second is the boundary line offshore that
divides the area remaining always covered by the sea
water and the area which remains dry at least once
due to the retreating movement of the shoreline
during the tsunami attack.
When the tide regime is strong and there is a relevant
difference between high and low tide, which occurs
more in the oceans than in closed basins and seas,
tsunami hazard scenarios can be built distinctly for low
tide and high tide conditions.
Typically a number of sources are needed to provide a
complete picture of the many ways a tsunami can
attack a given place. Producing a tsunami hazard
worst-case credible scenario means indeed modelling
worst-case credible tsunamis for a comprehensive set
of sources affecting a given location and then
combining them together in the aggregate scenario.
The most reasonable way of aggregation is to build
maps with the maximum extension of inundation and
drawdown, and aggregated fields (such as sea
inundation depth and current speed) with the
maximum intensities. The resulting scenario should be
referred to correctly as the tsunami hazard aggregated
scenario, but it is often referred to simply as tsunami
hazard scenario, under the assumption that the
context clarifies what it really is. The aggregation
synthesis regards only the local scenarios, and more
specifically the products ranging from 5 to 8. A typical
map of the aggregated hazard scenario, for example, is
the map of the maximum extent of the inundation
area, which is obtained by adding together all the
inundated areas resulting from the various scenarios.
This map carries information relevant for end users,
since it distinguishes the coastal zone clearly into two
classes, the area that is not inundated by any tsunami,
and therefore is safe, and the area that can be
affected by at least one of the tsunami cases.
3.1 Selection of the sources
The first step in order to build scenarios is represented
by the choice of the sources that could have the
highest tsunamigenic potential for the considered test
site (see Figure 1). Seismotectonic studies of
earthquake and tsunami catalogues are the main tools
to be used to the purpose of compiling the worst-case
tsunami scenarios. For the test sites treated in
SCHEMA a careful examination of data and of the
existing literature provided the motivation for the
selection of sources as may be found in the scientific
reports produced by the project partners. In this
handbook we simply provide the list of such sources
through Table 3 and of the main related references
taken from the literature.
For the Rabat test site two of the three selected
scenarios are based on historical earthquakes: one is a
source hypothesis of the event following the strong
earthquake occurred in 1755 (Baptista et al., 2003)
and the second is the Mw=7.9 earthquake occurred in
1969 and located south of the Gorringe Bank, SW off
Portugal. The third scenario is represented by a
hypothetical tsunamigenic huge volume landslide that
could follow from the eruption of the Cumbre Vieja
volcano in the Canary island of La Palma (Ward and
Day, 2001).
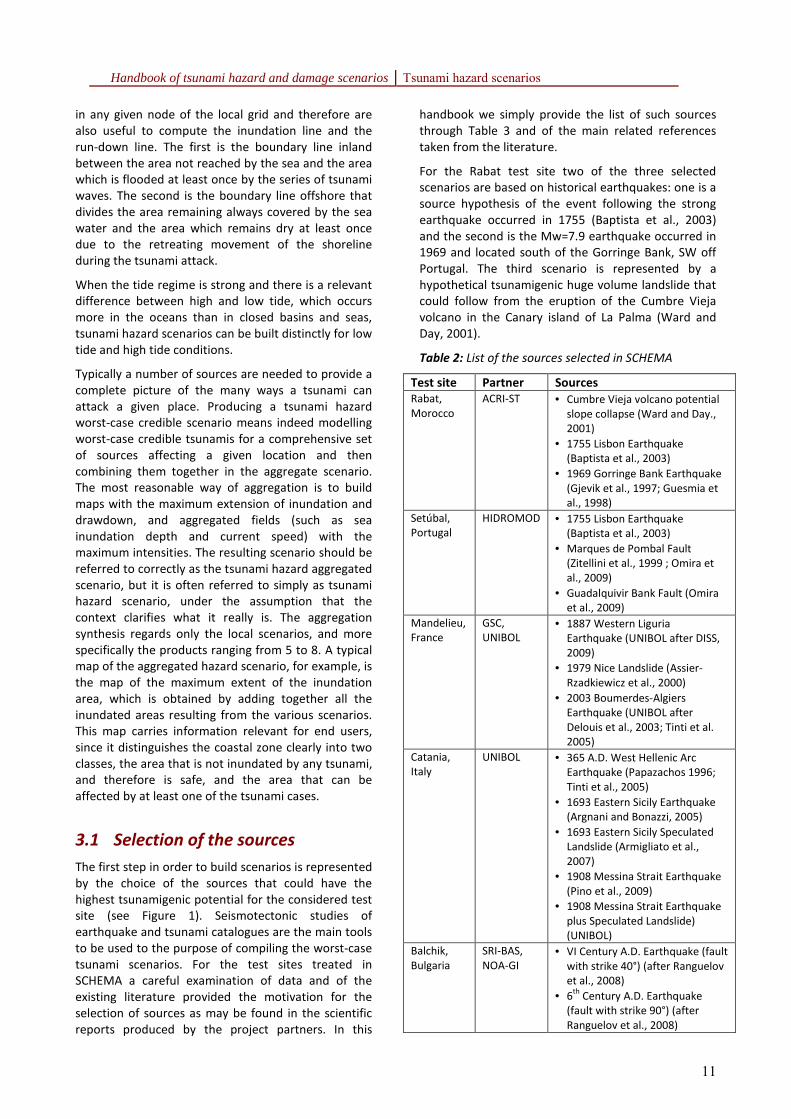
Table 2: List of the sources selected in SCHEMA
Test site Partner Sources
Rabat,
Morocco
ACRI-ST • Cumbre Vieja volcano potential
slope collapse (Ward and Day.,
2001)
• 1755 Lisbon Earthquake
(Baptista et al., 2003)
• 1969 Gorringe Bank Earthquake
(Gjevik et al., 1997; Guesmia et
al., 1998)
Setúbal,
Portugal
HIDROMOD • 1755 Lisbon Earthquake
(Baptista et al., 2003)
• Marques de Pombal Fault
(Zitellini et al., 1999 ; Omira et
al., 2009)
• Guadalquivir Bank Fault (Omira
et al., 2009)
Mandelieu,
France
GSC,
UNIBOL
• 1887 Western Liguria
Earthquake (UNIBOL after DISS,
2009)
• 1979 Nice Landslide (Assier-
Rzadkiewicz et al., 2000)
• 2003 Boumerdes-Algiers
Earthquake (UNIBOL after
Delouis et al., 2003; Tinti et al.
2005)
Catania,
Italy
UNIBOL • 365 A.D. West Hellenic Arc
Earthquake (Papazachos 1996;
Tinti et al., 2005)
• 1693 Eastern Sicily Earthquake
(Argnani and Bonazzi, 2005)
• 1693 Eastern Sicily Speculated
Landslide (Armigliato et al.,
2007)
• 1908 Messina Strait Earthquake
(Pino et al., 2009)
• 1908 Messina Strait Earthquake
plus Speculated Landslide)
(UNIBOL)
Balchik,
Bulgaria
SRI-BAS,
NOA-GI
• VI Century A.D. Earthquake (fault
with strike 40°) (after Ranguelov
et al., 2008)
• 6th
Century A.D. Earthquake
(fault with strike 90°) (after
Ranguelov et al., 2008)
Handbook of tsunami hazard and damage scenarios Tsunami hazard scenarios
12
For the Setúbal test site three main offshore faults or
fault systems have been examined. The first is the
same selected for the Rabat test site and considered
as the source of the 1755 Lisbon earthquake and
tsunami (Baptista et al., 2003). Two more sources
placed in the Gulf of Cadiz have been identified by
considering the complex seismotectonic setting of the
region that is governed by the convergence between
the African and the Eurasian plates: they are the so
called Marques de Pombal fault (Zitellini et al., 1999)
and the Guadalquivir Bank fault (Omira et al., 2009).
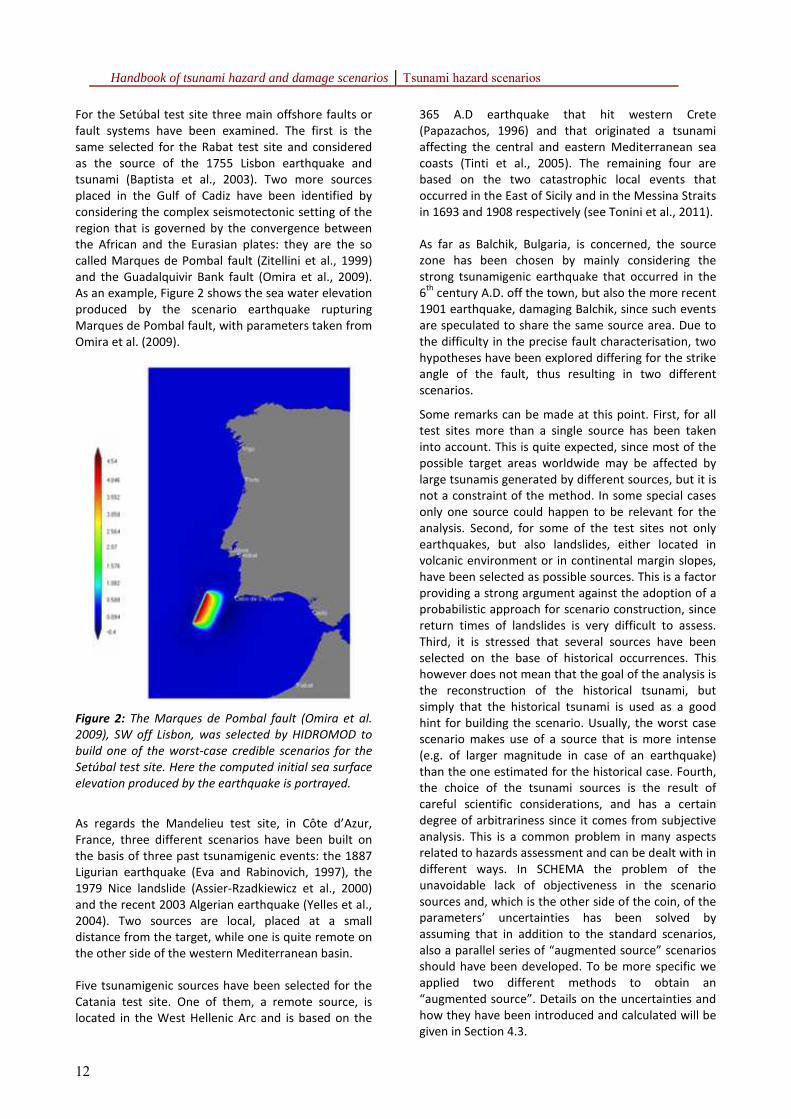
As an example, Figure 2 shows the sea water elevation
produced by the scenario earthquake rupturing
Marques de Pombal fault, with parameters taken from
Omira et al. (2009).
Figure 2: The Marques de Pombal fault (Omira et al.
2009), SW off Lisbon, was selected by HIDROMOD to
build one of the worst-case credible scenarios for the
Setúbal test site. Here the computed initial sea surface
elevation produced by the earthquake is portrayed.
As regards the Mandelieu test site, in Côte d’Azur,
France, three different scenarios have been built on
the basis of three past tsunamigenic events: the 1887
Ligurian earthquake (Eva and Rabinovich, 1997), the
1979 Nice landslide (Assier-Rzadkiewicz et al., 2000)
and the recent 2003 Algerian earthquake (Yelles et al.,
2004). Two sources are local, placed at a small
distance from the target, while one is quite remote on
the other side of the western Mediterranean basin.
Five tsunamigenic sources have been selected for the
Catania test site. One of them, a remote source, is
located in the West Hellenic Arc and is based on the
365 A.D earthquake that hit western Crete
(Papazachos, 1996) and that originated a tsunami
affecting the central and eastern Mediterranean sea
coasts (Tinti et al., 2005). The remaining four are
based on the two catastrophic local events that
occurred in the East of Sicily and in the Messina Straits
in 1693 and 1908 respectively (see Tonini et al., 2011).
As far as Balchik, Bulgaria, is concerned, the source
zone has been chosen by mainly considering the
strong tsunamigenic earthquake that occurred in the
6th
century A.D. off the town, but also the more recent
1901 earthquake, damaging Balchik, since such events
are speculated to share the same source area. Due to
the difficulty in the precise fault characterisation, two
hypotheses have been explored differing for the strike
angle of the fault, thus resulting in two different
scenarios.
Some remarks can be made at this point. First, for all
test sites more than a single source has been taken
into account. This is quite expected, since most of the
possible target areas worldwide may be affected by
large tsunamis generated by different sources, but it is
not a constraint of the method. In some special cases
only one source could happen to be relevant for the
analysis. Second, for some of the test sites not only
earthquakes, but also landslides, either located in
volcanic environment or in continental margin slopes,
have been selected as possible sources. This is a factor
providing a strong argument against the adoption of a
probabilistic approach for scenario construction, since
return times of landslides is very difficult to assess.
Third, it is stressed that several sources have been
selected on the base of historical occurrences. This
however does not mean that the goal of the analysis is
the reconstruction of the historical tsunami, but
simply that the historical tsunami is used as a good
hint for building the scenario. Usually, the worst case
scenario makes use of a source that is more intense
(e.g. of larger magnitude in case of an earthquake)
than the one estimated for the historical case. Fourth,
the choice of the tsunami sources is the result of
careful scientific considerations, and has a certain
degree of arbitrariness since it comes from subjective
analysis. This is a common problem in many aspects
related to hazards assessment and can be dealt with in
different ways. In SCHEMA the problem of the
unavoidable lack of objectiveness in the scenario
sources and, which is the other side of the coin, of the
parameters’ uncertainties has been solved by
assuming that in addition to the standard scenarios,
also a parallel series of “augmented source” scenarios
should have been developed. To be more specific we
applied two different methods to obtain an
“augmented source”. Details on the uncertainties and
how they have been introduced and calculated will be
given in Section 4.3.
Handbook of tsunami hazard and damage scenarios Tsunami hazard scenarios
13
3.2 Numerical models
Following the selection of the sources for a given test
site, numerical simulation of the tsunami are to be
performed (see Figure 1). This has been carried out in
the project SCHEMA for each test site by partners with
expertise in tsunami numerical modelling. The tsunami
code models used in SCHEMA are listed in table 4.
Table 3: Tsunami numerical models used for the test
sites of the project SCHEMA.
Partner Model
name
Test site Two-way
Nesting
Solution
ACRI-ST TIDAL Rabat No Boussinesq
HIDROMOD MOHID Setúbal Yes Shallow water
GSC,
UNIBOL
COMCOT
UBO-
TSUFD
Mandelieu Yes Shallow water
NOA-GI FUNWAVE Balchik Yes Boussinesq
UNIBOL UBO-
TSUFD
Catania Yes Shallow water
All models solve the Navier-Stokes equations for water
waves propagation under the approximation that the
vertical velocity of water particles is negligible and
that the horizontal velocity components are uniform
along the vertical column of the fluid.
TIDAL is a general-purpose software tool for solution
of the fluid flow, heat and mass transfer problems in
shallow water bodies. It can be used to simulate
transient or steady state problems in a water body
with irregular coastline, complex bathymetry, and
islands. The water body may contain rivers, sources,
inlets and outlets. It may have coastal plains or tidal
flats which get inundated with or drained of water
from time to time.
HIDROMOD performed tsunami propagation
simulations using MOHID modelling system (see
http://www.mohid.com). MOHID is an open source 3D
water modelling system that was used in 2D
approximation for tsunami calculations. It was
developed by MARETEC (Marine and Environmental
Technology Research Center) at Instituto Superior
Técnico (IST) which belongs to Technical University of
Lisbon. The MOHID modelling system allows the
adoption of an integrated modelling philosophy, not
only of processes (physical and biogeochemical), but
also of different scales (allowing the use of nested
models) and systems (estuaries and watersheds), due
to the adoption of an object oriented programming
philosophy. For tsunami application the code was
applied in the long wave approximation version (see
Vaz et al., 2007).
The numerical tool used by GSC is the ComMIT
(Community Model Interface for Tsunami) package,
based on the Method of Splitting Tsunami (MOST)l,
and developed by the Pacific Marine Environmental
Laboratory (PMEL) of the National Oceanic and
Atmospheric Administration (NOAA) of the United
States (http://nctr.pmel.noaa.gov/ComMIT; see also
Titov and Synolakis, 1995).
NOA-GI simulated tsunami propagation and
inundation with FUNWAVE, a Boussinesq water wave
model, that was initially developed for modelling
ocean wave transformation from deep water to the
coast, including breaking and runup
(http://chinacat.coastal.udel.edu/programs/funwave/
funwave.html; see also Kirby et al., 1998).
To perform numerical simulations for the Catania and
Mandelieu test sites, UNIBOL has made use of the in-
house developed tsunami propagation code UBO-
TSUFD, which solves both linear and non-linear
shallow water equations with a leap-frog algorithm
over staggered structured grids with the finite
difference technique.
A nested multi-grid system (see Figures 3 and 7) is
implemented for all the codes to allow for different
grid resolution in modelling regional wave propagation
across deep ocean and local impact in the shallow
nearshore zone: however TIDAL uses the output of the
large coarser grid as input of the small finer grid (one
way coupling), while other codes account for a full
coupling between the coarser and the finer grid,
though coupling techniques differ from one code to
the other.
The set of the models used in SCHEMA and given in
Table 4 does not cover all the possible models
available for tsunami propagation. Several others have
been developed especially in the last years, after the
great increase of interest on tsunamis following the
2004 disaster in the Indian Ocean. It is stressed here
that the SCHEMA methodology does not determine or
recommend a specific tsunami simulation code. It is
simply observed, however, that tsunami modelling
plays a very fundamental role in the procedure since it
is at the basis of the creation of the tsunami scenarios,
and therefore the utilisation of any in-house or
commercial software has to be made by paying
attention to the advantages and limitations of the
codes, with the warning that performing simulations
in a black-box mode might lead to some unreliable
artefacts. A further remark is that all the tsunami
simulation codes used by the SCHEMA partners were
validated on a common case, more precisely by
computing the Indian Ocean 2004 tsunami
propagation from the source up to the Seychelles
archipelago and by comparing numerical results with
observed run-up data in the Praslin Island and with the
Handbook of tsunami hazard and damage scenarios Tsunami hazard scenarios
14
tide-gauge record in the port of Pointe La Rue, in the
Mahé Island (see SCHEMA Deliverable 1.3, 2008).
3.3 Bathymetry and topography
databases
Tsunami propagation is sensitive to sea bathymetry,
and tsunami impact on the coast and flooding are
sensitive to coast topography. Therefore, it is not
surprising that all tsunami models are sensitive as well
to bathymetry and topography data and that a very
important step for tsunami simulation is the creation
of an adequate topo-bathymetric set of computational
grids. This task seems simple in principle, but in
practice it is quite complex due to the lack of data with
the proper resolution and/or due to the fact that such
data may exist but are not easily and openly available.
Indeed a big step forward has been done in recent
years as the results of international projects that
produced homogeneous worldwide gridded datasets
of bathymetry and topography such as GEBCO
(General Bathymetric Chart of the Oceans;
http://www. gebco.net/) and SRTM (Shuttle Radar
Topography Mission; http://srtm.usgs.gov/) with
resolution of 30 arc-second and 90 m respectively.
This resolution is sufficient for regional scales and for
producing regional tsunami hazard scenarios (see
Table 2), but it is not enough for the detailed local
study required for the SCHEMA test sites. Hence, each
partner has collected topo-bathymetric data from a
variety of sources also in collaboration with local
administrations, and then has compiled gridded
datasets by means of suitable procedures of data
merging and interpolation.
3.3.1 Combining land and sea datasets
A further complication derives from a need that is
typical of tsunami studies pointing to computation of
wave inundation and run-up. Usually, topographic
data and bathymetric data are acquired by different
agencies and institutions and processed
independently, which has the consequence that they
have no common reference frame or no common zero
for the vertical coordinate. Indeed, it is tradition that
land elevations are determined with reference to the
mean sea surface level over a long period (preferably
around 18 years), while sea depth in nautical charts is
relative to the chart datum, which is defined to be a
level below which tide rarely falls, let’s say the
minimum tidal level. It is quite frequent, therefore,
that the coastline representations of these data sets
are inconsistent. If one just limited to put these data
together, a transect crossing the shoreline would
result almost always into a discontinuous jump in
passing from sea to land. So special care, with specific
processing and data validation, is needed to create a
coherent unique data set in the coastal zone, where
the resolution requested in SCHEMA ranges for 1-
40 m.
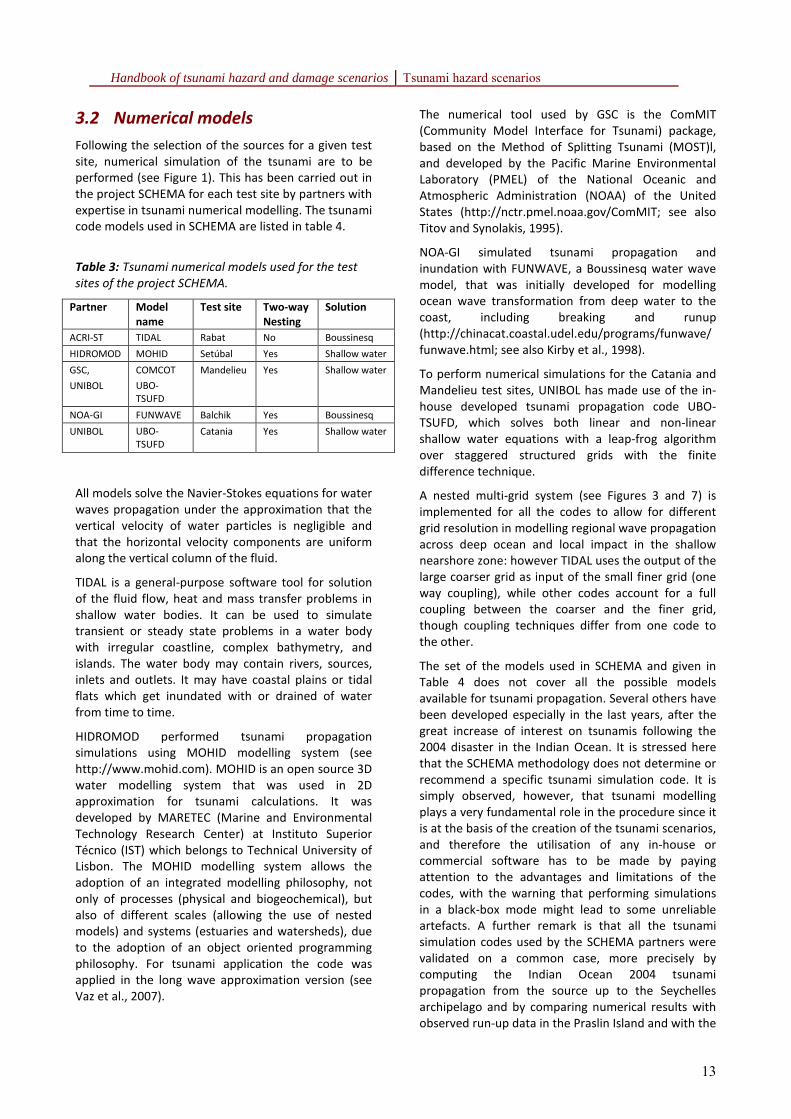
One example of compilation of various datasets for
local tsunami scenarios is given in Figure 3 and in
Figure 4 that refer to the test site of Mandelieu,
France. It is seen from Figure 3 that the bathymetry
results from the combination of GEBCO data and data
acquired by IFREMER (Institut Français de Recherche
pour l'Exploitation de la Mer, 1998 and 2004) and
SHOM© (Service Hydrographique et Océanographique
de la Marine) during a series of cruises carried out far
offshore and nearshore.
Figure 3: Compilation of bathymetric data for the
Mandelieu test site by GSC. Rectangles represent the
boundaries of the computational grids of the multi-
grid system created by UNIBOL for numerical
simulations.
A very accurate local digital elevation model (DEM)
was used for the topography of Mandelieu. The
position of the coastlines, which is the boundary
between the DEM and ocean data, has been inferred
from analysing Google Earth images and validated
through in-field observations (Figure 4). In addition,
the position of the coastline may be used as a
constraint to harmonise sea and land data sets in the
process of building a unique topo-bathymetric
database.
Handbook of tsunami hazard and damage scenarios Tsunami hazard scenarios
15
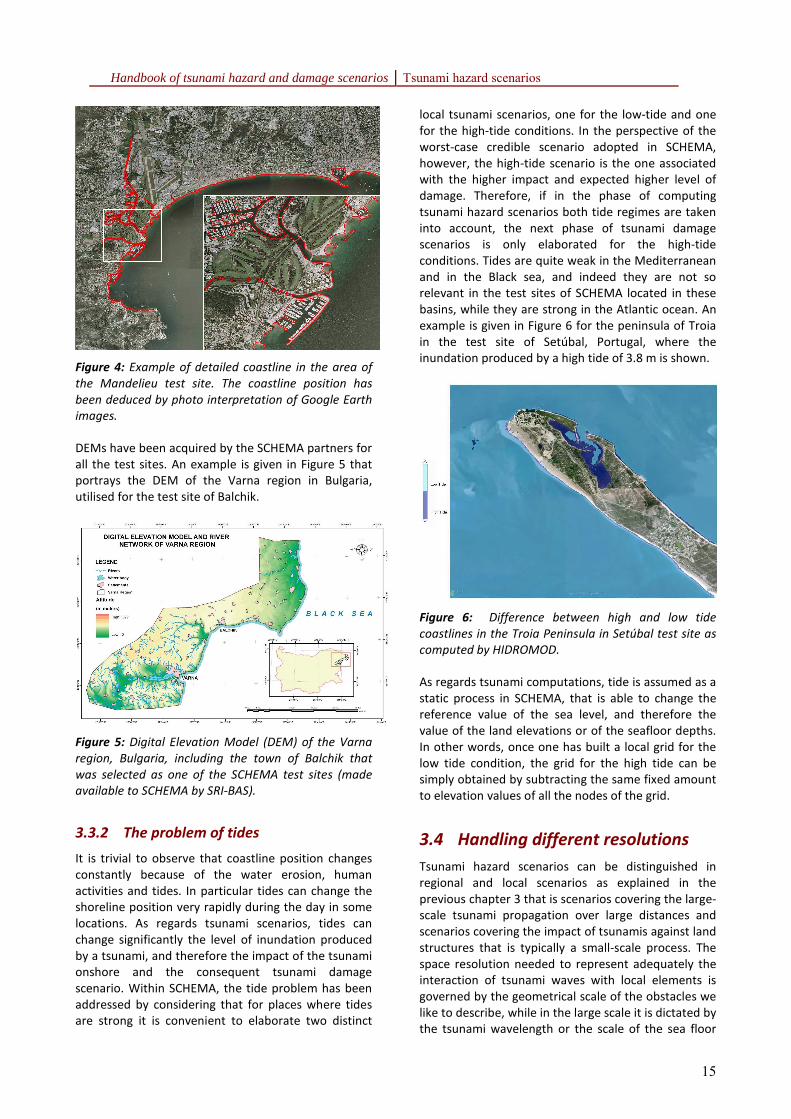
Figure 4: Example of detailed coastline in the area of
the Mandelieu test site. The coastline position has
been deduced by photo interpretation of Google Earth
images.
DEMs have been acquired by the SCHEMA partners for
all the test sites. An example is given in Figure 5 that
portrays the DEM of the Varna region in Bulgaria,
utilised for the test site of Balchik.
Figure 5: Digital Elevation Model (DEM) of the Varna
region, Bulgaria, including the town of Balchik that
was selected as one of the SCHEMA test sites (made
available to SCHEMA by SRI-BAS).
3.3.2 The problem of tides
It is trivial to observe that coastline position changes
constantly because of the water erosion, human
activities and tides. In particular tides can change the
shoreline position very rapidly during the day in some
locations. As regards tsunami scenarios, tides can
change significantly the level of inundation produced
by a tsunami, and therefore the impact of the tsunami
onshore and the consequent tsunami damage
scenario. Within SCHEMA, the tide problem has been
addressed by considering that for places where tides
are strong it is convenient to elaborate two distinct
local tsunami scenarios, one for the low-tide and one
for the high-tide conditions. In the perspective of the
worst-case credible scenario adopted in SCHEMA,
however, the high-tide scenario is the one associated
with the higher impact and expected higher level of
damage. Therefore, if in the phase of computing
tsunami hazard scenarios both tide regimes are taken
into account, the next phase of tsunami damage
scenarios is only elaborated for the high-tide
conditions. Tides are quite weak in the Mediterranean
and in the Black sea, and indeed they are not so
relevant in the test sites of SCHEMA located in these
basins, while they are strong in the Atlantic ocean. An
example is given in Figure 6 for the peninsula of Troia
in the test site of Setúbal, Portugal, where the
inundation produced by a high tide of 3.8 m is shown.
Figure 6: Difference between high and low tide
coastlines in the Troia Peninsula in Setúbal test site as
computed by HIDROMOD.
As regards tsunami computations, tide is assumed as a
static process in SCHEMA, that is able to change the
reference value of the sea level, and therefore the
value of the land elevations or of the seafloor depths.
In other words, once one has built a local grid for the
low tide condition, the grid for the high tide can be
simply obtained by subtracting the same fixed amount
to elevation values of all the nodes of the grid.
3.4 Handling different resolutions
Tsunami hazard scenarios can be distinguished in
regional and local scenarios as explained in the
previous chapter 3 that is scenarios covering the large-
scale tsunami propagation over large distances and
scenarios covering the impact of tsunamis against land
structures that is typically a small-scale process. The
space resolution needed to represent adequately the
interaction of tsunami waves with local elements is
governed by the geometrical scale of the obstacles we
like to describe, while in the large scale it is dictated by
the tsunami wavelength or the scale of the sea floor
Handbook of tsunami hazard and damage scenarios Tsunami hazard scenarios
16
main features. Typically, if we like to describe how a
breakwater interacts with a tsunami wave or how a
tsunami attacks a building, we need grid spacing in the
range of 1-10 m, while in the deep ocean grid spacing
can be 500-5000 m to treat propagation of tsunamis
generated by large earthquakes.
Numerical models handle different resolutions in two
different ways, which is either by using a single
unstructured grid with heterogeneous resolution or by
means of a set of structured interconnected grids that
have different node density. Typically the first
category is the category of grids formed by polygons,
such as triangles, of various size, that are used by
codes based on the finite-element technique: smaller
polygons are used to cover those areas of the domain
where higher resolution is required. No such models
have been used in the project SCHEMA. The second
category covers the domain by a series of grids, nested
one in the other, with the coarser including the finer
one. This technique, which is adopted by the finite
difference models, allows one to compute the
propagation of waves with increasing resolution as the
wave passes from a coarse grid to a fine grid. By
combining a series of grids, one can get the desired
level of resolution in the area of interest.
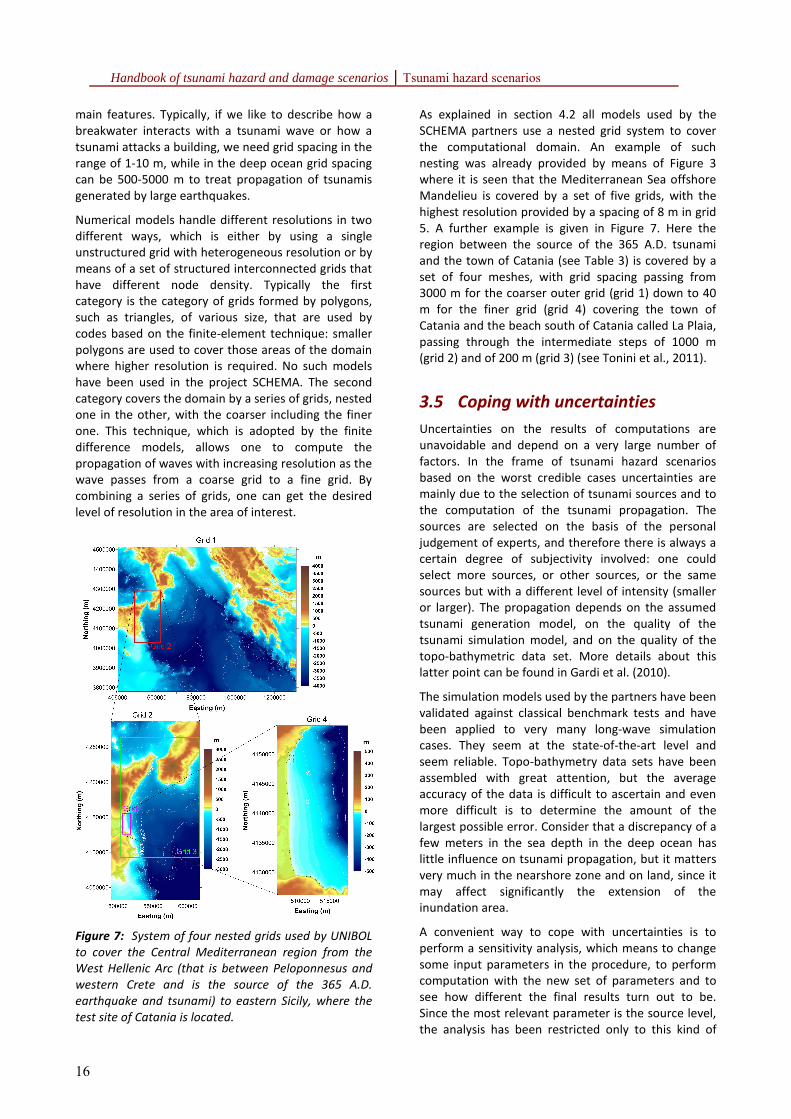
Figure 7: System of four nested grids used by UNIBOL
to cover the Central Mediterranean region from the
West Hellenic Arc (that is between Peloponnesus and
western Crete and is the source of the 365 A.D.
earthquake and tsunami) to eastern Sicily, where the
test site of Catania is located.
As explained in section 4.2 all models used by the
SCHEMA partners use a nested grid system to cover
the computational domain. An example of such
nesting was already provided by means of Figure 3
where it is seen that the Mediterranean Sea offshore
Mandelieu is covered by a set of five grids, with the
highest resolution provided by a spacing of 8 m in grid
5. A further example is given in Figure 7. Here the
region between the source of the 365 A.D. tsunami
and the town of Catania (see Table 3) is covered by a
set of four meshes, with grid spacing passing from
3000 m for the coarser outer grid (grid 1) down to 40
m for the finer grid (grid 4) covering the town of
Catania and the beach south of Catania called La Plaia,
passing through the intermediate steps of 1000 m
(grid 2) and of 200 m (grid 3) (see Tonini et al., 2011).
3.5 Coping with uncertainties
Uncertainties on the results of computations are
unavoidable and depend on a very large number of
factors. In the frame of tsunami hazard scenarios
based on the worst credible cases uncertainties are
mainly due to the selection of tsunami sources and to
the computation of the tsunami propagation. The
sources are selected on the basis of the personal
judgement of experts, and therefore there is always a
certain degree of subjectivity involved: one could
select more sources, or other sources, or the same
sources but with a different level of intensity (smaller
or larger). The propagation depends on the assumed
tsunami generation model, on the quality of the
tsunami simulation model, and on the quality of the
topo-bathymetric data set. More details about this
latter point can be found in Gardi et al. (2010).
The simulation models used by the partners have been
validated against classical benchmark tests and have
been applied to very many long-wave simulation
cases. They seem at the state-of-the-art level and
seem reliable. Topo-bathymetry data sets have been
assembled with great attention, but the average
accuracy of the data is difficult to ascertain and even
more difficult is to determine the amount of the
largest possible error. Consider that a discrepancy of a
few meters in the sea depth in the deep ocean has
little influence on tsunami propagation, but it matters
very much in the nearshore zone and on land, since it
may affect significantly the extension of the
inundation area.
A convenient way to cope with uncertainties is to
perform a sensitivity analysis, which means to change
some input parameters in the procedure, to perform
computation with the new set of parameters and to
see how different the final results turn out to be.
Since the most relevant parameter is the source level,
the analysis has been restricted only to this kind of
Handbook of tsunami hazard and damage scenarios Tsunami hazard scenarios
17
change, to keep it simple and to keep it economical.
Since the sources used for the SCHEMA test sites are
essentially either earthquakes or landslides (see Table
3), two different strategies have been adopted.
When the tsunami is caused by an earthquake, it is
known that the earthquake initially displaces the sea
water up or down by almost the same amount by
which it moves the sea floor. In the area where the
earthquake determines a co-seismic subsidence
(uplift) of the sea floor, the sea level goes down (up)
and forms a trough (crest) at the sea surface. The sea
surface pattern produced by the earthquake is known
as the initial state (or condition) of the tsunami wave.
Changing the size of the earthquake means to change
the size of the vertical displacement of the sea floor,
and hence of the amplitude of the initial tsunami
wave, and viceversa. In order to perform the
sensitivity analysis for earthquake-induced tsunamis,
the SCHEMA partners have taken each earthquake
source of Table 3 and increased the amplitude of the
initial tsunami by 20%.
The generation mechanism of a landslide tsunami is
more complex than for an earthquake. The concept of
initial tsunami wave has no meaning anymore since
the tsunami generation goes along with the process of
landsliding. We may however notice that tsunami
wave amplitude is strongly correlated to the thickness
of the landslides and, within a certain extent, there
can be seen a linear dependence. In analogy with the
earthquake generation case, therefore, sensitivity
analysis has been carried out by increasing the
thickness of the landslide by the same factor of 20%.
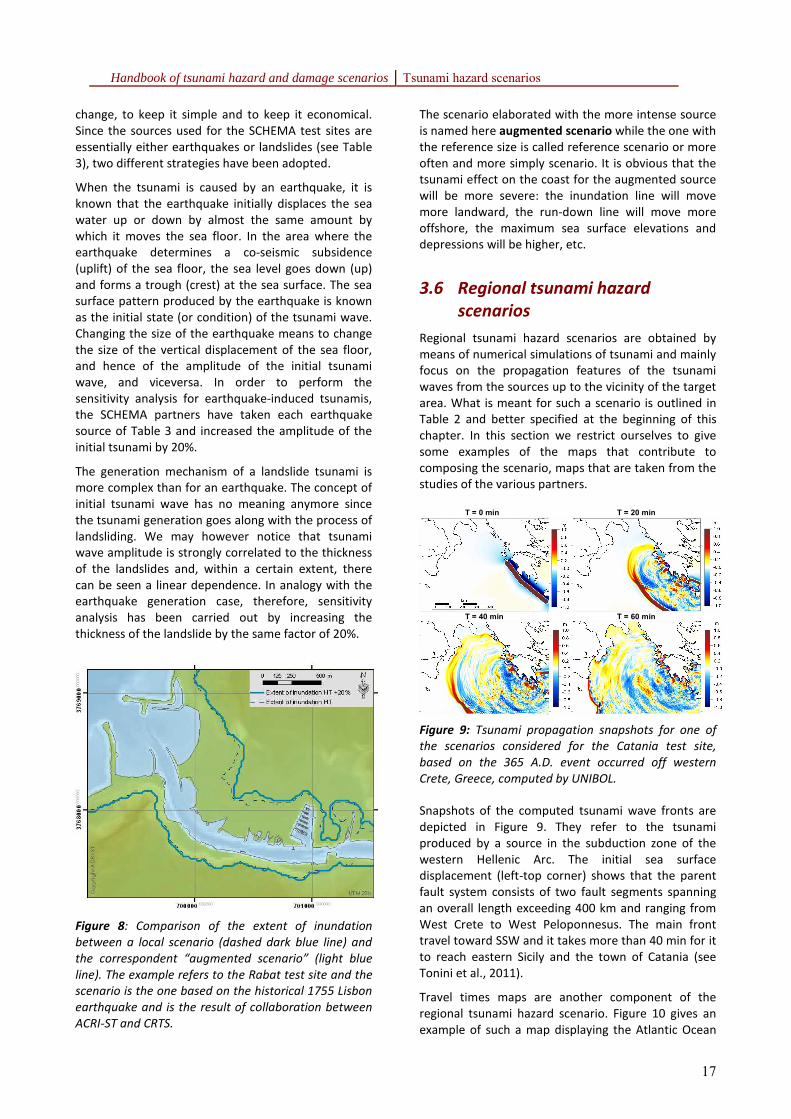
Figure 8: Comparison of the extent of inundation
between a local scenario (dashed dark blue line) and
the correspondent “augmented scenario” (light blue
line). The example refers to the Rabat test site and the
scenario is the one based on the historical 1755 Lisbon
earthquake and is the result of collaboration between
ACRI-ST and CRTS.
The scenario elaborated with the more intense source
is named here augmented scenario while the one with
the reference size is called reference scenario or more
often and more simply scenario. It is obvious that the
tsunami effect on the coast for the augmented source
will be more severe: the inundation line will move
more landward, the run-down line will move more
offshore, the maximum sea surface elevations and
depressions will be higher, etc.
3.6 Regional tsunami hazard
scenarios
Regional tsunami hazard scenarios are obtained by
means of numerical simulations of tsunami and mainly
focus on the propagation features of the tsunami
waves from the sources up to the vicinity of the target
area. What is meant for such a scenario is outlined in
Table 2 and better specified at the beginning of this
chapter. In this section we restrict ourselves to give
some examples of the maps that contribute to
composing the scenario, maps that are taken from the
studies of the various partners.
T = 0 min T = 20 min
T = 40 min T = 60 min
Figure 9: Tsunami propagation snapshots for one of
the scenarios considered for the Catania test site,
based on the 365 A.D. event occurred off western
Crete, Greece, computed by UNIBOL.
Snapshots of the computed tsunami wave fronts are
depicted in Figure 9. They refer to the tsunami
produced by a source in the subduction zone of the
western Hellenic Arc. The initial sea surface
displacement (left-top corner) shows that the parent
fault system consists of two fault segments spanning
an overall length exceeding 400 km and ranging from
West Crete to West Peloponnesus. The main front
travel toward SSW and it takes more than 40 min for it
to reach eastern Sicily and the town of Catania (see
Tonini et al., 2011).
Travel times maps are another component of the
regional tsunami hazard scenario. Figure 10 gives an
example of such a map displaying the Atlantic Ocean
Handbook of tsunami hazard and damage scenarios Tsunami hazard scenarios
18
propagation of the tsunami produced by the assumed
sector collapse of the volcano Cumbre Vieja in the
Canary islands. Travel time maps give the minimum
time needed by the tsunami front to reach a specified
location. Among the sources taken into account (see
Table 3) in the project SCHEMA, the ones that
happened to be most remote in terms of propagation
time are the landslide in La Palma for Rabat, the
earthquake of Boumerdes-Algiers for Mandelieu and
the earthquake on the western Hellenic Arc for
Catania.
Figure 10: Propagation time map of the scenario
associated with the mega-collapse of the Cumbre Vieja
in the La Palma island elaborated for the Rabat test
site by ACRI-ST. It is seen that the first tsunami waves
will reach Rabat in about 90 min.
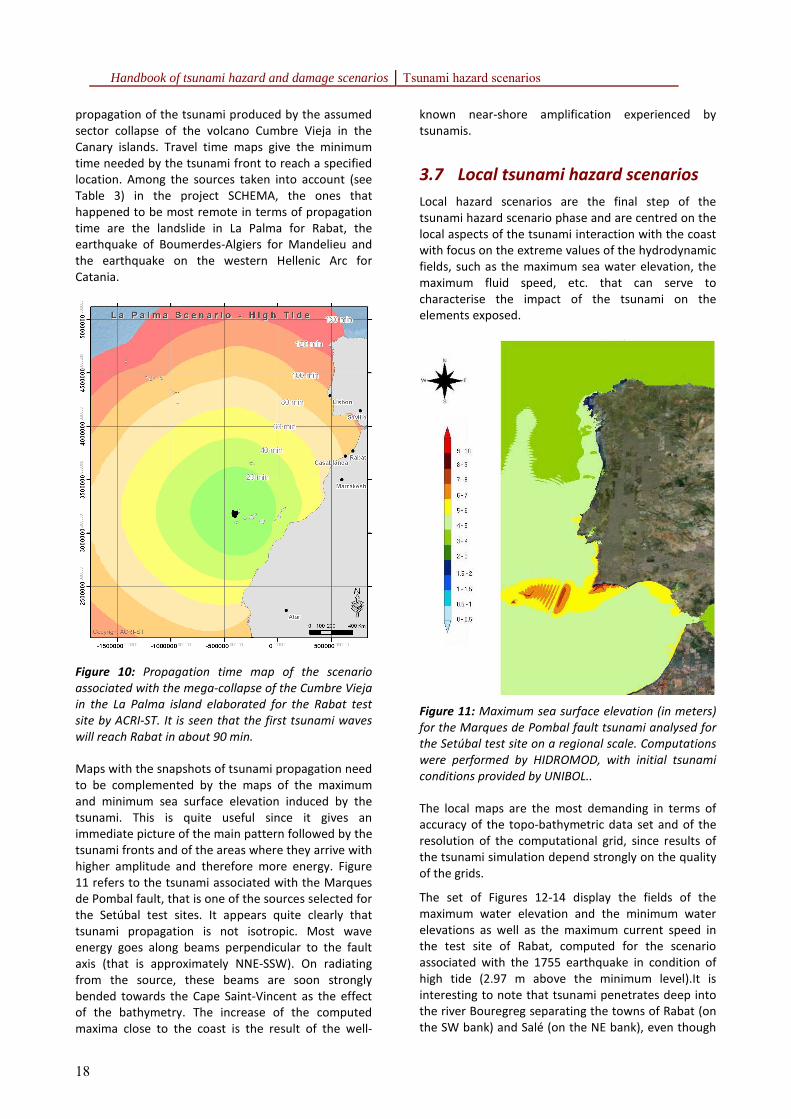
Maps with the snapshots of tsunami propagation need
to be complemented by the maps of the maximum
and minimum sea surface elevation induced by the
tsunami. This is quite useful since it gives an
immediate picture of the main pattern followed by the
tsunami fronts and of the areas where they arrive with
higher amplitude and therefore more energy. Figure
11 refers to the tsunami associated with the Marques
de Pombal fault, that is one of the sources selected for
the Setúbal test sites. It appears quite clearly that
tsunami propagation is not isotropic. Most wave
energy goes along beams perpendicular to the fault
axis (that is approximately NNE-SSW). On radiating
from the source, these beams are soon strongly
bended towards the Cape Saint-Vincent as the effect
of the bathymetry. The increase of the computed
maxima close to the coast is the result of the well-
known near-shore amplification experienced by
tsunamis.
3.7 Local tsunami hazard scenarios
Local hazard scenarios are the final step of the
tsunami hazard scenario phase and are centred on the
local aspects of the tsunami interaction with the coast
with focus on the extreme values of the hydrodynamic
fields, such as the maximum sea water elevation, the
maximum fluid speed, etc. that can serve to
characterise the impact of the tsunami on the
elements exposed.
Figure 11: Maximum sea surface elevation (in meters)
for the Marques de Pombal fault tsunami analysed for
the Setúbal test site on a regional scale. Computations
were performed by HIDROMOD, with initial tsunami
conditions provided by UNIBOL..
The local maps are the most demanding in terms of
accuracy of the topo-bathymetric data set and of the
resolution of the computational grid, since results of
the tsunami simulation depend strongly on the quality
of the grids.
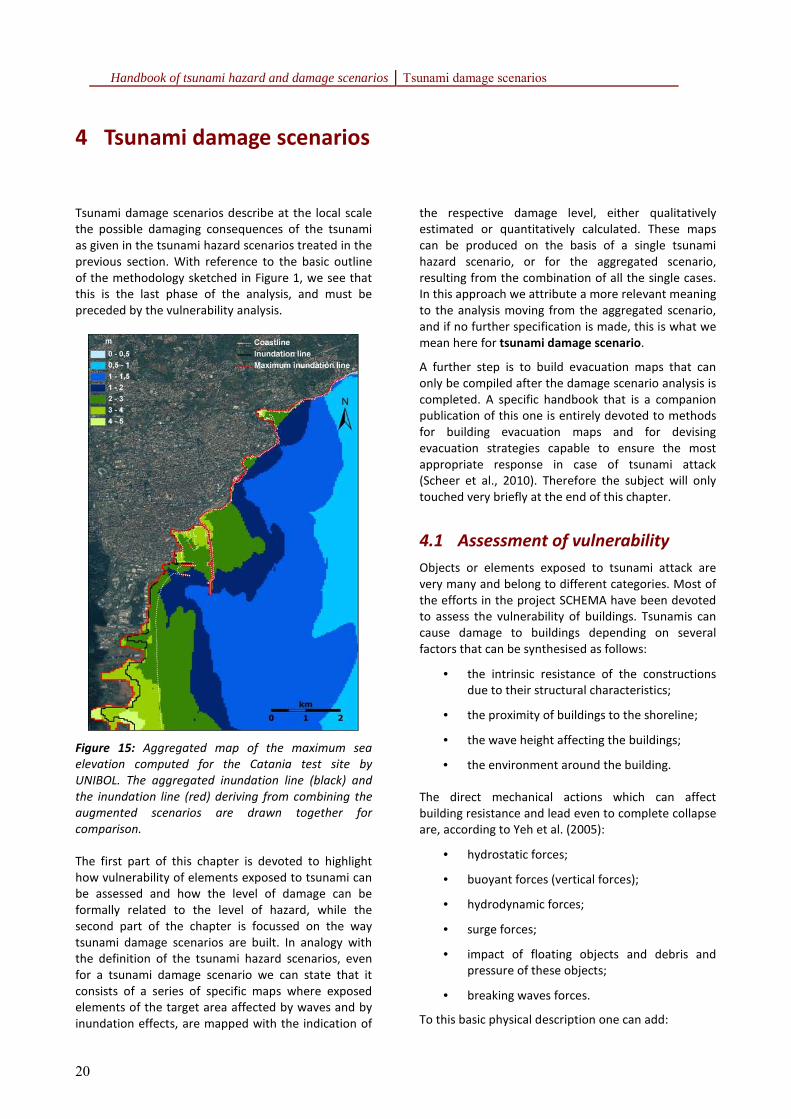
The set of Figures 12-14 display the fields of the
maximum water elevation and the minimum water
elevations as well as the maximum current speed in
the test site of Rabat, computed for the scenario
associated with the 1755 earthquake in condition of
high tide (2.97 m above the minimum level).It is
interesting to note that tsunami penetrates deep into
the river Bouregreg separating the towns of Rabat (on
the SW bank) and Salé (on the NE bank), even though
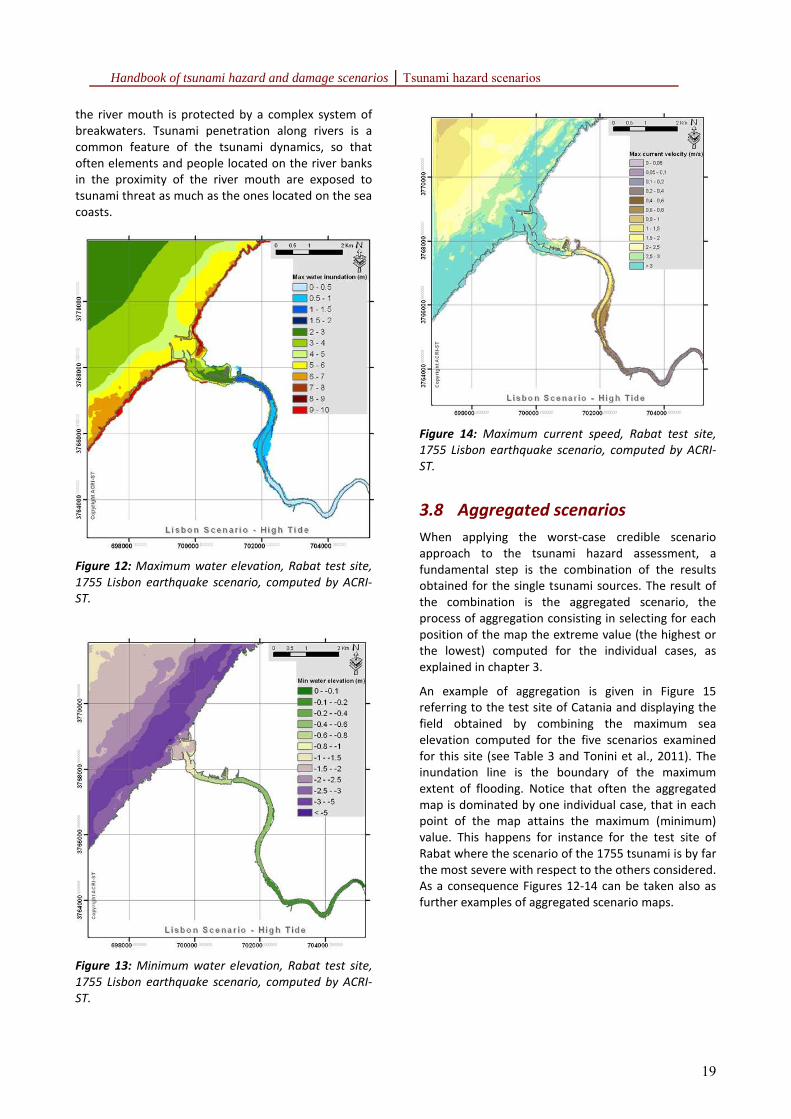
Handbook of tsunami hazard and damage scenarios Tsunami hazard scenarios
19
the river mouth is protected by a complex system of
breakwaters. Tsunami penetration along rivers is a
common feature of the tsunami dynamics, so that
often elements and people located on the river banks
in the proximity of the river mouth are exposed to
tsunami threat as much as the ones located on the sea
coasts.
Figure 12: Maximum water elevation, Rabat test site,
1755 Lisbon earthquake scenario, computed by ACRI-
ST.
Figure 13: Minimum water elevation, Rabat test site,
1755 Lisbon earthquake scenario, computed by ACRI-
ST.
Figure 14: Maximum current speed, Rabat test site,
1755 Lisbon earthquake scenario, computed by ACRI-
ST.
3.8 Aggregated scenarios
When applying the worst-case credible scenario
approach to the tsunami hazard assessment, a
fundamental step is the combination of the results
obtained for the single tsunami sources. The result of
the combination is the aggregated scenario, the
process of aggregation consisting in selecting for each
position of the map the extreme value (the highest or
the lowest) computed for the individual cases, as
explained in chapter 3.
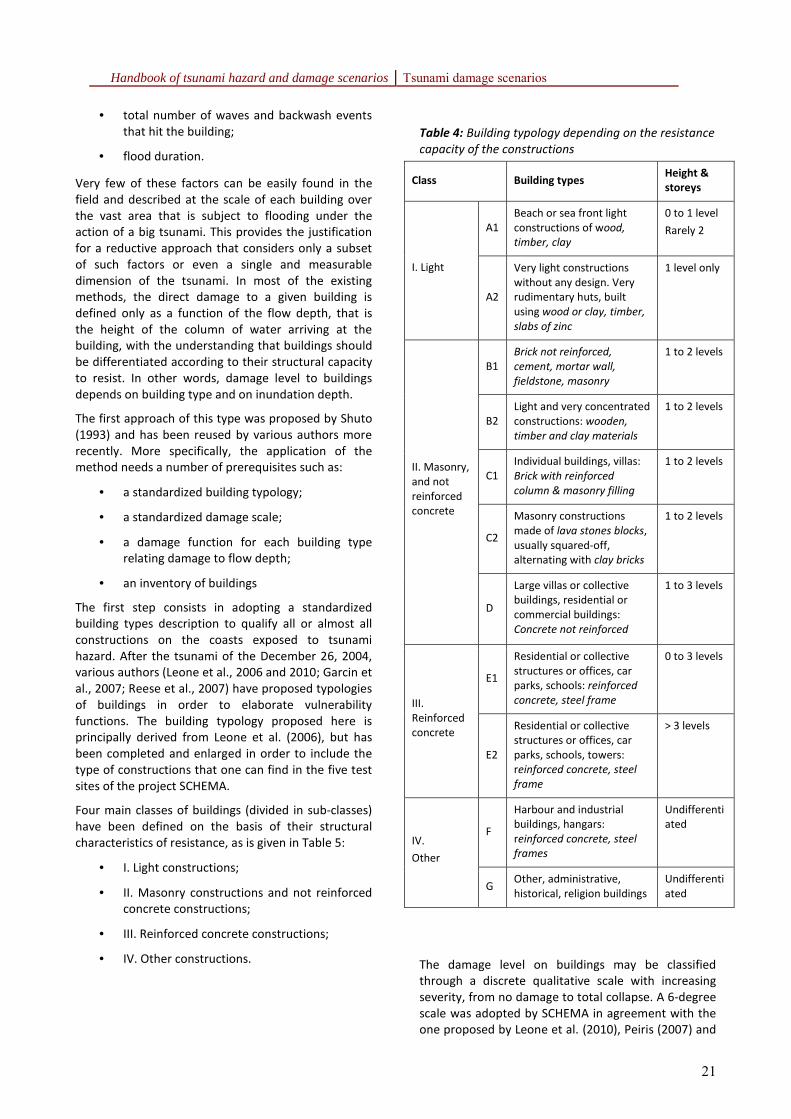
An example of aggregation is given in Figure 15
referring to the test site of Catania and displaying the
field obtained by combining the maximum sea
elevation computed for the five scenarios examined
for this site (see Table 3 and Tonini et al., 2011). The
inundation line is the boundary of the maximum
extent of flooding. Notice that often the aggregated
map is dominated by one individual case, that in each
point of the map attains the maximum (minimum)
value. This happens for instance for the test site of
Rabat where the scenario of the 1755 tsunami is by far
the most severe with respect to the others considered.
As a consequence Figures 12-14 can be taken also as
further examples of aggregated scenario maps.
Handbook of tsunami hazard and damage scenarios Tsunami damage scenarios
20
4 Tsunami damage scenarios
Tsunami damage scenarios describe at the local scale
the possible damaging consequences of the tsunami
as given in the tsunami hazard scenarios treated in the
previous section. With reference to the basic outline
of the methodology sketched in Figure 1, we see that
this is the last phase of the analysis, and must be
preceded by the vulnerability analysis.
Figure 15: Aggregated map of the maximum sea
elevation computed for the Catania test site by
UNIBOL. The aggregated inundation line (black) and
the inundation line (red) deriving from combining the
augmented scenarios are drawn together for
comparison.
The first part of this chapter is devoted to highlight
how vulnerability of elements exposed to tsunami can
be assessed and how the level of damage can be
formally related to the level of hazard, while the
second part of the chapter is focussed on the way
tsunami damage scenarios are built. In analogy with
the definition of the tsunami hazard scenarios, even
for a tsunami damage scenario we can state that it
consists of a series of specific maps where exposed
elements of the target area affected by waves and by
inundation effects, are mapped with the indication of
the respective damage level, either qualitatively
estimated or quantitatively calculated. These maps
can be produced on the basis of a single tsunami
hazard scenario, or for the aggregated scenario,
resulting from the combination of all the single cases.
In this approach we attribute a more relevant meaning
to the analysis moving from the aggregated scenario,
and if no further specification is made, this is what we
mean here for tsunami damage scenario.
A further step is to build evacuation maps that can
only be compiled after the damage scenario analysis is
completed. A specific handbook that is a companion
publication of this one is entirely devoted to methods
for building evacuation maps and for devising
evacuation strategies capable to ensure the most
appropriate response in case of tsunami attack
(Scheer et al., 2010). Therefore the subject will only
touched very briefly at the end of this chapter.
4.1 Assessment of vulnerability
Objects or elements exposed to tsunami attack are
very many and belong to different categories. Most of
the efforts in the project SCHEMA have been devoted
to assess the vulnerability of buildings. Tsunamis can
cause damage to buildings depending on several
factors that can be synthesised as follows:
• the intrinsic resistance of the constructions
due to their structural characteristics;
• the proximity of buildings to the shoreline;
• the wave height affecting the buildings;
• the environment around the building.
The direct mechanical actions which can affect
building resistance and lead even to complete collapse
are, according to Yeh et al. (2005):
• hydrostatic forces;
• buoyant forces (vertical forces);
• hydrodynamic forces;
• surge forces;
• impact of floating objects and debris and
pressure of these objects;
• breaking waves forces.
To this basic physical description one can add:
Handbook of tsunami hazard and damage scenarios Tsunami damage scenarios
21
• total number of waves and backwash events
that hit the building;
• flood duration.
Very few of these factors can be easily found in the
field and described at the scale of each building over
the vast area that is subject to flooding under the
action of a big tsunami. This provides the justification
for a reductive approach that considers only a subset
of such factors or even a single and measurable
dimension of the tsunami. In most of the existing
methods, the direct damage to a given building is
defined only as a function of the flow depth, that is
the height of the column of water arriving at the
building, with the understanding that buildings should
be differentiated according to their structural capacity
to resist. In other words, damage level to buildings
depends on building type and on inundation depth.
The first approach of this type was proposed by Shuto
(1993) and has been reused by various authors more
recently. More specifically, the application of the
method needs a number of prerequisites such as:
• a standardized building typology;
• a standardized damage scale;
• a damage function for each building type
relating damage to flow depth;
• an inventory of buildings
The first step consists in adopting a standardized
building types description to qualify all or almost all
constructions on the coasts exposed to tsunami
hazard. After the tsunami of the December 26, 2004,
various authors (Leone et al., 2006 and 2010; Garcin et
al., 2007; Reese et al., 2007) have proposed typologies
of buildings in order to elaborate vulnerability
functions. The building typology proposed here is
principally derived from Leone et al. (2006), but has
been completed and enlarged in order to include the
type of constructions that one can find in the five test
sites of the project SCHEMA.
Four main classes of buildings (divided in sub-classes)
have been defined on the basis of their structural
characteristics of resistance, as is given in Table 5:
• I. Light constructions;
• II. Masonry constructions and not reinforced
concrete constructions;
• III. Reinforced concrete constructions;
• IV. Other constructions.
Table 4: Building typology depending on the resistance
capacity of the constructions
Class Building types Height &
storeys
A1
Beach or sea front light
constructions of wood,
timber, clay
0 to 1 level
Rarely 2
I. Light
A2
Very light constructions
without any design. Very
rudimentary huts, built
using wood or clay, timber,
slabs of zinc
1 level only
B1
Brick not reinforced,
cement, mortar wall,
fieldstone, masonry
1 to 2 levels
B2
Light and very concentrated
constructions: wooden,
timber and clay materials
1 to 2 levels
C1
Individual buildings, villas:
Brick with reinforced
column & masonry filling
1 to 2 levels
C2
Masonry constructions
made of lava stones blocks,
usually squared-off,
alternating with clay bricks
1 to 2 levels
II. Masonry,
and not
reinforced
concrete
D
Large villas or collective
buildings, residential or
commercial buildings:
Concrete not reinforced
1 to 3 levels
E1
Residential or collective
structures or offices, car
parks, schools: reinforced
concrete, steel frame
0 to 3 levels
III.
Reinforced
concrete
E2
Residential or collective
structures or offices, car
parks, schools, towers:
reinforced concrete, steel
frame
> 3 levels
F
Harbour and industrial
buildings, hangars:
reinforced concrete, steel
frames
Undifferenti
ated
IV.
Other
G Other, administrative,
historical, religion buildings
Undifferenti
ated
The damage level on buildings may be classified
through a discrete qualitative scale with increasing
severity, from no damage to total collapse. A 6-degree
scale was adopted by SCHEMA in agreement with the
one proposed by Leone et al. (2010), Peiris (2007) and
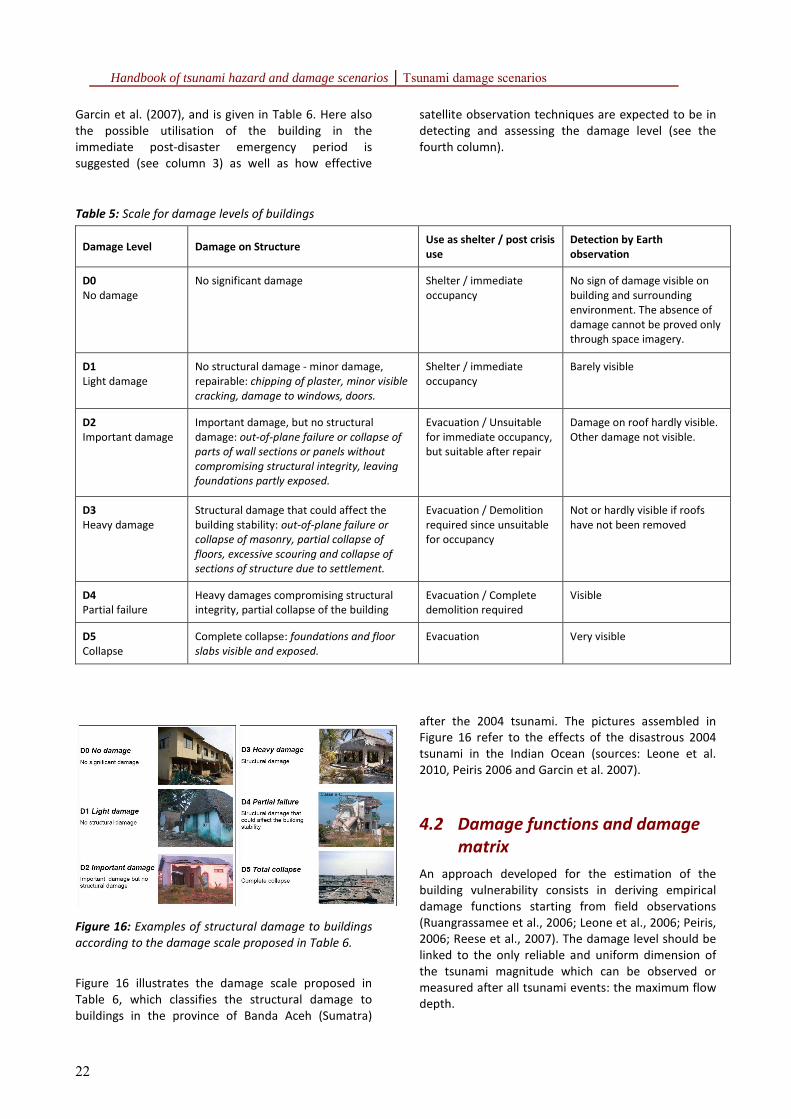
Handbook of tsunami hazard and damage scenarios Tsunami damage scenarios
22
Garcin et al. (2007), and is given in Table 6. Here also
the possible utilisation of the building in the
immediate post-disaster emergency period is
suggested (see column 3) as well as how effective
satellite observation techniques are expected to be in
detecting and assessing the damage level (see the
fourth column).
Table 5: Scale for damage levels of buildings
Damage Level Damage on Structure Use as shelter / post crisis
use
Detection by Earth
observation
D0
No damage
No significant damage Shelter / immediate
occupancy
No sign of damage visible on
building and surrounding
environment. The absence of
damage cannot be proved only
through space imagery.
D1
Light damage
No structural damage - minor damage,
repairable: chipping of plaster, minor visible
cracking, damage to windows, doors.
Shelter / immediate
occupancy
Barely visible
D2
Important damage
Important damage, but no structural
damage: out-of-plane failure or collapse of
parts of wall sections or panels without
compromising structural integrity, leaving
foundations partly exposed.
Evacuation / Unsuitable
for immediate occupancy,
but suitable after repair
Damage on roof hardly visible.
Other damage not visible.
D3
Heavy damage
Structural damage that could affect the
building stability: out-of-plane failure or
collapse of masonry, partial collapse of
floors, excessive scouring and collapse of
sections of structure due to settlement.
Evacuation / Demolition
required since unsuitable
for occupancy
Not or hardly visible if roofs
have not been removed
D4
Partial failure
Heavy damages compromising structural
integrity, partial collapse of the building
Evacuation / Complete
demolition required
Visible
D5
Collapse
Complete collapse: foundations and floor
slabs visible and exposed.
Evacuation Very visible
Figure 16: Examples of structural damage to buildings
according to the damage scale proposed in Table 6.
Figure 16 illustrates the damage scale proposed in
Table 6, which classifies the structural damage to
buildings in the province of Banda Aceh (Sumatra)
after the 2004 tsunami. The pictures assembled in
Figure 16 refer to the effects of the disastrous 2004
tsunami in the Indian Ocean (sources: Leone et al.
2010, Peiris 2006 and Garcin et al. 2007).
4.2 Damage functions and damage
matrix
An approach developed for the estimation of the
building vulnerability consists in deriving empirical
damage functions starting from field observations
(Ruangrassamee et al., 2006; Leone et al., 2006; Peiris,
2006; Reese et al., 2007). The damage level should be
linked to the only reliable and uniform dimension of
the tsunami magnitude which can be observed or
measured after all tsunami events: the maximum flow
depth.
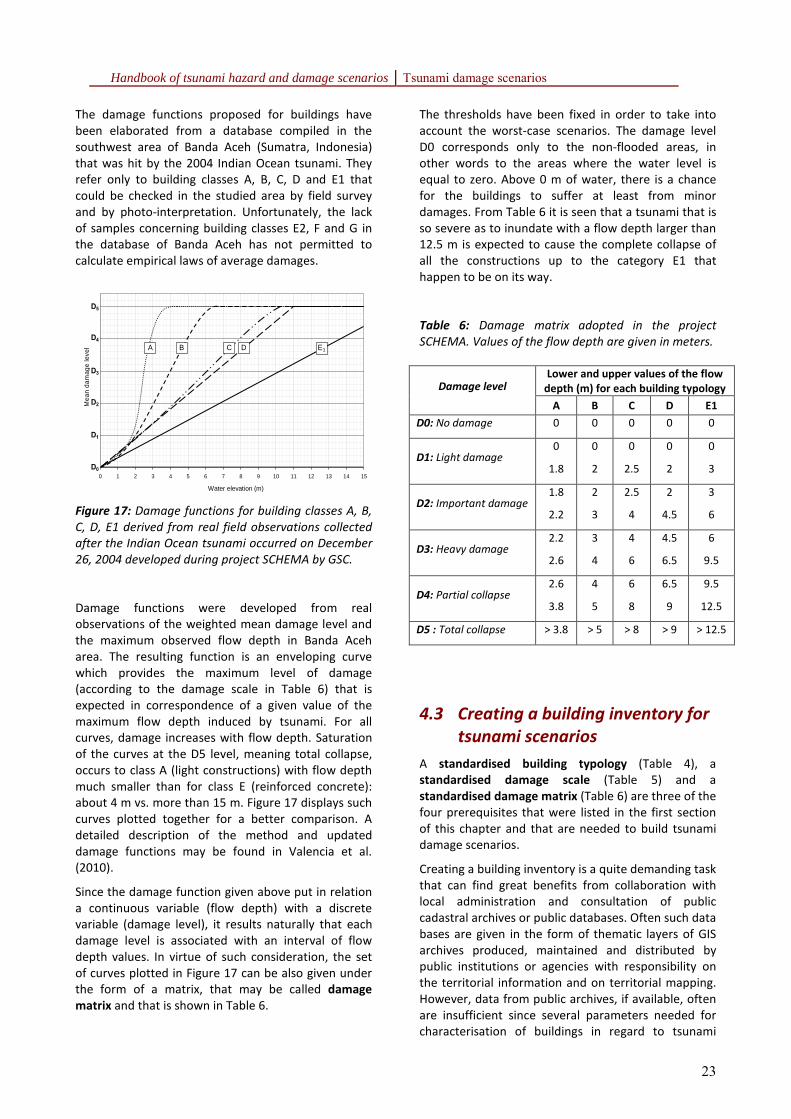
Handbook of tsunami hazard and damage scenarios Tsunami damage scenarios
23
The damage functions proposed for buildings have
been elaborated from a database compiled in the
southwest area of Banda Aceh (Sumatra, Indonesia)
that was hit by the 2004 Indian Ocean tsunami. They
refer only to building classes A, B, C, D and E1 that
could be checked in the studied area by field survey
and by photo-interpretation. Unfortunately, the lack
of samples concerning building classes E2, F and G in
the database of Banda Aceh has not permitted to
calculate empirical laws of average damages.
0
1
2
3
4
5
0 1 2 3 4 5 6 7 8 9 10 11 12 13 14 15
Mea
n da
mag
e le
vel
Water elevation (m)
D0
D1
D2
D3
D4
D5
A E1B C D
Figure 17: Damage functions for building classes A, B,
C, D, E1 derived from real field observations collected
after the Indian Ocean tsunami occurred on December
26, 2004 developed during project SCHEMA by GSC.
Damage functions were developed from real
observations of the weighted mean damage level and
the maximum observed flow depth in Banda Aceh
area. The resulting function is an enveloping curve
which provides the maximum level of damage
(according to the damage scale in Table 6) that is
expected in correspondence of a given value of the
maximum flow depth induced by tsunami. For all
curves, damage increases with flow depth. Saturation
of the curves at the D5 level, meaning total collapse,
occurs to class A (light constructions) with flow depth
much smaller than for class E (reinforced concrete):
about 4 m vs. more than 15 m. Figure 17 displays such
curves plotted together for a better comparison. A
detailed description of the method and updated
damage functions may be found in Valencia et al.
(2010).
Since the damage function given above put in relation
a continuous variable (flow depth) with a discrete
variable (damage level), it results naturally that each
damage level is associated with an interval of flow
depth values. In virtue of such consideration, the set
of curves plotted in Figure 17 can be also given under
the form of a matrix, that may be called damage
matrix and that is shown in Table 6.
The thresholds have been fixed in order to take into
account the worst-case scenarios. The damage level
D0 corresponds only to the non-flooded areas, in
other words to the areas where the water level is
equal to zero. Above 0 m of water, there is a chance
for the buildings to suffer at least from minor
damages. From Table 6 it is seen that a tsunami that is
so severe as to inundate with a flow depth larger than
12.5 m is expected to cause the complete collapse of
all the constructions up to the category E1 that
happen to be on its way.
Table 6: Damage matrix adopted in the project
SCHEMA. Values of the flow depth are given in meters.
Lower and upper values of the flow
depth (m) for each building typology Damage level
A B C D E1
D0: No damage 0 0 0 0 0
D1: Light damage 0
1.8
0
2
0
2.5
0
2
0
3
D2: Important damage
1.8
2.2
2
3
2.5
4
2
4.5
3
6
D3: Heavy damage 2.2
2.6
3
4
4
6
4.5
6.5
6
9.5
D4: Partial collapse 2.6
3.8
4
5
6
8
6.5
9
9.5
12.5
D5 : Total collapse > 3.8 > 5 > 8 > 9 > 12.5
4.3 Creating a building inventory for
tsunami scenarios
A standardised building typology (Table 4), a
standardised damage scale (Table 5) and a
standardised damage matrix (Table 6) are three of the
four prerequisites that were listed in the first section
of this chapter and that are needed to build tsunami
damage scenarios.
Creating a building inventory is a quite demanding task
that can find great benefits from collaboration with
local administration and consultation of public
cadastral archives or public databases. Often such data
bases are given in the form of thematic layers of GIS
archives produced, maintained and distributed by
public institutions or agencies with responsibility on
the territorial information and on territorial mapping.
However, data from public archives, if available, often
are insufficient since several parameters needed for
characterisation of buildings in regard to tsunami
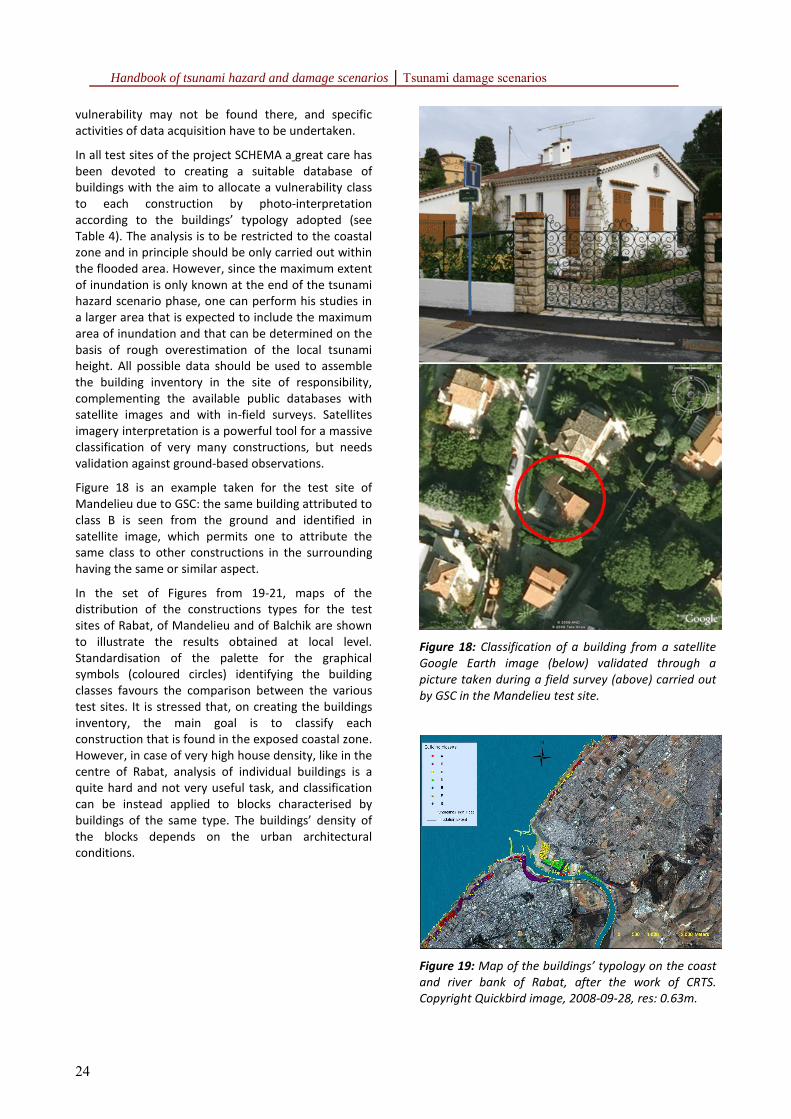
Handbook of tsunami hazard and damage scenarios Tsunami damage scenarios
24
vulnerability may not be found there, and specific
activities of data acquisition have to be undertaken.
In all test sites of the project SCHEMA a great care has
been devoted to creating a suitable database of
buildings with the aim to allocate a vulnerability class
to each construction by photo-interpretation
according to the buildings’ typology adopted (see
Table 4). The analysis is to be restricted to the coastal
zone and in principle should be only carried out within
the flooded area. However, since the maximum extent
of inundation is only known at the end of the tsunami
hazard scenario phase, one can perform his studies in
a larger area that is expected to include the maximum
area of inundation and that can be determined on the
basis of rough overestimation of the local tsunami
height. All possible data should be used to assemble
the building inventory in the site of responsibility,
complementing the available public databases with
satellite images and with in-field surveys. Satellites
imagery interpretation is a powerful tool for a massive
classification of very many constructions, but needs
validation against ground-based observations.
Figure 18 is an example taken for the test site of
Mandelieu due to GSC: the same building attributed to
class B is seen from the ground and identified in
satellite image, which permits one to attribute the
same class to other constructions in the surrounding
having the same or similar aspect.
In the set of Figures from 19-21, maps of the
distribution of the constructions types for the test
sites of Rabat, of Mandelieu and of Balchik are shown
to illustrate the results obtained at local level.
Standardisation of the palette for the graphical
symbols (coloured circles) identifying the building
classes favours the comparison between the various
test sites. It is stressed that, on creating the buildings
inventory, the main goal is to classify each
construction that is found in the exposed coastal zone.
However, in case of very high house density, like in the
centre of Rabat, analysis of individual buildings is a
quite hard and not very useful task, and classification
can be instead applied to blocks characterised by
buildings of the same type. The buildings’ density of
the blocks depends on the urban architectural
conditions.
Figure 18: Classification of a building from a satellite
Google Earth image (below) validated through a
picture taken during a field survey (above) carried out
by GSC in the Mandelieu test site.
Figure 19: Map of the buildings’ typology on the coast
and river bank of Rabat, after the work of CRTS.
Copyright Quickbird image, 2008-09-28, res: 0.63m.
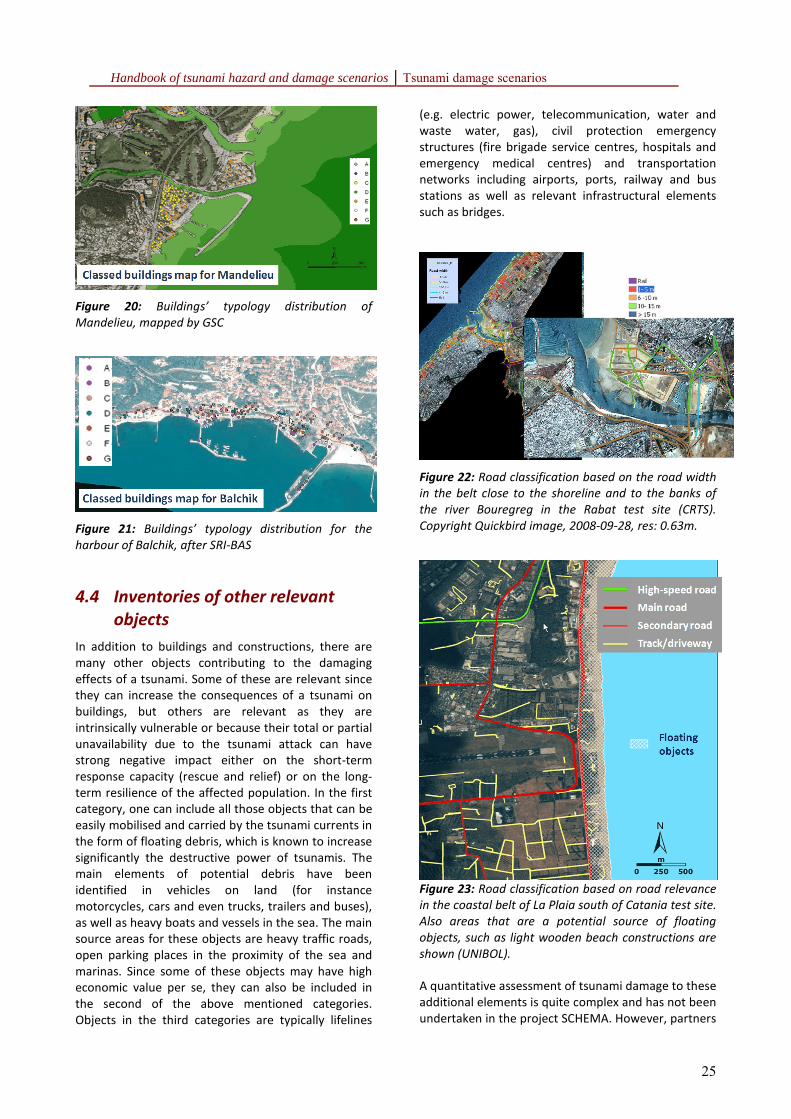
Handbook of tsunami hazard and damage scenarios Tsunami damage scenarios
25
Figure 20: Buildings’ typology distribution of
Mandelieu, mapped by GSC
Figure 21: Buildings’ typology distribution for the
harbour of Balchik, after SRI-BAS
4.4 Inventories of other relevant
objects
In addition to buildings and constructions, there are
many other objects contributing to the damaging
effects of a tsunami. Some of these are relevant since
they can increase the consequences of a tsunami on
buildings, but others are relevant as they are
intrinsically vulnerable or because their total or partial
unavailability due to the tsunami attack can have
strong negative impact either on the short-term
response capacity (rescue and relief) or on the long-
term resilience of the affected population. In the first
category, one can include all those objects that can be
easily mobilised and carried by the tsunami currents in
the form of floating debris, which is known to increase
significantly the destructive power of tsunamis. The
main elements of potential debris have been
identified in vehicles on land (for instance
motorcycles, cars and even trucks, trailers and buses),
as well as heavy boats and vessels in the sea. The main
source areas for these objects are heavy traffic roads,
open parking places in the proximity of the sea and
marinas. Since some of these objects may have high
economic value per se, they can also be included in
the second of the above mentioned categories.
Objects in the third categories are typically lifelines
(e.g. electric power, telecommunication, water and
waste water, gas), civil protection emergency
structures (fire brigade service centres, hospitals and
emergency medical centres) and transportation
networks including airports, ports, railway and bus
stations as well as relevant infrastructural elements
such as bridges.
Figure 22: Road classification based on the road width
in the belt close to the shoreline and to the banks of
the river Bouregreg in the Rabat test site (CRTS).
Copyright Quickbird image, 2008-09-28, res: 0.63m.
Figure 23: Road classification based on road relevance
in the coastal belt of La Plaia south of Catania test site.
Also areas that are a potential source of floating
objects, such as light wooden beach constructions are
shown (UNIBOL).
A quantitative assessment of tsunami damage to these
additional elements is quite complex and has not been
undertaken in the project SCHEMA. However, partners
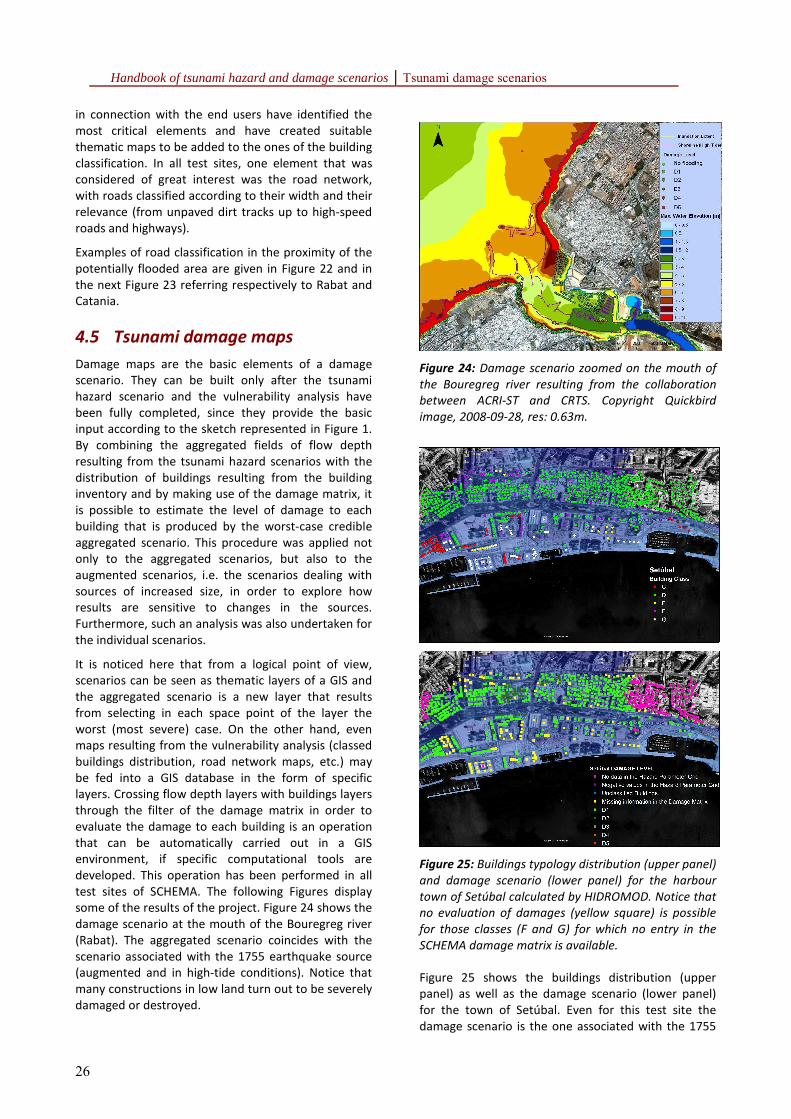
Handbook of tsunami hazard and damage scenarios Tsunami damage scenarios
26
in connection with the end users have identified the
most critical elements and have created suitable
thematic maps to be added to the ones of the building
classification. In all test sites, one element that was
considered of great interest was the road network,
with roads classified according to their width and their
relevance (from unpaved dirt tracks up to high-speed
roads and highways).
Examples of road classification in the proximity of the
potentially flooded area are given in Figure 22 and in
the next Figure 23 referring respectively to Rabat and
Catania.
4.5 Tsunami damage maps
Damage maps are the basic elements of a damage
scenario. They can be built only after the tsunami
hazard scenario and the vulnerability analysis have
been fully completed, since they provide the basic
input according to the sketch represented in Figure 1.
By combining the aggregated fields of flow depth
resulting from the tsunami hazard scenarios with the
distribution of buildings resulting from the building
inventory and by making use of the damage matrix, it
is possible to estimate the level of damage to each
building that is produced by the worst-case credible
aggregated scenario. This procedure was applied not
only to the aggregated scenarios, but also to the
augmented scenarios, i.e. the scenarios dealing with
sources of increased size, in order to explore how
results are sensitive to changes in the sources.
Furthermore, such an analysis was also undertaken for
the individual scenarios.
It is noticed here that from a logical point of view,
scenarios can be seen as thematic layers of a GIS and
the aggregated scenario is a new layer that results
from selecting in each space point of the layer the
worst (most severe) case. On the other hand, even
maps resulting from the vulnerability analysis (classed
buildings distribution, road network maps, etc.) may
be fed into a GIS database in the form of specific
layers. Crossing flow depth layers with buildings layers
through the filter of the damage matrix in order to
evaluate the damage to each building is an operation
that can be automatically carried out in a GIS
environment, if specific computational tools are
developed. This operation has been performed in all
test sites of SCHEMA. The following Figures display
some of the results of the project. Figure 24 shows the
damage scenario at the mouth of the Bouregreg river
(Rabat). The aggregated scenario coincides with the
scenario associated with the 1755 earthquake source
(augmented and in high-tide conditions). Notice that
many constructions in low land turn out to be severely
damaged or destroyed.
Figure 24: Damage scenario zoomed on the mouth of
the Bouregreg river resulting from the collaboration
between ACRI-ST and CRTS. Copyright Quickbird
image, 2008-09-28, res: 0.63m.
Figure 25: Buildings typology distribution (upper panel)
and damage scenario (lower panel) for the harbour
town of Setúbal calculated by HIDROMOD. Notice that
no evaluation of damages (yellow square) is possible
for those classes (F and G) for which no entry in the
SCHEMA damage matrix is available.
Figure 25 shows the buildings distribution (upper
panel) as well as the damage scenario (lower panel)
for the town of Setúbal. Even for this test site the
damage scenario is the one associated with the 1755
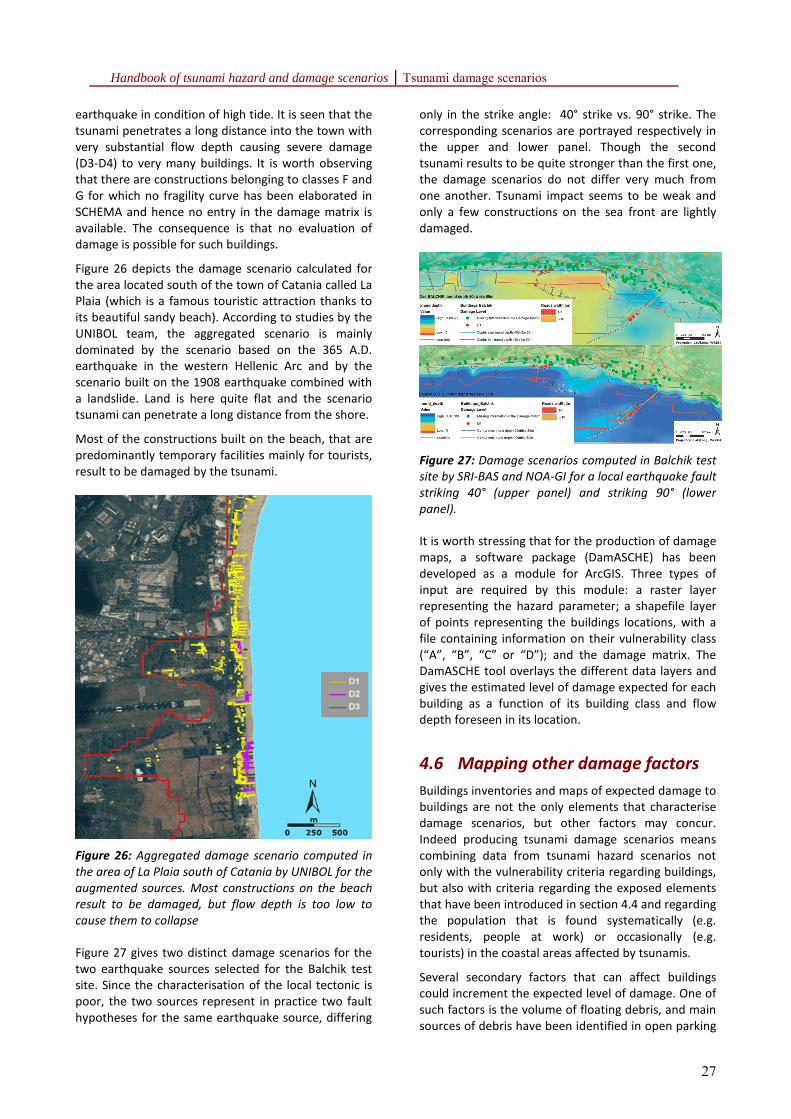
Handbook of tsunami hazard and damage scenarios Tsunami damage scenarios
27
earthquake in condition of high tide. It is seen that the
tsunami penetrates a long distance into the town with
very substantial flow depth causing severe damage
(D3-D4) to very many buildings. It is worth observing
that there are constructions belonging to classes F and
G for which no fragility curve has been elaborated in
SCHEMA and hence no entry in the damage matrix is
available. The consequence is that no evaluation of
damage is possible for such buildings.
Figure 26 depicts the damage scenario calculated for
the area located south of the town of Catania called La
Plaia (which is a famous touristic attraction thanks to
its beautiful sandy beach). According to studies by the
UNIBOL team, the aggregated scenario is mainly
dominated by the scenario based on the 365 A.D.
earthquake in the western Hellenic Arc and by the
scenario built on the 1908 earthquake combined with
a landslide. Land is here quite flat and the scenario
tsunami can penetrate a long distance from the shore.
Most of the constructions built on the beach, that are
predominantly temporary facilities mainly for tourists,
result to be damaged by the tsunami.
Figure 26: Aggregated damage scenario computed in
the area of La Plaia south of Catania by UNIBOL for the
augmented sources. Most constructions on the beach
result to be damaged, but flow depth is too low to
cause them to collapse
Figure 27 gives two distinct damage scenarios for the
two earthquake sources selected for the Balchik test
site. Since the characterisation of the local tectonic is
poor, the two sources represent in practice two fault
hypotheses for the same earthquake source, differing
only in the strike angle: 40° strike vs. 90° strike. The
corresponding scenarios are portrayed respectively in
the upper and lower panel. Though the second
tsunami results to be quite stronger than the first one,
the damage scenarios do not differ very much from
one another. Tsunami impact seems to be weak and
only a few constructions on the sea front are lightly
damaged.
Figure 27: Damage scenarios computed in Balchik test
site by SRI-BAS and NOA-GI for a local earthquake fault
striking 40° (upper panel) and striking 90° (lower
panel).
It is worth stressing that for the production of damage
maps, a software package (DamASCHE) has been
developed as a module for ArcGIS. Three types of
input are required by this module: a raster layer
representing the hazard parameter; a shapefile layer
of points representing the buildings locations, with a
file containing information on their vulnerability class
(“A”, “B”, “C” or “D”); and the damage matrix. The
DamASCHE tool overlays the different data layers and
gives the estimated level of damage expected for each
building as a function of its building class and flow
depth foreseen in its location.
4.6 Mapping other damage factors
Buildings inventories and maps of expected damage to
buildings are not the only elements that characterise
damage scenarios, but other factors may concur.
Indeed producing tsunami damage scenarios means
combining data from tsunami hazard scenarios not
only with the vulnerability criteria regarding buildings,
but also with criteria regarding the exposed elements
that have been introduced in section 4.4 and regarding
the population that is found systematically (e.g.
residents, people at work) or occasionally (e.g.
tourists) in the coastal areas affected by tsunamis.
Several secondary factors that can affect buildings
could increment the expected level of damage. One of
such factors is the volume of floating debris, and main
sources of debris have been identified in open parking
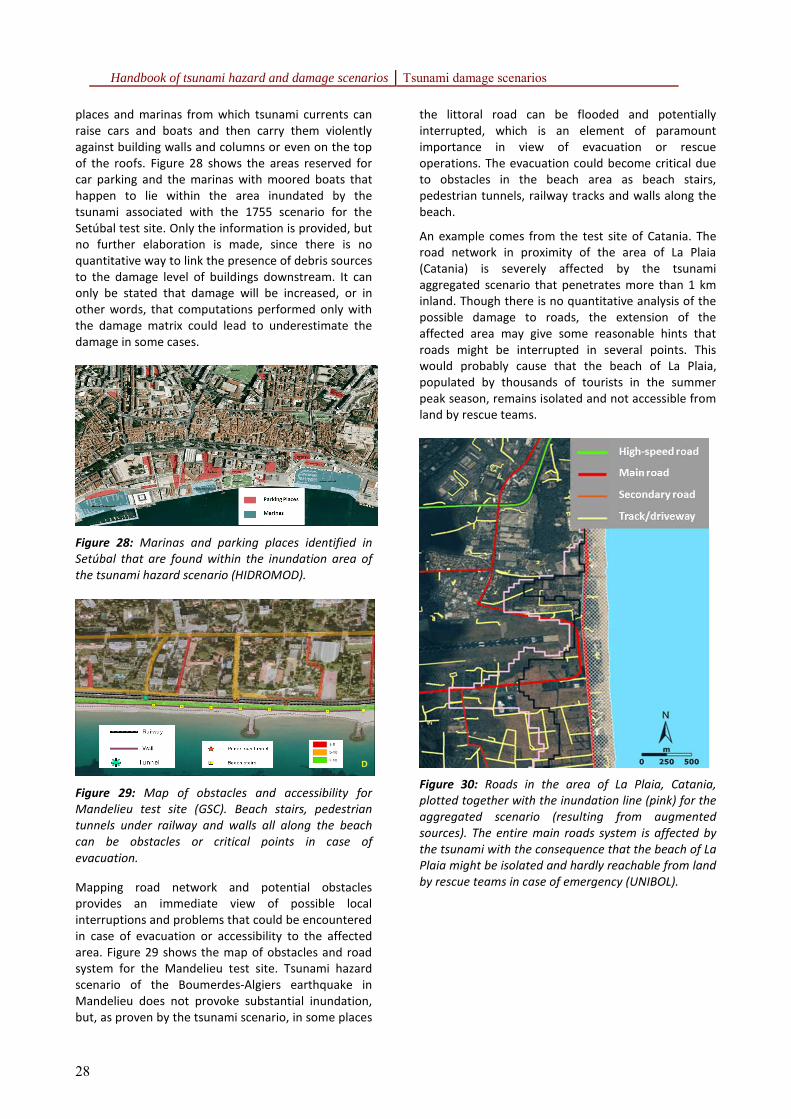
Handbook of tsunami hazard and damage scenarios Tsunami damage scenarios
28
places and marinas from which tsunami currents can
raise cars and boats and then carry them violently
against building walls and columns or even on the top
of the roofs. Figure 28 shows the areas reserved for
car parking and the marinas with moored boats that
happen to lie within the area inundated by the
tsunami associated with the 1755 scenario for the
Setúbal test site. Only the information is provided, but
no further elaboration is made, since there is no
quantitative way to link the presence of debris sources
to the damage level of buildings downstream. It can
only be stated that damage will be increased, or in
other words, that computations performed only with
the damage matrix could lead to underestimate the
damage in some cases.
Figure 28: Marinas and parking places identified in
Setúbal that are found within the inundation area of
the tsunami hazard scenario (HIDROMOD).
Figure 29: Map of obstacles and accessibility for
Mandelieu test site (GSC). Beach stairs, pedestrian
tunnels under railway and walls all along the beach
can be obstacles or critical points in case of
evacuation.
Mapping road network and potential obstacles
provides an immediate view of possible local
interruptions and problems that could be encountered
in case of evacuation or accessibility to the affected
area. Figure 29 shows the map of obstacles and road
system for the Mandelieu test site. Tsunami hazard
scenario of the Boumerdes-Algiers earthquake in
Mandelieu does not provoke substantial inundation,
but, as proven by the tsunami scenario, in some places
the littoral road can be flooded and potentially
interrupted, which is an element of paramount
importance in view of evacuation or rescue
operations. The evacuation could become critical due
to obstacles in the beach area as beach stairs,
pedestrian tunnels, railway tracks and walls along the
beach.
An example comes from the test site of Catania. The
road network in proximity of the area of La Plaia
(Catania) is severely affected by the tsunami
aggregated scenario that penetrates more than 1 km
inland. Though there is no quantitative analysis of the
possible damage to roads, the extension of the
affected area may give some reasonable hints that
roads might be interrupted in several points. This
would probably cause that the beach of La Plaia,
populated by thousands of tourists in the summer
peak season, remains isolated and not accessible from
land by rescue teams.
Figure 30: Roads in the area of La Plaia, Catania,
plotted together with the inundation line (pink) for the
aggregated scenario (resulting from augmented
sources). The entire main roads system is affected by
the tsunami with the consequence that the beach of La
Plaia might be isolated and hardly reachable from land
by rescue teams in case of emergency (UNIBOL).
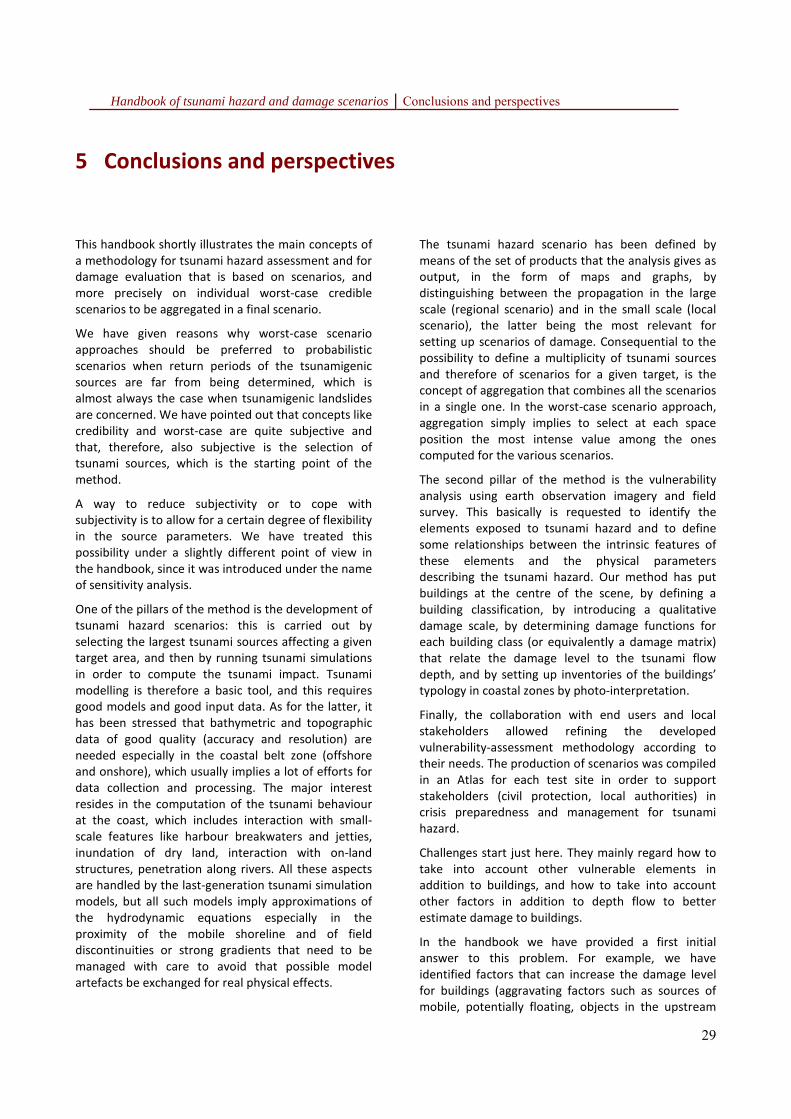
Handbook of tsunami hazard and damage scenarios Conclusions and perspectives
29
5 Conclusions and perspectives
This handbook shortly illustrates the main concepts of
a methodology for tsunami hazard assessment and for
damage evaluation that is based on scenarios, and
more precisely on individual worst-case credible
scenarios to be aggregated in a final scenario.
We have given reasons why worst-case scenario
approaches should be preferred to probabilistic
scenarios when return periods of the tsunamigenic
sources are far from being determined, which is
almost always the case when tsunamigenic landslides
are concerned. We have pointed out that concepts like
credibility and worst-case are quite subjective and
that, therefore, also subjective is the selection of
tsunami sources, which is the starting point of the
method.
A way to reduce subjectivity or to cope with
subjectivity is to allow for a certain degree of flexibility
in the source parameters. We have treated this
possibility under a slightly different point of view in
the handbook, since it was introduced under the name
of sensitivity analysis.
One of the pillars of the method is the development of
tsunami hazard scenarios: this is carried out by
selecting the largest tsunami sources affecting a given
target area, and then by running tsunami simulations
in order to compute the tsunami impact. Tsunami
modelling is therefore a basic tool, and this requires
good models and good input data. As for the latter, it
has been stressed that bathymetric and topographic
data of good quality (accuracy and resolution) are
needed especially in the coastal belt zone (offshore
and onshore), which usually implies a lot of efforts for
data collection and processing. The major interest
resides in the computation of the tsunami behaviour
at the coast, which includes interaction with small-
scale features like harbour breakwaters and jetties,
inundation of dry land, interaction with on-land
structures, penetration along rivers. All these aspects
are handled by the last-generation tsunami simulation
models, but all such models imply approximations of
the hydrodynamic equations especially in the
proximity of the mobile shoreline and of field
discontinuities or strong gradients that need to be
managed with care to avoid that possible model
artefacts be exchanged for real physical effects.
The tsunami hazard scenario has been defined by
means of the set of products that the analysis gives as
output, in the form of maps and graphs, by
distinguishing between the propagation in the large
scale (regional scenario) and in the small scale (local
scenario), the latter being the most relevant for
setting up scenarios of damage. Consequential to the
possibility to define a multiplicity of tsunami sources
and therefore of scenarios for a given target, is the
concept of aggregation that combines all the scenarios
in a single one. In the worst-case scenario approach,
aggregation simply implies to select at each space
position the most intense value among the ones
computed for the various scenarios.
The second pillar of the method is the vulnerability
analysis using earth observation imagery and field
survey. This basically is requested to identify the
elements exposed to tsunami hazard and to define
some relationships between the intrinsic features of
these elements and the physical parameters
describing the tsunami hazard. Our method has put
buildings at the centre of the scene, by defining a
building classification, by introducing a qualitative
damage scale, by determining damage functions for
each building class (or equivalently a damage matrix)
that relate the damage level to the tsunami flow
depth, and by setting up inventories of the buildings’
typology in coastal zones by photo-interpretation.
Finally, the collaboration with end users and local
stakeholders allowed refining the developed
vulnerability-assessment methodology according to
their needs. The production of scenarios was compiled
in an Atlas for each test site in order to support
stakeholders (civil protection, local authorities) in
crisis preparedness and management for tsunami
hazard.
Challenges start just here. They mainly regard how to
take into account other vulnerable elements in
addition to buildings, and how to take into account
other factors in addition to depth flow to better
estimate damage to buildings.
In the handbook we have provided a first initial
answer to this problem. For example, we have
identified factors that can increase the damage level
for buildings (aggravating factors such as sources of
mobile, potentially floating, objects in the upstream
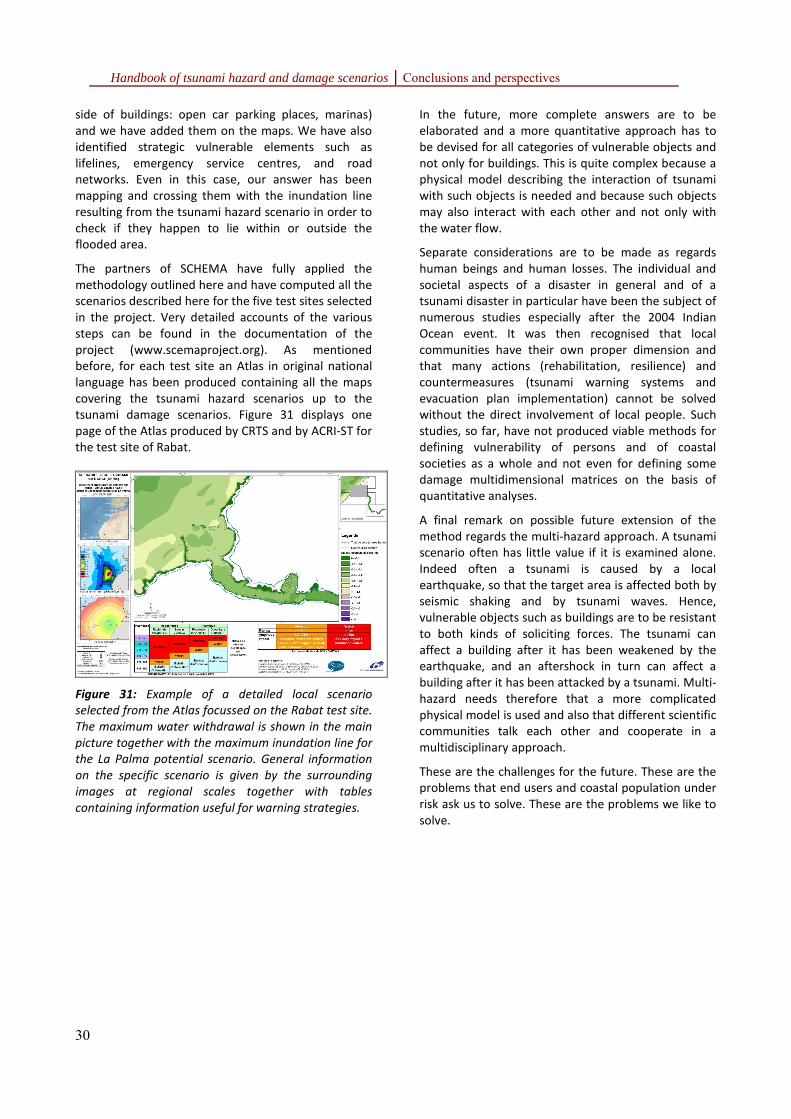
Handbook of tsunami hazard and damage scenarios Conclusions and perspectives
30
side of buildings: open car parking places, marinas)
and we have added them on the maps. We have also
identified strategic vulnerable elements such as
lifelines, emergency service centres, and road
networks. Even in this case, our answer has been
mapping and crossing them with the inundation line
resulting from the tsunami hazard scenario in order to
check if they happen to lie within or outside the
flooded area.
The partners of SCHEMA have fully applied the
methodology outlined here and have computed all the
scenarios described here for the five test sites selected
in the project. Very detailed accounts of the various
steps can be found in the documentation of the
project (www.scemaproject.org). As mentioned
before, for each test site an Atlas in original national
language has been produced containing all the maps
covering the tsunami hazard scenarios up to the
tsunami damage scenarios. Figure 31 displays one
page of the Atlas produced by CRTS and by ACRI-ST for
the test site of Rabat.
Figure 31: Example of a detailed local scenario
selected from the Atlas focussed on the Rabat test site.
The maximum water withdrawal is shown in the main
picture together with the maximum inundation line for
the La Palma potential scenario. General information
on the specific scenario is given by the surrounding
images at regional scales together with tables
containing information useful for warning strategies.
In the future, more complete answers are to be
elaborated and a more quantitative approach has to
be devised for all categories of vulnerable objects and
not only for buildings. This is quite complex because a
physical model describing the interaction of tsunami
with such objects is needed and because such objects
may also interact with each other and not only with
the water flow.
Separate considerations are to be made as regards
human beings and human losses. The individual and
societal aspects of a disaster in general and of a
tsunami disaster in particular have been the subject of
numerous studies especially after the 2004 Indian
Ocean event. It was then recognised that local
communities have their own proper dimension and
that many actions (rehabilitation, resilience) and
countermeasures (tsunami warning systems and
evacuation plan implementation) cannot be solved
without the direct involvement of local people. Such
studies, so far, have not produced viable methods for
defining vulnerability of persons and of coastal
societies as a whole and not even for defining some
damage multidimensional matrices on the basis of
quantitative analyses.
A final remark on possible future extension of the
method regards the multi-hazard approach. A tsunami
scenario often has little value if it is examined alone.
Indeed often a tsunami is caused by a local
earthquake, so that the target area is affected both by
seismic shaking and by tsunami waves. Hence,
vulnerable objects such as buildings are to be resistant
to both kinds of soliciting forces. The tsunami can
affect a building after it has been weakened by the
earthquake, and an aftershock in turn can affect a
building after it has been attacked by a tsunami. Multi-
hazard needs therefore that a more complicated
physical model is used and also that different scientific
communities talk each other and cooperate in a
multidisciplinary approach.
These are the challenges for the future. These are the
problems that end users and coastal population under
risk ask us to solve. These are the problems we like to
solve.
Handbook of tsunami hazard and damage scenarios References
31
References
Argnani A. and Bonazzi C., 2005. Malta Escarpment
fault zone offshore eastern Sicily: Pliocene-Quaternary
tectonic evolution based on new multichannel seismic
data. Tectonics, 24, TC4009, doi:10.1029/
2004TC001656.
Armigliato A., Tinti S., Argnani A., Zaniboni F. and
Pagnoni G., 2007. Tsunamigenic potential of recently
mapped submarine mass movements offshore eastern
Sicily (Italy): numerical simulations and implications
for the 1693 tsunami. IUGG XXIV General Assembly,
Perugia (Italy), July 2-13 2007, Abstract JSS002-1811.
Assier-Rzadkiewicz S., Heinrich P., Sabatier P. C.,
Savoye B. and Bourillet J. F., 2000. Numerical
Modelling of a Landslide-generated Tsunami: The 1979
Nice Event. Pure and Applied Geophysics, 157, 1707-
1727.
Baptista M. A., Miranda J. M., Chierici F. and Zitellini
N., 2003. New study of the 1755 earthquake source
based on multi-channel seismic survey data and
tsunami modeling. Natural Hazards and Earth System
Sciences, 3, 333-340.
Delouis B. and 9 co-authors, 2004. Slip distribution of
the 2003 Boumerdes-Zemmouri earthquake, Algeria,
from teleseismic, GPS, and coastal uplift data.
Geophys. Res. Lett., 31, L18607,
doi:10.1029/2004GL020687.
DISS Working Group, 2009. Database of Individual
Seismogenic Sources (DISS), Version 3.1.0: A
compilation of potential sources for earthquakes
larger than M 5.5 in Italy and surrounding areas.
http://diss.rm.ingv.it/diss/, © INGV 2009 - Istituto
Nazionale di Geofisica e Vulcanologia.
Eva C. and Rabinovich A. B., 1997. The February 23,
1887 tsunami recorded on the Ligurian Coast, western
Mediterranean. Geophys. Res. Letts, 24, 2211-2214,
doi:10.1029/97GL02110.
Garcin M., Prame B., Attanayake N., De Silva U.,
Desprats J.F., Fernando S., Fontaine M., Idier D.,
Lenotre N., Pedreros R. and C.H.E.R. Siriwardana,
2007. A Geographic Information System for Coastal
Hazards. Application to a pilot site in Sri Lanka (Final
Report). BRGM Open file BRGM/RP-55553-FR, 124 p.
Gardi A., Valencia N., Guillande R. and André C., 2011.
Inventory of the uncertainties associated with the
process of tsunami damage assessment on buildings
(SCHEMA FP6 EC co-funded project). Special issue of
NHESS on "New developments in Tsunami science:
from hazard to risk". In press.
Gjevik B., Pedersen G., Dybesland E., Harbitz C. B.,
Miranda P. M. A., Baptista M. A., Mendes-Victor L.,
Heinrich P., Roche R. and Guesmia M., 1997. Modeling
tsunamis from earthquake sources near Gorringe Bank
southwest of Portugal. Journal of Geophysical
Research, 102, C13, 27931-27949.
Guesmia M., Heinrich P. and Mariotti C., 1998.
Numerical simulation of the 1969 Portoguese tsunami
by a finite-element method. Natural Hazards, 17, 31-
46.
ICG/IOTWS, 2007. Workshop on tsunami risk
assessment for the Indian Ocean, Final Report, Dubai,
4-6 October.
IFREMER Editions: CA 98-01 Multibeam bathymetric
data synthesis (occidental Mediterranean Sea)
A.Normand, R. Le Suavé. 1/250 000 - 6 folded maps,
undercovered, 1998.
IFREMER Editions: CA 04-01 The gulf of Lyon, morpho-
bathymetric map, S. Berné, D. Carré, B. Loubrieu, JP.
Mazé, L. Morvan, A. Normand 1/250 000 - 1 map,
2004.
Kirby J. T., Wei G., Chen Q., Kennedy A. B. and
Dalrymple, R. A., 1998. FUNWAVE 1.0. Fully nonlinear
Boussinesq wave model, documentation and user’s
manual. Rep. CACR-98-06, Cent. For Appl. Coastal Res.,
Dep. Of Civ.and Environ. Eng.,Univ. of Del., Newark.
Leone F., Denain J. C., Vinet F. and Bachri S., 2006.
Analyse spatiale des dommages au bâti de Banda Aceh
(Sumatra, Indonésie): contribution à la connaissance
du phénomène et à l’élaboration de scénarios de
risque tsunami. Scientific report of Tsunarisque (2005-
2006) programme.
Leone F., Lavigne F., Paris R., Denain J-C., Vinet F.,
2010. A spatial analysis of the December 26th, 2004
tsunami-induced damages: Lessons learned for a
better risk assessment integrating buildings
vulnerability. Applied Geography, doi:10.1016/
j.apgeog.2010.07.009.
Omira R., Baptista M. A., Matias L., Miranda J. M.,
Catita C., Carrilho L. and Toto E., 2009. Design of a sea-
level tsunami detection network for the Gulf of Cadiz.
Natural Hazards and Earth System Sciences, 9, 1327-
1338.
Papazachos B. C., 1996. Large Seismic Faults in the
Hellenic Arc. Annali di Geofisica, 39, 891-903.
Peiris N., 2006. Vulnerability functions for tsunami loss
estimation. First European conference on Earthquake
Handbook of tsunami hazard and damage scenarios References
32
Engineering and Seismology (a joint event of the 13th
ECEE & 30th General Assembly of the ESC), Geneva,
Switzerland, Paper number 1121.
Pino N. A., Piatanesi A., Valensise G. and Boschi E.,
2009. The 28 December 1908 Messina Straits
Earthquake (Mw 7.1): A Great Earthquake throughout
a Century of Seismology. Seism. Res. Lett., Vol. 80, 2,
243-259.
Reese S., Cousins W. J., Power W. L., Palmer N. G.,
Tejakusuma I. G. and Nugrahadi S., 2007. Tsunami
vulnerability of buildings and people in South Java-
field observations after the July 2006 Java tsunami.
Natural Hazards and Earth Systems Sciences, 7, 573-
589.
Ranguelov B., Mircheva E., Lazarenko I. and Encheva
R., 2008. The archaeological site – possible evidence
about multihazard ancient events. Proceedings Conf.
Geoarchaeology and Archaelomineralogy., 29-30
October 2008, Sofia, “St. Ivan Rilski” Publishing House,
347-352.
Ruangrassamee A., Yanagisawa H., Foytong P.,
Lukkunaprasit P., Koshimura S. and Imamura F., 2006.
Investigation of tsunami-induced damage and fragility
of buildings in Thailand after the December 2004
Indian Ocean Tsunami. Earthquake Spectra, Special
Issue, 22, S377-S401.
Santos A., Martins H., Coelho H., Leitão P. C. and
Neves R., 2002. A circulation model for the European
ocean margin. Applied Mathematical Modelling, 26
(5), 563-582.
Scheer S., Gardi A., Guillande R. , Eftichidis G., Varela
V., de Vanssay B., Colbeau-Justin L., 2011. Handbook
of Evacuation Planning, EUR 24707 EN, JRC61202,
Luxembourg (Luxembourg): OP, 2011.
SCHEMA Deliverable 1.3, 2008. Lessons learned from
Asia test sites (http://www.schema project.org/).
SCHEMA Deliverable 2.1, 2009. Generic aspects and
rules on vulnerability evaluation: Classification of the
building vulnerability as regards to tsunami hazard
(http://www.schema project.org/).
SCHEMA Deliverable 4.1, 2009. Development of
complete approach on Rabat test site. (http://www.
schema project.org/).
SCHEMA Deliverable 4.2, 2009. Development of
complete approach on Balchik test site. (http://www.
schema project.org/).
SCHEMA Deliverable 4.3, 2010. Development of
complete approach on French test site. (http://www.
schema project.org/).
SCHEMA Deliverable 4.4, 2009. Development of
complete approach on the Setúbal test site.
(http://www. schema project.org/).
SCHEMA Deliverable 4.5, 2009. Development of
complete approach on Catania test site. (http://www.
schema project.org/).
Shuto, N. 1993. Tsunami intensity and disasters. In:
Tinti, S. (ed.) Tsunamis in the World, Kluwer Academic,
Dordrecht, 197-216.
Tinti S., Armigliato A., Pagnoni G. and Zaniboni F.,
2005. Scenarios of giant tsunamis of tectonic origin in
the Mediterranean. ISET Journal of Earthquake
Technology, 42, 171-188.
Titov V.V. and Synolakis C.E. 1995. Modeling of
breaking and non breaking long-wave evolution and
run up using VTCS-2. J Waterway Port Coast Ocean
Eng, 121, 308-316.
Tonini R., Armigliato A., Pagnoni G., Zaniboni F., Tinti
S., 2011. Tsunami hazard for the city of Catania,
eastern Sicily, Italy, assessed by means of Worst-case
Credible Tsunami Scenario Analysis (WCTSA). Nat.
Hazards Earth Syst. Sci., accepted. Yeh H., Robertson I. and Preuss J., 2005. Development
of Design Guidelines for Structures that Serve as
Tsunami Vertical Evacuation sites. Washington division
of Geology and Earth Resources, Open File Report
2005-4.
Yelles K., Lammali K., Mahsas A., Calais E. and Briole P.,
2004. Coseismic deformation of the May 21st, 2003,
Mw=6.8 Boumerdes earthquake, Algeria, from GPS
measurements. Geophys. Res. Lett., 31, L13610,
doi:10.1029/2004GL019884
Valencia N., Gardi A., Gauraz A., Leone F., Guillande R,
2011. New tsunami damage functions developed in
the framework of SCHEMA project: application to
Euro-Mediterranean coasts. Nat. Hazards Earth Syst.
Sciences, under review.
Vaz N., Dias J. M., Leitão P. C. and Nolasco R., 2007.
Application of the Mohid-2D model to a mesotidal
temperate coastal lagoon. Computers & Geosciences
33, 1204–1209.
Ward S. N. and Day S., 2001. Cumbre Vieja Volcano -
Potential collapse and tsunami at La Palma, Canary
Islands. Geophys. Res. Lett., 28, 397-400.
Zitellini N., Chierici F., Sartori R. and Torelli L., 1999.
The tectonic source of the 1755 Lisbon Earthquake.
Annali di Geofisica, 42(1), 49–55.
Handbook of tsunami hazard and damage scenarios Annexes
33
Annex A – The project SCHEMA
SCHEMA is a research effort that has been carried out
by a consortium including initially eleven organizations
based not only in the European Union, but also in
Turkey and in Morocco (see Annex B). The partnership
aimed at using Earth observation data in order to
develop a general methodology suitable for helping
experts to build up hazard, vulnerability and impact
damage maps related with the occurrence of
tsunamis. The project has been coordinated by
Geosciences Consultants (GSC), a French private
enterprise based in Paris. It has been launched in
August 2007 with duration up to the end of October
2010 and financed by the European Commission
within the 6th Framework Programme.
The key features of the research and development
work under SCHEMA can be summarised in the
following bullet points:
• the clarification of concepts such as vulnerability,
hazards, scenarios, in order to produce
documents and maps accessible and understood
by end-users (civil protection, rescue planners);
• an analysis of mathematical modelling limitation
to reproduce reality in order to assess the degree
of uncertainty when risk is estimated on models
and not on real past events;
• the development of a general methodology,
validated by end users, to produce scenarios for
tsunami and for related phenomena hazardous
impact;
• the extraction of vulnerability and hazard level
indicators, as used in the general methodology,
from Earth observation data;
• a first validation of the methodology on real life
cases as observed during the recent tsunami in
Asia;
• a thorough validation of the resulting prototype
methodology on 5 test sites typical of different
environments (Setúbal in Portugal, Rabat in
Morocco, Mandelieu in south France, Catania in
Italy and Balchik in Bulgaria).
SCHEMA partners have worked keeping end users in
mind and the advantages to them deriving from
SCHEMA research and products. These benefits can be
synthesized in the list below:
1. for civil security organisations: a comprehensive
and homogeneous technique to assess tsunami
and related phenomena risk levels based on
intrinsic vulnerability variables (building heights,
building types, inhabitant description) and
environment variables (density of buildings per
unit area, road width,…) and, thus, a technique
capable of helping them to develop general
preventive emergency measures;
2. for rescue planners: a clear-cut description of
accessible areas under multi-disaster occurrence,
to help rescue planners design effective rescue
operations providing them the tools to evaluate
vulnerability variables under crisis organisation
modes;
3. for public safety policy makers: a set of policy
recommendations to standardise data collection
and preparation for vulnerability studies, based
on tsunami and related phenomena simulation
scenarios that concentrate prevention and
education efforts within the most exposed areas;
4. for insurance companies: useful spatial data
related to potential maximum claims for building
damages within potentially flooded zones, thus
allowing them to answer questions such as: what
level of premiums should be set for buildings,
content loss and business interruption loss
insurance in risky areas? What is the potential
level of claims for a particular portfolio of
insured assets in a given location?
5. for land management and planners: the
approach that combines models, field surveys
and vulnerability assessments should be used as
an input in the planning of coastal management
and taken into consideration when building or
modifying a coastal zone exposed to a tsunami
hazard.
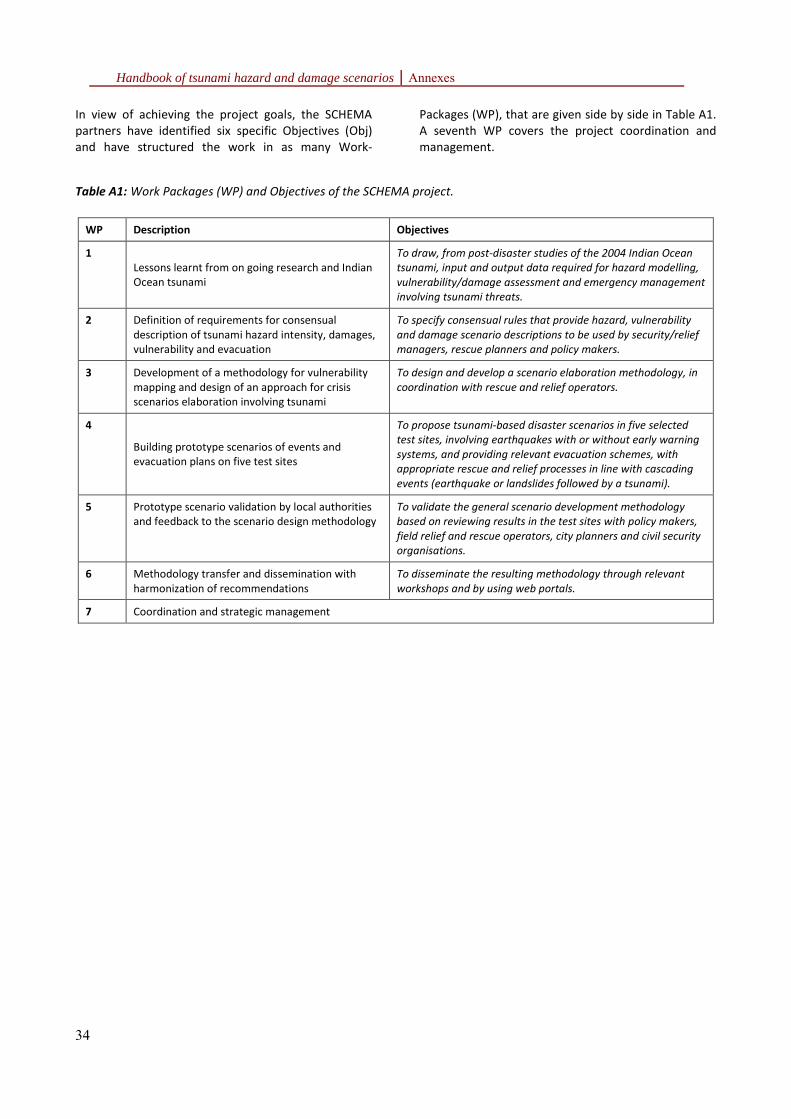
Handbook of tsunami hazard and damage scenarios Annexes
34
In view of achieving the project goals, the SCHEMA
partners have identified six specific Objectives (Obj)
and have structured the work in as many Work-
Packages (WP), that are given side by side in Table A1.
A seventh WP covers the project coordination and
management.
Table A1: Work Packages (WP) and Objectives of the SCHEMA project.
WP Description Objectives
1
Lessons learnt from on going research and Indian
Ocean tsunami
To draw, from post-disaster studies of the 2004 Indian Ocean
tsunami, input and output data required for hazard modelling,
vulnerability/damage assessment and emergency management
involving tsunami threats.
2 Definition of requirements for consensual
description of tsunami hazard intensity, damages,
vulnerability and evacuation
To specify consensual rules that provide hazard, vulnerability
and damage scenario descriptions to be used by security/relief
managers, rescue planners and policy makers.
3 Development of a methodology for vulnerability
mapping and design of an approach for crisis
scenarios elaboration involving tsunami
To design and develop a scenario elaboration methodology, in
coordination with rescue and relief operators.
4
Building prototype scenarios of events and
evacuation plans on five test sites
To propose tsunami-based disaster scenarios in five selected
test sites, involving earthquakes with or without early warning
systems, and providing relevant evacuation schemes, with
appropriate rescue and relief processes in line with cascading
events (earthquake or landslides followed by a tsunami).
5 Prototype scenario validation by local authorities
and feedback to the scenario design methodology
To validate the general scenario development methodology
based on reviewing results in the test sites with policy makers,
field relief and rescue operators, city planners and civil security
organisations.
6 Methodology transfer and dissemination with
harmonization of recommendations
To disseminate the resulting methodology through relevant
workshops and by using web portals.
7 Coordination and strategic management
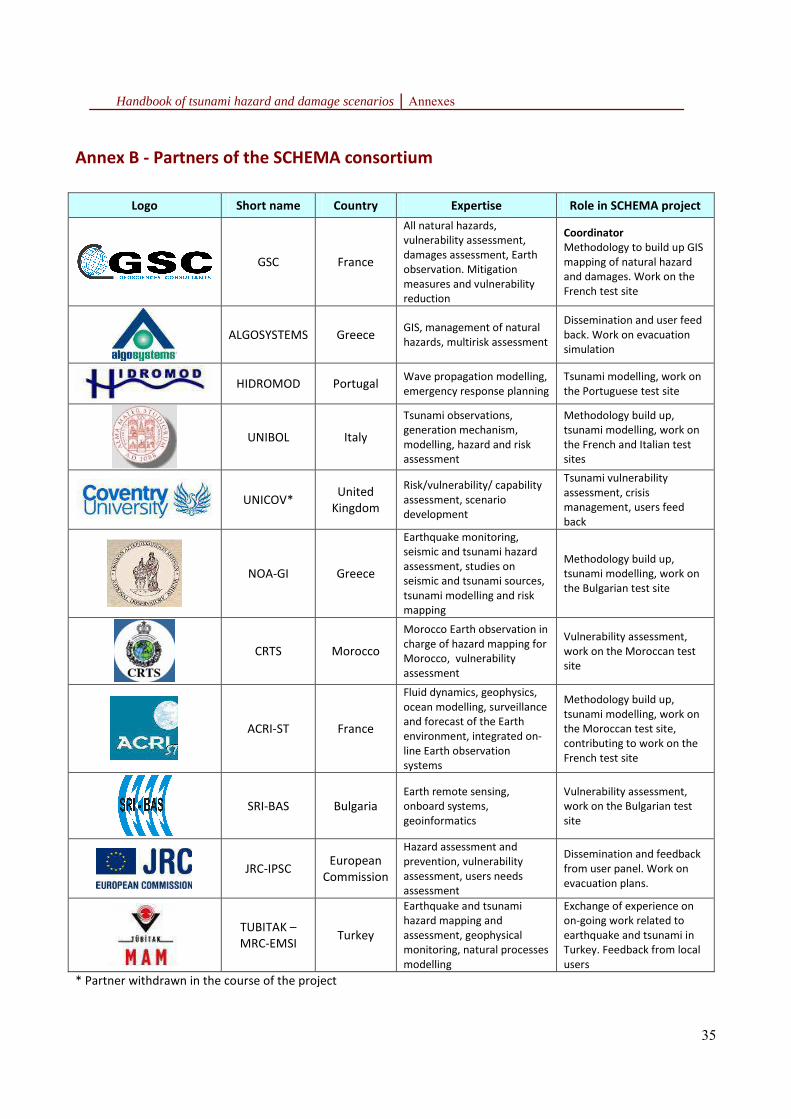
Handbook of tsunami hazard and damage scenarios Annexes
35
Annex B - Partners of the SCHEMA consortium
Logo Short name Country Expertise Role in SCHEMA project
GSC France
All natural hazards,
vulnerability assessment,
damages assessment, Earth
observation. Mitigation
measures and vulnerability
reduction
Coordinator
Methodology to build up GIS
mapping of natural hazard
and damages. Work on the
French test site
ALGOSYSTEMS Greece GIS, management of natural
hazards, multirisk assessment
Dissemination and user feed
back. Work on evacuation
simulation
HIDROMOD Portugal
Wave propagation modelling,
emergency response planning Tsunami modelling, work on
the Portuguese test site
UNIBOL Italy
Tsunami observations,
generation mechanism,
modelling, hazard and risk
assessment
Methodology build up,
tsunami modelling, work on
the French and Italian test
sites
UNICOV* United
Kingdom
Risk/vulnerability/ capability
assessment, scenario
development
Tsunami vulnerability
assessment, crisis
management, users feed
back
NOA-GI Greece
Earthquake monitoring,
seismic and tsunami hazard
assessment, studies on
seismic and tsunami sources,
tsunami modelling and risk
mapping
Methodology build up,
tsunami modelling, work on
the Bulgarian test site
CRTS Morocco
Morocco Earth observation in
charge of hazard mapping for
Morocco, vulnerability
assessment
Vulnerability assessment,
work on the Moroccan test
site
ACRI-ST France
Fluid dynamics, geophysics,
ocean modelling, surveillance
and forecast of the Earth
environment, integrated on-
line Earth observation
systems
Methodology build up,
tsunami modelling, work on
the Moroccan test site,
contributing to work on the
French test site
SRI-BAS Bulgaria
Earth remote sensing,
onboard systems,
geoinformatics
Vulnerability assessment,
work on the Bulgarian test
site
JRC-IPSC European
Commission
Hazard assessment and
prevention, vulnerability
assessment, users needs
assessment
Dissemination and feedback
from user panel. Work on
evacuation plans.
TUBITAK –
MRC-EMSI Turkey
Earthquake and tsunami
hazard mapping and
assessment, geophysical
monitoring, natural processes
modelling
Exchange of experience on
on-going work related to
earthquake and tsunami in
Turkey. Feedback from local
users
* Partner withdrawn in the course of the project
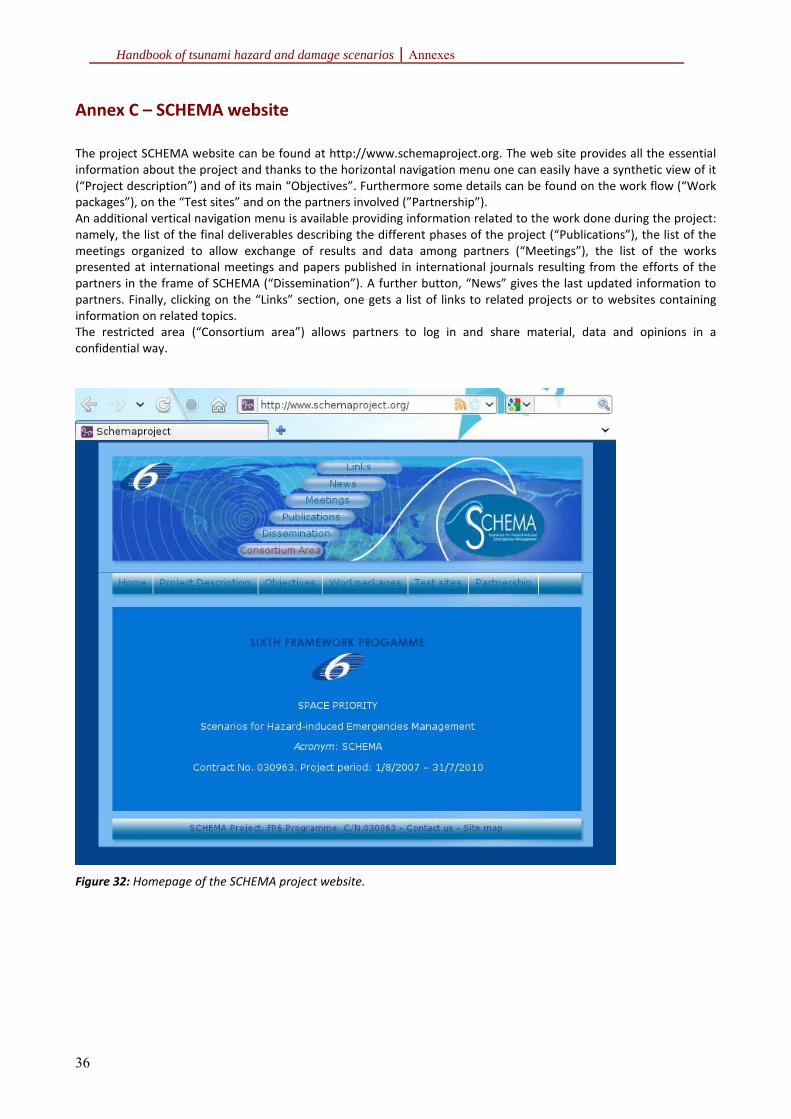
Handbook of tsunami hazard and damage scenarios Annexes
36
Annex C – SCHEMA website
The project SCHEMA website can be found at http://www.schemaproject.org. The web site provides all the essential
information about the project and thanks to the horizontal navigation menu one can easily have a synthetic view of it
(“Project description”) and of its main “Objectives”. Furthermore some details can be found on the work flow (“Work
packages”), on the “Test sites” and on the partners involved (”Partnership”).
An additional vertical navigation menu is available providing information related to the work done during the project:
namely, the list of the final deliverables describing the different phases of the project (“Publications”), the list of the
meetings organized to allow exchange of results and data among partners (“Meetings”), the list of the works
presented at international meetings and papers published in international journals resulting from the efforts of the
partners in the frame of SCHEMA (“Dissemination”). A further button, “News” gives the last updated information to
partners. Finally, clicking on the “Links” section, one gets a list of links to related projects or to websites containing
information on related topics.
The restricted area (“Consortium area”) allows partners to log in and share material, data and opinions in a
confidential way.
Figure 32: Homepage of the SCHEMA project website.
Handbook of tsunami hazard and damage scenarios List of figures
37
List of Figures
Figure 1: Sketch illustrating the developed methodology for producing tsunami hazard and tsunami damage
scenarios.................................................................................................................................................................8
Figure 2: The Marques de Pombal fault (Omira et al. 2009), SW off Lisbon, was selected by HIDROMOD to build
one of the worst-case credible scenarios for the Setúbal test site. Here the computed initial sea surface
elevation produced by the earthquake is portrayed. .......................................................................................... 12
Figure 3: Compilation of bathymetric data for the Mandelieu test site by GSC. Rectangles represent the
boundaries of the computational grids of the multi-grid system created by UNIBOL for numerical simulations.14
Figure 4: Example of detailed coastline in the area of the Mandelieu test site. The coastline position has been
deduced by photo interpretation of Google Earth images. ................................................................................. 15
Figure 5: Digital Elevation Model (DEM) of the Varna region, Bulgaria, including the town of Balchik, that was
selected as one of the SCHEMA test sites (made available to SCHEMA by SRI-BAS)........................................... 15
Figure 6: Difference between high and low tide coastlines in the Troia Peninsula in Setúbal test site as
computed by HIDROMOD.................................................................................................................................... 15
Figure 7: System of four nested grids used by UNIBOL to cover the Central Mediterranean region from the
West Hellenic Arc (that is between Peloponnesus and western Crete and is the source of the 365 A.D.
earthquake and tsunami) to eastern Sicily, where the test site of Catania is located. ....................................... 16
Figure 8: Comparison of the extent of inundation between a local scenario (dashed dark blue line) and the
correspondent “augmented scenario” (light blue line). The example refers to the Rabat test site and the
scenario is the one based on the historical 1755 Lisbon earthquake and is the result of collaboration between
ACRI-ST and CRTS................................................................................................................................................. 17
Figure 9: Tsunami propagation snapshots for one of the scenarios considered for the Catania test site, based
on the 365 A.D. event occurred off western Crete, Greece, computed by UNIBOL. ............................................ 17
Figure 10: Propagation time map of the scenario associated with the mega-collapse of the Cumbre Vieja in the
La Palma island elaborated for the Rabat test site by ACRI-ST. It is seen that the first tsunami waves will reach
Rabat in about 90 min. ........................................................................................................................................ 18
Figure 11: Maximum sea surface elevation (in meters) for the Marques de Pombal fault tsunami analysed for
the Setúbal test site on a regional scale. Computations were performed by HIDROMOD, with initial tsunami
conditions provided by UNIBOL.. ......................................................................................................................... 18
Figure 12: Maximum water elevation, Rabat test site, 1755 Lisbon earthquake scenario, computed by ACRI-ST.19
Figure 13: Minimum water elevation, Rabat test site, 1755 Lisbon earthquake scenario, computed by ACRI-ST.19
Figure 14: Maximum current speed, Rabat test site, 1755 Lisbon earthquake scenario, computed by ACRI-ST. 19
Figure 15: Aggregated map of the maximum sea elevation computed for the Catania test site by UNIBOL. The
aggregated inundation line (black) and the inundation line (red) deriving from combining the augmented
scenarios are drawn together for comparison. ................................................................................................... 20
Figure 16: Structural damage to buildings according to the damage scale developed by Leone et al. (2006)... 22
Figure 17: Damage functions for building classes A, B, C, D, E1 derived from real field observations collected
after the Indian Ocean tsunami occurred on December 26, 2004 developed during project SCHEMA by GSC... 23
Figure 18: Classification of a building from a satellite Google Earth image (below) validated through a picture
taken during a field survey (above) carried out by GSC in the Mandelieu test site............................................. 24
Figure 19: Map of the buildings’ typology on the coast and river bank of Rabat, after the work of CRTS.
Copyright Quickbird image, 2008-09-28, res: 0.63m........................................................................................... 24
Figure 20: Buildings’ typology distribution of Mandelieu, mapped by GSC ........................................................ 25
Figure 21: Buildings’ typology distribution for the harbour of Balchik, after SRI-BAS......................................... 25
Figure 22: Road classification based on the road width in the belt close to the shoreline and to the banks of the
river Bouregreg in the Rabat test site (CRTS). Copyright Quickbird image, 2008-09-28, res: 0.63m. ................. 25
Figure 23: Road classification based on road relevance in the coastal belt of La Plaia south of Catania test site.
Also areas that are a potential source of floating objects, such as light wooden beach constructions are shown
(UNIBOL). ............................................................................................................................................................. 25
Figure 24: Damage scenario zoomed on the mouth of the Bouregreg river resulting from the collaboration
between ACRI-ST and CRTS. Copyright Quickbird image, 2008-09-28, res: 0.63m. ............................................ 26
Handbook of tsunami hazard and damage scenarios List of figures and tables
38
Figure 25: Buildings typology distribution (upper panel) and damage scenario (lower panel) for the harbour
town of Setúbal calculated by HIDROMOD. Notice that level D0 is attributed even to buildings of those classes
(F and G) for which damage level cannot be estimated by means of the SCHEMA damage matrix................... 26
Figure 26: Aggregated damage scenario computed in the area of La Plaia south of Catania by UNIBOL for the
augmented sources. Most constructions on the beach result to be damaged, but flow depth is too low to cause
them to collapse .................................................................................................................................................. 27
Figure 27: Damage scenarios computed in Balchik test site by SRI-BAS and NOA-GI for a local earthquake fault
striking 40° (upper panel) and striking 90° (lower panel).................................................................................... 27
Figure 28: Marinas and parking places identified in Setúbal that are found within the inundation area of the
tsunami hazard scenario (HIDROMOD)............................................................................................................... 28
Figure 29: Map of obstacles and accessibility for Mandelieu test site (GSC). Beach stairs, pedestrian tunnels
under railway and walls all along the beach can be obstacles or critical points in case of evacuation.............. 28
Figure 30: Roads in the area of La Plaia, Catania, plotted together with the inundation line (pink) for the
aggregated scenario (resulting from augmented sources). The entire main roads system is affected by the
tsunami with the consequence that the beach of La Plaia might be isolated and hardly reachable from land by
rescue teams in case of emergency (UNIBOL). .................................................................................................... 28
Figure 31: Example of a detailed local scenario selected from the Atlas focussed on the Rabat test site. The
maximum water withdrawal is shown in the main picture together with the maximum inundation line for the
La Palma potential scenario. General information on the specific scenario is given by the surrounding images
at regional scales together with tables containing information useful for warning strategies. ......................... 30
Figure 32: Homepage of the SCHEMA project website. ...................................................................................... 36
List of Tables
Table 1: List of the maps that characterise tsunami scenarios in the project SCHEMA .........................................9
Table 2: List of the sources selected in SCHEMA ................................................................................................. 11
Table 3: Tsunami numerical models used for the test sites of the project SCHEMA. .......................................... 13
Table 4: Building typology depending on the resistance capacity of the constructions...................................... 21
Table 5: Scale for damage levels of buildings...................................................................................................... 22
Table 6: Damage matrix adopted in the project SCHEMA. Values of the flow depth are given in meters.......... 23
Table A1: Work Packages (WP) and Objectives of the SCHEMA project. .......................................................... 344
39
European Commission
EUR 24691 EN– Joint Research Centre – Institute for the Protection and Security of the Citizen
Title: Handbook on Tsunami Hazard and Damage Scenarios
Author(s): S. Tinti, R. Tonini, L. Bressan, A. Armigliato, A. Gardi, R. Guillande, N. Valencia, S. Scheer
Luxembourg: Publications Office of the European Union
2011 – 43 pp. – 21 x 29.7 cm
EUR – Scientific and Technical Research series – ISSN 1018-5593
ISBN 978-92-79-19062-9
doi:10.2788/21259
Abstract
The handbook on tsunami scenarios is the result of an intense work performed under the European FP6 co-funded
project SCHEMA in a 39 month period from 2007 to 2010 by a Consortium of 11 partners led by Geosciences
Consultants (Paris). The handbook is one of the products of the project and has been conceived to illustrate the basic
concepts and methods elaborated and applied in the project to produce tsunami scenarios in view of providing tools
to assess tsunami hazard and potential damage. One of the main objectives was the elaboration of a general
methodology that can be used in all possible cases and that can be easily adapted to the needs of the end users, i.e.
chiefly the public administrators responsible for planning of the coastal zone development and protection strategies
as well as people and organisations involved in disasters management and mitigation policies. For these reasons, the
SCHEMA methodology has been applied to five test sites (Rabat, Morocco; Setúbal, Portugal; Mandelieu, France;
Catania, Italy; Balchik, Bulgaria) differing very much from one another, and it has been tested with the active
involvement of the end users, so ensuring that it will provide practical and useful tools and it is flexible enough to
cover local needs.
40
How to obtain EU publications Our priced publications are available from EU Bookshop (http://bookshop.europa.eu), where you can place an order with the sales agent of your choice. The Publications Office has a worldwide network of sales agents. You can obtain their contact details by sending a fax to (352) 29 29-42758.
The mission of the JRC is to provide customer-driven scientific and technical support for the conception, development, implementation and monitoring of EU policies. As a service of the European Commission, the JRC functions as a reference centre of science and technology for the Union. Close to the policy-making process, it serves the common interest of the Member States, while being independent of special interests, whether private or national.
LB
-NA
-24691-EN-C