Embed Size (px)
Citation preview

Handbook of Parameters for U.S. and
International Governments Risk and Dose
Assessment Models for Remediation of
Radiologically Contaminated Soil
(PRG/DCC, RESRAD, NORMALYSA, RCLEA, RSRARS,
WISMUT and NCRP)
By
Nasser Shubayr, PhD
U.S. EPA Research Fellow, ORISE
October, 2017

ACKNOWLEDGMENTS
This project was supported in part by an appointment to the Research Participation Program at
the Office of Superfund Remediation and Technology Innovation, U.S. Environmental
Protection Agency (EPA), administered by the Oak Ridge Institute for Science and Education
(ORISE) through an interagency agreement between the U.S. Department of Energy and EPA.
This project was under the supervision of Mr. Stuart Walker of the EPA.

Contents
I. Introduction ............................................................................................................................1
II. Preliminary Remediation Goal (PRG) .................................................................................3
2.1 PRG Exposure Scenarios and Pathways .......................................................................... 3
2.2 DCC Exposure Scenarios and Pathways .......................................................................... 4
2.3 PRG/DCC Recommended Default Input Parameters....................................................... 5
2.4 PRG/DCC References: ................................................................................................... 19
III. Residual Radioactive Material Guideline (RESRAD-ONSITE) ......................................23
3.1 RESRAD-ONSITE Exposure Scenarios and Pathways ................................................. 23
3.2 RESRAD-ONSITE Recommended Default Input Parameters ...................................... 23
3.3 RESRAD-ONSITE References ...................................................................................... 33
IV. NORM and LegacY Site Assessment (NORMALYSA) ....................................................34
4.1 NORMALYSA Exposure Scenarios and Pathways ....................................................... 34
4.2 NORMALYSA Recommended Default Input Parameters ............................................ 35
4.3 NORMALYSA References: ........................................................................................... 60
V. The Radioactively Contaminated Land Exposure Assessment Methodology (RCLEA) ...........62
5.1 RCLEA Exposure Scenarios and Pathways ................................................................... 62
5.2 RCLEA Recommended Default Input Parameters......................................................... 63
5.3 RCLEA References: ....................................................................................................... 69
VI. Radioactive Soil Remediation Standards (RaSoRS): ........................................................70
6.1 RaSoRS Exposure Scenarios and Pathways: ................................................................. 70
6.2 RaSoRS Recommended Default Input Parameters ........................................................ 70
6.3 RaSoRS References: ...................................................................................................... 71
VII. WISMUT ...............................................................................................................................72
7.1 WISMUT Exposure Scenarios and Pathways ................................................................ 72
7.2 WISMUT Recommended Default Input Parameters ..................................................... 73
7.3 WISMUT Reference: ..................................................................................................... 77
VIII. NCRP Report No. 129 ...................................................................................................78
8.1 NCRP Exposure Scenarios and Pathways ...................................................................... 78
8.2 NCRP Recommended Default Input Parameters ........................................................... 78
8.3 NCRP References:.......................................................................................................... 81

1
I. Introduction
Radiation risk assessment models are important tools for decision makers that are used to
assess risk and dose for the public and workers due to radioactivity resulting from radioactively
contaminated sites. These models can be used for remediation, decommissioning,
decontamination etc. Models constructed in different ways as shown in Figure 1. Modeling and
monitoring are necessary to comply with regulations as well as to determine the need for
remediation in case a contaminated site constitutes a danger for people or the environment. The
radiation risk assessment models are usually used to analyze the exposure sources and scenarios
in order to produce guidelines for remediation and clean up actions. Generic assessment requires
minimal information about the contaminated site and the default input parameters maybe used.
Advanced assessment requires site-specific data for the relevant scenarios and pathways.
Radiation risk assessment models have input parameters for relevant exposure scenarios and
pathways that can be used for the assessment. This document shows a brief overview for the
following models: PRG/DCC, RESRAD, NORMALYSA, RCLEA, RaSoRs, WISMUT and
NCRP, and lists all input parameters used by these models. This document can be used as a
parameters reference for modelers.

2
Figure 1: Models categories.
Models
Internet based calculators
PRG
Software based models
RESRAD
NORMALYSA
Excel based models
UK RCLEA
NJ RaSoRs
WISMUT
Reports
NCRP Report No.
129

3
II. Preliminary Remediation Goal (PRG)
Preliminary Remediation Goals for Radionuclide Contaminants at Superfund Sites (PRG)
is an electronic calculator developed by the U.S. Environmental Protection Agency (EPA). The
PRG calculator presents risk-based standardized exposure parameters and equations that should
be used for calculating radionuclide PRGs for residential, commercial/industrial, and agricultural
land use exposures from soil, tap water, air and biota. Calculated PRGs can be produced
generically (considered to be protective for humans, including the most sensitive groups) or
using site-specific data for 1255 radionuclides in the PRG calculator which may be found at:
https://epa-prgs.ornl.gov/radionuclides/. The PRG calculator was first issued in 2002 and last
updated in 2017.
2.1 PRG Exposure Scenarios and Pathways
Scenario/ Land use Media
Resident Soil, air, 2-D external exposure, tap water, and fish
Composite worker Soil, air, 2-D external exposure
Outdoor worker Soil, air, 2-D external exposure
Indoor worker Soil, air, 2-D external exposure
Construction worker—standard unpaved road
vehicle traffic (site-specific only)
Soil, air, 2-D external exposure
Construction worker—wind erosion and other
construction activities (site-specific only)
Soil, air, 2-D external exposure
Recreator (site-specific only) Soil, air, 2-D external exposure, surface water, game and fowl
Farmer Air, biota direct, combined soil and biota, combined water and
biota, biota from both soil and water
Soil to groundwater Soil
Cover Layer May be added to soil or 2D for shielding from external
exposure

4
Dose Compliance Concentration for Radionuclides at Superfund Sites (DCC) is also an
electronic calculator developed by the U.S. EPA to address Applicable or Relevant and
Appropriate Requirements (ARARs) that are expressed in terms of millirem per year. The DCC
calculator equations are nearly identical to those in the PRG for Radionuclides. There are three
key differences between the two tools: 1) the target dose rate (ARAR-based) is substituted for
the target cancer risk (1 x 10⁻⁶), 2) the period of exposure is one year, to indicate year of peak
dose, and 3) dose conversion factor (DCF) is used in place of the slope factor. The DCC
calculator may be found at the EPA website: https://epa-dccs.ornl.gov/. The DCC calculator was
first issued in 2004 and last updated in 2017.
2.2 DCC Exposure Scenarios and Pathways
Scenario/ Land use Media
Resident Soil, air, 2-D external exposure, tap water, and fish
Composite worker Soil, air, 2-D external exposure
Outdoor worker Soil, air, 2-D external exposure
Indoor worker Soil, air, 2-D external exposure
Construction worker—standard unpaved road vehicle
traffic (site-specific only)
Soil, air, 2-D external exposure
Construction worker—wind erosion and other
construction activities (site-specific only)
Soil, air, 2-D external exposure
Recreator (site-specific only) Soil, air, 2-D external exposure, surface water, game
and fowl
Farmer Air, biota direct, combined soil and biota, combined
water and biota, biota from both soil and water
Soil to groundwater
Cover Layer
Soil
May be added to soil/ 2D for shielding from
radiation in an external exposure scenario.

5
2.3 PRG/DCC Recommended Default Input Parameters
Slope Factors
Slope factors provide cancer risk posed by lifetime exposure to specific radionuclides. Slope factors also take into
account the type of exposure (inhalation, ingestion, or external) and amount of exposure. For example, a resident
on a site would expect to have a different exposure level than a worker on the same site. PRG calculator uses
slope factors to calculate cleanup levels based on a default target cancer risk of 10-6.
Parameter (units) Default Information/Reference
Slope Factor - external exposure (risk/yr per pCi/g) RN-specific ORNL 2014c
Slope Factor - external exposure (risk/yr per pCi/g) RN-specific ORNL 2014c
Slope Factor - external exposure (risk/yr per pCi/g) RN-specific ORNL 2014c
Slope Factor - external exposure (risk/yr per
pCi/cm2)
RN-specific ORNL 2014c
Slope Factor - external exposure (risk/yr per pCi/g) RN-specific ORNL 2014c
Food Ingestion Slope Factor (risk/pCi) RN-specific ORNL 2014c
Slope Factor - inhalation (risk/pCi) RN-specific ORNL 2014c
Slope Factor - immersion (risk/yr per pCi/L) RN-specific ORNL 2014c
Soil Ingestion Slope Factor - population (risk/pCi) RN-specific ORNL 2014c
Soil Ingestion Slope Factor - adult only (risk/pCi) RN-specific ORNL 2014c
Slope Factor - submersion (risk/yr per pCi/cm3):
For use in this tool, ORNL 2014c units were
converted to (risk/yr per pCi/m3)
RN-specific ORNL 2014c
Water Ingestion Slope Factor (risk/pCi) RN-specific ORNL 2014c
Dose and Decay Constant Variables
Parameter (units) Default Information/Reference
Time - construction worker (years) 1 U.S. EPA 2002 Exhibit 5-1
Time - farmer (years) 40 U.S. EPA 2005 (pg. C-24/C-26)
Time - indoor worker (years) 25 U.S. EPA 1991a (pg. 15)
Time - outdoor worker (years) 25 U.S. EPA 1991a (pg. 15)
Target Risk 1 × 10⁻⁶ U.S. EPA 1991b
Target cancer risk of 10-6 means that a person
exposed to the contamination has a one in a
million chance of developing cancer. (Target is
based on upper bound estimated level of
reasonable maximum exposure (RME). Most
people will have less of a chance of developing
cancer)
Time - recreator (years) site-specific site-specific
Time - resident (years) 26 U.S. EPA 2011a, Table 16-108; 90th percentile or
current residence time.
Time - worker (years) 25 U.S. EPA 1991a (pg. 15)
decay constant = 0.693/half-life
(year-1) where 0.693 = ln(2)
RN-specific Developed for Radionuclide Soil Screening
calculator

6
Miscellaneous Variables
Parameter (units) Default Information/Reference
Area Correction Factor - 15cm (unitless) RN-specific The area correction factor is the ratio of
a dose rate coefficient from a finite
contaminated slab to a dose rate
coefficient from an infinite source.
ORNL 2014a
Area Correction Factor - 1cm (unitless) RN-specific ORNL 2014a
Area Correction Factor - 5cm (unitless) RN-specific ORNL 2014a
Area Correction Factor - ground plane
(unitless)
RN-specific ORNL 2014a
Area Correction Factor - soil volume
(unitless)
RN-specific ORNL 2014a
Beef Contaminated Fraction - farmer
(unitless)
1 Developed for Radionuclide Soil
Screening calculator
Dairy Contaminated Fraction - farmer
(unitless)
1 Developed for Radionuclide Soil
Screening calculator
Egg Contaminated Fraction - Farmer
(unitless)
1 Developed for Radionuclide Soil
Screening calculator
Fish Contaminated Fraction - farmer
(unitless)
1 Developed for Radionuclide Soil
Screening calculator
Goat Contaminated Fraction - Farmer
(unitless)
1 Developed for Radionuclide Soil
Screening calculator
Goat Milk Contaminated Fraction - Farmer
(unitless)
1 Developed for Radionuclide Soil
Screening calculator
Poultry Contaminated Fraction - farmer
(unitless)
1 Developed for Radionuclide Soil
Screening calculator
Produce Contaminated Fraction - farmer
(unitless)
1 U.S. EPA 2011, U.S. EPA 2005
Sheep Contaminated Fraction - Farmer
(unitless)
1 Developed for Radionuclide Soil
Screening calculator
Sheep Milk Contaminated Fraction - Farmer
(unitless)
1 Developed for Radionuclide Soil
Screening calculator
Swine Contaminated Fraction - farmer
(unitless)
1 Developed for Radionuclide Soil
Screening calculator
Produce Contaminated Fraction - resident
(unitless)
1 U.S. EPA 2011, U.S. EPA 2005
Gamma Shielding Factor - Air (unitless) 1 Developed for Radionuclide Soil
Screening calculator
Gamma Shielding Factor - building (unitless) GSFi × GSFo Developed for Radionuclide Soil
Screening calculator
Gamma Shielding Factor - Indoor (unitless) 0.4 U.S. EPA 2000a. (pg. 2-22). U.S. EPA
2000b. (pg. 2-18)
Gamma Shielding Factor - 15cm (unitless) RN-specific ORNL 2014b
Gamma Shielding Factor - 1cm (unitless) RN-specific ORNL 2014b
Gamma Shielding Factor - 5cm (unitless) RN-specific ORNL 2014b
Gamma Shielding Factor - ground plane
(unitless)
RN-specific ORNL 2014b
7
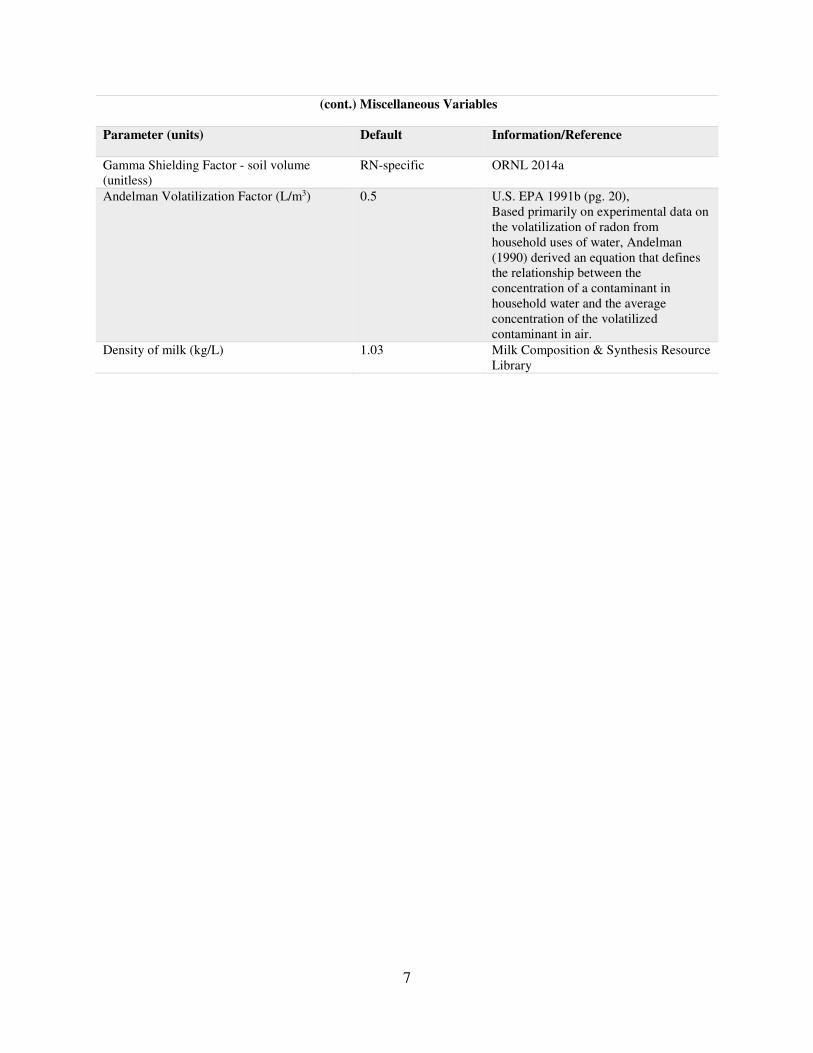
(cont.) Miscellaneous Variables
Parameter (units) Default Information/Reference
Gamma Shielding Factor - soil volume
(unitless)
RN-specific ORNL 2014a
Andelman Volatilization Factor (L/m3) 0.5 U.S. EPA 1991b (pg. 20),
Based primarily on experimental data on
the volatilization of radon from
household uses of water, Andelman
(1990) derived an equation that defines
the relationship between the
concentration of a contaminant in
household water and the average
concentration of the volatilized
contaminant in air.
Density of milk (kg/L) 1.03 Milk Composition & Synthesis Resource
Library

8
Tissue Transfer Factors and Animal Ingestion Rates of Fodder, Water, and Soil
Parameter (units) Default Information/Reference
Fish Transfer Factor (L/kg) RN-specific hierarchy selection in ORNL (2016)
Soil to Plant Transfer Factor - dry (pCi/g-
dry plant per pCi/g-dry soil)
RN-specific hierarchy selection in ORNL (2016)
Soil to Plant Transfer Factor - wet (pCi/g-
fresh plant per pCi/g-dry soil)
RN-specific hierarchy selection in ORNL (2016)
Irrigation Period (unitless) 0.25 Personal communication
Animal On-site Fraction - beef (unitless) 1 Developed for this calculator
Animal On-site Fraction - dairy (unitless) 1 Developed for this calculator
Animal On-site Fraction - goat (unitless) 1 Developed for this calculator
Animal On-site Fraction - goat milk
(unitless)
1 Developed for this calculator
Animal On-site Fraction - poultry (unitless) 1 Developed for this calculator
Animal On-site Fraction - sheep (unitless) 1 Developed for this calculator
Animal On-site Fraction - sheep milk
(unitless)
1 Developed for this calculator
Animal On-site Fraction - swine (unitless) 1 Developed for this calculator
Fraction of Year Animal On Site - beef
(unitless)
1 Developed for this calculator
Fraction of Year Animal On Site - dairy
(unitless)
1 Developed for this calculator
Fraction of Year Animal On Site - goat
(unitless)
1 Developed for this calculator
Fraction of Year Animal On Site - goat milk
(unitless)
1 Developed for this calculator
Fraction of Year Animal On Site - poultry
(unitless)
1 Developed for this calculator
Fraction of Year Animal On Site - sheep
(unitless)
1 Developed for this calculator
Fraction of Year Animal On Site - sheep
milk (unitless)
1 Developed for this calculator
Fraction of Year Animal On Site - swine
(unitless)
1 Developed for this calculator
Interception Fraction (unitless) 0.42 Miller, C. W. 1980,
The fraction of deposited materials intercepted
and initially retained (i.e. not immediately
blown or washed off) by vegetation.
Irrigation Rate (L/m2) 3.62 Personal communication
aerial deposition from irrigation multiplier RN-specific Calculated
resuspension from irrigation multiplier RN-specific Calculated
root uptake from irrigation multiplier RN-specific Calculated

9
(cont.) Tissue Transfer Factors and Animal Ingestion Rates of Fodder, Water, and Soil
Parameter (units) Default Information/Reference
Pasture Plant Mass Loading Factor (g dry
soil per g dry plant)
0.25 Hinton, T. G. 1992
Produce Plant Mass Loading Factor (g dry
soil per g fresh plant)
plant-specific ORNL (2016)
Area Density for Root Zone (kg/m2) 240 Hoffman, F. O., R. H. Gardner, and K. F.
Eckerman. 1982; Peterson, H. T., Jr. 1983;
McKone, T. E. 1994
Beef Fodder Intake Rate (kg/day) 11.77 U.S. EPA 2005 (pg. B-138)
Dairy Fodder Intake Rate (kg/day) 20.3 U.S. EPA 2005 (pg. B-145)
Goat Fodder Intake Rate (kg/day) 1.27 Lyons et. al. 1999
Goat Milk Fodder Intake Rate (kg/day) 1.59 Lyons et. al. 1999 and Tarr
Chicken Fodder Intake Rate (kg/day)
Duck Fodder Intake Rate (kg/day)
Turkey Fodder Intake Rate (kg/day)
Goose Fodder Intake Rate (kg/day)
0.2
0.24
0.68
0.33
U.S. EPA 2005 (pg. B-158/164)
NRC 1994
NRC 1994
NRC 1994
Sheep Fodder Intake Rate (kg/day) 1.75 Lyons et. al. 1999 and OMAFRA
Sheep Milk Fodder Intake Rate (kg/day) 3.15 Lyons et. al. 1999 and OMAFRA
Swine Fodder Intake Rate (kg/day) 4.7 U.S. EPA 2005 (pg. B-152)
Beef Soil Intake Rate (kg/day) 0.5 U.S. EPA 2005 (pg. B-139)
Dairy Soil Intake Rate (kg/day) 0.4 U.S. EPA 2005 (pg. B-146)
Goat Soil Intake Rate (kg/day) 0.23 Handbook of Ecotoxicology (Qs is 18% of Qp:
sheep surrogate used)
Goat Milk Soil Intake Rate (kg/day) 0.29 Handbook of Ecotoxicology (Qs is 18% of Qp:
sheep surrogate used)
Chicken Soil Intake Rate (kg/day)
Duck Soil Intake Rate (kg/day)
Turkey Soil Intake Rate (kg/day)
Goose Soil Intake Rate (kg/day)
0.022
0.024
0.068
0.033
U.S. EPA 2005 (pg. B-159/165)
NRC 1994 (Qs is 10% of Qp)
NRC 1994 (Qs is 10% of Qp)
NRC 1994 (Qs is 10% of Qp)
Sheep Soil Intake Rate (kg/day) 0.32 Handbook of Ecotoxicology (Qs is 18% of Qp)
Sheep Milk Soil Intake Rate (kg/day) 0.57 Handbook of Ecotoxicology (Qs is 18% of Qp)
Swine Soil Intake Rate (kg/day) 0.37 U.S. EPA 2005 (pg. B-153)
Beef Water Intake Rate (L/day) 53 U.S. EPA 1999a (pg 10-23). U.S. EPA 1997b.
Dairy Water Intake Rate (L/day) 92 U.S. EPA 1999a (pg 10-23). U.S. EPA 1997b.
Goat Water Intake Rate (L/day) 3.81 Tarr
Goat Milk Water Intake Rate (L/day) 8.75 Tarr

10
(cont.) Tissue Transfer Factors and Animal Ingestion Rates of Fodder, Water, and Soil
Parameter (units) Default Information/Reference
Chicken Water Intake Rate (L/day)
Duck Water Intake Rate (L/day)
Turkey Water Intake Rate (L/day)
Goose Water Intake Rate (L/day)
0.4
0.48
1.36
0.66
U.S. EPA 2005 (pg. B-159/165), NRC 1994
pg.15 (Qw=2×Qp)
Sheep Water Intake Rate (L/day) 5.25 OMAFRA
Sheep Milk Water Intake Rate (L/day) 10.4 OMAFRA
Swine Water Intake Rate (L/day) 11.4 NEC, Swine Nutrition Guide (pg. 19). U.S.
EPA 1998 (pg B-180)
soil resuspension multiplier (g dry soil per g
fresh plant)
=MLF (pasture
or produce)
Hinton 1992
dry root uptake for pasture multiplier
(pCi/g-dry plant per pCi/g-dry soil)
RN-specific
(=Bvdry)
hierarchy selection in ORNL (2016)
wet root uptake for produce multiplier
(pCi/g-fresh plant per pCi/g-dry soil)
RN-specific
(=Bvwet)
hierarchy selection in ORNL (2016)
Translocation Factor (unitless) 1 NCRP 1984
Long Term Deposition and Buildup (day) 10950 NCRP 1985
Beef Transfer Factor (day/kg) RN-specific hierarchy selection in ORNL (2016)
Dairy Transfer Factor (day/L) RN-specific hierarchy selection in ORNL (2016)
Egg Transfer Factor (day/kg) RN-specific hierarchy selection in ORNL (2016)
Goat Transfer Factor (day/kg) RN-specific hierarchy selection in ORNL (2016)
Goat Milk Transfer Factor (day/L) RN-specific hierarchy selection in ORNL (2016)
Poultry Transfer Factor (day/kg) RN-specific hierarchy selection in ORNL (2016)
Sheep Transfer Factor (day/kg) RN-specific hierarchy selection in ORNL (2016)
Sheep Milk Transfer Factor (day/L) RN-specific hierarchy selection in ORNL (2016)
Swine Transfer Factor (day/kg) RN-specific hierarchy selection in ORNL (2016)
Above Ground Exposure Time (day) 60 NCRP 1985
Weathering Half-life (day) 14 NCRP 1989
Plant Yield - wet (kg/m2) 2 NCRP 1985
Effective Rate of Removal from Soil
(1/day)
λHL + λi NCRP 1989
Effective Rate of Removal from Produce
(1/day)
λi + (0.693/tw) NCRP 1989
Rate of removal from soil by harvesting or
leaching (1/day)
0.000027 NCRP 1989
decay of parent or daughter products (1/day) 0.693/HL(days) NCRP 1989

11
Inhalation, Ingestion, and Consumption Rates
Parameter (units) Default Information/Reference
Recreator Immersion Factor - age-adjusted (hours) site-specific U.S. EPA 1991a (pg. 15)
Farmer Inhalation Fraction - age-adjusted (m3) 259,000 Calculated using the age-adjusted
intake factors equation.
This fraction is to take into account the
different between children and adults,
age adjusted fractions are used to
account for changes in the receptor
ages.
Recreator Inhalation Fraction - age-adjusted (m3) site-specific Calculated using the age-adjusted
intake factors equation.
Resident Inhalation Rate - age-adjusted (m3) 161,100 Calculated using the age-adjusted
intake factors equation.
Farmer Beef Ingestion Fraction - age-adjusted (g) 2,098,950 Calculated using the aged adjusted
intake factors equation
Farmer Dairy Ingestion Fraction - age-adjusted (g) 10,138,030 Calculated using the aged adjusted
intake factors equation
Farmer Egg Ingestion Rate - age-adjusted (g) 775,810 Calculated using the aged adjusted
intake factors equation
Farmer Produce Ingestion Fraction - age-adjusted (g) plant-specific Calculated using the aged adjusted
intake factors equation
Farmer Fish Ingestion Fraction - age-adjusted (g) 10,018,960 Calculated using the aged adjusted
intake factors equation
Farmer Poultry Ingestion Fraction - age-adjusted (g) 1,376,550 Calculated using the aged adjusted
intake factors equation
Resident Produce Ingestion Fraction - age-adjusted
(g)
plant-specific Calculated using the aged adjusted
intake factors equation
Farmer Soil Ingestion Fraction - age-adjusted (mg) 1,610,000 Calculated using the age-adjusted
intake factors equation.
Recreator Ingestion Fraction - age-adjusted (mg) site-specific Calculated using the age-adjusted
intake factors equation.
Resident Ingestion Fraction - age-adjusted (mg) 1,120,000 Calculated using the age-adjusted
intake factors equation.
Farmer Swine Ingestion Fraction - age-adjusted (g) 1,171,520 Calculated using the aged adjusted
intake factors equation
Recreator Surface Water Ingestion Fraction - age-
adjusted (L)
site-specific Calculated using the age-adjusted
intake factors equation.
Resident Tapwater Ingestion Rate - age-adjusted (L) 19,138 Calculated using the age-adjusted
intake factors equation.
Construction Worker Inhalation Rate (m3/day; based
on a rate of 2.5m3/hour for 24 hours)
60 U.S. EPA 1997a (pg. 5-11)
Soil Inhalation Rate - adult farmer(m3/day) 20 U.S. EPA 1991a (pg. 15)
Farmer Inhalation Rate - child (m3/day) 10 U.S. EPA 1997a (pg. 5-11)
Indoor Worker Inhalation Rate (m3; based on a rate
of 2.5m3/hour for 24 hours)
60 U.S. EPA 1997a (pg. 5-11)
Outdoor Worker Inhalation Rate (m3/day; based on a
rate of 2.5m3/hour for 24 hours)
60 U.S. EPA 1997a (pg. 5-11)
Recreator Inhalation Rate - adult (m3/day) 20 U.S. EPA 1991a (pg. 15)

12
(cont.) Inhalation, Ingestion, and Consumption Rates
Parameter (units) Default Information/Reference
Recreator Inhalation Rate - child (m3/day) 10 U.S. EPA 1997a (pg. 5-11)
Resident Inhalation Rate - adult (m3/day) 20 U.S. EPA 1991a (pg. 15)
Resident Inhalation Rate - child (m3/day) 10 U.S. EPA 1997a (pg. 5-11)
Composite Worker Inhalation Rate (m3/day; based
on a rate of 2.5m3/hour for 24 hours)
60 U.S. EPA 1997a (pg. 5-11)
Farmer Beef Ingestion Rate - adult (g/day) 165.3 U.S. EPA 2011 (Table 13-33)
Farmer Beef Ingestion Rate - child (g/day) 62.8 U.S. EPA 2011 (Table 13-33)
Farmer Dairy Ingestion Rate - adult (g/day) 676.4 U.S. EPA 2011 (Table 11-4)
Farmer Dairy Ingestion Rate - child (g/day) 994.7 U.S. EPA 2011 (Table 11-4)
Farmer Egg Ingestion Rate - adult (g/day) 59.6 U.S. EPA 2011 (Table 13-40)
Farmer Egg Ingestion Rate - child (g/day) 31.7 U.S. EPA 2011 (Table 13-40)
Farmer Produce Ingestion Rate - adult (g/day) plant-specific U.S. EPA 2011 (Table 13-10)
Farmer Produce Ingestion Rate - child (g/day) plant-specific U.S. EPA 2011 (Table 13-10)
Farmer Fish Ingestion Rate - adult (g/day) 831.8 U.S. EPA 2011 (Table 13-20)
Farmer Fish Ingestion Rate - child (g/day) 57.4 U.S. EPA 2011 (Table 13-20)
Resident Fish Ingestion Rate (g/day) 54 U.S. EPA 1991a (page 15)
Farmer Poultry Ingestion Rate - adult (g/day) 107.4 U.S. EPA 2011 (Table 13-52)
Farmer Poultry Ingestion Rate - child (g/day) 46.9 U.S. EPA 2011 (Table 13-52)
Resident Produce Ingestion Rate - adult (g/day) plant-specific U.S. EPA 2011 (Table 13-10)
Resident Produce Ingestion Rate - child (g/day) plant-specific U.S. EPA 2011 (Table 13-10)
Construction Worker Soil Ingestion Rate (mg/day) 330
Farmer Soil Ingestion Rate - adult (mg/day) 100 U.S. EPA 1991a (pg. 15)
Farmer Soil Ingestion Rate - child (mg/day) 200 U.S. EPA 1991a (pg. 15)
Indoor Worker Soil Ingestion Rate (mg/day) 50 U.S. EPA 2001 (pg. 4-3)
Outdoor Worker Soil Ingestion Rate (mg/day) 100 U.S. EPA 1991a (pg. 15)
Recreator Soil Ingestion Rate - adult (mg/day) 100 U.S. EPA 1991a (pg. 15)
Recreator Soil Ingestion Rate - child (mg/day) 200 U.S. EPA 1991a (pg. 15)

13
(cont.) Inhalation, Ingestion, and Consumption Rates
Parameter (units) Default Information/Reference
Resident Soil Ingestion Rate - adult (mg/day) 100 U.S. EPA 1991a (pg. 15)
Resident Soil Ingestion Rate - child (mg/day) 200 U.S. EPA 1991a (pg. 15)
Composite Worker Soil Ingestion Rate (mg/day) 100 U.S. EPA 1991a (pg. 15)
Farmer Swine Ingestion Rate - adult (g/day) 92.5 U.S. EPA 2011 (Table 13-51)
Farmer Swine Ingestion Rate - child (g/day) 33.7 U.S. EPA 2011 (Table 13-51)
Recreator Surface Water Ingestion Rate - adult
(L/hour)
0.071 Adult upper percentile from Table 3.5 of
EFH 2011
Recreator Surface Water Ingestion Rate - child
(L/hour)
0.12 Child upper percentile from Table 3.5 of
EFH 2011
Resident Tapwater Ingestion - adult (L/day) 2.5 U.S. EPA 2011a, Tables 3-15 and 3-33;
weighted average of 90th percentile
consumer-only ingestion of drinking water
(birth to <6 years)
Resident Tapwater Ingestion - child (L/day) 0.78 U.S. EPA 2011a, Tables 3-15 and 3-33;
weighted average of 90th percentile
consumer-only ingestion of drinking water
(birth to <6 years)

14
Exposure Frequency, Exposure Duration, and Exposure Time Variables
Parameter (units) Default Information/Reference
Construction Worker Exposure Frequency
(days/week)
5 U.S. EPA 2002 Exhibit 5-1
Construction Worker Exposure Duration (years) 1 U.S. EPA 2002 Exhibit 5-1
Farmer Exposure Duration (years) 40 U.S. EPA 2005 (Table 6-3)
Farmer Exposure Duration - adult (years) 34 U.S. EPA 1994a
Farmer Exposure Duration - child (years) 6 U.S. EPA 2005 (Table 6-3)
Indoor Worker Exposure Duration (years) 25 U.S. EPA 1991a (pg. 15)
Outdoor Worker Exposure Duration (years) 25 U.S. EPA 1991a (pg. 15)
Recreator Exposure Duration (years) site-specific U.S. EPA 2011a, Table 16-108; 90th
percentile or current residence time.
Recreator Exposure Duration - adult (years) site-specific -
Recreator Exposure Duration - child (years) site-specific U.S. EPA 1991a, Pages 6 and 15
Resident Exposure Duration (years) 26 U.S. EPA 2011a, Table 16-108; 90th
percentile or current residence time.
Resident Exposure Duration - adult (years) 20 EDres (26 years) - EDres-c (6 years)
Resident Exposure Duration - child (years) 6 U.S. EPA 1991a, Pages 6 and 15
Composite Exposure Duration (years) 25 U.S. EPA 1991a (pg. 15)
Construction Worker Exposure Frequency (days/year) 250 U.S. EPA 2002 Exhibit 5-1
Farmer Exposure Frequency (days/year) 350 U.S. EPA 1991a (pg. 15)
Indoor Worker Exposure Frequency (days/year) 250 U.S. EPA 1991a (pg. 15)
Outdoor Worker Exposure Frequency (days/year) 225 U.S. EPA 1991a (pg. 15)
Recreator Exposure Frequency - (days/year) site-specific U.S. EPA 1991a (pg. 15)
Recreator Exposure Frequency - adult (days/year) site-specific U.S. EPA 1991a (pg. 15)
Recreator Exposure Frequency - child (days/year) site-specific U.S. EPA 1991a (pg. 15)
Resident Exposure Frequency - (days/year) 350 U.S. EPA 1991a (pg. 15)
Resident Exposure Frequency - adult (days/year) 350 U.S. EPA 1991a (pg. 15)
Resident Exposure Frequency - child (days/year) 350 U.S. EPA 1991a (pg. 15)
Composite Worker Exposure Frequency (days/year) 250 U.S. EPA 1991a (pg. 15)

15
(cont.) Exposure Frequency, Exposure Duration, and Exposure Time Variables
Parameter (units) Default Information/Reference
Construction Worker Exposure Time (hours/day) 8 Eight Hours per 24 hour Day
Farmer Exposure Time (hours/day) 24 24 Hours per 24 hour Day
Farmer Exposure Time - away (hours/day) 1.83 U.S. EPA 2011 (Tables 16-20 and 16-24
total of time in vehicles, near vehicles
and outdoors other than near residence
25th%)
Farmer Exposure Time - indoor (hours/day) 10.0 1440 hrs/day - (ETf-o + ETf-a)
Farmer Exposure Time - outdoor (hours/day) 12.167 U.S. EPA 2011 (Table 16-20 95th%))
Indoor Worker Exposure Time (hours/day) 8 Eight Hours per 24 hour Day
Outdoor Worker Exposure Time (hours/day) 8 Eight Hours per 24 hour Day
Recreator Exposure Time (hours/day) site-specific
Recreator Exposure Time - adult (hours/day) site-specific
Recreator Exposure Time - child (hours/day) site-specific
Resident Exposure Time (hours/day) 24 24 Hours per 24 hour Day
Resident Exposure Time - indoor (hours/day) 16.416 U.S. EPA 2011 (Table 16-16 50th%)
Resident Exposure Time - outdoor (hours/day) 1.752 U.S. EPA 2011 (Table 16-20 50th%))
Composite Worker Exposure Time (hours/day) 8 Eight Hours per 24 hour Day
Number of bathing events per day - adult recreator
(events/day)
site-specific -
Number of bathing events per day - child recreator
(events/day)
site-specific U.S. EPA 1991a, Pages 6 and 15
Number of bathing events per day - adult resident
(events/day)
1
Number of bathing events per day - child resident
(events/day)
1
Construction Worker Exposure Frequency
(weeks/year)
50 U.S. EPA 2002 Exhibit 5-1

16
Soil to Groundwater SSL Factor Variables
Parameter (units) Default Information/Reference
Target soil leachate concentration (pCi/L) nonzero MCL or RSL × DAF U.S. EPA. 2002 Equation 4-14
mixing zone depth (m) site-specific U.S. EPA. 2002 Equation 4-12
aquifer thickness (m) site-specific U.S. EPA. 2002 Equation 4-10
Dilution attenuation factor (unitless) 1 (or site-specific) U.S. EPA. 2002 Equation 4-11
depth of source (m) site-specific U.S. EPA. 2002 Equation 4-10
Exposure duration 70 U.S. EPA. 2002 Equation 4-14
hydraulic gradient (m/m) site-specific U.S. EPA. 2002 Equation 4-11
Infiltration Rate (m/year) 0.18 U.S. EPA. 2002 Equation 4-11
aquifer hydraulic conductivity (m/year) site-specific U.S. EPA. 2002 Equation 4-11
soil-water partition coefficient (L/kg) = Koc*foc for organics U.S. EPA. 2002 Equation 4-10
source length parallel to ground water flow(m) site-specific U.S. EPA. 2002 Equation 4-11
total soil porosity(Lpore/Lsoil) = 1-(ρb/ρs) U.S. EPA. 2002 Equation 4-10
air-filled soil porosity (Lair/Lsoil) = n-θw U.S. EPA. 2002 Equation 4-10
water-filled soil porosity (Lwater/Lsoil) 0.3 U.S. EPA. 2002 Equation 4-10
dry soil bulk density (kg/L) 1.5 U.S. EPA. 2002 Equation 4-10
soil particle density (Kg/L) 2.65 U.S. EPA. 2002 Equation 4-10
Wind Particulate Emission Factor Variables
Parameter (units) Default Information/Reference
Dispersion constant unitless PEF and region-specific U.S. EPA 2002 Exhibit D-2
Areal extent of the site or contamination
(acres)
0.5 (range 0.5 to 500) U.S. EPA 2002 Exhibit D-2
Dispersion constant unitless PEF and region-specific U.S. EPA 2002 Exhibit D-2
Dispersion constant unitless PEF and region-specific U.S. EPA 2002 Exhibit D-2
Function Dependent on 0.886 × (Ut/Um)
(unitless)
0.194 U.S. EPA. 1996, Appendix D Table 2
Inverse of the Mean Concentration at the
Center of a 0.5-Acre-Square Source (g/m2-
s per kg/m3)
93.77 (region-specific) U.S. EPA 2002 Exhibit D-2
Mean Annual Wind Speed (m/s) 4.69 U.S. EPA. 1996, Appendix D Table 2
Equivalent Threshold Value of Wind
Speed at 7m (m/s)
11.32 U.S. EPA. 1996, Appendix D Table 2
Fraction of Vegetative Cover (unitless) 0.5 U.S. EPA. 2002 Equation 4-5
Particulate Emission Factor - Minneapolis
(m3/kg)
1.36 x 10⁹(region-specific) U.S. EPA 2002 Exhibit D-2,
This factor represents an estimate of
the relationship between soil
contaminant concentrations and the
concentration of these contaminants
in air as a consequence of particle
suspension

17
Mechanical Particulate Emission Factor Variables from Standard Unpaved Road Vehicle Traffic
Parameter (units) Default Information/Reference
Dispersion constant unitless 12.9351 U.S. EPA 2002 Equation 5-6
Surface area of contaminated road segment
(m2)
(AR = LR x WR x
0.092903m2 /ft2 )
U.S. EPA 2002 Equation 5-5
Areal extent of site surface soil contamination
(acres)
0.5 (range 0.5 to 500) U.S. EPA 2002 Equation 5-6
Dispersion constant unitless 5.7383 U.S. EPA 2002 Equation 5-6
Dispersion constant unitless 71.7711 U.S. EPA 2002 Equation 5-6
Dispersion correction factor (unitless) 0.185 U.S. EPA 2002 Equation E-
16
Length of road segment (ft) Site-specific U.S. EPA 2002 Equation 5-5
Number of days with at least 0.01 inches of
precipitation (days/year)
Site-specific U.S. EPA 2002 Exhibit 5-2
Inverse of the ratio of the 1-h geometric mean
concentration to the emission flux along a
straight road segment bisecting a square site
(g/m2-s per kg/m3)
23.02 (for 0.5-acre site) U.S. EPA 2002 Equation 5-5
Total time over which construction occurs (s) site-specific U.S. EPA 2002 Equation 5-5
Mean vehicle weight (tons) (number of cars x tons/car + number
of trucks x tons/truck) / total vehicles) U.S. EPA 2002 Equation 5-5
Width of road segment (ft) 20 U.S. EPA 2002 Equation E-
18
Sum of fleet vehicle kilometers traveled during
the exposure duration (km)
∑VKT = total vehicles x
distance (km/day) x frequency
(weeks/year) x (days/year)
U.S. EPA 2002 Equation 5-5
Particulate Emission Factor - subchronic
(m3/kg)
(site-specific) U.S. EPA 2002 Equation 5-5

18
Mechanical Particulate Emission Factor Variables from Other Construction Activities
Parameter (units) Default Information/Reference
PM10 particle size multiplier (unitless) 0.35 U.S. EPA 2002 Equation E-21
PM10 scaling factor (unitless) 0.60 U.S. EPA 2002 Equation E-23
PM10 scaling factor (unitless) 0.75 U.S. EPA 2002 Equation E-22
Dispersion constant unitless 2.4538 U.S. EPA 2002 Equation E-15
Areal extent of dozing (acres) Site-specific
Areal extent of tilling (acres) Site-specific U.S. EPA 2002 Equation E-24
Areal extent of excavation (m2) (range 0.5 to 500) U.S. EPA 2002 Equation E-21
Areal extent of site surface soil contamination (acres) (range 0.5 to 500) U.S. EPA 2002 Equation E-15
Areal extent of site surface soil contamination (m2) (range 0.5 to 500) U.S. EPA 2002 Equation E-20
Dispersion constant unitless 17.5660 U.S. EPA 2002 Equation E-15
Dozer blade length (m) Site-specific U.S. EPA 2002 Page E-28
Grader blade length (m) Site-specific U.S. EPA 2002 Page E-28
Dispersion constant unitless 189.0426 U.S. EPA 2002 Equation E-15
Average depth of excavation (m) Site-specific U.S. EPA 2002 Equation E-21
Exposure duration (years) Site-specific U.S. EPA 2002 Equation E-20
Function Dependent on 0.886 × (Ut/Um) (unitless) 0.194 U.S. EPA. 1996, Appendix D Table 2
Dispersion correction factor (unitless) Site-specific U.S. EPA 2002 Equation E-16
Total time-averaged PM10 unit emission flux for
construction activities other than traffic on
unpaved roads
Site-specific U.S. EPA 2002 Equation E-25
Unit mass emitted from dozing operations (g) site-specific U.S. EPA 2002 Equation E-22 Unit mass emitted from excavation soil dumping (g) site-specific U.S. EPA 2002 Equation E-21
Unit mass emitted from grading operations (g) site-specific U.S. EPA 2002 Equation E-23
Gravimetric soil moisture content (%) 7.9 (mean value
for overburden)
U.S. EPA 2002 Equation E-22
Gravimetric soil moisture content (%) 12 (mean value
for municipal
landfill cover)
U.S. EPA 2002 Equation E-21
Unit mass emitted from wind erosion (g) site-specific U.S. EPA 2002 Equation E-20
Unit mass emitted from tilling operations (g) site-specific U.S. EPA 2002 Equation E-24
Number of times site is dozed (unitless) Site-specific U.S. EPA 2002 Equation E-22
Number of times soil is dumped (unitless) 2 U.S. EPA 2002 Equation E-21
Number of times site is graded (unitless) Site-specific U.S. EPA 2002 Equation E-23
Number of times soil is tilled (unitless) 2 U.S. EPA 2002 Equation E-24
Inverse of the ratio of the 1-h. geometric mean air
concentration and the emission flux at the center of
the square emission source (g/m2-s per kg/m3)
Site-specific U.S. EPA 2002 Equation E-15
Average dozing speed (kph) 11.4 U.S. EPA 2002 Equation E-22
Soil silt content (%) 6.9 U.S. EPA 2002 Equation E-22
Average grading speed (kph) 11.4 U.S. EPA 2002 Equation E-23
Soil silt content (%) 18 U.S. EPA 2002 Equation E-24
Mean Annual Wind Speed (m/s) 4.69 U.S. EPA. 1996, Appendix D Table 2
Equivalent Threshold Value of Wind Speed at 7 m
(m/s)
11.32 U.S. EPA. 1996, Appendix D Table 2
Fraction of Vegetative Cover (unitless) 0 U.S. EPA 2002 Equation E-20
In situ soil density (includes water) (Mg/m3) 1.68 U.S. EPA 2002 Equation E-21
Sum of dozing kilometers traveled (km) Site-specific U.S. EPA 2002 Equation E-22
Sum of grading kilometers traveled (km) U.S. EPA 2002 Equation E-23
Areal extent of grading (acres) Site-specific
Particulate Emission Factor - subchronic (m3/kg) (site-specific) U.S. EPA 2002 Equation E-26

19
2.4 PRG/DCC References:
ANL (2001). User's Manual for RESRAD Version 6. Argonne National Laboratory, Argonne, IL. ANL/EAD-
4
AMEC (2014). Uptake of Gaseous Carbon-14 in the Biosphere: Development of an Assessment Model.
AMEC/004041/007, Issue 2.
Calabrese E.J., Barnes R., Stanek III E.J., Pastides H., Gilbert CE, Veneman P., Wang XR, Lasztity A., and
Kostecki P.T. (1989); How much soil do young children ingest: an epidemiologic study. Regul Toxicol
Pharmacol: 10(2):123-137.
Davis, S; Waller, P; Buschbom, R; Ballou, J; White, P. (1990). Quantitative estimates of soil ingestion in
normal children between the ages of 2 and 7 years: Population-based estimates using aluminum, silicon, and
titanium as soil tracer elements. Arch Environ Health 45: 112-122.
Environment Agency (E.A.) (2006). Initial radiological assessment methodology - part 2 methods and input
data. United Kingdom. SC030162/SR2.
Environment Agency (E.A.) (2009). Updated technical background to the CLEA model. United Kingdom.
SC050021/SR3. pg. 97 and pg. 100.
Etnier 1980. Till, J. E., H. R. Meyer, E. L. Etnier, E. S. Bomar, R. D. Gentry, G. G. Killough, P. S. Rohwer, V.
J. Tennery, and C. C. Travis Tritium-An Analysis of Key Environmental and Dosimetric Questions.
ORNL/TM-6990. pg 15.
Hinton, T. G. 1992. Contamination of plants by resuspension: a review, with critique of measurement
methods. Sci. Total Environ. 121:171-193
Hoffman, David J.; Rattner, Barnett A.; Burton, G. Allen jr.; Cairns, John jr. 2003. Handbook of
Ecotoxicology: Second Edition. Lewis Publishers.
IAEA 1994. Handbook of Parameter Values for the Prediction of Radionuclide Transfer in Temperate
Environments. International Atomic Energy Agency. TRS-364
IAEA 2009. Quantification of Radionuclide Transfer in Terrestrial and Freshwater Environments for
Radiological Assessments. International Atomic Energy Agency. TECDOC1616.
IAEA 2010. Technical Report Series No. 472: Handbook of Parameter Values for the Prediction of
Radionuclide Transfer in Terrestrial and Freshwater Environments. International Atomic Energy Agency.
TRS-472
ICRP 2008. Nuclear Decay Data for Dosimetric Calculations. ICRP Publication 107. Ann. ICRP 38 (3).
Lyons, Robert K.; Machen, Rick; Forbes, T.D.A. 1999 Understanding Forage Intake in Range
Animals AgriLIFE Extension. Texas A&M.

20
Lugo, A. E.; Brown, S.L.; Dodson, R.; Smith, T.S.; and Shugart, H.H. (1999); The Holdridge life zones of the
conterminous United States in relation to ecosystem mapping ; Journal of Biogeography, 26, 1025-1038
MILLER Ch. W. (1980): An analysis of measured values for the fraction of a radiocative aerosol intercepted
by vegetation. Health Physics, 38: 705 - 712.
NCRP (1996). Screening Models for Releases of Radionuclides to Atmosphere, Surface Water, and Ground,
Vols. 1 and 2, NCRP Report No. 123. National Council on Radiation Protection and
Measurements. http://www.ncrp.com/rpt123.html
NEC. Swine Nutrition Guide. Cooperative Extension Service / South Dakota State University and University
of Nebraska / U.S. Department of Agriculture. Nebraska Cooperative Extension EC 95-273-C.
The pig water ingestion numbers are derived from the USDA "Swine Nutrition Guide" and the EPA Human Health Risk Assessment Protocol for
Hazardous Waste Combustion Facilities, found here. USDA assumes a pig consumes 1/4 to 1/3 gallons of water for every pound of dry feed. The midpoint
of this range (7/24 gallons of water per 1 lbs. of dry feed) was used with the default dry feed, (4.7 kg) from the U.S. EPA, to come up with 3 gallons (11.4
L) per day default water intake.
NRC 1994. Nutrient Requirements of Poultry: Ninth Revised Edition. Washington, DC: The National
Academies Press, 1994.
OMAFRA (2015). Water Requirements of Livestock. Order Number 07-023. July, 2015.
ORNL (2014a). Area Correction Factors for Contaminated Soil for Use in Risk and Dose Assessment
Models and appendix. Center for Radiation Protection Knowledge. September 2014.
ORNL (2014b). Gamma Shielding Factors for Soil Covered Contamination for Use in Risk and Dose
Assessment Models and appendix. Center for Radiation Protection Knowledge. September 2014.
ORNL (2014c). Calculation of Slope Factors and Dose Coefficients and appendix. Center for Radiation
Protection Knowledge. September 2014.
ORNL (2016). Biota Modeling in EPA's Preliminary Remediation Goal and Dose Compliance Concentration
Calculators for Use in EPA Superfund Risk Assessment: Explanation of Intake Rate Derivation, Transfer
Factor Compilation, and Mass Loading Factor Sources Center for Radiation Protection Knowledge. November
2016.
Pinder, J. E. ,. I., and K. W. McLeod. (1989). Mass loading of soil particles on plant surfaces, Health Phys.
57:935-942.
Tarr, Brian. Guidelines to Feeding and Management of Dairy Goats Nutrifax. Shur Gain.
U.S. EPA. (1988). Limiting Values of Radionuclide Intake and Air Concentration and Dose Conversion
Factors for Inhalation, Submersion, and Ingestion. Federal Guidance Report No. 11. Office of Radiation
Programs, Washington, DC. EPA-520/1-88-020. http://www.epa.gov/radiation/federal/index.html
U.S. EPA (1989). U.S. Environmental Protection Agency (U.S. EPA). Risk assessment guidance for
Superfund. Volume I: Human health evaluation manual (Part A). Interim Final. Office of Emergency and
Remedial Response. EPA/540/1-89/002.

21
U.S. EPA (1990). Interim Final Methodology for Assessing Health Risks Associated with Indirect Exposure to
Combustor Emissions. Environmental Criteria and Assessment Office. ORD. EPA-600-90-003. January.
U.S. EPA (1991a). U.S. Environmental Protection Agency (U.S. EPA). Human health evaluation manual,
supplemental guidance: "Standard default exposure factors". OSWER Directive 9285.6-03.
U.S. EPA (1991b). Risk Assessment Guidance for Superfund, Volume I: Human Health Evaluation Manual
(Part B, Development of Risk-Based Preliminary Remediation Goals). Office of Emergency and Remedial
Response. EPA/540/R-92/003. December 1991
U.S. EPA. (1993). External Exposure to Radionuclides in Air, Water, and Soil. Federal Guidance Report No.
12. Office of Radiation and Indoor Air, Washington, DC. EPA 402-R-93-
081. http://www.epa.gov/radiation/federal/index.html
U.S. EPA. (1994a). Estimating Exposure to Dioxin-like Components - Volume III: Site-Specific Assessment
Procedure. Review Draft. Office of Research and Development. Washington D.C. EPA/600/6-88/005Cc. June.
(Also see U.S. EPA. 1994c for direct link to
Table) http://cfpub.epa.gov/ncea/cfm/recordisplay.cfm?deid=34762
U.S. EPA (1994b). Radiation Site Cleanup Regulations: Technical Support Documents for the Development
of Radiation Cleanup Levels for Soil - Review Draft. Office of Radiation and Indoor Air, Washington, DC.
EPA 402-R-96-011A. PDF document View Appendix C here.
U.S. EPA. (1994c). Revised Draft Guidance for Performing Screening Level Risk Analyses at Combustion
Facilities Burning Hazardous Wastes. Attachment C, Draft Exposure Assessment Guidance for RCRA
Hazardous Waste Combustion Facilities. Office of Emergency and Remedial Response. Office of Solid Waste.
December 14. http://www.epa.gov/osw/hazard/tsd/td/combust/finalmact/ssra/05hhrapapc.pdf
U.S. EPA. (1996a). Soil Screening Guidance: User's Guide. Office of Emergency and Remedial Response.
Washington, DC. OSWER No. 9355.4-23 http://www.epa.gov/superfund/health/conmedia/soil/index.htm
U.S. EPA. (1996b). Soil Screening Guidance: Technical Background Document. Office of Emergency and
Remedial Response. Washington, DC. OSWER No. 9355.4-
17A http://www.epa.gov/superfund/health/conmedia/soil/index.htm
U.S. EPA. (1997a). Exposure Factors Handbook. Office of Research and Development, Washington, DC.
EPA/600/P-95/002Fa.
U.S. EPA. (1997b). Parameter Guidance Document. National Center for Environmental Assessment, NCEA-
0238.
U.S. EPA. (1998). Human Health Risk Assessment Protocol for Hazardous Waste Combustion Facilities.
Office of Solid Waste, Washington, DC. EPA530-D-98-001A. A secure PDF can be downloaded here.
U.S. EPA. (1999a). Data Collection for the Hazardous Waste Identification Rule. Office of Solid Waste,
Washington, DC. http://www.epa.gov/osw/hazard/wastetypes/wasteid/hwirwste/risk.htm The section on cattle
fodder, soil and water intakes is here.

22
U.S. EPA (1999b). Volume II, "Review of Geochemistry and Available Kd Values for Cadmium, Cesium,
Chromium, Lead, Plutonium, Radon, Strontium, Thorium, Tritium (3H), and Uranium. Office of Radiation
and Indoor Air. Washington, DC. EPA 402-R-99-004B, August 1999. http://www.epa.gov/cgi-
bin/claritgw?op-Display&document=clserv:OAR:0232;&rank=4&template=epa
U.S. EPA (1999c). Cancer Risk Coefficients for Environmental Exposure to Radionuclides. Federal Guidance
Report No. 13. Office of Radiation and Indoor Air. EPA 402-R-99-001. September
1999. http://www.epa.gov/radiation/federal/index.html
U.S. EPA. (2000a). Soil Screening Guidance for Radionuclides: User's Guide. Office of Emergency and
Remedial Response and Office of Radiation and Indoor Air. Washington, DC. OSWER No. 9355.4-
16A http://www.epa.gov/superfund/health/contaminants/radiation/radssg.htm
U.S. EPA. (2000b). Soil Screening Guidance for Radionuclides: Technical Background Document. Office of
Emergency and Remedial Response and Office of Radiation and Indoor Air. Washington, DC. OSWER No.
9355.4-16 http://www.epa.gov/superfund/health/contaminants/radiation/radssg.htm
U.S. EPA (2002). Role of Background in the CERCLA Cleanup Program. Office of Solid Waste and
Emergency Response, April 26, 2002, OSWER 9285.6-07P
U.S. EPA (2002). Supplemental Guidance for Developing Soil Screening Levels for Superfund Sites. OSWER
9355.4-24. December 2002. http://www.epa.gov/superfund/health/conmedia/soil/index.htm
U.S. EPA (2002). Simulating Transport in the Unsaturated Zone: Evaluation and Sensitivity Analyses of
Select Computer Models.
U.S. EPA. (2005). Human Health Risk Assessment Protocol for Hazardous Waste Combustion Facilities.
Office of Solid Waste, Washington, DC. http://www.epa.gov/osw/hazard/tsd/td/combust/risk.htm. The pdf is
available here.
U.S. EPA. (2011). Exposure Factors Handbook 2011 Edition (Final). National Center for Environmental
Assessment, Office of Research and Development. Washington D.C.
van Wijnen J.H., Clausing P., and Brunekreef B. (1990); Estimated soil ingestion by children. Environ Res:
51(2): 147-162.

23
III. Residual Radioactive Material Guideline (RESRAD-ONSITE)
RESidual RADioactive material guidelines (RESRAD-ONSITE) is a computer model
developed by Argonne National Laboratory for the U.S. Department of Energy (DOE) to
calculate site-specific guidelines, radiation doses and excess lifetime cancer risk to a receptor
chronically exposed on-site to residual radioactive materials (Figure 3). Although DOE is not
regulating non-DOE sites, RESRAD-ONSITE is included in this study, since NRC
recommendeds its use for NRC licensed sites as well as NRC’s DandD code. RESRAD-ONSITE
was first issued in 1989 and updated last in 2016. RESRAD-ONSITE can be downloaded at:
http://www.evs.anl.gov/resrad/.
3.1 RESRAD-ONSITE Exposure Scenarios and Pathways
RESRAD-ONSITE has major exposure pathways; direct exposure to external radiation
from the contaminated soil material; Internal exposure from inhalation of airborne radionuclides;
Internal exposure from inhalation of radon progeny; and internal exposure from ingestion of:
plant foods grown in the contaminated soil and irrigated with contaminated water, meat and milk
from livestock fed with contaminated fodder and water, drinking water from a contaminated well
or pond, fish from a contaminated pond, and contaminated soil.
3.2 RESRAD-ONSITE Recommended Default Input Parameters
Contaminated Zone
Parameter Default Information/Reference
Area of contaminated zone (m2) 1.0E+04 Area in which contains all the soils samples with radionuclide
concentrations that are clearly (2 standard deviations) above
background. This area is assumed to be circular for modeling
purposes.
Thickness of contaminated zone (m) 2.0E+00 Thickness of the area considered to be the contaminated zone.
Length parallel to aquifer flow (m) 1.0E+02 This length is the distance between two parallel lines that are
perpendicular to the direction of aquifer flow, one at the
upgradient edge of the contaminated zone, the other at the
downgradient edge.

24
Cover/Hydrology
Parameter Default Information/Reference
Cover depth (m) 0.0E+00 The cover depth is the distance from the ground surface to the
location of the uppermost soil sample with radionuclide
concentrations that are clearly above background.
Density of cover material (g/cm3) 1.5E+00 The density is the ratio of the mass of a material to its
volume.
Cover depth erosion rate (m/yr) 1.0E-03 The cover depth erosion rate is the rate at which soil is
removed by erosion.
Density of contaminated zone
(g/cm3)
1.5E+00 The density is the ratio of the mass of a material to its
volume.
Contaminated zone erosion rate
(m/yr)
1.0E-03 The contaminated erosion rate is the rate at which soil is
removed by erosion. This parameter is only in effect when
the cover depth equals zero.
Contaminated zone total porosity 4.0E-01 Total porosity of a porous medium is the ratio of the pore
volume to the total volume of a representative sample.
Contaminated zone field capacity 2.0E-01 Effective porosity of a porous medium is the ratio of the part
of the pore volume where water can circulate to the total
volume of a representative sample. Effective porosity should
not be greater than total porosity.
Contaminated zone hydraulic
conductivity (m/yr)
1.0E+01 This value reflects the rate at which groundwater will move
through soil.
Contaminated zone b parameter 5.3E+00 The b parameter is a hydrological parameter used to evaluate
the saturation ratio.
Average annual wind speed
(m/sec)
2.0E+00 The average annual wind speed is the overall average of the
wind speed, measured near the surface in a one-year period.
Humidity in air (g/cm3) 8.0E+00 This parameter is only relevant to the Tritium model
Evapotranspiration coefficient 5.0E-01 The evapotranspiration coefficient represents the total
volume of water that changes phase, that is, from the liquid or
solid state to the gaseous state, near the ground surface and is
transferred to the atmosphere during a fixed period of time.
Precipitation (m/yr) 1.0E+00 The precipitation rate is the average volume of water in the
form of rain, snow, hail, or sleet that falls per unit of area and
per unit of time at the site.
Irrigation (m/yr) 2.0E-01 The irrigation rate is the amount of water that is added to the
soil at the site as a artificial water supply in order to permit
agricultural use of the land.
Irrigation mode overhead
Runoff coefficient 2.0E-01 Runoff coefficient is the fraction of the average annual
precipitation that does not infiltrate into the soil and is not
transferred back into the atmosphere through
evapotranspiration.
Watershed area for nearby stream
or pond (m2)
1.0E+06 The watershed is a region contoured by an imaginary line
connecting ridges or summits of high land and drained by or
draining into a river, river system, or a body of water.
Accuracy for water/soil
computations
1.0E-03 No information available

25
Saturated Zone
Parameter Default Information/Reference
Density of saturated zone (g/cm3) 1.5E+00 The density is the ratio of the mass of a material to its volume.
The saturated zone is the layer of the uncontaminated zone that
lies below the contaminated zone and the unsaturated zone but
within the water table.
Saturated zone total porosity 4.0E-01 Total porosity of a porous medium is the ratio of the pore
volume to the total volume of a representative sample.
Saturated zone effective porosity 2.0E-01 Effective porosity of a porous medium is the ratio of the part of
the pore volume where water can circulate to the total volume of
a representative sample. Effective porosity should not be greater
than total porosity.
Saturated zone field capacity 2.0E-01 Field capacity is the volumetric moisture content of soil at which
(free) gravity drainage ceases. This is the amount of moisture
that will be retained in a column of soil against the force of
gravity. The field capacity sets the lower limit of the volumetric
water content and is used to replace the calculated value when
the calculated value is smaller
Saturated zone hydraulic
conductivity (m/yr)
1.0E+02 Hydraulic conductivity is the measure of the soil's ability to
transmit water when submitted to a hydraulic gradient.
Saturated zone hydraulic gradient 2.0E-02 The hydraulic gradient is the change in hydraulic head per unit
of distance of the groundwater flow in a given direction.
Saturated zone b parameter 5.3E+00 The b parameter is a hydrological parameter used to evaluate the
saturation ratio.
Water table drop rate (m/yr) 1.0E-03 The water table drop rate is the rate at which the depth of the
water table is lowered.
Well pump intake depth (m below
water table)
1.0E+01 The well-pump intake depth is the screened depth of a well
within the aquifer (the saturated zone).
Model: Nondispersion (ND) or
Mass- Balance (MB)
ND The choice of ND (non-dispersion) or MB (mass balance) selects
which of two models used for water/soil concentration ratio
calculations. Selecting 0 uses the ND model where selecting 1
uses the MB model. The MB model is not recommended for
contaminated zone.
Well pumping rate (m3/yr) 2.5E+02 The well pumping rate is the total volume of water obtained
annually from the well for use by humans and livestock.

26
Unsaturated
Parameter Default Information/Reference
Number of unsaturated zone strata 1.0E+00 Number of unsaturated zones used in the model.
Unsat. zone 1, thickness (m) 4.0E+00 The unsaturated zone #1 is the 1st layer of the uncontaminated
zone that lies below the contaminated zone and above the
saturated zone.
Unsat. zone 1, soil density (g/cm3) 1.5E+00 The density is the ratio of the mass of a material to its volume.
Unsat. zone 1, total porosity 4.0E-01 Total porosity of a porous medium is the ratio of the pore
volume to the total volume of a representative sample.
Unsat. zone 1, effective porosity 2.0E-01 Effective porosity of a porous medium is the ratio of the part of
the pore volume where water can circulate to the total volume of
a representative sample. Effective porosity should not be
greater than total porosity.
Unsat. zone 1, field capacity 2.0E-01 Field capacity is the volumetric moisture content of soil at
which (free) gravity drainage ceases. This is the amount of
moisture that will be retained in a column of soil against the
force of gravity.
Unsat. zone 1, soil-specific b
parameter
5.3E+00 The b parameter is a hydrological parameter used to evaluate the
saturation ratio.
Unsat. zone 1, hydraulic
conductivity (m/yr)
1.0E+01 Hydraulic conductivity is the measure of the soil's ability to
transmit water when submitted to a hydraulic gradient.
Unsat. zone 2, thickness (m) 0.0E+00 The unsaturated zone #2 is the 2nd layer of the uncontaminated
zone that lies below the contaminated zone and above the
saturated zone.
Unsat. zone 2, soil density (g/cm3) 1.5E+00 The density is the ratio of the mass of a material to its volume.
Unsat. zone 2, total porosity 4.0E-01 Total porosity of a porous medium is the ratio of the pore
volume to the total volume of a representative sample.
Unsat. zone 2, effective porosity 2.0E-01 Effective porosity of a porous medium is the ratio of the part of
the pore volume where water can circulate to the total volume of
a representative sample. Effective porosity should not be
greater than total porosity.
Unsat. zone 2, field capacity 2.0E-01 Field capacity is the volumetric moisture content of soil at
which (free) gravity drainage ceases. This is the amount of
moisture that will be retained in a column of soil against the
force of gravity.
Unsat. zone 2, soil-specific b
parameter
5.3E+00 The b parameter is a hydrological parameter used to evaluate the
saturation ratio.
Unsat. zone 2, hydraulic
conductivity (m/yr)
1.0E+01 Hydraulic conductivity is the measure of the soil's ability to
transmit water when submitted to a hydraulic gradient.

27
Soil Concentrations - Transport
Parameter Default Information/Reference
Distribution coefficients for all isotopes:
Contaminated zone (cm3/g)
Unsaturated zone (cm3/g)
Saturated zone (cm3/g)
Radionuclide-specific
Distribution coefficients are used to develop
the leach- rate constants between the
surface soil layer, the unsaturated soil layer
and the aquifer.
Leach rate (/yr) 0.0E+00
Solubility constant 0.0E+00
Soil Concentrations
Parameter Default Information/Reference
Basic radiation dose limit (mrem/yr) 2.5E+01 NRC guideline of 25 mrem/yr
Time since placement of material (yr) 0.0E+00 This is the elapsed time, in years, between the
placement of radioactive materials on-site and the
performance of radiological survey. It is possible
that on-site radioactive materials originated from
different sources and have different placement times
Occupancy
Parameter Default Information/Reference
Inhalation rate (m3/yr) 8.4E+04 Inhalation rate determined for subsistence farmer who works land
and has primary residence on site.
Mass loading for inhalation
(g/m3)
1.0E-04 The mass loading parameter is the concentration of soil particles in
the air
Exposure duration (year) 3.0E+01 The exposure duration is the span of time, in years, during which an
individual is expected to spend time on the site. The default value
in RESRAD is 30 years.
Shielding factor, inhalation 4.0E-01 The shielding factor describes the effect of the building structure on
the level of gamma radiation and/or contaminated dust existing
indoors. Shielding factor is dependent on exposure time.
Shielding factor, external
gamma
7.0E-01 The shielding factor describes the effect of the building structure on
the level of gamma radiation and/or contaminated dust existing
indoors. Shielding factor is dependent on exposure time.
Fraction of time spent indoors 6.55E-01 The fraction of time spent indoors onsite is the average fraction of
time in a year during which an individual stays inside a house or a
building on the contaminated site.
Fraction of time spent
outdoors (on site)
2.5E-01 The fraction of time spent outdoors onsite is the average fraction of
time in a year during which an individual stays outdoors on the site.
Shape factor flag, external
gamma
1.0E+00 Setting the shape factor to -1 shows that the contaminated zone is
not circular. The receptor was placed in the approximate center of
a rectangular area.

28
Ingestion, Dietary
Parameter Default Information/Reference
Fruits, vegetables and grain
consumption (kg/yr)
1.6E+02 Consumption rate of fruits, vegetables and grain
Leafy vegetable consumption
(kg/yr)
1.4E+01 Consumption rate of leafy vegetables.
Milk consumption (L/yr) 9.2E+01 Consumption rate of milk.
Meat and poultry
consumption (kg/yr)
6.3E+01 Consumption rates of meat and poultry.
Fish consumption (kg/yr) 5.4E+00 Consumption rate of fish.
Other seafood consumption
(kg/yr)
9.0E-01 Other seafood (lobsters, oysters, scallops, shrimp and other non-fish).
Soil ingestion rate (g/yr) 3.7E+01 The soil ingestion rate is the direct accidental ingestion rate of soil
material or soil dust.
Drinking water intake (L/yr) 5.1E+02 Average amount of water consumed by an adult.
Contamination fraction of
drinking water
1.0E+00 Fraction of substance used that originates from the contaminated site.
Only used when applicable pathway is on. For example, for a
scenario that does obtain drinking water from onsite, this value is
zero. Off-site water is assumed to be uncontaminated
Contamination fraction of
household water
1.0E+00 Fraction of substance used that originates from the contaminated site.
Contamination fraction of
livestock water
1.0E+00 Fraction of substance used that originates from the contaminated site.
Contamination fraction of
irrigation water
1.0E+00 Fraction of substance used that originates from the contaminated site.
Contamination fraction of
aquatic food
5.0E-01 Fraction of substance used that originates from the contaminated site.
Only in effect when the aquatic pathway is turned on.
Contamination fraction of
plant food
-
1.0E+00
Fraction of substance used that originates from the contaminated site.
Only in effect when plant ingestion pathway is turned on.
Contamination fraction of
meat
-
1.0E+00
Fraction of substance used that originates from the contaminated site.
Only in effect when meat ingestion pathway is turned on.
Contamination fraction of
milk
-
1.0E+00
Fraction of substance used that originates from the contaminated site.
Only in effect when milk ingestion pathway is turned on.

29
Ingestion, Non-Dietary
Parameter Default Information/Reference
Livestock fodder intake for meat (kg/day) 6.8E+01 Rate at which beef animals intake fodder (forage, hay
and grain).
Livestock fodder intake for milk (kg/day) 5.5E+01 Rate at which milk cows intake fodder (forage, hay, and
grain).
Livestock water intake for meat (L/day) 5.0E+01 Rate at which beef animals intake water.
Livestock water intake for milk (L/day) 1.6E+02 Rate at which milk cows intake water.
Livestock soil intake (kg/day) 5.0E-01 Rate at which beef animals and milk cows intake soil.
Mass loading for foliar deposition (g/m3) 1.0E-04
Depth of soil mixing layer (m) 1.5E-01
Depth of roots (m) 9.0E-01 This parameter is the average root depth of various
plants grown in the contaminated zone. The root depth
varies for different plants.
Drinking water fraction from ground water 1.0E+00 Fraction of the drinking water obtained from onsite
sources (ground water or surface water).
Household water fraction from ground
water
1.0E+00 Fraction of the household water obtained from onsite
sources (ground water or surface water)
Livestock water fraction from ground
water
1.0E+00 Fraction of the livestock water obtained from onsite
sources (ground water or surface water)
Irrigation fraction from ground water 1.0E+00 Percentage of irrigation water obtained from onsite
ground water rather than on site surface water

30
Ingestion, Non-Dietary - Plant
Parameter Default Information/Reference
Wet weight crop yield for Non-Leafy (kg/m2) 7.0E-01
Wet weight crop yield for Leafy (kg/m2) 1.5E+00
Wet weight crop yield for Fodder (kg/m2) 1.1E+00
Growing Season for Non-Leafy (years) 1.7E-01
Growing Season for Leafy (years) 2.5E-01
Growing Season for Fodder (years) 8.0E-02
Translocation Factor for Non-Leafy 1.0E-01 The translocation fraction is the fraction of activity
deposited on plant surfaces that reaches the edible
parts of the non-leafy plant.
Translocation Factor for Leafy 1.0E+00 The translocation fraction is the fraction of activity
deposited on plant surfaces that reaches the edible
parts of the leafy plant.
Translocation Factor for Fodder 1.0E+00 The translocation fraction is the fraction of activity
deposited on plant surfaces that reaches the edible
parts of the (grains) plant.
Dry Foliar Interception Fraction for Non-
Leafy
2.5E-01 The interception fraction as defined on is the fraction
of deposited activity that is retained on plant
surfaces.
Dry Foliar Interception Fraction for Leafy 2.5E-01 "
Dry Foliar Interception Fraction for Fodder 2.5E-01 "
Wet Foliar Interception Fraction for Non
Leafy
2.5E-01 "
Wet Foliar Interception Fraction for Leafy 2.5E-01 "
Wet Foliar Interception Fraction for Fodder 2.5E-01 "
Weathering Removal Constant for Vegetation 2.0E+01
Carbon-14
Parameter Default Information/Reference
C-12 concentration in water (g/cm3) 2.0E-05 This set of parameters is only in effect if
Carbon 14 is selected as a contaminant.
C-12 concentration in contaminated soil (g/g) 3.0E-03 "
Fraction of vegetation carbon from soil 2.0E-02 "
Fraction of vegetation carbon from air 9.8E-01 "
C-14 evasion layer thickness in soil (m) 3.0E-01 "
C-14 evasion flux rate from soil (1/sec) 7.0E-07 "
C-12 evasion flux rate from soil (1/sec) 1.0E-10 "
Fraction of grain in beef cattle feed 8.0E-01 "
Fraction of grain in milk cow feed 1.0E-01 "
DCF Corrections factor for gaseous forms of C14 8.9E+01 "
31
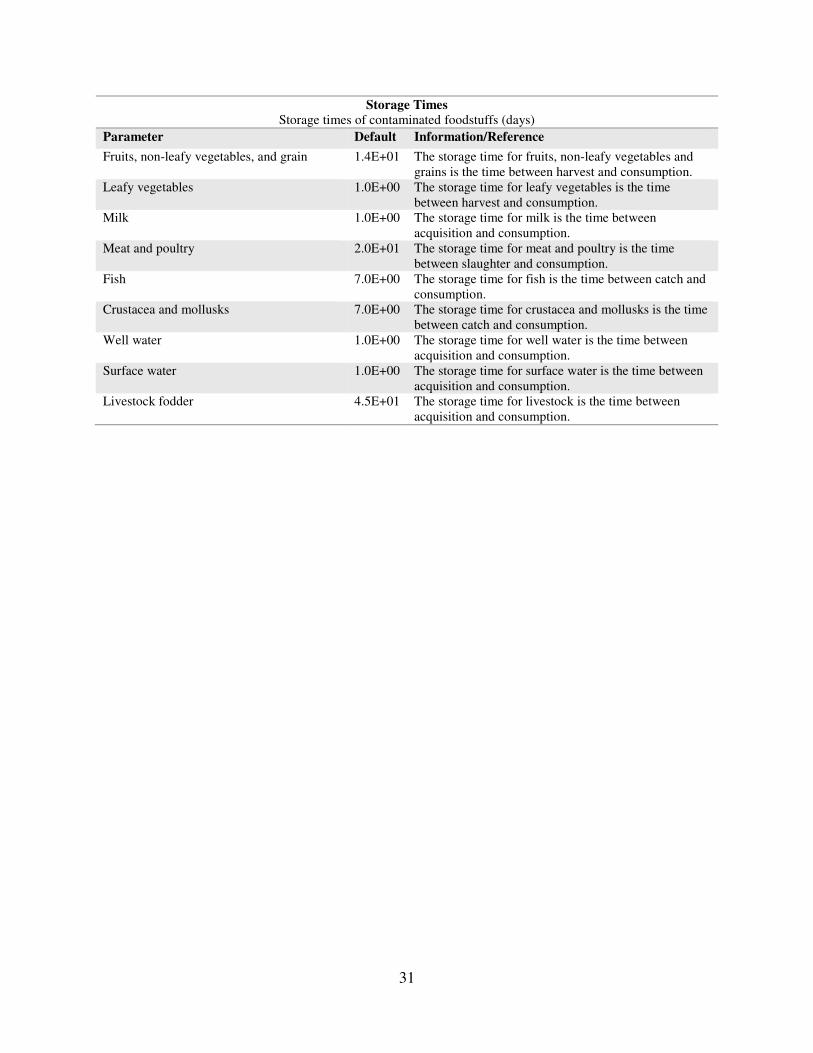
Storage Times
Storage times of contaminated foodstuffs (days)
Parameter Default Information/Reference
Fruits, non-leafy vegetables, and grain 1.4E+01 The storage time for fruits, non-leafy vegetables and
grains is the time between harvest and consumption.
Leafy vegetables 1.0E+00 The storage time for leafy vegetables is the time
between harvest and consumption.
Milk 1.0E+00 The storage time for milk is the time between
acquisition and consumption.
Meat and poultry 2.0E+01 The storage time for meat and poultry is the time
between slaughter and consumption.
Fish 7.0E+00 The storage time for fish is the time between catch and
consumption.
Crustacea and mollusks 7.0E+00 The storage time for crustacea and mollusks is the time
between catch and consumption.
Well water 1.0E+00 The storage time for well water is the time between
acquisition and consumption.
Surface water 1.0E+00 The storage time for surface water is the time between
acquisition and consumption.
Livestock fodder 4.5E+01 The storage time for livestock is the time between
acquisition and consumption.

32
Radon
Parameter Default Information/Reference
Thickness of building foundation (m) 1.5E-01 The thickness of the building foundation is the average
thickness of the building shell structure in the subsurface
of the soil.
Bulk density of building foundation
3
2.4E+00 The density of the foundation material.
Total porosity of the cover material 4.0E-01 Total porosity of a porous medium is the ratio of the pore
volume to the total volume of a representative sample.
Total porosity of the building
foundation
1.0E-01 Total porosity of a porous medium is the ratio of the pore
volume to the total volume of a representative sample.
Volumetric water content of the
cover material
5.0E-02 The volumetric water content in a porous medium is the
ratio of the total volume of water present in the pore space
to the total volume of the medium.
Volumetric water content of the
foundation
3.0E-02 The volumetric water content in a porous medium is the
ratio of the total volume of water present in the pore space
to the total volume of the medium.
Diffusion coefficient for radon gas
(m/sec):
The effective radon diffusion coefficient as the ratio of the
radon flux across the pore area to the gradient of the radon
concentration in the pore spaces.
in cover material 2.0E-06 The value is set to -1 so that the program will generate the
value on the basis of the porosity and water content of the
medium.
in foundation material 3.0E-07 The value is set to -1 so that the program will generate the
value on the basis of the porosity and water content of the
medium.
in contaminated zone soil 2.0E-06 The value is set to -1 so that the program will generate the
value on the basis of the porosity and water content of the
medium.
Radon vertical dimension of mixing
(m)
2.0E+00 The radon vertical dimension of mixing parameter is the
assumed height to which the radon emission from the
ground surface is uniformly mixed in the outdoor air.
Average building air exchange rate
(1/hr)
5.0E-01 The average building air exchange rate is the number of
total volumes of air contained in the building that is being
exchanged with outside air per unit of time.
Height of the building (room) (m) 2.5E+00 The height of the building (room) parameter is the average
height of the living area of the building.
Building interior area factor 0.0E+00 The building interior area factor is the fraction of the floor
area built on the contaminated area.
Building depth below ground surface
(m)
-1.0E+00 The foundation depth below ground surface is the vertical
distance in the soil from the very bottom of the basement
floor slab to the ground surface.
Emanating power of Rn-222 gas 2.5E-01 The radon emanation coefficient is the fraction of the total
amount of radon produced by radium decay that escapes
from the soil particles and gets into the pores of the
medium.
Emanating power of Rn-220 gas 1.5E-01 The radon emanation coefficient is the fraction of the total
amount of radon produced by radium decay that escapes
from the soil particles and gets into the pores of the
medium.
33
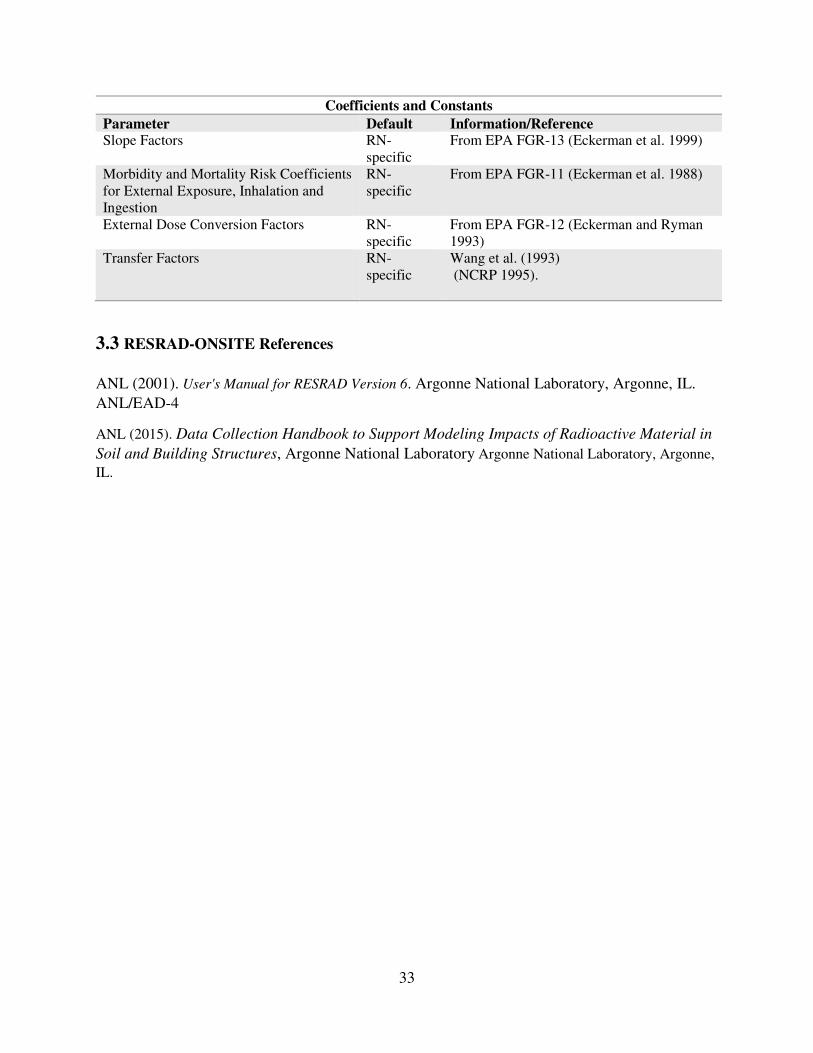
Coefficients and Constants
Parameter Default Information/Reference Slope Factors RN-
specific
From EPA FGR-13 (Eckerman et al. 1999)
Morbidity and Mortality Risk Coefficients
for External Exposure, Inhalation and
Ingestion
RN-
specific
From EPA FGR-11 (Eckerman et al. 1988)
External Dose Conversion Factors RN-
specific
From EPA FGR-12 (Eckerman and Ryman
1993)
Transfer Factors RN-
specific
Wang et al. (1993)
(NCRP 1995).
3.3 RESRAD-ONSITE References
ANL (2001). User's Manual for RESRAD Version 6. Argonne National Laboratory, Argonne, IL.
ANL/EAD-4
ANL (2015). Data Collection Handbook to Support Modeling Impacts of Radioactive Material in
Soil and Building Structures, Argonne National Laboratory Argonne National Laboratory, Argonne,
IL.

34
IV. NORM and LegacY Site Assessment (NORMALYSA)
NORMALYSA is risk assessment model developed by the International Atomic Energy
Agency (IAEA) MODARIA I, Working Group 3, to assess radiological impacts arising from
NORM and radioactively contaminated legacy sites to support remediation (Figure 6).
NORMALYSA library of models consists of four components: Sources (radionuclide releases to
ecosystems), Transport pathways, Receptors, and Dose (exposed human). NORMALYSA has no
user’s manual. Parameters can be obtained from the software.
4.1 NORMALYSA Exposure Scenarios and Pathways
SOURCE TRANSPORT RECEPTOR DOSE
Tailing without cover Groundwater Cropland Occupancy
Tailing with Cover Surface runoff Garden Ingestion
Atmospheric Pastureland Total
Forest
Land
Marine
Freshwater body
Well
House

35
4.2 NORMALYSA Recommended Default Input Parameters
Aquifer
This module simulates radionuclide transport in the aquifer (flow tube) accounting for the advection,
dispersion, radioactive decay and sorption “Transport" block is used to simulate RN migration in
groundwater. The number of compartments N in transport block is determined automatically
considering the accuracy of approximation of advection-dispersion fluxes (Parameter "dispersion
accuracy" is used to control the accuracy of numerical approximations of advection-dispersion fluxes.
The smaller is this parameter the larger is the number of compartments. The recommended value is 0.1-
0.2).
Parameter Default Information/Reference Aquifer Kd (m3/kgDW) 0.7 Sorption Kd values for aquifer material
based on minimum values recommended in
(IAEA, 2010).
Aquifer Material Bulk Density
(kgDW/m3)
1600
Aquifer Porosity (unitless) 0.3
Dispersion Accuracy (unitless) 0.1-0.2 Parameter controlling accuracy of
approximation of dispersive flux in
Transport_AQ block
Flow Tube Area (m2) 4000 Flow tube (aquifer) cross-section area
perpendicular to flow direction
Groundwater Flow Darcy Velocity
(m/year)
10.0 Is used to calculate the input activity flux
through inflow of contaminated groundwater
from upstream direction.
Initial RN Concentration in
Groundwater (Bq/m3)
RN-specific User Provided
Length of The Flow Tube (m) 100
N Max (unitless) 100 Maximum number of cells in Transport_AQ
block (unitless)
N Min (unitless) 5 Minimum number of cells in Transport_AQ
block (unitless)
RN Concentration in Infiltration Water
(Bq/m3)
RN-specific User Provided

36
Aquifer Mixing
Aquifer mixing zone compartment (version 28.10.2013). This compartment is designed to represent a
"transition compartment" between the Uns_Zone_TRANSPORT compartment and
AQUIFER_TRANSPORT compartment. This compartment is used to "translate" vertical transport in
the unsaturated zone to the horizontal transport in the aquifer (flow tube transport). The "Aquifer
mixing" compartments simulates the aquifer zone immediately below the waste site, where
contaminated infiltration flux from the unsaturated zone mixes with the groundwater in the aquifer.
This "transition" compartment is particularly needed in a case the waste site has a large areal extent,
while the aquifer has a low thickness
Parameter Default Information/Reference
Aquifer Material Bulk Density, ( kgDW/m3) 1600
Aquifer Material Kd, (m3/kgDW) 0.7 Sorption Kd values for aquifer
material based on minimum values
recommended in (IAEA, 2010).
Aquifer Mixing Thickness, (m) 10 Thickness of the aquifer "mixing
zone" below the waste site
Aquifer Porosity, (unitless) 0.3
Groundwater Flow Darcy Velocity, (m/year) 10
Infiltration Recharge Rate, (m/year) 0.3
Initial RN Concentration in Groundwater,
(Bq/m3)
User Provided
Length of The Waste Site, (m) 200
RN Concentration in Infiltration Water, (Bq/m3) RN-
specific.
User Provided
RN Concentration in Inflowing Groundwater,
(Bq/m3)
RN-
specific.
User Provided
Waste Site Area (m2) 4000
Atmosphere Chronic
Parameter Default Information/Reference
Average Wind speed in Direction from Release Source to
Recipient Object., (m/s)
1 Average wind speed in
direction from release source
to recipient object
Distance from Release Source to Geometric Center of
Recipient Object.,(m)
1
Normalized Radionuclide Concentration in The Atmospheric
Air, (year/m3)
0
Normalized Rate of Deposition, (1/m2) 0
Release Rate at The Release Point (Bq/year) 1 Radionuclide Specific. User
Provided

37
Atmosphere SR-19
Module for the estimation of ground level air concentration (Bq/m3) and deposition rates (Bq/m2/year)
at a Receptor. The approach of dispersion in the lee of an isolated point source when building wake
effects are insignificant has been applied.
Parameter Default Information/Reference
Distance from The Source to The Receptor,
(m)
1000
Dry Deposition Velocity, (m/day) 500
Frequency at Which Wind Blows in A Year in
The Direction of the Receptor Point
0.25
Height at Which Radioactive Materials Are
Released, (m)
0
Release Rate at The Release Point, (Bq/s) 0
Wet Deposition Velocity, (m/day) 500
Wind at Release Height (m/s) 2 Geometric mean of the wind speed at the
height of release for one representative
year

38
Constants
Parameter Default Information/Reference
Conversion factor from ambient
to effective dose
RN-specific Conversion factor to obtain effective dose for
reference person from ambient dose equivalent
(BfS. 2011)
Dose Coefficient for Effective
Dose by Ingestion, (Sv/Bq)
RN-specific Committed dose over integration period.
(BfS. 2011)
Dose coefficient for effective
dose by inhalation (Sv/Bq)
RN-specific Committed dose over integration period. Age
dependent. (BfS. 2011)
Dose coefficient for effective
dose by Radon inhalation,
((Sv*m3)/(Bq*h))
RN-specific Committed dose over integration period. Age
dependent. (BfS. 2011)
Dose coefficient for effective
dose from immersion in cloud
((Sv*m3)/(Bq*h)
RN-specific
Assuming semi-infinite geometry
Radionuclide Specific. User Provided
Dose coefficient for effective
dose from immersion in water
(Sv*h-1)/(Bq*m-3)
RN-specific User Provided. Dose rate of external irradiation
per unit concentration in water during
swimming
Dose coefficient for effective
dose from surface deposits,
((Sv*h-1)/(Bq*m-2))
RN-specific User Provided
Assuming radionuclides distributed in 5 cm
surface layer, Cs-137: 3.5E-14, Sr-90: 9.7E-18
Dose Coefficient for Effective
Dose from Total Deposit,
(Sv*m3)/(Bq*h)
RN-specific Assuming semi-infinite geometry with constant
concentration
Equilibrium factor inside
buildings
0.4 Equilibrium factor inside buildings between Rn-
222 and its short-lived progeny for reference
person at the exposure location (dimensionless)
(BfS. 2011)
Equilibrium factor outdoors 0.4
Equilibrium factor outdoors between Rn-222
and its short lived progeny for reference person
at the exposure location (dimensionless)
(BfS. 2011)
Factor Cover Depth Fit
Parameter A,
RN-specific User Provided
Factor Cover Depth Fit
Parameter B,
RN-specific User Provided
Factor Cover Depth Fit
Parameter KA, (cm2/g)
RN-specific User Provided
Factor Cover Depth Fit
Parameter KB, (cm2/g)
RN-specific User Provided
Fractional Water Content in
Game Meat,
0.78 User Provided
Fractional Water Content of
Berries,
0.85 Fractional water content of berries, value for
fruits. (IAEA te-1616)

39
(cont.) Constants
Parameter Default Information/Reference
Fractional Water Content of
Mushrooms,
0.9 User Provided
Fractional Water Content of the
Crops,
Cereals 0.12
leafy vegetables
0.12
legumes 0.87
roots; 0.92
Fractional water content of the crops,
(IAEA te-1616)
Fractional Water Content of the
Garden Foods,
0.75
Fractional water content of the garden foods.
(IAEA te-1616)
Ingestion rate of berries
(kg.FW/year)
17
Ingestion rate of berries by
lactating mother, (kg.FW/year)
17
Ingestion Rate of Breastmilk by
Infant, (kg.FW/year)
Ingestion rate of breastmilk by infant.
Ingestion Rate of Crops,
(kg.FW/year)
Crop types, Total annual crops consumption
(kg-fresh weight/year), per crops types.
Ingestion Rate of Crops by
Lactating Mother, (kg.FW/year)
Crop types, Total annual crops consumption
(kg-fresh weight/year), per crops types.
Ingestion rate of freshwater
food, (kg.FW/year)
Yearly consumption of different types of
freshwater food
Ingestion rate of freshwater food
by lactating mother,
(kg.FW/year)
Yearly consumption of different types of
freshwater food
Ingestion rate of game
Ingestion rate of game by
lactating mother
Ingestion rate of garden food
Ingestion rate of garden food by
lactating mother
Ingestion rate of marine food Yearly consumption of different types of marine
food
Ingestion rate of marine food by
lactating mother, (kg.FW/year)
Fish: 0.262
Fish: 1.19
Mussels: 0.0
Yearly consumption of different types of marine
food
Ingestion rate of meat
Adult: beef: 7.931
Adult, sheep: 0.208
Child, beef :10.865
Child, sheep: 0.285
Infant, beef: 7.5762
Infant, sheep: 0.198

40
(cont.) Constants
Parameter Default Information/Reference
Ingestion rate of meat by
lactating mother, (kg.FW/year)
beef :7.9310
sheep:0.208
Ingestion rate of milk, (L /year)
Adult, cow: 31.32
Child, cow :53.69
Infant, cow: 55.264
Yearly consumption of different types of milk
Ingestion rate of milk by
lactating mother, (L /year)
31.320 Yearly consumption of different types of milk
Ingestion rate of mushrooms,
(kg. FW/year)
Adult: 0.45
Child: 0.15
Infant: 4.8
(Turtiainen et al. 2015)
Ingestion rate of mushrooms by
lactating mother, (kg.FW/year)
0.45 (Turtiainen et al. 2015)
Ingestion rate of soil, (kg.DW/h)
Default: 5.0E-6
Child: 1.0E-5
Infant: 5.0E-5
Ingestion rate of soil (kg-dry weight/h).
Ingestion rate of soil by lactating
mother, (kgDW/h)
5.0E-6
Ingestion rate of soil (kg-dry weight/h).
(Smith et al. 2004)
Ingestion rate of water (m3/year) Adult: 0.375
Child/Infant: 0.076
Ingestion rate of water by
lactating mother,(m3/year)
0.375
(Amcoff et al. 2013)
Inhalation rate, (m3/h) Default 0.92
Infants 0.64
Inhalation rate (m3/h) (ICRP Publication 71).
Number of Seconds in A Year,
(s/year)
3.1536E7
Number of Seconds in One
Hour,(s/h)
3600.0
Precipitation Rate
(m3/(m2*year))
0.674
Reduction Factor for Calculation
of Air Concentrations Indoors,
1 Ratio between indoor and outdoor air
concentrations (values between zero and one)
Shielding factor of the building 1 Shielding factor against external exposure to
outdoor radiation that is provided by the
building
Transfer Factors from Ingested
Activity to Breastmilk (d/kgFW)
1 Transfer factors from ingested activity to
breastmilk
Transfer Factors from Inhaled
Activity to Breastmilk,
(d/kgFW)
1 From German regulations
Units Correction from DW to
FW, (kgDW/kgFW)
1
Units correction from DW to FW
Water Content in Aquatic Food, 0.78 Values for fish, (IAEA te-161)
Water Content in Aquatic Food 0.78 Values for fish, (IAEA te-161)
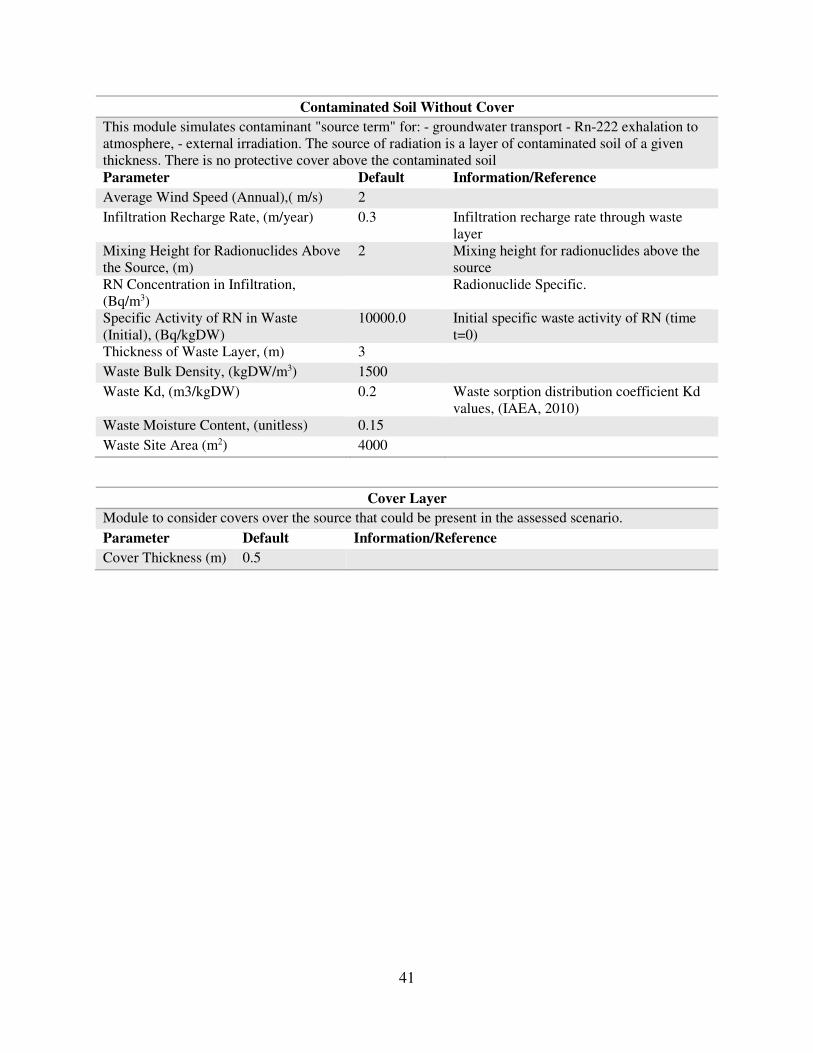
41
Contaminated Soil Without Cover
This module simulates contaminant "source term" for: - groundwater transport - Rn-222 exhalation to
atmosphere, - external irradiation. The source of radiation is a layer of contaminated soil of a given
thickness. There is no protective cover above the contaminated soil
Parameter Default Information/Reference
Average Wind Speed (Annual),( m/s) 2
Infiltration Recharge Rate, (m/year) 0.3 Infiltration recharge rate through waste
layer
Mixing Height for Radionuclides Above
the Source, (m)
2 Mixing height for radionuclides above the
source
RN Concentration in Infiltration,
(Bq/m3)
Radionuclide Specific.
Specific Activity of RN in Waste
(Initial), (Bq/kgDW)
10000.0 Initial specific waste activity of RN (time
t=0)
Thickness of Waste Layer, (m) 3
Waste Bulk Density, (kgDW/m3) 1500
Waste Kd, (m3/kgDW) 0.2 Waste sorption distribution coefficient Kd
values, (IAEA, 2010)
Waste Moisture Content, (unitless) 0.15
Waste Site Area (m2) 4000
Cover Layer
Module to consider covers over the source that could be present in the assessed scenario.
Parameter Default Information/Reference
Cover Thickness (m) 0.5

42
Cropland
Land where industrial agriculture is practiced
Parameter Default Information/Reference
Area, (m2) 30000
Biomass of Crops,
(kgDW/m2)
cereals: 0.39
leafy vegetables:
0.54
legumes: 1.11
roots: 1.02
The aboveground biomass of crops in the considered cropland.
The crops, and crop biomass, will depend on the crops that are
grown in the considered crop land
Bioturbation,
(kgDW/(m2*year)
5.85 Amount of soil (per m2 and year) that is affected by
bioturbation, and the subsequent transport of radionuclides.
Bioturbation is the physical rearrangement (reworking) of the
upper part of the soil profile by soil life. Value is the average
value of total bioturbation found in different soil types at
Forsmark (15.9, 11.9, 0.99, 0.31, 0.19 kgdw/m2 y) in the study
of Persson et al, 2007. (Löfgren A (ed), 2010)
Concentration of
Dust in
Atmospheric Air,
(kgDW/m3)
5.0E-8 Löfgren A (ed), 2010)
Concentration of
Radionuclides in
Air Outdoors,
(Bq/m3)
RN-specific User Provided
Concentration
Ratio for Crops,
Crop types The concentration ratio (radionuclide concentration in
vegetation per radionuclide concentration in soil) for crops.
Values are RN-specific and should as far as possible be
vegetation type and environment specific.
Crop Exposure
Period,
Crop types The number of days that crops have above ground parts and as
a result are exposed to radionuclides (e.g. through irrigation
and deposition).
Density of The
Deep Zone Soil,
(kgDW/m3)
2115 The dry bulk density of the deep zone soil in considered land
object. The default value is for "other soils" (IAEA, 2001)
Density of The
Rooting Zone Soil,
(kgDW/m3)
1626 The dry bulk density of the rooting zone soil in considered land
object. The default value is for "peat soils" Typical density of
the oxic top 0.25 m layer of a soil in Forsmark. (IAEA, 2001)
Deposition Rate,
(Bq year-1 m-2)
Radionuclide Specific, User Provided. The deposition rate of
radionuclides on the surface of the considered object. Both dry
and wet deposition should be considered
Distribution
Coefficient for The
Deep Soil Zone,
(m3/kgDW)
The distribution coefficients for the deep soil zone, i.e. for
inorganic soils, of considered object. Values are element
specific.
Distribution
Coefficient for The
Soil Rooting Zone,
(m3/kgDW)
The distribution coefficients for the rooting zone of the soil, i.e.
for organic soils, of considered object. Values are element
specific.
Erosion Rate,
(kgDW/(m2*year))
0.05 The erosion rate of soils in the considered land type object.
References: (Kirkby et al,2004)

43
(cont.) Cropland
Parameter Default Information/Reference
Evapotranspiration
Rate,
(m3/(m2*year))
Height of The
Deep Soil Zone,
(m)
0.5 Height (thickness) of the deep soil zone, i.e. the soil layer
which extends from below the rooting zone to the groundwater
table.
Height of The Soil
Rooting Zone, (m)
0.25 Height (thickness) of the soil rooting zone. Assumed primary
rooting depth of crops. Values agree with info on soil
compartment "RegoUp_io" in table 2-1 in SKB, 2014. "Kd and
CR for the Biosphere". Report R-13-01, which is used to
describe the RZ_soil in this model (used e.g. for Kd, porosity
and density). (Löfgren A (ed), 2010)
Initial Deposition
On the Cropland,
(Bq)
RN-specific User Provided
Irrigation Rate for
Crops, (m3/
(m2*year)
Crop types, the irrigation rate for crops in considered land type
object. Default values are from Bioprota
Mass Interception
Factor, (m2/kgFW)
0.3 Mass interception factor for plants, defined as the fraction of
deposited materials intercepted and initially retained (i.e. not
immediately blown or washed off) by vegetation (unitless)
divided by above ground biomass of vegetation per unit area
(kg) (IAEA,2001)
Porosity of The
Deep Soil Zone,
(m3/m3)
0.21 Porosity of soil in the deep soil zone in the considered land use
object. Typical porosity for till (which is the dominating soil
type in the subcatchment) in Forsmark. (Table 2-1 in SKB,
2014. "Kd and CR for the Biosphere". Report R-13-01.)
Porosity of The
Soil Rooting Zone,
(m3/m3)
0.36 Porosity of the soil in the rooting zone of the considered land
use object. Typical porosity for the oxic top 0.25 m layer of a
soil in Forsmark.(Table 2-1 in SKB, 2014. "Kd and CR for the
Biosphere". Report R-13-01)
RN Concentration
in Irrigation
Water,( Bq/m3)
RN-specific User Provided
Time Period of
Irrigation of Crops,
(day)
The number of days that vegetation is exposed to irrigation.
(IAEA 2001)
Weathering Half
Time (day)
22.4 Half time of removal of radionuclides from plant surfaces.
Values presented are averages of presneted values in table 6
(over elements and plant groups). (IAEA,2010)

44
Forest
Possible future improvements of this model: 1. Better consideration of interception by vegetation
Consider effects of C-14 accumulation in soil, recycling to air and root uptake
Parameter Default Information/Reference
Area, (m2) 2000000
Biomass of Leaves, (kgDW/m2) 0.5 The biomass of tree leaves in the considered
wetland. The biomass of the tree leaves will
depend on the tree type considered (eg.
deciduous or coniferous).
Biomass of Lichens, (kgDW/m2) 0.5
Biomass of Understorey,
(kgDW/m2)
0.08 The aboveground biomass of understorey plants
Biomass of Wood, (kgDW/m2) 5.1 The biomass of tree wood in the considered
wetland
Concentration of Dust in
Atmospheric Air, (kgDW/m3)
5.0E-8 Concentration of dust in atmospheric air,
(Löfgren ed, 2010)
Concentration of Radionuclides
in Air Outdoors, (Bq/m3)
RN-specific User Provided
Concentration Ratio for Berries,
(kgDW/kgDW)
RN-specific The concentration ratio (radionuclide
concentration in vegetation per radionuclide
concentration in soil) for forest berries. Values
are element specific and should as far as possible
be vegetation type and environment specific.
Concentration Ratio for Game,
(kgDW/kgDW)
RN-specific The concentration ratio (radionuclide
concentration in animal per radionuclide
concentration in animal feed) for game. Values
are radionuclide specific and should as far as
possible be animal and environment specific
Concentration Ratio for
Mushrooms, (kgDW/kgDW)
RN-specific The concentration ratio (radionuclide
concentration in mushrooms per radionuclide
concentration in soil). Values are element
specific and should as far as possible be
environment specific.
Concentration Ratio for Tree
Leaves, (kgDW/kgDW)
RN-specific The concentration ratio (radionuclide
concentration in vegetation per radionuclide
concentration in soil) for tree leaves. Values are
element specific and should as far as possible be
vegetation type and environment specific.
Concentration Ratio for
Understorey, (kgDW/kgDW)
RN-specific The concentration ratio (radionuclide
concentration in vegetation per radionuclide
concentration in soil) for forest understorey
vegetation. Values are element specific and
should as far as possible be vegetation type and
environment specific.
Concentration Ratio for Wood,
(kgDW/kgDW)
RN-specific The concentration ratio (radionuclide
concentration in vegetation per radionuclide
concentration in soil) for tree wood. Values are
element specific and should as far as possible be
vegetation type and environment specific.
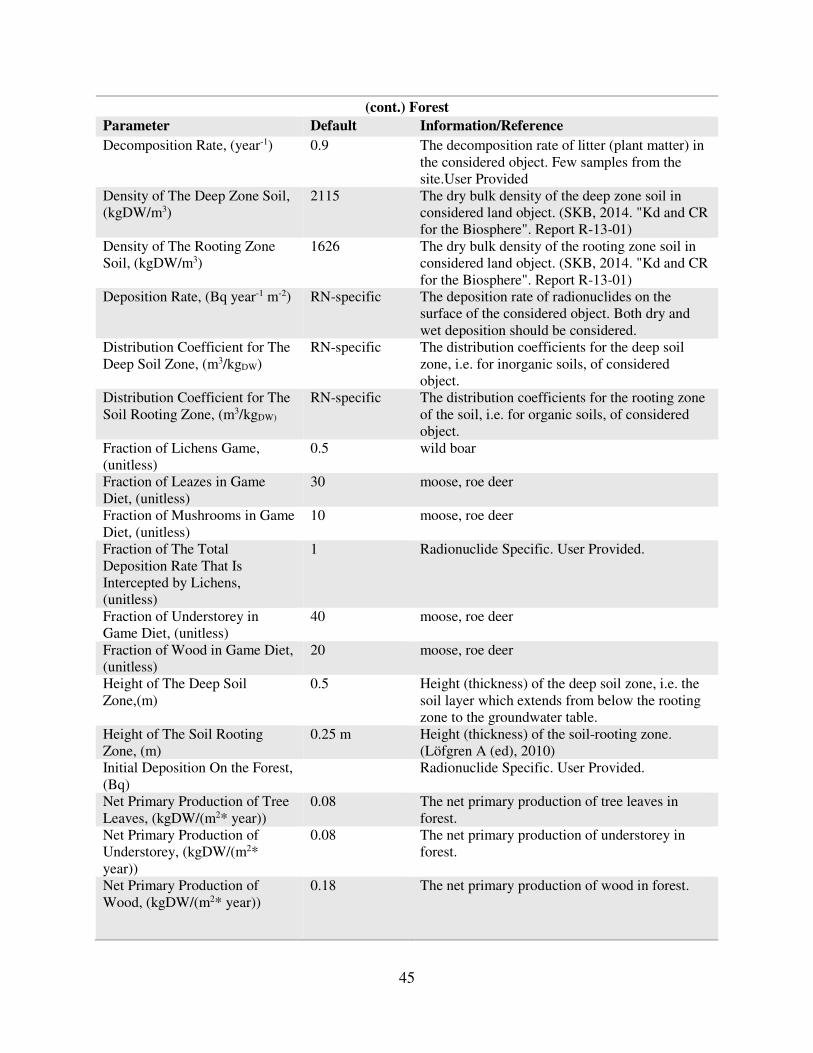
45
(cont.) Forest
Parameter Default Information/Reference
Decomposition Rate, (year-1) 0.9 The decomposition rate of litter (plant matter) in
the considered object. Few samples from the
site.User Provided
Density of The Deep Zone Soil,
(kgDW/m3)
2115 The dry bulk density of the deep zone soil in
considered land object. (SKB, 2014. "Kd and CR
for the Biosphere". Report R-13-01)
Density of The Rooting Zone
Soil, (kgDW/m3)
1626 The dry bulk density of the rooting zone soil in
considered land object. (SKB, 2014. "Kd and CR
for the Biosphere". Report R-13-01)
Deposition Rate, (Bq year-1 m-2) RN-specific The deposition rate of radionuclides on the
surface of the considered object. Both dry and
wet deposition should be considered.
Distribution Coefficient for The
Deep Soil Zone, (m3/kgDW)
RN-specific The distribution coefficients for the deep soil
zone, i.e. for inorganic soils, of considered
object.
Distribution Coefficient for The
Soil Rooting Zone, (m3/kgDW)
RN-specific The distribution coefficients for the rooting zone
of the soil, i.e. for organic soils, of considered
object.
Fraction of Lichens Game,
(unitless)
0.5 wild boar
Fraction of Leazes in Game
Diet, (unitless)
30 moose, roe deer
Fraction of Mushrooms in Game
Diet, (unitless)
10 moose, roe deer
Fraction of The Total
Deposition Rate That Is
Intercepted by Lichens,
(unitless)
1 Radionuclide Specific. User Provided.
Fraction of Understorey in
Game Diet, (unitless)
40 moose, roe deer
Fraction of Wood in Game Diet,
(unitless)
20 moose, roe deer
Height of The Deep Soil
Zone,(m)
0.5 Height (thickness) of the deep soil zone, i.e. the
soil layer which extends from below the rooting
zone to the groundwater table.
Height of The Soil Rooting
Zone, (m)
0.25 m Height (thickness) of the soil-rooting zone.
(Löfgren A (ed), 2010)
Initial Deposition On the Forest,
(Bq)
Radionuclide Specific. User Provided.
Net Primary Production of Tree
Leaves, (kgDW/(m2* year))
0.08 The net primary production of tree leaves in
forest.
Net Primary Production of
Understorey, (kgDW/(m2*
year))
0.08 The net primary production of understorey in
forest.
Net Primary Production of
Wood, (kgDW/(m2* year))
0.18 The net primary production of wood in forest.

46
(cont.) Forest
Parameter Default Information/Reference
Porosity of The Deep Soil Zone,
(m3/m3)
0.21 Porosity of soil in the deep soil zone in the
considered land use object. (Table 2-1 in SKB,
2014. "Kd and CR for the Biosphere". Report R-
13-01)
Porosity of The Soil Rooting
Zone, (m3/m3)
0.36 Porosity of the soil in the rooting zone of the
considered land use object. (Table 2-1 in SKB,
2014. "Kd and CR for the Biosphere". Report R-
13-01)
Rain Interception Factor, 0.3 Fraction of the rain that is intercepted by the
vegetation
Rate of Leaching Of
Radionuclides From Lichens,
(year-1)
0.2 Radionuclide Specific. User Provided.
Transpiration Rate
[m3/(m2*year)]
0.335

47
Fresh Water Body
Module simulates radionuclide (RN) transport and fate in lake water (sediments). This module takes
into account the following process: - RN inflow to lake with water (surface water / groundwater) - RN
releases to lake due to different process (atmospheric deposition, discharges etc.) - RN decay - RN
removal from water column due to sedimentation of suspended particles - RN outflow from the lake
with water (surface water / groundwater)
Parameter Default Information/Reference
Average Lake Depth, (m) 5.58 SMHI website
Bulk Density of Soil in
Subcathmnent Area, (kgDW/m3)
2115 Table 2-1 in SKB, 2014. "Kd and CR for the
Biosphere". Report R-13-01.
Concentration of Suspended
Particulate Matter in Lake Water,
(kgDW/m3)
0.007 (POSIVA BSA, 2012)
Concentration Ratio for
Freshwater Food, (m3/kgDW)
RN-specific The concentration ratio (radionuclide concentration
in aquatic food per element concentration in water)
for freshwater food (Fish, cray fish, mussels).
Values are element specific and should, as far as
possible, be food type and environment specific.
Density of The Deep Sediment
Layer, (kgDW/m3)
71.7 The dry bulk density of the deep sediment layer.
Density of The Top Sediment
Layer, (kgDW/m3)
179 The dry bulk density of the top sediment layer.
This is considered the bioturbated layer of the
sediment. (SKB, 2014. "Kd and CR for the
Biosphere". Report R-13-01. See table 2-1 of the
report.)
Deposition Rate, (Bq/(m2*year)) RN-specific Radionuclide Specific.
Deposition Rate Over the Lake
Subcatchment, (Bq/(m2*year))
RN-specific Total deposition rate, dry and wet, of radionuclides
over the lake subcatchment
Distribution Coefficient for
Suspended Particulate Matter,
(m3/kgDW)
The distribution coefficients for the suspended
particulate matter in the lake. Values are element
specific.
Distribution Coefficient of Soil in
The Lake Subcatchment Area,
(m3/kgDW)
Distribution coefficient of soil in the lake
subcatchment area.
Height of The Deep Sediment
Layer, (m)
0.96 Height (thickness) of the deep sediment layer of
the lake.
Height of The Top Sediment
Layer, (m)
0.05 Height (thickness) of the top sediment layer of the
lake. This is considered the bioturbated layer of the
sediment. It is thickness is kept constant in time.
(SKB, 2014. "Kd and CR for the Biosphere".
Report R-13-01. See table 2-1 of the report, and
chapter 5.10)
Initial Deposition On the
Subcathment, (Bq)
Deposition on subcathment compartment of the
freshwater body
Initial Deposition On Water, (Bq) On the water compartment of the freshwater body

48
(cont.) Fresh Water Body
Parameter Default Information/Reference Lake Area, (m) 1800000
Measured Radionuclide Concentration in Water,
Porosity of Soil in Subcathment Area, (m3/m3) 0.21 water filled porosity of soil in
subcathment area. (Table 2-1 in SKB,
2014. "Kd and CR for the Biosphere",
Report R-13-01)
Porosity of The Top Sediment, (m3/m3) 0.92 Porosity of the soil in the top sediment
in lake. This is considered the
bioturbated layer of the sediment.
(SKB, 2014. "Kd and CR for the
Biosphere", Report R-13-01. See table
2-1 of the report)
Radionuclide Distribution Coefficient, (m3/kgDW) The distribution coefficients for the
top layer of the lake bottom sediment.
Values are element specific.
Release Rate of Radionuclides, (Bq/year) RN-
specific
User Provided.
Resuspension Rate, (kgDW/(m2*year) The sediment resuspension (the
renewed suspension of a precipitated
sediment) rate in lake.
Runoff, (m/year) 0.2 The runoff (P-ET, assuming no change
in storage and a closed system) in the
considered area
Sedimentation Rate, (kgDW/(m2*year)) 0.05 The sedimentation rate of particles in
the lake water, i.e. the rate at which
particles in suspension settle out of the
water and come to rest on the lake
bottom.
Subcatchment Area, (m2) 1.5E7 Area of the lake subcatchment
Thickness of Soil in Subcathment Area, (m) 0.5
Upstream Water Flux (m3/year) 0 Water flux from affluent river or other
water body upstream
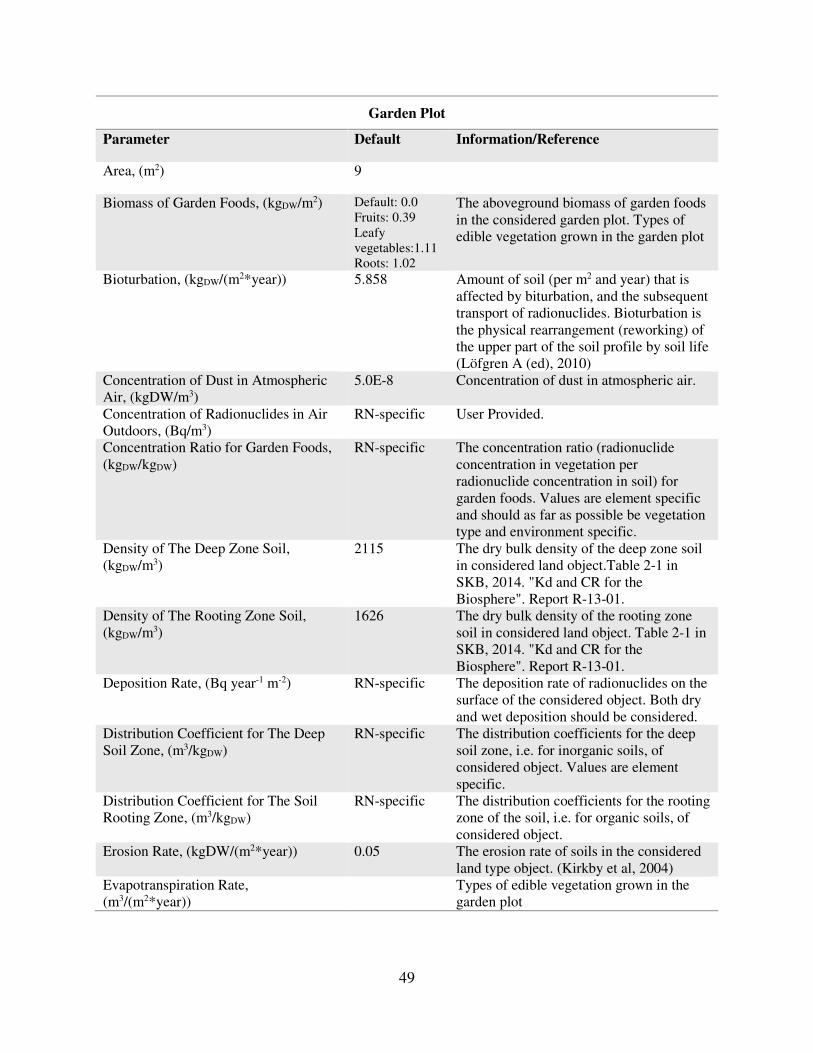
49
Garden Plot
Parameter Default Information/Reference
Area, (m2) 9
Biomass of Garden Foods, (kgDW/m2) Default: 0.0
Fruits: 0.39
Leafy
vegetables:1.11
Roots: 1.02
The aboveground biomass of garden foods
in the considered garden plot. Types of
edible vegetation grown in the garden plot
Bioturbation, (kgDW/(m2*year)) 5.858 Amount of soil (per m2 and year) that is
affected by biturbation, and the subsequent
transport of radionuclides. Bioturbation is
the physical rearrangement (reworking) of
the upper part of the soil profile by soil life
(Löfgren A (ed), 2010)
Concentration of Dust in Atmospheric
Air, (kgDW/m3)
5.0E-8 Concentration of dust in atmospheric air.
Concentration of Radionuclides in Air
Outdoors, (Bq/m3)
RN-specific User Provided.
Concentration Ratio for Garden Foods,
(kgDW/kgDW)
RN-specific The concentration ratio (radionuclide
concentration in vegetation per
radionuclide concentration in soil) for
garden foods. Values are element specific
and should as far as possible be vegetation
type and environment specific.
Density of The Deep Zone Soil,
(kgDW/m3)
2115 The dry bulk density of the deep zone soil
in considered land object.Table 2-1 in
SKB, 2014. "Kd and CR for the
Biosphere". Report R-13-01.
Density of The Rooting Zone Soil,
(kgDW/m3)
1626 The dry bulk density of the rooting zone
soil in considered land object. Table 2-1 in
SKB, 2014. "Kd and CR for the
Biosphere". Report R-13-01.
Deposition Rate, (Bq year-1 m-2) RN-specific The deposition rate of radionuclides on the
surface of the considered object. Both dry
and wet deposition should be considered.
Distribution Coefficient for The Deep
Soil Zone, (m3/kgDW)
RN-specific The distribution coefficients for the deep
soil zone, i.e. for inorganic soils, of
considered object. Values are element
specific.
Distribution Coefficient for The Soil
Rooting Zone, (m3/kgDW)
RN-specific The distribution coefficients for the rooting
zone of the soil, i.e. for organic soils, of
considered object.
Erosion Rate, (kgDW/(m2*year)) 0.05 The erosion rate of soils in the considered
land type object. (Kirkby et al, 2004)
Evapotranspiration Rate,
(m3/(m2*year))
Types of edible vegetation grown in the
garden plot

50
(cont.) Garden Plot
Parameter Default Information/Reference
Garden Crops Exposure Period, (days) 75 The number of days that garden foods have
above ground parts and as a result are
exposed to radionuclides (e.g. through
irrigation and deposition).
Height of The Deep Soil Zone, (m) 0.5 Height (thickness) of the deep soil zone,
i.e. the soil layer which extends from
below the rooting zone to the groundwater
table.
Height of The Soil Rooting Zone, (m) 0.25 (Löfgren A (ed), 2010)
Initial Deposition On the Forest, (Bq)
Irrigation Rate for Garden Foods,
(m3/(m2*year))
The irrigation rate for garden food in
considered garden plot
Mass Interception Factor, (m2/kgFW) 0.3 Mass interception factor for plants, defined
as the fraction of deposited materials
intercepted and initially retained (i.e. not
immediately blown or washed off) by
vegetation (unitless) divided by above
ground biomass of vegetation per unit area
(kg) (IAEA,2001)
Porosity of The Deep Soil Zone,
(m3/m3)
0.21 Porosity of soil in the deep soil zone in the
considered land use object. (Table 2-1 in
SKB, 2014. "Kd and CR for the
Biosphere". Report R-13-01)
Porosity of The Soil Rooting Zone,
(m3/m3)
0.36 Porosity of the soil in the rooting zone of
the considered land use object. (Table 2-1
in SKB, 2014. "Kd and CR for the
Biosphere". Report R-13-01)
RN Concentration in Irrigation Water,
(Bq/m3)
RN-specific User Provided
Time Period of Irrigation of Garden
Foods,
The number of days that vegetation is
exposed to irrigation. (IAEA,2001)
Weathering Half Time (day) 22.4 Half time of removal of radionuclides from
plant surfaces.

51
House
This is used for assessment of indoor air concentrations
Parameter Default Information/Reference
Area of The House, (m2) 100
Exchange of Air in The House, (h-1) 0.5
Radon Concentrations in Air Outdoors, (Bq/m3)
Radon Flux Density into The House from The
Foundament, (Bq/(m2*s))
RN Concentration in Outdoor Air, (Bq/m3) The measured radionuclides
concentrations in air outside
building.
Volume of The House (m3) 500
House Slab
Module to consider attenuation of Radon fluxes and gamma dose rates by a house slab, i.e. by the
house foundation.
Parameter Default Information/Reference
Cover Thickness (m) 0.5

52
Land
Parameter Default Information/Reference Area, (m2) 20000
Bioturbation, (kgDW/ (m2*year) 5.858 Amount of soil (per m2 and year) that is affected by
biturbation, and the subsequent transport of
radionuclides. Bioturbation is the physical
rearrangement (reworking) of the upper part of the
soil profile by soil life. (Löfgren A (ed), 2010)
Concentration of Dust in
Atmospheric Air, (kgDW/m3)
5.0E-8 Concentration of dust in atmospheric air. (Löfgren
A (ed), 2010)
Concentration of Radionuclides
in Air Outdoors, (Bq/m3)
RN-specific User Provided
Density of The Deep Zone Soil,
(kgDW/m3)
2115 The dry bulk density of the deep zone soil in
considered land object. (SKB, 2014. "Kd and CR
for the Biosphere". Report R-13-01)
Density of The Rooting Zone
Soil, (kgDW/m3)
1626 The dry bulk density of the rooting zone soil in
considered land object.(SKB, 2014. "Kd and CR
for the Biosphere". Report R-13-01.)
Deposition Rate, (Bq year-1 m-2) The deposition rate of radionuclides on the surface
of the considered object. Both dry and wet
deposition should be considered.
Distribution Coefficient for The
Deep Soil Zone, (m3/kgDW)
RN-specific The distribution coefficients for the deep soil zone,
i.e. for inorganic soils, of considered object.
Distribution Coefficient for The
Soil Rooting Zone, (m3/kgDW)
RN-specific The distribution coefficients for the rooting zone of
the soil, i.e. for organic soils, of considered object.
Erosion Rate,
(kgDW/(m2*year))
0.05 The erosion rate of soils in the considered land type
object. (Kirkby et al,2004)
Evapotranspiration Rate,
(m3/(m2*year))
Types of edible vegetation grown in the garden
plot
Height of The Deep Soil Zone,
(m)
0.5 Height (thickness) of the deep soil zone, i.e. the
soil layer which extends from below the rooting
zone to the groundwater table.
Height of The Soil Rooting
Zone, (m)
0.25 Height (thickness) of the soil rooting zone.
(Löfgren A (ed), 2010)
Initial Depostion On the Forest,
(Bq)
Measured Radionuclide
Concentration in Soil, (m)
0.25
Porosity of The Deep Soil Zone,
(m3/m3)
0.21 Porosity of soil in the deep soil zone in the
considered land use object. (Table 2-1 in SKB,
2014. "Kd and CR for the Biosphere". Report R-
13-01)
Porosity of The Soil Rooting
Zone (m3/m3)
0.36 Porosity of the soil in the rooting zone of the
considered land use object. (Table 2-1 in SKB,
2014. "Kd and CR for the Biosphere". Report R-
13-01)

53
Marine
Parameter Default Information/Reference
Accumulation Time in Beach Sediment,
(years)
50
Area, (m2) 12345.0 User Provided
Bioturbation Coefficient, (m2/year) 1
Bulk Density of The Beach Sediment,
(kgDW/m3)
1200
Characteristic Lenght of The Middle
Sediment Layer (m)
1
Characteristic Lenght of the Top Sediment
Layer, (m)
1
Concentration of Suspended Particulate
Matter in Lake Water, (kgDW/m3)
1
Concentration Ratio for Marine Food,
(m3/kgDW)
RN-specific The concentration ratio (radionuclide
concentration in marine food per
element concentration in water) for
marine food. Values are element
specific and should, as far as possible,
be food type and environment specific.
Density of Sediment Particles, (kgDW/m3) 1
Deposition Rate, (Bq year-1 m-2) The deposition rate of radionuclides on
the surface of the considered object.
Both dry and wet deposition should be
considered.
Depth of Water Box, (m) 1
Distribution Coefficient for Suspended
Particulate Matter, (m3/kgDW)
RN-specific The distribution coefficients for the
suspended particulate matter in the
lake.
Flux in Par, (Bq/year) RN-specific User Provided
Initial Deposition On the Water of Marine
Box, (Bq)
Measured Radionuclide Concentration in
Water,
Physical Diffusivity Coefficient, (m2/year) 1
Porosity, 0.5
Radionuclide Distribution Coefficient,
(m3/kgDW)
RN-specific User Provided
Release Rate of Radionuclides, (Bq/year) RN-specific User Provided
Sedimentation Velocity of Solid Particles,
(m/year)
1 is the velocity of solid particles settling
down in gravity field
Thickness of The Top Layer of the Beach
Sediment, (m)
0.05
Volume (m3) 61.68

54
Pasture Land
Losses from the system by pasture are conservatively neglected. This may give a substantial
overestimation for radionuclides with high Kds. Consider this effect in supporting simulations.
Parameter Default Information/Reference Area, (m2) 20000
Biomass of Pasture, (kgDW/m2) 0.33 The aboveground biomass of pasture in the
considered pasture land. (POSIVA BSA-2012)
Bioturbation, (kgDW/(m2*year)) 5.858 Amount of soil (per m2 and year) that is affected by
biturbation, and the subsequent transport of
radionuclides. Bioturbation is the physical
rearrangement (reworking) of the upper part of the
soil profile by soil life. (Löfgren A (ed), 2010)
Concentration of Dust in
Atmospheric Air, (kgDW/m3)
5.0E-8 Concentration of dust in atmospheric air. (Löfgren
A (ed), 2010)
Concentration of Radionuclides
in Air Outdoors, (Bq/m3)
RN-specific
Concentration Ratio for Pasture,
(kgDW/kgDW)
RN-specific The concentration ratio (radionuclide concentration
in vegetation per radionuclide concentration in
soil) for garden foods. Values are element specific
and should as far as possible be vegetation type and
environment specific.
Density of The Deep Zone Soil,
(kgDW/m3)
2115 The dry bulk density of the deep zone soil in
considered land object. (SKB, 2014. "Kd and CR
for the Biosphere". Report R-13-01)
Density of The Rooting Zone
Soil, (kgDW/m3)
1626 The dry bulk density of the rooting zone soil in
considered land object. (SKB, 2014. "Kd and CR
for the Biosphere". Report R-13-01).
Deposition Rate, (Bq year-1 m-2) RN-specific The deposition rate of radionuclides on the surface
of the considered object. Both dry and wet
deposition should be considered.
Distribution Coefficient for The
Deep Soil Zone, (m3/kgDW)
RN-specific The distribution coefficients for the deep soil zone,
i.e. for inorganic soils, of considered object.
Distribution Coefficient for The
Soil Rooting Zone, (m3/kgDW)
RN-specific The distribution coefficients for the rooting zone of
the soil, i.e. for organic soils, of considered object.
Erosion Rate, (kgDW/(m2*year)) 0.05 The erosion rate of soils in the considered land type
object. (Kirkby et al,2004)
Evapotranspiration Rate,
(m3/(m2*year))
Types of edible vegetation grown in the garden
plot
Fraction of Year During Which
Meat Animals Are Grazing
Pasture,
0.25 The fraction of the year during which meat
producing animals are grazing the pasture. (SJVFS
2010:15)
Height of The Deep Soil Zone,
(m)
0.5 Height (thickness) of the deep soil zone, i.e. the
soil layer which extends from below the rooting
zone to the groundwater table.
Height of The Soil Rooting Zone,
(m)
0.25 (Löfgren A (ed), 2010).
Ingestion Rate of Pasture by Meat
Animals, (kgDW/day)
Beef: 11.44 The ingestion rates of pasture by meat producing
animals. Values are animal type specific.

55
(cont.) Pasture Land
Parameter Default Information/Reference Ingestion Rate of Pasture by Milk
Animals, (kgDW/day)
Cow: 9.1 The ingestion rates of pasture by meat producing
animals. Values are animal type specific.
Ingestion Rate of Soil by Meat
Animals, (kgDW/day)
Beef: 0.7 The ingestion rates of soil by meat producing
animals. Values are animal type specific
Ingestion Rate of Soil by Milk
Animals, (kgDW/day)
Cow: 0.6 The ingestion rates of soil by milk producing
animals. Values are animal type specific.
Ingestion Rate of Water by Meat
Animals, (m3/day)
Beef: 0.06 The ingestion rates of soil by meat producing
animals. Values are animal type specific
Ingestion Rate of Water by Milk
Animals, (m3/day)
Cow: 0.04 The ingestion rates of soil by milk producing
animals. Values are animal type specific
Initial Deposition On the Forest,
(Bq)
RN-specific Radionuclide Specific. User Provided.
Irrigation Rate for Pasture,
(m3/(m2*year))
The irrigation rate for pasture in considered land
type object. (Brundell et al. 2008 + SCB 2012 +
Jordbruksverket 2009)
Mass Interception Factor,
(m2/kgDW)
3 Mass interception factor for plants, defined as the
fraction of deposited materials intercepted and
initially retained (i.e. not immediately blown or
washed off) by vegetation (unitless) divided by
above ground biomass of vegetation per unit area
(kg) (IAEA,2001)
Pasture Exposure Period, (day) 30 The number of days that vegetation is exposed to
processes which will affect the radionuclide
concentration in the vegetation. The vegetation
exposure period equals the vegetation growth
period. (IAEA, 2001).
Porosity of The Deep Soil Zone,
(m3/m3)
0.21 Porosity of soil in the deep soil zone in the
considered land use object. (Table 2-1 in SKB,
2014. "Kd and CR for the Biosphere". Report R-
13-01)
Porosity of The Soil Rooting
Zone, (m3/m3)
0.36 Porosity of the soil in the rooting zone of the
considered land use object. (Table 2-1 in SKB,
2014. "Kd and CR for the Biosphere". Report R-
13-01)
RN Concentration in Animals
Drinking Water, (Bq/m3)
RN-specific User Provided. RN concentration in meat, RN
concentration in milk
RN Concentration in Irrigation
Water, (Bq/m3)
RN-specific Irrigation, RN concentration in crops by
interception from air.
Time Period of Irrigation of
Pasture, (day)
7.5 The number of days that vegetation is exposed to
irrigation. (IAEA, 2001)
Transfer Factor to Meat,
(day/kgFW)
Animal
specific
The transfer factor relating the uptake of elements
in muscle tissue (meat) of an animal to the intake
of food, water and soil by the meat animal.
Transfer Factor to Milk, (day/L) Animal
specific
The transfer factor relating the concentration of
radionuclides in milk to the intake of food, water
and soil by the animal.
Weathering Half Time, (day) 22.4 half time of removal of radionuclides from plant
surfaces. (IAEA, 2010)
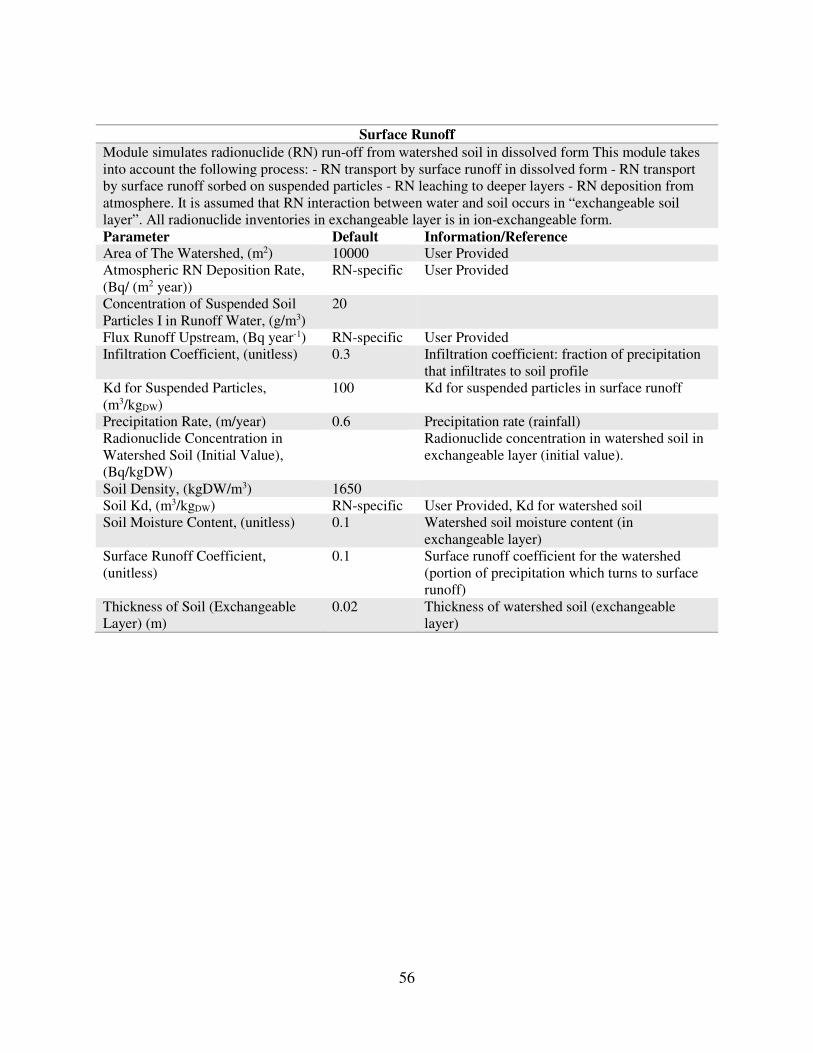
56
Surface Runoff
Module simulates radionuclide (RN) run-off from watershed soil in dissolved form This module takes
into account the following process: - RN transport by surface runoff in dissolved form - RN transport
by surface runoff sorbed on suspended particles - RN leaching to deeper layers - RN deposition from
atmosphere. It is assumed that RN interaction between water and soil occurs in “exchangeable soil
layer”. All radionuclide inventories in exchangeable layer is in ion-exchangeable form.
Parameter Default Information/Reference Area of The Watershed, (m2) 10000 User Provided
Atmospheric RN Deposition Rate,
(Bq/ (m2 year))
RN-specific User Provided
Concentration of Suspended Soil
Particles I in Runoff Water, (g/m3)
20
Flux Runoff Upstream, (Bq year-1) RN-specific User Provided
Infiltration Coefficient, (unitless) 0.3 Infiltration coefficient: fraction of precipitation
that infiltrates to soil profile
Kd for Suspended Particles,
(m3/kgDW)
100 Kd for suspended particles in surface runoff
Precipitation Rate, (m/year) 0.6 Precipitation rate (rainfall)
Radionuclide Concentration in
Watershed Soil (Initial Value),
(Bq/kgDW)
Radionuclide concentration in watershed soil in
exchangeable layer (initial value).
Soil Density, (kgDW/m3) 1650
Soil Kd, (m3/kgDW) RN-specific User Provided, Kd for watershed soil
Soil Moisture Content, (unitless) 0.1 Watershed soil moisture content (in
exchangeable layer)
Surface Runoff Coefficient,
(unitless)
0.1 Surface runoff coefficient for the watershed
(portion of precipitation which turns to surface
runoff)
Thickness of Soil (Exchangeable
Layer) (m)
0.02 Thickness of watershed soil (exchangeable
layer)

57
Tailing Without Cover
This module simulates contaminant "source term" for: - groundwater transport - Rn-222 exhalation to
atmosphere, - external irradiation. The source of radiation is a layer of contaminated waste of a given
thickness. There is no protective cover above the contaminated waste layer
Parameter Default Information/Reference
Average Wind Speed (Annual),
(m/s)
2 User Provided
Infiltration Recharge Rate, (m/year) 0.3 Infiltration recharge rate through waste
layer
Mixing Height for Radionuclides
Above the Source, (m)
2
RN Concentration in Infiltration,
(Bq/m3)
RN-specific
Specific Activity of RN in Waste
(Initial), (Bq/kgDW)
10000 Initial specific waste activity of RN
(time t=0)
Thickness of Waste Layer, 3 m
Waste Bulk Density, (kgDW/m3) 1500
Waste Kd, (m3/kgDW) 0.2 Waste sorption distribution coefficient
Kd values Reference: (IAEA, 2010)
Waste Moisture Content, (unitless) 0.15 Contaminated soil (waste) moisture
content
Waste Site Area (m2) 4000 Waste site (contaminated soil) area
Total Dose
Total dose to different population groups by all exposure pathways taking into account contributions
from all objects and radionuclides.
Parameter Default Information/Reference Total Dose from External Exposure Summed Over
All Radionuclides, (Sv/year)
Annual effective dose to different
exposed groups
Total Dose from Ingestion of Food Summed Over
All Radionuclides, (Sv/year)
Annual effective dose to different
exposed groups
Total Dose from Ingestion of Water Summed Over
All Radionuclides, (Sv/year)
Annual effective dose to different
exposed groups
Total Dose from Inhalation Summed Over All
Radionuclides, (Sv/year)
Annual effective dose to different
exposed groups
Total Dose from Soil Ingestion Summed Over All
Radionuclides, (Sv/year)
Annual effective dose to different
exposed groups

58
Unsaturated Zone
This module simulates radionuclide transport in the unsaturated zone accounting for advection,
dispersion, radioactive decay and sorption “Transport" block is used to simulate radionuclide migration
The number of compartments N in transport block is determined automatically considering the
accuracy of approximation of the advection-dispersion terms. (Parameter "dispersion accuracy" is used
to control the accuracy of numerical approximations of advection-dispersion. The smaller is this
parameter the larger is the number of compartments. The recommended value is 0.1-0.2).
Parameter Default Information/Reference
Dispersion Accuracy,
(unitless)
0.2 Parameter controlling accuracy of approximation of
dispersion flux in Transport_UZ block, (recommended
value 0.1-0.2)
Infiltration Recharge Rate,
(m/year)
0.05 Infiltration recharge rate through the unsaturated zone
Initial Specific Activity of
Soil,( Bq/kgDW)
Initial specific activity of soil in the unsaturated zone (at
time t=0)
Moisture Content in The
UZ, (unitless)
0.15
N Max, (unitless) 100 Maximum number of blocks in Transport_UZ block
N Min, (unitless) 5 Minimum number of cells in Transport_UZ block
RN Concentration in
Infiltration, (Bq/m3)
RN-specific Radionuclides (RN) concentration in infiltration recharge
water. User Provided
Soil Bulk Density in UZ,
(kgDW/m3)
2000
Thickness of The UZ, (m) 8 Thickness of the unsaturated zone
Unsaturated Zone Kd,
(m3/kgDW)
0.7 Unsaturated zone sorption Kd values
Waste Site Area (m2) 42000 Waste site (contaminated soil) area
Well
This module calculates radionuclide concentrations in groundwater pumped by a water well. It is
assumed that some fraction of the well debit is formed by contaminated groundwater from the flow
tube originating from the waste site, while the other part of well debit is formed by "background"
groundwater
Parameter Default Information/Reference
Fraction of Groundwater
Coming to The Well from The
Flow Tube, (unitless)
1 The fraction of groundwater coming to the well
from the flow tube.
RN Concentration in
Background Groundwater,
(Bq/m3)
RN-specific User Provided, The radionuclide concentration in
the background groundwater
RN Concentration in The Water
Coming from The Aquifer
(Bq/m3)
The radionuclide concentration in the aquifer
(flow tube) groundwater flowing into the well
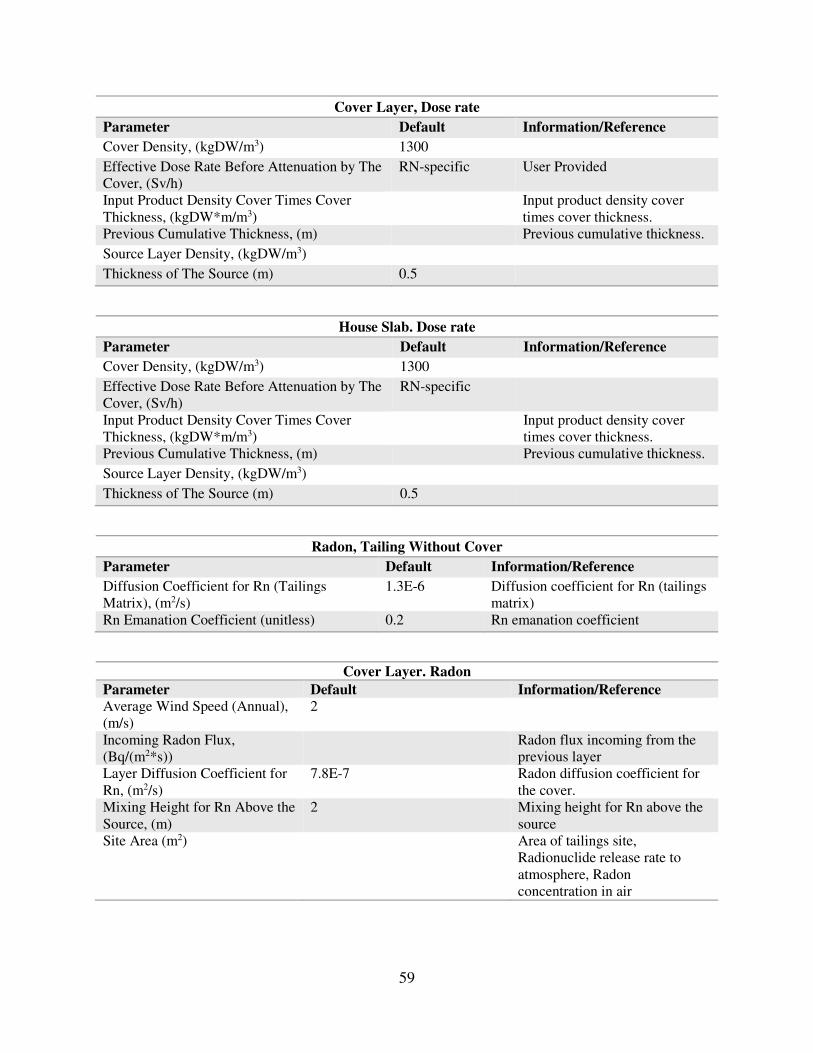
59
Cover Layer, Dose rate
Parameter Default Information/Reference
Cover Density, (kgDW/m3) 1300
Effective Dose Rate Before Attenuation by The
Cover, (Sv/h)
RN-specific User Provided
Input Product Density Cover Times Cover
Thickness, (kgDW*m/m3)
Input product density cover
times cover thickness.
Previous Cumulative Thickness, (m) Previous cumulative thickness.
Source Layer Density, (kgDW/m3)
Thickness of The Source (m) 0.5
House Slab. Dose rate
Parameter Default Information/Reference
Cover Density, (kgDW/m3) 1300
Effective Dose Rate Before Attenuation by The
Cover, (Sv/h)
RN-specific
Input Product Density Cover Times Cover
Thickness, (kgDW*m/m3)
Input product density cover
times cover thickness.
Previous Cumulative Thickness, (m) Previous cumulative thickness.
Source Layer Density, (kgDW/m3)
Thickness of The Source (m) 0.5
Radon, Tailing Without Cover
Parameter Default Information/Reference
Diffusion Coefficient for Rn (Tailings
Matrix), (m2/s)
1.3E-6 Diffusion coefficient for Rn (tailings
matrix)
Rn Emanation Coefficient (unitless) 0.2 Rn emanation coefficient
Cover Layer. Radon
Parameter Default Information/Reference
Average Wind Speed (Annual),
(m/s)
2
Incoming Radon Flux,
(Bq/(m2*s))
Radon flux incoming from the
previous layer
Layer Diffusion Coefficient for
Rn, (m2/s)
7.8E-7 Radon diffusion coefficient for
the cover.
Mixing Height for Rn Above the
Source, (m)
2 Mixing height for Rn above the
source
Site Area (m2) Area of tailings site,
Radionuclide release rate to
atmosphere, Radon
concentration in air
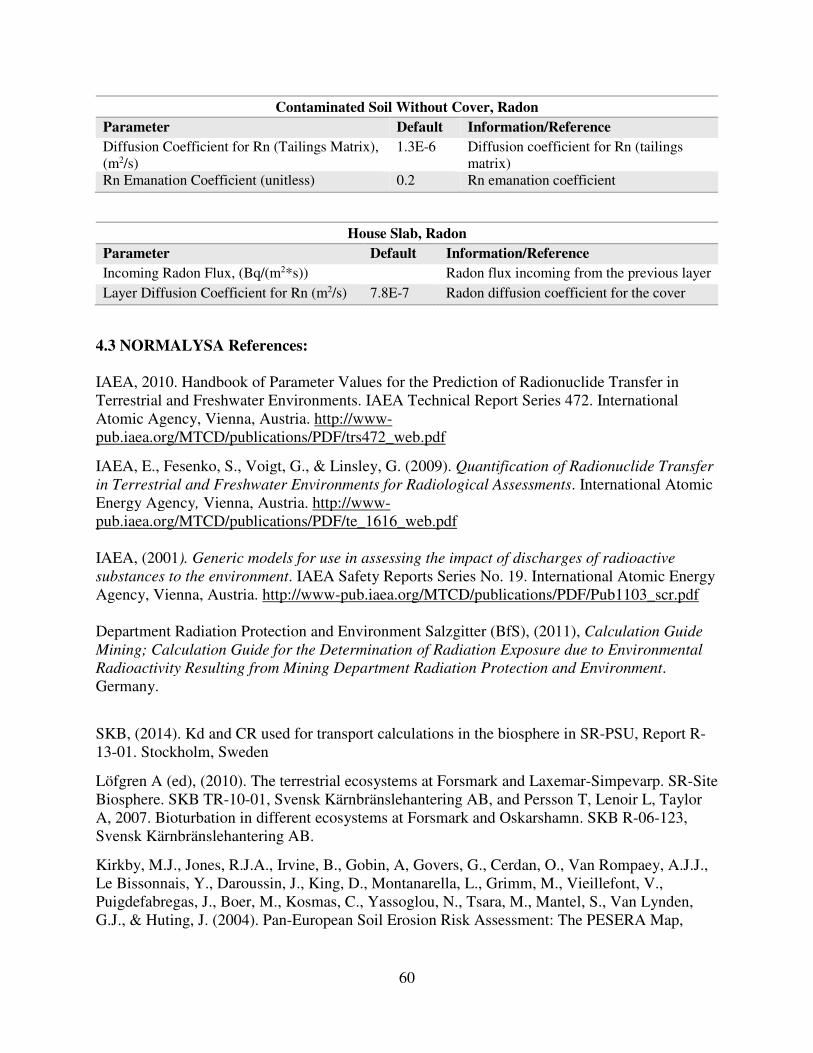
60
Contaminated Soil Without Cover, Radon
Parameter Default Information/Reference
Diffusion Coefficient for Rn (Tailings Matrix),
(m2/s)
1.3E-6 Diffusion coefficient for Rn (tailings
matrix)
Rn Emanation Coefficient (unitless) 0.2 Rn emanation coefficient
House Slab, Radon
Parameter Default Information/Reference
Incoming Radon Flux, (Bq/(m2*s)) Radon flux incoming from the previous layer
Layer Diffusion Coefficient for Rn (m2/s) 7.8E-7 Radon diffusion coefficient for the cover
4.3 NORMALYSA References:
IAEA, 2010. Handbook of Parameter Values for the Prediction of Radionuclide Transfer in
Terrestrial and Freshwater Environments. IAEA Technical Report Series 472. International
Atomic Agency, Vienna, Austria. http://www-
pub.iaea.org/MTCD/publications/PDF/trs472_web.pdf
IAEA, E., Fesenko, S., Voigt, G., & Linsley, G. (2009). Quantification of Radionuclide Transfer
in Terrestrial and Freshwater Environments for Radiological Assessments. International Atomic
Energy Agency, Vienna, Austria. http://www-
pub.iaea.org/MTCD/publications/PDF/te_1616_web.pdf
IAEA, (2001). Generic models for use in assessing the impact of discharges of radioactive
substances to the environment. IAEA Safety Reports Series No. 19. International Atomic Energy
Agency, Vienna, Austria. http://www-pub.iaea.org/MTCD/publications/PDF/Pub1103_scr.pdf
Department Radiation Protection and Environment Salzgitter (BfS), (2011), Calculation Guide
Mining; Calculation Guide for the Determination of Radiation Exposure due to Environmental
Radioactivity Resulting from Mining Department Radiation Protection and Environment.
Germany.
SKB, (2014). Kd and CR used for transport calculations in the biosphere in SR-PSU, Report R-
13-01. Stockholm, Sweden
Löfgren A (ed), (2010). The terrestrial ecosystems at Forsmark and Laxemar-Simpevarp. SR-Site
Biosphere. SKB TR-10-01, Svensk Kärnbränslehantering AB, and Persson T, Lenoir L, Taylor
A, 2007. Bioturbation in different ecosystems at Forsmark and Oskarshamn. SKB R-06-123,
Svensk Kärnbränslehantering AB.
Kirkby, M.J., Jones, R.J.A., Irvine, B., Gobin, A, Govers, G., Cerdan, O., Van Rompaey, A.J.J.,
Le Bissonnais, Y., Daroussin, J., King, D., Montanarella, L., Grimm, M., Vieillefont, V.,
Puigdefabregas, J., Boer, M., Kosmas, C., Yassoglou, N., Tsara, M., Mantel, S., Van Lynden,
G.J., & Huting, J. (2004). Pan-European Soil Erosion Risk Assessment: The PESERA Map,

61
Version 1 October 2003. EUR 21176. Luxembourg: Office for Official Publications of the
European Communities.
POSIVA BSA-(2012), Safety Case for the Disposal of Spent Nuclear Fuel at Olkiluoto - Data
Basis for the Biosphere Assessment BSA-2012, EURAJOKI, FINLAND.
http://www.posiva.fi/en/databank/posiva_reports/safety_case_for_the_disposal_of_spent_nuclear
_fuel_at_olkiluoto_-_data_basis_for_the_biosphere_assessment_bsa-
2012.1871.xhtml?xm_col_type=4&cd_offset=30#.WblMt-vytpg
ICRP (1995). Age-dependent Doses to Members of the Public from Intake of Radionuclides -
Part 4 Inhalation Dose Coefficients. ICRP Publication 71. Ann. ICRP 25 (3-4).
Turtiainen, M., (2015). Modelling bilberry and cowberry yields in Finland: different approaches
to develop models for forest planning calculations. Dissertationes Forestales 185, 56.

62
V. The Radioactively Contaminated Land Exposure Assessment Methodology (RCLEA)
The Radioactively Contaminated Land Exposure Assessment Methodology (RCLEA) is a
mathematical model developed by Quintessa in support of the U.K. Government Department for
Environment, Food and Rural Affairs (DEFRA) Part IIA for managing contaminated land in the
UK. RCLEA is an Excel file with a collection of worksheets that contain all input data and
results
The default input data is protected against any change, and the equations are hidden. The
model can be used for generic and site-specific calculations. RCLEA has four options to build a
scenario: 1) land use scenarios, 2) building type (timber framed or brick); 3) age of the exposed
individual (adult, infant or child), and 4) sex of the exposed individual (male or female). RCLEA
was issued in 2003 and may be downloaded at: http://www.rclea.info/index.htm.
5.1 RCLEA Exposure Scenarios and Pathways
RCLEA contains four scenarios: Residential with Home-Grown Produce, Residential
without Home-Grown Produce, Allotments, and Commercial/Industrial. It can calculate doses
from whole body external irradiation, ingestion, dermal contact, inhalation, consumption of
homegrown produce, and inhalation of Rn-222 gas indoors.

63
5.2 RCLEA Recommended Default Input Parameters
Element Dependent Data
Soil to Liquid
Distribution
Coefficient for Soil
Plant uptake
affinity
Soil-to-Plant Concentration Factor
(m³/kg) (-) (Bq/kg(fw) per Bq/kg(dw))
Element Library User Library User Library User Formula Value
Ac 1 1 0.5 0.5 4.00E-04 4.00E-04 4.00E-04 4.00E-04
Ag 0.1 0.1 5 5 4.00E-02 4.00E-02 4.00E-02 4.00E-02
Am 5 5 0.5 0.5 7.00E-05 7.00E-05 7.00E-05 7.00E-05
C 0.02 0.02 5 5 2.00E-01 2.00E-01 2.00E-01 2.00E-01
Co 0.5 0.5 5 5 7.00E-03 7.00E-03 7.00E-03 7.00E-03
Cs 1 1 5 5 4.00E-03 4.00E-03 4.00E-03 4.00E-03
Eu 0.8 0.8 0.5 0.5 4.00E-04 4.00E-04 4.00E-04 4.00E-04
Fe 0.5 0.5 5 5 7.00E-03 7.00E-03 7.00E-03 7.00E-03
H 0 0 0 0 6.00E+00 6.00E+00 6.00E+00 6.00E+00
I 0.02 0.02 0.1 0.1 4.00E-03 4.00E-03 4.00E-03 4.00E-03
K 0.2 0.2 50 50 2.00E-01 2.00E-01 2.00E-01 2.00E-01
Mo 0.05 0.05 5 5 7.00E-02 7.00E-02 7.00E-02 7.00E-02
Nb 0.5 0.5 0.5 0.5 4.00E-04 4.00E-04 7.00E-04 7.00E-04
Ni 0.5 0.5 5 5 7.00E-03 7.00E-03 7.00E-03 7.00E-03
Np 0.03 0.03 0.5 0.5 1.00E-02 1.00E-02 1.00E-02 1.00E-02
Pa 1 1 0.5 0.5 4.00E-04 4.00E-04 4.00E-04 4.00E-04
Pb 1 1 5 5 4.00E-03 4.00E-03 4.00E-03 4.00E-03
Pm 0.8 0.8 0.5 0.5 4.00E-04 4.00E-04 4.00E-04 4.00E-04
Pu 1 1 0.5 0.5 4.00E-04 4.00E-04 4.00E-04 4.00E-04
Ra 5 5 5 5 7.00E-04 7.00E-04 7.00E-04 7.00E-04
Sb 0.1 0.1 5 5 4.00E-02 4.00E-02 4.00E-02 4.00E-02
Se 0.05 0.05 50 50 7.00E-01 7.00E-01 7.00E-01 7.00E-01
Sm 0.8 0.8 0.5 0.5 4.00E-04 4.00E-04 4.00E-04 4.00E-04
Sn 0.5 0.5 5 5 7.00E-03 7.00E-03 7.00E-03 7.00E-03
Sr 0.02 0.02 5 5 2.00E-01 2.00E-01 2.00E-01 2.00E-01
Tc 0.0001 0.0001 5 5 8.00E+00 8.00E+00 8.00E+00 8.00E+00
Th 3 3 0.5 0.5 1.00E-04 1.00E-04 1.00E-04 1.00E-04
U 0.05 0.05 0.5 0.5 7.00E-03 7.00E-03 7.00E-03 7.00E-03
Element Independent Data
Enrichment Factor Soil Water Filled Porosity Soil Total
Porosity Soil Dry Bulk Density
(-) (-) (-) (kg/m³)
Library User Library User Library User Library User
3 3 0.25 0.25 0.5 0.5 1400 1400
Rn-222 Data
Emanation Fraction Effective Diffusion Coefficient

64
(-) (m2 s-1)
Library User Library User
0.2 0.2 2.00E-06 2.00E-06
Soil Ingestion and Occupancy of Contaminated Land
Inadvertent
Ingestion Rate for
Soil and Dust
Fractional Indoor
Occupancy Over
Contaminated Land
Fractional Outdoor
Occupancy on
Contaminated Land
(kg (dry soil) /y) (-) (-)
Land Use Age Library User Library User Library User
Residential with
Home-Grown
Produce
Infant 5.50E-02 5.50E-02 0.875 0.875 0.125 0.125
Residential with
Home-Grown
Produce
Child 3.70E-02 3.70E-02 0.75 0.75 0.083 0.083
Residential with
Home-Grown
Produce
Adult 2.20E-02 2.20E-02 0.833 0.833 0.104 0.104
Residential without
Home-Grown
Produce
Infant 5.50E-02 5.50E-02 0.875 0.875 0.125 0.125
Residential without
Home-Grown
Produce
Child 3.70E-02 3.70E-02 0.75 0.75 0.083 0.083
Residential without
Home-Grown
Produce
Adult 2.20E-02 2.20E-02 0.833 0.833 0.104 0.104
Allotments Infant 5.50E-02 5.50E-02 0.875 0.875 0.036 0.036
Allotments Child 3.70E-02 3.70E-02 0.75 0.75 0.024 0.024
Allotments Adult 2.60E-02 2.60E-02 0.833 0.833 0.095 0.095
Commercial/Industrial Adult 9.20E-03 9.20E-03 0.197 0.197 0.019 0.019
Suspended Dust Characteristics
Fraction of Indoor Dust Comprising
of Locally Derived Soil
Annual Average Air
Concentration of Respirable
Particles
(-) (kg/m3)
Land Use Library User Library User
Residential with Home-
Grown Produce
0.75 0.75 5.00E-08 5.00E-08
Residential without
Home-Grown Produce
0.75 0.75 5.00E-08 5.00E-08
Allotments 0.375 0.375 5.00E-08 5.00E-08
Commercial/Industrial 0.75 0.75 5.00E-08 5.00E-08

65
Fraction of Time Spent Indoors
Fractional Duration of
Skin Contact Indoors
Fractional Active
Occupancy Indoors
Fractional Passive
Occupancy Indoors
(-) (-) (-)
Land Use Age Libra
ry
User Library User Library User
Residential with Home-
Grown Produce
Infant 0.5 0.5 0.125 0.125 0.75 0.75
Residential with Home-
Grown Produce
Child 0.5 0.5 0.083 0.083 0.667 0.667
Residential with Home-
Grown Produce
Adult 0.5 0.5 0.125 0.125 0.708 0.708
Residential without Home-
Grown Produce
Infant 0.5 0.5 0.125 0.125 0.75 0.75
Residential without Home-
Grown Produce
Child 0.5 0.5 0.083 0.083 0.667 0.667
Residential without Home-
Grown Produce
Adult 0.5 0.5 0.125 0.125 0.708 0.708
Allotments Infant 0.5 0.5 0.125 0.125 0.75 0.75
Allotments Child 0.5 0.5 0.083 0.083 0.667 0.667
Allotments Adult 0.5 0.5 0.125 0.125 0.708 0.708
Commercial/Industrial Adult 0.315 0.315 0.052 0.052 0.144 0.144
Fraction of Time Spent Outdoors
Fractional
Duration of Skin
Contact Outdoors
Fractional Active
Occupancy Outdoors
Fractional Passive
Occupancy Outdoors
(-) (-) (-)
Land Use Age Library User Library User Library User
Residential with Home-
Grown Produce
Infant 0.178 0.178 0.083 0.083 0.042 0.042
Residential with Home-
Grown Produce
Child 0.178 0.178 0.083 0.083 0 0
Residential with Home-
Grown Produce
Adult 0.5 0.5 0.063 0.063 0.042 0.042
Residential without Home-
Grown Produce
Infant 0.178 0.178 0.083 0.083 0.042 0.042
Residential without Home-
Grown Produce
Child 0.178 0.178 0.083 0.083 0 0
Residential without Home-
Grown Produce
Adult 0.5 0.5 0.063 0.063 0.042 0.042
Allotments Infant 0.038 0.038 0.018 0.018 0.018 0.018
Allotments Child 0.026 0.026 0.012 0.012 0.012 0.012
Allotments Adult 0.285 0.285 0.047 0.047 0.047 0.047
Commercial/Industrial Adult 0.233 0.233 0.013 0.013 0.006 0.006

66
Skin Contamination (while Indoors)
Soil Loading on Skin
Contaminated with Soil Indoors
Maximum Fraction of
Skin Exposed Indoors
(mg/cm²) (-)
Land Use Age Library User Library User
Residential with Home-Grown
Produce
Infant 0.06 0.06 0.33 0.33
Residential with Home-Grown
Produce
Child 0.06 0.06 0.22 0.22
Residential with Home-Grown
Produce
Adult 0.06 0.06 0.33 0.33
Residential without Home-Grown
Produce
Infant 0.06 0.06 0.33 0.33
Residential without Home-Grown
Produce
Child 0.06 0.06 0.22 0.22
Residential without Home-Grown
Produce
Adult 0.06 0.06 0.33 0.33
Allotments Infant 0.06 0.06 0.33 0.33
Allotments Child 0.06 0.06 0.22 0.22
Allotments Adult 0.06 0.06 0.33 0.33
Commercial/Industrial Adult 0.14 0.14 0.07 0.07
Tissue Weighting Factor
Tissue Weighting Factor for UV Exposed Skin
(-)
Library User
0.01 0.01
Skin Contamination (While Outdoors)
Soil Loading on Skin
Contaminated with Soil
Outdoors
Maximum Fraction
of Skin Exposed
Outdoors
(mg/cm²) (-)
Land Use Age Library User Library User
Residential with Home-Grown Produce Infant 1 1 0.26 0.26
Residential with Home-Grown Produce Child 1 1 0.15 0.15
Residential with Home-Grown Produce Adult 0.3 0.3 0.26 0.26
Residential without Home-Grown Produce Infant 1 1 0.26 0.26
Residential without Home-Grown Produce Child 1 1 0.15 0.15
Residential without Home-Grown Produce Adult 0.3 0.3 0.26 0.26
Allotments Infant 1 1 0.26 0.26
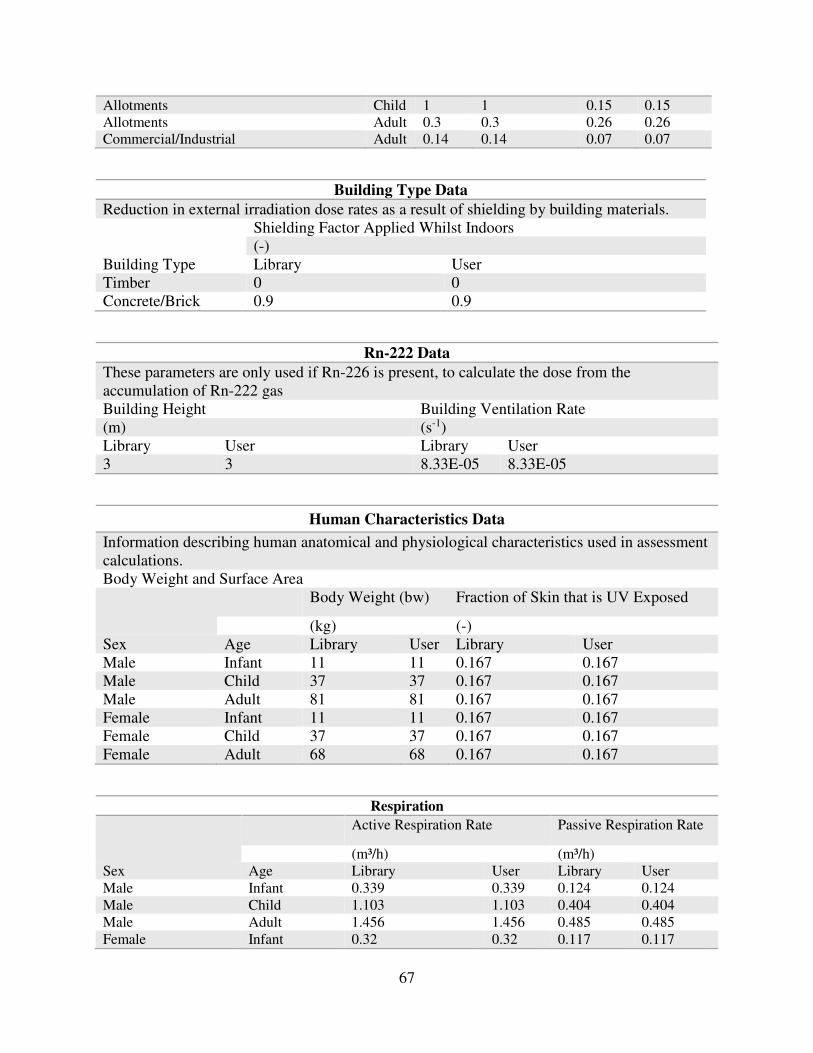
67
Allotments Child 1 1 0.15 0.15
Allotments Adult 0.3 0.3 0.26 0.26
Commercial/Industrial Adult 0.14 0.14 0.07 0.07
Building Type Data
Reduction in external irradiation dose rates as a result of shielding by building materials.
Shielding Factor Applied Whilst Indoors
(-)
Building Type Library User
Timber 0 0
Concrete/Brick 0.9 0.9
Rn-222 Data
These parameters are only used if Rn-226 is present, to calculate the dose from the
accumulation of Rn-222 gas
Building Height Building Ventilation Rate
(m) (s-1)
Library User Library User
3 3 8.33E-05 8.33E-05
Human Characteristics Data
Information describing human anatomical and physiological characteristics used in assessment
calculations.
Body Weight and Surface Area
Body Weight (bw) Fraction of Skin that is UV Exposed
(kg) (-)
Sex Age Library User Library User
Male Infant 11 11 0.167 0.167
Male Child 37 37 0.167 0.167
Male Adult 81 81 0.167 0.167
Female Infant 11 11 0.167 0.167
Female Child 37 37 0.167 0.167
Female Adult 68 68 0.167 0.167
Respiration
Active Respiration Rate Passive Respiration Rate
(m³/h) (m³/h)
Sex Age Library User Library User
Male Infant 0.339 0.339 0.124 0.124
Male Child 1.103 1.103 0.404 0.404
Male Adult 1.456 1.456 0.485 0.485
Female Infant 0.32 0.32 0.117 0.117

68
Female Child 1.1 1.1 0.403 0.403
Female Adult 1.234 1.234 0.411 0.411
Origin of Food and Amount of Soil on Vegetables
Fraction of Consumption Derived
from Contaminated Area
Soil Contamination of Home-
Grown Vegetables
(-) (kg(dw)/kg(fw))
Crop Library User Library User
Brussels Sprouts 0.87 0.87 0.001 0.001
Cabbage 0.92 0.92 0.001 0.001
Carrot 0.7 0.7 0.0001 0.0001
Leafy Salads 0.51 0.51 0.001 0.001
Onion (shallots and leeks) 0.91 0.91 0.001 0.001
Potato 0.66 0.66 0.0002 0.0002
Consumption Rates
Consumption Rate of Vegetables
(kg(fw)/kg(bw)/y)
Age Crop Library User
Infant Brussels Sprouts 4.75E-01 4.75E-01
Infant Cabbage 5.48E-01 5.48E-01
Infant Carrot 6.57E-01 6.57E-01
Infant Leafy Salads 4.02E-01 4.02E-01
Infant Onion (shallots and leeks) 3.36E-01 3.36E-01
Infant Potato 2.74E+00 2.74E+00
Child Brussels Sprouts 2.48E-01 2.48E-01
Child Cabbage 2.30E-01 2.30E-01
Child Carrot 3.65E-01 3.65E-01
Child Leafy Salads 1.93E-01 1.93E-01
Child Onion (shallots and leeks) 2.30E-01 2.30E-01
Child Potato 2.08E+00 2.08E+00
Adult Brussels Sprouts 2.56E-01 2.56E-01
Adult Cabbage 2.45E-01 2.45E-01
Adult Carrot 2.37E-01 2.37E-01
Adult Leafy Salads 1.79E-01 1.79E-01
Adult Onion (shallots and leeks) 1.61E-01 1.61E-01
Adult Potato 1.24E+00 1.24E+00
Constants
Density of Water 1000 (kg/m³)
Rn-222 Decay Constant (s-1) 2.10E-06
Non-Rad Calculations
Annual respired volume of air with indoors (m3/y) 1185.885

69
Annual respired volume of air with indoors (m3/y) 292.1022
Ratio of the area of skin contaminated to the area of skin exposed to Ultra-violet 1
Crop Calculations
Total consumption rate of all vegetables, which are homegrown (kg/y) 40.62859
Total consumption rate of soil on all vegetables, which are homegrown (kg/y) 0.020176
5.3 RCLEA References:
U.K. Government Department for Environment, Food and Rural Affairs (2011), The
Radioactively Contaminated Land Exposure Assessment Methodology – Technical Report, CLR-
14, Version 1.2. available at:
https://www.gov.uk/government/uploads/system/uploads/attachment_data/file/316279/Radioacti
vely_Contaminated_Land_Exposure_Assessment_Methodology_Technical_Report.pdf

70
VI. Radioactive Soil Remediation Standards (RaSoRS):
RaSoRS is an Excel-based model developed in 2003 by the Bureau of Environmental
Radiation of the State of New Jersey to provide technical support to the Site Remediation
Program (Figure 4). RaSoRS contains a total of 7 radionuclides with their progenies (U-238, U-
234, Th-230, Ra-226, U-235, Ac-227 and Th-232). The RaSoRS spreadsheet may be found at:
http://www.nj.gov/dep/rpp/rms/agreedown/NJrasorsver60.xls.
6.1 RaSoRS Exposure Scenarios and Pathways:
RaSoRS has two construction scenarios (Basement and Slap-on-Grade) for two site use
scenarios (Residential and Commercial). It can calculate doses from external gamma exposure,
ingestion of crops, ingestion of soil, ingestion of water, inhalation of dust and radon.
6.2 RaSoRS Recommended Default Input Parameters
ASSUMPTIONS PERTAINING TO EXCAVATION SCENARIO
Uncontaminated surface soil lost from grading (ft): 1
Parameters Specific to Construction Scenario Basement Slab on Grade
Depth of excavation (ft): 7 4
Width of excavation (ft): 2
Parameters Specific to Site Use Scenario Residential Commercial
Building length (ft): 40 60
Building width (ft): 25 40
Lot size ((ft²): 10,890 87,120
Fraction of time spent indoors on site: 68% 18%
Fraction of time spent outdoors on site: 8% 5%
ASSUMPTIONS PERTAINING TO RADON PATHWAY
Radon to radium ratio (pCi/l per pCi/g): 1.5
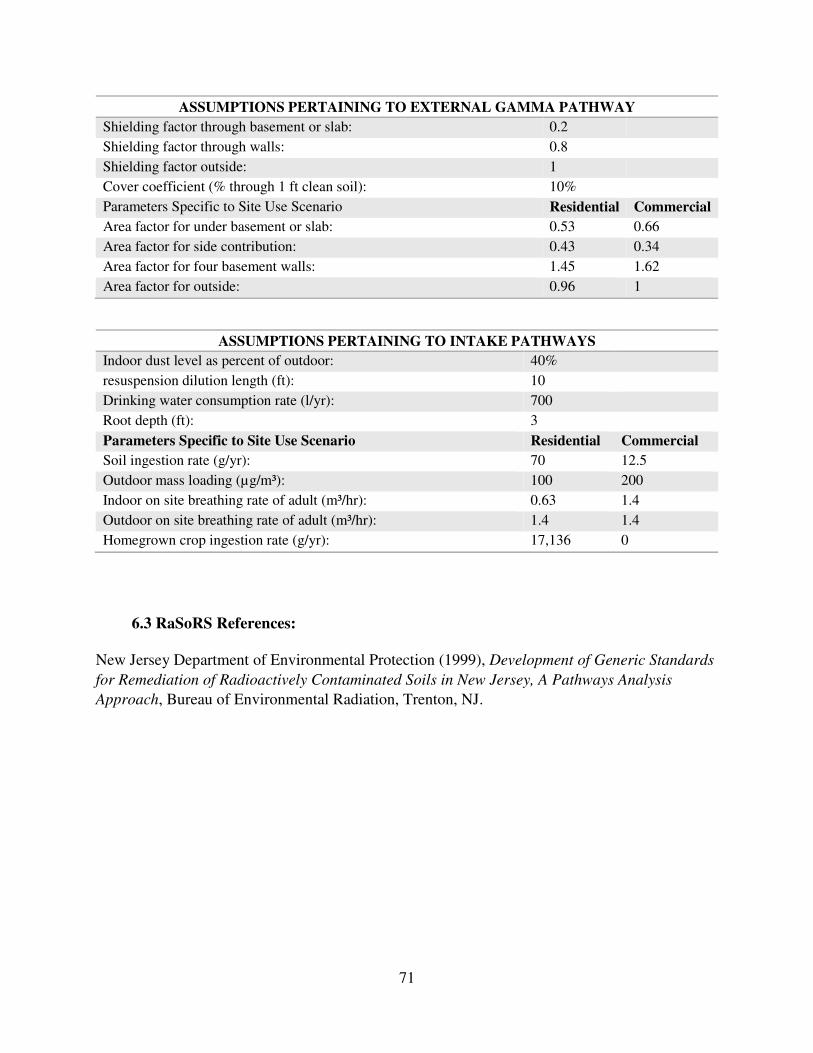
71
ASSUMPTIONS PERTAINING TO EXTERNAL GAMMA PATHWAY
Shielding factor through basement or slab: 0.2
Shielding factor through walls: 0.8
Shielding factor outside: 1
Cover coefficient (% through 1 ft clean soil): 10%
Parameters Specific to Site Use Scenario Residential Commercial
Area factor for under basement or slab: 0.53 0.66
Area factor for side contribution: 0.43 0.34
Area factor for four basement walls: 1.45 1.62
Area factor for outside: 0.96 1
ASSUMPTIONS PERTAINING TO INTAKE PATHWAYS
Indoor dust level as percent of outdoor: 40%
resuspension dilution length (ft): 10
Drinking water consumption rate (l/yr): 700
Root depth (ft): 3
Parameters Specific to Site Use Scenario Residential Commercial
Soil ingestion rate (g/yr): 70 12.5
Outdoor mass loading (µg/m³): 100 200
Indoor on site breathing rate of adult (m³/hr): 0.63 1.4
Outdoor on site breathing rate of adult (m³/hr): 1.4 1.4
Homegrown crop ingestion rate (g/yr): 17,136 0
6.3 RaSoRS References:
New Jersey Department of Environmental Protection (1999), Development of Generic Standards
for Remediation of Radioactively Contaminated Soils in New Jersey, A Pathways Analysis
Approach, Bureau of Environmental Radiation, Trenton, NJ.

72
VII. WISMUT
The WISMUT model, “Calculation Guide Mining”, is developed by the Germany Federal
Laender and the WISMUT GmbH to assess radiation exposure for the public and workers due to
environmental radioactivity resulting from mining. The name “WISMUT” refers to the areas in
Saxony and Thuringia in Germany that were adversely affected by more than 40 years of
unrestrained mining and processing of uranium ores. The WISMUT model is developed with
special considerations for the WISMUT region, such as levels of natural background for all
relevant environmental media in the area. It is applicable for remediation, decommissioning,
reuse of mining plants and installations. The WISMUT model is not available in English and not
accessible due to a copyright agreement; however, an English language version of the WISMUT
model User Guide was provided for this analysis.
7.1 WISMUT Exposure Scenarios and Pathways
WISMUT can be used for the following scenarios: indoors (dwellings and public
buildings), commercial buildings, underground workplaces (only inhalation of radon and its
short-lived decay products), outdoors, ingestion of breast milk, and locally produced food
(vegetable and animal products, as well as water). It can calculate doses from external exposure
to gamma radiation from soil, exposure from inhalation of dust, exposure from inhalation of
radon and its short-lived decay products, exposure from ingestion of breast milk, exposure from
ingestion of locally produced foods (drinking water, fish, milk and milk products, meat and meat
products, leafy vegetables and other vegetable products), and exposure from direct soil ingestion.
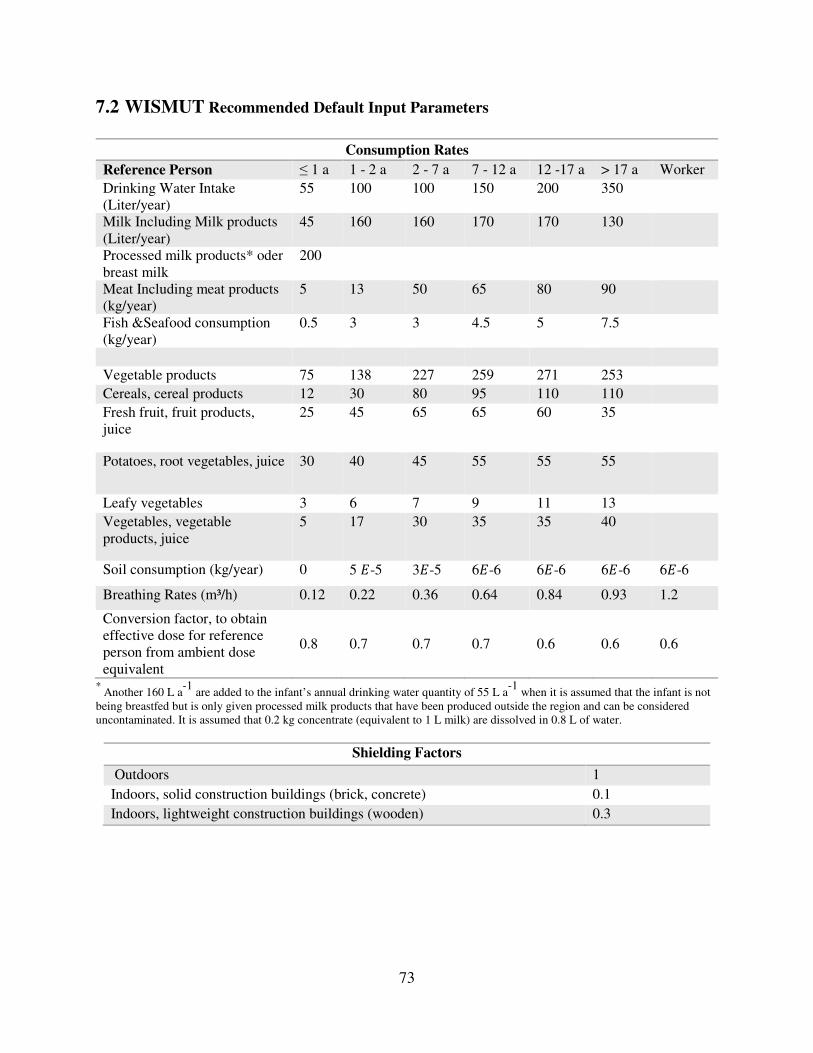
73
7.2 WISMUT Recommended Default Input Parameters
Consumption Rates
Reference Person ≤ 1 a 1 - 2 a 2 - 7 a 7 - 12 a 12 -17 a > 17 a Worker
Drinking Water Intake
(Liter/year)
55 100 100 150 200 350
Milk Including Milk products
(Liter/year)
45 160 160 170 170 130
Processed milk products* oder
breast milk
200
Meat Including meat products
(kg/year)
5 13 50 65 80 90
Fish &Seafood consumption
(kg/year)
0.5 3 3 4.5 5 7.5
Vegetable products 75 138 227 259 271 253
Cereals, cereal products 12 30 80 95 110 110
Fresh fruit, fruit products,
juice
25 45 65 65 60 35
Potatoes, root vegetables, juice 30 40 45 55 55 55
Leafy vegetables 3 6 7 9 11 13
Vegetables, vegetable
products, juice
5 17 30 35 35 40
Soil consumption (kg/year) 0 5 �-5 3�-5 6�-6 6�-6 6�-6 6�-6
Breathing Rates (m³/h) 0.12 0.22 0.36 0.64 0.84 0.93 1.2
Conversion factor, to obtain
effective dose for reference
person from ambient dose
equivalent
0.8 0.7 0.7 0.7 0.6 0.6 0.6
* Another 160 L a
-1 are added to the infant’s annual drinking water quantity of 55 L a
-1 when it is assumed that the infant is not
being breastfed but is only given processed milk products that have been produced outside the region and can be considered
uncontaminated. It is assumed that 0.2 kg concentrate (equivalent to 1 L milk) are dissolved in 0.8 L of water.
Shielding Factors
Outdoors 1
Indoors, solid construction buildings (brick, concrete) 0.1
Indoors, lightweight construction buildings (wooden) 0.3

74
Inhalation dose coefficient for radionuclide and inhalation dose coefficient of the radionuclide
mixture for reference person:
238U-series: ≤ 1 yr 1 - 2 yr 2 - 7 yr 7 - 12 yr 12 - 17 yr > 17 yr Worker 238U 1.2E-5 9.4E-6 5.9E-6 4.0E-6 3.4E-6 2.9E-6 1.6E-6 234U 1.5E-5 1.1E-5 7.0E-6 4.8E-6 4.2E-6 3.5E-6 2.1E-6 230Th 4.0E-5 3.5E-5 2.4E-5 1.6E-5 1.5E-5 1.4E-5 7.2E-6 226Ra 1.5E-5 1.1E-5 7.0E-6 4.9E-6 4.5E-6 3.5E-6 2.2E-6 210Pb 5.0E-6 3.7E-6 2.2E-6 1.5E-6 1.3E-6 1.1E-6 1.1E-6 210Po 1.5E-5 1.1E-5 6.7E-6 4.6E-6 4E-6 3.3E-6 2.2E-6 235U-series: 235U 1.3E-5 1.0E-5 6.3E-6 4.3E-6 3.7E-6 3.1E-6 1.8E-6 231Pa 2.2E-4 2.3E-4 1.9E-4 1.5E-4 1.5E-4 1.4E-4 8.9E-5 227Ac 1.7E-3 1.6E-3 1.0E-3 7.2E-4 5.6E-4 5.5E-4 6.3E-4 232Th-series: 232Th 5.4E-5 5.0E-5 3.7E-5 2.6E-5 2.5E-5 2.5E-5 1.2E-5 228Ra 1.5E-5 1.0E-5 6.3E-6 4.6E-6 4.4E-6 2.6E-6 1.7E-6 228Th 1.6E-4 1.3E-4 8.2E-5 5.5E-5 4.7E-5 4.0E-5 3.2E-5
Mixture 1.9E-4 1.7E-4 1.1E-4 8.0E-5 6.8E-5 6.3E-5 5.0E-5
Ingestion dose coefficient for radionuclide and ingestion dose coefficient of the
radionuclide mixture for reference person: 238U-series: ≤ 1 yr 1 - 2 yr 2 - 7 yr 7 - 12 yr 12 - 17
yr
> 17 yr Worker
238U 3.4E-7 1.2E-7 8.0E-8 6.8E-8 6.7E-8 4.5E-8 4.4E-8 234U 3.7E-7 1.3E-7 8.8E-8 7.4E-8 7.4E-8 4.9E-8 4.9E-8 230Th 4.1E-5 4.1E-7 3.1E-7 2.4E-7 2.2E-7 2.1E-7 2.1E-7 226Ra 4.7E-6 9.6E-7 6.2E-6 8.0E-7 1.5E-6 2.8E-7 2.8E-7 210Pb 8.4E-6 3.6E-6 2.2E-6 1.9E-6 1.9E-6 6.9E-7 6.8E-7 210Po 2.6E-5 8.8E-6 4.4E-6 2.6E-6 1.6E-6 1.2E-6 2.4E-7 210Po for soil ingestion 5.2E-6 1.8E-6 8.8E-7 5.2E-7 3.2E-7 2.4E-7 235U-series: 235U 3.5E-7 1.3E-7 8.5E-8 7.1E-8 7.0E-8 4.7E-8 4.6E-8 231Pa 1.3E-5 1.3E-6 1.1E-6 9.2E-7 8.0E-7 7.1E-7 7.1E-7 227Ac 3.3E-5 3.1E-6 2.2E-6 1.5E-6 1.2E-6 1.1E-6 1.1E-6 232Th-series: 232Th 4.6E-6 4.5E-7 3.5E-7 2.9E-7 2.5E-7 2.3E-7 2.2E-7 228Ra 3.0E-5 5.7E-6 3.4E-6 3.9E-6 5.3E-6 6.9E-7 6.7E-7 228Th 3.7E-6 3.7E-7 2.2E-7 1.5E-7 9.4E-8 7.2E-8 7.0E-8
Mixture 4.6E-5 1.4E-5 7.9E-6 5.8E-6 5.5E-6 2.6E-6 1.6`E-6

75
Exposure site Equilibrium factor Rn-222
On a mining installation or facility
Indoors and outdoors 0.4
In the vicinity of a mining installation or facility
Indoors and outdoors 0.4
Values to calculate the radionuclide transport:
Fraction of time per year spent on the pasture by grazing animals
0.5
Fraction of activity deposited on the plant during spray irrigation 0.3
Daily water consumption by cattle (L d-1) 75
Daily ingestion of pasture forage (FM) (kg d-1) 65
Daily soil ingestion by cattle when grazing on the pasture (DM) (kg d-1) 0.5
Proportion of local food production
Milk, Meat, Fish, Leafy Vegetable, Vegetables, Root Vegetables, Fruit 0.5
Drinking Water, Breast Milk, Processed Milk 1
Contamination time for plants during the growth period
vegetable products except for leafy vegetables (60 days) 5.2E 6 (sec.)
leafy vegetables (60 days) 5.2E 6 (sec.)
pasture plants (30 days) 2.6E 6 (sec.)
Time of surface contamination of plants due to spray irrigation during the growth period
time until the same piece of pasture is fed down again (30 days) 2.6E 6 (sec.)
average growing period of vegetable productions except for leafy vegetables, and of
leafy vegetables respectively (60 days)
5.2E 6 (sec.)
Spray irrigation rate during grazing time and growth period of vegetable products
(L m-2
s-1
)
1.2E -5
Yield or vegetation density (FM)
yield of leafy vegetables (kg m-2
) 1.6
yield of vegetable products except for leafy vegetables (kg m-2
) 2.4
plant cover density of pasture plants (kg m-2
) 0.85
Effective rate constant for the retention of radionuclide r on the plant
Effective rate constant:
(Physical decay constant of radionuclide r, s-1) + (Residence constant for the
retention of the radionuclides on the plant)
Residence constant for the retention of the radionuclides on the plant (residence time
14 days) (s-1
)
5.7 E -7

76
T.F to PP= Transfer factor from soil to pasture plants (These transfer factors account for the
uptake of radionuclides not only via roots but also via surface plant components due to local
contamination).
T.F to LV; PL= Transfer factor from soil to leafy vegetables and none leafy vegetables. (These
transfer factors account for the uptake of radionuclides not only via roots but also via surface
plant components due to local contamination).
T.F to Mi = Transfer factor from forage, cattle trough water and ingested soil to milk
T.F to Me= Transfer factor from forage, cattle trough water and ingested soil to meat
T.F to BM= Foodstuff to breast milk transfer factor for radionuclide
T.F to BM, Inh= Inhaled-dust-to-breast milk transfer factor for radionuclide
T.F to Fi= Concentration factor for radionuclide r in fish.
222Rn concentration or potential alpha energy concentration of the short-lived
222Rn decay products
of the natural background outdoors. The value of potential alpha energy concentration of the short-
lived 222Rn decay products was calculated from the 222Rn concentration using an equilibrium factor
of 0.4.
222Rn concentration 10 Bq m
-3
Potential alpha energy concentration of short-lived
222Rn decay products
2.22E-8
J m-3
Transfer factors for pasture plants and food as well as concentration factors for fish related to
radionuclide.
T.F to PP T.F to LV; PL T.F to Mi T.F to Me T.F to BM T.F to BM, Inh T.F to Fi
Bq/kg (FM)/ Bq/kg (DM) d/kg d/kg d/kg d/kg L/kg
U 3E-3 3E-3 5E-4 4E-4 2E-2 1E-1 2
Pa 3E-3 3E-3 5E-6 5E-3 6E-4 2E-1 30
Th 2E-3 5E-4 5E-6 2E-4 2E-2 2E-2 30
Ac 3E-3 3E-3 2E-5 3E-3 6E-4 4E-1 30
Ra 1E-2 5E-3 3E-3 9E-4 2E-1 2E-1 10
Pb 1E-2 7E-3 3E-4 4E-4 2E-1 1E-1 60
Po 1E-2 5E-3 3E-4 5E-3 6E-1 2E-1 300

77
WISMUT has the following natural background tables used in the model:
• General values of natural background activity concentration for a particle-bound
radionuclide.
• 222
Rn concentration or potential alpha energy concentration of the short-lived 222
Rn
decay products of the natural background outdoors.
• General values of natural background activity concentration of radionuclide in foodstuff.
• General values of natural background activity concentration of radionuclide in the upper
Soil, soil layer (0 − 10 cm for pasture soil, 0 − 30 cm for arable and garden soil, 0 − 30
cm for calculating external radiation exposure) and of activity concentrations in the dust
Soil (0.02), fraction and in the fine grain fraction of soil (dry mass).
• General values of natural background activity concentration of the radionuclide r in
surface water in spray irrigation water and in cattle watering trough water.
• General values of natural background activity concentration of radionuclide in pasture
plants (fresh mass).
• General values of natural background soil contamination rate of radionuclide from dry
dust deposition.
7.3 WISMUT Reference:
Department Radiation Protection and Environment Salzgitter (2011), Calculation Guide Mining;
Calculation Guide for the Determination of Radiation Exposure due to Environmental
Radioactivity Resulting from Mining Department Radiation Protection and Environment.
Germany.

78
VIII. NCRP Report No. 129
The National Council on Radiation Protection and Measurements (NCRP) published a
report entitled “Recommended Screening Limits for Contaminated Surface Soil and Review of
Factors Relevant to Site Specific Studies”, report No. 129. It lists screening guidance for over
200 radionuclides with half-lives greater than 30 days. The limits were calculated by dividing
0.25 mSv by the calculated maximum screening total dose per unit soil concentration in Sieverts.
8.1 NCRP Exposure Scenarios and Pathways
The NCRP report no. 129 contains soil guidelines for several Land-Use Scenarios, such
as Agricultural (AG), Heavily Vegetated Pasture (PV), Sparsely Vegetated Pasture (PS), Heavily
Vegetated Rural (RV), Sparsely Vegetated Rural (RS), Suburban (SU), No Food Suburban (SN),
and Construction, Commercial, Industrial (CC). The exposure pathways considered in NCRP
include external radiation exposure, beta-ray skin dose, ingestion of contaminated foodstuffs,
direct and indirect ingestion of soil by human and animals, and both indoor and outdoor
inhalation of resuspended material.
8.2 NCRP Recommended Default Input Parameters
Food consumption rate
Fruit, Vegetable and Grains (kg/yr) 300
Milk consumption (Liter/yr) 200
Meat and poultry consumption (kg/yr) 100
Inhalation rates used for calculating adult screening doses for land-use scenario considered
(m3/day)
Land use scenario
AG PV PS RV RS SU/SN CC
outdoor 35 35 35 30 30 25 35
GSD 1.2 1.2 1.2 1.2 1.2 1.2 1.2
indoor - - - 20 20 20 -
GSD - - - 1.2 1.2 1.2 -
GSD: Geological Standard Deviation, S.D: Standard Deviation.

79
Soil ingestion rates and number of days of exposure (T) used for screening dose calculations.
Land-Use Scenario Adult Child Time (day/year) Range
Agricultural 0.1 - 270 180-360
Heavily Vegetated Pasture 0.05 - 270 180-360
Sparsely vegetated pasture 0.1 - 270 180-360
Heavily Vegetated rural 0.05 0.1 270 180-360
Sparsely Vegetated rural 0.1 0.2 270 180-360
Suburban 0.05 0.1 270 180-360
Construction, etc 0.1 - 180 90-270
Animal Consumption Rates (kg/day)
Fodder Range
Milk cows 16 8-25
Beef cattle, game 8 4-12
Pigs 2.4 2-3
Calves 1.9 1.5-3.5
Lamb 1.1 0.5-2.0
Chicken 0.07 0.05-0.15
Occupancy Factors
Percent of time spent: Indoor on-site (%) Outdoor on-site (%) Time off-site (%)
Agricultural 40 0 60
Heavily Vegetated Pasture 30 0 70
Sparsely vegetated pasture 30 0 70
Heavily Vegetated rural 40 50 10
Sparsely Vegetated rural 40 50 10
Suburban 40 50 10
Construction, etc. 30 0 70
Shielding Factors
Radionuclides dependents, Appendix C
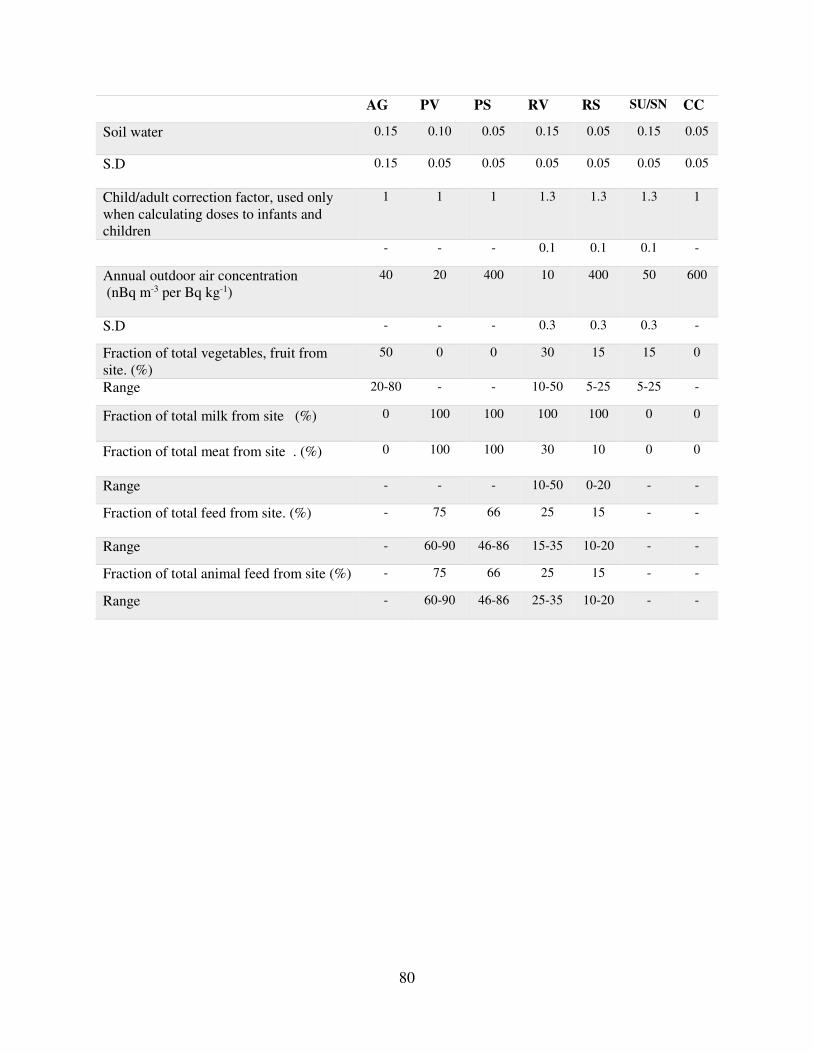
80
AG PV PS RV RS SU/SN CC
Soil water 0.15 0.10 0.05 0.15 0.05 0.15 0.05
S.D 0.15 0.05 0.05 0.05 0.05 0.05 0.05
Child/adult correction factor, used only
when calculating doses to infants and
children
1 1 1 1.3 1.3 1.3 1
- - - 0.1 0.1 0.1 -
Annual outdoor air concentration
(nBq m-3 per Bq kg-1)
40 20 400 10 400 50 600
S.D - - - 0.3 0.3 0.3 -
Fraction of total vegetables, fruit from
site. (%)
50 0 0 30 15 15 0
Range 20-80 - - 10-50 5-25 5-25 -
Fraction of total milk from site (%) 0 100 100 100 100 0 0
Fraction of total meat from site. (%) 0 100 100 30 10 0 0
Range - - - 10-50 0-20 - -
Fraction of total feed from site. (%) - 75 66 25 15 - -
Range - 60-90 46-86 15-35 10-20 - -
Fraction of total animal feed from site (%) - 75 66 25 15 - -
Range - 60-90 46-86 25-35 10-20 - -

81
Land use independent:
Mean concentration in soil (Bq kg-1
dry)
1.0 (mean) S.D. = 0.5
Density of soil (g/cm-3) 1.6 S.D. = 0.1
Adult external radiation dose factor (Sv
d-1 per Bq kg-1)
Nuclide dependent CV = 0.1-0.3
Adult inhalation dose factor (Sv Bq-1) Nuclide dependent GSD = 1.4-2.2
Child/adult correction factor-used only
when calculating doses to children
Nuclide dependent
Feed to meat transfer factor (d kg-1) Nuclide dependent GSD = 1.2-2.8
Feed to milk transfer factor (d L-1). Nuclide dependent GSD = 1.6-2.5
Adult ingestion dose factor (Sv Bq-1) Nuclide dependent GSD = 1.3-2.5
(C/A)ing, (I/A)ing :Child/adult correction
factor- used only when calculating dose
to infant or child.(Ing.)
Nuclide dependent
(C/A)veg :Child/infant correction factor-
used only when calculating dose to
infant or child.(Veg.)
Max [0.65 (C/A)ing,0.34 (I/A)ing]
(C/A)milk :Child/infant correction
factor-used only when calculating dose
to infant or child.(Milk)
Max [1.0 (C/A)ing,1.1 (I/A)ing]
(C/A)meat :child/infant correction factor-
used only when calculating dose to
infant or child, (Meat)
Max [0.7 (C/A)ing,0.3 (I/A)ing]
Bv =root uptake factor (Bq kg-'wet
vegetable per Bq kg-1 dry soil)
Nuclide dependent GSD = 2.5-3.0
Bv’ = resuspension/soil adhesion (Bq
kg-1 wet vegetable per Bq kg-1 dry
soil)
Nuclide dependent
GSD = 2.5-3.0
Bf =root uptake factor (Bq kg-1 dry
fodder per Bq kg-1 dry soil)
Nuclide dependent
GSD = 2.5-3.0)
Bf’ = resuspension/soil adhesion (Bq
kg-1 dry fodder per Bq kg-1 dry soil)
Nuclide dependent GSD = 2.5-3.0
8.3 NCRP References:
NCRP. (1999). Recommended screening limits for contaminated surface soil and review of
factors relevant to site-specific studies. NCRP Report No. 129. Bethesda, MD