Embed Size (px)
Citation preview
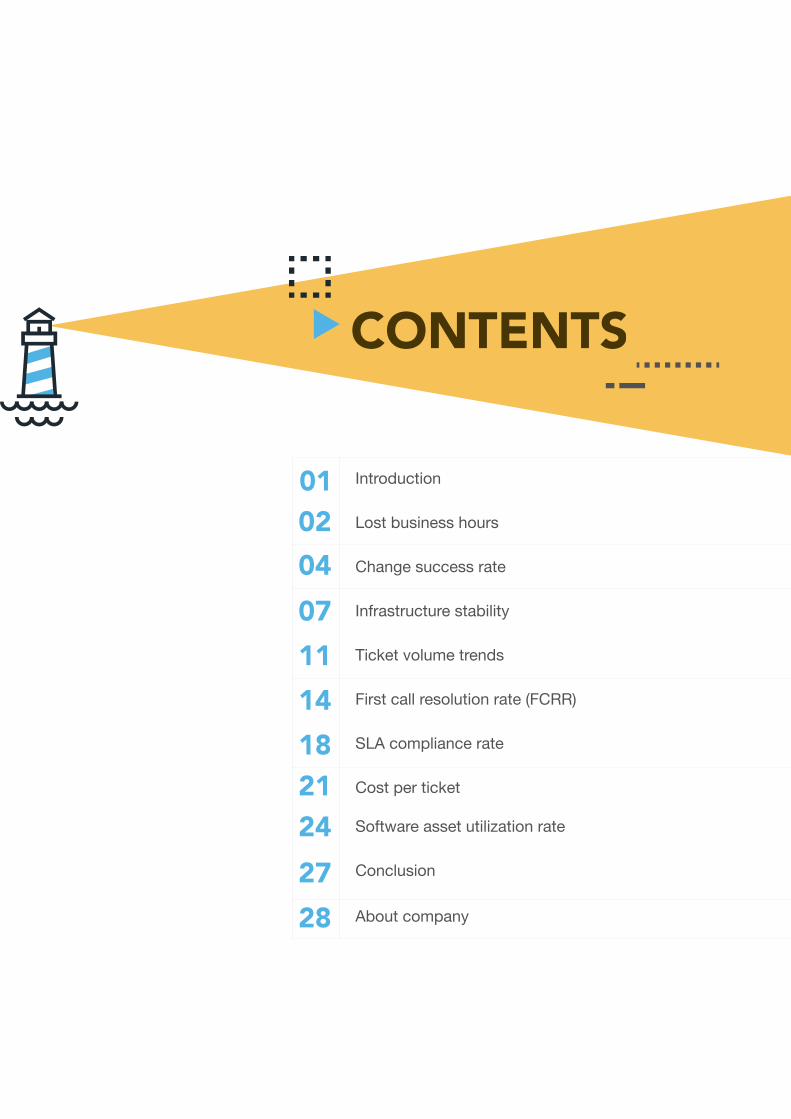
Introduction
Lost business hours
Change success rate
Infrastructure stability
Ticket volume trends
First call resolution rate (FCRR)
SLA compliance rate
Cost per ticket
Software asset utilization rate
Conclusion
About company
CONTENTS
0102040711141821242728
www.servicedeskplus.com
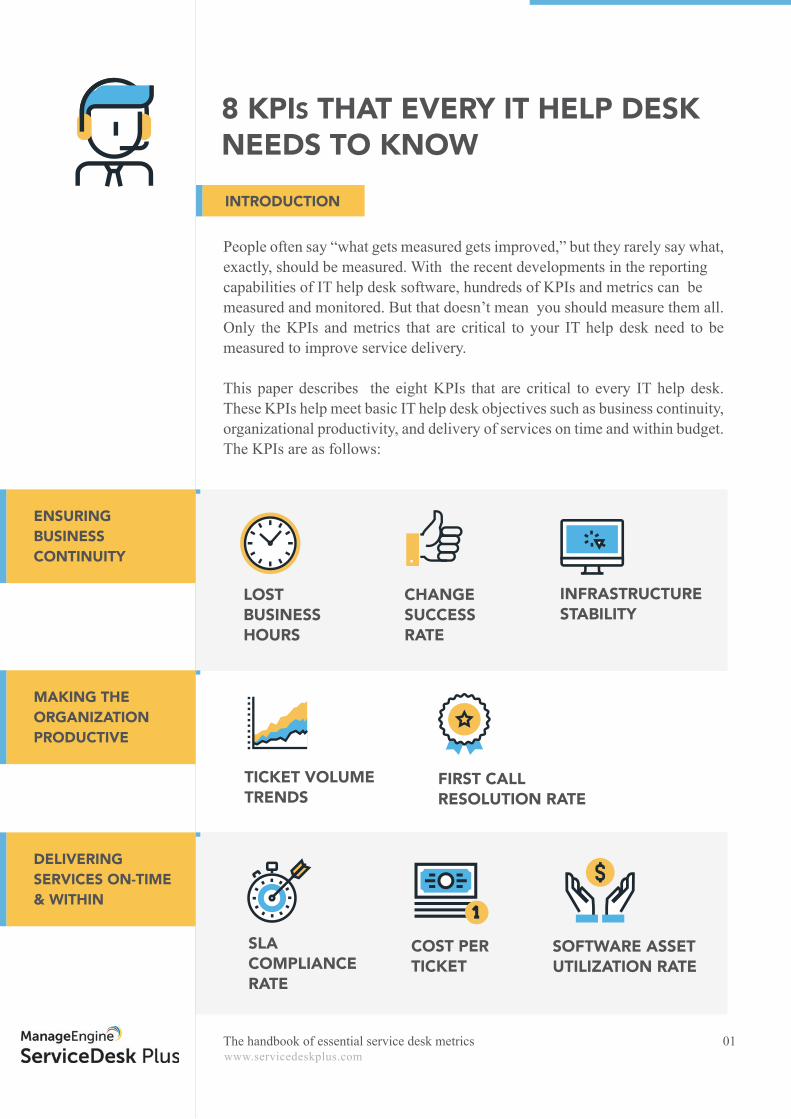
People often say “what gets measured gets improved,” but they rarely say what, exactly, should be measured. With the recent developments in the reporting capabilities of IT help desk software, hundreds of KPIs and metrics can be measured and monitored. But that doesn’t mean you should measure them all. Only the KPIs and metrics that are critical to your IT help desk need to be measured to improve service delivery. This paper describes the eight KPIs that are critical to every IT help desk. These KPIs help meet basic IT help desk objectives such as business continuity, organizational productivity, and delivery of services on time and within budget. The KPIs are as follows:
The handbook of essential service desk metrics 01
8 KPIS THAT EVERY IT HELP DESK NEEDS TO KNOW INTRODUCTION
ENSURING BUSINESS CONTINUITY
MAKING THE ORGANIZATION PRODUCTIVE
DELIVERING SERVICES ON-TIME & WITHIN
LOST BUSINESS HOURS
CHANGE SUCCESS RATE
INFRASTRUCTURE STABILITY
TICKET VOLUME TRENDS
FIRST CALL RESOLUTION RATE
SLA COMPLIANCE RATE
COST PER TICKET
SOFTWARE ASSET UTILIZATION RATE
www.servicedeskplus.com
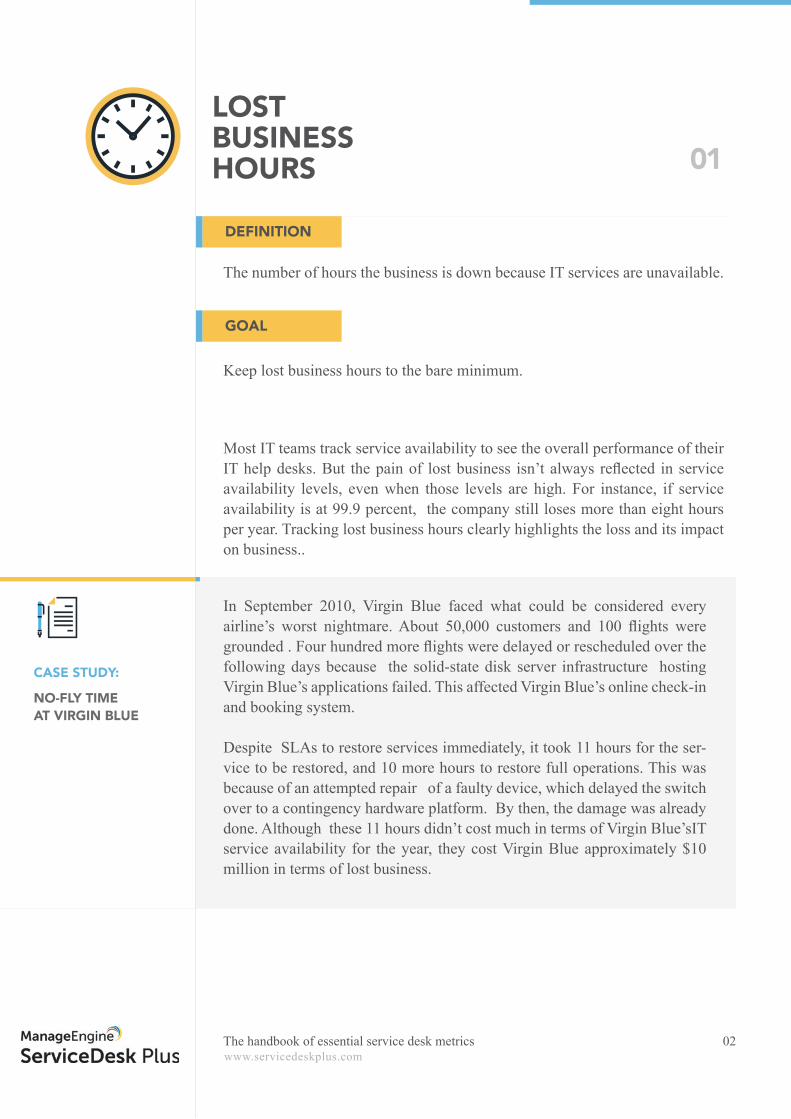
The number of hours the business is down because IT services are unavailable.
Keep lost business hours to the bare minimum.
Most IT teams track service availability to see the overall performance of their IT help desks. But the pain of lost business isn’t always refl ected in service availability levels, even when those levels are high. For instance, if service availability is at 99.9 percent, the company still loses more than eight hours per year. Tracking lost business hours clearly highlights the loss and its impact on business..
In September 2010, Virgin Blue faced what could be considered every airline’s worst nightmare. About 50,000 customers and 100 fl ights were grounded . Four hundred more fl ights were delayed or rescheduled over the following days because the solid-state disk server infrastructure hosting Virgin Blue’s applications failed. This affected Virgin Blue’s online check-in and booking system. Despite SLAs to restore services immediately, it took 11 hours for the ser-vice to be restored, and 10 more hours to restore full operations. This was because of an attempted repair of a faulty device, which delayed the switch over to a contingency hardware platform. By then, the damage was already done. Although these 11 hours didn’t cost much in terms of Virgin Blue’sIT service availability for the year, they cost Virgin Blue approximately $10 million in terms of lost business.
02
LOST BUSINESS HOURS 01
DEFINITION
GOAL
CASE STUDY:
NO-FLY TIME AT VIRGIN BLUE
The handbook of essential service desk metrics
www.servicedeskplus.com
That said, a lot of factors could contribute negatively towards lost business hours. In 2010, Gartner projected that, “Through 2015, 80% of outages impact-ing mission-critical services will be caused by people and process issues, and more than 50% of those outages will be caused by change/confi guration/release integration, and hand-off issues.”
• Proper planning and execution of application upgrades, server migration, and any IT change implementation process.
• Having a clean and well-defi ned CMDB to identify critical failure points and understanding CI interactions in the network to identify the cascading impact of failed changes.
• Educating IT teams on the risks of SLA violations in terms of lost business hours and revenue. • Gain insight on anticipating and handling outages by evaluating the past performance of the IT help desk.
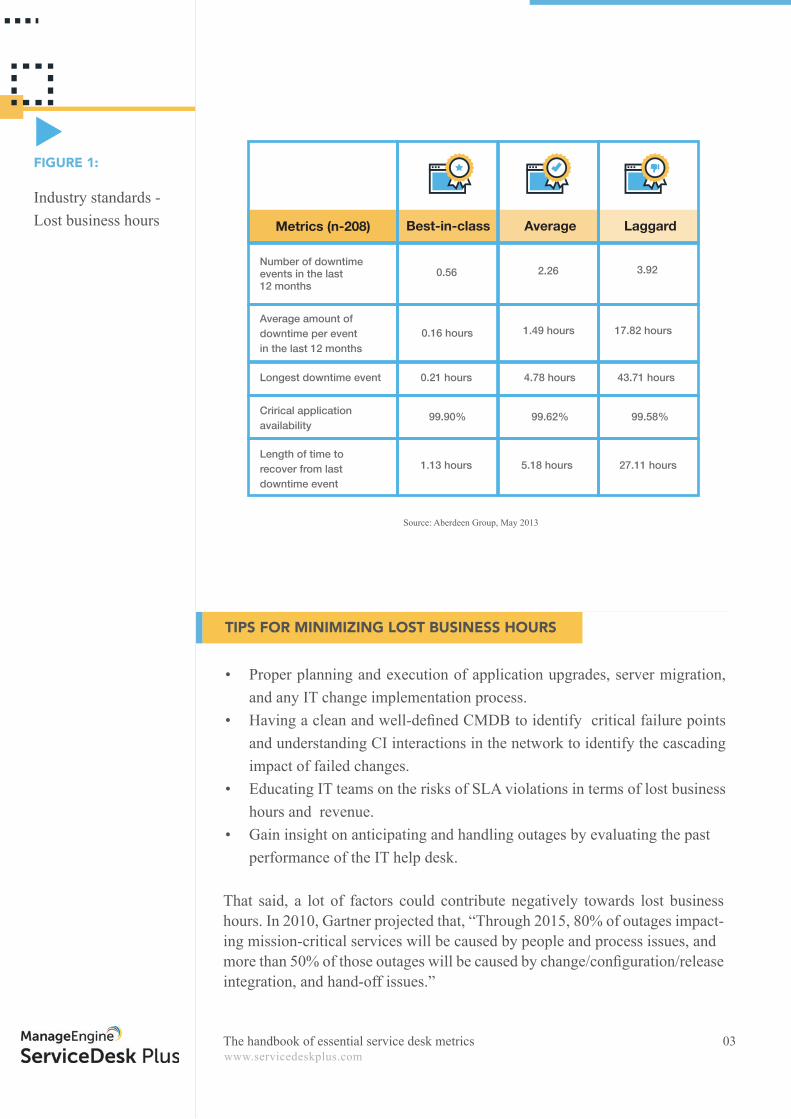
Industry standards - Lost business hours
Source: Aberdeen Group, May 2013
03
TIPS FOR MINIMIZING LOST BUSINESS HOURS
FIGURE 1:
Number of downtime events in the last 12 months
0.56 2.26 3.92
0.16 hours 1.49 hours 17.82 hours
0.21 hours 4.78 hours 43.71 hours
99.90% 99.62% 99.58%
1.13 hours 5.18 hours 27.11 hours
Longest downtime event
Crirical application availability
Average amount of downtime per event in the last 12 months
Length of time to recover from last downtime event
Metrics (n-208) Best-in-class Average Laggard
The handbook of essential service desk metrics
www.servicedeskplus.com
The ratio of the number of successful changes to the total number of changes that were executed in a given time frame.
A downward trend or a stale change success rate is usually due to failure of change implementations due to: • Lack of relevant information such as the impact of the change, the de-
pendencies of the assets involved, the change implementation window, and business priorities.
• Inability to collaborate between teams for successful change implementation.
• Improper communication to end users and stakeholders of the change implementation.
Achieve a higher percentage of successful change implementations.
Opinion remains divided on what a failed change implies. It basically refers to any change that did not meet its objectives or go as planned.
On October 27, 2011, trading had to be halted at the Australian Stock Ex-change (ASX) for four hours due to a failed change implementation. An up-grade on the ASX’s internal network ( to improve the latency of the trading platform) led to unprecedented connectivity issues between the supporting components and the disseminating gateways of the trading system. ASX had to initiate trading services from one of their disaster recovery sites. Finally, to restore normalcy, the change had to be backed out that night.
04
CHANGE SUCCESS RATE 02
DEFINITION
GOAL
CASE STUDY:
THE ASX OUTAGE
The handbook of essential service desk metrics
www.servicedeskplus.com
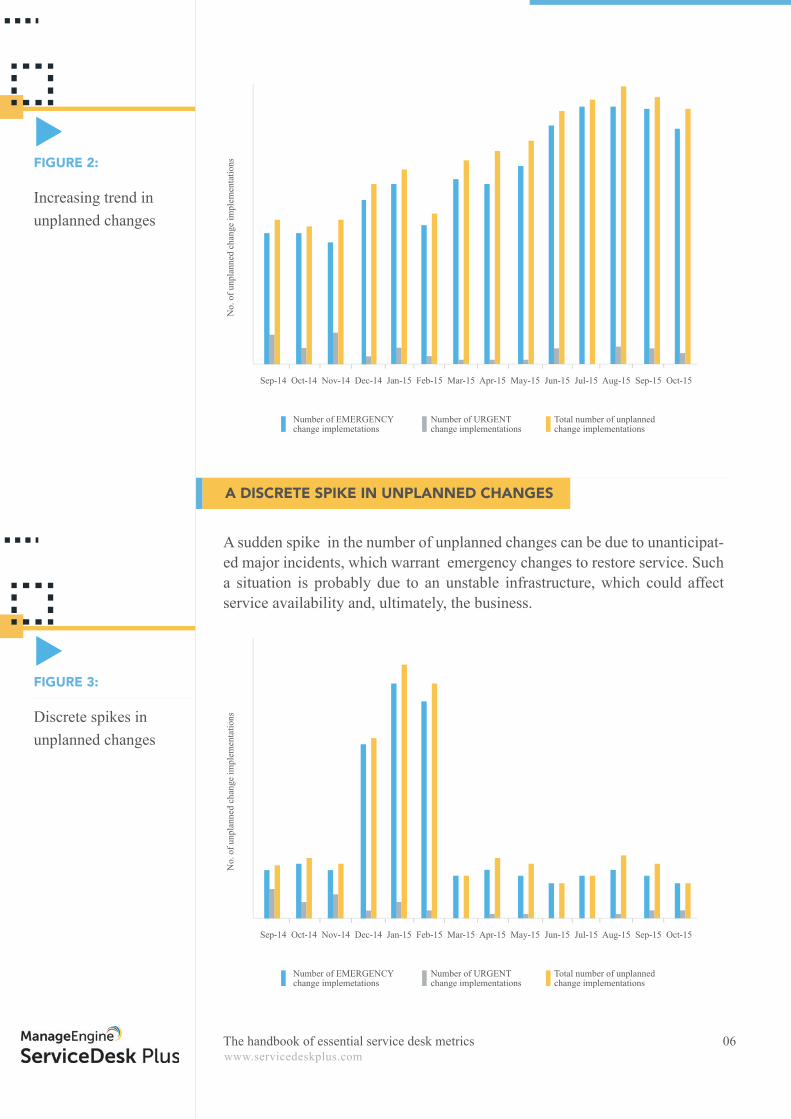
Another metric that should be tracked to have an effective change management process is the number of unplanned changes. An unplanned change can be an emergency change or an urgent change.
An increasing trend in the number of unplanned changes indicates the inade-quate planning of changes and questions the effi ciency of the change manage-ment process. Therefore, the change management process has to be improved to ensure proper planning and execution of changes.
Although there is no industry standard or defi ned number for the number of unplanned changes permissible in an IT infrastructure, this metric is important, especially during an increasing trend or a spike in the number of unplanned changes.
• Perform a proper impact analysis and a detailed rollout plan with a check list of tasks to be completed.
• Collect all relevant information from end users and technicians before the implementation.
• Constitute CABs and ensure a strict approval process.
• An emergency change: A service restoration change due to an incident, or a change that needs to be implemented quickly to avoid an incident.
• An urgent or expedited change: Changes that are required quickly due to a pressing need such as a legal requirement or a business need, but are not related to restoring service.
05
TIPS FOR A HIGH CHANGE SUCCESS RATE
2.1) UNPLANNED CHANGES
AN INCREASING TREND IN UNPLANNED CHANGES
The handbook of essential service desk metrics
www.servicedeskplus.com
A sudden spike in the number of unplanned changes can be due to unanticipat-ed major incidents, which warrant emergency changes to restore service. Such a situation is probably due to an unstable infrastructure, which could affect service availability and, ultimately, the business.
Increasing trend in unplanned changes
Discrete spikes in unplanned changes
06
A DISCRETE SPIKE IN UNPLANNED CHANGES
FIGURE 2:
FIGURE 3:
Sep-14 Oct-14 Nov-14 Dec-14 Jan-15 Feb-15 Mar-15 Apr-15 May-15 Jun-15 Jul-15 Aug-15 Sep-15 Oct-15
No.
of u
npla
nned
cha
nge
impl
emen
tatio
ns
Number of EMERGENCY change implemetations
Number of URGENT change implementations
Total number of unplanned change implementations
Sep-14 Oct-14 Nov-14 Dec-14 Jan-15 Feb-15 Mar-15 Apr-15 May-15 Jun-15 Jul-15 Aug-15 Sep-15 Oct-15
No.
of u
npla
nned
cha
nge
impl
emen
tatio
ns
Number of EMERGENCY change implemetations
Number of URGENT change implementations
Total number of unplanned change implementations
The handbook of essential service desk metrics
www.servicedeskplus.com
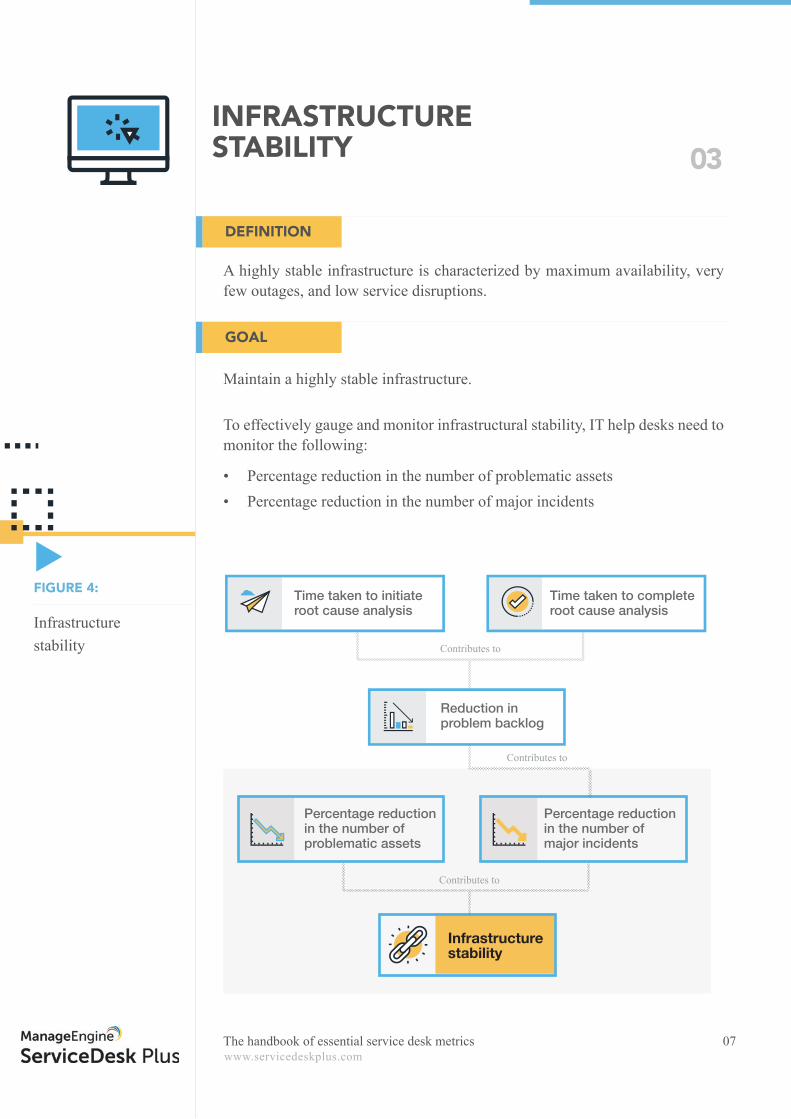
A highly stable infrastructure is characterized by maximum availability, very few outages, and low service disruptions.
To effectively gauge and monitor infrastructural stability, IT help desks need to monitor the following:
• Percentage reduction in the number of problematic assets• Percentage reduction in the number of major incidents
Maintain a highly stable infrastructure.
07
INFRASTRUCTURE STABILITY 03
DEFINITION
GOAL
Infrastructure stability
FIGURE 4: Time taken to initiate root cause analysis
Time taken to complete root cause analysis
Reduction in problem backlog
Percentage reduction in the number of major incidents
Percentage reduction in the number of problematic assets
Infrastructure stability
Contributes to
Contributes to
Contributes to
The handbook of essential service desk metrics
www.servicedeskplus.com
Delivering maximum availability and better service quality will be impossible in an infrastructure where routers have to be restarted multiple times a day, servers are often down, or workstations have to be rebooted every now and then. Therefore, such problematic assets must be identifi ed and replaced to ensure business continuity. A problematic asset might repeatedly be the cause for service disruptions or outages, and for reporting purposes, these could be assets that have more than a couple incidents associated with them. The per-centage reduction in the number of problematic assets can be calculated using the following formula:
Another major indication of stability is the recurrence of major incidents on the IT infrastructure, which can lead to service disruptions or service level deterio-ration. A major incident, by defi nition, is a high-impact, high-urgency incident that affects a large number of users, depriving the business of one or two key services. The goal is to reduce the number of major incidents, which can be achieved with effi cient root cause analysis (RCA) and a reduction of problem backlog. Identifying root causes and fi xing problems can reduce the recurrence of major incidents and, subsequently, ticket volumes to the IT help desk.
• Faster initiation of RCA: In this case, the sooner the better. The sooner the RCA is initiated, the greater the chances are of identifying the root cause.
• Quick completion of investigations: If the root cause is identifi ed faster, the IT team can fi x and resolve the problem faster, making sure that inci-dents don’t reoccur.
Teams can also measure these action items with details on time taken to initiate root cause analysis after problem identifi cation and time taken to complete root cause analysis.
Number of problematic assets replaced at the end of the time frame.
Number of problematic assets identifi ed at the beginning of the time frame.
08
3.1) PERCENTAGE REDUCTION IN THE NUMBER OF PROBLEMATIC ASSETS
3.2) PERCENTAGE REDUCTION IN THE NUMBER OF MAJOR INCIDENTS
TIPS TO REDUCE PROBLEM BACKLOG (AND THEREFORE MAJOR INCIDENTS)
The handbook of essential service desk metrics
www.servicedeskplus.com09
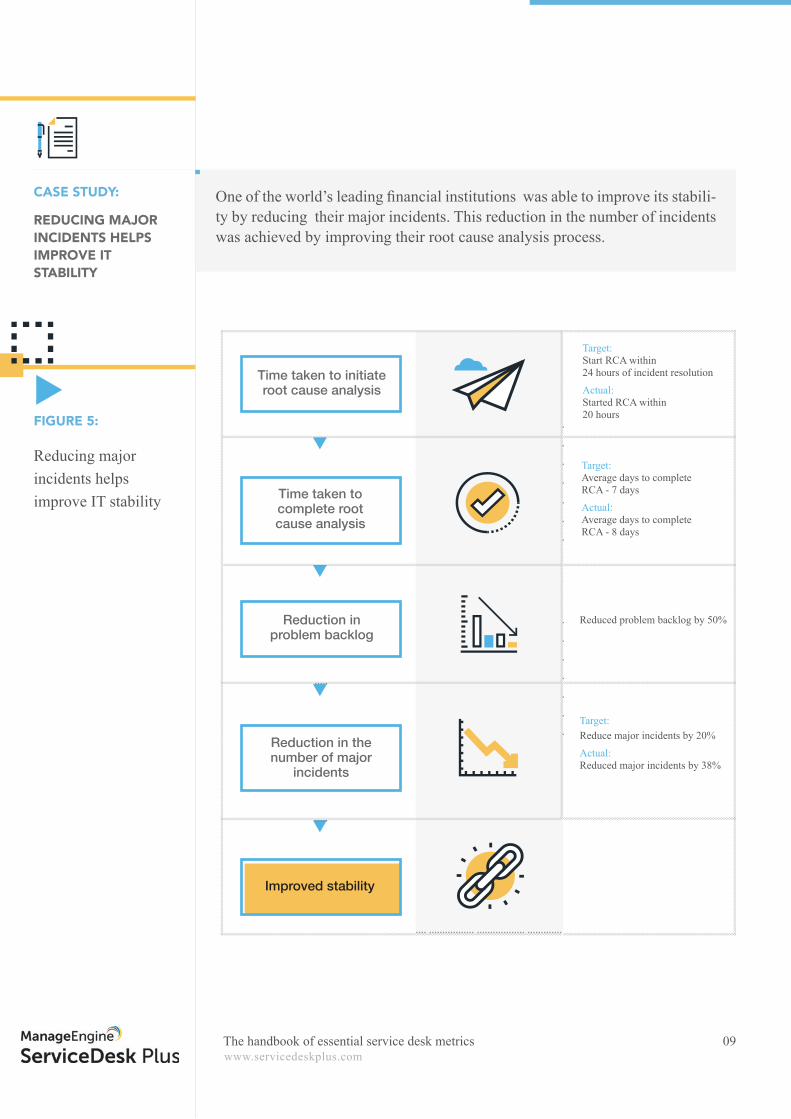
Reducing major incidents helps improve IT stability
FIGURE 5:
CASE STUDY:
REDUCING MAJOR INCIDENTS HELPS IMPROVE IT STABILITY
Time taken to initiate root cause analysis
Time taken to complete root cause analysis
Reduction in problem backlog
Reduction in the number of major
incidents
Improved stability
One of the world’s leading fi nancial institutions was able to improve its stabili-ty by reducing their major incidents. This reduction in the number of incidents was achieved by improving their root cause analysis process.
Target: Start RCA within 24 hours of incident resolution
Actual: Started RCA within 20 hours
Target: Average days to complete RCA - 7 days
Actual: Average days to complete RCA - 8 days
Target: Reduce major incidents by 20%
Actual: Reduced major incidents by 38%
Reduced problem backlog by 50%
The handbook of essential service desk metrics
www.servicedeskplus.com10
Without identifying and rectifying the root cause, the chances of major inci-dents recurring are fairly high. Thankfully, though, the problem backlog can be reduced by: • Having a dedicated problem management team with problem administra-
tors and problem managers.• Identifying and training subject matter experts.• Training the problem management team on the basic and advanced root
cause analysis techniques.
Working on these two simple metrics—percentage reduction in the number of major incidents and percentage reduction in the number of problematic assets—can help you maintain a highly stable IT infrastructure.
The major reasons for a heavy problem backlog could be:
• Delayed and long-pending RCAs.• Inconsistent quality of RCAs, and lack of proper documentation.• Not effectively communicating the investigation process to the stakeholders.
The handbook of essential service desk metrics
www.servicedeskplus.com
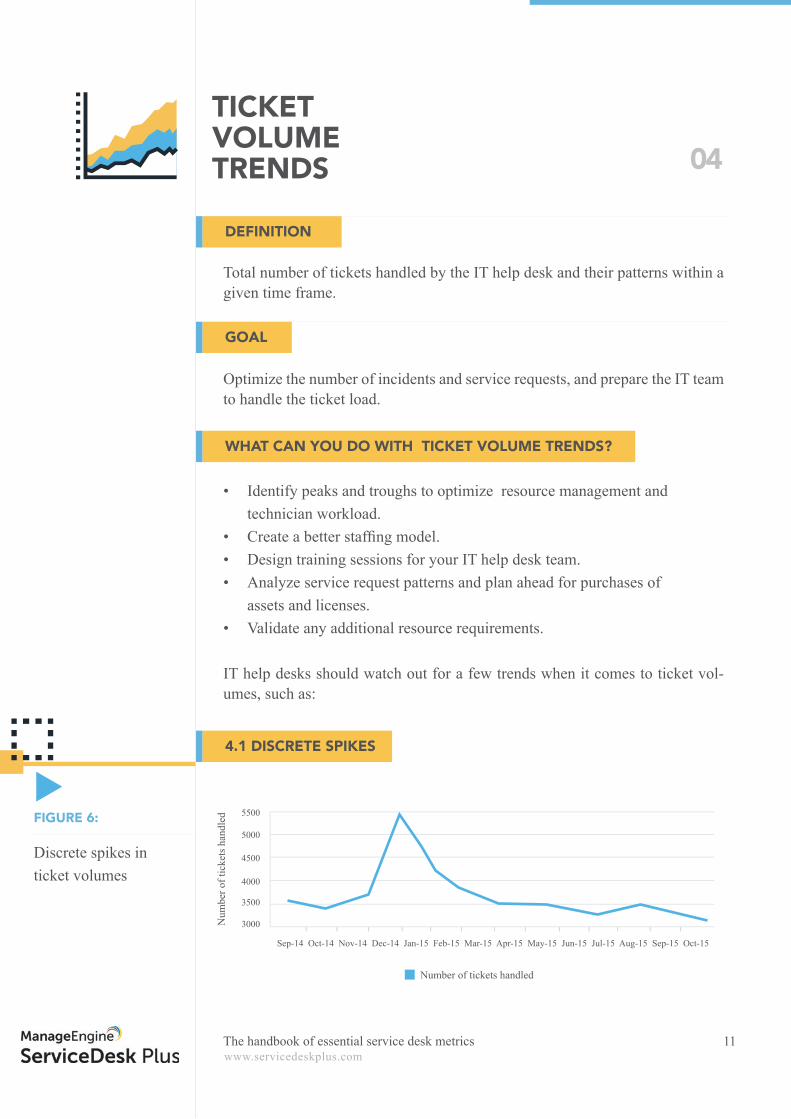
Total number of tickets handled by the IT help desk and their patterns within a given time frame.
• Identify peaks and troughs to optimize resource management and technician workload.• Create a better staffi ng model.• Design training sessions for your IT help desk team.• Analyze service request patterns and plan ahead for purchases of assets and licenses.• Validate any additional resource requirements.
Optimize the number of incidents and service requests, and prepare the IT team to handle the ticket load.
IT help desks should watch out for a few trends when it comes to ticket vol-umes, such as:
11
TICKET VOLUME TRENDS 04
DEFINITION
GOAL
WHAT CAN YOU DO WITH TICKET VOLUME TRENDS?
4.1 DISCRETE SPIKES
Discrete spikes in ticket volumes
FIGURE 6:
Sep-14 Oct-14 Nov-14 Dec-14 Jan-15 Feb-15 Mar-15 Apr-15 May-15 Jun-15 Jul-15 Aug-15 Sep-15 Oct-15
3000
3500
4000
4500
5000
5500
Number of tickets handled
Num
ber o
f tic
kets
han
dled
The handbook of essential service desk metrics
www.servicedeskplus.com
A sudden upward spike in the ticket volume can be due to the followingreasons:• a. Period of peak business activity • b. IT rollouts leading to: Service disruptions and unavailability FAQs • c. IT disruptions • d. Post holiday password reset tickets
12
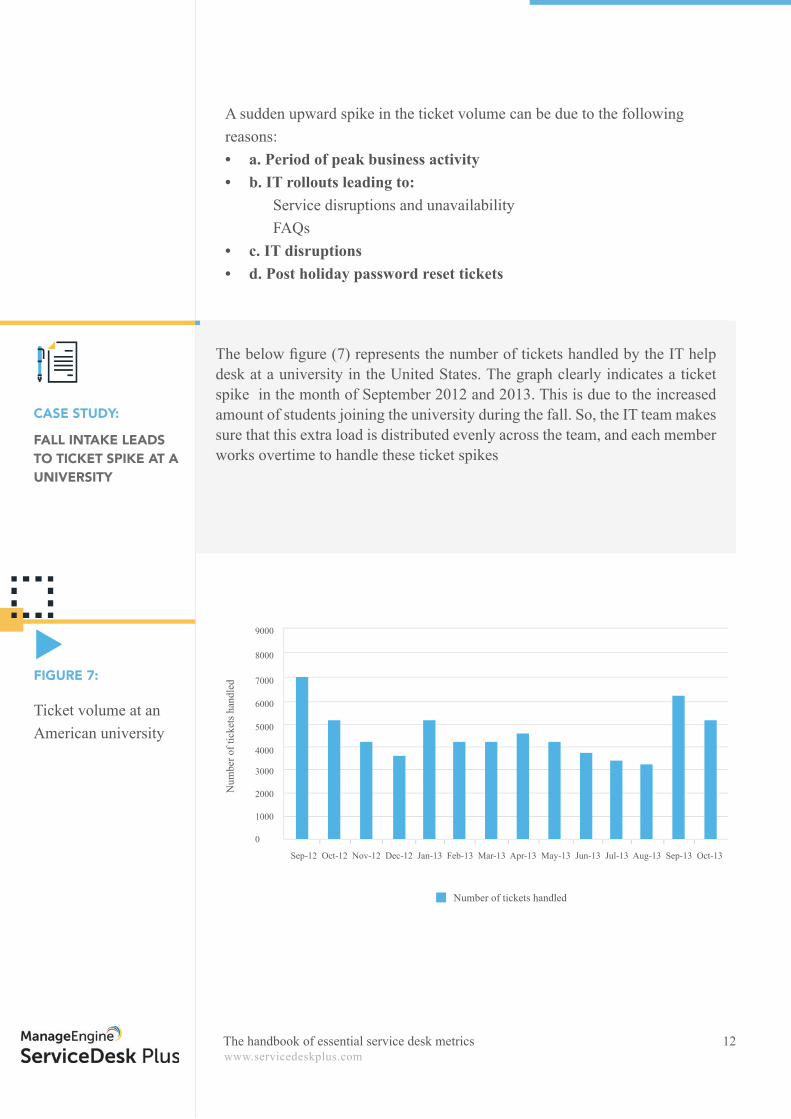
CASE STUDY:
FALL INTAKE LEADS TO TICKET SPIKE AT A UNIVERSITY
The below fi gure (7) represents the number of tickets handled by the IT help desk at a university in the United States. The graph clearly indicates a ticket spike in the month of September 2012 and 2013. This is due to the increased amount of students joining the university during the fall. So, the IT team makes sure that this extra load is distributed evenly across the team, and each member works overtime to handle these ticket spikes
Ticket volume at an American university
FIGURE 7:
Sep-12 Oct-12 Nov-12 Dec-12 Jan-13 Feb-13 Mar-13 Apr-13 May-13 Jun-13 Jul-13 Aug-13 Sep-13 Oct-13
0
1000
2000
3000
4000
5000
6000
7000
8000
9000
Number of tickets handled
Num
ber o
f tic
kets
han
dled
The handbook of essential service desk metrics
www.servicedeskplus.com13
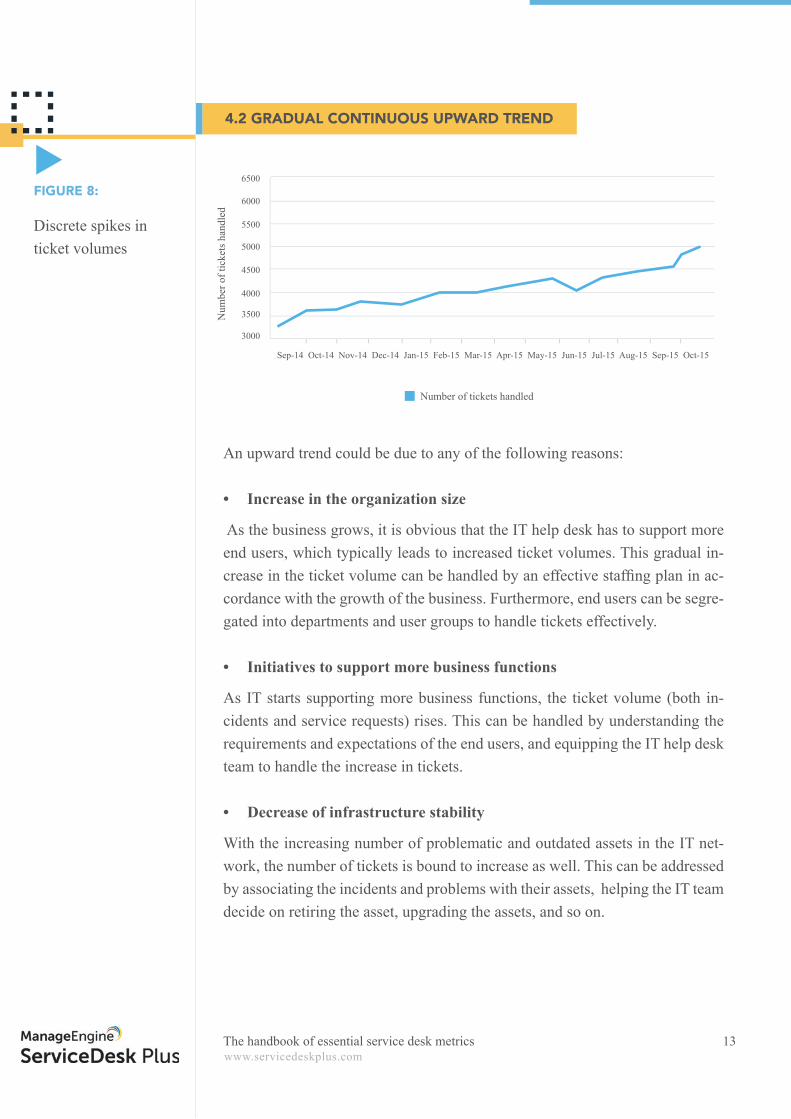
4.2 GRADUAL CONTINUOUS UPWARD TREND
Discrete spikes in ticket volumes
FIGURE 8:
An upward trend could be due to any of the following reasons:
• Increase in the organization size
As the business grows, it is obvious that the IT help desk has to support more end users, which typically leads to increased ticket volumes. This gradual in-crease in the ticket volume can be handled by an effective staffi ng plan in ac-cordance with the growth of the business. Furthermore, end users can be segre-gated into departments and user groups to handle tickets effectively.
• Initiatives to support more business functions
As IT starts supporting more business functions, the ticket volume (both in-cidents and service requests) rises. This can be handled by understanding the requirements and expectations of the end users, and equipping the IT help desk team to handle the increase in tickets.
• Decrease of infrastructure stability
With the increasing number of problematic and outdated assets in the IT net-work, the number of tickets is bound to increase as well. This can be addressed by associating the incidents and problems with their assets, helping the IT team decide on retiring the asset, upgrading the assets, and so on.
Sep-14 Oct-14 Nov-14 Dec-14 Jan-15 Feb-15 Mar-15 Apr-15 May-15 Jun-15 Jul-15 Aug-15 Sep-15 Oct-15
3000
3500
4000
4500
5000
5500
6000
6500
Number of tickets handled
Num
ber o
f tic
kets
han
dled
The handbook of essential service desk metrics

www.servicedeskplus.com
Percentage of incidents resolved by the fi rst level of support (fi rst call or contact with the IT help desk).
Have a higher level of FCRR.
High fi rst call resolution rate is usually associated with higher customer satis-faction as confi rmed by a study that Customer Relationship Metrics conducted. Furthermore, a study conducted by the Service Quality Measurement Group also revealed that for every one percent improvement in FCR, you get a one percent improvement in customer or end user satisfaction.
First call resolution is also related to cost per ticket. The following graph represents the cost per ticket for every level.
14
FIRST CALL RESOLUTION RATE (FCRR) 05
DEFINITION
GOAL
Cost per ticket at various levels of support
FIGURE 9:
Self service Level-1 Level-2 Level-3
Time taken for resolutionSource: Whitepaper - Service desk optimization: 40 to 80 in no time flat
Cos
t per
tick
et
$20.00
$0
$40.00
$60.00
$80.00
$100.00
$120.00
$140.00
$160.00
Cost(Min) Cost(Max)
The handbook of essential service desk metrics
www.servicedeskplus.com15
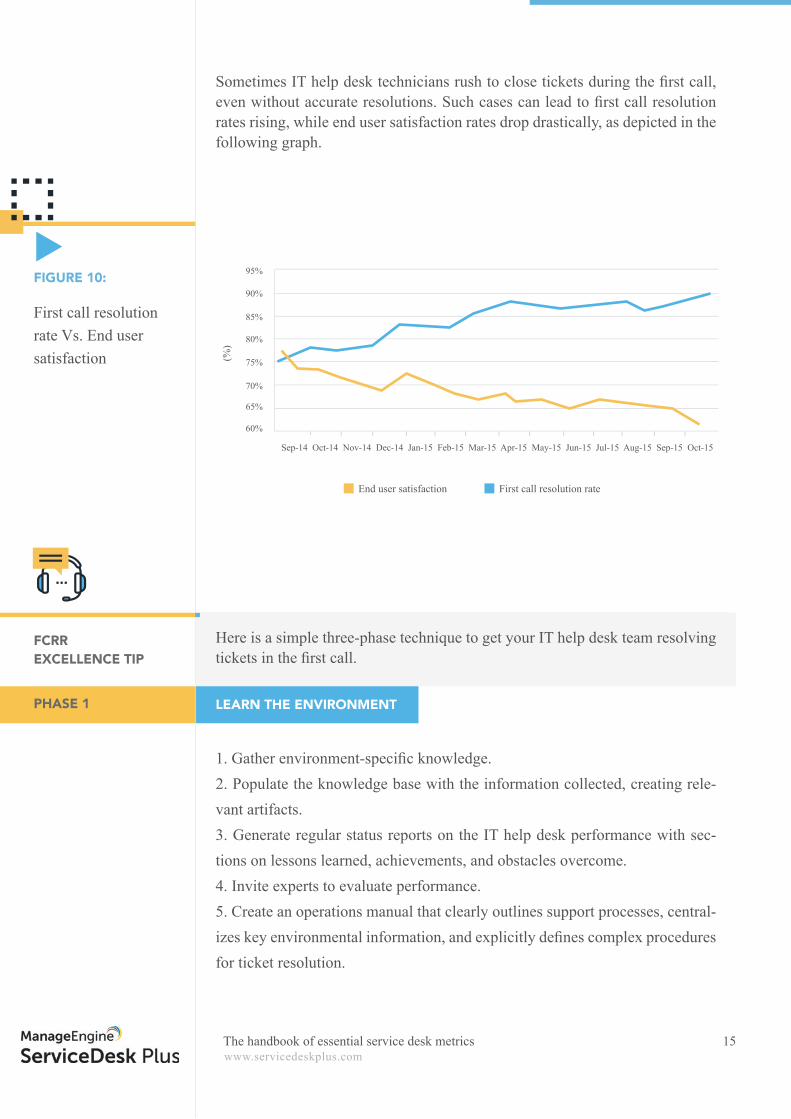
Sometimes IT help desk technicians rush to close tickets during the fi rst call, even without accurate resolutions. Such cases can lead to fi rst call resolution rates rising, while end user satisfaction rates drop drastically, as depicted in the following graph.
First call resolution rate Vs. End user satisfaction
FIGURE 10:
FCRR EXCELLENCE TIP
PHASE 1 LEARN THE ENVIRONMENT
Here is a simple three-phase technique to get your IT help desk team resolving tickets in the fi rst call.
1. Gather environment-specifi c knowledge. 2. Populate the knowledge base with the information collected, creating rele-vant artifacts. 3. Generate regular status reports on the IT help desk performance with sec-tions on lessons learned, achievements, and obstacles overcome.4. Invite experts to evaluate performance. 5. Create an operations manual that clearly outlines support processes, central-izes key environmental information, and explicitly defi nes complex procedures for ticket resolution.
Sep-14 Oct-14 Nov-14 Dec-14 Jan-15 Feb-15 Mar-15 Apr-15 May-15 Jun-15 Jul-15 Aug-15 Sep-15 Oct-15
60%
65%
70%
75%
80%
85%
90%
95%
End user satisfaction First call resolution rate
(%)
The handbook of essential service desk metrics
www.servicedeskplus.com16
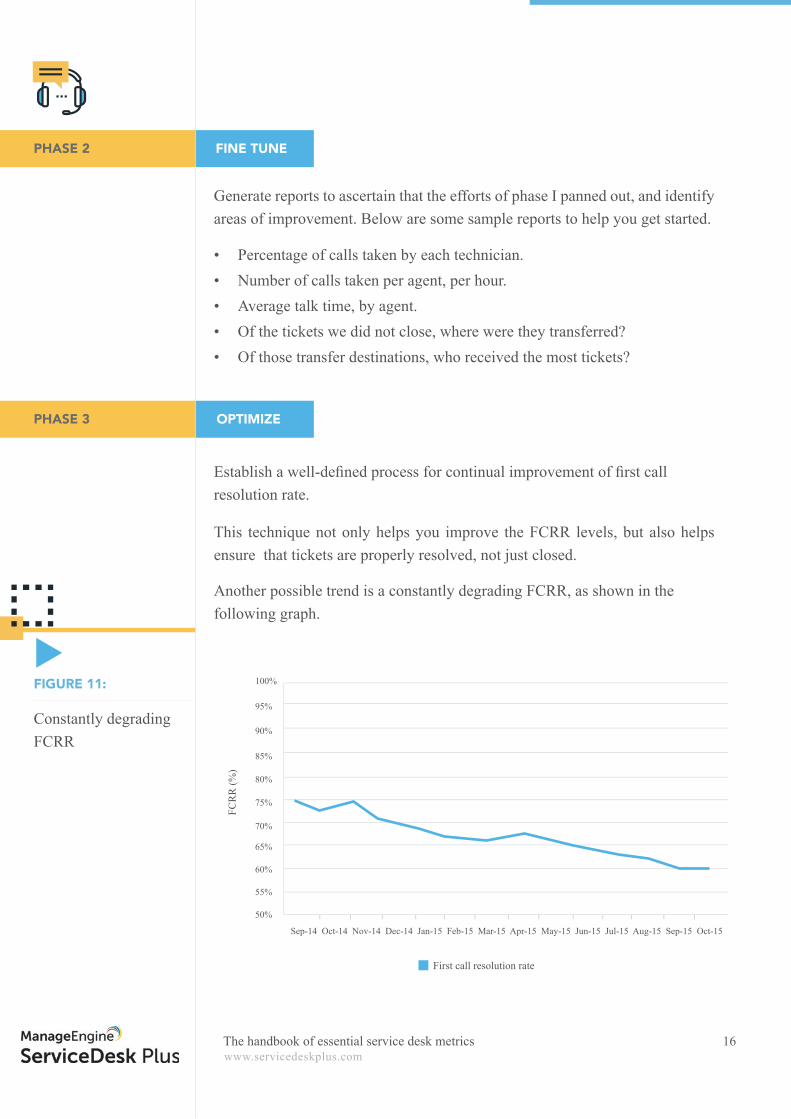
Generate reports to ascertain that the efforts of phase I panned out, and identify areas of improvement. Below are some sample reports to help you get started.
• Percentage of calls taken by each technician.• Number of calls taken per agent, per hour. • Average talk time, by agent. • Of the tickets we did not close, where were they transferred? • Of those transfer destinations, who received the most tickets?
Establish a well-defi ned process for continual improvement of fi rst call resolution rate.
This technique not only helps you improve the FCRR levels, but also helps ensure that tickets are properly resolved, not just closed.
Another possible trend is a constantly degrading FCRR, as shown in the following graph.
PHASE 2
PHASE 3
FINE TUNE
OPTIMIZE
Constantly degrading FCRR
FIGURE 11:
Sep-14 Oct-14 Nov-14 Dec-14 Jan-15 Feb-15 Mar-15 Apr-15 May-15 Jun-15 Jul-15 Aug-15 Sep-15 Oct-15
50%
55%
60%
65%
70%
75%
80%
85%
90%
95%
100%
First call resolution rate
FCR
R (%
)
The handbook of essential service desk metrics

www.servicedeskplus.com
• Communicate the importance of FCRR to the technicians.• Design training programs for the fi rst level technicians on specifi c subjects
to help resolve tickets faster.• Maintain a knowledge base of advanced technical solutions and articles
exclusively for, and limited to, technicians.• Create custom forms to collect all relevant information at the time of ticket
creation to avoid turnaround delays.• Automatically route tickets to the right technician or group based on ticket
parameters.
According to MetricNet’s benchmarking levels, the average net FCRR for ser-vice desks globally is 74 percent, with a range of 41 to 74 percent. The most common factors among all the services on the higher end of the spectrum were the presence of highly trained agents, the availability of knowledge manage-ment tools, and the presence of tools such as remote desktop management.
There are a few reasons this could occur, but the primary reasons are as follows:
• Lack of requester and system information.
• Poor technician capabilities.
• Poor knowledge transfer and sharing.
17
FCRR CAN BE IMPROVED WITH THE FOLLOWING TIPS:
The handbook of essential service desk metrics
www.servicedeskplus.com
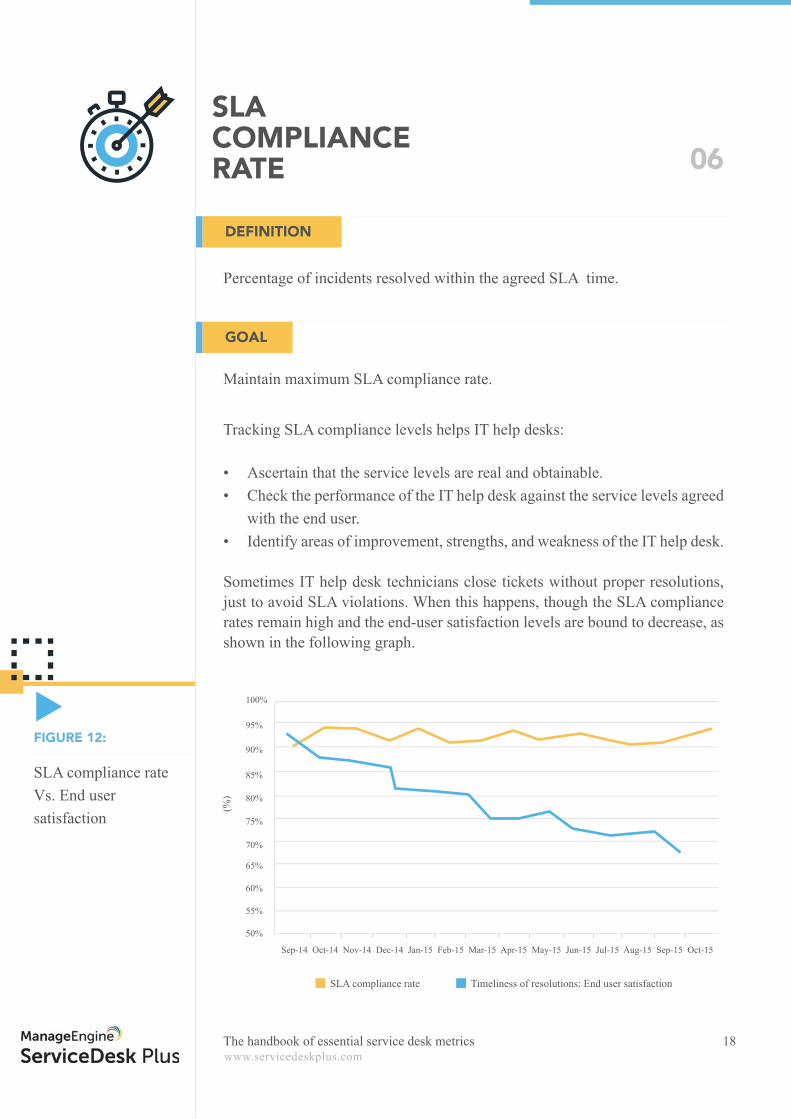
Percentage of incidents resolved within the agreed SLA time.
Maintain maximum SLA compliance rate.
Tracking SLA compliance levels helps IT help desks:
• Ascertain that the service levels are real and obtainable.• Check the performance of the IT help desk against the service levels agreed
with the end user.• Identify areas of improvement, strengths, and weakness of the IT help desk.
Sometimes IT help desk technicians close tickets without proper resolutions, just to avoid SLA violations. When this happens, though the SLA compliance rates remain high and the end-user satisfaction levels are bound to decrease, as shown in the following graph.
18
SLA COMPLIANCE RATE 06
DEFINITION
GOAL
SLA compliance rate Vs. End user satisfaction
FIGURE 12:
Sep-14 Oct-14 Nov-14 Dec-14 Jan-15 Feb-15 Mar-15 Apr-15 May-15 Jun-15 Jul-15 Aug-15 Sep-15 Oct-15
50%
55%
60%
65%
70%
75%
80%
85%
90%
95%
100%
SLA compliance rate Timeliness of resolutions: End user satisfaction
(%)
The handbook of essential service desk metrics
www.servicedeskplus.com19
CASE STUDY:
WHEN MEETING SLAS DOESN’T HELP
SLAs and SLA compliance are critical to ensuring business continuity. This case from a cement manufacturing company, however, stresses that SLAs must also be set carefully. The IT help desk was unavailable for immediate response to an issue on a truck dispatch, but did resolve it within the SLA. Unfortunate-ly, the cement manufactured had to be dispatched to the client location within one hour to avoid hardening. The IT help desk was unaware of this, and SLAs were set without considering these factors. As a result, though the ticket was resolved within the SLA, the cement had already hardened, which affected the business.
SLA compliance levels may drop for other reasons, though, so it is important to keep the following possibilities in mind:
• Your team may not understand the business requirements, which can lead to service level agreements that don’t fulfi ll the business needs, or improper categorization and prioritization of tickets leading to SLA violations.
• There is often a lack of proper communication on the risks of outages af-fecting mission-critical services and their business impacts.
During such scenarios, IT help desk teams must understand the requirements of the business, and redefi ne their SLAs as appropriate.
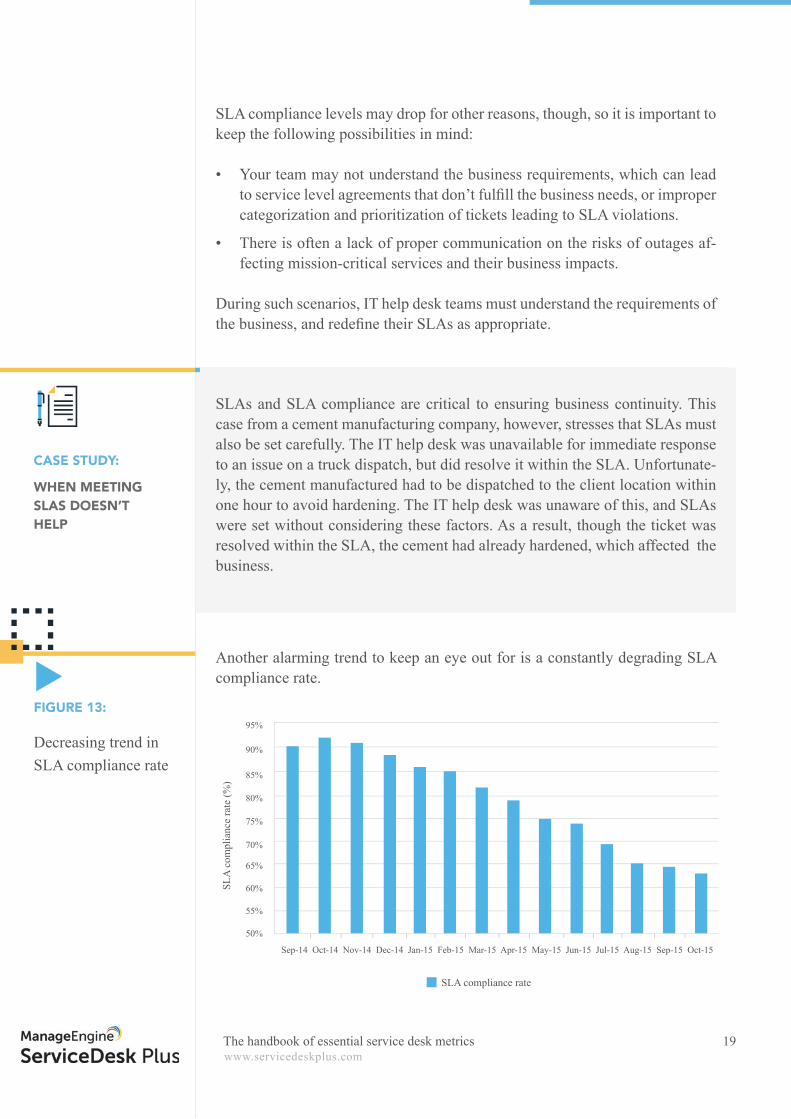
Another alarming trend to keep an eye out for is a constantly degrading SLA compliance rate.
Decreasing trend in SLA compliance rate
FIGURE 13:
Sep-14 Oct-14 Nov-14 Dec-14 Jan-15 Feb-15 Mar-15 Apr-15 May-15 Jun-15 Jul-15 Aug-15 Sep-15 Oct-15
50%
55%
60%
65%
70%
75%
80%
85%
90%
95%
SLA compliance rate
SLA
com
plia
nce
rate
(%)
The handbook of essential service desk metrics
www.servicedeskplus.com
• Unrealistic service level agreements. • Lack of awareness of the SLAs and the risks of SLA violations.• Absence of proper monitoring and proactive escalation.• Lack of technician expertise.• Unassigned tickets and delayed and faulty ticket assignments.
• Setting realistic SLAs based on the business requirements and IT capabilities.• Communicating the SLAs and risks of SLA violations to the business and
technicians.• Setting necessary escalation rules.• Automating the process of routing and assigning tickets.• Designing training programs for your technicians.
20
THIS FALLING TREND COULD BE DUE TO ANY OF THE FOLLOWING:
THE SLA COMPLIANCE RATE CAN BE KEPT AT HIGHER LEVELS BY:
The handbook of essential service desk metrics
www.servicedeskplus.com
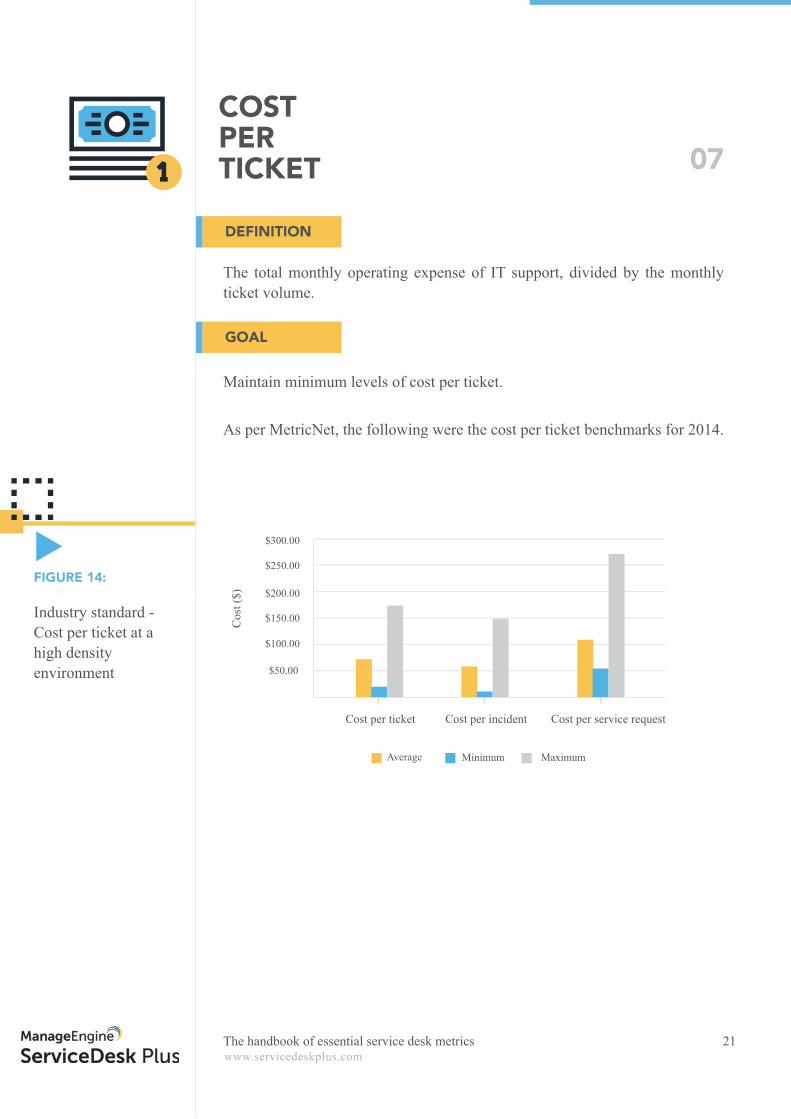
The total monthly operating expense of IT support, divided by the monthly ticket volume.
Maintain minimum levels of cost per ticket.
As per MetricNet, the following were the cost per ticket benchmarks for 2014.
21
COST PER TICKET 07
DEFINITION
GOAL
Industry standard - Cost per ticket at a high density environment
FIGURE 14:
Cost per ticket Cost per incident Cost per service request
Cos
t ($)
$50.00
$100.00
$150.00
$200.00
$250.00
$300.00
Average Minimum Maximum
The total monthly operating expense of IT support, divided by the monthly The total monthly operating expense of IT support, divided by the monthly The total monthly operating expense of IT support, divided by the monthly The total monthly operating expense of IT support, divided by the monthly The total monthly operating expense of IT support, divided by the monthly The total monthly operating expense of IT support, divided by the monthly
The handbook of essential service desk metrics
www.servicedeskplus.com22
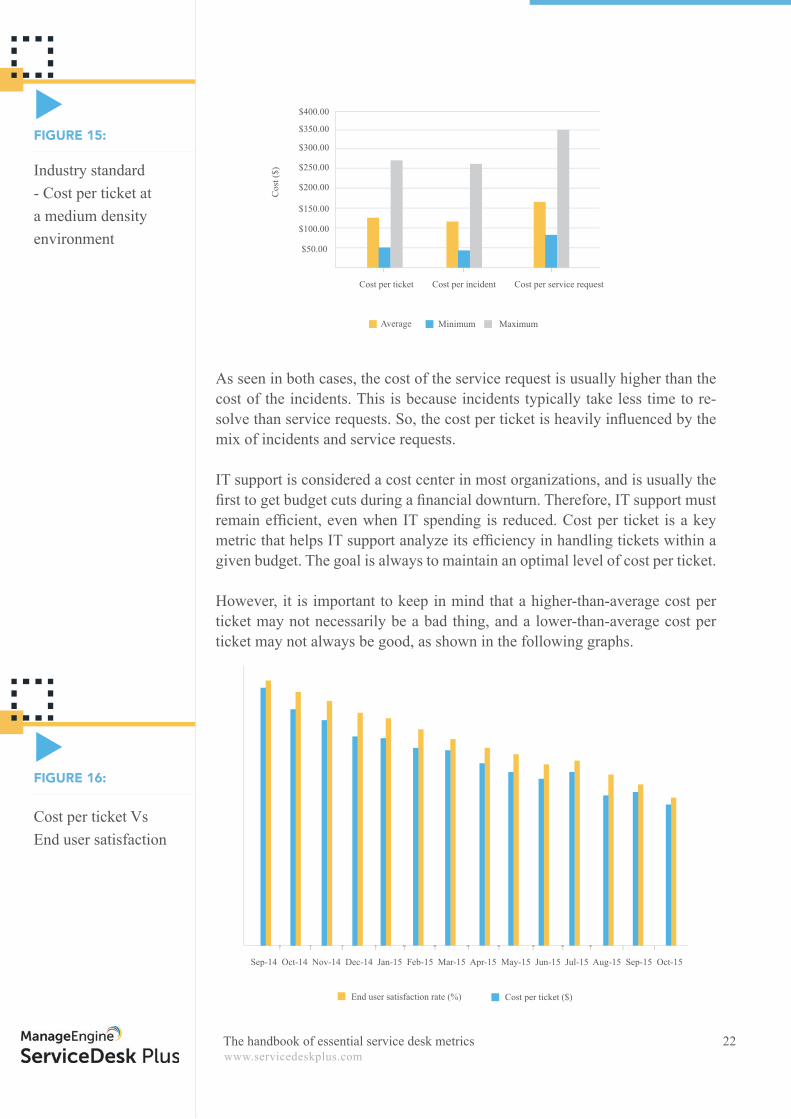
As seen in both cases, the cost of the service request is usually higher than the cost of the incidents. This is because incidents typically take less time to re-solve than service requests. So, the cost per ticket is heavily infl uenced by the mix of incidents and service requests. IT support is considered a cost center in most organizations, and is usually the fi rst to get budget cuts during a fi nancial downturn. Therefore, IT support must remain effi cient, even when IT spending is reduced. Cost per ticket is a key metric that helps IT support analyze its effi ciency in handling tickets within a given budget. The goal is always to maintain an optimal level of cost per ticket.
However, it is important to keep in mind that a higher-than-average cost per ticket may not necessarily be a bad thing, and a lower-than-average cost per ticket may not always be good, as shown in the following graphs.
Industry standard - Cost per ticket at a medium density environment
Cost per ticket Vs End user satisfaction
FIGURE 15:
FIGURE 16:
Sep-14 Oct-14 Nov-14 Dec-14 Jan-15 Feb-15 Mar-15 Apr-15 May-15 Jun-15 Jul-15 Aug-15 Sep-15 Oct-15
End user satisfaction rate (%) Cost per ticket ($)
Cost per ticket Cost per incident Cost per service requestC
ost (
$)
$50.00
$100.00
$150.00
$200.00
$250.00
$300.00
$350.00
$400.00
Average Minimum Maximum
The handbook of essential service desk metrics
www.servicedeskplus.com23
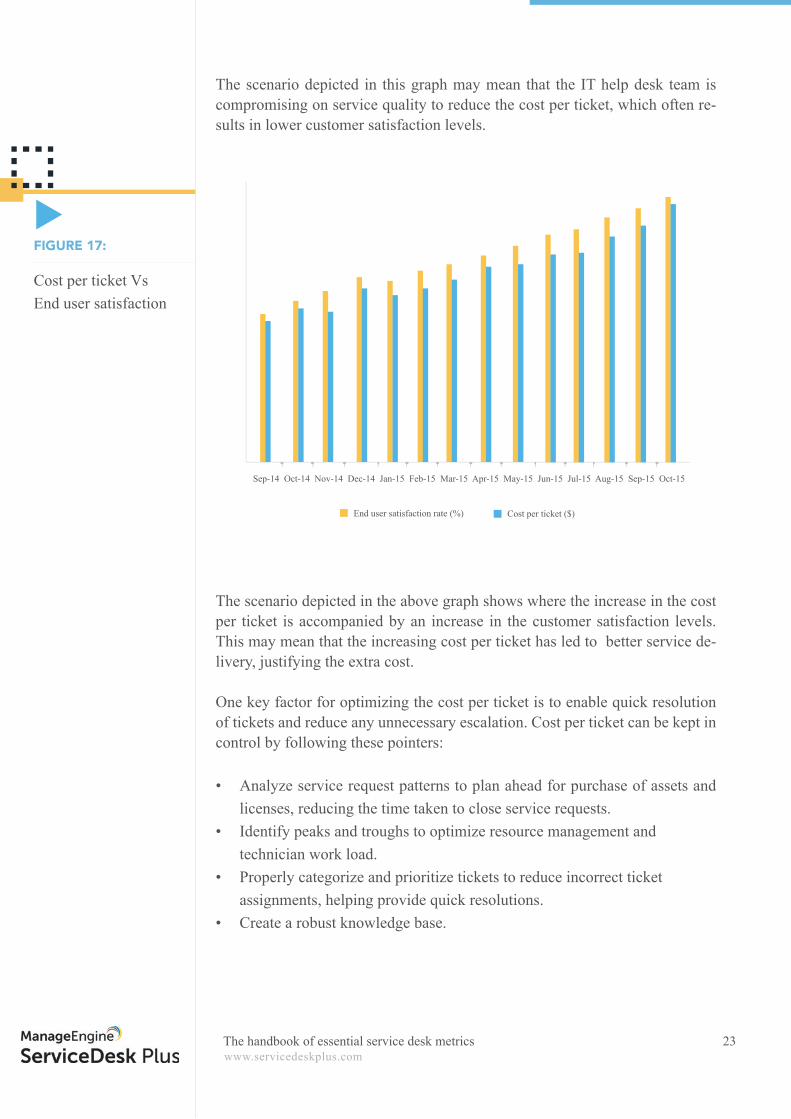
The scenario depicted in this graph may mean that the IT help desk team is compromising on service quality to reduce the cost per ticket, which often re-sults in lower customer satisfaction levels.
The scenario depicted in the above graph shows where the increase in the cost per ticket is accompanied by an increase in the customer satisfaction levels. This may mean that the increasing cost per ticket has led to better service de-livery, justifying the extra cost.
One key factor for optimizing the cost per ticket is to enable quick resolution of tickets and reduce any unnecessary escalation. Cost per ticket can be kept in control by following these pointers:
• Analyze service request patterns to plan ahead for purchase of assets and licenses, reducing the time taken to close service requests.
• Identify peaks and troughs to optimize resource management and technician work load.• Properly categorize and prioritize tickets to reduce incorrect ticket assignments, helping provide quick resolutions.• Create a robust knowledge base.
Cost per ticket Vs End user satisfaction
FIGURE 17:
Sep-14 Oct-14 Nov-14 Dec-14 Jan-15 Feb-15 Mar-15 Apr-15 May-15 Jun-15 Jul-15 Aug-15 Sep-15 Oct-15
End user satisfaction rate (%) Cost per ticket ($)
The handbook of essential service desk metrics
www.servicedeskplus.com
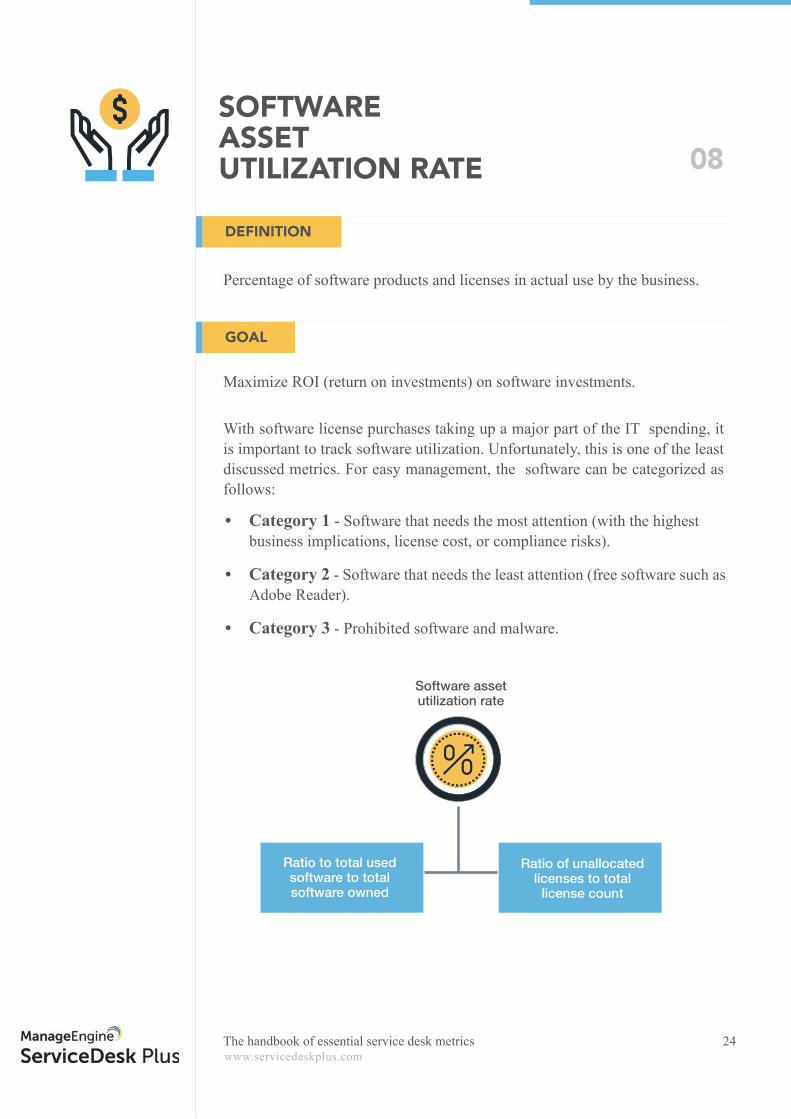
Percentage of software products and licenses in actual use by the business.
Software asset utilization rate
Ratio to total used software to total software owned
Ratio of unallocated licenses to total
license count
• Category 1 - Software that needs the most attention (with the highest business implications, license cost, or compliance risks).
• Category 2 - Software that needs the least attention (free software such as Adobe Reader).
• Category 3 - Prohibited software and malware.
Maximize ROI (return on investments) on software investments.
With software license purchases taking up a major part of the IT spending, it is important to track software utilization. Unfortunately, this is one of the least discussed metrics. For easy management, the software can be categorized as follows:
24
SOFTWARE ASSET UTILIZATION RATE 08
DEFINITION
GOAL
The handbook of essential service desk metrics

www.servicedeskplus.com
This metric helps identify any software purchase expenditure that does not provide any value to the organization. Ideally, this ratio should be close to one, meaning there is maximum utilization of all purchased software, thereby ensuring a maximum ROI on the software license purchase. A high number of category one software in the unused list means that a major portion of the soft-ware asset spending is sitting in idle software.
This metric helps analyze the license utilization of a particular software, help-ing IT teams plan ahead for license purchases. The ratio should be as small as possible for maximum ROI. A higher ratio could mean that some of the soft-ware applications are over licensed, which could be an idle investment with no ROI.
The following metrics can be used to track software utilization:
25
8.1) RATIO OF TOTAL USED TO TOTAL OWNED SOFTWARE
8.2) RATIO OF UNALLOCATED LICENSES TO TOTAL LICENSE COUNT
CASE STUDY:
INCREASING SOFTWARE ASSET UTILIZATION SAVESA MILLION DOLLARS
A leading global pharmaceutical company saved about one million dollars in software license spending. The pharmaceutical company, with its services spread across 50+ countries, was using a diverse range of Microsoft products. At one particular offi ce, there were thousands of software applications licensed under a Microsoft volume licensing agreement, but there was no visibility or control of these software assets, initially. The purchase had been made without understanding the business requirements. In fact, the company had limited in-formation on the software assets and the number and type of assets the organ-ization actually needed. This, again, put the organization at the risk of over-li-censing, under-licensing, and compliance penalties. The IT help desk started with a simple analysis by comparing the installed Microsoft software with the Microsoft licenses they held. The insight gained, and IT’s efforts to understand the business requirements, led to a redesigned Microsoft license purchase that involved stepping down from the Microsoft Offi ce Professional edition to the cheaper standard edition, which met the business requirement. Furthermore, several other volume licenses were replaced, leading to cost cuts saving the company about one million dollars in their software license purchases.
The handbook of essential service desk metrics
www.servicedeskplus.com
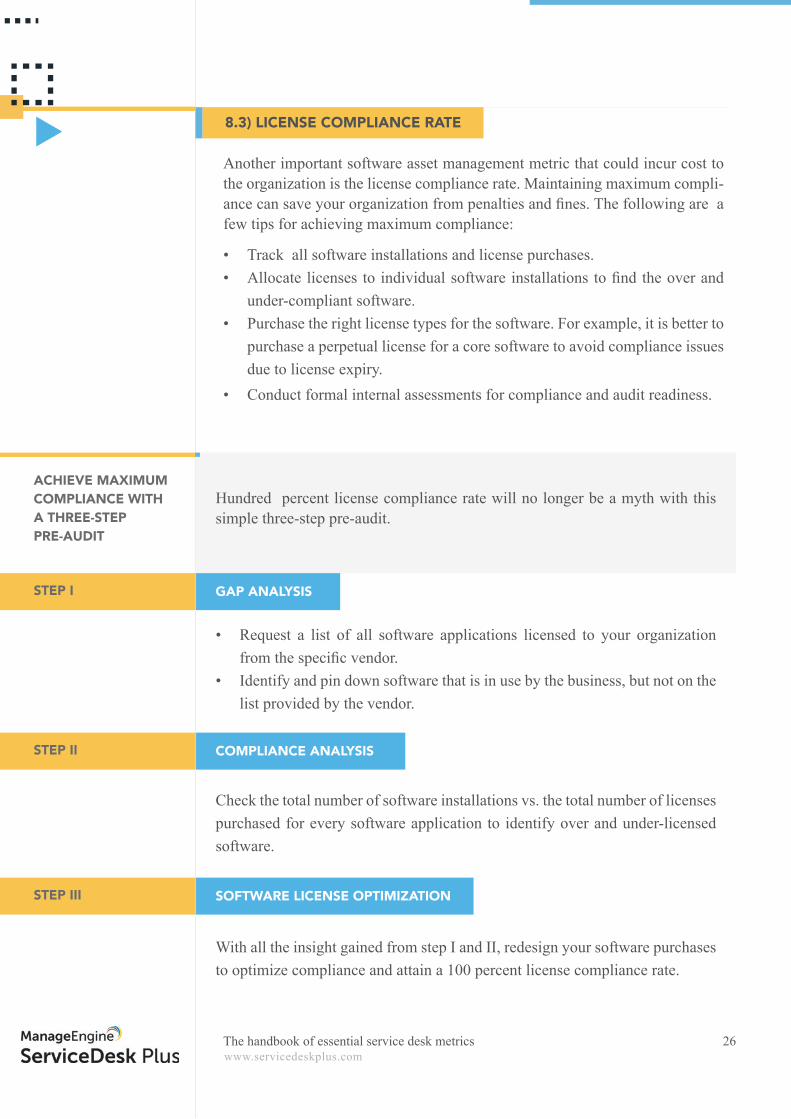
Another important software asset management metric that could incur cost to the organization is the license compliance rate. Maintaining maximum compli-ance can save your organization from penalties and fi nes. The following are a few tips for achieving maximum compliance:
• Track all software installations and license purchases.• Allocate licenses to individual software installations to fi nd the over and
under-compliant software. • Purchase the right license types for the software. For example, it is better to
purchase a perpetual license for a core software to avoid compliance issues due to license expiry.
• Conduct formal internal assessments for compliance and audit readiness.
26
8.3) LICENSE COMPLIANCE RATE
ACHIEVE MAXIMUM COMPLIANCE WITHA THREE-STEP PRE-AUDIT
STEP I
STEP II
STEP III
GAP ANALYSIS
COMPLIANCE ANALYSIS
SOFTWARE LICENSE OPTIMIZATION
Hundred percent license compliance rate will no longer be a myth with this simple three-step pre-audit.
• Request a list of all software applications licensed to your organization from the specifi c vendor.
• Identify and pin down software that is in use by the business, but not on the list provided by the vendor.
Check the total number of software installations vs. the total number of licenses purchased for every software application to identify over and under-licensed software.
With all the insight gained from step I and II, redesign your software purchases to optimize compliance and attain a 100 percent license compliance rate.
The handbook of essential service desk metrics
www.servicedeskplus.com
These eight KPIs, with respective metrics, will help you establish a measure-ment engine to constantly measure and continuously improve your help desk performance. The fi rst step in establishing this measurement engine is to under-stand the business that the IT help desk is supporting, and align the IT help desk objectives to the business objectives. The next step is to identify the KPIs and metrics that are critical to these help desk objectives, and constantly measure them. The eight KPIs discussed here are critical to the three basic IT help desk objectives of ensuring business continuity, making the organization productive, and delivering services within budgets and on time, which underlines the fact that these eight KPIs are the ones that your IT help desk should care most about.
27
CONCLUSION
The handbook of essential service desk metrics
ManageEngine delivers real-time IT management tools that empower an IT team to meet an organization’s need for real-time services and support. World-wide, more than 72,000 established and emerging enterprises—including more than 60 percent of the Fortune 500—rely on ManageEngine products to ensure the optimal performance of their critical IT infrastructure, including networks, servers, applications, desktops, and more. ManageEngine is a division of Zoho Corp. with offices worldwide, including the United States, India, Japan, and China.
ServiceDesk Plus is ITIL-ready help desk software with integrated Asset and Project Management capabilities. With advanced ITSM functionality and easy-to-use capability, ServiceDesk Plus helps IT support teams deliver world-class service to end users with reduced costs and complexity. It comes in three edi-tions and is available in 29 different languages. Over 100,000 organizations, across 185 countries, trust ServiceDesk Plus to optimize IT service desk performance and achieve high end user satisfaction.
For queries: [email protected] demo: demo.servicedeskplus.comToll free: +1 888 720 9500
28
ABOUT MANAGEENGINE
ABOUT SERVICEDESK PLUS
WEBSITE www.servicedeskplus.com